


Abstract
In irrigated areas around the world, the recommendation for the use of subsurface drainage is also associated with controlling salinity problems. Due to the high implementation cost, the search for solutions that make this requirement more flexible is necessary. Among the options to be investigated is the hypothesis that the height and salinity of the water table in plots located at the highest points of a toposequence are lower and do not compromise plant development, even without underground drainage systems. In this context, the present work was developed to monitor and evaluate the variation in water level or mottling over twelve months, as well as to measure and analyze the electrical conductivity and average pH of the water table during this period and its possible impact on plants. For this purpose, three lots in toposequence were selected in the Senador Nilo Coelho Public Irrigation Project, Petrolina—PE, with previously defined characteristics: soil classification (Plinthic Yellow—Ultisol), crop planted (Mangifera indica L.) and irrigation system used (micro-sprinkler). Precipitation, reference evapotranspiration and volume of water applied via irrigation were monitored by an automatic weather station and hydrometers in each lot. In each plot, nine observation wells were installed, distributed in a grid, with the aim of make monthly measurements of the water table level or mottling. The electrical conductivity and pH of the groundwater were also measured to obtain the average monthly value for each lot. Illustrative 3D maps of the water table level in relation to the ground surface were created using the simple kriging method, in the UTM SIRGAS 2000 24S projection system. The absence and presence of groundwater in the upper and lower hillslope lots, respectively, were favored by the toposequence. The decision to install underground drainage or not can be made on a case-by-case basis; this must take into account, among other aspects, changes in physical characteristics along the soil profile, possible occurrence of mottling, the quality of water for irrigation, the irrigation management adopted and the position of the lot in the toposequence.
1. Introduction
The sustainability of irrigated areas, especially of those situated in semi-arid conditions, has been associated with the concomitant use of efficient fertirrigation systems and agricultural drainage. Fertirrigation improves productivity to provide water and nutrients in amounts required for the crops, whereas agricultural drainage has a regulating role in soil salt balance, to allow natural or induced leaching processes to be concluded by removing salts from the root zone of the crops [1].
In the Brazilian experience, crystalline basement is found in 85% of the semi-arid region [2]. Among the hydrogeological implications, the predominance of shallow soils with low storage capacity stands out, as well as the dependence on fractures and shear zones for water storage, whose recharge depends on precipitation which, in this region of Brazil, is irregular in time and space. All of this context favors the process of soil salinization, which can be catalyzed by limitations in agricultural drainage [3], as verified in different public irrigation projects, such as those located in the São Francisco river valley.
This relationship between irrigation, drainage, and hydrogeological issues can also be observed in several other countries. In studies carried out in the Basin of Kesikkopru located in Central Anatolia of Turkey, Kale [3] demonstrates the interdependence of drainage requirement and soil salinity. Research carried out in other semi-arid regions of the world, such as in San Joaquin Valley, CA, USA [4], Australia [5], Egypt [6], etc., also supports the hypothesis that drainage, irrigation and salinity for arid lands should be considered as components of a water management system [3].
Some funding organizations adopt, as a requirement for financing irrigation systems, the concomitant implementation of drainage systems, which can be attributed to an expectation of sustainability [7], but also to reducing risks in crop production [8]. However, the economic impact of this requirement simultaneously burdens production and increases the return on investment time, which induces farmers to use less efficient irrigation systems and to not install drainage systems.
Although the role of subsurface drainage is recognized as complementary to natural drainage [7], there are reports from various countries around the world, from studies developed in different contexts and methodologies, that agree that the accumulation of salts in the soil is influenced by the toposequence and other topographic factors [9]. In Argentina, for example, in a sub-humid sedimentary basin with a shallow water table, Nosetto et al. [10] found that land use and topography shape the salinity of the soil and groundwater. In a study developed in the lower Delmarva peninsula, USA, Nordio and Fagherazzi [11] observed that salinity increases when groundwater levels are high. This saline increment in the groundwater often becomes an important additional source of salts to move towards the soil surface through capillary processes, depositing in the root growth zones of the cropping systems [12,13,14].
Considering all these issues, our hypothesis is that the need for subsurface drainage for irrigated areas needs to be analyzed for each specific case; lots located at the top of the toposequence may, in some cases, not require such implementation and still not present future salinity problems. In other words, at the highest point of the toposequence, the rise in the water table and the formation of mottling over time are lower than those observed at lower points of the toposequence, as is the average electrical conductivity of the water table, therefore not causing salinity problems for crops.
This study contributes to the literature by discussing the importance of the lot’s position in the toposequence as a decisive factor for the installation or not of subsurface drainage in irrigated fruit farming, aiming at sustainability. In this context, the results obtained can be framed within SDG 2—Zero hunger and sustainable agriculture; SDG 8—Decent work and economic growth; and SDG 12—Responsible consumption and production.
Therefore, this study was developed to monitor and evaluate the variation in water level or patches over twelve months, as well as to measure and analyze the electrical conductivity and average pH of the water table during this period and its possible impact on plants. The objective is that this information can support the decision of whether or not to implement subsurface drainage, based on the lot’s position in the toposequence.
2. Materials and Methods
2.1. Location and Climatic Characterization of the Experimental Area
The experiment was conducted over twelve months in the municipality of Petrolina, Pernambuco state, in the Brazilian semi-arid region [15], specifically in lots located at Senator Nilo Coelho Public Irrigation Project (geographic coordinates 09°23′55″ south latitude and 40°30′03″ west longitude, with an average altitude of 376 m) (Figure S1—Supplementary Data).
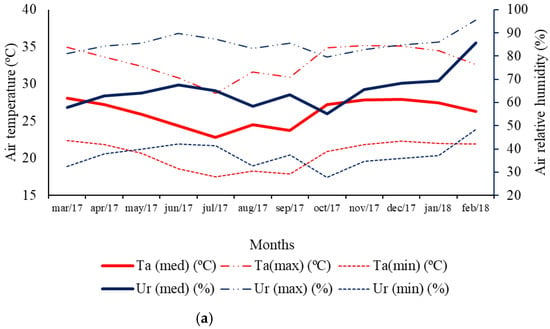
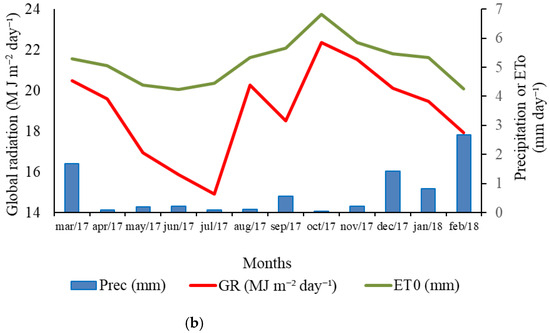
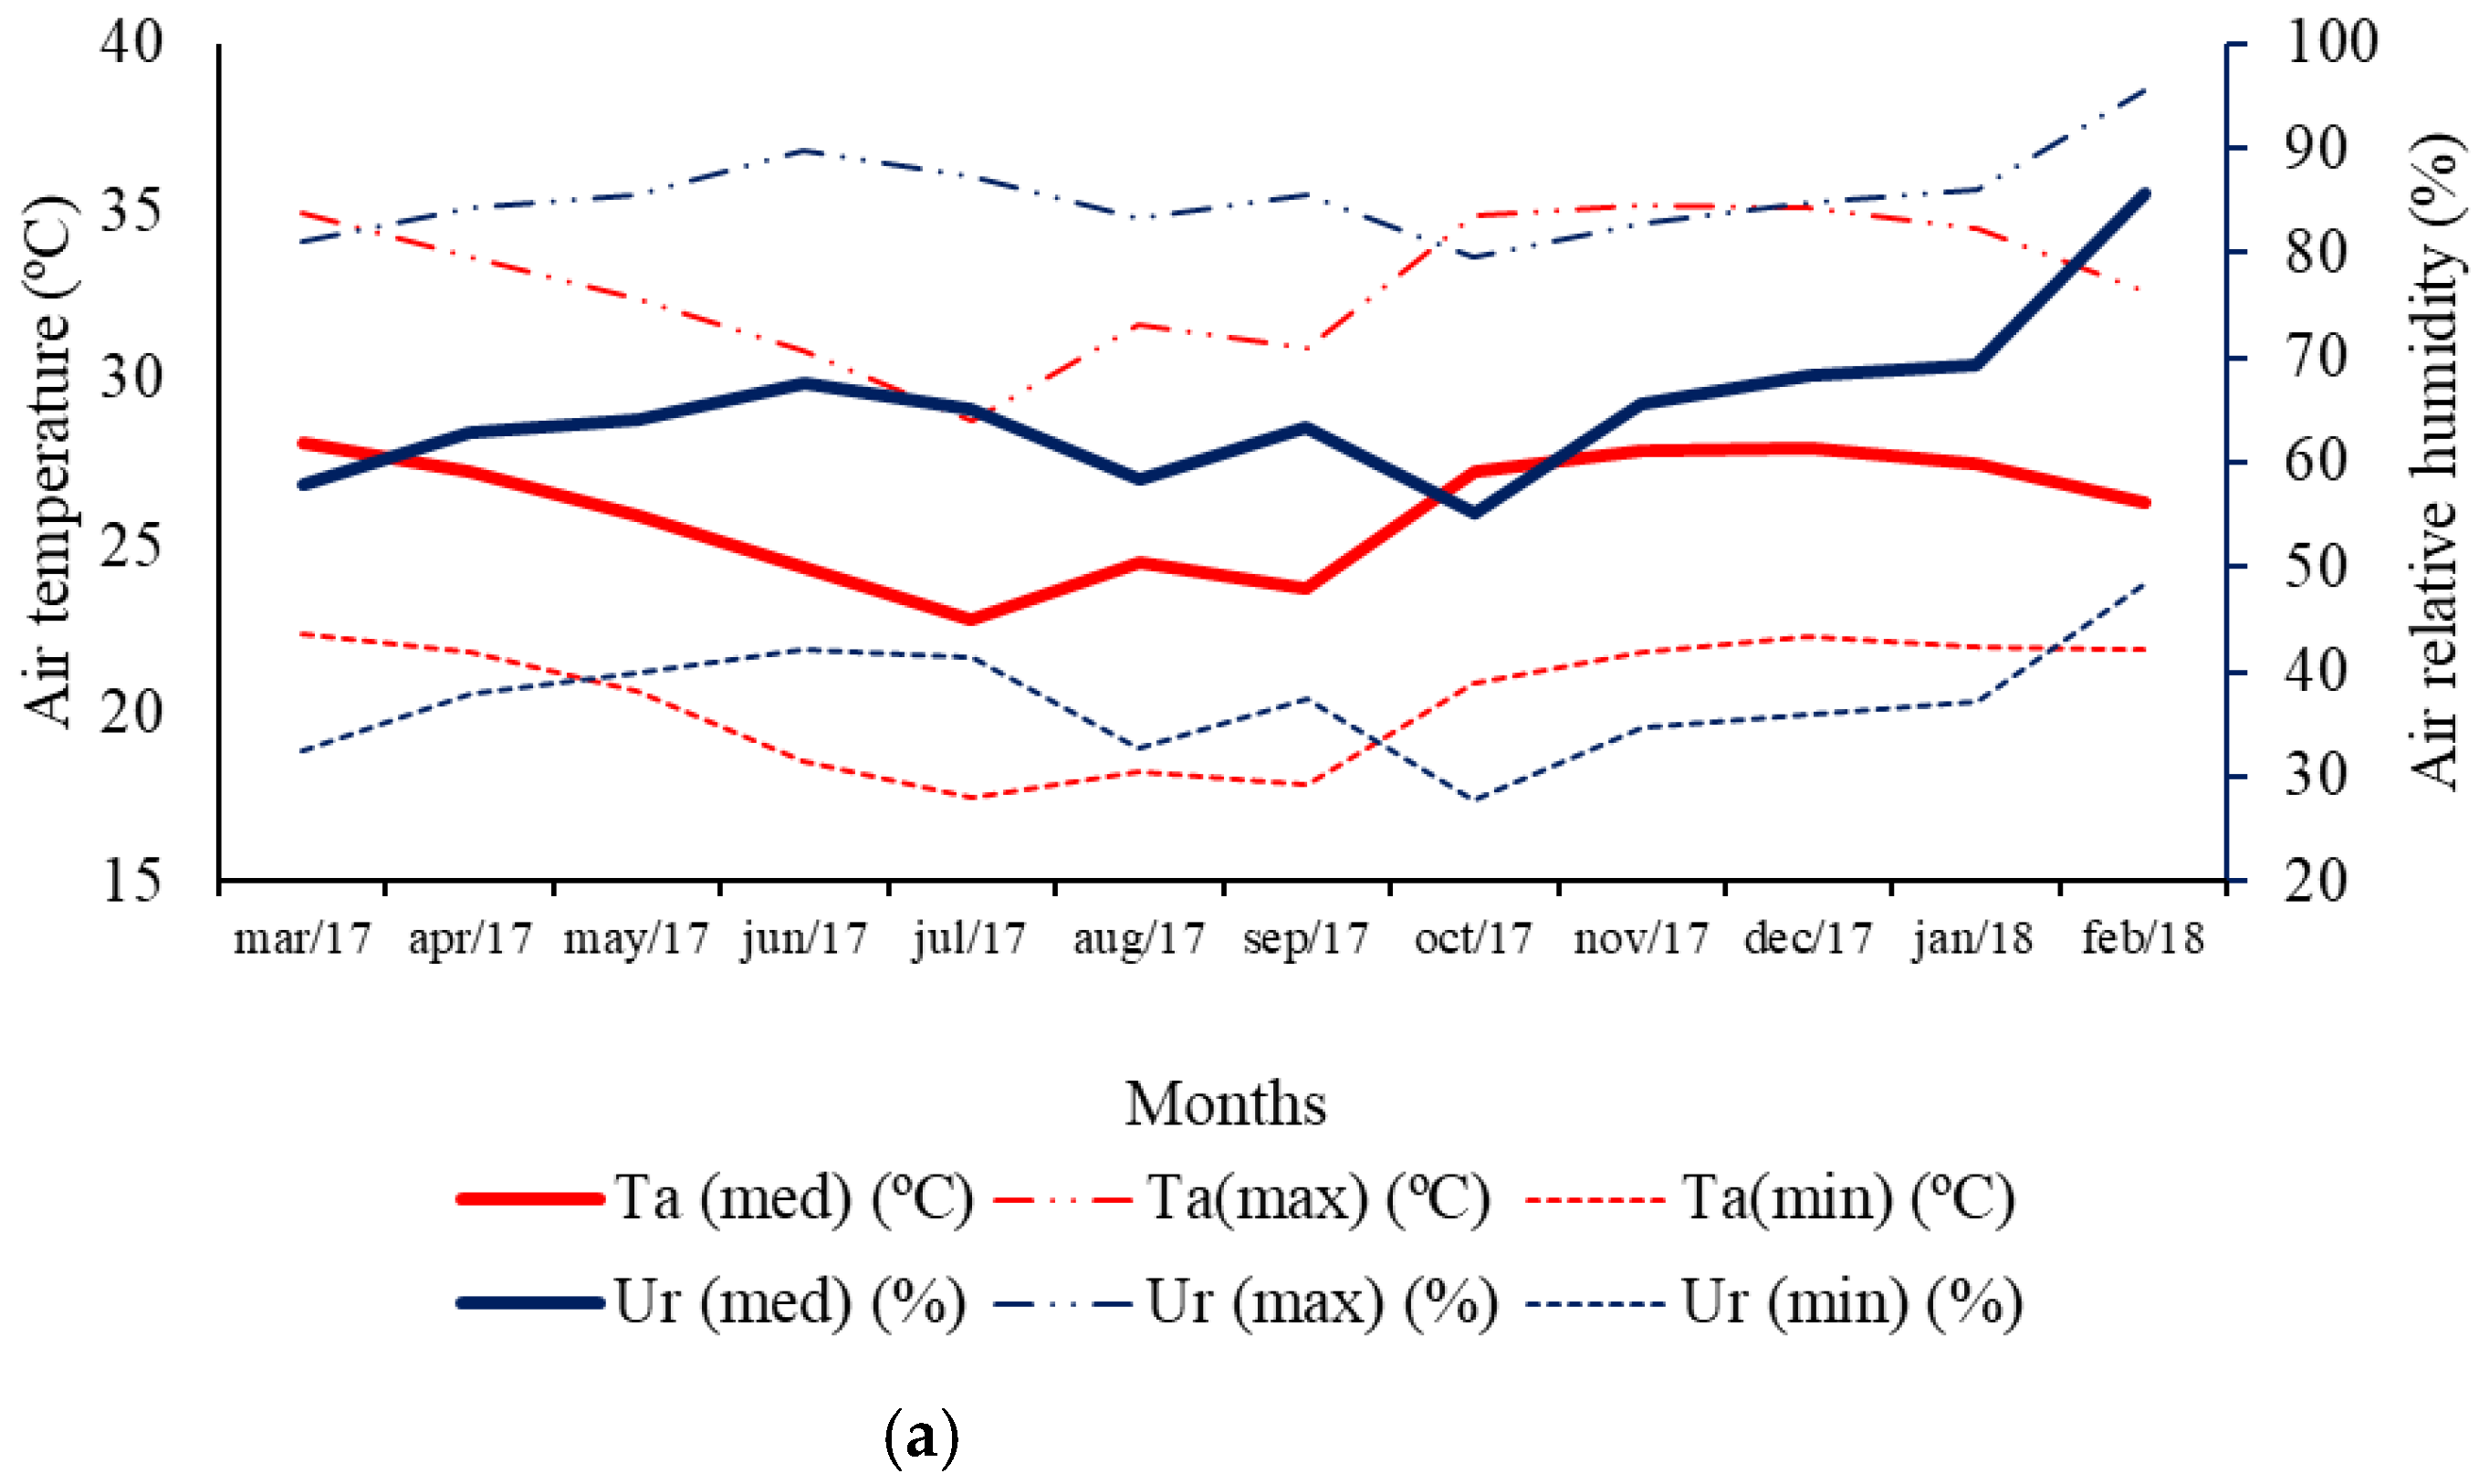
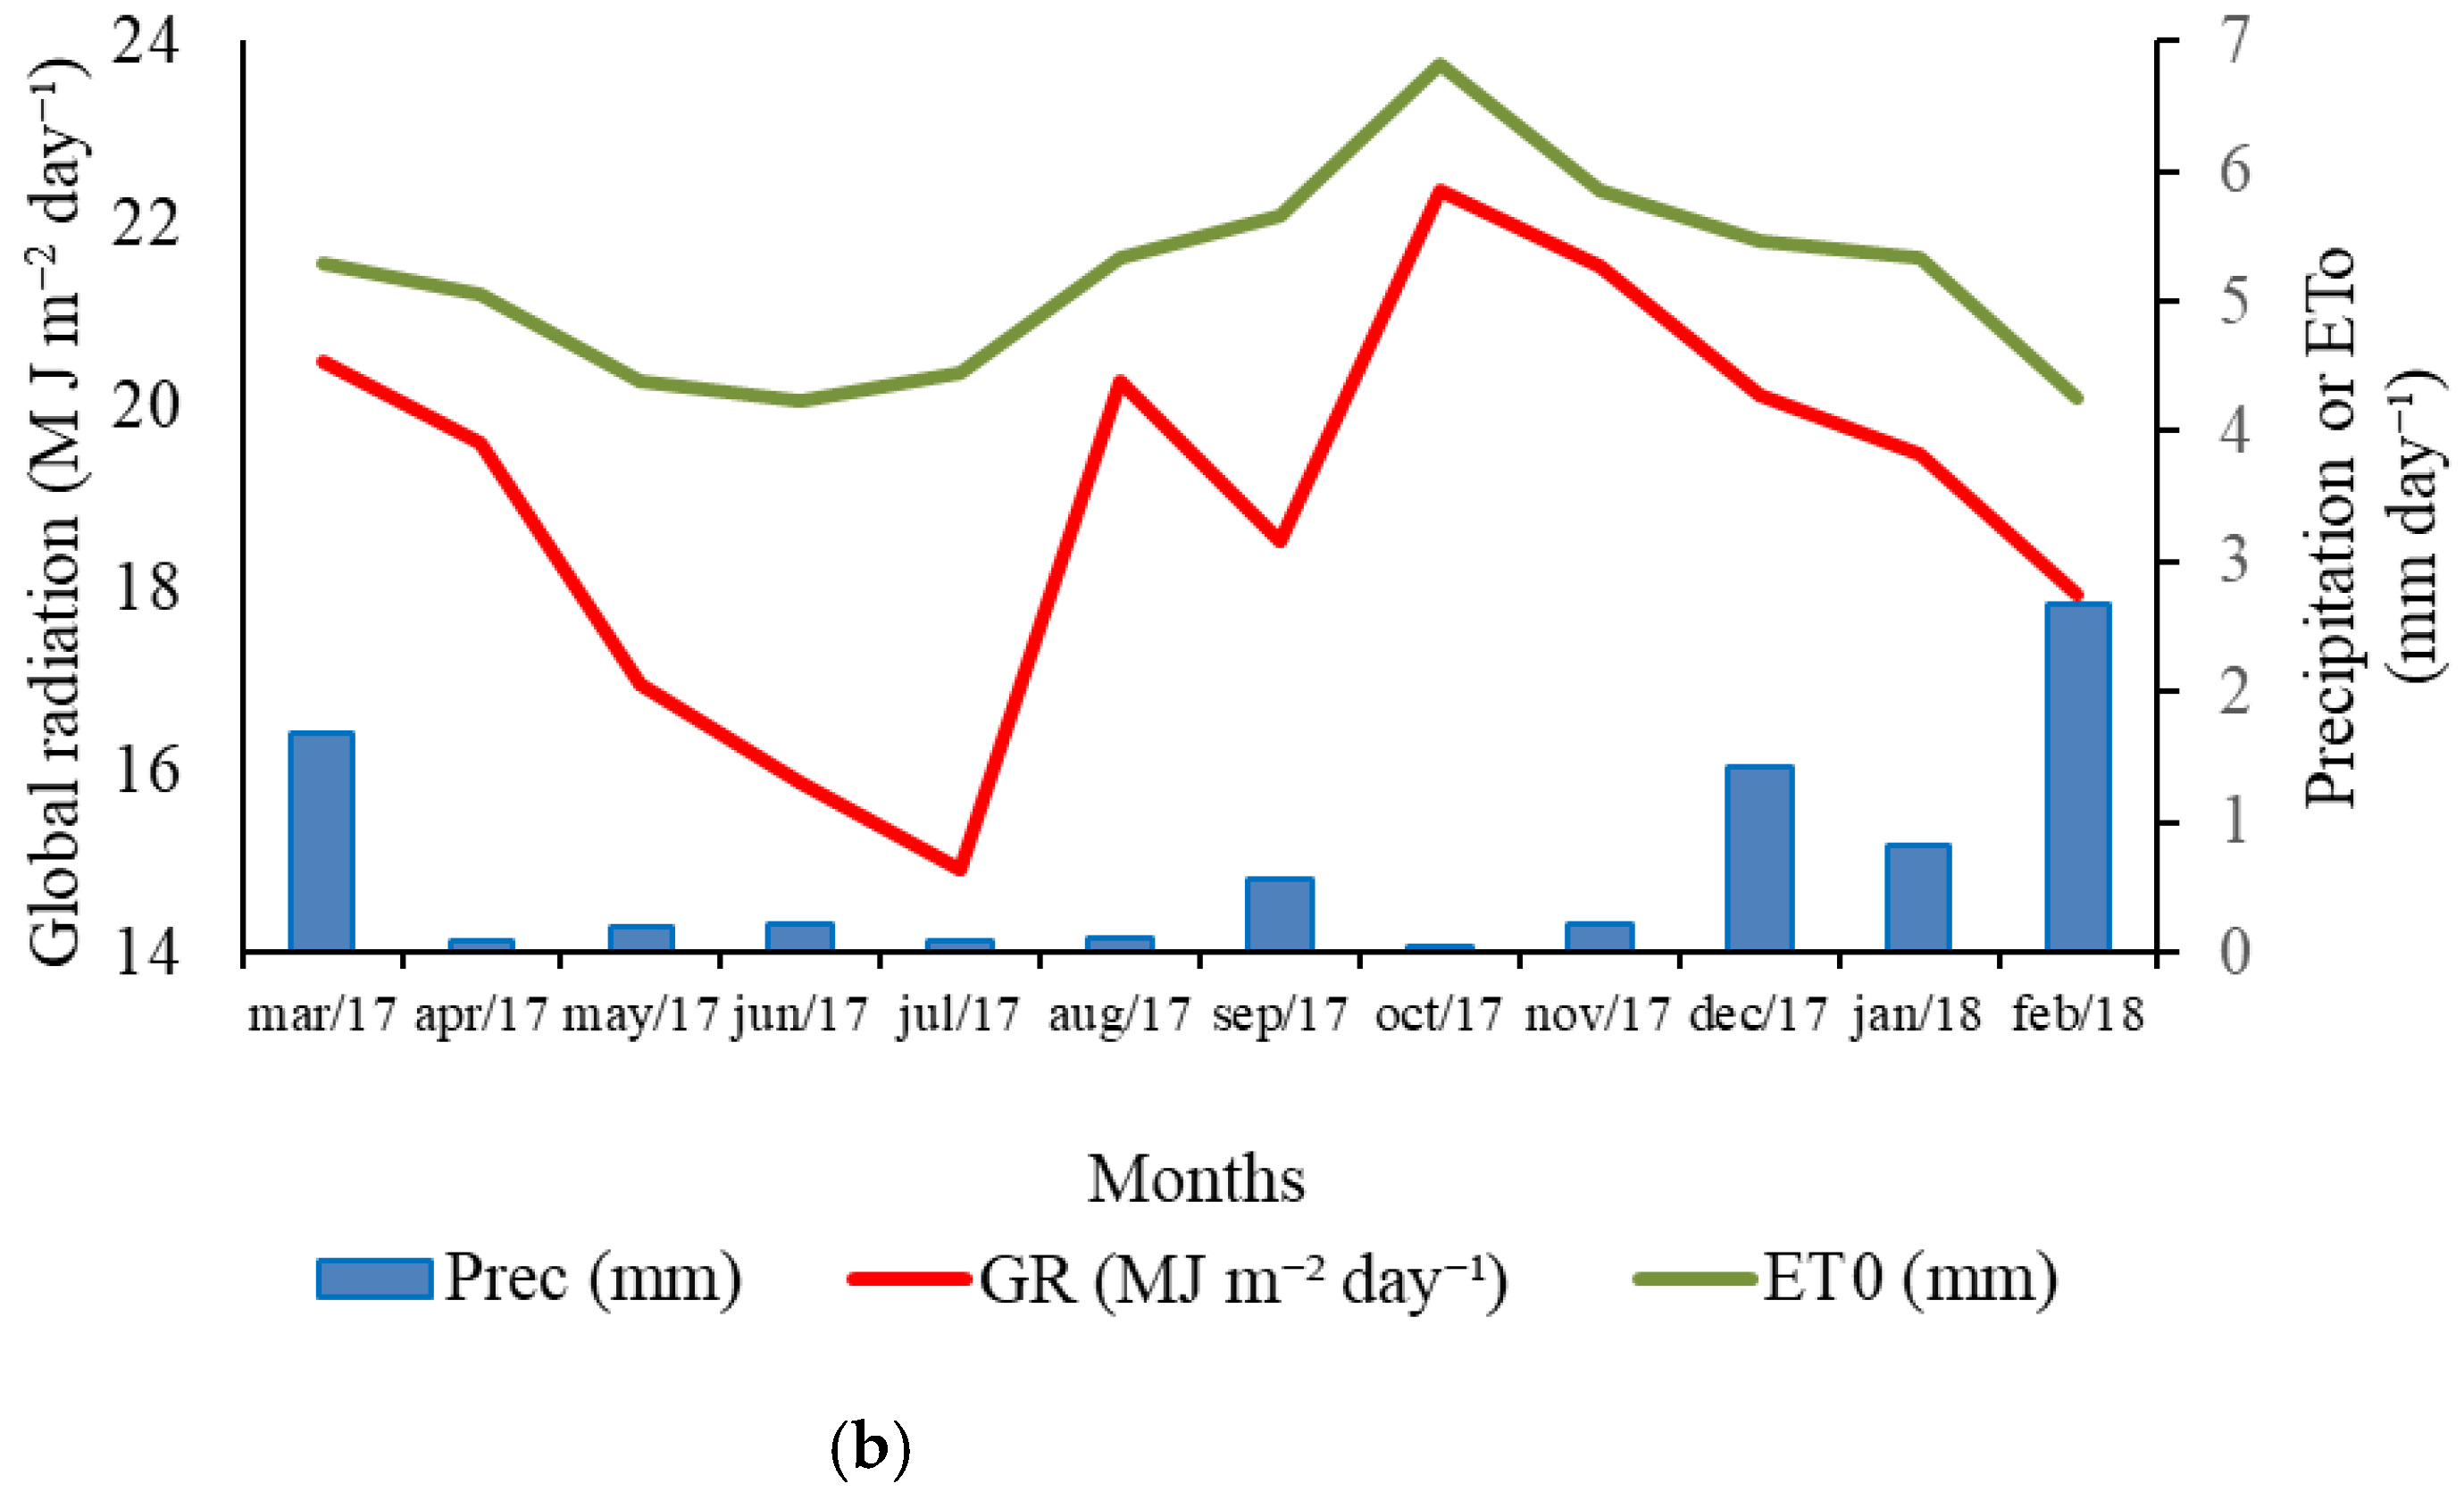
Between March 2017 and February 2018, the following meteorological variables were monitored: average air temperature (°C), relative humidity (%), precipitation (mm per day), and global solar radiation (MJ m−2 per day). The temperature and relative humidity were obtained by using an HMP45C thermo-hygrometer sensor, CS105 barometric pressure (Vaisala, Inc.; Helsinki, Finland); global solar by using an SP-214-SS (Apogee Instruments, Inc.; Logan, UT, USA), 03002-L anemometer; and precipitation by using an TE525MM connected to a CR1000 model data logger (Campbell Scientific, Inc.; Logan, UT, USA). The reference evapotranspiration (mm per day) was determined by using the Penman–Monteith–FAO equation. These variables (Figure 1) were obtained with the help of a meteorological station situated at Timbaúba Agrícola S/A (9°14′16.6″ S and 40°29′04.3″ W, 373 m altitude), Petrolina—PE, about 10 km from the experimental area.
Figure 1.
(a) Maximum, average and minimum values for air temperature (°C) and relative humidity (%). (b) Values for global radiation (MJ m−2 day−1), reference evapotranspiration (ETo—mm day−1) and precipitation (mm day−1). The values shown represent the sum of the daily values divided by the number of days in the respective month. Petrolina, Pernambuco, Brazil—Senador Nilo Coelho Public Irrigation Project, February 2018.
2.2. Dimensions, Criteria for Selection and Characterization of Soil and Relief of Lots
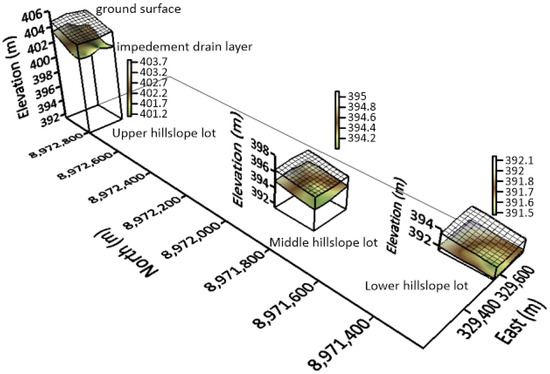
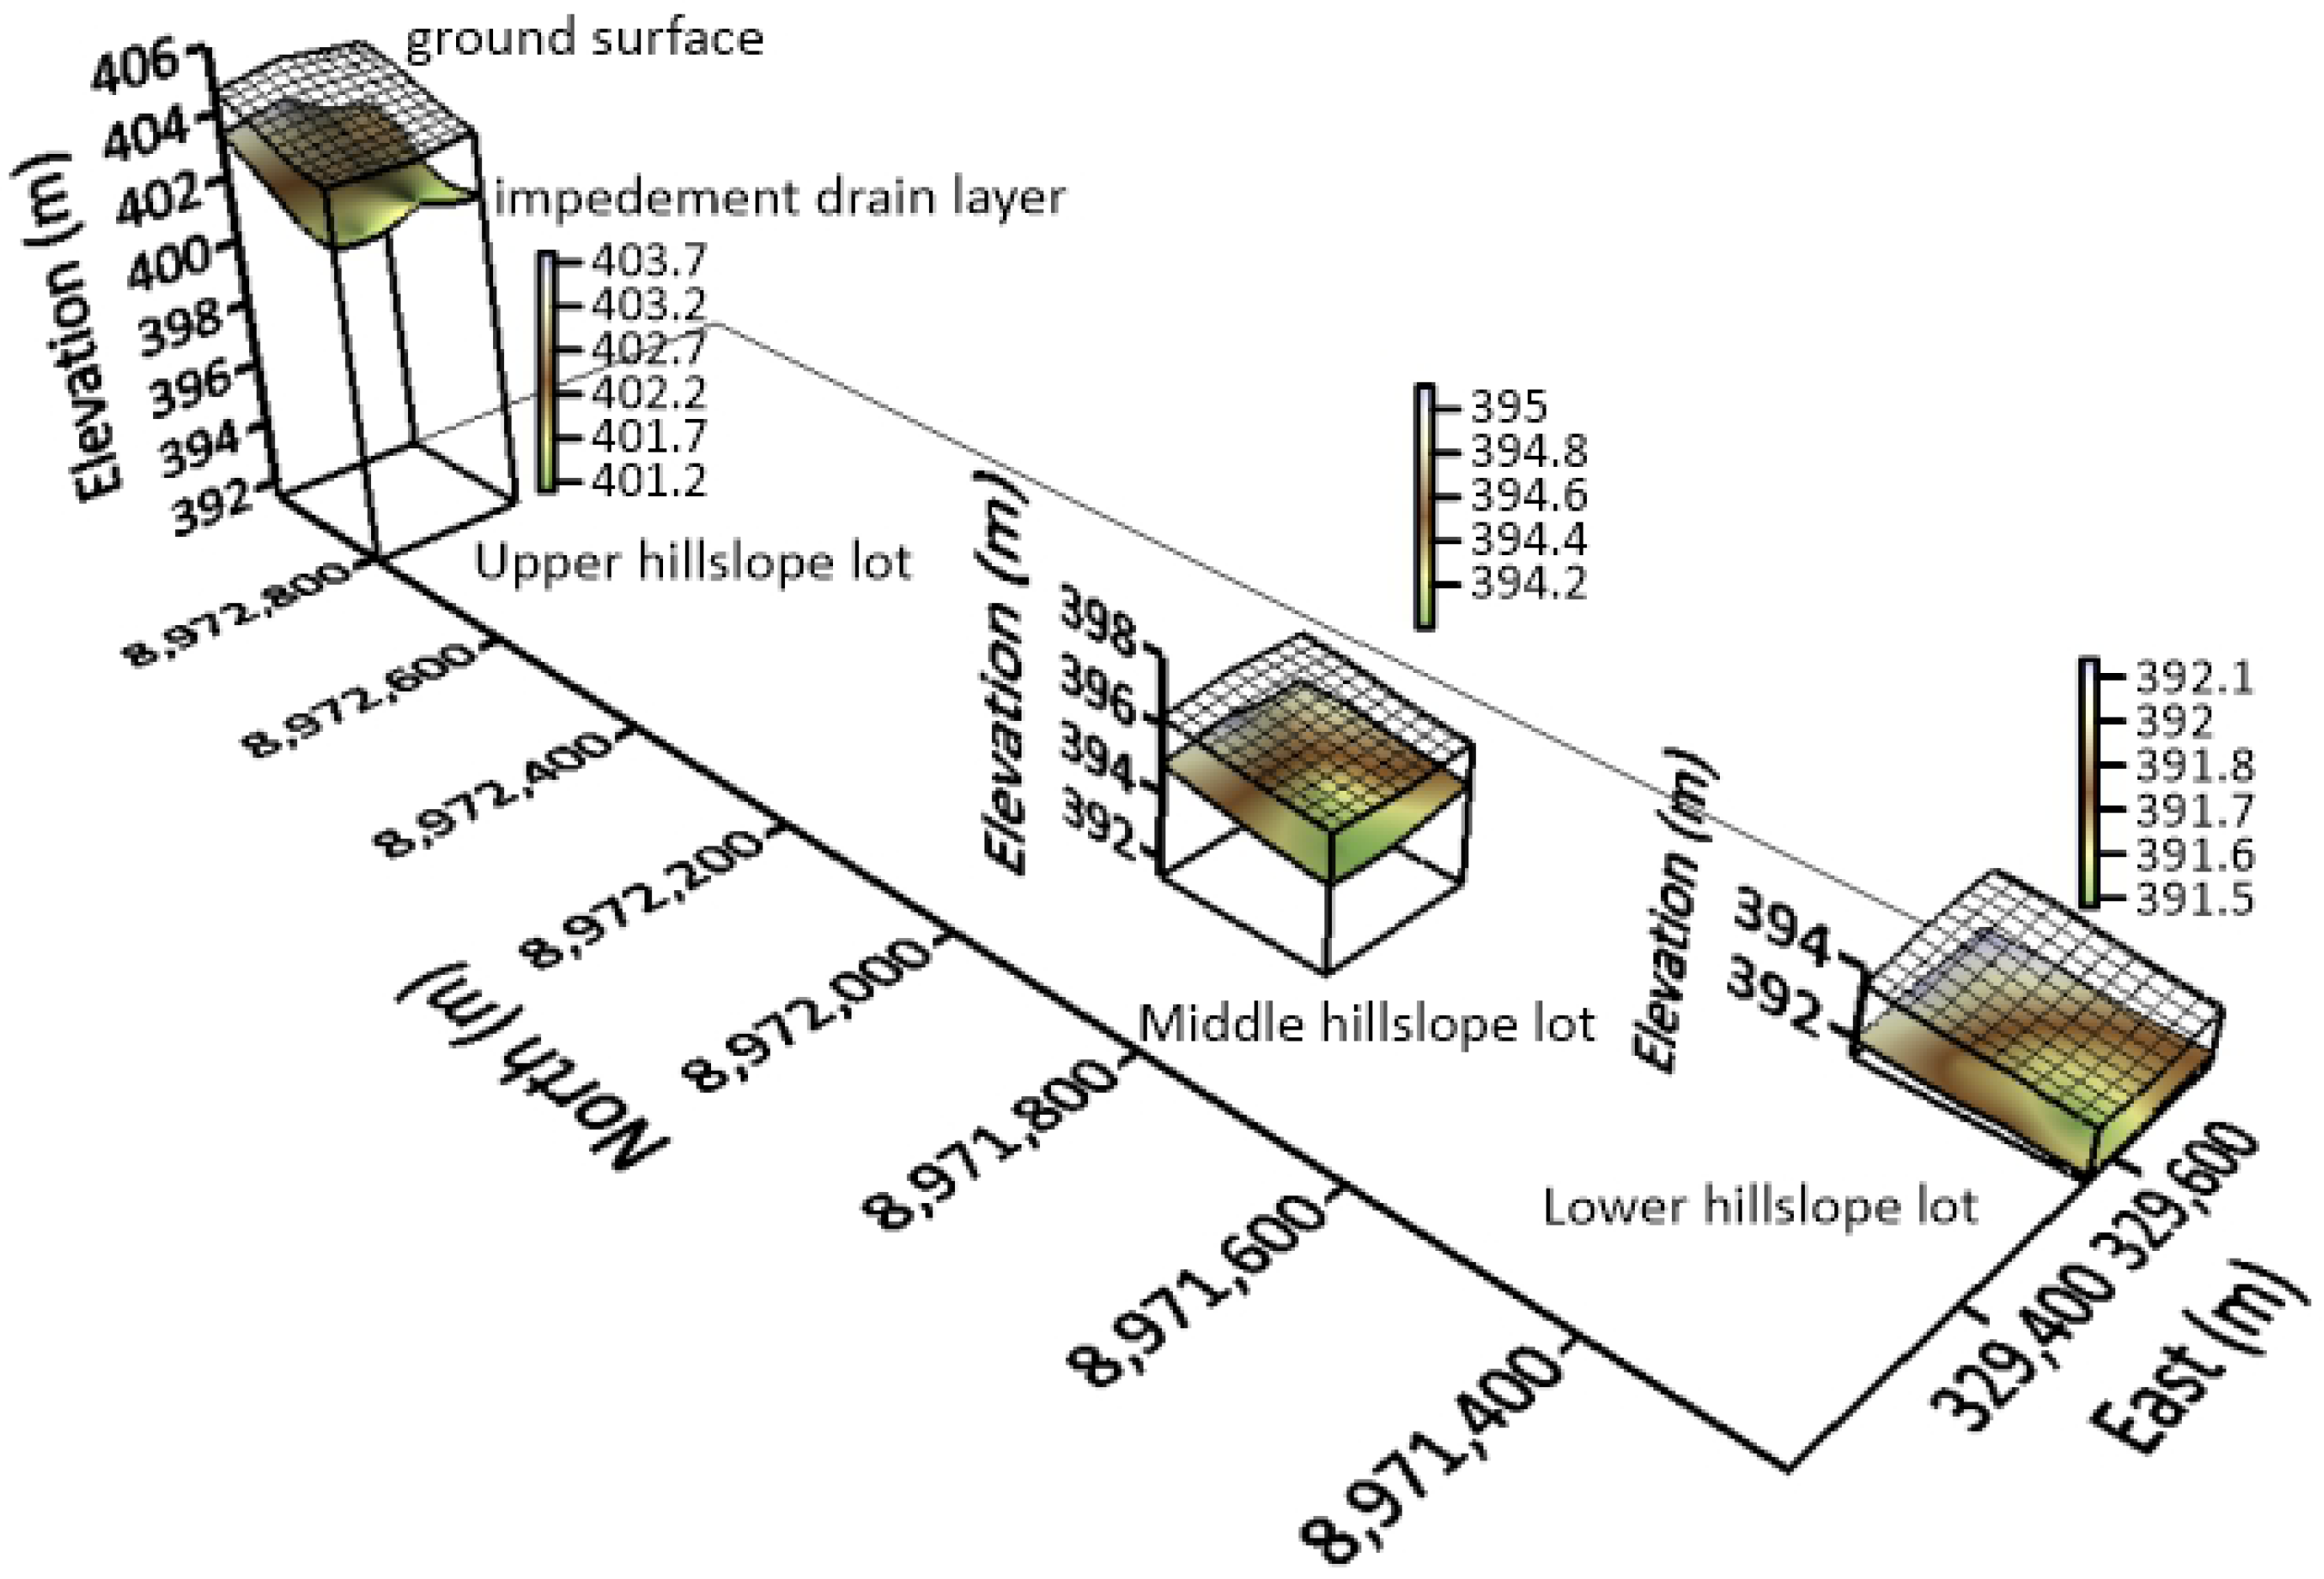
The study area was composed of three lots, each one with six hectares, ordered by toposequence (Figure 2); that is, the definition of the dimension and position of the lot in the toposequence were necessary for the hypotheses of this research.
Figure 2.
Location and distribution of the studied lots in the toposequence showing the impediment layer depth and the direction of the collector drains. Petrolina, Pernambuco, Brazil—Senador Nilo Coelho Public Irrigation Project. SIRGAS 2000 UTM 24 S, March 2017.
The selection process of the lots was based on the following criteria: (1) the soil class Argissolo Amarelo plíntico [16], which was characterised [17] according to physical-hydric parameters (Table S1—Supplementary Data); (2) the crop cultivation—mango (cv. Tommy); (3) the irrigation system (microsprinkler) and water management; and (4) the water quality (São Francisco river).
2.3. Location and Installation of Observation Wells
A rectangular grid has been defined in each lot for installation of nine groundwater observation wells. The points were located and referenced by planialtimetric survey with representative distribution in the area. The lines of wells were installed at ¼, 2/4 and ¾ of the length of the land, adjusted to the crop lines, with three wells per line. In the lower hillslope lot, the only one with underground drainage installed, the wells were located at the midpoints between the drains, indicative of the lowering of the groundwater (Figure S2—Supplementary Data).
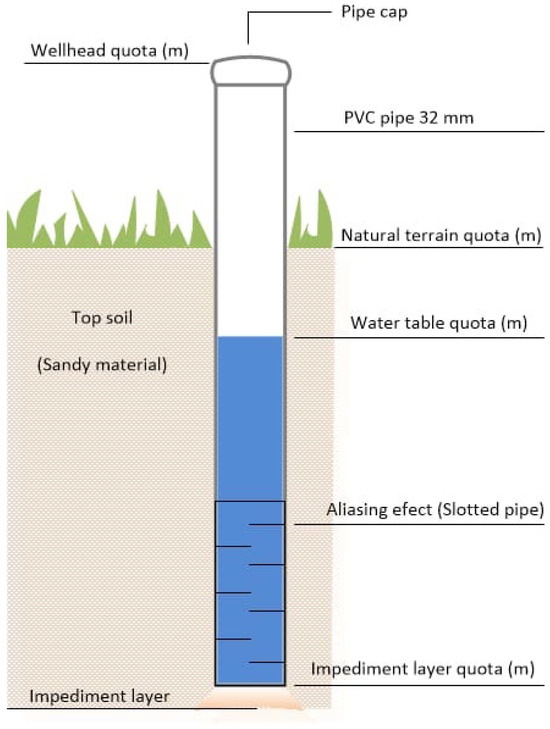
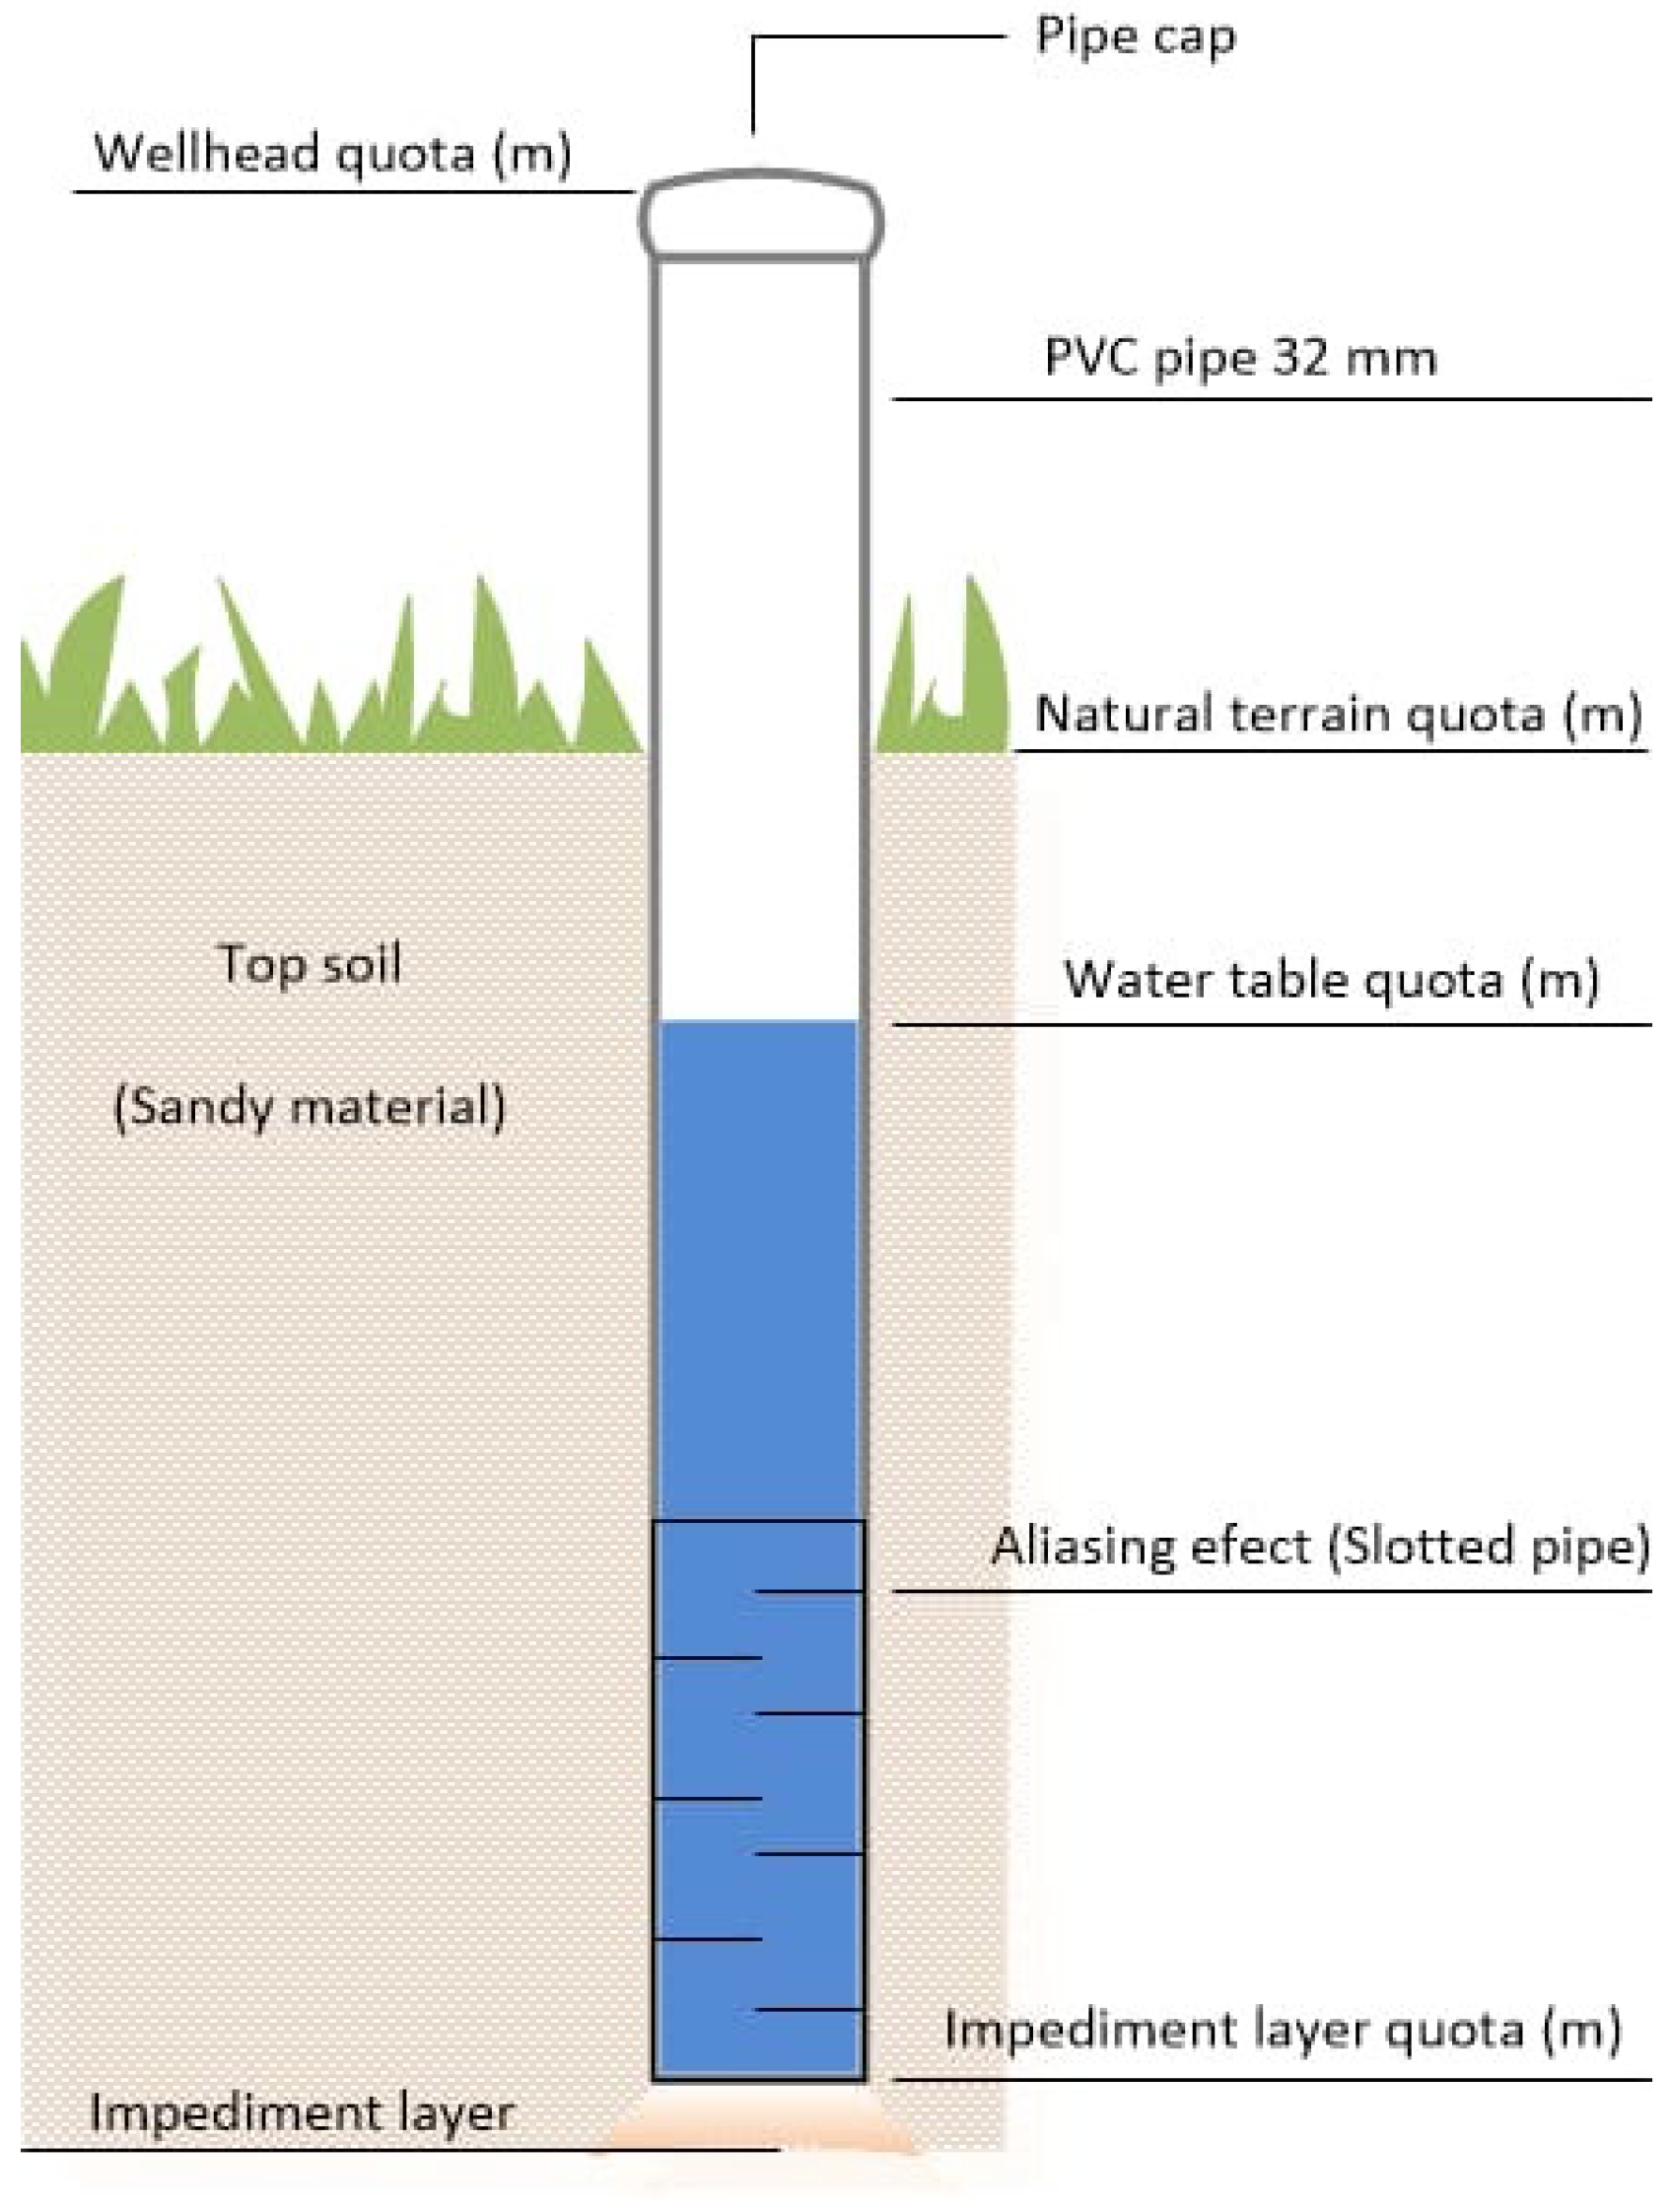
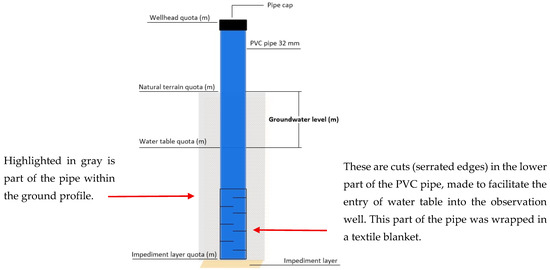
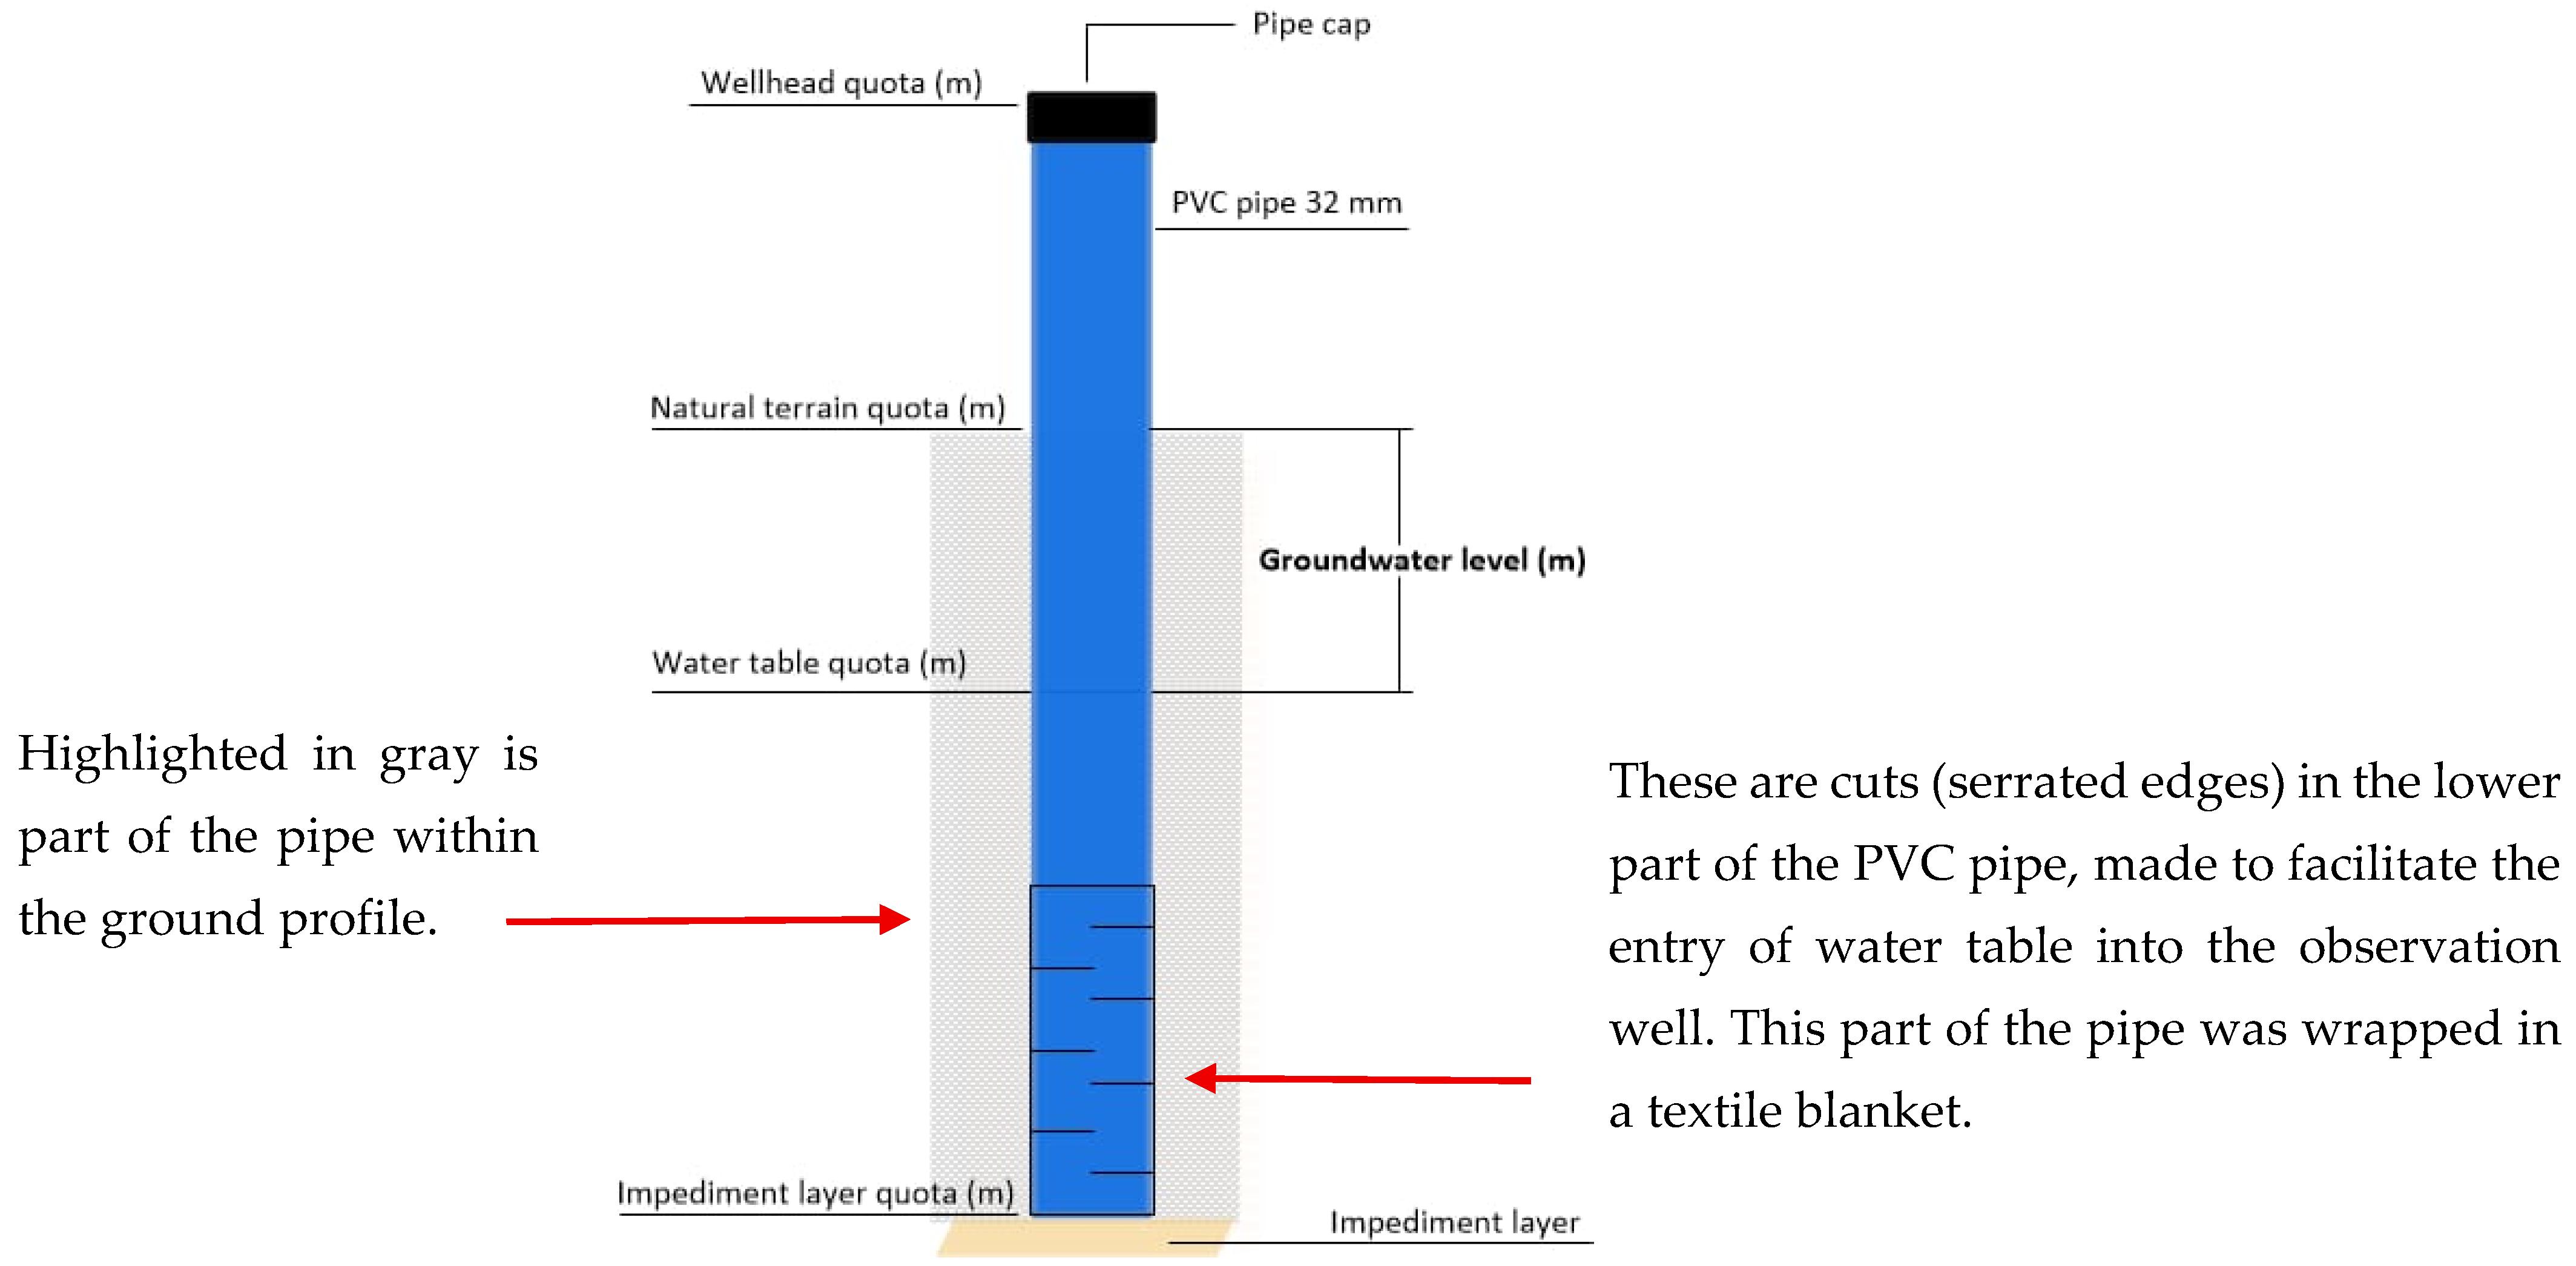
For the installation process of the observation wells, the holes were opened using a soil sampling auger of 3-inch diameter until reaching the impediment layer at varying depths (according to the location of the layer). For the assembly of the well, one PVC tube with 32 mm internal diameter was installed in each hole, with lengths consistent with the impediment layer depth; in addition, some slits were arranged on alternating sides of the tube in the first 1.00 m of the deep end and surrounded by a synthetic polyester blanket, based on the methodology of Batista et al. [18] and Gheyi et al. [19]. The value of the impediment layer elevation was obtained as the difference between the topographic elevation of the soil surface at each well and the depth of the layer that resisted soil sampling.
2.4. Characterization of Observation Wells
The tube was inserted until it reached the impediment layer, and the space between the hole wall and the tube was filled with the material of the excavation itself, followed by a manual compaction to minimise possible erosion effects. At the top of the tube, a 32 mm inner diameter cap thread was coupled, and a 2 mm diameter hole was drilled to release and prevent increased internal air pressure (Figure 3).
Figure 3.
Schematic drawing of observation wells.
2.5. Analyzed Variables
2.5.1. Climatic/Atmospheric Water Balance Indicator
The climatic/atmospheric water balance indicator was determined by considering the sum of precipitation + irrigation as soil water input, and ETo was considered as soil water output. As already explained in subitem 2.1, the crop’s reference precipitation and evapotranspiration (ETo) data were obtained with the help of a meteorological station, and the irrigation depth values were obtained using water meters on the respective plots, and were subsequently transformed into millimeters depending on the irrigated area.
2.5.2. Mottled Depth
The “mottling” mentioned here refers to the presence of stains found in the soil profile during the excavation of observation wells. These spots were categorized according to color (reddish and yellowish) and also according to quantity (little, common and abundant) [20].
2.5.3. Water Table Level
To determine the depth of water in the well, the elevation of the natural terrain surface and the height of the well were taken as references to determine the water level depth using a fiberglass tape measure (Figure 4). A cylindrical metal tube, called a ‘plop’, was attached to the end of the measuring tape, so that the end of the tube coincided with the ‘zero’ of the tape measure scale, in order to weight the measuring tape and cause an acoustic signal upon contact of the tube with the surface of the water, according to the methodology described by Amorim [21] and Batista [18]. The readings were taken monthly, from March 2017 to February 2018.
Figure 4.
Schematic drawing to explain how the water table level was measured.
2.5.4. Electrical Conductivity and pH of Water Table
The groundwater samples were collected once per month, with an extractor, to determine the electrical conductivity (EC) and pH at 25 °C, on the field, with a conductivity meter (AKSO. Conductivity meter AK51, São Leopoldo, Brazil) and a portable potentiometer (AKSO. pH meter AK90, São Leopoldo, Brazil), respectively. The readings were taken monthly, from March 2017 to February 2018.
2.6. Data Analysis
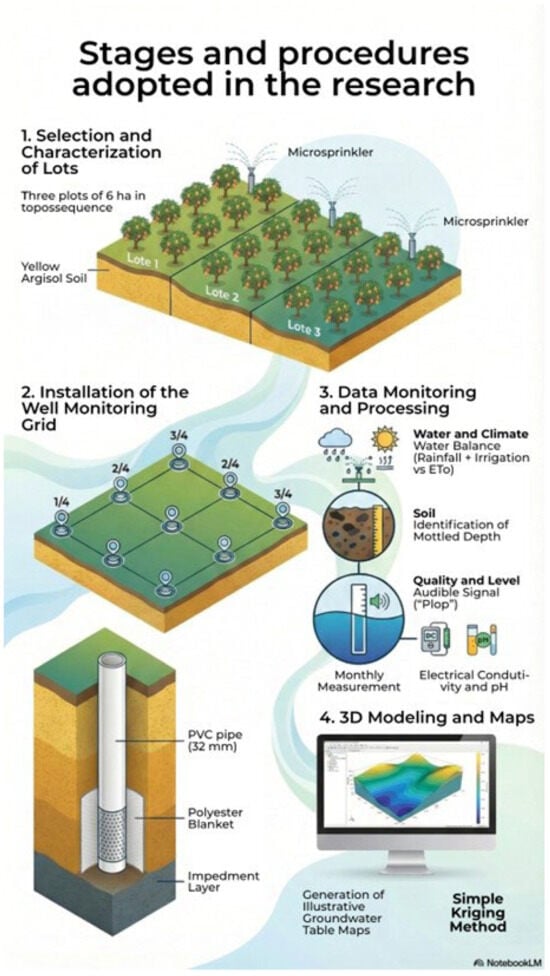
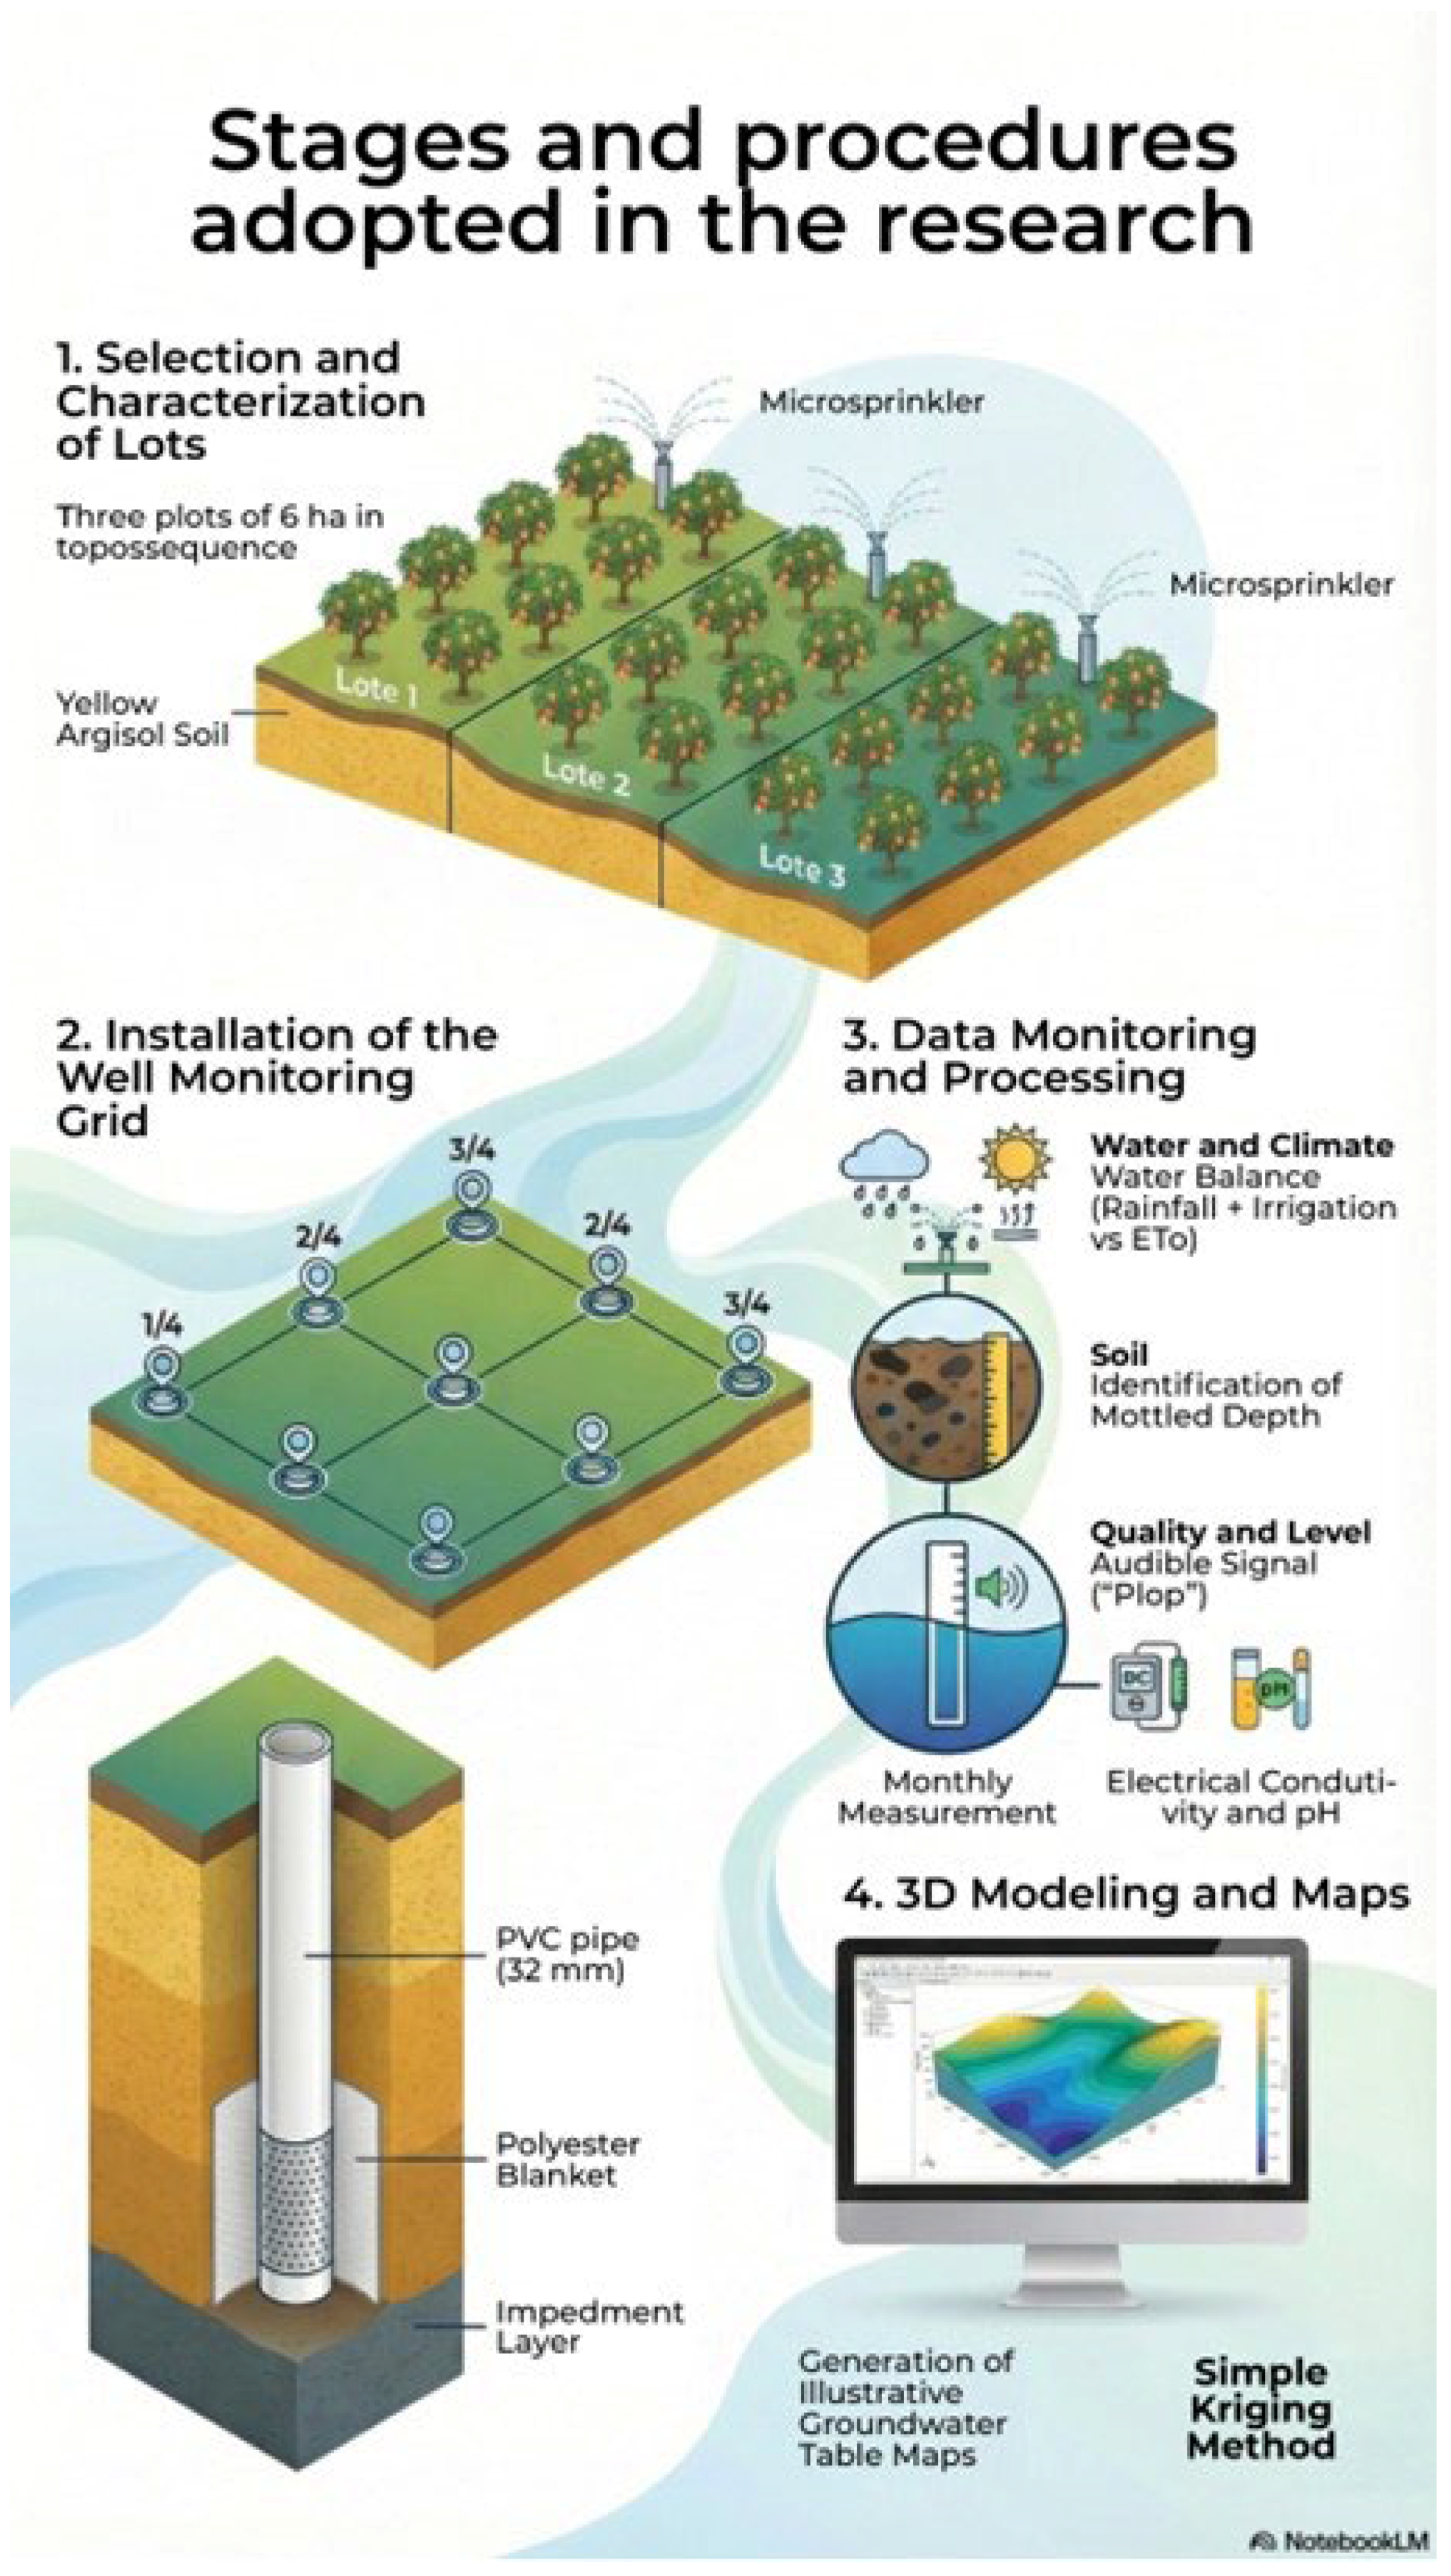
Illustrative 3D maps of the water table level in relation to the ground surface were created using the simple kriging method, in the UTM SIRGAS 2000 24 S projection system (SURFER: Versão 25.0. Golden, CO, USA: Golden Software, LLC, 2024), and estimates of the average of electrical conductivity and pH groundwater were calculated. An infographic detailing the steps and procedures adopted in the research is shown in Figure 5.
Figure 5.
Infographic detailing the steps and procedures adopted in the research.
3. Results
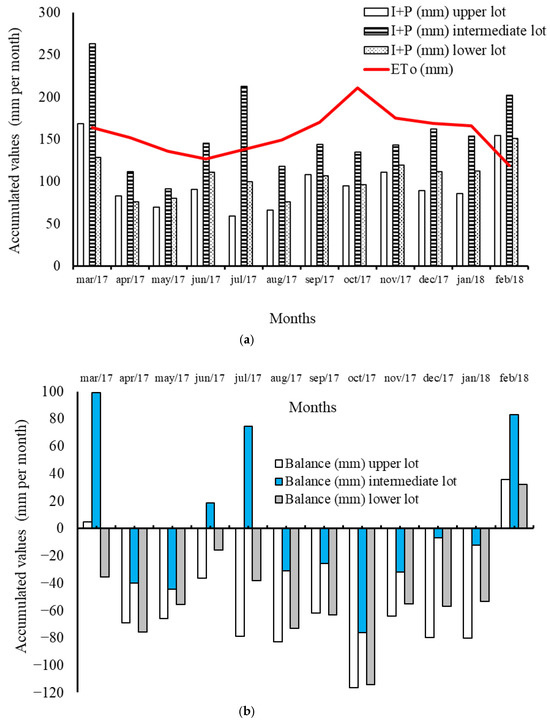
There was no record of precipitation in the months of October 2017 and February 2018, while the rainiest months were March 2017, which accumulated 168.6 mm, and February 2018, which accumulated 154.7 mm; when comparing precipitation and ETo levels, it is clear that throughout the experimental period there was a water deficit, particularly in October 2017, when the accumulated ETo for the month was 211 mm (Figure 1).
3.1. Climatic/Atmospheric Water Balance Indicator
When analyzing the sum of the accumulated values each month of Irrigation + Precipitation (I + P) and then deducting the value of ETo also accumulated in each month, it is clear that there was a water deficit throughout the analyzed period, except in the months of March 2017 (high and intermediate lots); June and July 2017 (intermediate lot); and February 2018 in the three lots (Figure 6a,b).
Figure 6.
(a) Values of the sum (I + P) of the irrigation depths (I) and precipitation (P); values of reference evapotranspiration (ETo) by Penman–Monteith. (b) Values of water balance (I + P)—ETo. All values refer to the accumulated amount for the respective month.
There was similarity between the irrigation depths (monthly accumulations) applied to the high and low lots; however, in the intermediate lot the irrigation depth was 3.75 and 2.16 times greater in July 2017 compared to the high and low lots, respectively. Although the intermediate lot received a higher irrigation depth in some months of the year, only in the months of March, June and July 2017 and February 2018 was there a positive water balance in this lot; on the other hand, in the high and low lots a deficit of 116.3 and 114.5 mm was recorded, respectively, in October 2017.
3.2. Mottled Depth, Groundwater: Level, Electrical Conductivity and pH
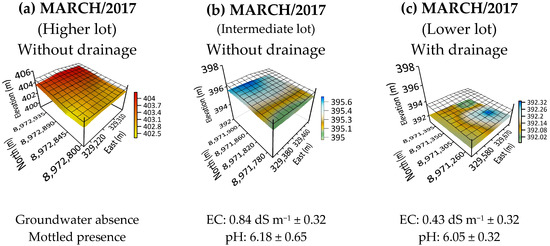
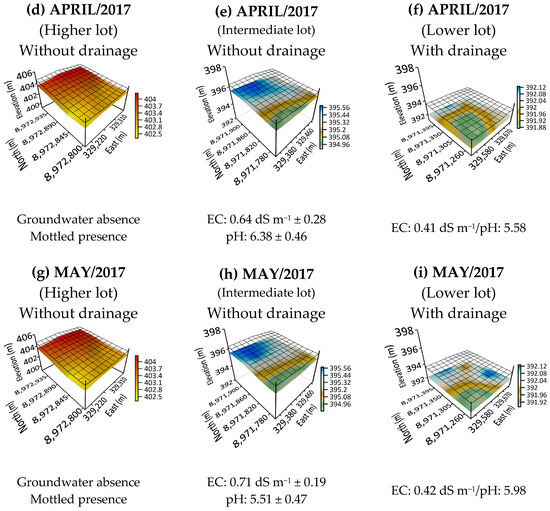
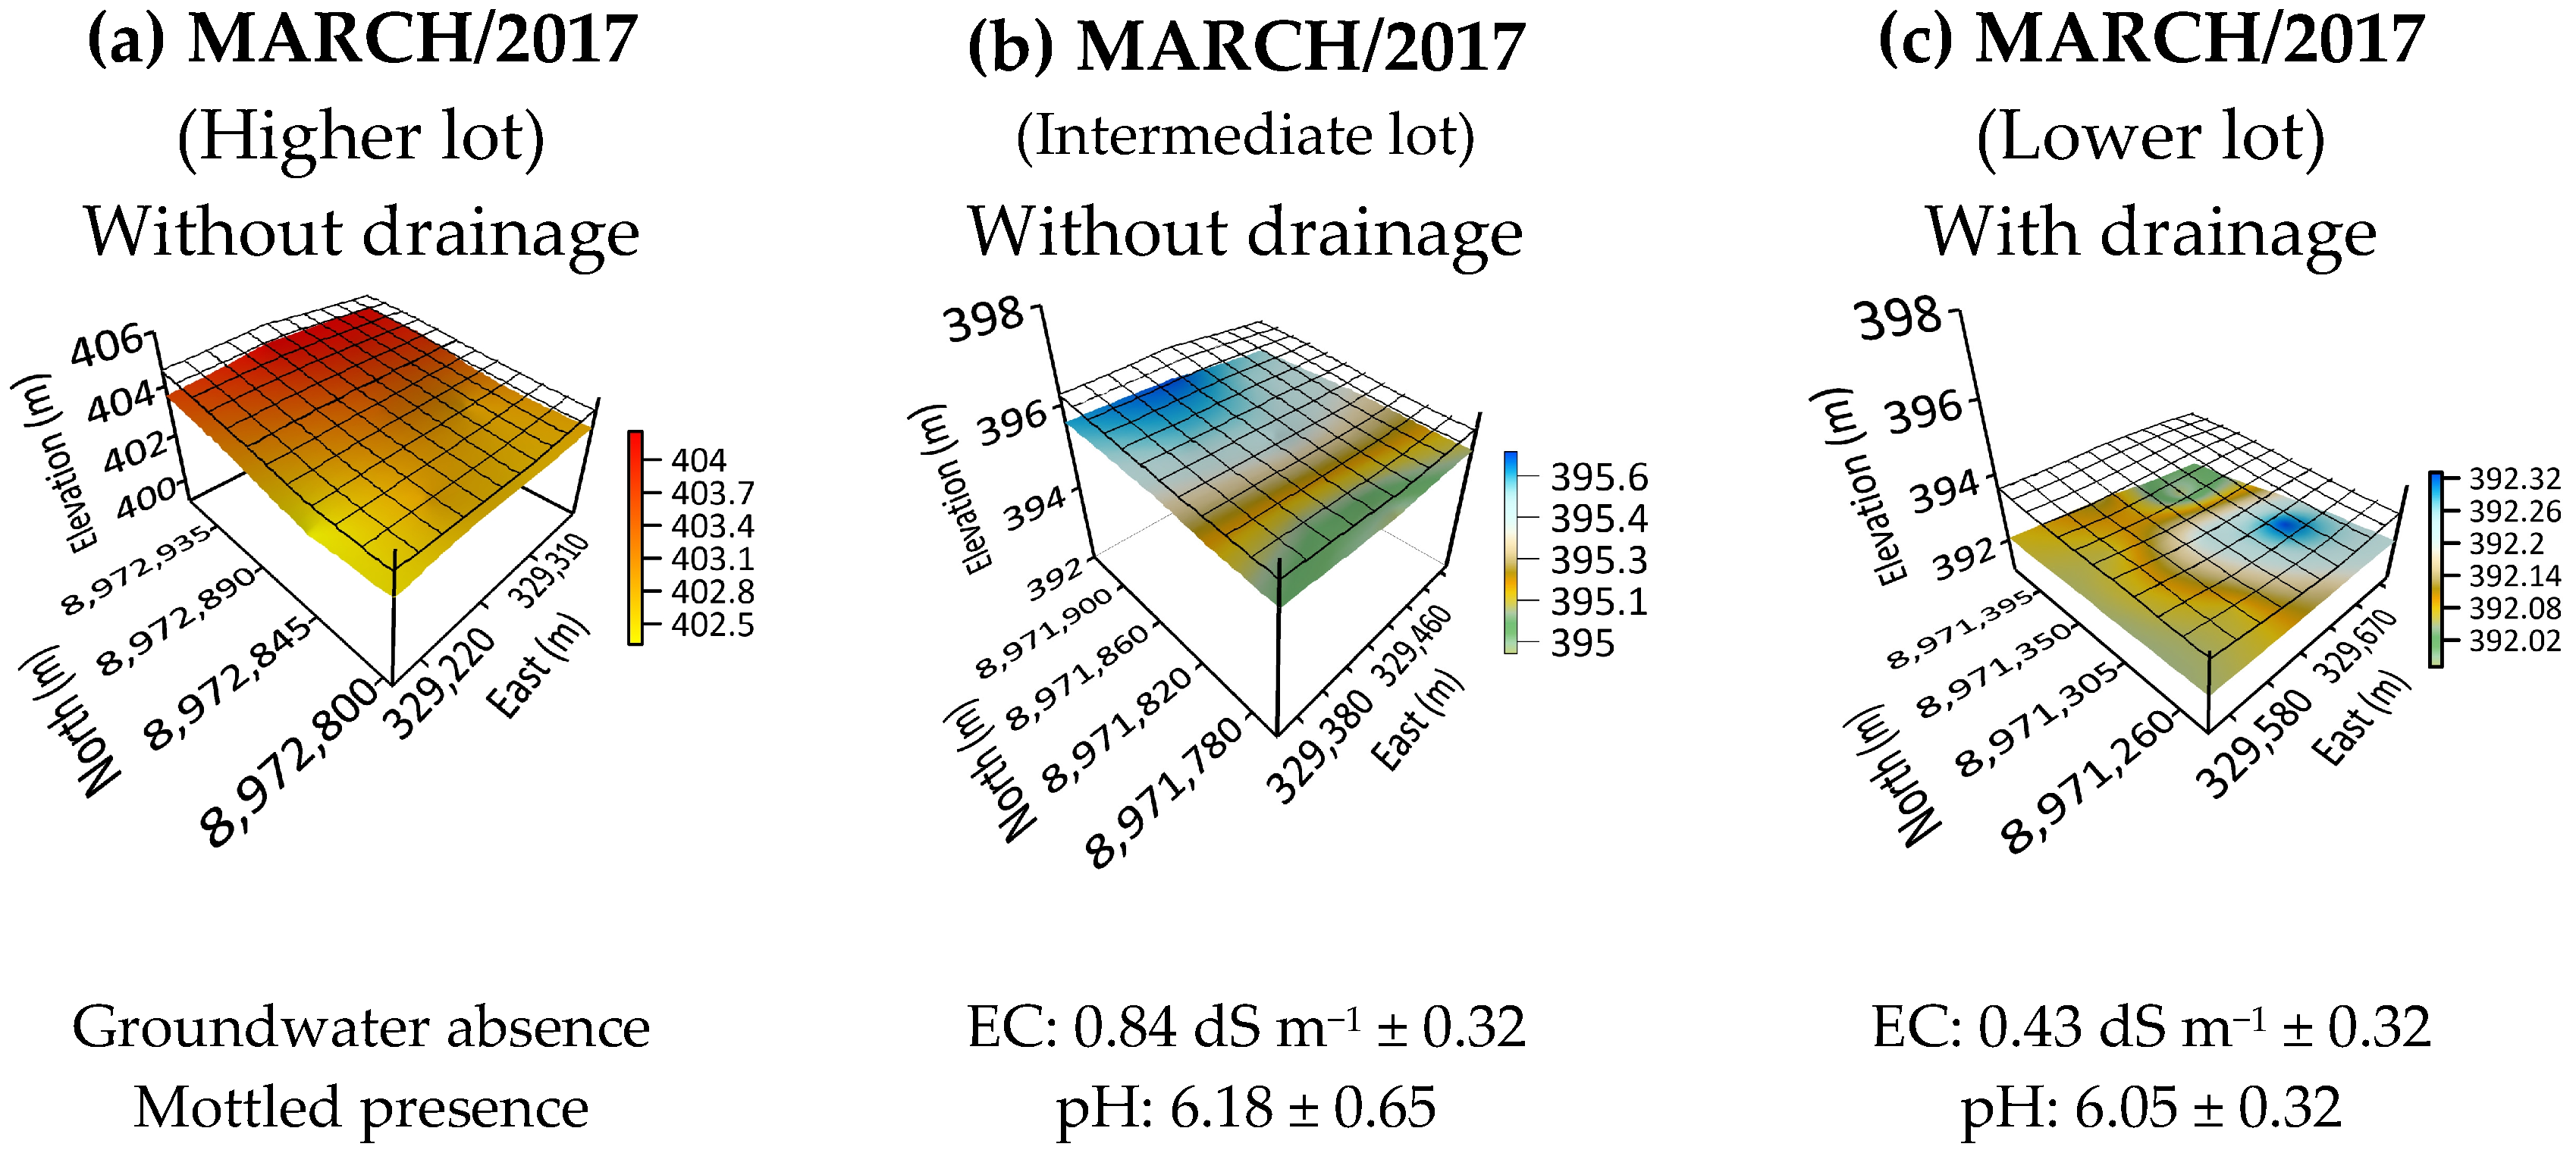
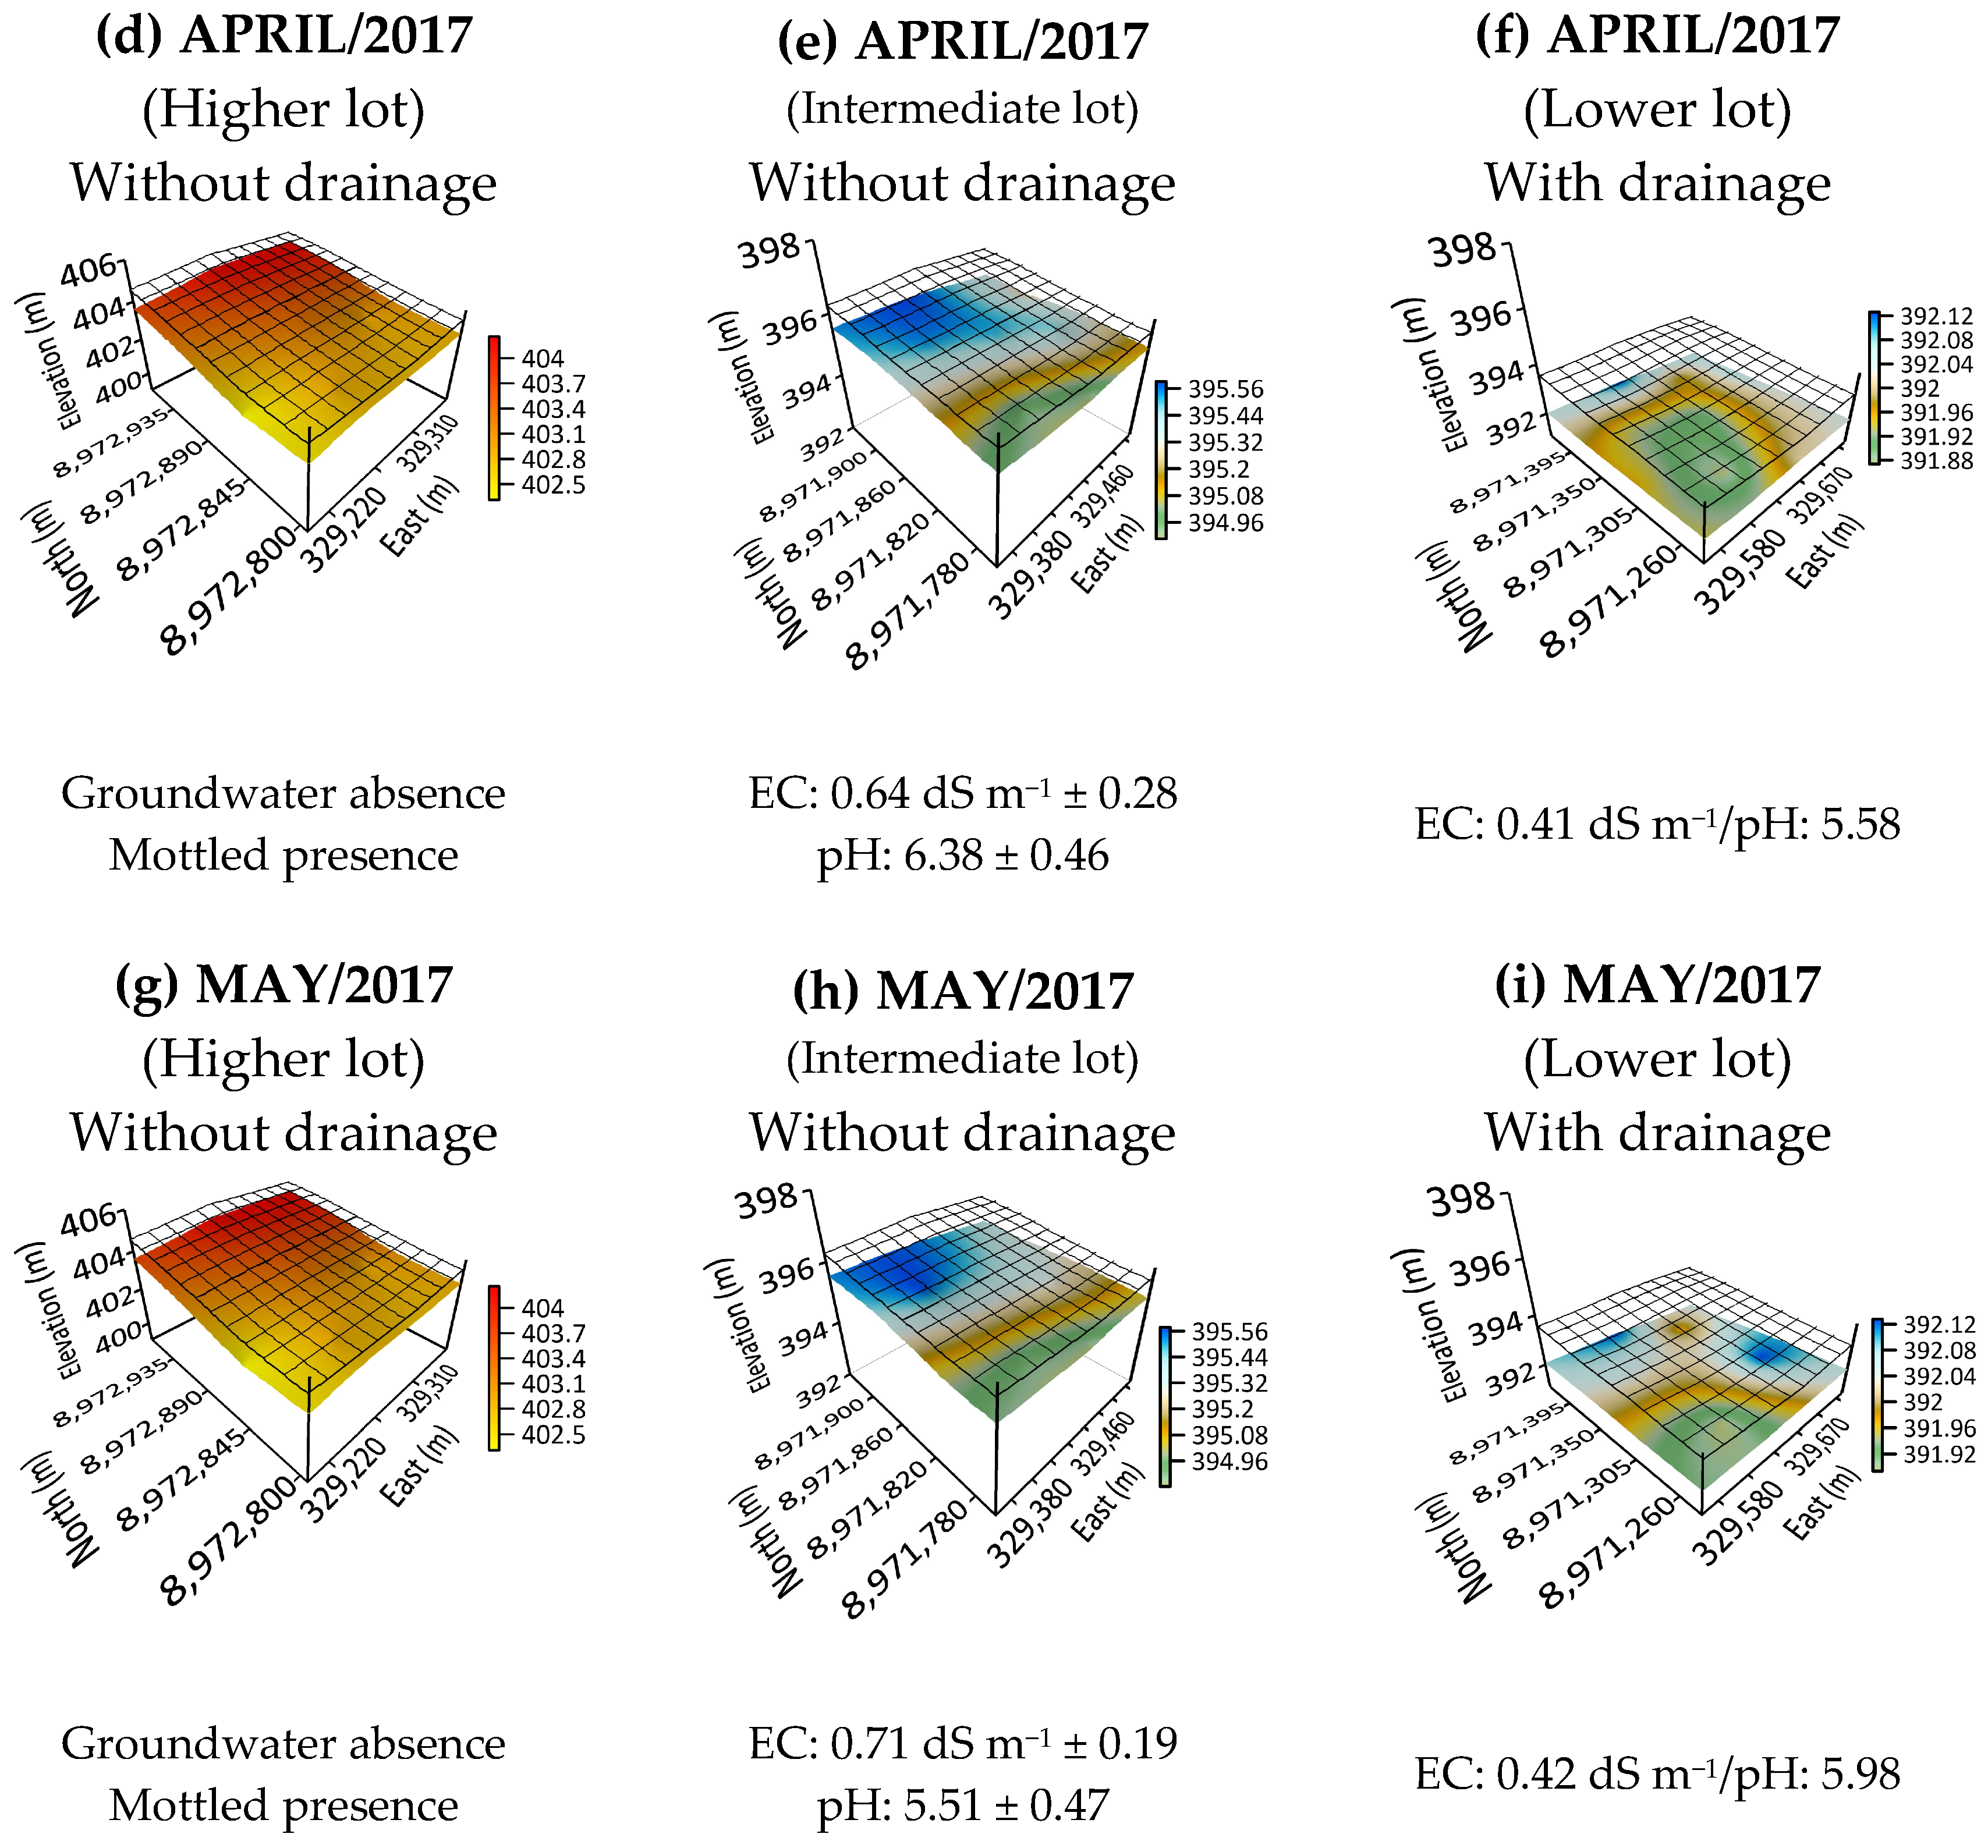
In the first quarter analyzed, in March, April and May, there was a complete absence of groundwater in the upper hillslope lot; even with irrigation events, the water balance was always negative, except in March 2017. It is worth noting the presence of mottling (Table S2—Supplementary Data) from 0.6 m depth below the soil surface in four of the nine observation wells used and, also, the fact that the impediment layer varied between 1.2 and 2.2 m in depth (Figure 7a,d,g).
Figure 7.
Groundwater dynamic in March, April and May 2017. SIRGAS 2000 UTM 24 S.
In the middle hillslope lot (without underground drainage), there was the presence of groundwater, mainly in the higher points of the lot. At these points, considering the months of March, April and May, the maximum rise of the water table in relation to the ground level was 0.40, 0.27 and 0.40 m, respectively (Figure 7b,e,h). In this lot, the impediment layer varied from 1.25 to 1.79 m and the initial presence of mottling was observed from 0.30 m, with the quantity increasing considerably from 0.60 m, being abundant from 0.90 m in depth in relation to the natural elevation of the land.
On the other hand, in the lower hillslope lot (with underground drainage) the presence of groundwater was less noticeable in the quarter of March, April and May 2017, being found on average 1.4 m below the natural surface of the ground. Another important point was checking the mottling from 0.4 m, with a greater quantity from 0.6 m and, finally, from 0.80 m in an abundant manner (Figure 7c,f,i). In the low lot, the impediment layer was found at a depth of 1.45 and 1.69 m, taking the soil surface as a reference.
Although there were no major changes in groundwater pH when comparing middle and lower hillslope lots, the electrical conductivity (EC) measured in the middle hillslope lot was 48.8, 35.93 and 40.84% higher compared to the lower hillslope lot (March, April and May 2017, respectively) (Figure 7).
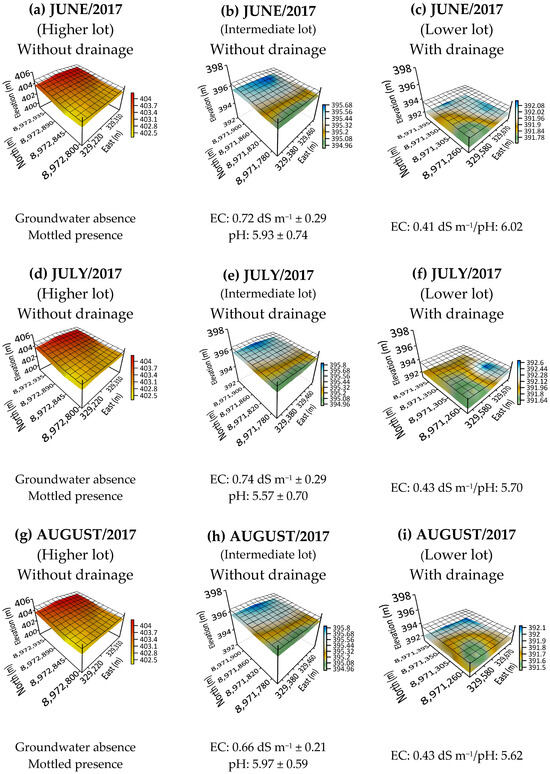
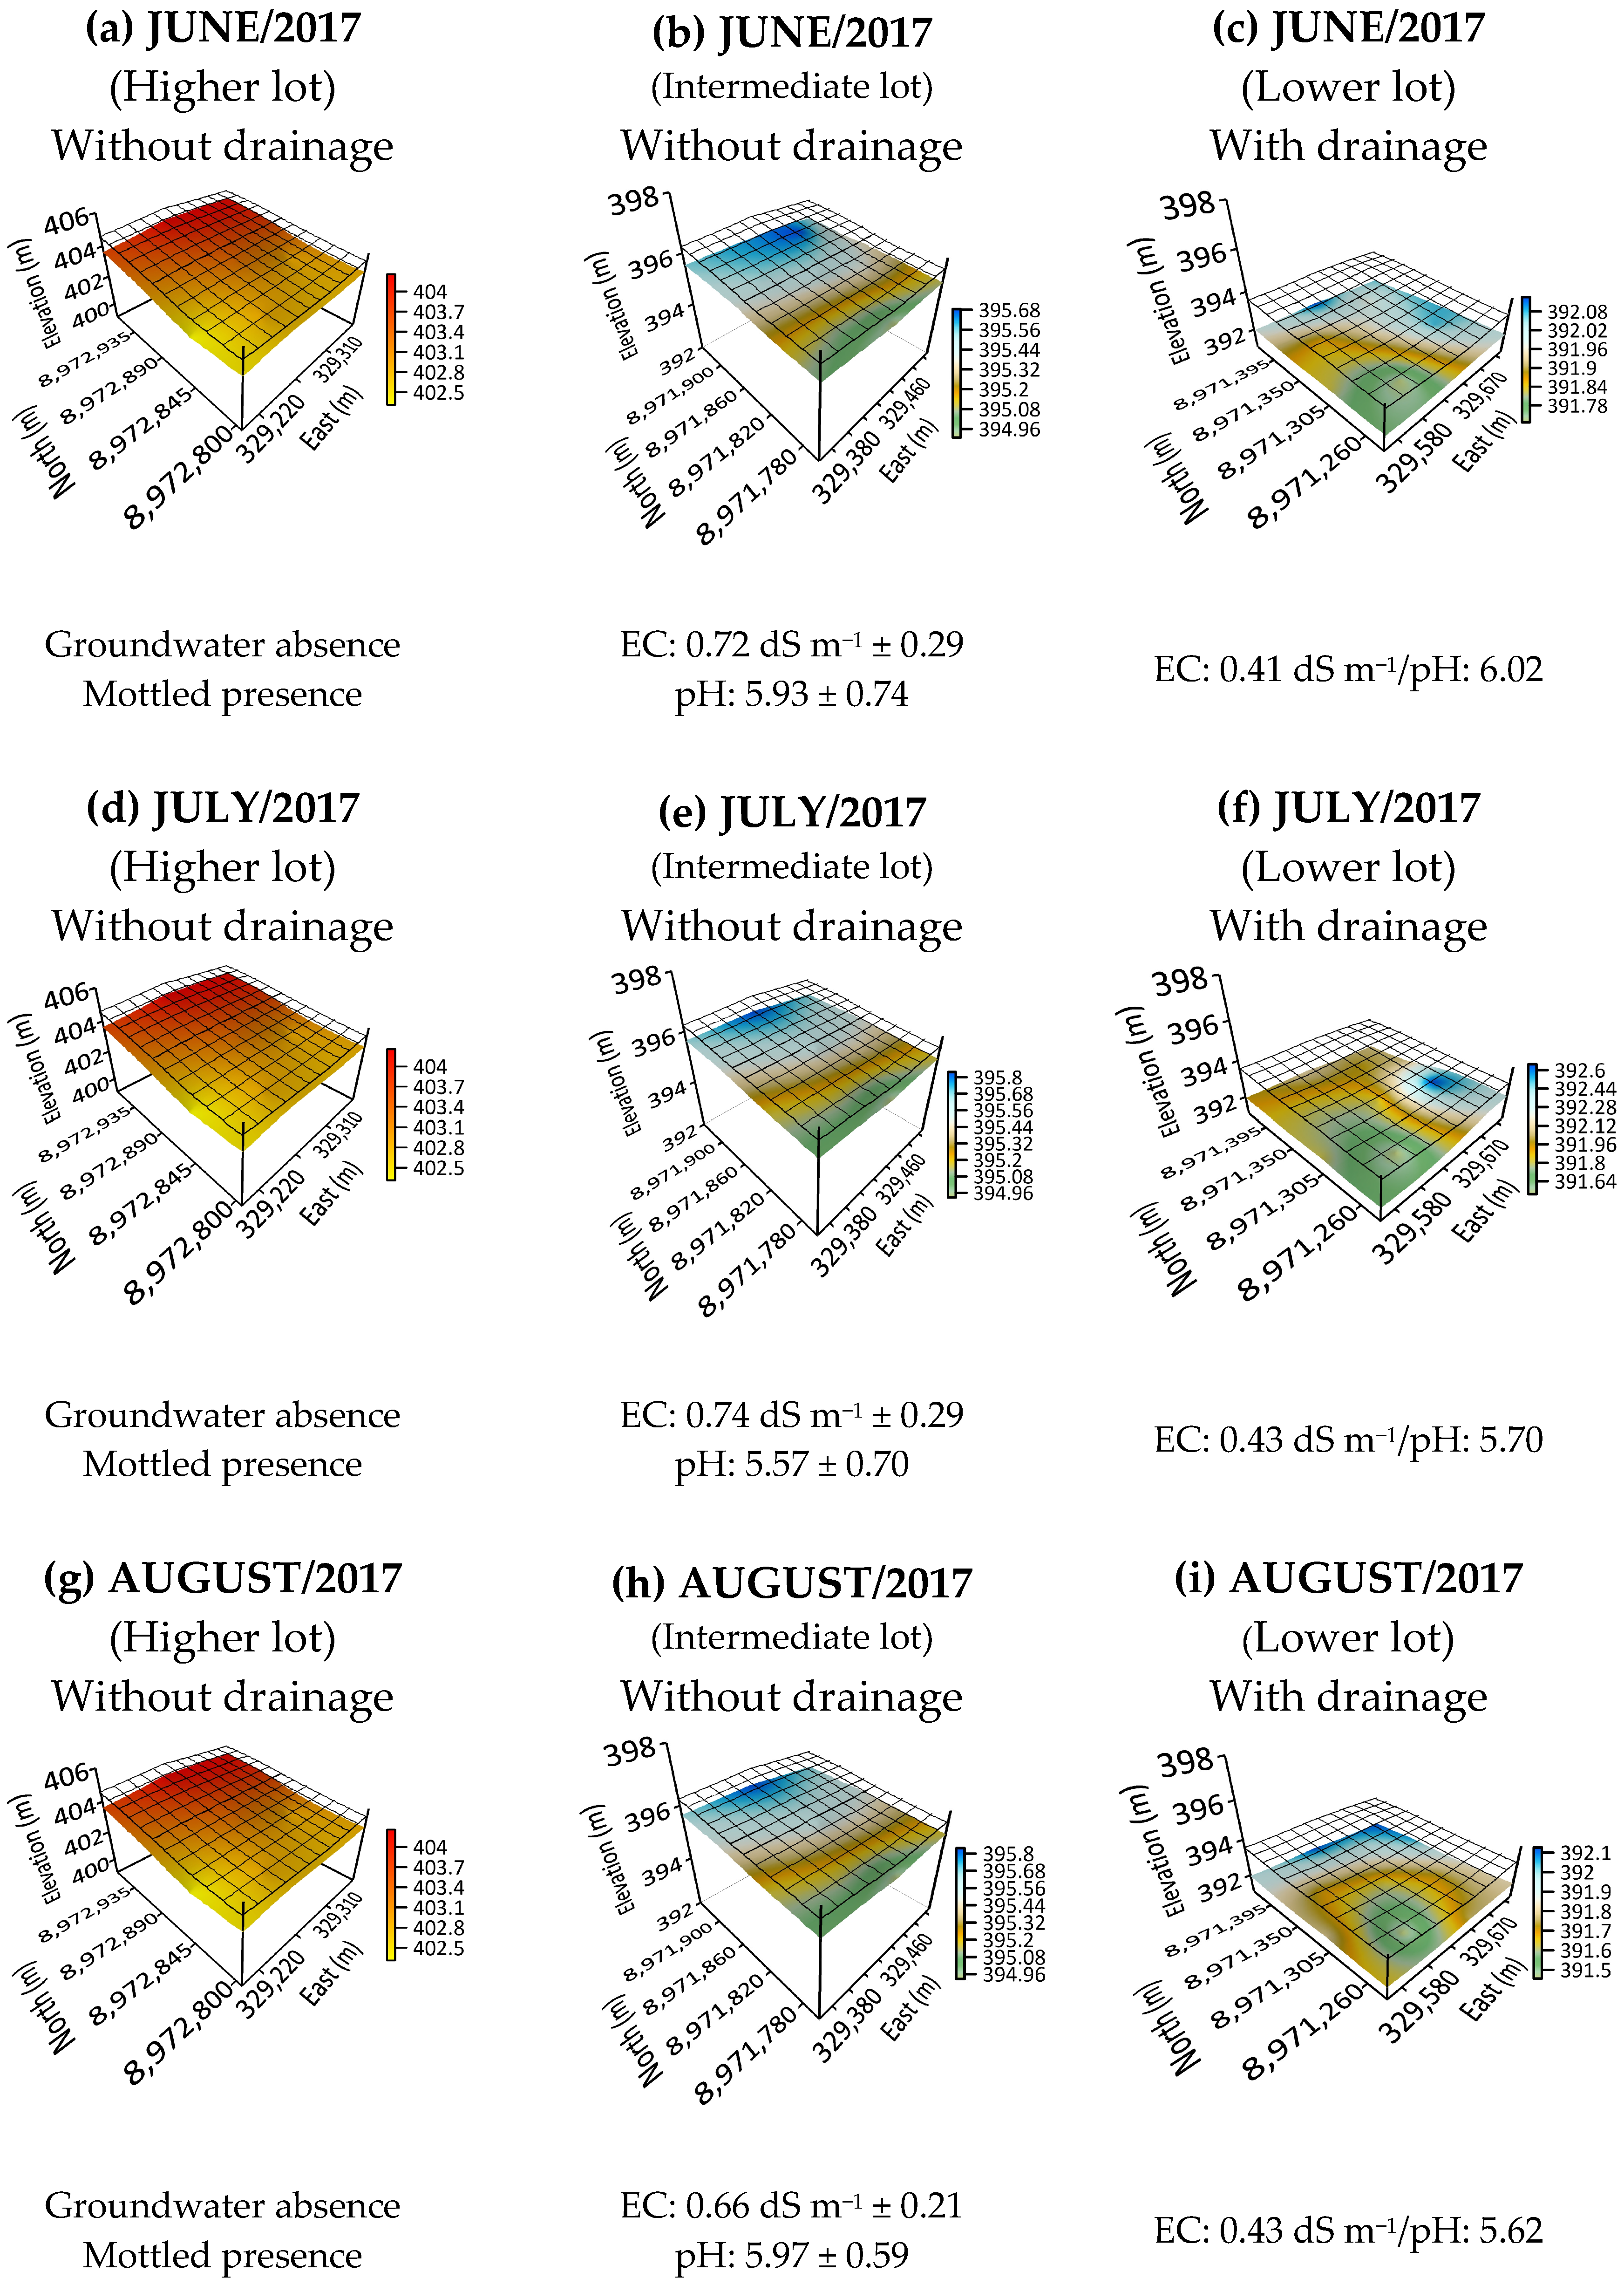
In the second quarter, in June, July and August 2017, there was also no presence of a water table in the high lot, although the ‘mottling’ remained noticeable at the same depth and abundance levels as in the previous quarter (Figure 8a,d,g). In the intermediate lot (Figure 8b,e,h) the presence of a water table is evident in the three months analyzed here; in June the water table rose between 0.37 and 0.81 m, with an average elevation of 0.57 m; in July, the rise of the water table was between 0.32 and 0.61 m, with an average rise of 0.50 m; in August, the rise of the water table was between 0.40 and 0.94 m, with an average of 0.66 m; in these cases, the values obtained in the nine wells analyzed were considered and the average was calculated.
Figure 8.
Groundwater dynamic in June, July and August 2017. SIRGAS 2000 UTM 24 S.
For the low lot (Figure 8c,f,i), specifically in the month of June, only a rise in the water table was observed (1.15 m) in one of the wells where an impediment layer was recorded at 1.18 m in relation to the ground surface. In July, the presence of a water table was verified in two wells, at a depth of 1.4 and 1.05 m, and in these same wells, the impediment layer was verified at a depth of 1.3 and 1.18 m in relation to the ground surface. On the other hand, in the month of August there is a slight perception of the presence of a water table on the upper right side of the lot, with almost negligible minimum elevations.
The EC values verified in this quarter (June, July and August 2017) were, on average, 0.70 and 0.42 dS m−1 in the intermediate and low lot, respectively; that is, the average CE of the intermediate batch was 66.7% higher than that of the low lot. However, the average pH value was 5.82 and 5.78 in the intermediate and low lots, respectively, i.e., a 0.7% difference.
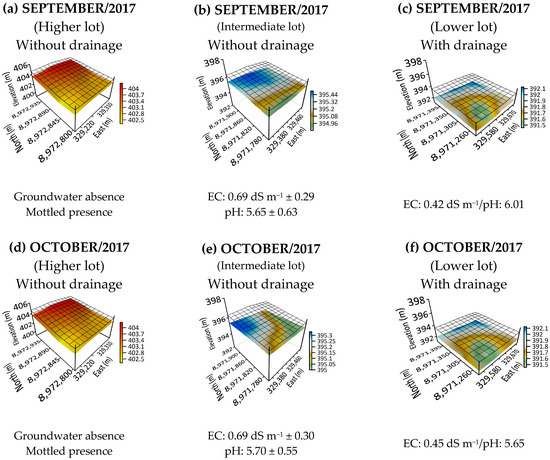
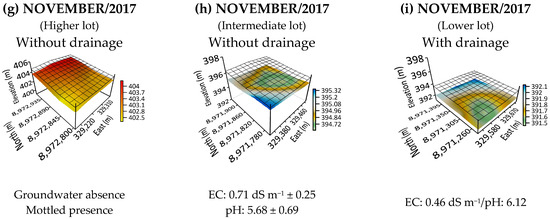
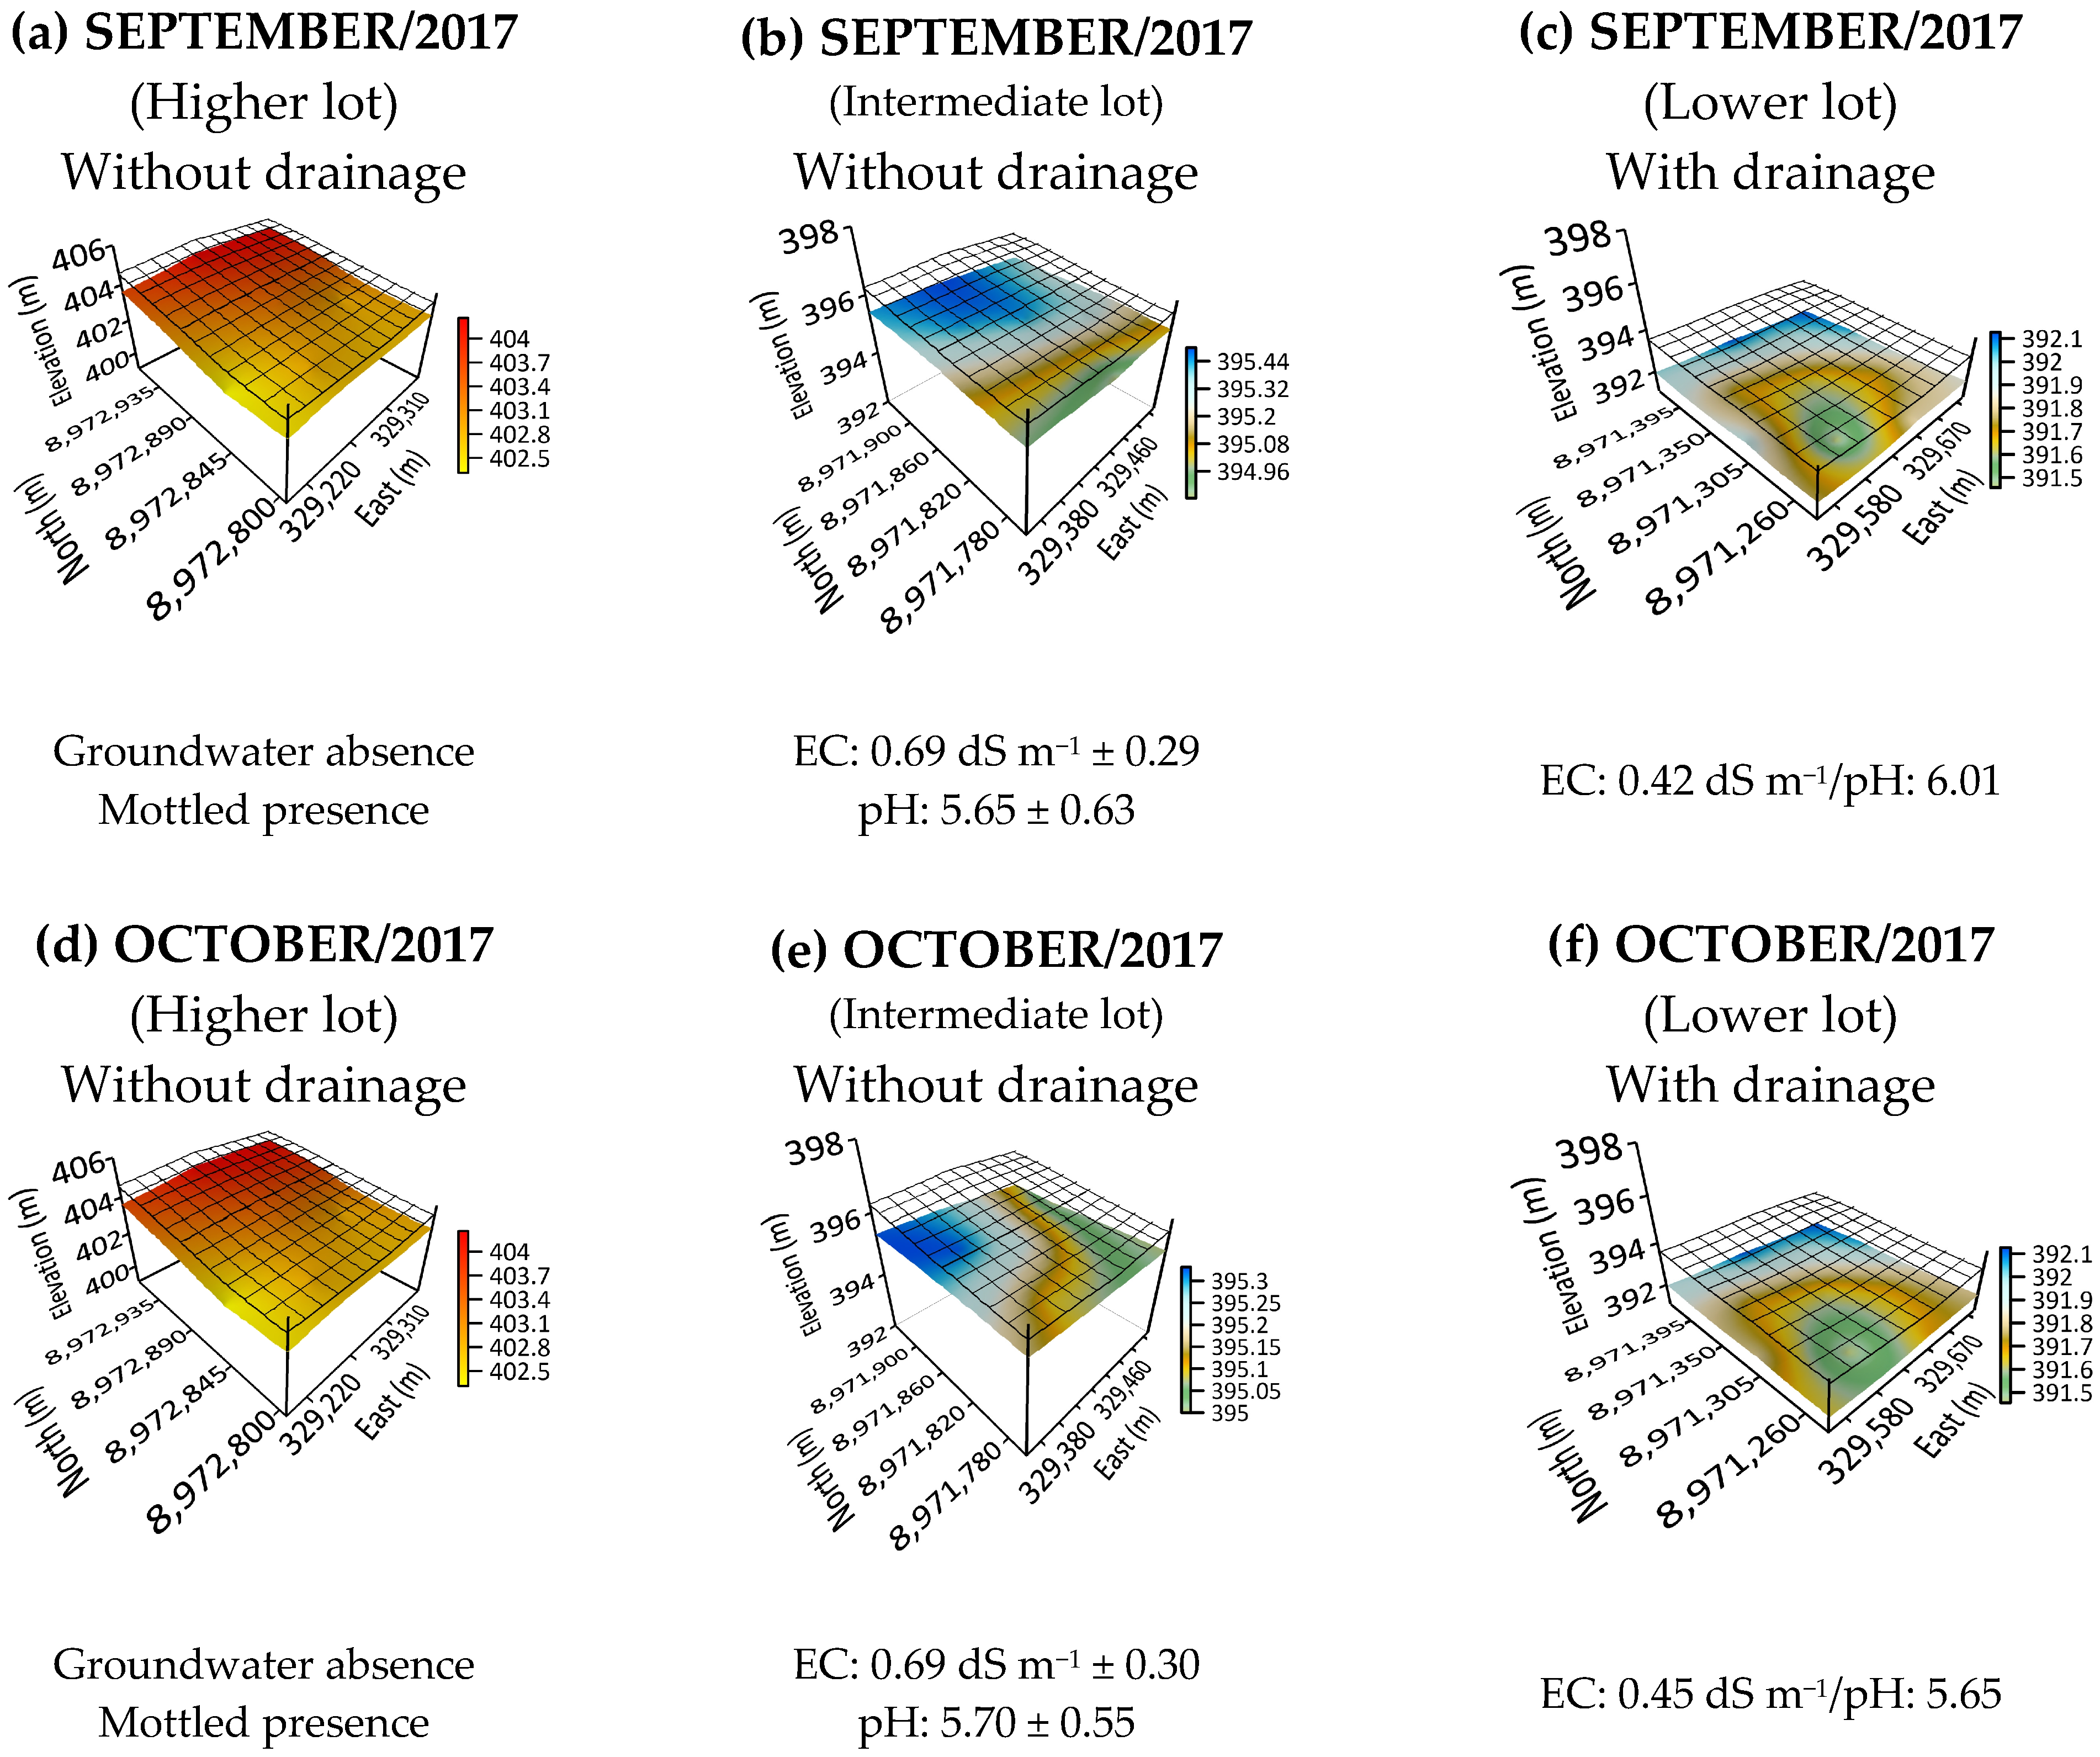
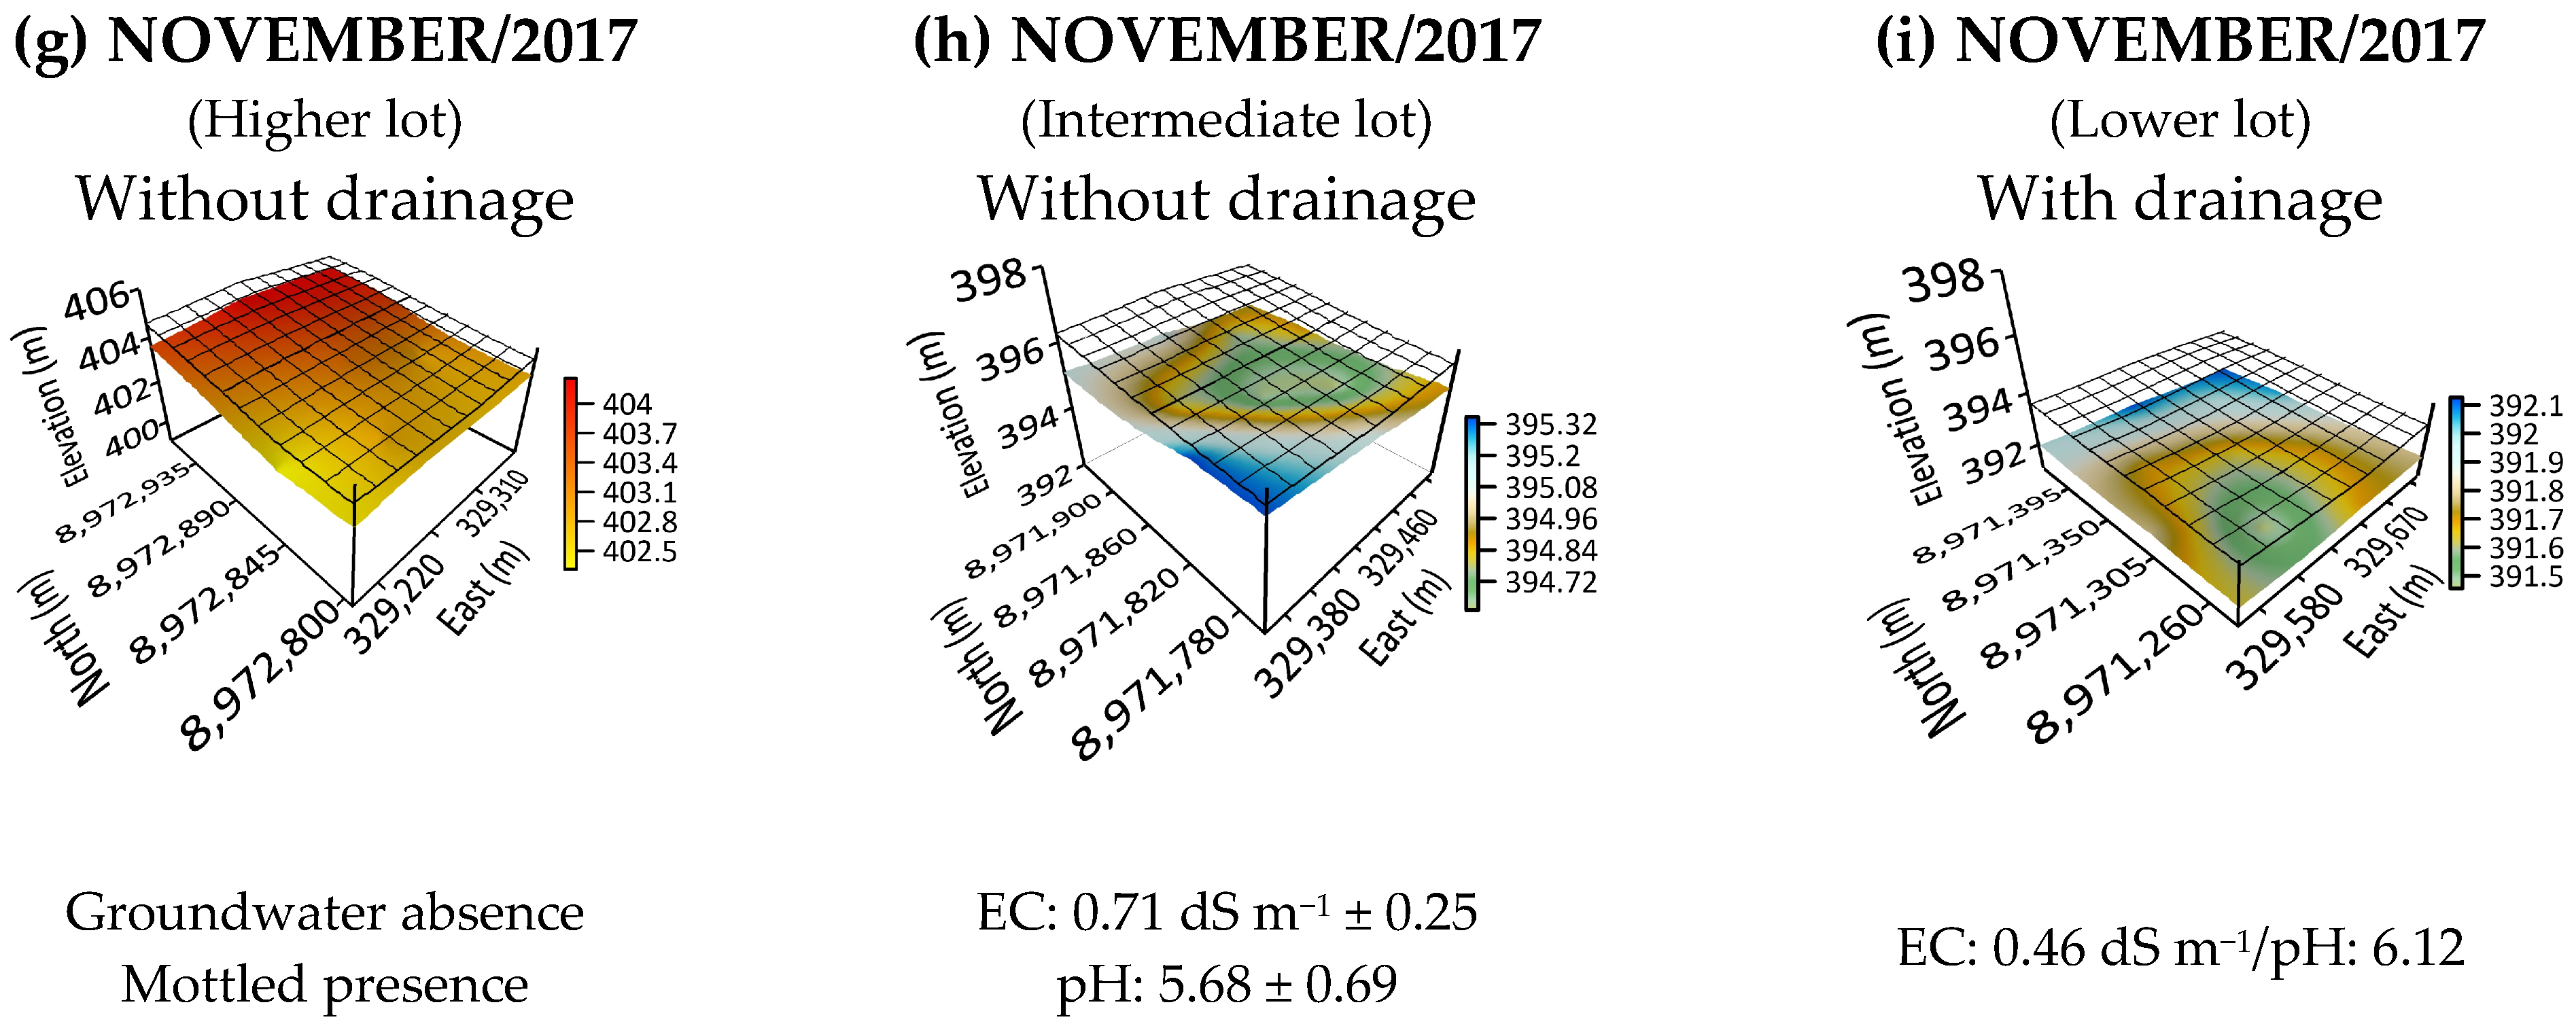
In the months of September, October and November 2017, as in all previous quarters, there was no record of the presence of the water table in the high lot (Figure 9a,d,g). In the intermediate lot, in the month of September, the presence of the water table was verified at the highest levels of the lot, at a depth of 0.4 to 0.6 m; in October, the water table was checked from a depth of 0.38 m, also in the upper part; and in the month of November, in three of the nine wells, a water table of 0.40 m was found and, in the other wells, from 1.2 m (Figure 9b,e,h).
Figure 9.
Groundwater dynamic in September, October and November 2017. SIRGAS 2000 UTM 24 S.
The dynamics of the groundwater in the middle hillslope lot between September and October 2017 was influenced by the water supplied via irrigation, so that the distribution of the groundwater showed the tendency to concentrate at the same region of the lot (Figure 9). However, in November 2017, when the evapotranspiration demand was higher than the water supply, there was a tendency of groundwater to flow to the lower points of the middle hillslope lot and to accumulate in the highest points of the lower hillslope lot.
In the low lot the presence of a water table was insignificant in the three months analyzed, showing that the installed underground drainage was efficient, which explains the minimal elevation. Regarding the EC and pH values of the water table, in the intermediate and low lots, an average EC of 0.69 and 0.44 dS m−1 was observed, respectively, as well as respective values of 5.73 and 5.92 for pH, values that repeat the trend of the previous quarters (Figure 9c,f,i).
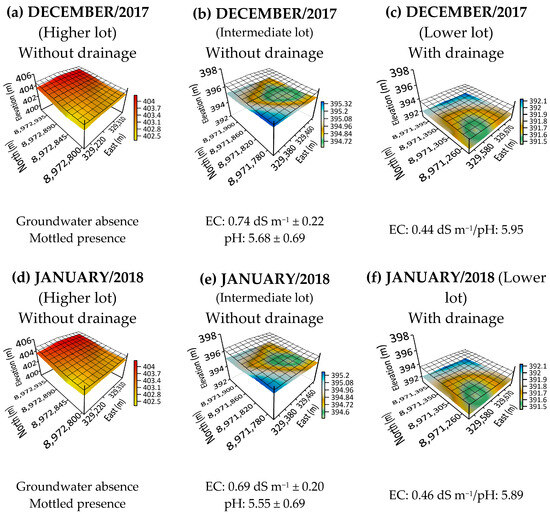
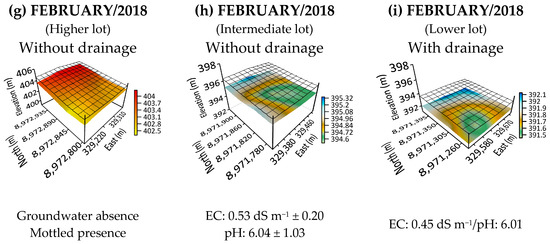
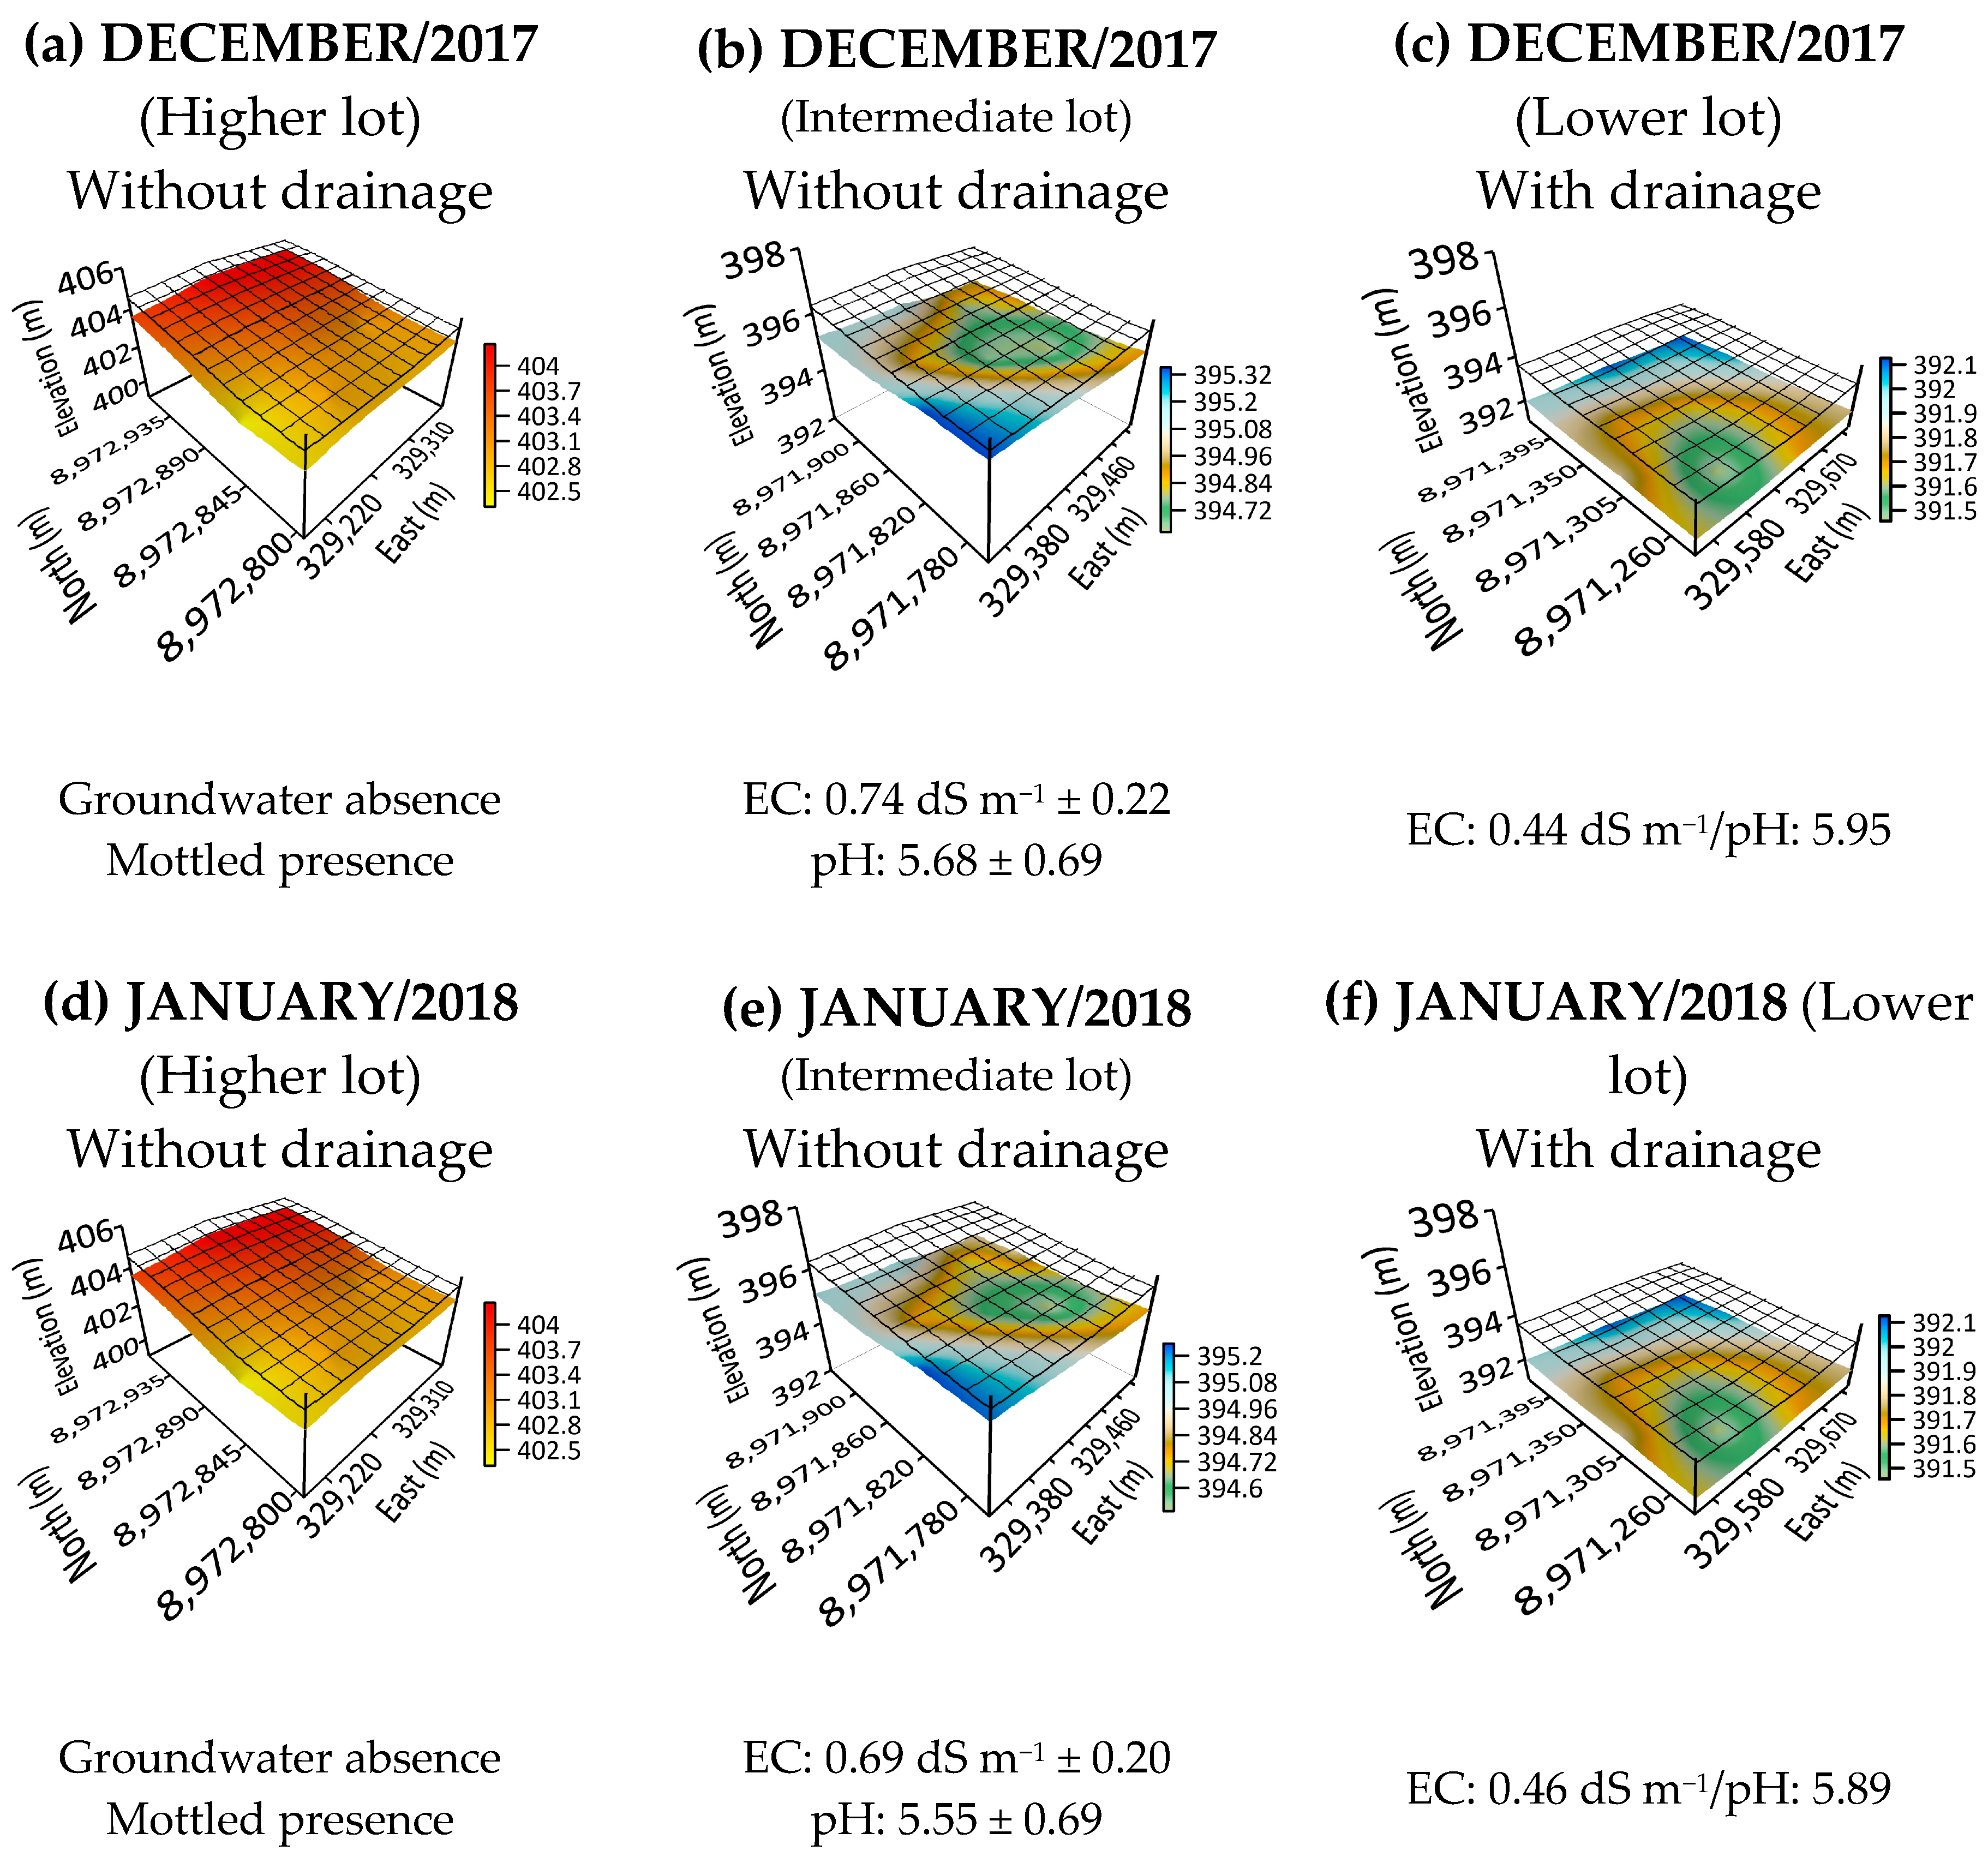
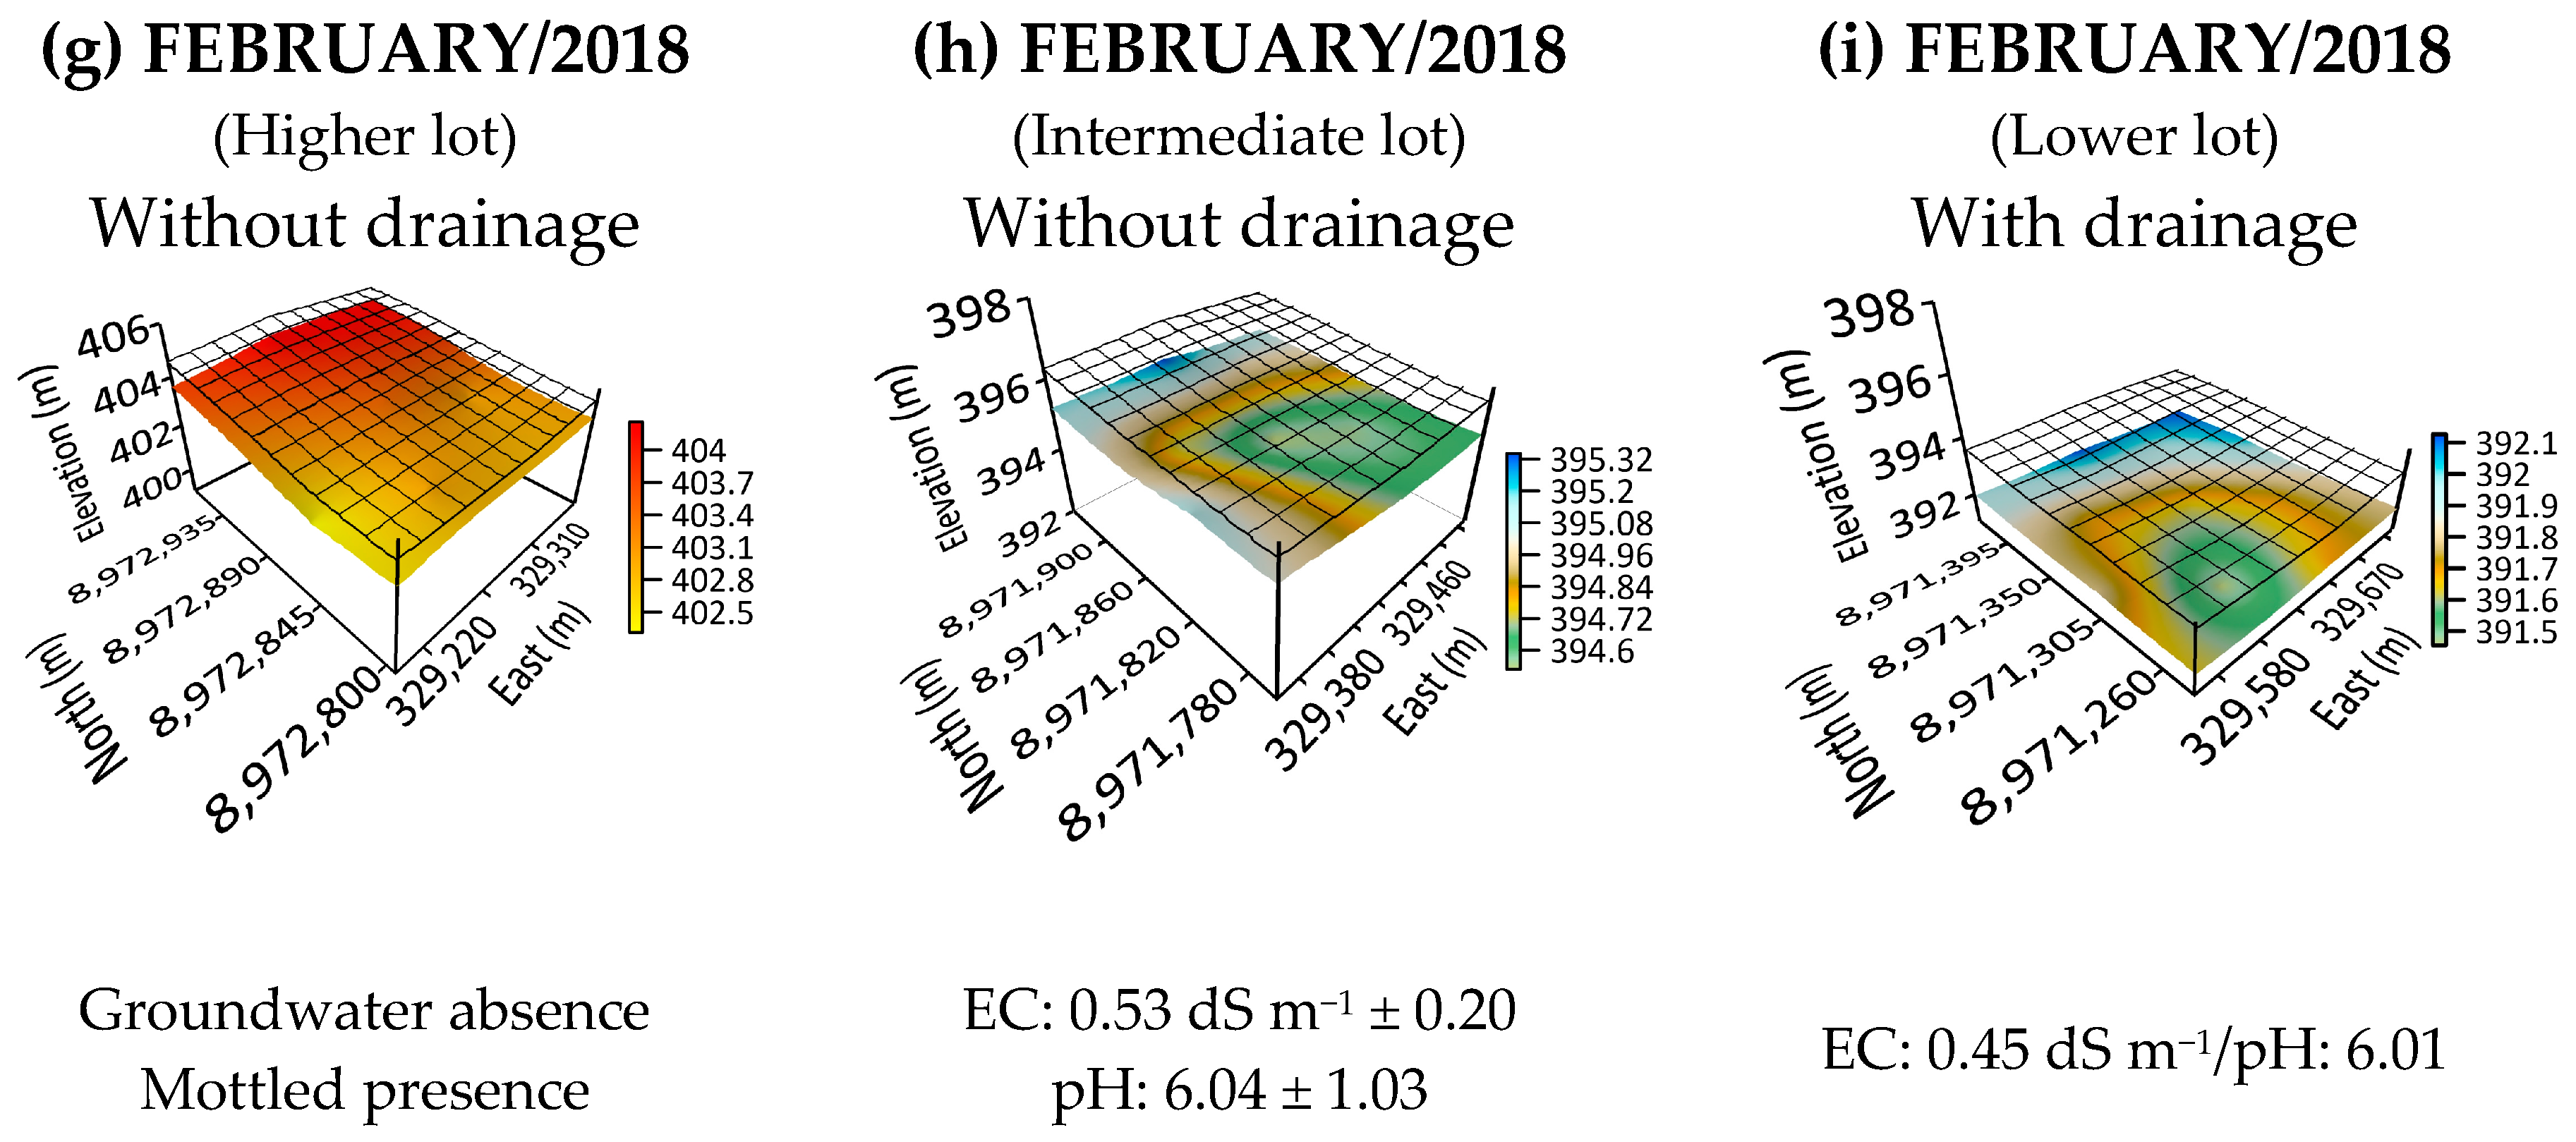
In the last quarter analyzed (December 2017, January and February 2018) the trend of no presence of water table in the high lot continued (Figure 10a,d,g). In the intermediate lot, it was noted that the tendency for the presence of a water table in the lowest part of the lot verified in November 2017 remained in the months of December 2017 (presence of water table from 0.39 m depth) and January 2018 (presence of water table from 0.49 m depth), unlike February 2018, when the presence of the water table was more pronounced in the lowest part of the lot, with the presence of the water table from 0.60 m in depth (Figure 10b,e,h). In the lower lot, the trend was similar to that observed in previous quarters, with an incipient presence of a water table located in the upper right part of the lot (Figure 10c,f,i).
Figure 10.
Groundwater dynamic in December 2017, January and February 2018. SIRGAS 2000 UTM 24 S.
4. Discussion
4.1. Water Balance, Rise of the Water Table and Presence of Mottling
The lot located at the top of the slope was under water deficit in all months analyzed, except in the months of March 2017 and February 2018. At no time, not even in the rare moments of positive water balance, was the presence of a water table observed, corroborating, in principle, the thesis that higher elevations usually have well-drained soil [22]. Corroborating this, after studies in toposequence areas in Cambodia, Tsubo et al. [23] also found that the dominant component for the upper part of the toposequence was the downward flow of water.
On the other hand, it is worth highlighting the “rare and common” presence of mottling from 0.6 and 0.8 m depths in relation to the soil surface, respectively; this means that the mottling was at a depth inconsistent with the position of the lot in the landscape; that is, the expectation was that there would be no presence of stains due to the water flow established by the toposequence.
Among the causes for the presence of mottling in the high lot, one can list possible leaks in the conduit channel located upstream of the lot or the marked difference in the physical characteristics of the soil with increasing soil depth; for example, the reduction in hydraulic conductivity from 0.89 to 0.39 m per day, and a 90.2% increase in the amount of clay with increasing depth up to 0.6 m (Table S1—Supplementary Data). These factors limit the flow of water in the profile and may have conditioned the temporary existence of the water table, in a time sufficient for the formation of the mottling. The presence of an indurated (plinthite) layer in the subsurface soil was also mentioned by Oyebiyi et al. [24], after studies in toposequence in Wasinmi, Southwest Nigeria; the authors associated this layer with “imperfect drainage conditions”.
The presence of mottling and its increase with increasing depth can be attributed to periods of seasonal saturation and anaerobic conditions, i.e., they are reliable indicators of high water tables and restricted drainage [20]. On the other hand, it is clear that in the twelve months analyzed in 2017 and 2018, including March 2017 and February 2018 when there was a positive water balance, there is no record of the presence of the water table, which can be attributed to the influence of the position of the lot in the toposequence regarding natural drainage. Although variations in the physical characteristics of the soil profile reduced hydraulic conductivity and increased the time required for drainage, groundwater flow occurred in the direction of the natural runoff of surface water [25].
The presence of groundwater in the middle hillslope lot, even with collector drains all around its perimeter, can be attributed to application of irrigation depths that surpass the evapotranspiration demand, notably, in the months of March, July and July 2017, as well as in February 2018 (Figure 6). Among other aspects, the predominant soil texture was sandy, associated with a hydraulic conductivity of 1.26 m per day (Table S1—Supplementary Data), detected up to 0.3 m deep, which may have favored the underground flow towards the toposequence.
In the middle hillslope lot, despite the negative water balance, the presence of a water table may be attributed to the impedance layer surface, which takes a concave form in the central region of the lot, favouring the accumulation of water and salts. In addition, there is also a reduction in hydraulic conductivity from 1.26 to 0.12 m per day with increasing depth up to 0.6 m, which explains the presence of little mottling from 0.30 m and the common presence of mottling from 0.6 m in depth in relation to the soil surface (Table S1—Supplementary Data). This reduction in the value of hydraulic conductivity can be attributed to the disconnectivity and discontinuity of the macropore network; ref. [26] associate the reduction in hydraulic conductivity with the type of land use and we infer that in the conditions of the semi-arid region of central Iran, the change from pasture to agricultural use had a negative influence on soil hydraulic properties. We therefore infer that the formation of the mottling was due to the change in hydraulic conductivity along the profile; that is, the presence of slow permeability horizons conditioned the formation of a suspended water table in periods of greater rainfall [27] or depending on irrigation (intermediate lot).
In summary, there are two particularities in the intermediate lot that determine the observed trend: the presence of a concave-shaped impediment layer that directs the flow of water to the lowest elevation of the impediment layer and not to the collector drain arranged around the lot, and the amount of water applied via irrigation that resulted in a positive water balance in four of the twelve months analyzed.
In the lot located in the lowest part of the toposequence, the presence of little mottling was observed from 0.40 m and became common from 0.6 m. The presence of mottling closer to the surface in relation to the high lot can be attributed to the position of the lot in the toposequence, even considering some particularities of the low lot: the presence of an underground drainage system; the reduction in hydraulic conductivity from 1.58 to 0.24 m per day along the soil profile to a depth of 0.6 m; and, finally, the only time a positive water balance was recorded was in February 2018, even though irrigation depths similar to those applied to the high lot were applied to this lot. The physical aspects of the soil also induced the presence of mottling and, even if in small quantities, the presence of a water table was observed in the low lot, which did not occur in the high lot, attesting to the influence of the toposequence.
Measurements of water table fluctuations are widely used to quantify rainfall recharge and groundwater evapotranspiration (ETg); specifically for agriculture, an inadequate water table depth is associated with vegetation degradation and soil secondary salinization [28]. Just as in the Brazilian semi-arid region, in semi-arid areas of several countries around the world there are reports of salinity problems in irrigated areas associated with shallow water tables, for example, in Guangming Village, China [29]. Elsamet et al. [30] mention this type of problem in the northeastern region of Egypt. Addab and Balley [31], studying the transport of salt ions in a watershed, present results for the Fairmont Drainage District, located in the Lower Arkansas River Valley, Colorado, USA. It is therefore evident that this type of problem recurs on the planet and that studies related to monitoring and controlling the water table for irrigated agriculture in semi-arid regions of various parts of the world are relevant.
4.2. EC and pH of Water Table
The tendency towards lower EC values in the lower hillslope lot compared to the middle hillslope lot evidences the role of underground drainage in removing salts from the area, since the dynamics of water and salts in the soil are naturally favoured by the toposequence, providing accumulation of water and salts at the lower points. It is important to highlight the beneficial effect of underground drainage in the lower lot, especially since the expectation is that long-term irrigation will increase the complexity and accelerate the fragmentation of groundwater chemistry and salinity distribution [32,33]. On the other hand, even with the negative water balance, the EC in the middle hillslope lot was changed little in relation to the first trimester studied, indicating that there were no salt concentration increments, even under deficit water balance.
In this context, the role of the toposequence is associated with favouring the underground flow of water and salts by the difference in quota, which is also influenced by the soil physical-hydric characteristics (Table S1—Supplementary Data). In the Lower Acaraú Irrigated District—DIBAU, Ceará, Brazil, studies about the dynamic of the groundwater level and the salinization of underground water in irrigated areas confirm this result; they have also found surplus irrigation depths and well recharge during the dry season, indicating the movement of water to lower levels [34]. The role of the toposequence in promoting water table flow is crucial for long-term irrigated agriculture. Zang et al. [35] confirm that groundwater salinization is aggravated by agricultural activity in work carried out in the context of the Yinchuan dam in China.
It is important to note that groundwater EC and pH had little variation from the first through the fourth quarters evaluated in the middle hillslope lot, even without underground drainage and under irrigation. In this case, it is possible to attribute this result to the lixiviation process induced by irrigation depth, the capacity of soil drainage and, mostly, the water dynamic and salts imposed by the toposequence [27].
In the same way, the dynamic of groundwater EC and pH varied little in the lower hillslope lot, considering the length of the period evaluated. At the outset, natural drainage suggests greater accumulation of water and salts in the lower elevation quotas, making them more susceptible to salinization processes [10,36]. Within this sense, the results discussed here confirm the importance of underground drainage to remove water and salts [25]; however, its indispensability, in this case, was related only to specific lots of the toposequence, mainly in the lower elevation quota. In studies on the groundwater in irrigated areas in the São Francisco Valley, Cabral et al. [37] also found the existence of critical points in specific locations within the area, that is, points where the groundwater compromised the performance of the worked culture, which emphasizes the argument now proposed that the decision to install underground drainage or not must be weighed based on the specific characteristics of each area and considering the position of the lot in the toposequence.
5. Conclusions
The position of the plot in the toposequence influences whether or not the installation of underground drainage is necessary, even in the context of irrigated fruit farming.
In lots located at higher elevations, even in the absence of a water table, the presence of abundant mottling can be an indicator of drainage problems.
Even with irrigation water supplied to plots located at elevated points in the toposequence, the negative water balance and the water and salt dynamics in the soil induced by the toposequence favor the maintenance of low EC levels in the water table.
The reduction in hydraulic conductivity and the increase in clay content along the soil profile led to the formation of mottling even in the high lot, in whose dynamics the presence of a water table was not observed at any time analyzed.
It is proposed that the decision regarding whether or not to install underground drainage be made on a case-by-case basis; it should take into account, among other aspects, changes in physical characteristics along the soil profile, possible occurrence of mottling, the quality of irrigation water, the irrigation management adopted and the position of the lot in the toposequence.
Further studies are needed to verify the influence of the position in the toposequence on the level and electrical conductivity of the water table, considering other soil types, crops, and irrigation systems.
Supplementary Materials
The following supporting information can be downloaded at: https://www.mdpi.com/article/10.3390/hydrology13030099/s1, Figure S1. Geographic location of the Senador Nilo Coelho Public Irrigation Project in the municipality of Petrolina, State of Pernambuco, Brazil. Source: Adapted from Codevasf (2018); Figure S2. Location of observation wells. Petrolina, Pernambuco, Brazil—Senador Nilo Coelho Public Irrigation Project, February 2018; Table S1. Physical-hydric characterization of the soil samples collected in the lots studied. Petrolina, Pernambuco, Brazil—Senador Nilo Coelho Public Irrigation Project, February 2018; Table S2. Depth of the impeding layer, mottling (few, common and abundant) and water table in relation to the soil surface of the high, intermediate and low plots. Petrolina, Pernambuco, Brazil—Senador Nilo Coelho Public Irrigation Project, March 2018.
Author Contributions
Conceptualization, L.d.R.F.L., V.B.d.A., C.D.G.C.d.A. and J.A.S.J., Data curation, G.R.d.M., M.M.d.S., C.D.G.C.d.A. and J.A.S.J.; Formal analysis, G.R.d.M., C.D.G.C.d.A., K.J.J., L.d.R.F.L. and J.A.S.J.; Funding acquisition, C.D.G.C.d.A., M.D.I.D. and L.d.R.F.L.; Investigation, V.B.d.A., R.N.B., M.D.I.D., K.J.J., T.F.d.O. and J.A.S.J.; Methodology, V.B.d.A., C.D.G.C.d.A., T.F.d.O., G.R.d.M., L.d.R.F.L. and J.A.S.J.; Project administration, C.D.G.C.d.A., A.T.C.S.G.d.S., R.N.B. and L.d.R.F.L.; Resources, L.d.R.F.L., C.D.G.C.d.A., M.D.I.D., T.F.d.O. and J.A.S.J.; Software, M.M.d.S., A.T.C.S.G.d.S., T.F.d.O., J.F.F.J. and R.N.B.; Supervision, C.D.G.C.d.A., V.B.d.A., G.R.d.M. and J.A.S.J.; Validation, L.d.R.F.L., M.D.I.D., R.N.B., C.D.G.C.d.A. and J.A.S.J.; Visualization, L.d.R.F.L., C.D.G.C.d.A., J.F.F.J., K.J.J., A.T.C.S.G.d.S. and J.A.S.J.; Writing—original draft, C.D.G.C.d.A., K.J.J., M.M.d.S., J.F.F.J. and J.A.S.J.; Writing—review and editing, M.M.d.S., A.T.C.S.G.d.S., T.F.d.O., J.F.F.J. and J.A.S.J. All authors have read and agreed to the published version of the manuscript.
Funding
The research was financed with resources from UFRPE, PROEX-CAPES (88881.183005/2025-01) of the Postgraduate Program in Agricultural Engineering at UFRPE/Sede and InctAgris.
Data Availability Statement
I declare that the data have privacy restrictions.
Acknowledgments
To the agricultural producers of the Senator Nilo Coelho Public Irrigation Project for permission to use their areas and protect the materials and equipment installed: Antônio Rosa da Silva Neto, Edson Tadashi Nakahara and Norberto Gomes de Oliveira Sobrinho (in memoriam). The authors also thank the 3rd Superintendence of CODEVASF and EMBRAPA Semi-arid, both located in Petrolina-PE, Brazil, as well as the Federal Rural University of Pernambuco for the support, infrastructure and logistics provided.
Conflicts of Interest
Authors have received the support, infrastructure and logistics provided by the 3rd Superintendence of CODEVASF and EMBRAPA Semi-arid.
References
- Elmahdi, A. Addressing Water Scarcity in Agricultural Irrigation: By Exploring Alternative Water Resources for Sustainable Irrigated Agriculture. Irrig. Drain. 2024, 73, 1675–1683. [Google Scholar] [CrossRef] [Scilit]
- Bhering, A.P.; Antunes, I.M.H.R.; Marques, E.A.G.; de Paula, R.S. Geological and Hydrogeological Review of a Semi-Arid Region with Conflicts to Water Availability (Southeastern Brazil). Environ. Res. 2021, 202, 111756. [Google Scholar] [CrossRef] [Scilit]
- Kale, S. Impact of Drained and Un-Drained Soil Conditions on Water Table Depths, Soil Salinity and Crop Yields. Afr. J. Agric. Res. 2012, 7, 2935–2945. [Google Scholar] [CrossRef] [Scilit]
- Schoups, G.; Hopmans, J.W.; Young, C.A.; Vrugt, J.A.; Wallender, W.W.; Tanji, K.K.; Panday, S. Sustainability of Irrigated Agriculture in the San Joaquin Valley, California. Proc. Natl. Acad. Sci. USA 2005, 102, 15352–15356. [Google Scholar] [CrossRef] [Scilit] [PubMed]
- Christen, E.; Ayars, J.; Hornbuckle, J. Subsurface Drainage Design and Management in Irrigated Areas of Australia. Irrig. Sci. 2001, 21, 35–43. [Google Scholar] [CrossRef] [Scilit]
- El-Agha, D.E.; Molle, F.; Rap, E.; El Bialy, M.; El-Hassan, W.A. Drainage Water Salinity and Quality across Nested Scales in the Nile Delta of Egypt. Environ. Sci. Pollut. Res. 2020, 27, 32239–32250. [Google Scholar] [CrossRef] [Scilit] [PubMed]
- Abduljaleel, Y.; Awad, A.; Al-Ansari, N.; Salem, A.; Negm, A.; Gabr, M.E. Assessment of Subsurface Drainage Strategies Using DRAINMOD Model for Sustainable Agriculture: A Review. Sustainability 2023, 15, 1355. [Google Scholar] [CrossRef] [Scilit]
- Resende, R.S.; Amorim, J.R.A.; Cruz, M.A.S.; Meneses, T.N. Distribuição Espacial e Lixiviação Natural de Sais Em Solos Do Perímetro Irrigado Califórnia, Em Sergipe. Rev. Bras. De Eng. Agrícola E Ambient. 2014, 18, 46–52. [Google Scholar] [CrossRef] [Scilit]
- Al-Ali, Z.M.; Bannari, A.; Rhinane, H.; El-Battay, A.; Shahid, S.A.; Hameid, N. Validation and Comparison of Physical Models for Soil Salinity Mapping over an Arid Landscape Using Spectral Reflectance Measurements and Landsat-OLI Data. Remote Sens. 2021, 13, 494. [Google Scholar] [CrossRef] [Scilit]
- Nosetto, M.D.; Acosta, A.M.; Jayawickreme, D.H.; Ballesteros, S.I.; Jackson, R.B.; Jobbágy, E.G. Land-Use and Topography Shape Soil and Groundwater Salinity in Central Argentina. Agric. Water Manag. 2013, 129, 120–129. [Google Scholar] [CrossRef] [Scilit]
- Nordio, G.; Fagherazzi, S. Salinity Increases with Water Table Elevation at the Boundary between Salt Marsh and Forest. J. Hydrol. 2022, 608, 127576. [Google Scholar] [CrossRef] [Scilit]
- Combatt, E.; Narváez, H. Estimación de La Salinidad En Aguas Freáticas Del Área de Influencia de La Desembocadura Del Río Sinú-Córdoba, Colombia. Idesia 2015, 33, 55–63. [Google Scholar] [CrossRef] [Scilit]
- Pedrotti, A.; Chagas, R.M.; Ramos, V.C.; Prata, A.P.D.N.; Lucas, A.A.T.; Santos, P.B. dos Causas e Consequências Do Processo de Salinização Dos Solos. Rev. Eletrônica Em Gestão Educ. E Tecnol. Ambient. 2015, 19, 1308–1324. [Google Scholar]
- Gao, Y.; Chen, J.; Qian, H.; Wang, H.; Ren, W.; Qu, W. Hydrogeochemical Characteristics and Processes of Groundwater in an over 2260 Year Irrigation District: A Comparison between Irrigated and Nonirrigated Areas. J. Hydrol. 2022, 606, 127437. [Google Scholar] [CrossRef] [Scilit]
- Ministério da Integração e do Desenvolvimento Regional. Resolução Condel/Sudene No 176, 3 de Janeiro de 2024. Publicado Em 23 de Janeiro de 2024. Available online: https://share.google/hlR3DlnVZcJJaciLE (accessed on 12 March 2026).
- Oliveira Neto, M.B.; Cunha, T.J.F.; do Nascimento, A.F.; do Amaral, A.J.; Alves, E.D.S.; Marques, F.A.; Eudmar, D.A.S.A.; Marques, F.A. Relação Solo-Geoloogia Da Área de Estudo Do Projeto Fragissolos Em Petrolina/PE; SIDALC: San José, Costa Rica, 2013. [Google Scholar]
- Teixeira, P.C.; Donagemma, G.K.; Fontana, A.; Teixeira, W.G. Manual de Métodos de Análise de Solo; Embrapa: Brasília, Brazil, 2017. [Google Scholar]
- Batista, M.D.J.; Novaes, F.D.; Santos, D.G.D.; Suguino, H.H. Drenagem Como Instrumento de Dessalinização e Prevenção Da Salinização de Solos. Brasília CODEVAsF 2002, 2. [Google Scholar]
- Gheyi, H.R.; Dias, N.D.S.; Lacerda, C.F.D.; Gomes, E. Manejo Da Salinidade Na Agricultura Estudos Básicos e Aplicados; INCTSal: Fortaleza, Brazil, 2016. [Google Scholar]
- IBGE. Manual Técnico de Pedologia; IBGE Rio de Janeiro: Rio de Janeiro, Brazil, 2007; ISBN 978-85-240-4359-8. [Google Scholar]
- Amorim, V.B.D. Diagnóstico e Avaliação de Desempenho de Drenagem Subterrânea No Perímetro Irrigado de Bebedouro-PE; Federal University of Campina Grande: Paraíba, Brazil, 1995. [Google Scholar]
- Atofarati, S.O.; Ewulo, B.S.; Ojeniyi, S.O. Characterization and Classification of Soils on Two Toposequence at Ile-Oluji, Ondo State, Nigeria. Int. J. Agric. Sci. 2012, 2, 642–650. [Google Scholar]
- Tsubo, M.; Fukai, S.; Tuong, T.P.; Ouk, M. A Water Balance Model for Rainfed Lowland Rice Fields Emphasising Lateral Water Movement within a Toposequence. Ecol. Modell. 2007, 204, 503–515. [Google Scholar] [CrossRef] [Scilit]
- Oyebiyi, O.O.; Fagbohun, U.O.; Egbinola, O.A.; Ojetade, J.O.; Muda, S.A.; Adewumi, O.A. Evaluation of Soil Properties Variability along a Toposequence in Wasinmi, Southwest Nigeria. Agric. Trop. Et Subtrop. 2024, 57, 90–99. [Google Scholar] [CrossRef] [Scilit]
- Sales, J.L.; Costa, R.N.T.; Matias Filho, J.; Hernandez, F.F.F. Análise de Desempenho de Um Sistema de Drenagem Subterrânea Na Cultura Da Videira No Município de Jaguaruana-Ceará. Irriga 2004, 9, 166–180. [Google Scholar] [CrossRef] [Scilit]
- Baranian Kabir, E.; Bashari, H.; Bassiri, M.; Mosaddeghi, M.R. Effects of Land-Use/Cover Change on Soil Hydraulic Properties and Pore Characteristics in a Semi-Arid Region of Central Iran. Soil Tillage Res. 2020, 197, 104478. [Google Scholar] [CrossRef] [Scilit]
- Souza, L.S.; Paiva, A.Q.; Souza, L.D.; Cogo, N.P. Água No Solo Influenciada Pela Posição Na Paisagem, Em Uma Toposseqüência de Solos de Tabuleiro Do Estado Da Bahia. Rev. Bras. Cienc. Solo 2002, 26, 843–855. [Google Scholar] [CrossRef] [Scilit]
- Zhang, R.; Wu, J.; Yang, Y.; Peng, X.; Li, C.; Zhao, Q. A Method to Determine Optimum Ecological Groundwater Table Depth in Semi-Arid Areas. Ecol. Indic. 2022, 139, 108915. [Google Scholar] [CrossRef] [Scilit]
- Liu, G.; Wang, C.; Wang, X.; Huo, Z.; Liu, J. Growing Season Water and Salt Migration between Abandoned Lands and Adjacent Croplands in Arid and Semi-Arid Irrigation Areas in Shallow Water Table Environments. Agric. Water Manag. 2022, 274, 107968. [Google Scholar] [CrossRef] [Scilit]
- Elsamet, R.M.; Serag, A.; Abdel-Razek, M. The Influence of Tile Drainage Spacinf on Water-Table Fluctuation and Alfafa Crop Producion in the Northeast Nile Delta, Egypt. Menoufia J. Soil Sci. 2024, 8, 185–197. [Google Scholar] [CrossRef] [Scilit]
- Addab, H.; Bailey, R.T. Simulating the Effect of Subsurface Tile Drainage on Watershed Salinity Using SWAT. Agric. Water Manag. 2022, 262, 107431. [Google Scholar] [CrossRef] [Scilit]
- He, S.; Li, P.; Su, F.; Wang, D.; Ren, X. Identification and Apportionment of Shallow Groundwater Nitrate Pollution in Weining Plain, Northwest China, Using Hydrochemical Indices, Nitrate Stable Isotopes, and the New Bayesian Stable Isotope Mixing Model (MixSIAR). Environ. Pollut. 2022, 298, 118852. [Google Scholar] [CrossRef] [Scilit]
- Yan, J.; Chen, J.; Zhang, W. Impact of Land Use and Cover on Shallow Groundwater Quality in Songyuan City, China: A Multivariate Statistical Analysis. Environ. Pollut. 2022, 307, 119532. [Google Scholar] [CrossRef] [Scilit]
- de Andrade, E.M.; Aquino, D.D.N.; Luna, N.R.d.S.; Lopes, F.B.; Crisóstomo, L.d.A. Dinâmica Do Nível Freático e Da Salinização Das Águas Subterrâneas Em Áreas Irrigadas. Rev. Ceres 2016, 63, 621–630. [Google Scholar] [CrossRef] [Scilit]
- Zhang, Y.; Hou, K.; Qian, H.; Gao, Y.; Fang, Y.; Tang, S.; Xiao, S.; Ren, W.; Qu, W.; Zhang, Q. Natural-Human Driving Factors of Groundwater Salinization in a Long-Term Irrigation Area. Environ. Res. 2023, 220, 115178. [Google Scholar] [CrossRef] [Scilit]
- Gheyi, H.R.; Queiroz, J.E.; Medeiros, J.F. Manejo e Controle da Salinidade Na Agricultura Irrigada; UFPB/SBEA: Campina Grande, Brazil, 1997. [Google Scholar]
- Cabral, J.J.S.P.; Antonino, A.C.D.; Audry, P.; Silva, S.C.; Sampaio, E. Monitoramento da dinâmica da recarga do lençol freático numa área irrigada no Vale do São Francisco. Águas Subterrâneas 1998, Suplemento—Anais do X Congresso Brasileiro de Águas Subterrâneas. Available online: https://aguassubterraneas.abas.org/asubterraneas/article/view/22306 (accessed on 12 March 2026).
Disclaimer/Publisher’s Note: The statements, opinions and data contained in all publications are solely those of the individual author(s) and contributor(s) and not of MDPI and/or the editor(s). MDPI and/or the editor(s) disclaim responsibility for any injury to people or property resulting from any ideas, methods, instructions or products referred to in the content. |
© 2026 by the authors. Licensee MDPI, Basel, Switzerland. This article is an open access article distributed under the terms and conditions of the Creative Commons Attribution (CC BY) license.