


Abstract
This study investigated the influence of groundwater flux and temperature on denitrification in a steep coastal agricultural Island in western Japan. Push–pull tests (PPTs) were conducted at depths of 3 m, 15 m, and 30 m, during winter, spring, and summer to assess denitrification under varying hydrogeological and seasonal conditions. The 3 m layer is silty loam, 15 m is granitic weathered soil, and 30 m is granitic weathered rock, each with distinct hydraulic conductivities and fluxes. The objectives were to assess denitrification rates and fluxes, assess depth- and season-related variability, and determine the relative roles of hydraulic flux and temperature on denitrification. Denitrification was higher at shallow (3 m) and deep (30 m) boreholes during low-flux periods, while low at the intermediate depth (15 m) where fluxes were highest. Temperature variation had weak correlations compared to hydraulic flux, which showed a strong inverse correlation with denitrification. These findings demonstrate that residence time, controlled by groundwater flux, is the dominant factor influencing nitrate attenuation in this steep coastal aquifer. The PPTs results indicate that denitrification rates derived from PPTs decrease under higher hydraulic fluxes, as these conditions promote more oxic conditions. The study highlights the potential for natural denitrification to mitigate nitrate contamination during low-flux periods, providing insights for sustainable groundwater management in agricultural island environments.
1. Introduction
Groundwater contamination by nitrate (NO3−) is a global concern [1,2,3]. Excessive use of nitrogen fertilizers and poor waste management are the primary sources of nitrate pollution in groundwater [4,5]. Nitrate-contaminated groundwater adversely affects human health and the environment [6], contributing to harmful algal blooms, eutrophication, cancer, and methemoglobinemia [7,8,9]. To ensure the sustainable management of water resources, it is crucial to mitigate and remediate nitrate contamination in groundwater systems. To address this issue, it is necessary to understand the natural denitrification process, which is influenced by changing climatic conditions, land use, and topography [10].
Denitrification involves the sequential reduction of nitrate to nitrogen gas (N2) [11]. During denitrification, facultative bacteria use nitrate as an energy source in low-oxygen environments [12]. Denitrification can be either autotrophic or heterotrophic, depending on the availability of the electron donor [13,14]. Heterotrophic denitrification occurs with organic carbon as the electron donor, whereas autotrophic denitrification occurs with reduced inorganic compounds, such as sulfide or ferrous iron, as the electron donor [13,15]. Various factors, including nitrate concentration, dissolved oxygen (DO), oxidation-reduction potential (ORP), temperature, denitrifying bacteria, and groundwater flow conditions influence the denitrification process [13,15,16]. The effectiveness of denitrification depends on the duration of contact between nitrate-rich water and reactive substrates [16]. Groundwater flow conditions (water level, hydraulic conductivity, flow direction, and hydraulic flux) control the solute transport rate and residence time, thereby influencing the extent of denitrification [17,18,19,20]. In environments with slow water flow, such as wetlands and floodplains, longer contact durations enhance nitrate reduction and denitrification [11,17,21,22]. In steep catchments, denitrification is typically limited because water passes rapidly through the reactive zone [18,21,23]. However, even in environments with rapid water flow, there may be localized zones (specific depths, hydraulic flux, low water levels, or dry seasons) that favor denitrification [24,25,26,27]. Understanding denitrification dynamics in such areas is essential for predicting the transport and fate of nitrate, particularly in coastal agricultural regions [28,29,30]. However, the influence of hydraulic flux on groundwater denitrification across different depths and seasons in steep coastal catchments is poorly understood.
Push–pull tests (PPTs) have been extensively used in denitrification studies [31,32,33,34,35]. PPTs involve injecting a known tracer solution into a monitoring well and then extracting the tracer solution from the groundwater of the same well, which allows for the direct estimation of denitrification rates and fluxes [31]. PPTs have been used to estimate denitrification reaction rates and coefficients [34]. PPTs have been conducted in situ across various fields, engineered laboratory settings, and reactive transport modeling to better understand denitrification dynamics [31,34,35,36]. However, few studies have used PPTs to assess the effects of hydraulic flux and temperature on denitrification at different depths and during different seasons in steep coastal agricultural aquifers.
This study aimed to assess the effect of groundwater flux on natural denitrification in a steep coastal agricultural catchment in Ikuchijima Island, Japan, using PPTs. The specific objectives were to (1) assess long-term variability, homogeneity, and temporal stability of air temperature and precipitation data (1994 to 2024) for Ikuchijima using Rescaled adjusted Partial Sums (RAPS), and Innovative Trend Analysis (ITA), and to determine whether the experimental periods represent typical climatic conditions (2) evaluate the denitrification potential at three different depths (3 m, 15 m, and 30 m) and three seasons (winter, spring, and summer) based on the temporal variation of NO3−-N and Cl− concentrations, and the residual ratio (RR), (3) estimate denitrification rates and fluxes by comparing measured NO3−-N concentrations from PPTs with NO3−-N concentration estimated assuming dilution only (based on conservative tracer (Cl−) behavior during PPTs), and (4) assess the influence of hydraulic flux and temperature on denitrification under varying hydrogeological and seasonal conditions.
2. Materials and Methods
2.1. Study Area
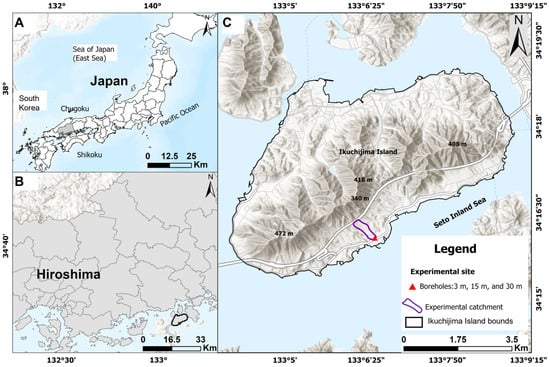
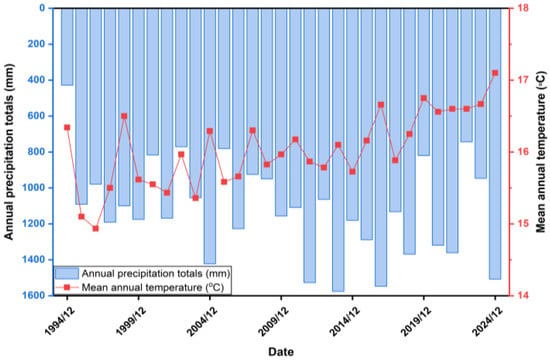
The study area is located on Ikuchijima Island in Hiroshima Prefecture, western Japan, covering approximately 31.2 km2 of land area [37] (Figure 1).
Figure 1.
Location of the study area on Ikuchijima Island, Japan. (A) shows the national geographic setting of Japan, showing the location of Ikuchijima Island, (B) illustrates the regional location within Hiroshima Prefecture, and (C) displays local elevation, borehole installation sites (3, 15, and 30 m depths), and the experimental catchment boundary (purple). Basemap source: Esri “Relief Map with Labels,” modified via ArcGIS Pro 3.6.0.
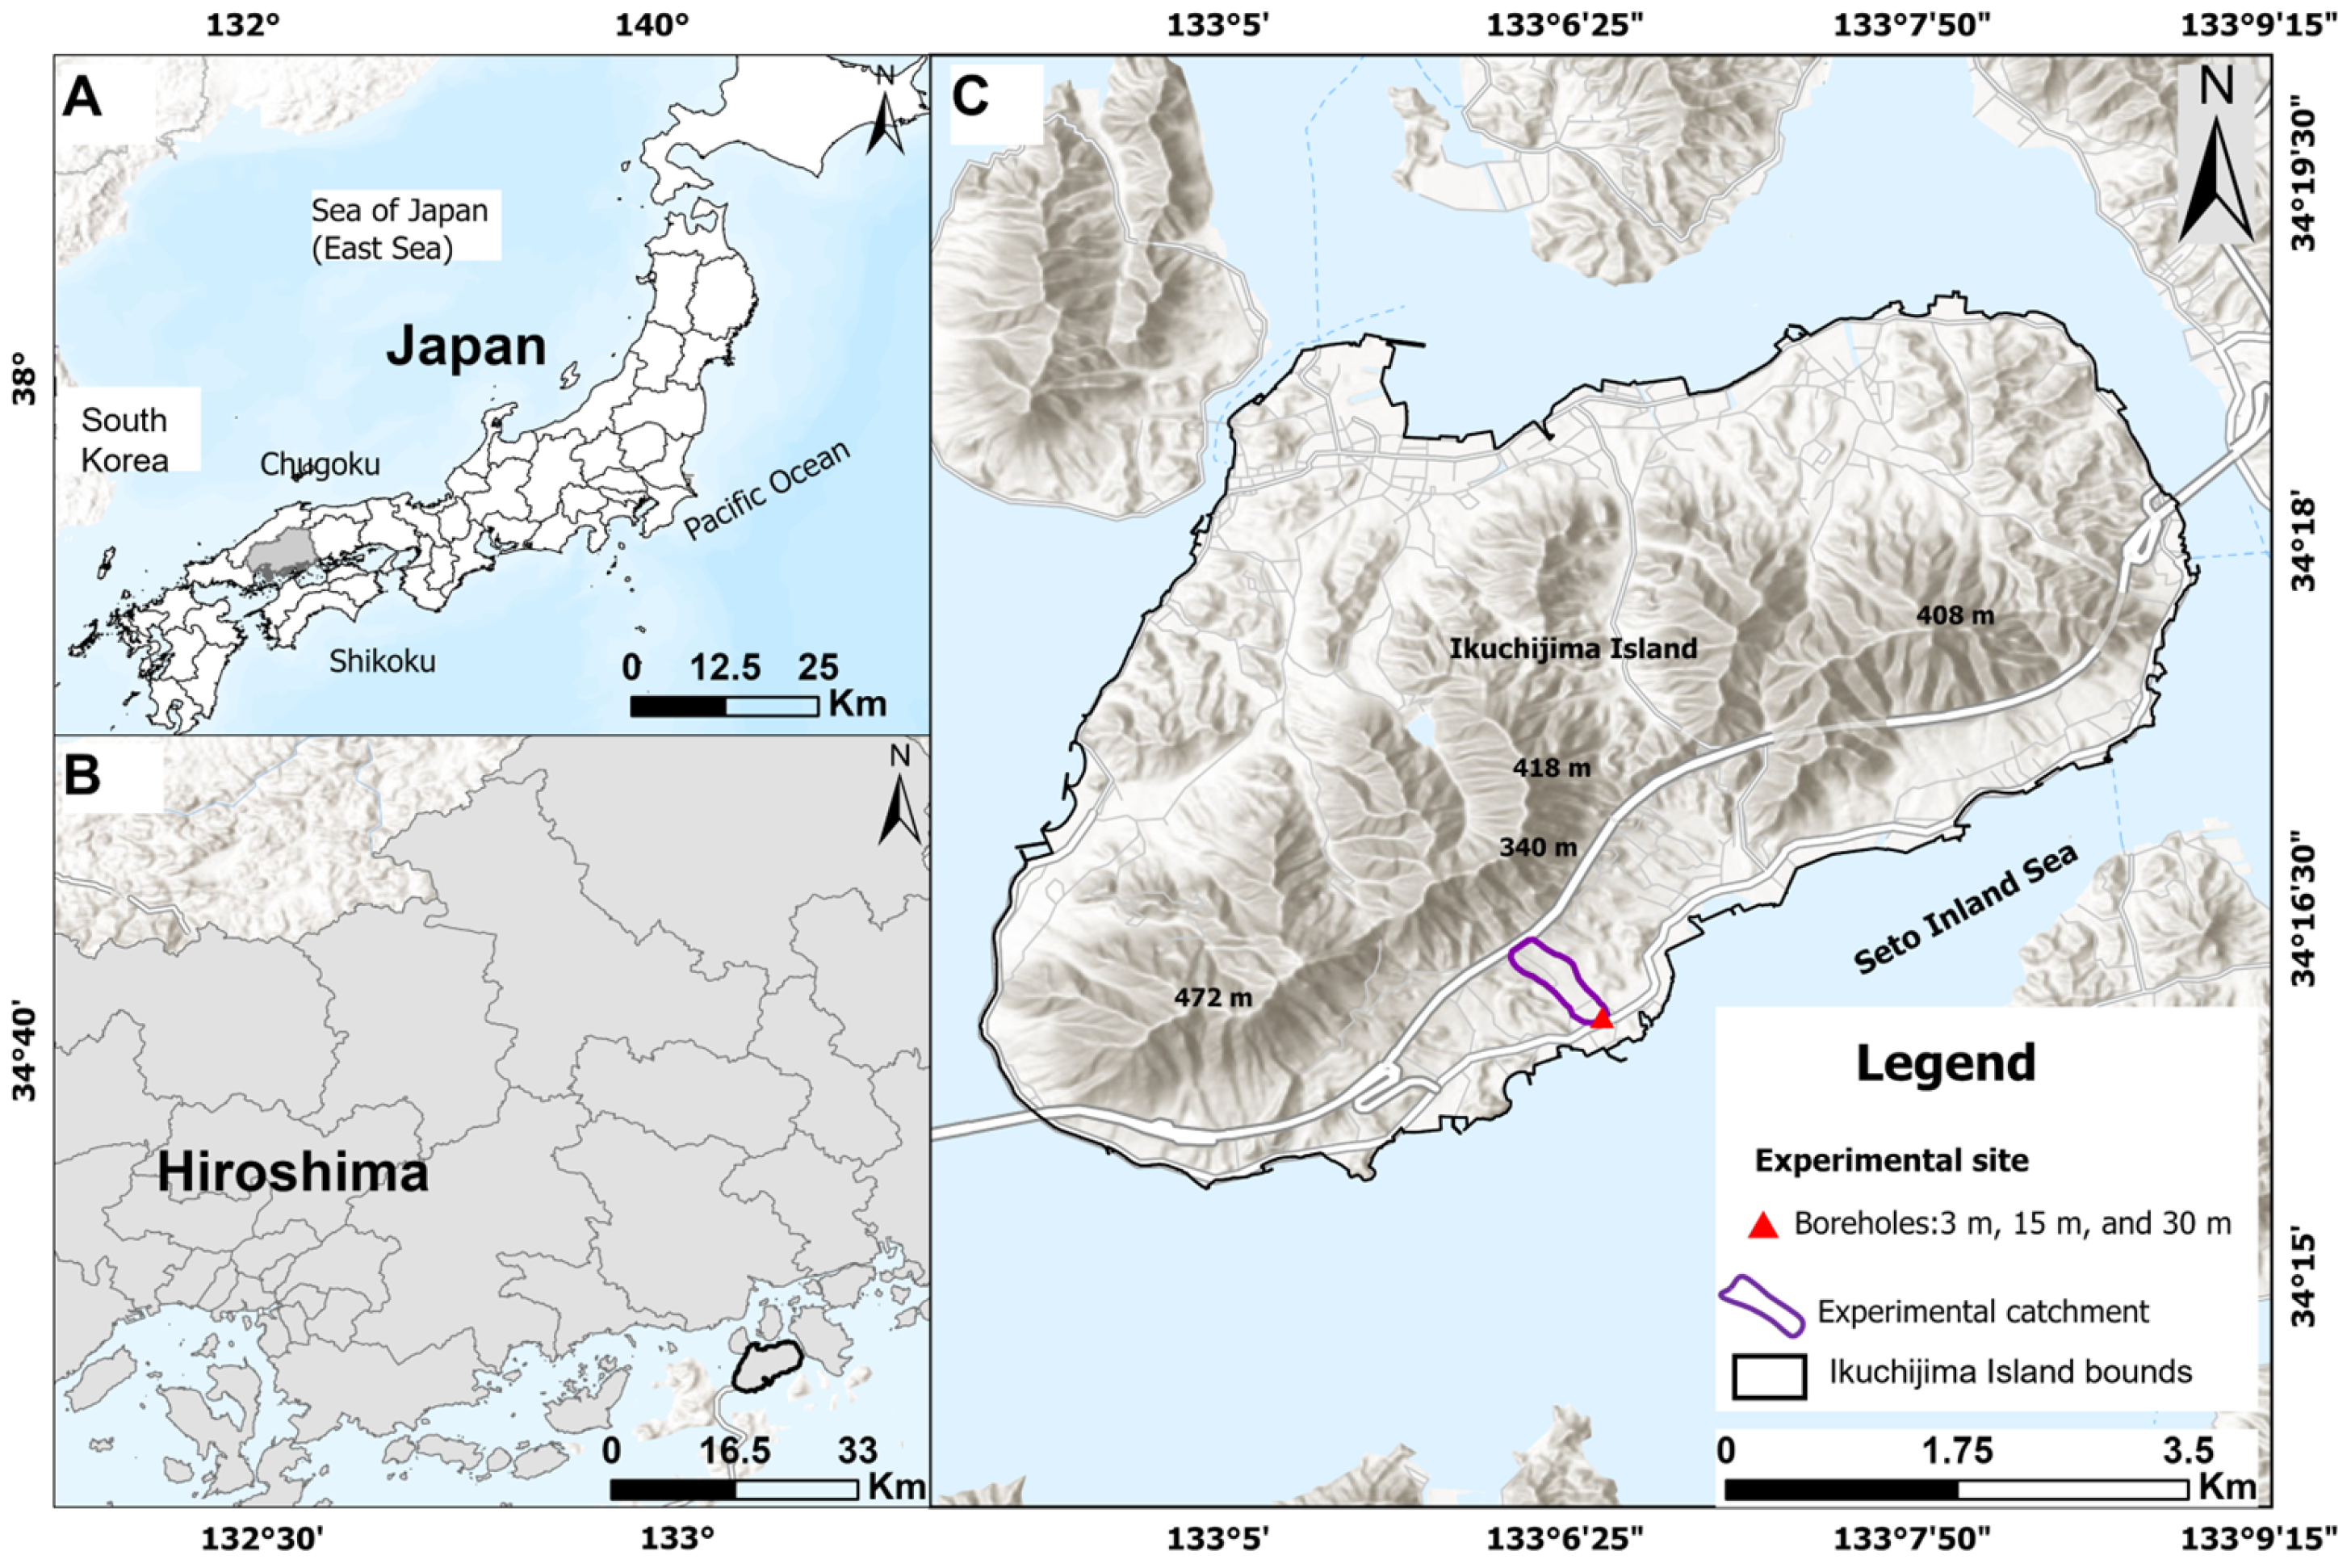
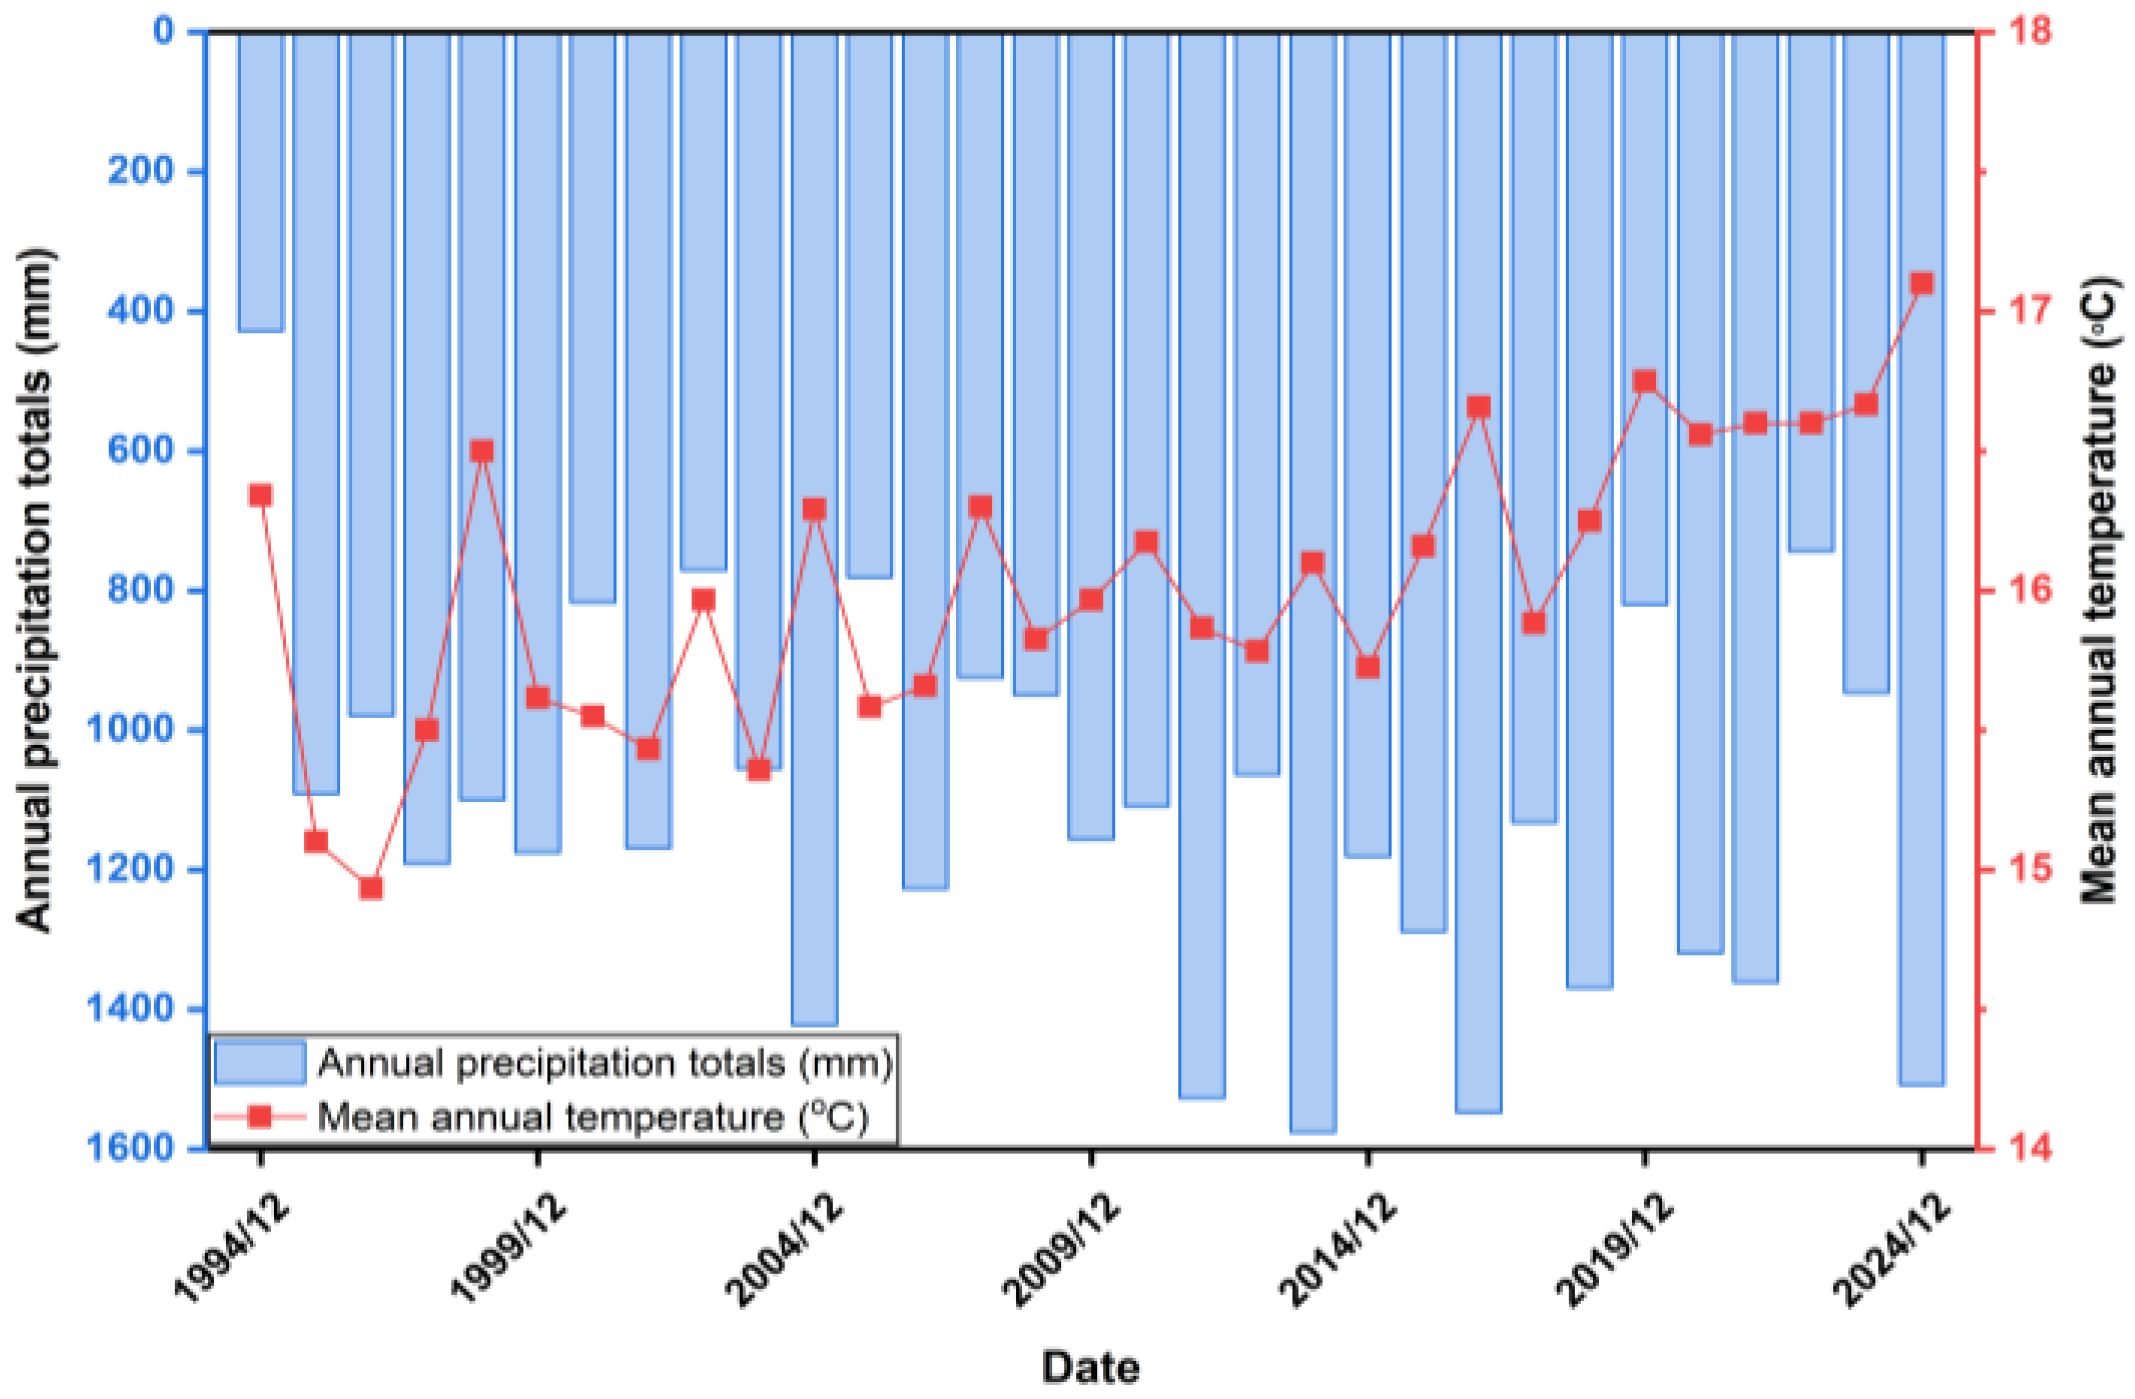
Ikuchijima, located in the Seto Inland Sea, is known for its rugged mountainous landscape [29]. The geological composition of Ikuchijima includes granite and materials formed by weathering [26]. Ikuchijima experiences a temperate marine climate, with an average annual rainfall of 1120 mm (Figure 2) and an average annual temperature of 16.0 °C (1994–2024 average), modified from [38].
Figure 2.
Annual precipitation totals and mean air temperature and precipitation at Ikuchijima Island, Japan, for the 1994–2024 period. Blue bars represent annual precipitation totals (mm), and the red line with symbols represents mean annual temperature (°C). Adapted from [38].
Agricultural activities account for 22% of the total land area of Ikuchijima [39]. Approximately 2400 kg ha−1 year−1 of fertilizer is applied on this Island, leading to nitrate contamination in the groundwater [29]. NO3−-N concentrations decrease downslope, with the lowest levels observed downstream [28,40]. A study examining the spatial distribution of groundwater and nutrient discharge across the island showed that NO3−-N concentrations at locations with high groundwater flux were 30 times higher than those at locations with lower groundwater flux [41]. In a relatively small Darcy flux, significant NO3−-N attenuation occurred in the catchment [26,29]. Denitrification across the entire Island occurred under low-flow conditions [29]. Bicarbonate (HCO3−) ions and dissolved organic carbon (DOC) were used to evaluate denitrification, and it was found that denitrification occurred by organic carbon as an electron donor [29]. Evidence from NO3−-N and δ15N confirmed that denitrification occurs in the coastal groundwater [42]. In situ experiments at the Ikuchijima site further validated this process at depths of 3 m and 30 m, although high groundwater velocity inhibited detectable denitrification at 15 m [42].
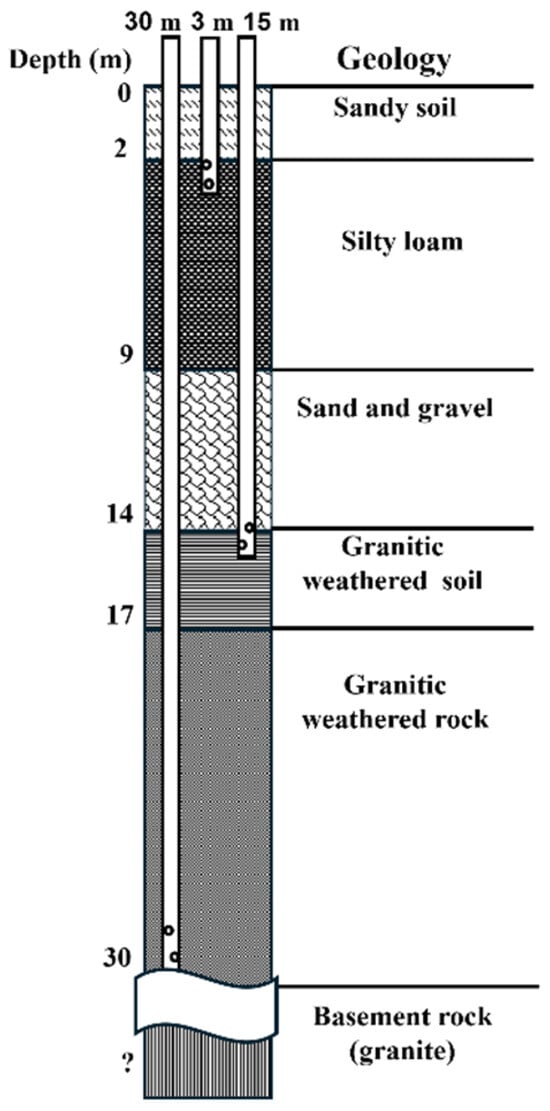
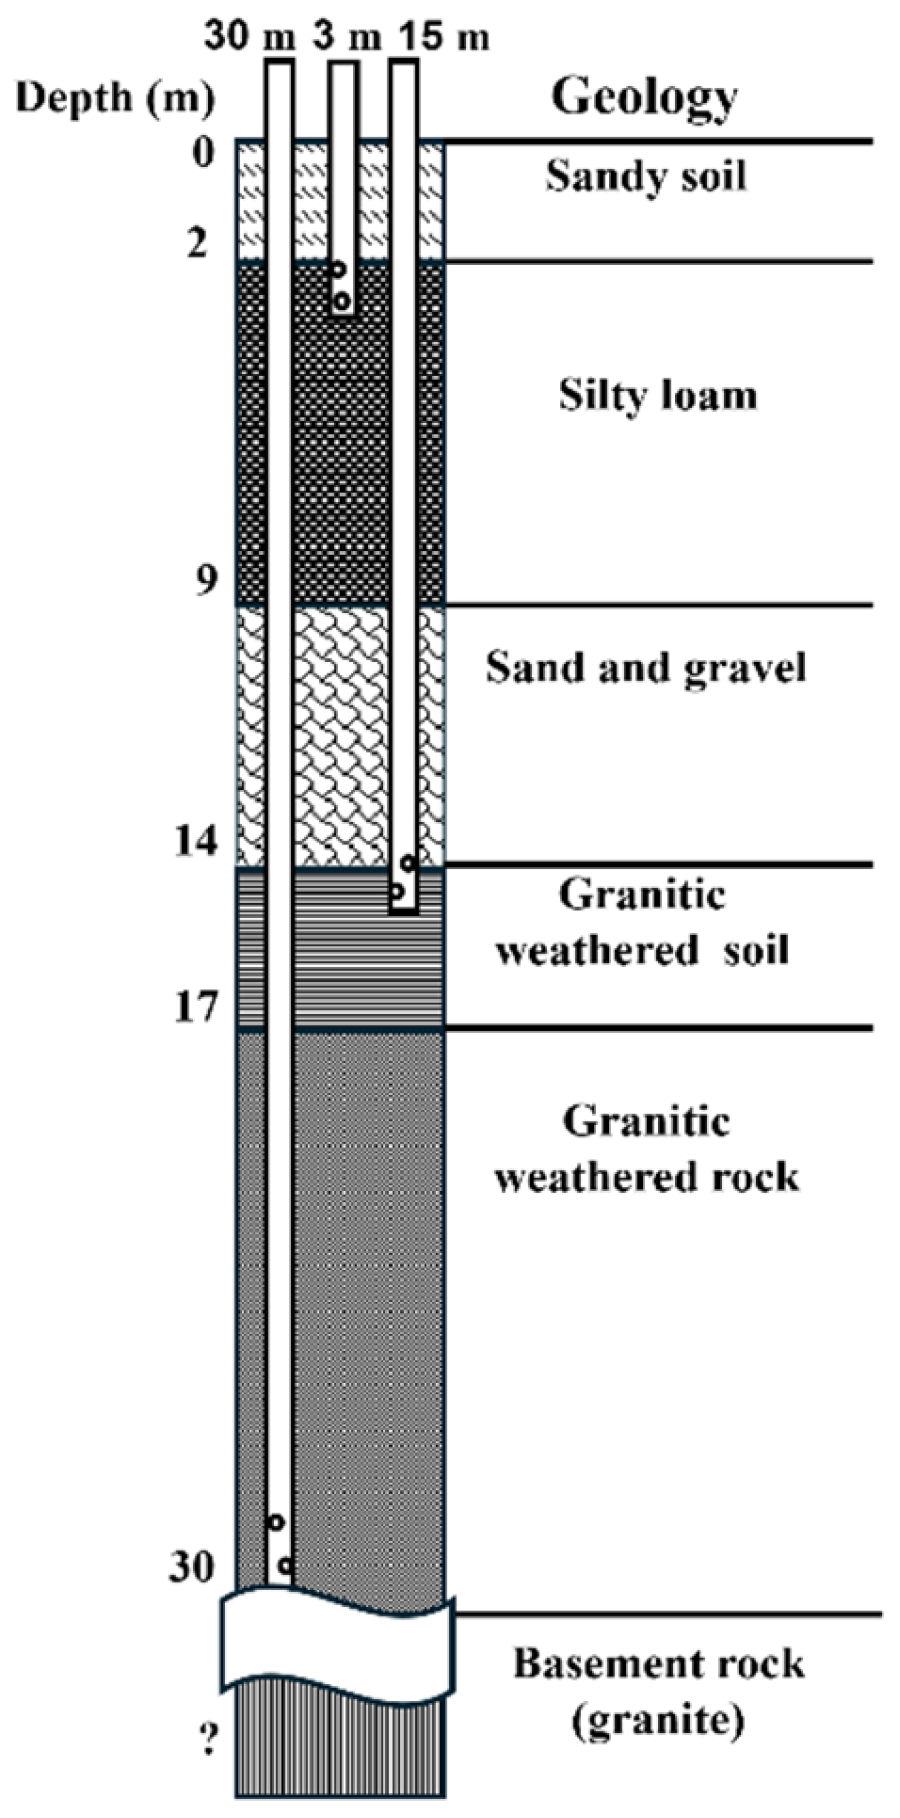
The observation boreholes were located downstream in the denitrification zone in the southeastern part of Ikuchijima Island, approximately 200 m from the Seto Inland Sea coastline (Figure 1). The elevation of the site is approximately 2.7 m [37]. The aquifer comprises five geological strata (Figure 3).
Figure 3.
Subsurface geological profile of the experimental sites with boreholes 3 m, 15 m, and 30 m deep [26]. The vertical profile indicates the depth below the ground surface. The sub-surface layers include sandy soil, silty loam, sand and gravel, granitic weathered soil, and granitic weathered rock.
The subsurface layers consisted of sandy soil from 0 to 2 m deep, silty loam between 2 and 9 m, sand and gravel from 9 to 14 m, granitic weathered soil spanning 14 to 17 m, granitic weathered rock from 17 to 30 m, and basement rock at depths exceeding 40 m (modified from [26]). Three boreholes were used in this study, each constructed from PVC pipes with depths of 3, 15, and 30 m (below ground level, bgl), representing distinct groundwater flow zones (Figure 3). The average hydraulic conductivities estimated from permeability tests were 1.7 × 10⁻⁴, 6.6 × 10⁻³, and 7.5 × 10⁻⁴ cm s−1, for the 3 m, 15 m, and 30 m deep boreholes, respectively [43]. These boreholes had an internal diameter of 5 cm and included a slotted screen positioned 1 m from the bottom of each borehole.
The background characteristics of groundwater measured before the PPTs at the three boreholes (3, 15, and 30 m deep) at the study site in winter, spring, and summer are shown in Table 1.
Table 1.
Background characteristics of groundwater from the experimental site on Ikuchijima Island, Western Japan.
Seasonal and depth-related differences in background groundwater were observed at the study site (Table 1). ORP, DO, and pH were not measured in winter. Generally, groundwater quality varied seasonally. The water depth ranged from 0.6 to 1.4 m bgl. Water levels were typically higher in the 15 m borehole and lowest in the 30 m borehole. The water level at a shallow depth (3 m) was lowest in summer, whereas in the deeper boreholes (15 and 30 m), it was lowest in winter. The hydraulic heads ranged from 1.3 to 2.1 m (amsl), highest at 15 m, and lowest at 30 m, like the water levels. DO was the lowest at 3 m and the highest at 15 m in all seasons. The NO3−-N concentration ranged from 1.2 mgL−1 to 13.8 mg L−1. In general, the background NO3−-N concentrations were lower at a depth of 3 m (1.2–3.7 mg L−1) and higher in the deeper boreholes, 15 m (6.6–13.8 mg L−1), and 30 m deep boreholes (4.5–12.4 mg L−1). Seasonally, the NO3−-N and Cl− ion concentrations in the background groundwater increased from winter to spring to summer.
2.2. Groundwater Sampling
In December 2023 (winter), March 2024 (spring), and August 2024 (summer), groundwater was sampled from three observation boreholes at depths of 3, 15, and 30 m. Daily precipitation and air temperature during the experiment period are shown in the Supplementary Material Figure S1. The water levels in these boreholes were measured using a water-level gauge. Prior to collecting samples, stagnant groundwater, equivalent to 1.5 times the borehole depth, was extracted using a baler (Daiki Rika Kogyo, Kounosu, Japan), and the groundwater was allowed to recover. Electrical conductivity (EC), DO, ORP, pH, and groundwater temperatures were measured using a portable water quality meter (except in winter). The field ORP (mV) were converted to ORPS.HE (mV). Background groundwater samples were collected a day before the PPTs from the three boreholes at depths of 3, 15, and 30 m. These samples were collected using a baler from the screen depths of each borehole and stored in 250 mL high-density polyethylene bottles. An extra 250 mL of groundwater was collected from each borehole to be used as a flushing solution for the PPTs.
During the PPTs, samples were collected approximately 0.3 m from the bottom of each screen depth using a syringe and a 2 mm internal diameter polyvinyl tube inserted into each borehole before starting the test. In winter, samples were collected hourly for the first 12 h, with a final sampling after 24 h. In spring, sampling was conducted hourly for the first six hours, every two hours for the next six hours, and the final sample was collected 24 h after the tracer injection. In summer, samples were collected hourly for the first four hours, every two hours for the next eight hours, and the final sample was collected after 24 h. The samples were filtered on-site using a membrane filter with a pore size of 0.2 µm (Advantec Toyo Corporation, Tokyo, Japan) and collected into 10 mL spitz tubes (AS ONE Corporation, Osaka, Japan). These filtered samples were then placed in ice bags and refrigerators before being transported to the laboratory, where they were stored at −4 °C until chemical analysis.
2.3. PPTs Design and Borehole Monitoring
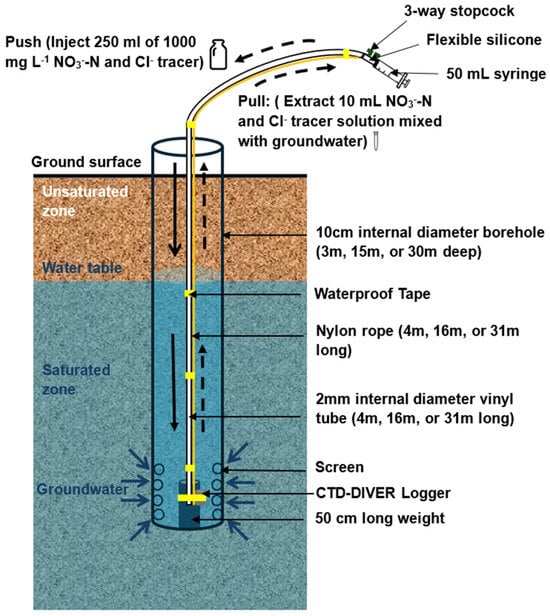
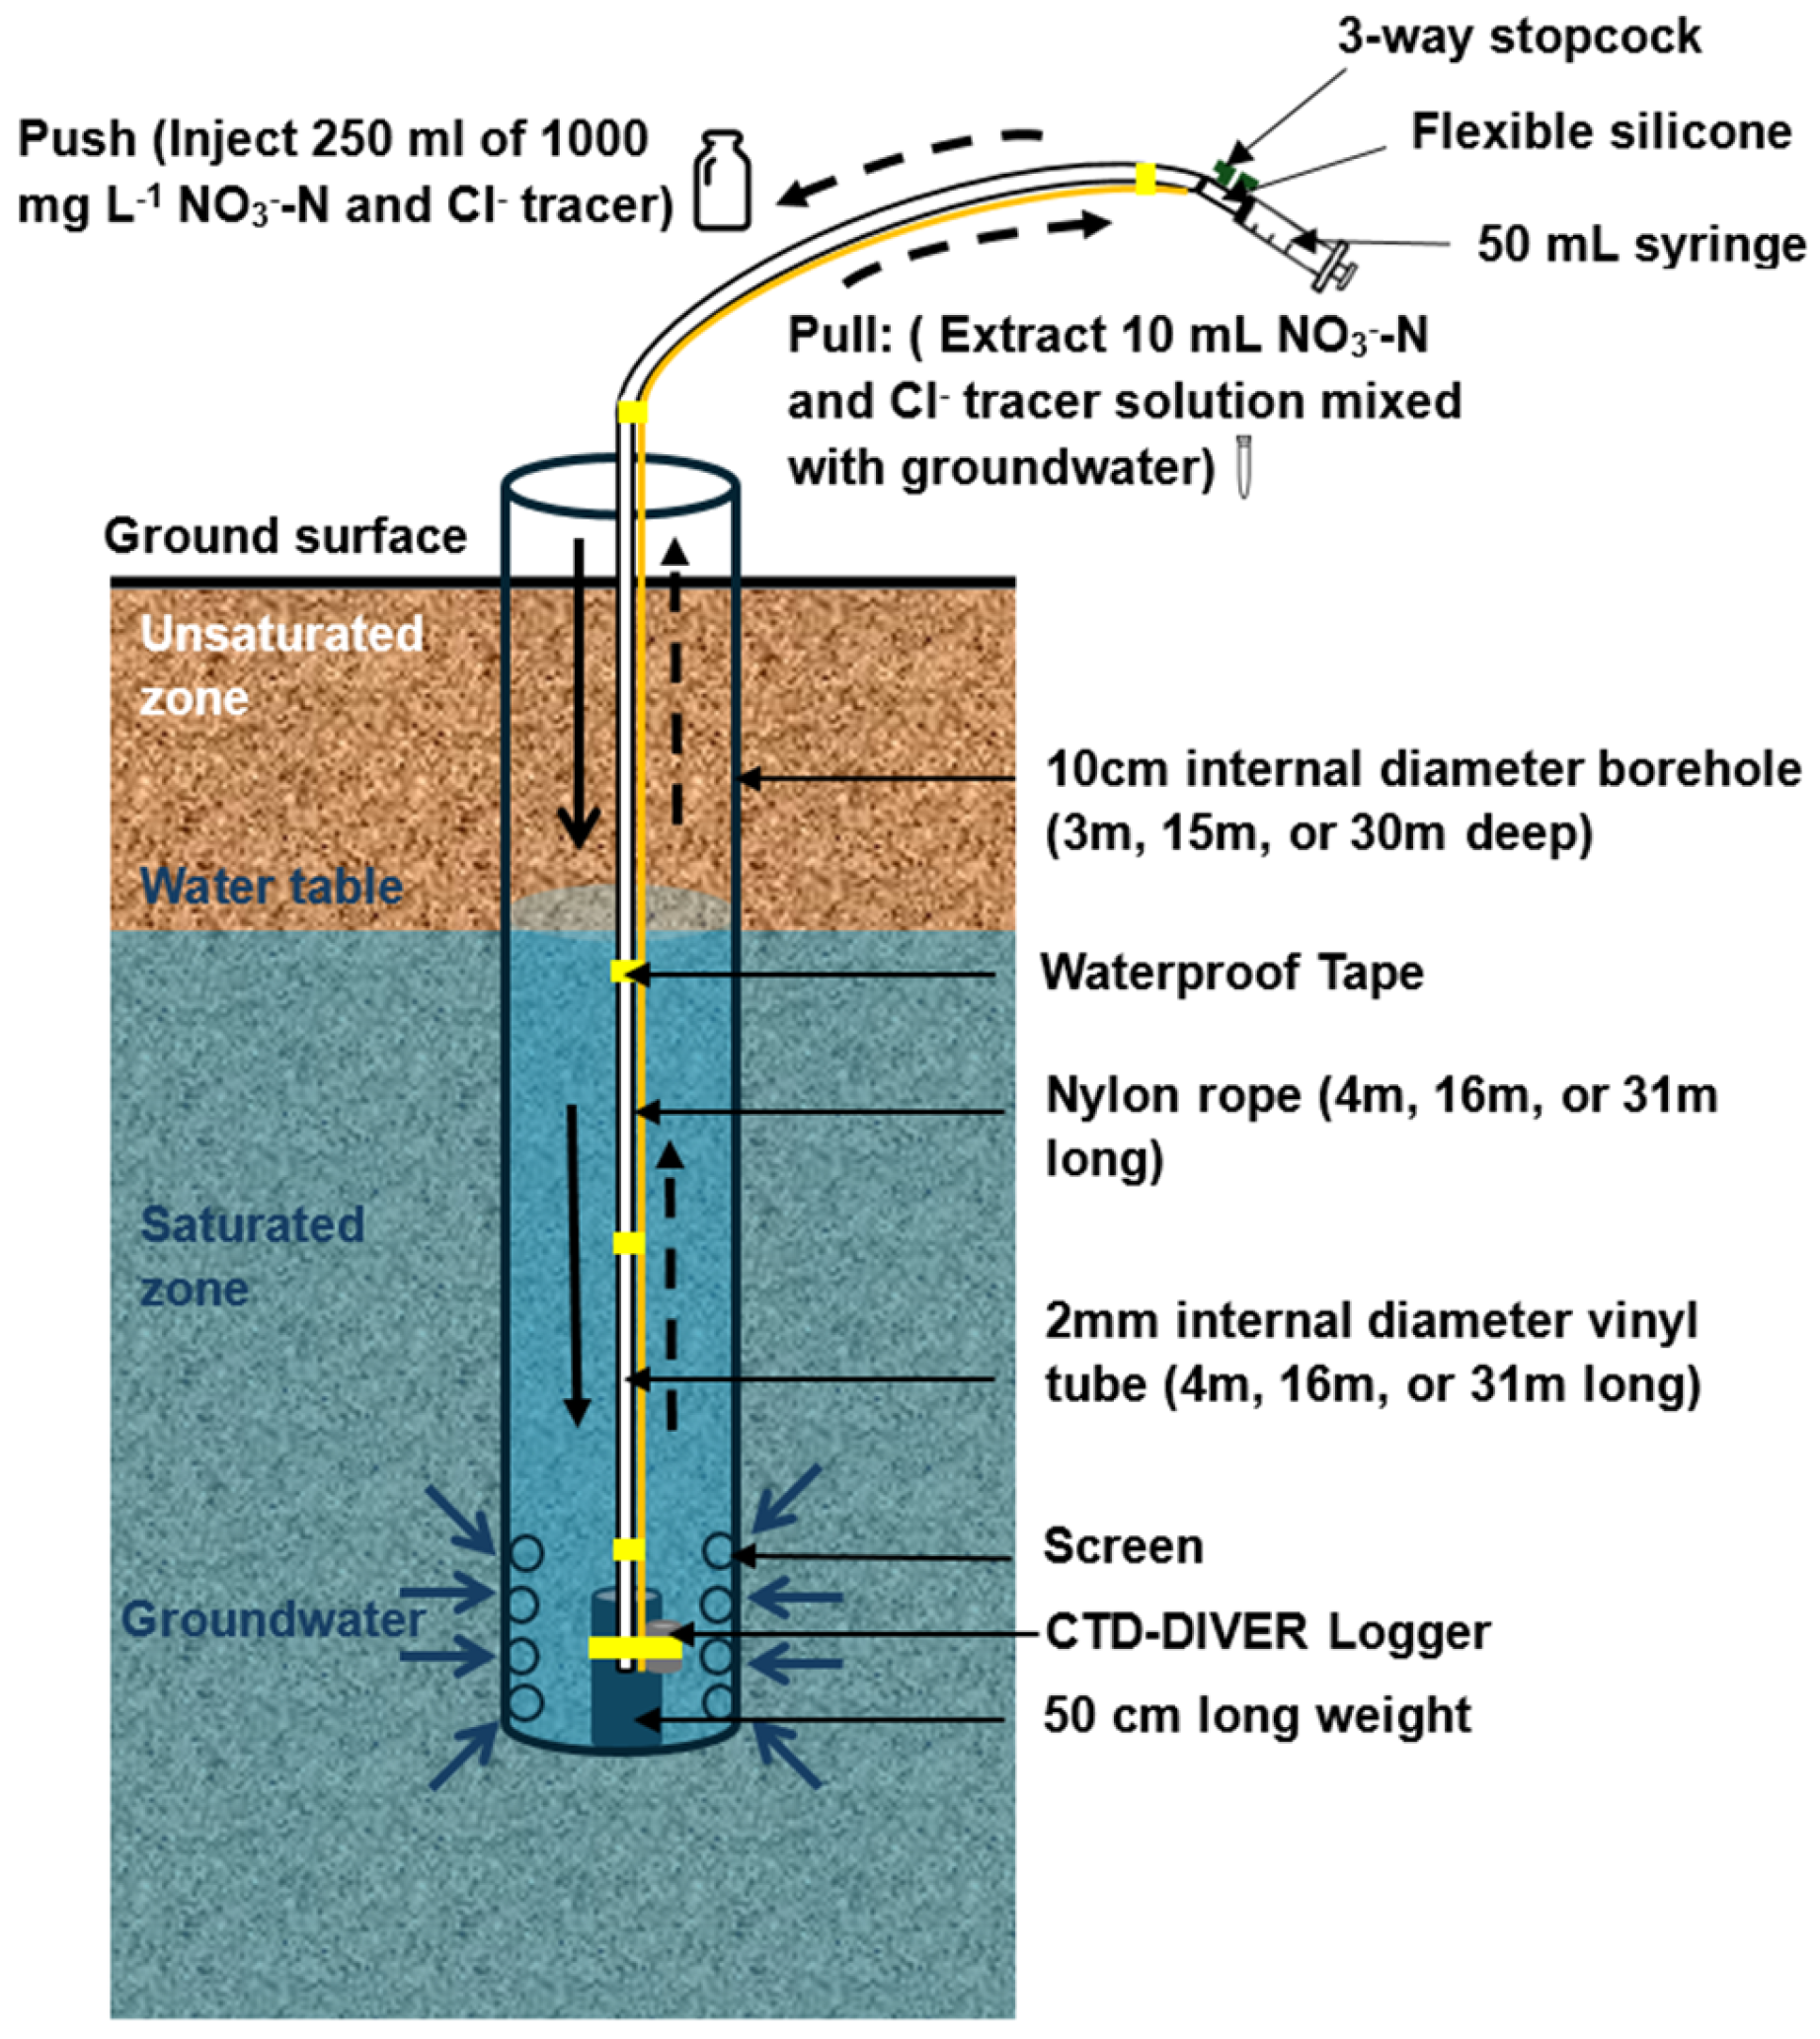
The denitrification rates in the coastal groundwater of a steep agricultural catchment were investigated using PPTs [26,31,33,34,35]. PPTs (Figure 4) were performed in December 2023 (winter), March 2024 (spring), and August 2024 (summer).
Figure 4.
Generalized schematic diagram of the push–pull test in each borehole (not drawn to scale).
Boreholes at depths of 3, 15, and 30 m at a site located Southeast of Ikuchijima, 200 m from the Seto Inland Sea, were used for the study. Before starting the PPTs and during sample collection, stagnant groundwater (10 mL, 50 mL, and 100 mL) in the vinyl tube corresponding to the tube length used for each borehole (3, 15, and 30 m, respectively) was extracted using a syringe. An identical volume was extracted from the vinyl tube before collecting samples.
In each PPT, a 250 mL solution containing NO3−-N (KNO3) and Cl− (KCl), 1000 mg L−1 each, was introduced approximately 0.8 m from the bottom of each screen depth using a vinyl tube with a 2 mm internal diameter and a 50 mL syringe.
Notably, during winter, some of the tracer solution was lost during the injection process in the 30 m-deep borehole. The duration from tracer injection to sample collection was less than 30 min. Subsequently, 250 mL of previously collected groundwater from each borehole was injected using a syringe to push the tracer from the vinyl tube into the aquifer. This was followed by collecting approximately 10 mL of the tracer mixed with groundwater from the boreholes within 24 h, using the same polyvinyl tube and syringe. A CTD logger (Diver CTD, Van Essen Instruments, Delft, The Netherlands) positioned similarly to each sampling tube was used to monitor groundwater EC, temperature, and water level changes during the PPTs every 10 min. The water levels were converted into hydraulic heads, and these values were used to estimate the hydraulic fluxes at each depth for each season relative to the coastline.
2.4. Chemical Analysis
The major ion (NO3−, Cl−) concentrations in the filtered samples were analyzed using ion chromatography (Shimadzu Corporation, Kyoto, Japan).
2.5. Estimation of Denitrification Rates and Fluxes
Residual ratio (RR) expressed as a percentage were used to quantify variations in NO3−-N and Cl− tracer concentrations in the samples and to estimate denitrification potential. It was presumed that the peak concentration would reach 100%. The Cl− ion served as a conservative tracer, with its changes attributed to processes such as advection, dispersion, and mixing. Conversely, NO3−-N functioned as a reactive tracer, with its reduction associated with nitrate attenuation via denitrification. The RR of the groundwater samples was calculated by subtracting their background concentrations from those in the collected sample and dividing by the difference between the maximum tracer concentration in the groundwater and the background concentration, then expressing this as a percentage (1).
The hydraulic flux, which represents groundwater flow velocity, was evaluated using Equation (2) derived from Darcy’s law [44,45].
where q is the hydraulic flux (cm s−1); K is the hydraulic conductivity (cm s−1); is the hydraulic gradient, di is the change in the hydraulic head (m, amsl), and dz is the distance between the observation wells and the coastline (m). In this study, dz was 200 m.
Estimated NO3−-N concentration assuming dilution only was obtained from the conservative tracer (Cl−) concentrations using Equation (3)
where is the Cl− ion concentration at any time during the PPTs, is the background Cl− ion concentration, and , is the Cl− ion concentration of the injected tracer (1000 mg L−1), and is the NO3−-N concentration of the injected tracer (1000 mg L−1).
The denitrification rate (mg N L−1 day−1) was estimated as the difference between the estimated nitrate concentration assuming dilution only (, mg L−1) and measured nitrate concentration from the PPTs (, mg L−1), divided by the experimental time ( (4).
The denitrification rate was converted from mg N L−1 day−1 to mol N L−1 h−1 by dividing by the molar mass of nitrogen (14 g mol−1), and by 24 h day−1. The nitrate removal rate (mol N h−1) was obtained by multiplying the denitrification rate (mol N L−1 h−1) by the hydraulic flux per unit area (m2).
2.6. Statistical Analysis and Software
Statistical analyses and correlation plots were conducted using OriginPro 2024 (OriginLab Corporation, Northampton, MA, USA). Pearson correlation matrices were generated to evaluate relationships among denitrification rates and flux, hydraulic flux, hydraulic conductivity, temperature, and groundwater chemistry. The same software was used to produce temporal variation plots.
The study area map was produced using ArcGIS Pro version 3.6.0 (Esri, Redlands, CA, USA). The Esri “Relief Map with Labels” basemap was used and modified to enhance the visualization of site features and topography.
2.7. Precipitation and Temperature Time-Series Analysis
Monthly precipitation totals and mean monthly air temperature data were downloaded from the Japan Meteorological Agency for the 1994–2024 period. Annual precipitation totals and annual mean air temperatures were calculated by summing monthly data. These data were analyzed to assess whether the experimental period represents typical climatic conditions and to identify long-term variability relevant to the denitrification experiments. Rescaled Adjusted Partial Sums (RAPS) Analysis was applied to temperature and precipitation data to gain insight into fluctuations in these parameters during the study period. The RAPS technique works by creating a cumulative series of deviations calculated from the initial continuous dataset. Plotting cumulative RAPS deviations provides a visual means of detecting variations and trends in the time series [46]. The RAPS statistics are computed using the following formula:
where represents the individual data point at time t, is the mean of the time series, represents the standard deviation, and k indicates the total number of observations. The sum is computed iteratively from t = 1 to k.
The Innovative Trend Analysis (ITA) method was applied to examine trends in precipitation and temperature over Ikuchijima Island, Japan, from 1994 to 2024. The method compares sorted subseries of equal length and identifies increasing, decreasing, or trendless behavior [47]. In this study, the time series of temperature and precipitation were each divided separately into two halves and then sorted in ascending order. A plot of the first sorted half was made against the second sorted half. A straight line was fitted to the minimum and maximum values of the precipitation and temperature data in the first and second halves, independently. Points on the 1:1 line represent no trend, while points above the line indicate an upward trend and points below the line indicate a downward trend [48].
3. Results and Discussion
3.1. Precipitation and Air Temperature Time-Series Analysis (1994–2024)
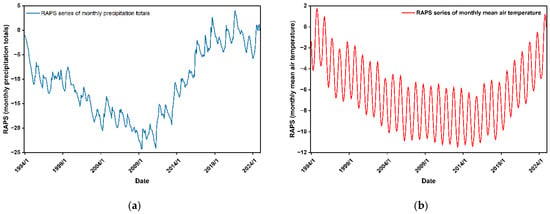
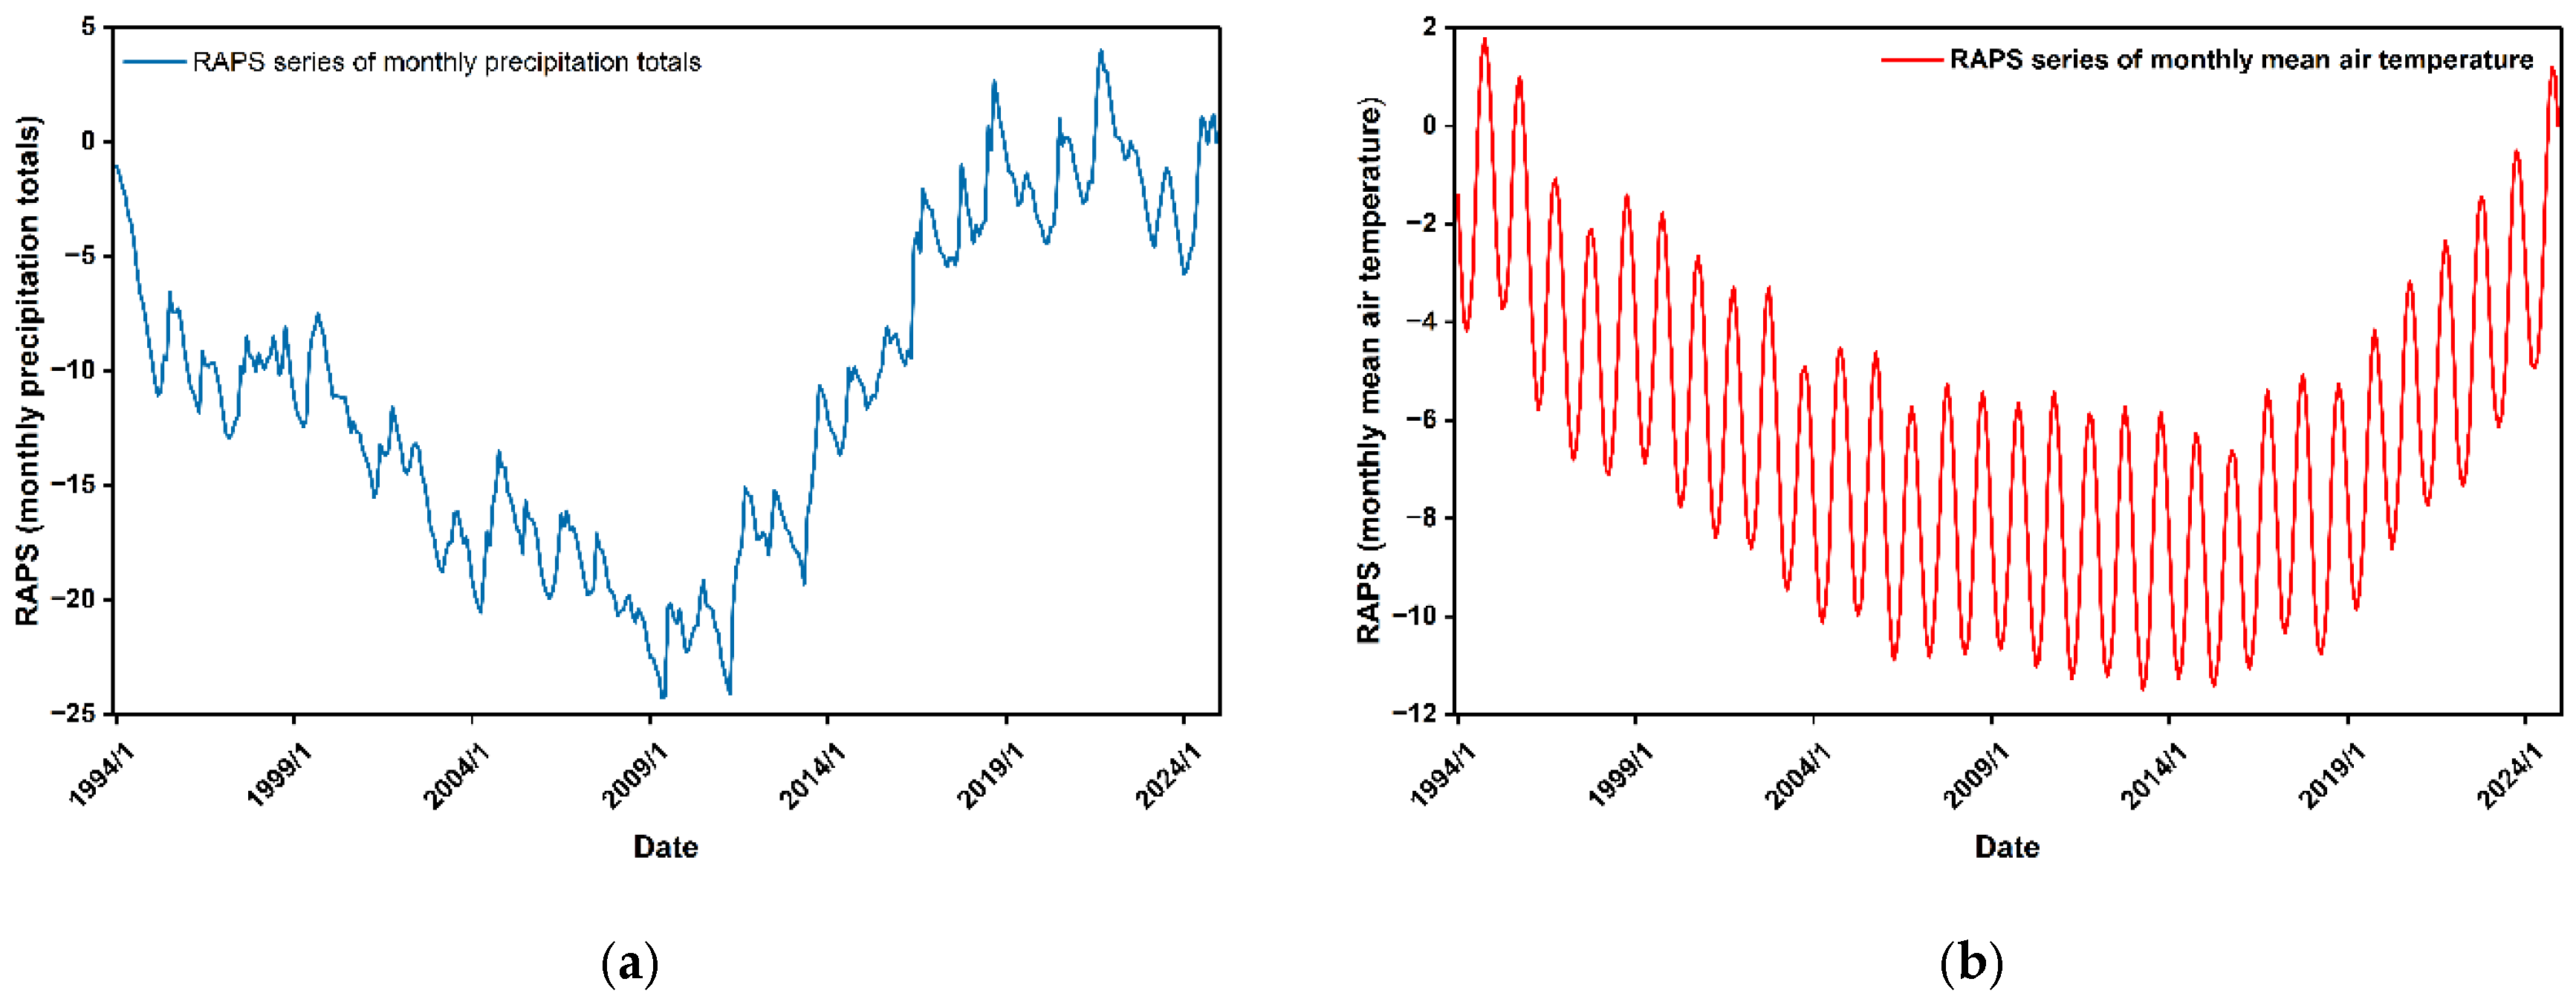
The monthly mean precipitation during the study period was 93.35 mm, and the average annual temperature was 16.02 °C (1994–2024 average). RAPS analysis was applied to understand the trend in the monthly precipitation totals, and the mean air temperature is presented in Figure 5.
Figure 5.
Rescaled adjusted partial sums (RAPS) of monthly (a) precipitation totals; and (b) mean air temperature, at Ikuchijima Island, Japan, from 1994 to 2024.
The RAPS series of precipitation shows a decreasing trend in precipitation from 1994 to 2011 (Figure 5). However, precipitation increased from 2012 to 2024. No drastic changes were observed in precipitation variability, suggesting that the precipitation record is not dominated by isolated extreme years. Therefore, the period analyzed was a typical year with respect to precipitation. The mean monthly air temperature RAPS series (Figure 5) shows a decline from 1994 to about 2007, a period of stability thereafter, and an upward trend since 2016. This behavior is consistent with gradual warming superimposed on substantial seasonal variability. The temperature fluctuations are continuous and systematic, indicating stable measurement conditions over the study period.
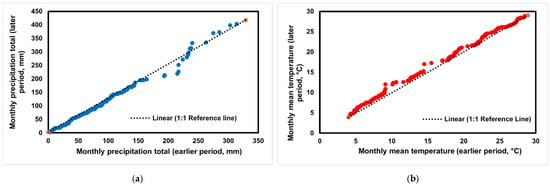
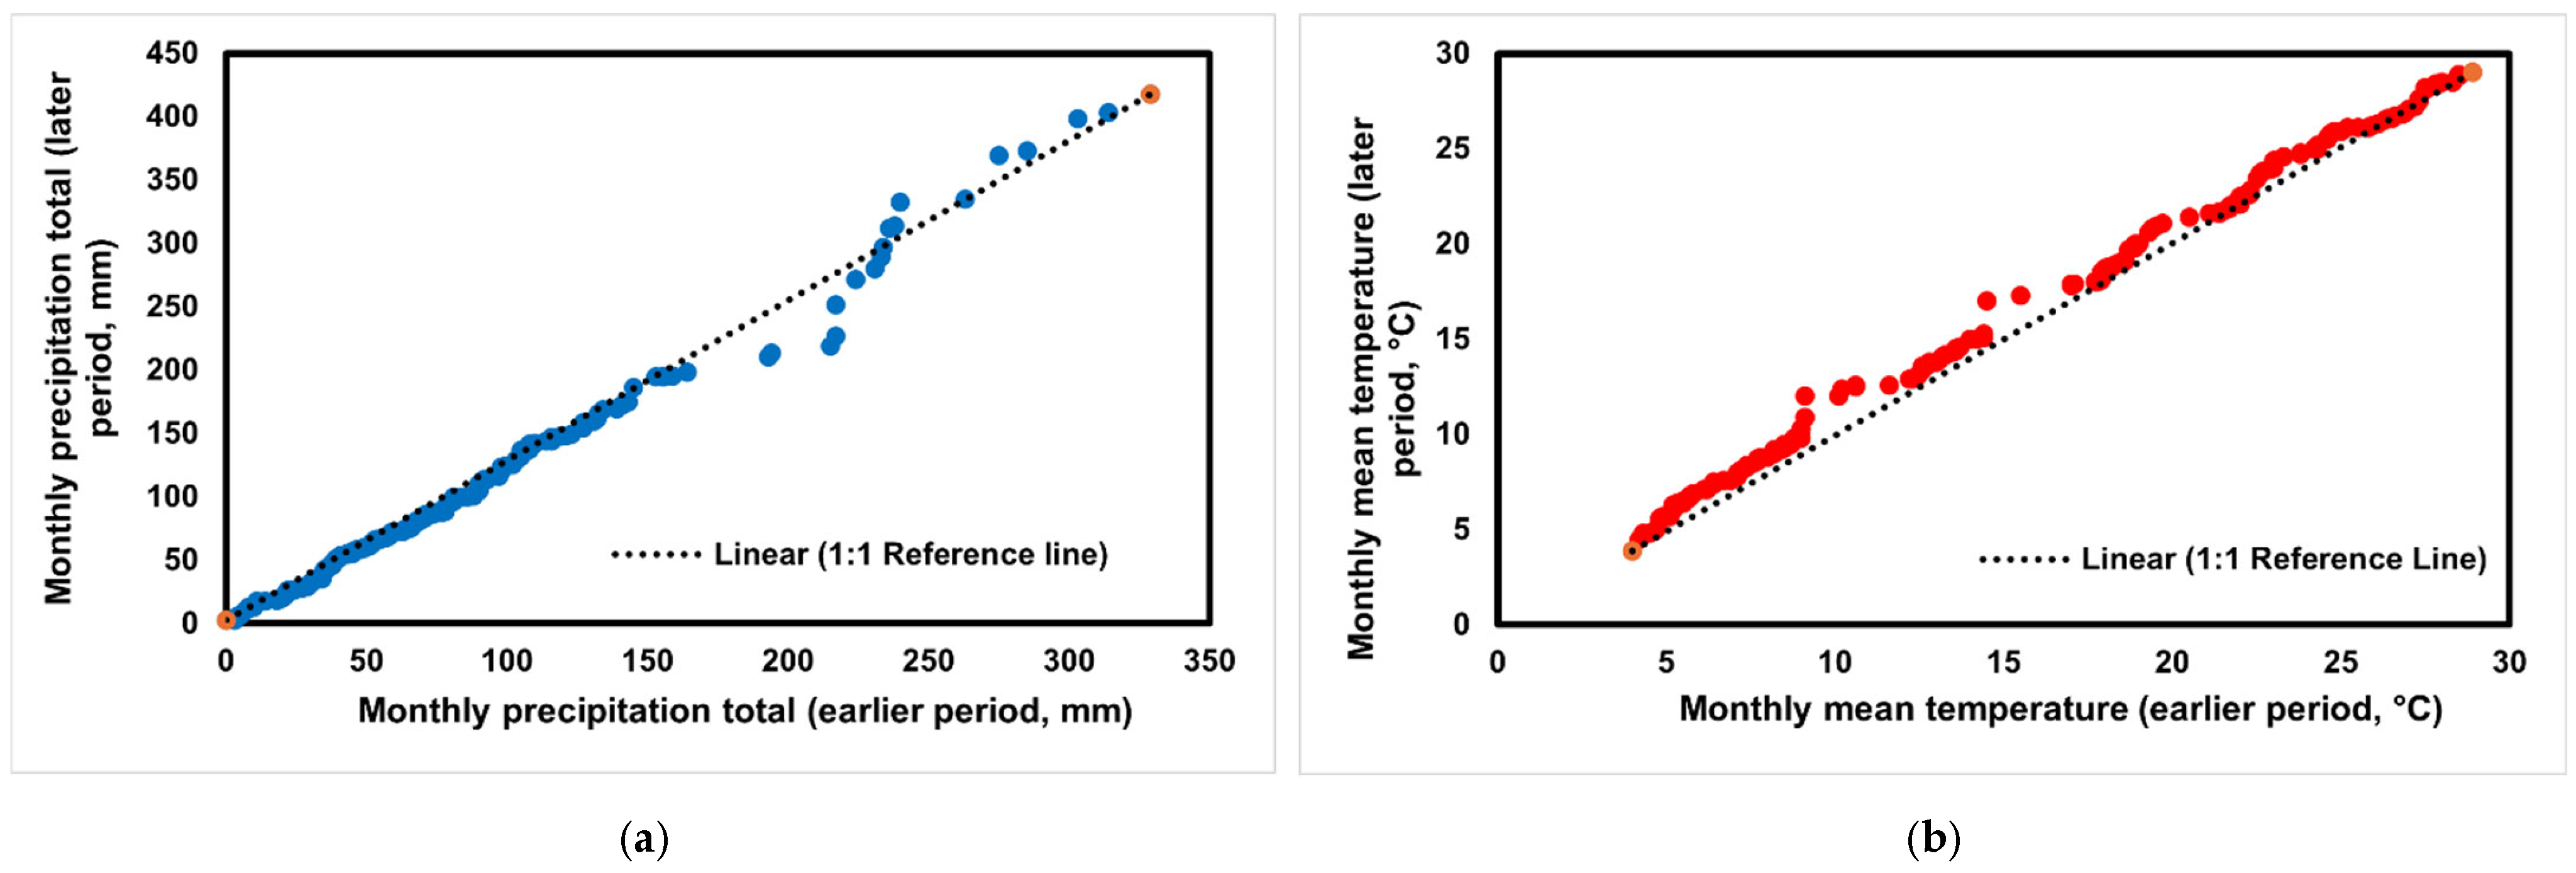
The Innovative Trend analysis (ITA) of Ikuchijima is shown in Figure 6.
Figure 6.
Innovative Trend Analysis (ITA) of monthly (a) precipitation totals; and (b) mean air temperature, at Ikuchijima from 1994 to 2024. Orange points represent the minimum and maximum values in the earlier and later periods of the time series and were used to define the reference line.
For precipitation, the data points are scattered around the 1:1 reference line. This distribution indicates the absence of a strong monotonic trend and suggests near-homogeneous behavior over the 1994–2024 period. For air temperature, most points lie above the reference line in the higher-value range. This pattern indicates a weak but persistent increasing trend in temperature.
The monthly and seasonal precipitation totals and mean air temperature of Ikuchijima Island during the experimental month were compared with the long-term mean (1994–2024) (Table 2).
Table 2.
Comparison of precipitation and air temperature during the experimental periods (December 2023 to November 2024) with climatological means (1994–2024) at Ikuchijima Island, Japan.
This comparison was conducted to evaluate whether the experimental period reflects average climatic conditions. During the experimental months, December precipitation was below the long-term average (41.6 mm), whereas March and August precipitation was close to or slightly above the long-term average. Seasonal precipitation during winter was below the long-term mean (43.5 mm), whereas spring and summer precipitation were slightly above it. Air temperature during the experimental months closely matched the long-term averages. Seasonal temperatures during winter, spring, and summer differed by less than 0.6 °C from the long-term means. These small deviations indicate that the experimental period represents typical thermal conditions for the region.
Overall, the time-series analysis confirms that the denitrification experiments were conducted under representative climatic conditions. Although interannual variability exists, no extreme anomalies dominate the period. The observed precipitation variability and gradual warming trend in temperature are consistent with regional climatic patterns reported for western Japan. Therefore, the denitrification results can be interpreted as broadly applicable across the long-term climatic context of Ikuchijima.
3.2. Variation of NO3−-N and Cl− Ion Concentrations and RR During the PPTs
The background characteristics of groundwater at each borehole are summarized in Table 1. The background concentration of Cl− generally increased with depth, except in winter. The background NO3−-N was typically lowest at the 3 m depth (1.2–3.7 mg L−1), highest at 15 m depth (6.6–13.8 mg L−1), and intermediate at the 30 m depth (4.5–12.4 mg L−1). Low background NO3−-N at the shallow depth suggests nitrate uptake, attenuation, or transport from agricultural input [28,49]. Higher NO3−-N concentration with depth in steep catchments likely results from transport of nitrate in percolating and recharging groundwaters from agricultural input to greater depths [27,28,40]. Figure 7 shows the temporal variation in NO3−-N and Cl− concentrations during the PPTs.
Figure 7.
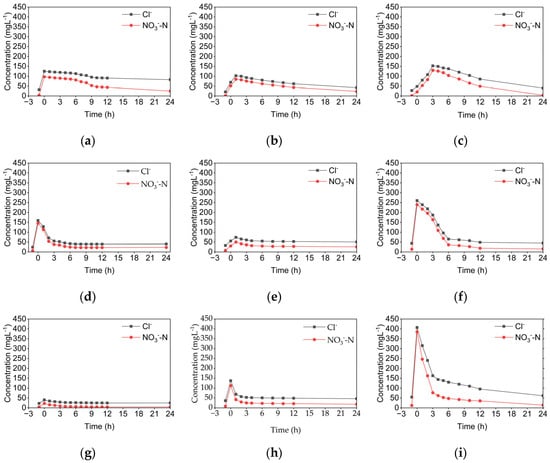
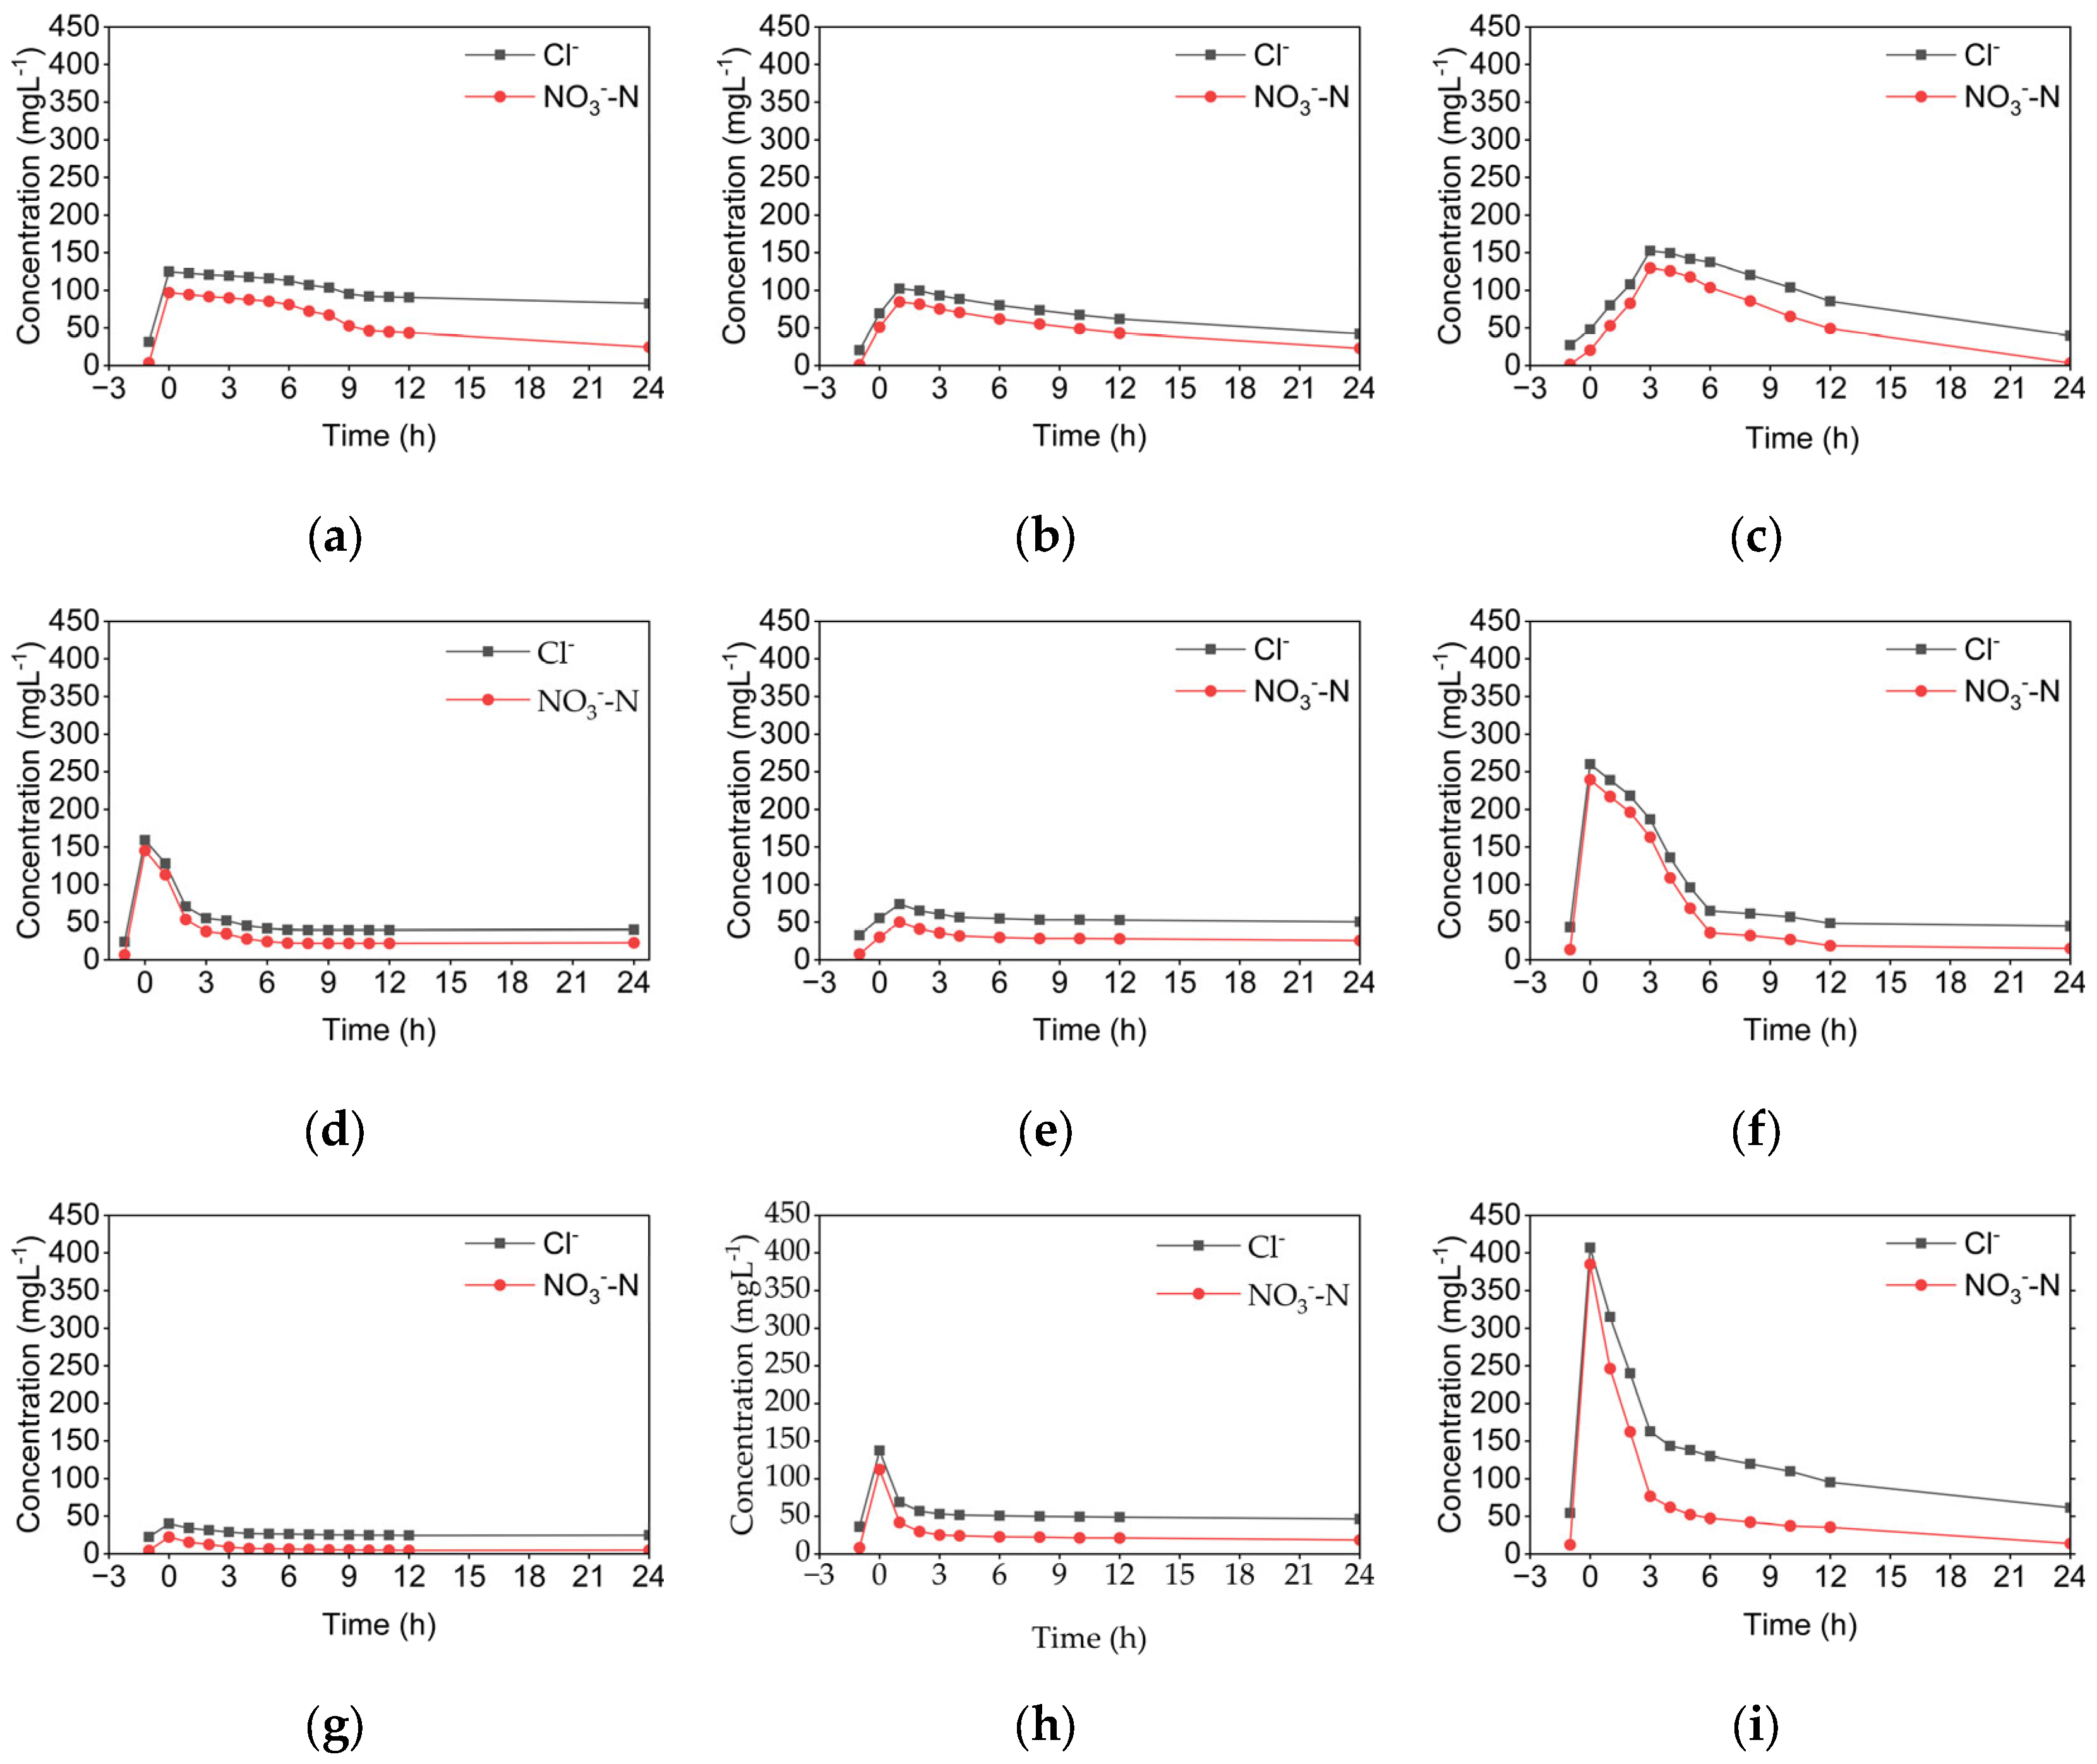
Temporal variation in NO3−-N and Cl− concentrations at different depths and seasons in Ikuchijima Island, Japan. (a) 3 m winter; (b) 3 m spring; (c) 3 m summer; (d) 15 m winter; (e) 15 m spring; (f) 15 m summer; (g) 30 m winter; (h) 30 m spring; (i) 30 m summer.
Both NO3−-N and Cl− concentrations increased rapidly within the first three hours following tracer injection, then declined over the 24 h test period due to mixing and advection in the aquifer.
The initial NO3−-N and Cl− concentrations of 1000 mg L−1 injected in all nine PPTs in the three boreholes were diluted in all seasons (Figure 7), with the greatest dilution in spring and least in summer. At all depths, Cl− decreased due to conservative processes, including dispersion and advection with groundwater flow. In contrast, NO3−-N concentration was consistently lower than the Cl− concentration. This indicates that, in addition to dispersion and advection, biogeochemical processes (for example, denitrification) reduced NO3−-N. Seasonal and depth-dependent variations were observed in the NO3−-N and Cl− concentrations. At the 15 m NO3−-N and Cl− concentrations declined at similar rates (Figure 7d–f), suggesting that solute transport was primarily conservative in this area under high hydraulic conductivity (6.6 × 10⁻³ cm s−1) and hydraulic flux (5.6–6.8 × 10⁻⁵ cm s−1) [42]. In contrast, at the 3 m and 30 m depths, NO3−-N concentrations decreased faster than Cl− (Figure 7a,c,g,i), indicating active nitrate reduction in addition to dilution [42]. The most significant nitrate reduction occurred at 3 m in winter, and 30 m in summer, corresponding to the lowest groundwater fluxes (1.3 × 10⁻⁶ cm s−1 and 5.6 × 10⁻⁶ cm s−1, respectively). In Spring, NO3−-N and Cl− displayed a similar trend across all depths, implying that denitrification was limited under higher flux (1.8 × 10⁻⁶ cm s−1 to 5.6 × 10⁻⁵ cm s−1) and more oxidizing conditions (DO: 3.7–5.8 mg L−1).
Figure 8 shows the temporal variation in the RR of NO3−-N and Cl− in groundwater samples during PPTs.
Figure 8.
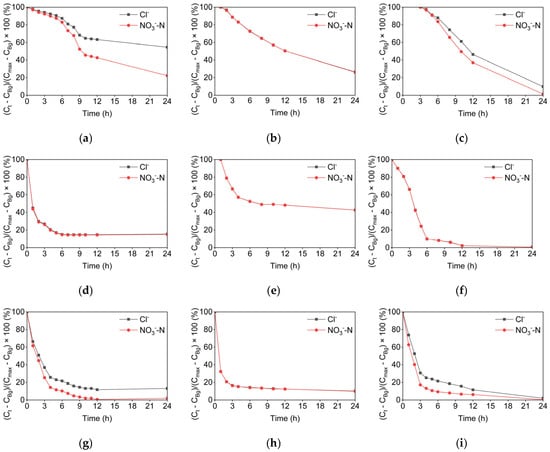
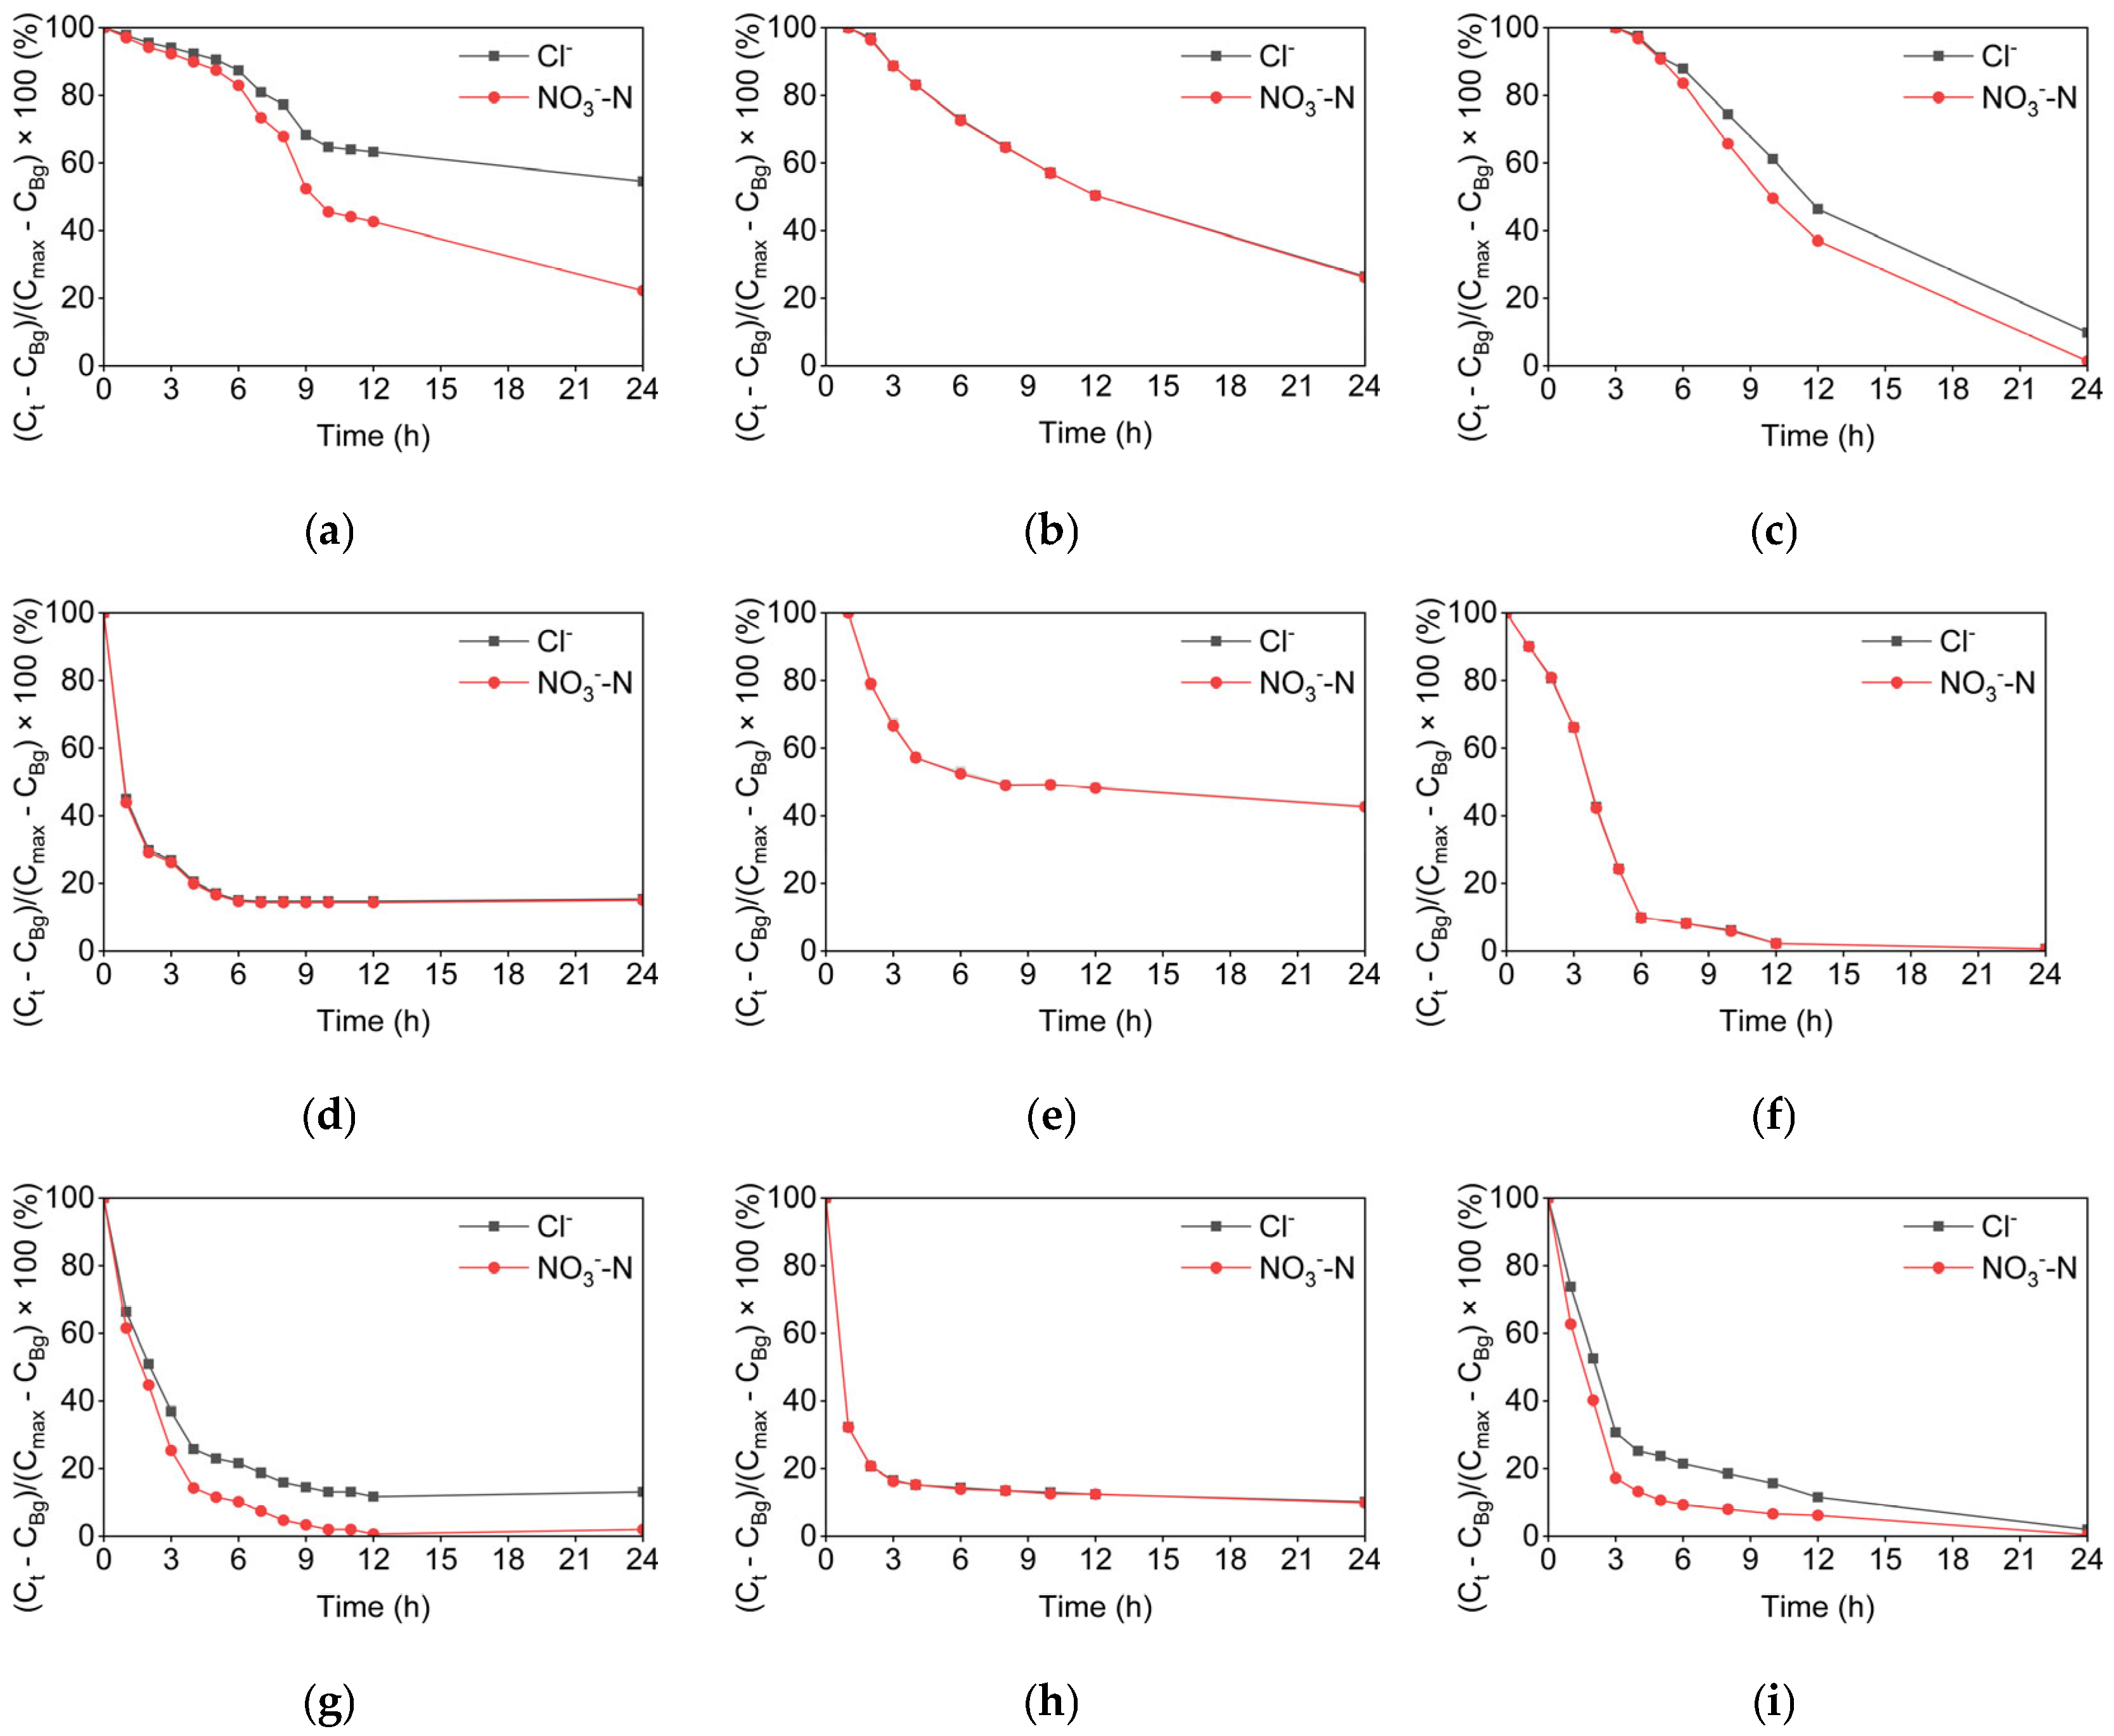
Temporal variation in the RR of NO3−-N and Cl− tracers in the groundwater samples during PPTs in Ikuchijima Island, Japan. (a) 3 m winter; (b) 3 m spring; (c) 3 m summer; (d) 15 m winter; (e) 15 m spring; (f) 15 m summer; (g) 30 m winter; (h) 30 m spring; (i) 30 m summer.
NO3−-N declined faster than Cl− at 3 m and 30 m depths in winter and summer, indicating greater denitrification potential. Approximately 12 h after tracer injection, the NO3−-N RR was reduced to approximately 43%, whereas Cl− RR was 63%. At 30 m in summer, 12 h after tracer injection, NO3−-N RR declined to approximately 6%, whereas Cl− RR was approximately 12%. At 15 m, the RR of both tracers decreased at similar rates across all experimental periods (Figure 8). A similar trend was observed at the 3 m and 30 m boreholes in spring. (Figure 8b,e,h). Overall, denitrification was more pronounced at 3 m and 30 m, particularly in winter and summer, than at 15 m.
The DO levels were highest at 15 m (4.8–5.4 mg L−1), which exceeded the preferred range of 2 mg L−1 and the 4 mg L−1 limit at which denitrification has been observed in the field [15]. Low denitrification potential at the 15 m depth could be due to its high DO values coupled with ORPS.HE which indicate oxygenated and oxidizing conditions that are not suitable for denitrification at a depth of 15 m [42]. In a field study, low to negligible denitrification was observed at depths consisting of coarse material, high DO, high water levels, and high hydraulic conductivities [22,23,27,42].
In contrast, the hydrological and redox conditions at 3 m (silty loam) and 30 m (weathered rock) depths were favorable for denitrification with lower water levels, hydraulic conductivities, DO and ORP (except in spring) [42]. Enhanced denitrification at 3 m and 30 m depths may be attributed to prolonged contact time between nitrate and the reactive substrate, resulting in measurable denitrification [29]. Trudell et al. [19] observed that denitrification reduces nitrate in groundwater with water tables below 1 m. They also attributed denitrification at these depths to low oxygen and carbon availability. However, denitrification was limited at these depths when the water table was more than 1 m below the surface. PPTs results in our study reveal heterogeneity and depth variation within coastal aquifers in steep agricultural areas, with most activity occurring at shallow and deep levels and minimal at intermediate depths characterized by rapid, conservative transport [20,36].
3.3. Estimated Denitrification Rates and Fluxes
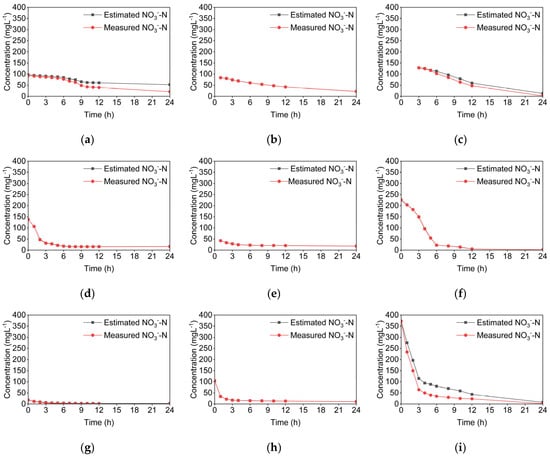
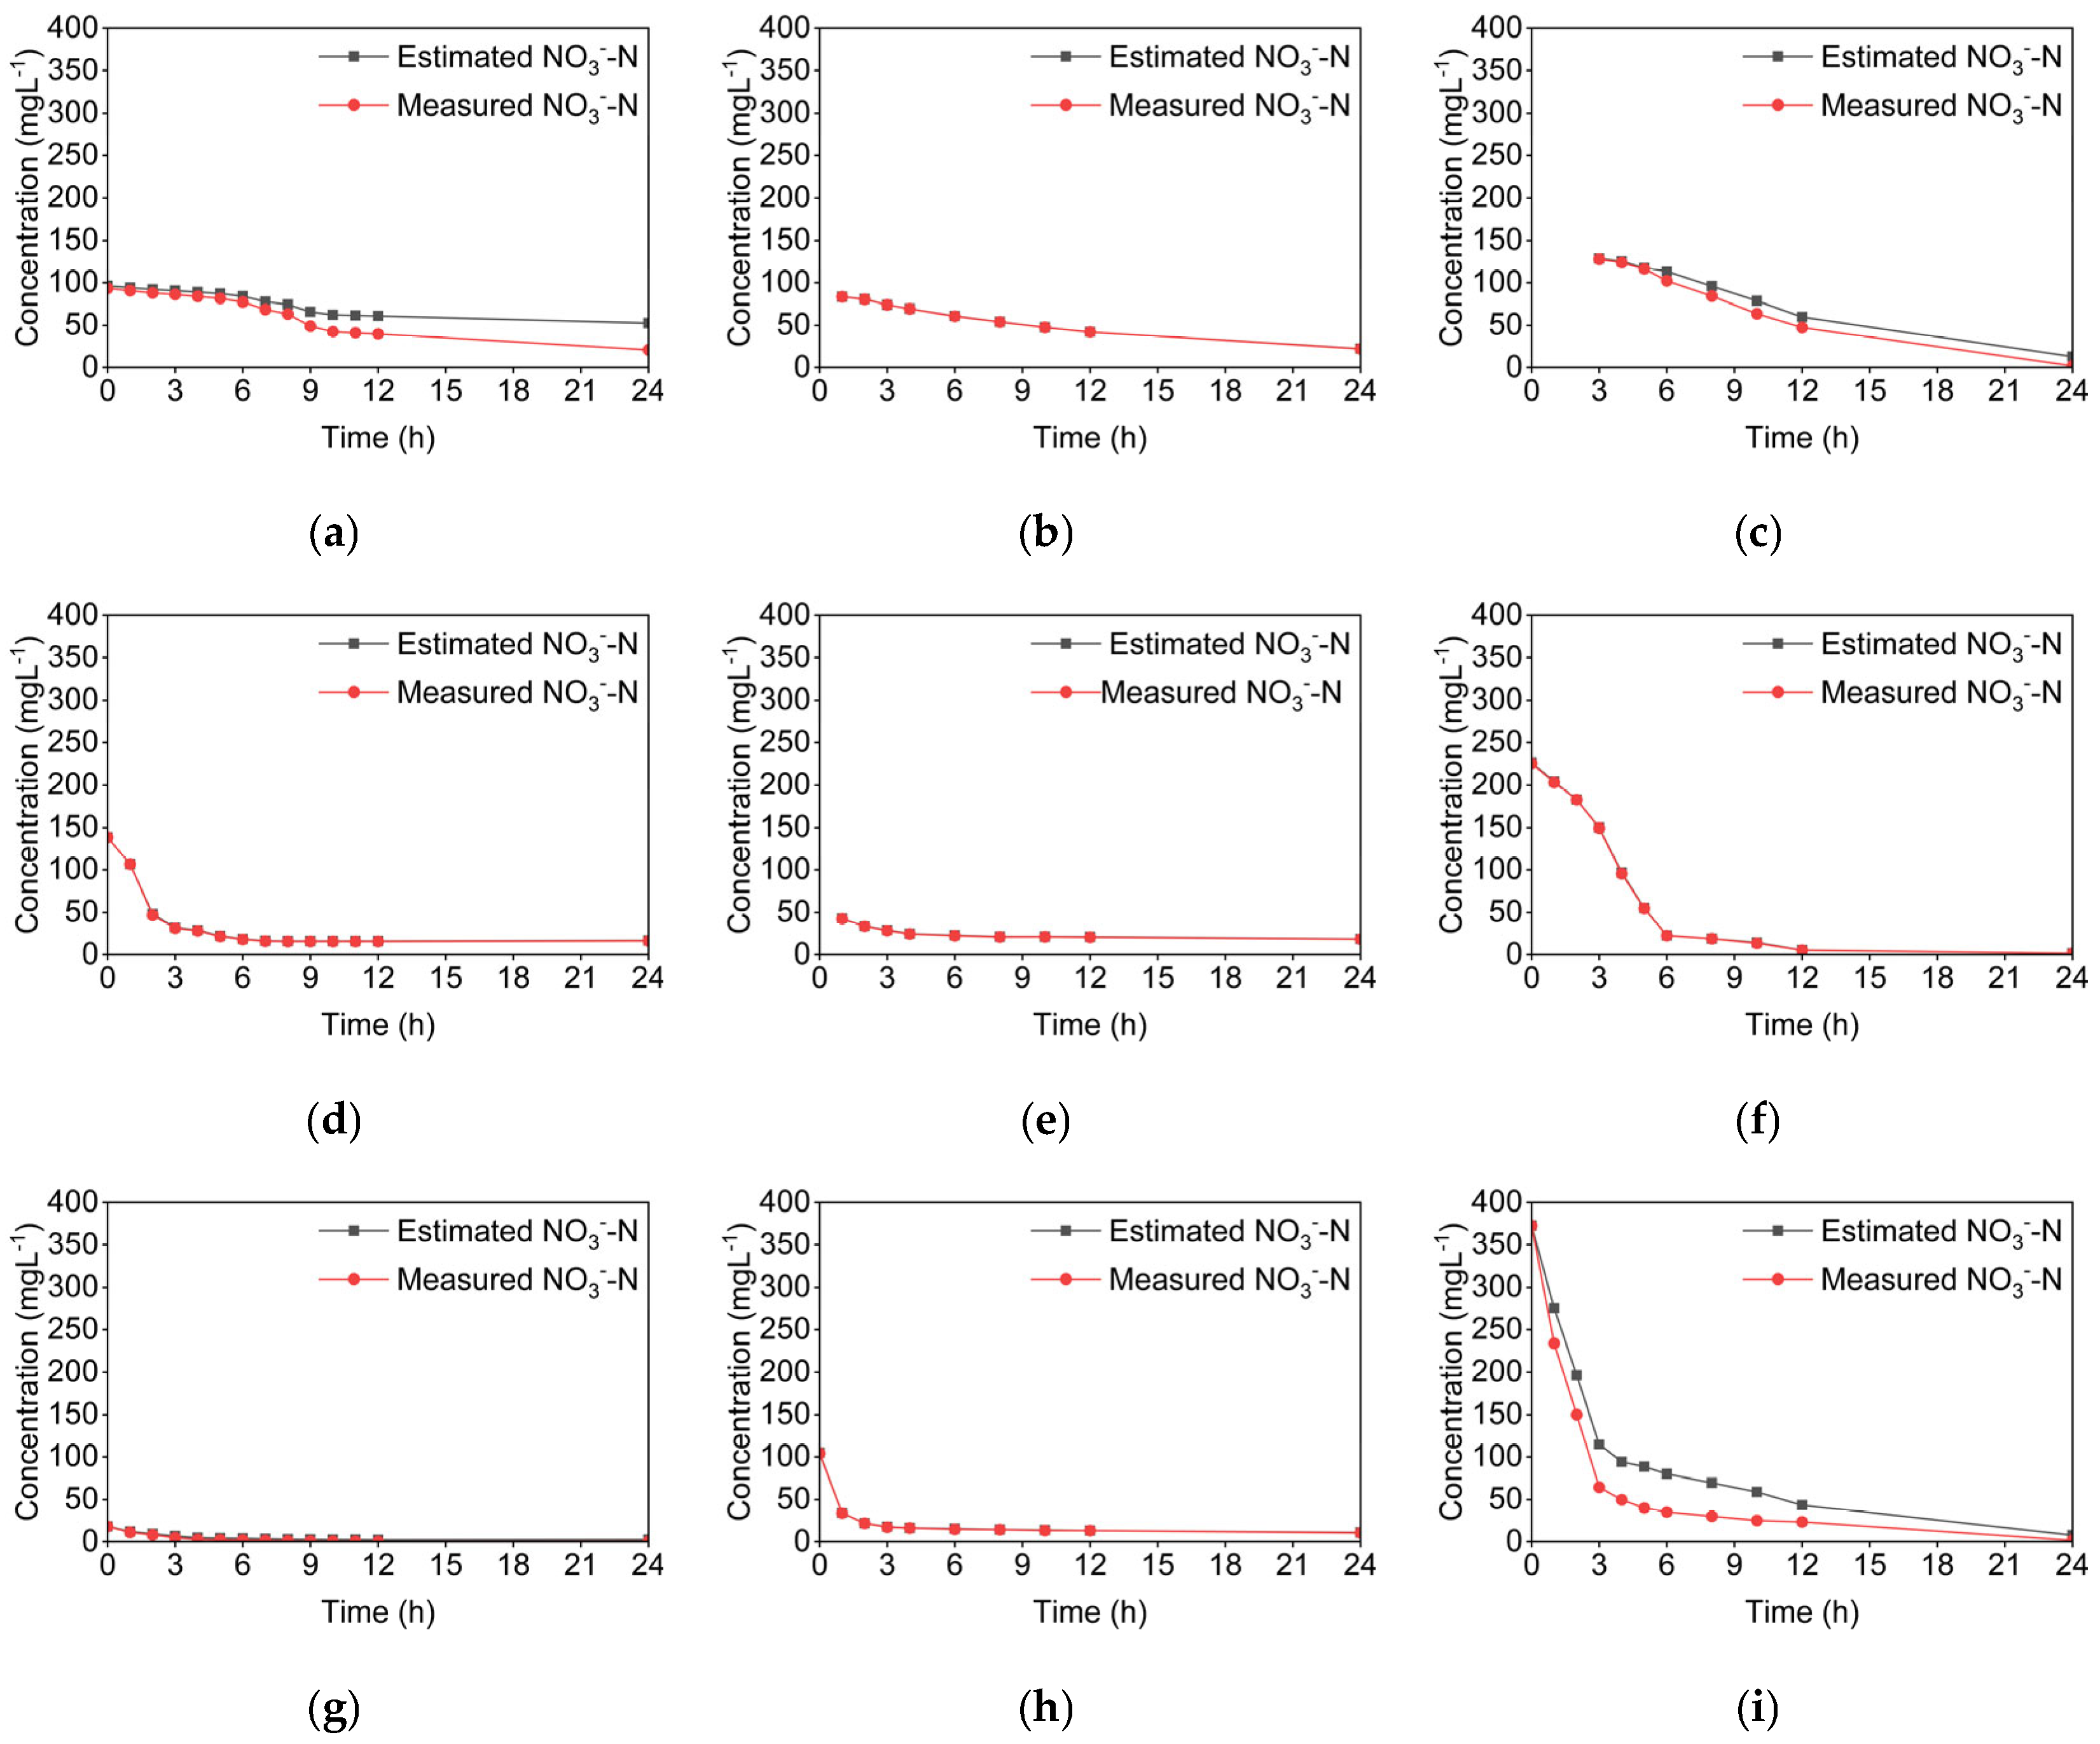
The temporal changes in the estimated NO3−-N concentration, adjusted for dilution using Cl− ion concentration, and the measured NO3−-N concentrations during the PPTs are shown in Figure 9.
Figure 9.
Temporal changes in the NO3−-N concentration corrected for dilution (estimated) and actual (measured) NO3−-N concentrations in Ikuchijima Island, Japan. (a) 3 m winter; (b) 3 m spring; (c) 3 m summer; (d) 15 m winter; (e) 15 m spring; (f) 15 m summer; (g) 30 m winter; (h) 30 m spring; (i) 30 m summer.
The cumulative difference between the dilution-corrected (estimated) and measured NO3−-N, divided by the time interval, indicates the level of denitrification in each push–pull test. When there was little or no deviation between the estimated and measured NO3−-N curves, NO3−-N behaved conservatively. This conservative behavior of NO3−-N suggests that its reduction occurred primarily through dilution and advection with groundwater flow, as with the Cl− tracer. In contrast, the deviations between the two curves indicate nitrate loss beyond simple dilution, indicative of both biological and chemical processes. The denitrification rate was calculated as the difference between the estimated and measured NO3−-N, divided by the time interval. Table 3 summarizes the denitrification rates at three different depths (3 m, 15 m, and 30 m) during winter, spring, and summer.
Table 3.
Summary of the denitrification rates and hydraulic fluxes during PPTs conducted at three depths in winter, spring, and summer.
3.4. Influence of Hydraulic Flux and Temperature on Denitrification
The average denitrification rate was controlled by the average hydraulic conductivity, which was minimum at 3 m, followed by 30 m, and maximum at 15 m (Table 1 and Table 3). The same trend was seen in the average hydraulic fluxes. During winter, the highest denitrification rate of 20 mg N L−1 day−1 was observed at 3 m depth. In summer, a maximum denitrification rate of 24 mg N L−1 day−1 was estimated in the 30 m borehole. The 15 m borehole with the highest value of hydraulic conductivity and flux exhibited a negligible denitrification rate in all seasons. Denitrification was generally limited during spring.
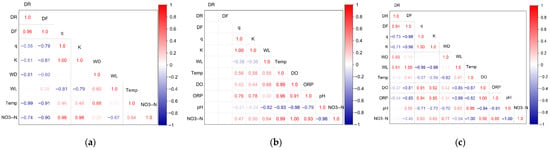
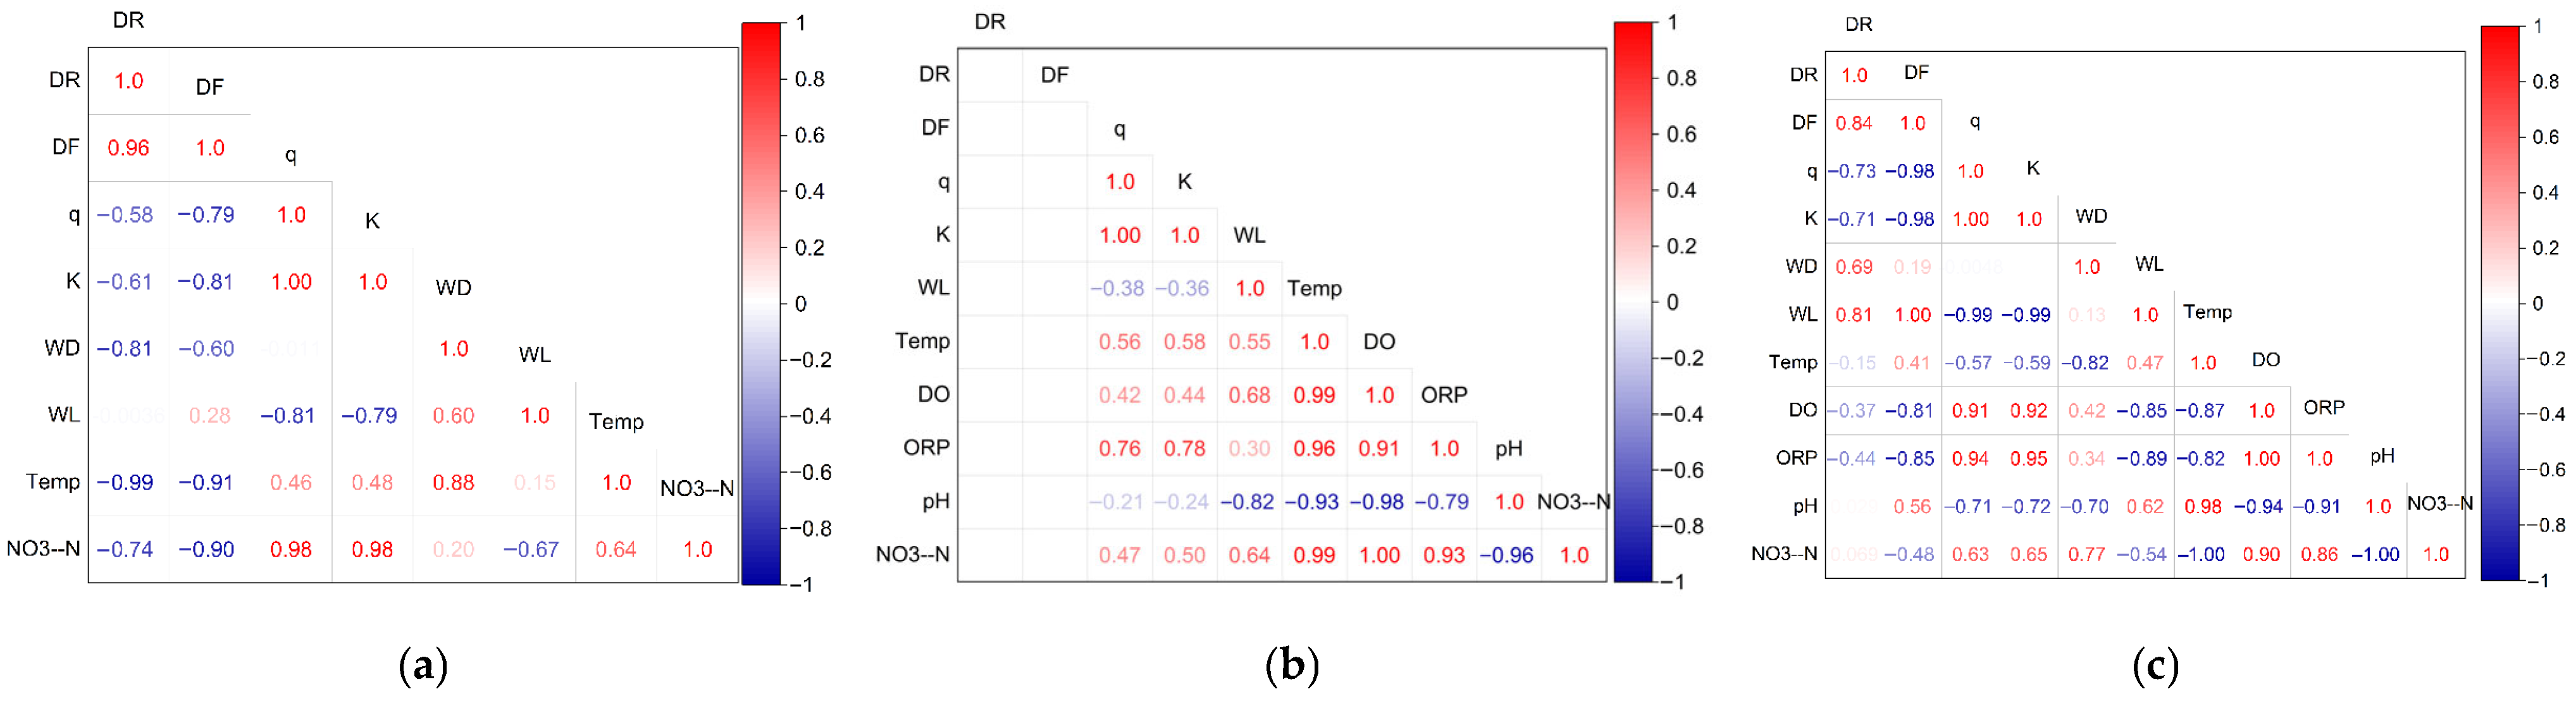
Under varying hydraulic fluxes, nitrate removal rates ranged from 0.3–3.4 × 10⁻⁴ mol N h−1 at all depths in all seasons, with the highest nitrate removal rate in summer in the 30 m borehole. The denitrification rate was inversely correlated with hydraulic flux (q) in both summer (r = −0.73) and winter (r = −0.58) (Figure 10).
Figure 10.
Pearson correlation matrix heatmap showing relationships between groundwater parameters for the experimental site in (a) winter, (b) spring, and (c) summer. Variables include denitrification rate (DR), nitrate removal rate (DF), hydraulic flux (q), hydraulic conductivity (K), well depth (WD), water level (WL), temperature (Temp), NO3−-N, and groundwater physicochemical parameters. Colors indicate the direction and strength of correlations (red = positive, blue = negative). The values represent the Pearson correlation coefficients (r).
The nitrate removal rate also correlated inversely with the hydraulic flux (Figure 10) in summer (r = −0.98) and winter (r = −0.79). Hydraulic flux correlated positively with DO (r = 0.91) and ORP (r = 0.93), implying that increasing hydraulic flux creates more oxidizing conditions that limit denitrification.
At depths of 3 m and 30 m under low hydraulic flux, denitrification rates were higher in winter and summer. Conversely, during spring, when hydraulic flux increased at these depths, the denitrification rates decreased. Furthermore, the total denitrification (or nitrate removal) per area in the catchment increased with enhanced denitrification at different depths. Thus, low hydraulic fluxes have the potential to denitrify and completely remove nitrate from groundwater.
Hydraulic flux emerged as a key factor influencing denitrification at all depths in each season. An inverse correlation was observed between hydraulic flux and denitrification rate, underscoring the critical roles of residence time and transport dynamics in attenuating nitrate concentrations in groundwater. At the study site, denitrification was consistently highest under low hydraulic flux (4.8–5.6 × 10⁻⁶ cm s−1) and was negligible at high fluxes (5.9–6.8 × 10⁻⁵ cm s−1 at 15 m). In the 3 m borehole, denitrification rates varied inversely with the hydraulic flux (1.3 × 10⁻⁶ cm s−1) in both winter and summer. In spring, the hydraulic flux at 3 m increased slightly, and the denitrification rate was reduced to less than 1 mg N L−1 day−1. Estimated denitrification rates at 3 m were 20 mg N L−1 day−1 in winter and 9 mg N L−1 day−1 in summer, whereas the estimated nitrate removal rates were 6.8 × 10⁻⁵ mol N h−1 and 3.0 × 10⁻⁵ mol N h−1, respectively.
The results of the PPTs indicated negligible denitrification at the intermediate (15 m) depth (Figure 7 and Figure 8). The 15 m depth consists of sand and gravel (Figure 3) and exhibits high hydraulic conductivity (Table 1). High hydraulic heads and hydraulic conductivities limit the contact time between the injected nitrate tracer and reactive substrates organic carbon or mineral ions [25,29]. Therefore, the 15 m borehole, characterized by the highest fluxes (5.9–6.8 × 10⁻⁵ cm s−1), exhibited negligible denitrification in all seasons. Despite its moderate temperature, higher water levels and hydraulic fluxes reduced residence time, limiting denitrification activity. Denitrification studies have been limited in highly transmissive aquifers due to rapid groundwater flow and short residence times, which restrict microbial nitrate reduction [27,40,50]. Zaman et al. [11] attributed limited denitrification in high-velocity areas to the high-nitrate plume bypassing these areas.
Conversely, at a depth of 30 m, where hydraulic fluxes were low (4.8–5.6 × 10⁻⁶ cm s−1), significant denitrification was observed. The denitrification rates increased from 2 mg N L−1 day−1 to 24 mg N L−1 day−1. The corresponding nitrate removal rates ranged from 2.3 × 10⁻⁵ mol N h−1 to 3.4 × 10⁻⁴ mol N h−1. These findings suggest that under low hydraulic flux conditions, microbial denitrification can occur when substrate availability and reducing conditions are present [25,29].
These findings confirm that denitrification efficiency increases at low groundwater flux. Slower groundwater movement increases residence time and reaction among nitrate, electron donors, and denitrifying bacteria, thereby enhancing denitrification. The lower flux conditions in summer corresponded with more reduced ORP (ORPS.HE of 246.8–346.4 mV) and oxygen-deficient environments (2.7–3.7 mg L−1), which favor denitrification (Figure 10).
Groundwater temperature showed minimal seasonal variability, except at 3 m depth (Table 1). The correlation matrix (Figure 10) indicates a strong inverse relationship between denitrification rate and temperature in winter (r = −0.99) and a weak inverse relationship in summer (r = −0.15). This indicates that groundwater temperature had a minor contribution to the denitrification rate in this catchment. In contrast, hydraulic flux, water level, and hydraulic conductivity showed stronger correlations with the denitrification rate and flux, suggesting that lower flux favors denitrification. Therefore, hydrologic factors were the dominant influencing factors, rather than temperature.
In winter, spring, and summer, there was negligible denitrification at 15 m depth, indicating little seasonal influence on denitrification at this depth (Figure 8 and Figure 9). In summer, the denitrification rate was maximum at 30 m depth (24 mg N L−1 day−1), more than one order of magnitude higher than in winter at the same depth. This seasonal variation in the denitrification rate may be due to more reducing conditions, and a relatively low water table and hydraulic flux. However, the shallower depth (3 m) resulted in a reduced denitrification rate from 20 mg N L−1 day−1 in winter to 9 mg N L−1 day−1 in summer despite increased temperatures and a lower water table and hydraulic flux. A weak relationship has been found between temperature and denitrification [51]. The reduced denitrification in summer suggests the influence of other factors, such as a limitation of electron donors (such as organic carbon sources, pyrite, and metal ions). Choi and Lee [50] showed that in the groundwater of a streambed watershed, even under reducing conditions, denitrification can be slower than groundwater flow when electron donors are limited. Future investigations are necessary to confirm the influence of electron donor availability on seasonal denitrification in this catchment area.
Denitrification was most prominent during the summer and winter and was negligible in the spring. The winter and summer experimental periods corresponded to dry days with slightly higher temperatures than those in spring. There was less recharge in winter and summer, which increased the residence time between the tracer and groundwater. This suggests that the seasonal variation was primarily driven by differences in hydraulic flux rather than by temperature fluctuations.
3.5. Comparison of the Denitrification Rates of This Study with Other Studies
The inverse relationship observed between hydraulic flux and denitrification rate in this study is consistent with global trends. A study conducted in alluvial aquifers in the United States assessed nitrate removal under low groundwater flux conditions [25] and found denitrification rates of 0.00038–5.37 mg N L−1 day−1 under hydraulic conductivities of approximately 10−4 to 10−3 cm s−1 (Table 4).
Table 4.
Comparison of denitrification rates and hydraulic conditions between this study and global studies.
Studies in European and Japanese aquifers involving both field measurements and tracer experiments, found denitrification rates between approximately 1 mg N L−1 day−1 to 26 mg N L−1 day−1 at hydraulic conductivities of approximately 10−6–10−3 cm s−1 [27,54]. They demonstrated that low to moderate hydraulic conductivities, hence flux, facilitate sustained redox reactions and nitrate removal.
In this study, denitrification rates of 2–24 mg N L−1 day−1 were observed at hydraulic conductivities of 1.7–7.5 × 10⁻⁴ cm s−1. Tesoriero et al. [25], emphasized the residence-time dependence of denitrification in aquifers. Under high-flow conditions, advective transport dominates and minimizes nitrate contact with available electron donors [55]. In contrast, under low-flow conditions, nitrate contact with available electron donors is enhanced, enabling enhanced nitrate attenuation through denitrification.
3.6. Implications
Denitrification can remain effective in steep aquifers during periods of reduced hydraulic flux, such as in winter and late summer. These findings have important implications for climate change and groundwater quality management. Future increases in rainfall variability and extreme precipitation events may accelerate groundwater flow, flushing nitrates deeper into aquifers. This process could temporarily reduce denitrification efficiency and increase the risk of nitrate discharge into coastal environments.
Conversely, prolonged dry periods with limited precipitation may promote more reducing conditions, thereby enhancing nitrate removal. Coastal aquifers will also experience additional redox changes due to sea-level rise and saltwater intrusion, potentially shifting microbial processes from denitrification toward sulfate reduction.
Understanding how hydraulic flux influences denitrification is critical for predicting the resilience of natural attenuation in agricultural islands and other coastal systems. Notably, the observed denitrification rates (up to 24 mg N L−1 day−1) are comparable to or exceed those reported in flat floodplains [11,54]. This underscores the importance of local hydrogeological conditions, especially in low-flux zones, in controlling redox dynamics even within steep aquifer systems.
3.7. Recommendations and Limitations
The potential electron donors responsible for denitrification, such as dissolved organic carbon, reduced sulfur, or iron species, were not assessed in this study. Evaluating the availability of these electron donors is crucial for understanding the factors that control denitrification rates. Therefore, this should be a priority in future research.
Incorporating isotopic tracers, such as δ15-NO3−, δ18O-NO3−, along with microbial analyses, would provide direct evidence of biological denitrification and its pathways. Future studies should also emphasize long-term monitoring of groundwater flux and water-level variations across all seasons. This would strengthen the connections among hydrological conditions, redox processes, and denitrification.
This study was based on three boreholes and three seasonal observations, which may not fully capture long-term variability or extreme hydrological events, such as typhoons or prolonged droughts. Hydraulic fluxes were estimated from point-scale measurements and may not represent small-scale heterogeneities or preferential flow paths. Furthermore, spatial heterogeneity in hydraulic flux was inferred rather than directly measured. This may introduce uncertainties into the interpretation of denitrification patterns. Expanding this approach to various hydrogeological settings, such as floodplains, confined aquifers, and engineered recharge systems, would enhance our global understanding of the relationship between hydraulic flux and denitrification.
Integrating denitrification kinetics into groundwater models could also improve our comprehension of nitrate fate in the context of future climate scenarios and water management strategies. The limitations encountered in this study highlight the need for integrated multi-scale research that combines hydrology, microbiology, and climate modeling.
Despite these limitations, this study effectively examined the interaction between denitrification and groundwater inflow in a steep coastal agricultural catchment affected by nitrate contamination. By quantifying denitrification rates and fluxes across different depths and seasons, the results indicate that hydraulic flux has a strong influence on denitrification. In contrast, temperature played a secondary role under the observed conditions. These findings offer site-specific evidence on how steep coastal aquifers can attenuate nitrate under favorable hydrologic conditions and provide a foundation for enhancing local groundwater management.
4. Conclusions
Overall, the time-series analysis confirms that the denitrification experiments were conducted under representative climatic conditions. Although there is interannual variability, no extreme anomalies dominate the period. The observed precipitation variability and gradual warming trend in temperature are consistent with regional climatic patterns reported for western Japan. Therefore, the denitrification results can be interpreted as broadly applicable across the long-term climatic context of Ikuchijima.
This study demonstrates that denitrification in steep coastal agricultural catchments is significantly influenced by hydraulic flux and seasonal fluctuations in water levels. These influences vary with depth and season. The denitrification rate was highest, ranging from 20 to 24 mg N L−1 day−1, under lower hydraulic fluxes in both winter and summer. In contrast, the rate was lowest under higher hydraulic fluxes in spring. These patterns were consistent across both denitrification rate and nitrate removal rate estimates.
Depth-wise, denitrification was prominent at both the shallowest (3 m) and the deepest (30 m) observation boreholes during low-flux periods. However, it was limited at intermediate depths (15 m) and at other depths under higher hydraulic flux. Pearson correlation analysis showed a strong inverse relationship between denitrification (rate and flux) and hydraulic flux in summer (r = −0.73) and winter (r = −0.58). Correlations with temperature were weak or inconsistent across seasons. This provides statistical evidence that groundwater flux exerts a stronger control on denitrification than temperature at this site.
This study advances understanding of nitrate reduction in steep island settings via denitrification across depths and seasons. It therefore informs local groundwater management. In the context of climate change, these findings underscore that shifts in hydraulic fluxes directly affect nitrate reduction through denitrification. The results demonstrate that denitrification varies seasonally and with depth. It is controlled by groundwater flow conditions such as hydraulic flux and hydraulic conductivity.
As coastal aquifers face combined pressures from agricultural loading, sea-level rise, and hydrological variability, understanding and managing groundwater fluxes is crucial. This knowledge is essential for the sustainable management of groundwater resources and the water environment. The results highlight the potential of natural denitrification to mitigate nitrate contamination during periods of low groundwater flux. This underscores the importance of considering hydrologic variability in the management of coastal aquifers.
Supplementary Materials
The following supporting information can be downloaded at: https://www.mdpi.com/article/10.3390/hydrology13010023/s1, Figure S1: Seasonal variations in air temperature and precipitation on Ikuchijima.
Author Contributions
Conceptualization, S.-i.O. and M.S.; methodology, K.T.T., S.-i.O., M.S., S.B.K. and M.A.; software, K.T.T.; validation, K.T.T., S.-i.O. and M.S.; formal analysis, K.T.T., S.B.K. and M.A.; investigation, K.T.T., S.-i.O., M.S., S.B.K. and M.A.; resources, S.-i.O. and M.S.; data curation, K.T.T. and M.A.; writing—original draft preparation, K.T.T.; writing—review and editing, K.T.T., S.-i.O., M.S. and S.B.K.; visualization, K.T.T.; supervision, S.-i.O. and M.S.; project administration, S.-i.O.; funding acquisition, M.S. All authors have read and agreed to the published version of the manuscript.
Funding
This research was funded by the Japan Society for the Promotion of Science (JSPS) Grant-in-aid for Challenging Research, grant number 22K19869, and Asia-Pacific Network for Global Change Research (APN) Grant No. CRRP2019-09MY-Onodera, Grant-in-Aid for Scientific Research (A) by Japan Society for the Promotion of Science (JSPS) KAKENHI Project No. 18H04151.
Data Availability Statement
The data presented in this study are available on request from the corresponding author.
Acknowledgments
We thank the Japanese Ministry of Education, Culture, Sports, Science, and Technology (MEXT) for the Monbukagakusho Scholarship, which supports Kelly Tiku Tarh’s PhD studies. We are grateful to our laboratory members, especially Gao Qidi, Kento Kawanabe, and Dingchang Chen, for their assistance in sample collection. We also thank Yusuke Tomozawa for his assistance with the chemical analysis.
Conflicts of Interest
The authors declare that they have no conflicts of interest.
References
- Picetti, R.; Deeney, M.; Pastorino, S.; Miller, M.R.; Shah, A.; Leon, D.A.; Dangour, A.D.; Green, R. Nitrate and Nitrite Contamination in Drinking Water and Cancer Risk: A Systematic Review with Meta-Analysis. Environ. Res. 2022, 210, 112988. [Google Scholar] [CrossRef] [Scilit] [PubMed]
- Abascal, E.; Gómez-Coma, L.; Ortiz, I.; Ortiz, A. Global Diagnosis of Nitrate Pollution in Groundwater and Review of Removal Technologies. Sci. Total Environ. 2022, 810, 152233. [Google Scholar] [CrossRef] [Scilit] [PubMed]
- Kruisdijk, E.; Eisfeld, C.; Stuyfzand, P.J.; Van Breukelen, B.M. Denitrification Kinetics during Aquifer Storage and Recovery of Drainage Water from Agricultural Land. Sci. Total Environ. 2022, 849, 157791. [Google Scholar] [CrossRef] [Scilit] [PubMed]
- Buvaneshwari, S.; Riotte, J.; Sekhar, M.; Mohan Kumar, M.S.; Sharma, A.K.; Duprey, J.L.; Audry, S.; Giriraja, P.R.; Praveenkumarreddy, Y.; Moger, H.; et al. Groundwater Resource Vulnerability and Spatial Variability of Nitrate Contamination: Insights from High Density Tubewell Monitoring in a Hard Rock Aquifer. Sci. Total Environ. 2017, 579, 838–847. [Google Scholar] [CrossRef] [Scilit] [PubMed]
- Priya, E.; Sarkar, S.; Maji, P.K. A Review on Slow-Release Fertilizer: Nutrient Release Mechanism and Agricultural Sustainability. J. Environ. Chem. Eng. 2024, 12, 113211. [Google Scholar] [CrossRef] [Scilit]
- Aquilina, L.; Roques, C.; Boisson, A.; Vergnaud-Ayraud, V.; Labasque, T.; Pauwels, H.; Pételet-Giraud, E.; Pettenati, M.; Dufresne, A.; Bethencourt, L.; et al. Autotrophic Denitrification Supported by Biotite Dissolution in Crystalline Aquifers (1): New Insights from Short-Term Batch Experiments. Sci. Total Environ. 2018, 619–620, 842–853. [Google Scholar] [CrossRef] [Scilit] [PubMed]
- Garcia-Segura, S.; Lanzarini-Lopes, M.; Hristovski, K.; Westerhoff, P. Electrocatalytic Reduction of Nitrate: Fundamentals to Full-Scale Water Treatment Applications. Appl. Catal. B Environ. 2018, 236, 546–568. [Google Scholar] [CrossRef] [Scilit]
- Zhang, Y.; Shi, P.; Song, J.; Li, Q. Application of Nitrogen and Oxygen Isotopes for Source and Fate Identification of Nitrate Pollution in Surface Water: A Review. Appl. Sci. 2018, 9, 18. [Google Scholar] [CrossRef] [Scilit]
- Roques, C.; Aquilina, L.; Boisson, A.; Vergnaud-Ayraud, V.; Labasque, T.; Longuevergne, L.; Laurencelle, M.; Dufresne, A.; De Dreuzy, J.-R.; Pauwels, H.; et al. Autotrophic Denitrification Supported by Biotite Dissolution in Crystalline Aquifers: (2) Transient Mixing and Denitrification Dynamic during Long-Term Pumping. Sci. Total Environ. 2018, 619–620, 491–503. [Google Scholar] [CrossRef] [Scilit]
- Seitzinger, S.; Harrison, J.A.; Bohlke, J.K.; Bouwman, A.F.; Lowrance, R.; Peterson, B.; Tobias, C.; Van Drecht, G. Denitrification across landscapes and waterscapes: A synthesis. Ecol. Appl. 2006, 16, 2064–2090. [Google Scholar] [CrossRef] [Scilit]
- Zaman, M.; Nguyen, M.L.; Gold, A.J.; Groffman, P.M.; Kellogg, D.Q.; Wilcock, R.J. Nitrous Oxide Generation, Denitrification, and Nitrate Removal in a Seepage Wetland Intercepting Surface and Subsurface Flows from a Grazed Dairy Catchment. Soil Res. 2008, 46, 565–577. [Google Scholar] [CrossRef] [Scilit]
- Wrage, N.; Velthof, G.L.; van Beusichem, M.L.; Oenema, O. Role of Nitrifier Denitrification in the Production of Nitrous Oxide. Soil Biol. Biochem. 2001, 33, 1723–1732. [Google Scholar] [CrossRef] [Scilit]
- Korom, S.F. Natural Denitrification in the Saturated Zone: A Review. Water Resour. Res. 1992, 28, 1657–1668. [Google Scholar] [CrossRef] [Scilit]
- Huang, G.; Fallowfield, H.; Guan, H.; Liu, F. Remediation of Nitrate-Nitrogen Contaminated Groundwater by a Heterotrophic-Autotrophic Denitrification Approach in an Aerobic Environment. Water Air Soil Pollut. 2012, 223, 4029–4038. [Google Scholar] [CrossRef] [Scilit]
- Rivett, M.O.; Buss, S.R.; Morgan, P.; Smith, J.W.N.; Bemment, C.D. Nitrate Attenuation in Groundwater: A Review of Biogeochemical Controlling Processes. Water Res. 2008, 42, 4215–4232. [Google Scholar] [CrossRef] [Scilit] [PubMed]
- Böhlke, J.K.; Wanty, R.; Tuttle, M.; Delin, G.; Landon, M. Denitrification in the Recharge Area and Discharge Area of a Transient Agricultural Nitrate Plume in a Glacial Outwash Sand Aquifer, Minnesota. Water Resour. Res. 2002, 38, 10-1–10-26. [Google Scholar] [CrossRef] [Scilit]
- Hiscock, K.M.; Lloyd, J.W.; Lerner, D.N. Review of Natural and Artificial Denitrification of Groundwater. Water Res. 1991, 25, 1099–1111. [Google Scholar] [CrossRef] [Scilit]
- Shuai, P.; Cardenas, M.B.; Knappett, P.S.K.; Bennett, P.C.; Neilson, B.T. Denitrification in the Banks of Fluctuating Rivers: The Effects of River Stage Amplitude, Sediment Hydraulic Conductivity and Dispersivity, and Ambient Groundwater Flow. Water Resour. Res. 2017, 53, 7951–7967. [Google Scholar] [CrossRef] [Scilit]
- Trudell, M.R.; Gillham, R.W.; Cherry, J.A. An In-Situ Study of the Occurrence and Rate of Denitrification in a Shallow Unconfined Sand Aquifer. J. Hydrol. 1986, 83, 251–268. [Google Scholar] [CrossRef] [Scilit]
- Hendry, M.J.; Gillham, R.W.; Cherry, J.A. An Integrated Approach to Hydrogeologic Investigations—A Case History. J. Hydrol. 1983, 63, 211–232. [Google Scholar] [CrossRef] [Scilit]
- Bates, H.K.; Spalding, R.F. Aquifer Denitrification as Interpreted from In Situ Microcosm Experiments. J. Environ. Qual. 1998, 27, 174–182. [Google Scholar] [CrossRef] [Scilit]
- Schipper, L.A.; Barkle, G.F.; Hadfield, J.C.; Vojvodic-Vukovic, M.; Burgess, C.P. Hydraulic Constraints on the Performance of a Groundwater Denitrification Wall for Nitrate Removal from Shallow Groundwater. J. Contam. Hydrol. 2004, 69, 263–279. [Google Scholar] [CrossRef] [Scilit] [PubMed]
- Kolbjørn Jensen, J.; Engesgaard, P.; Johnsen, A.R.; Marti, V.; Nilsson, B. Hydrological Mediated Denitrification in Groundwater below a Seasonal Flooded Restored Riparian Zone. Water Resour. Res. 2017, 53, 2074–2094. [Google Scholar] [CrossRef] [Scilit]
- Hallberg, L.; Hallin, S.; Bieroza, M. Catchment Controls of Denitrification and Nitrous Oxide Production Rates in Headwater Remediated Agricultural Streams. Sci. Total Environ. 2022, 838, 156513. [Google Scholar] [CrossRef] [Scilit]
- Tesoriero, A.J.; Liebscher, H.; Cox, S.E. Mechanism and Rate of Denitrification in an Agricultural Watershed: Electron and Mass Balance along Groundwater Flow Paths. Water Resour. Res. 2000, 36, 1545–1559. [Google Scholar] [CrossRef] [Scilit]
- Saito, M.; Onodera, S. Characteristics of seasonal NO3-N discharge by groundwater in a coastal agricultural catchment. Jpn. J. Limnol. 2009, 70, 141–151. [Google Scholar] [CrossRef] [Scilit]
- Rivas, A.; Singh, R.; Horne, D.J.; Roygard, J.; Matthews, A.; Hedley, M.J. Contrasting Subsurface Denitrification Characteristics under Temperate Pasture Lands and Its Implications for Nutrient Management in Agricultural Catchments. J. Environ. Manag. 2020, 272, 111067. [Google Scholar] [CrossRef] [Scilit] [PubMed]
- Onodera, S.-I.; Saito, M.; Hayashi, M.; Sawano, M. Nutrient Dynamics with Groundwater–Seawater Interactions in a Beach Slope of a Steep Island, Western Japan. In A New Focus on Groundwater–Seawater Interactions (Proceedings of Symposium HS1001 at IUGG2007, Perugia, July 2007); IAHS Publication; IAHS Press: Wallingford, UK, 2007; pp. 150–158. [Google Scholar]
- Saito, M.; Onodera, S.-I.; Sawano, M. Effect of Surface and Groundwater Interaction on Nitrate Reduction Process in a Small Alluvial Fan Catchment, Western Japan. In IAHS-AISI-Groundwater-Surface Water Interaction: Process Understanding, Conceptualization and Modelling (Proceedings of the Symposium HS1002, IUGG2007, Perugia, Italy, July 2007); IAHS Publication No. 321; IAHS Press: Wallingford, UK, 2008; pp. 76–82. [Google Scholar]
- DeSimone, L.A.; Howes, B.L. Denitrification and Nitrogen Transport in a Coastal Aquifer Receiving Wastewater Discharge. Environ. Sci. Technol. 1996, 30, 1152–1162. [Google Scholar] [CrossRef] [Scilit]
- Istok, J.D.; Humphrey, M.D.; Schroth, M.H.; Hyman, M.R.; O’Reilly, K.T. Single-Well, “Push-Pull” Test for In Situ Determination of Microbial Activities. Groundwater 1997, 35, 619–631. [Google Scholar] [CrossRef] [Scilit]
- Addy, K.; Gold, A.; Nowicki, B.; McKenna, J.; Stolt, M.; Groffman, P. Denitrification Capacity in a Subterranean Estuary below a Rhode Island Fringing Salt Marsh. Estuaries 2005, 28, 896–908. [Google Scholar] [CrossRef] [Scilit]
- Boisson, A.; De Anna, P.; Bour, O.; Le Borgne, T.; Labasque, T.; Aquilina, L. Reaction Chain Modeling of Denitrification Reactions during a Push–Pull Test. J. Contam. Hydrol. 2013, 148, 1–11. [Google Scholar] [CrossRef] [Scilit] [PubMed]
- Haggerty, R.; Schroth, M.H.; Istok, J.D. Simplified Method of “Push-Pull” Test Data Analysis for Determining In Situ Reaction Rate Coefficients. Groundwater 1998, 36, 314–324. [Google Scholar] [CrossRef] [Scilit]
- Kruisdijk, E.; Van Breukelen, B.M. Reactive Transport Modelling of Push-Pull Tests: A Versatile Approach to Quantify Aquifer Reactivity. Appl. Geochem. 2021, 131, 104998. [Google Scholar] [CrossRef] [Scilit]
- Paradis, C.J.; McKay, L.D.; Perfect, E.; Istok, J.D.; Hazen, T.C. Push-Pull Tests for Estimating Effective Porosity: Expanded Analytical Solution and in Situ Application. Hydrogeol. J. 2018, 26, 381–393. [Google Scholar] [CrossRef] [Scilit]
- Tomozawa, Y.; Onodera, S.; Saito, M.; Asai, K. Groundwater Dynamics near the Saltwater–Freshwater Interface in an Island of Seto Inland Sea. Water 2023, 15, 1416. [Google Scholar] [CrossRef] [Scilit]
- Japan Meteorological Agency. Download Past Weather Data. Available online: https://www.data.jma.go.jp/risk/obsdl/index.php (accessed on 3 December 2025).
- Dataset|ALOS@EORC. Available online: https://www.eorc.jaxa.jp/ALOS/index_e.htm (accessed on 30 December 2025).
- Saito, M.; Onodera, S. Is Groundwater Flow A Controlling Factor of Denitrification Process? JAHS 2011, 41, 91–101. [Google Scholar] [CrossRef] [Scilit]
- Nozaki, S. Spatial Distributions in Groundwater Discharge on Various Tidal Flats in a Small and Steep Island, Western Japan. Geomate 2021, 20, 66–71. [Google Scholar] [CrossRef] [Scilit]
- Saito, M.; Onodera, S.; Okada, K.; Sawano, M.; Miyaoka, K.; Chen, J.; Taniguchi, M.; Liu, G.; Fukushima, Y. Evaluation of Denitrification Potential in Coastal Groundwater Using Simple in Situ Injection Experiment. In Hydrological Changes and Management from Headwaters to the Ocean (Proceedings of the International Conference HYDROCHANGE 2008, Kyoto, Japan, 1–3 October 2008); Taniguchi, M., Burnett, W.C., Fukushima, Y., Haigh, M., Umezawa, Y., Eds.; IAHS Press: Wallingford, UK, 2009; Volume 331, pp. 653–658. [Google Scholar]
- Saito, M.; Onodera, S.; Asai, K. Mitsuyo Saito Nitrate Attenuation Process with the Groundwater Flow in the Coastal Agricultural Catchments. Ph.D. Thesis, Hiroshima University, Higashihiroshima, Hiroshima, Japan, 2008. [Google Scholar]
- Liu, H.-H.; Birkholzer, J. On the relationship between water flux and hydraulic gradient for unsaturated and saturated clay. J. Hydrol. 2013, 476, 242–247. [Google Scholar] [CrossRef] [Scilit]
- Cook, P. A Guide to Regional Groundwater Flow in Fractured Rock Aquifers; CSIRO Land and Water: Glen Osmond, Australia, 2003; ISBN 978-1-74008-233-4. [Google Scholar]
- Güler, C.; Thyne, G.D.; McCray, J.E.; Turner, K.A. Evaluation of Graphical and Multivariate Statistical Methods for Classification of Water Chemistry Data. Hydrogeol. J. 2002, 10, 455–474. [Google Scholar] [CrossRef] [Scilit]
- Zhang, B.; Han, J.; Liu, J.; Zhao, Y.; Dong, Z.; Jia, W.; Sarukkalige, R.; Fu, G.; Meng, Q.; Wang, Q. Innovative Trend Analysis of Air Temperature and Precipitation in the Jinsha River Basin, China. Water 2020, 12, 3293. [Google Scholar] [CrossRef] [Scilit]
- Dong, Z.; Jia, W.; Sarukkalige, R.; Fu, G.; Meng, Q.; Wang, Q.; Gedefaw, M.; Yan, D.; Wang, H.; Qin, T.; et al. Innovative Trend Analysis of Annual and Seasonal Rainfall Variability in Amhara Regional State, Ethiopia. Atmosphere 2018, 9, 326. [Google Scholar] [CrossRef] [Scilit]
- Wang, D.; Li, P.; Mu, D.; Liu, W.; Chen, Y.; Fida, M. Unveiling the Biogeochemical Mechanism of Nitrate in the Vadose Zone-Groundwater System: Insights from Integrated Microbiology, Isotope Techniques, and Hydrogeochemistry. Sci. Total Environ. 2024, 906, 167481. [Google Scholar] [CrossRef] [Scilit]
- Choi, H.-M.; Lee, J.-Y. Groundwater Contamination and Natural Attenuation Capacity at a Petroleum Spilled Facility in Korea. J. Environ. Sci. 2011, 23, 1650–1659. [Google Scholar] [CrossRef] [Scilit]
- Cameron, S.G.; Schipper, L.A. Nitrate Removal and Hydraulic Performance of Organic Carbon for Use in Denitrification Beds. Ecol. Eng. 2010, 36, 1588–1595. [Google Scholar] [CrossRef] [Scilit]
- Smith, R.L.; Duff, J.H. Denitrification in a Sand and Gravel Aquifer. Appl. Environ. Microbiol. 1988, 54, 1071–1078. [Google Scholar] [CrossRef] [Scilit]
- Schipper, L.A.; Cooper, A.B.; Harfoot, C.G.; Dyck, W.J. Regulators of Denitrification in an Organic Riparian Soil. Soil Biol. Biochem. 1993, 25, 925–933. [Google Scholar] [CrossRef] [Scilit]
- Rivas, A.; Singh, R.; Horne, D.; Roygard, J.; Matthews, A.; Hedley, M. Quantification of Denitrification Rate in Shallow Groundwater Using the Single-Well, Push-Pull Test Technique. J. Contam. Hydrol. 2025, 269, 104500. [Google Scholar] [CrossRef] [Scilit]
- Puckett, L.J.; Zamora, C.; Essaid, H.; Wilson, J.T.; Johnson, H.M.; Brayton, M.J.; Vogel, J.R. Transport and Fate of Nitrate at the Ground-Water/Surface-Water Interface. J. Environ. Qual. 2008, 37, 1034–1050. [Google Scholar] [CrossRef] [Scilit] [PubMed]

Disclaimer/Publisher’s Note: The statements, opinions and data contained in all publications are solely those of the individual author(s) and contributor(s) and not of MDPI and/or the editor(s). MDPI and/or the editor(s) disclaim responsibility for any injury to people or property resulting from any ideas, methods, instructions or products referred to in the content. |
© 2026 by the authors. Licensee MDPI, Basel, Switzerland. This article is an open access article distributed under the terms and conditions of the Creative Commons Attribution (CC BY) license.