


Abstract
The transition toward lower-carbon polyolefin manufacturing requires evaluating whether renewable hydrogen can be used in industrial polypropylene production while maintaining acceptable process operation and product quality. In this study, an industrial gas-phase polypropylene production campaign that used electrolytic hydrogen was assessed using statistical and multivariate analyses. A dataset comprising 1441 process observations and more than 100 laboratory measurements was analyzed to characterize process variability, catalyst-feed stability, fouling behavior, and polypropylene quality. The monitored variables included the H2/C3, triethylaluminum-to-titanium selectivity-control-agent-to-titanium (TEAL/Ti), SCA/Ti, and TEAL/SCA ratios, production rate, reactor pressure, distributor-plate pressure drop, recycle-system variables, and fouling indicators. Product quality was evaluated through melt flow index, xylene solubles, bulk density, and residual catalyst species. Descriptive statistics, temporal analysis of variance, Pearson correlation analysis, and principal component analysis were applied to identify the main sources of operational variability and their relationships with product quality. During the evaluated campaign, the process maintained an average production rate of 30.62 ± 0.69 t h−1, with low variability in the principal catalyst-feed ratios. The polypropylene exhibited an average melt flow index of 2.10 ± 0.11 g/10 min and a xylene-soluble content of 1.19 ± 0.08 wt.%, both within the specifications considered for the commercial grade produced. Temporal analysis of variance identified catalyst ratios, hydrogen utilization, and production rate as the variables with the largest temporal effects, whereas the distributor-plate fouling factor showed comparatively limited variation. The first two principal components explained 58.99% of the total process variance, with hydrogen utilization, catalyst-related variables, reactor pressure, and space–time yield among the dominant contributors. These results provide industrial-scale evidence that electrolytic hydrogen can be integrated into the investigated polypropylene process while maintaining stable operation and specification-compliant product quality during the evaluated period. However, because no parallel or matched campaign using fossil-derived hydrogen was available under the same plant, catalyst, grade, and operating conditions, the present results should not be interpreted as demonstrating full equivalence or direct replacement of conventional hydrogen. Instead, the study establishes an operational baseline and a multivariate monitoring framework for future comparative validation of the use of renewable hydrogen in polyolefin manufacturing.
1. Introduction
Polypropylene is one of the most widely produced thermoplastics because of its mechanical performance, chemical resistance, processability, low density, and competitive cost. It is extensively used in packaging, automotive components, medical products, fibers, household materials, and engineering applications. However, its manufacture remains are linked to fossil-derived raw materials and utilities, including the hydrogen used to regulate polymer molecular weight. Consequently, polyolefin decarbonization requires evaluating lower-carbon hydrogen alternatives under representative industrial conditions. Renewable hydrogen produced via water electrolysis powered by low-carbon electricity has emerged as a potential option to reduce dependence on conventionally supplied hydrogen in chemical and petrochemical manufacturing [1]. Industrial polypropylene is commonly produced using MgCl2-supported Ziegler–Natta catalysts comprising a titanium-based active component, triethylaluminum (TEAL) as a cocatalyst, and internal or external electron donors that regulate catalyst activity, stereoselectivity, and polymer microstructure. Hydrogen acts primarily as a chain-transfer agent by terminating growing polymer chains, promoting the formation of titanium–hydride species, reducing average molecular weight, and increasing melt flow index. Nevertheless, its effect depends on hydrogen concentration, catalyst composition, active-site structure, cocatalyst dosage, donor chemistry, temperature, monomer concentration, and the hydrogen-to-propylene ratio. Previous studies have demonstrated that hydrogen response is more complex than a direct proportional relationship between hydrogen concentration and polymer molecular weight. Chain-transfer efficiency may vary with the kinetic state of the catalyst’s active centers, while catalyst regioselectivity and the distribution of active-site populations influence molecular-weight regulation [2,3]. Hydrogen concentration, external-donor dosage, and polymerization temperature also jointly affect polymerization kinetics, catalyst activity, molecular-weight distribution, and polypropylene microstructure [4]. Active-center counting and kinetic analyses have further shown that hydrogen may modify both the concentration and reactivity of active sites in MgCl2-supported catalysts [5]. Therefore, hydrogen performance must be evaluated for the specific catalyst–donor–cocatalyst system and industrial operating window.
Hydrogen quality is equally important because Ziegler–Natta catalysts and organoaluminum cocatalysts are highly sensitive to moisture, oxygen, carbon monoxide, carbon dioxide, sulfur-containing compounds, oxygenated species, and other polar contaminants. These impurities may consume TEAL, deactivate titanium active sites, alter donor–catalyst interactions, and reduce catalyst activity or stereospecificity [6]. Accordingly, industrial evaluation of electrolytic hydrogen must consider not only nominal purity but also catalyst-feed behavior, hydrogen-response consistency, reactor stability, fouling indicators, production rate, and final polymer quality. Hydrogen also regulates molecular weight in polyethylene and copolymer production, although its kinetic effects differ from those observed in polypropylene. Increasing the H2/C2H4 ratio during ethylene polymerization may reduce the polymerization rate by decreasing the apparent propagation rate constant and altering the active-center population [7]. In ethylene–propylene copolymerization, variations in the comonomer feed ratio can alter the activity and stereochemical contribution of different active-center populations [8]. Consequently, results obtained for polypropylene homopolymerization cannot be transferred directly to polyethylene or copolymer processes without system-specific validation. At the industrial level, renewable- or low-carbon-hydrogen initiatives in the polyolefin sector have focused mainly on integrated-site decarbonization. Current projects incorporate hydrogen-based energy and carbon management strategies into ethylene and polyethylene manufacturing complexes or propose renewable hydrogen production via electrolysis and pipeline supply to adjacent petrochemical facilities [9,10]. However, these initiatives primarily address cracker furnaces, utilities, steam generation, energy integration, and site-wide emissions. They do not provide direct public validation of the use of renewable electrolytic hydrogen as a molecular-weight-regulating reagent in commercial polypropylene, polyethylene, or copolymerization reactors. Although laboratory and pilot-scale investigations have established relationships among hydrogen concentration, chain-transfer kinetics, catalyst activity, donor chemistry, active-site distribution, molecular weight, and polymer stereoregularity, publicly available evidence from full-scale commercial polymerization units remains limited. Industrial datasets simultaneously describing hydrogen utilization, catalyst-feed ratios, reactor pressure, recycle-system behavior, fouling indicators, production rate, and resin quality are particularly scarce because this information is generally proprietary.
The present study evaluates a commercial gas-phase polypropylene production campaign conducted with high-purity electrolytic hydrogen in a UNIPOL® fluidized-bed process technology licensed by W. R. Grace & Co.-Conn. (Columbia, MD, USA), a commercial fourth- or fifth-generation MgCl2-supported Ziegler–Natta catalyst supplied by W. R. Grace & Co.-Conn. (Columbia, MD, USA), using a fourth- or fifth-generation MgCl2-supported Ziegler–Natta catalyst supplied by W. R. Grace & Co.-Conn. (Columbia, MD, USA), triethylaluminum TEAL, and an alkoxysilane-based external donor. The database comprised 425 consecutive production intervals and 1.441 valid process observations after data-quality screening. Quality-control measurements included melt flow index, xylene-soluble fraction, polymer density, bulk density, and residual catalyst-related elements. Descriptive statistics, temporal variability analysis, Pearson correlation analysis, autocorrelation diagnostics, and principal component analysis were used to characterize hydrogen utilization, catalyst feed behavior, reactor operation, fouling, production rate, and polypropylene quality. The objective was to establish an industrial operational baseline and determine whether stable operation and specification-compliant product quality were maintained during the use of electrolytic hydrogen. Because no matched fossil-hydrogen campaign was available under identical plant, catalyst, grade, and operating conditions, the study was not designed to demonstrate complete replacement or direct equivalence. Instead, it provides industrial evidence for future controlled comparisons and monitoring strategies for lower-carbon polyolefin manufacturing.
2. Materials and Methods
2.1. Industrial Polypropylene Production Unit
Polypropylene was manufactured in a full-scale commercial plant using UNIPOL® gas-phase fluidized-bed polymerization technology. The process was operated in a continuous fluidized-bed reactor within the conventional industrial ranges of 65–85 °C and 20–40 bar, depending on the polypropylene grade and the corresponding production recipe. Propylene was continuously fed to the reactor and polymerized using a commercial fourth-/fifth-generation MgCl2-supported Ziegler–Natta catalyst system. Triethylaluminum (TEAL) was employed as the cocatalyst and catalyst activator. In contrast, an alkoxysilane-based external electron donor was used as the selectivity-control agent to regulate stereoselectivity and the polymer microstructure. The exact catalyst formulation and proprietary operating setpoints are protected by industrial confidentiality; however, the catalyst family, reactor configuration, operating ranges, and control strategy are summarized in Table S1. Hydrogen was continuously introduced as the molecular-weight-regulating chain-transfer agent. The hydrogen dosing point was located upstream of the gas-phase polymerization reactor, allowing the gas to be incorporated into the recycle-gas stream before entering the fluidized bed. Hydrogen addition was adjusted to match the targeted polypropylene grade, particularly the required melt flow index and molecular weight distribution. The hydrogen flow was measured using an industrial mass-flow measurement system and regulated automatically through a proportional–integral–derivative control loop integrated into the plant distributed control system. The H2/C3 ratio was continuously monitored and adjusted in accordance with the active production recipe and resin-quality requirements. Process variables were recorded continuously by the plant historian and distributed control system (DCS) throughout the production campaign.
In this study, the term “electrolytic hydrogen” refers specifically to hydrogen produced through water electrolysis. The term “renewable hydrogen” is used only when the electricity supplied to the electrolyzer originates from verified renewable energy sources. “Green hydrogen” is used as a conventional shorthand for renewable electrolytic hydrogen and does not refer to a different chemical form of hydrogen. To avoid ambiguity, the term “electrolytic hydrogen” is used throughout the manuscript when referring specifically to the hydrogen production route. The renewable hydrogen evaluated in this investigation was produced by water electrolysis using an industrial electrolyzer installed within the production complex. After generation, hydrogen was handled as a high-pressure compressed gas and supplied to the polypropylene unit through the existing industrial hydrogen distribution network and a dedicated pipeline. This configuration avoided intermediate transport between external facilities and enabled direct integration of electrolytic hydrogen into the polymerization process. The specific electrolyzer manufacturer, exact electrolyzer capacity, and proprietary distribution pressure are subject to industrial confidentiality. Nevertheless, the hydrogen generation route, handling configuration, supply pathway, dosing strategy, and flow-control philosophy are reported in Table S1.
The hydrogen employed was high-purity electrolytic hydrogen, in accordance with the internal quality specifications established for catalytic polypropylene production. Each hydrogen supply was verified through the plant quality-control protocol and the corresponding certificate of analysis before its use in the polymerization unit. The required hydrogen purity was ≥99.999 vol.%, with maximum impurity limits of 2 ppmv O2, 5 ppmv N2, 3 ppmv H2O, 0.1 ppmv CO, 0.5 ppmv CO2, 1 ppmv CH4, 0.004 ppmv total sulfur compounds, and 0.05 ppmv chlorine-containing compounds. The moisture specification corresponded to a dew point of approximately −70 °C. These limits are particularly relevant because oxygen-, sulfur-, carbon monoxide-, moisture-, and halogen-containing species may deactivate the MgCl2-supported Ziegler–Natta catalyst, interfere with TEAL scavenging, or modify the catalyst’s hydrogen response. The complete hydrogen-quality specification is provided in Table S2.
The industrial process was continuously monitored, 24 h per day, over 425 consecutive production intervals. Hydrogen flow control, H2/C3 ratio, catalyst feed ratios, reactor pressure, recycle gas conditions, production rate, and fouling-related variables were recorded retrospectively from the plant historian. Table S1 summarizes the industrial reactor configuration, catalyst system, renewable hydrogen generation and distribution route, dosing location, flow control strategy, and data acquisition procedure. Table S2 presents the quality specifications applied to the electrolytic hydrogen used during the production campaign.
One of the principal strengths of the present investigation is the extensive cumulative industrial operating time represented by the analyzed dataset. Although the study was not designed as a dedicated catalyst lifetime experiment, the absence of observable long-term operational deterioration throughout 9145.8 h of evaluated industrial operation provides indirect evidence supporting the compatibility of renewable electrolytic hydrogen with the commercial UNIPOL® polypropylene process under routine manufacturing conditions.
2.2. Data Preprocessing and Quality Assurance
Process data were extracted directly from the plant historian and distributed control system (DCS). A total of 1441 industrial observations were collected during the evaluated production campaign. The monitored variables included: H2/C3 ratio, TEAL/Ti ratio, SCA/Ti ratio, TEAL/SCA ratio, production rate, reactor pressure, distributor-plate differential pressure, compressor differential pressure, cooler differential pressure, Compressor power consumption, plate fouling factor, Cooler fouling factor, and space-time yield. Before statistical analysis, data were screened for obvious acquisition errors and instrument faults. Missing values and non-representative operational disturbances were excluded from the final dataset. The industrial database underwent a quality-control and consistency-verification procedure. Records with incomplete information for one or more of the variables included in the multivariate analyses were excluded, as principal component analysis (PCA) requires complete observation vectors for reliable model construction. Furthermore, operational records associated with unrepresentative process conditions, such as abnormal disturbances due to instrumentation failures, temporary communication losses between the distributed control system (DCS) and the data historian, maintenance activities, or other exceptional events that do not represent normal business operations, were excluded from the final analytical dataset. The data-screening procedure was performed before any statistical analysis and independently of the process outcomes to avoid selection bias. Only validated observations obtained under routine industrial operating conditions and presenting complete synchronization between process variables and laboratory quality measurements were retained for subsequent correlation analysis and principal component analysis (PCA). This preprocessing step was intended exclusively to improve data consistency and reliability and did not involve removing observations based on their influence on the statistical results.
2.3. Polypropylene Quality Characterization
Polypropylene quality was evaluated through routine industrial laboratory analyses performed during the investigated production campaign. The properties analyzed included melt flow index (MFI), xylene-soluble fraction (XS), polymer density, bulk density, and residual catalyst-related elements, specifically titanium, aluminum, and chlorine. The analytical standards, test conditions, reporting units, and numbers of measurements collected and retained after quality-control screening are summarized in Table 1. MFI was determined using an extrusion plastometer according to ASTM D1238, Procedure A [11], at 230 °C under a nominal load of 2.16 kg, and was reported as grams of polymer extruded per 10 min. Of the 102 measurements initially collected, 97 were retained for statistical analysis. MFI was used as the principal industrial indicator of molecular-weight control and hydrogen response. The XS fraction was determined gravimetrically in accordance with ASTM D5492 [12], which is technically equivalent to ISO 16152 [13]. A known mass of polypropylene was dissolved in xylene under reflux, cooled, and maintained at 25 °C to precipitate the insoluble fraction. The polymer remaining in the liquid phase was recovered gravimetrically. Of the 87 measurements collected, 82 were retained. XS was used as an operational indicator of the amorphous and low-stereoregularity polymer fraction. Polymer density was determined according to ASTM D1505 using a calibrated density-gradient column [14]. Prepared polypropylene specimens were introduced into the liquid-density gradient, and their equilibrium positions were compared with certified density standards. Results were reported in g cm−3, and 97 valid measurements were included in the statistical analysis. Polymer density was determined according to ASTM D1505 using a calibrated density-gradient column [14]. Prepared polypropylene specimens were introduced into the liquid-density gradient, and their equilibrium positions were compared with certified density standards. Results were reported in g cm−3, and 97 valid measurements were included in the statistical analysis. Polymer density represents the intrinsic mass-to-volume relationship of the solid polymer phase and is distinguished from bulk density, which additionally depends on particle morphology and packing. Bulk density was determined according to ASTM D1895, Method A [15], by allowing polypropylene particles to flow freely through a standardized funnel into a calibrated receiving cup. Excess material was removed without compaction, and density was calculated from the measured mass and cup volume. Fourteen measurements were obtained and reported in g cm−3. Residual titanium and aluminum were quantified by wavelength-dispersive X-ray fluorescence spectrometry following the general procedure established in ASTM D6247 [16] for elemental analysis of polyolefins. Homogeneous polypropylene specimens were analyzed using matrix-matched calibration standards, and concentrations were determined from the characteristic emission lines after background and spectral-interference correction. Results were expressed as mg kg−1, numerically equivalent to ppm by mass, with ten measurements performed for each element. Residual chlorine was quantified using a validated internal wavelength-dispersive X-ray fluorescence method for polypropylene matrices. Samples were prepared under the same conditions used for titanium and aluminum, and chlorine was determined using an instrument-specific calibration based on matrix-matched polypropylene standards. Background correction, calibration verification, and routine quality-control criteria were applied, and ten valid measurements were included. Titanium was associated primarily with the supported Ziegler–Natta catalyst, aluminum with the TEAL cocatalyst, and chlorine with the MgCl2-/TiCl4-based catalyst system.
Table 1.
Summary of the analyzed properties, including their measurement units and the number of observations collected for each variable. The dataset comprises melt flow index (MFI), xylene solubles (XSs), titanium residue (Ti), aluminum residue (Al), chlorine residue (Cl), bulk density, and average particle size (APS).
Before statistical analysis, the quality dataset was screened using the same predefined data quality criteria applied to the process variables. Five MFI and five XS records were excluded because they contained incomplete analytical information or could not be reliably matched with valid industrial production intervals. Consequently, 97 MFI and 82 XS measurements were retained for statistical analysis. No observation was excluded solely because of its numerical magnitude, and all retained results satisfied the acceptance criteria established by the industrial quality-control laboratory.
2.4. Descriptive Statistical Analysis
Descriptive statistics were calculated for all process and quality variables. The following parameters were determined: mean, standard deviation, and relative standard deviation (RSD). The RSD was calculated according to the following:
where SD is the standard deviation, and is the arithmetic mean.
2.5. Temporal Variability Analysis
Temporal variability in the principal process variables was evaluated using a one-way analysis of variance (ANOVA). The 1.441 time-resolved observations were arranged chronologically according to their original distributed control system timestamps and associated with 425 consecutive production intervals identified in the plant historian. Each interval represented a continuous period of routine commercial operation corresponding to the active production recipe and the prevailing process-control conditions. The same interval classification was applied consistently to all process variables. The ANOVA was used to quantify variability among the defined production intervals. Effect size was calculated using eta-squared (η2):
where is the sum of squares attributable to differences among production intervals and is the total sum of squares.
Effect sizes were classified according to conventional statistical criteria as negligible when η2 < 0.01, small when 0.01 ≤ η2 < 0.06, moderate when 0.06 ≤ η2 < 0.14, and large when η2 ≥ 0.14. A nominal significance level of p < 0.05 was used.
Because serial autocorrelation can reduce the effective number of independent observations and produce artificially small conventional ANOVA p-values, the F-statistics and associated probabilities were interpreted as exploratory measures of temporal variation rather than as confirmatory evidence of independent process shifts. Greater emphasis was placed on η2 as a descriptive measure of the proportion of variability distributed among production intervals. The observed temporal differences were not interpreted as causal effects of electrolytic hydrogen because they may also reflect routine process-control actions, catalyst- and donor-feed adjustments, production-rate changes, reactor regulation, residence-time variation, and other operating interventions occurring during the campaign. Accordingly, the conventional ANOVA was used to provide an initial descriptive assessment of temporal process variability. Autocorrelation-aware approaches, including generalized least-squares model with autoregressive residual structures, segmented time-series regression, mixed-effect models, and statistical process-control methods, were considered more appropriate for future confirmatory analyses of the complete industrial time series.
2.6. Correlation Analysis
Relationships between process variables, catalyst ratios, and polypropylene quality parameters were evaluated using Pearson correlation coefficients. The Pearson coefficient was calculated as follows:
Correlation strength was interpreted as follows: weak: |r| < 0.30, moderate: 0.30 ≤ |r| < 0.70, and strong: |r| ≥ 0.70.
2.7. Principal Component Analysis (PCA)
Principal component analysis (PCA) was employed to identify the dominant sources of variability within the industrial polypropylene process. Before PCA, variables were standardized using z-score normalization to eliminate scale effects.
2.8. Data Availability Statement
The raw time-resolved industrial data analyzed in this study were obtained from the plant distributed control system and historian and are subject to confidentiality and proprietary restrictions imposed by the industrial data owner. The complete raw dataset cannot be deposited in a public repository because it contains commercially sensitive information, including production recipes, operating setpoints, catalyst feed strategies, equipment performance indicators, and time-resolved plant records. To support verification of the reported results, processed and de-identified datasets, descriptive summaries, pairwise correlation statistics, confidence intervals, multiple-testing corrections, autocorrelation diagnostics, temporal-variability results, and PCA outputs are provided in the Supplementary Materials. Additional de-identified data or analysis outputs may be made available to qualified researchers upon reasonable request to the corresponding author, subject to approval by the industrial data owner and execution of an appropriate confidentiality agreement.
3. Results and Discussion
3.1. Operational Stability During Industrial Polypropylene Production with Green Hydrogen
The integration of renewable electrolytic hydrogen (GH2) into industrial-scale polypropylene production requires maintaining a delicate balance between reaction kinetics and chemical consistency. The data presented in Table 2 demonstrate that our GH2-based process operates within established industrial windows while achieving superior stability in both production rates and catalyst utilization. Table 2 compares the operational and quality indicators obtained during renewable electrolytic hydrogen operation with values reported in the literature for industrial polypropylene production. The comparison shows that all catalyst ratios, hydrogen utilization levels, and product quality indicators remained within the ranges commonly reported for commercial gas-phase polypropylene processes. This observation is particularly important because it demonstrates that integrating renewable electrolytic hydrogen did not require operating outside conventional industrial windows, supporting its potential as a drop-in alternative to fossil-derived hydrogen. The catalyst system ratios, specifically TEAL/Ti, SCA/Ti, and TEAL/SCA, are the primary determinants of polymer isotacticity and catalyst productivity in Ziegler–Natta systems. The catalyst-ratio values obtained in this work showed strong agreement with those reported for commercial gas-phase polypropylene production. In particular, the TEAL/Ti, SCA/Ti, and TEAL/SCA ratios were located within the lower and intermediate ranges reported by Albeladi et al. and Vittoria et al., indicating that catalyst activation, stereoregulation, and hydrogen response remained comparable to those observed in conventional polypropylene manufacturing. Operating at this optimized lower limit is scientifically advantageous; the literature indicates that high triethylaluminum concentrations can lead to the “over-reduction” of the titanium active sites (Ti3+ to Ti2+), which significantly reduces catalyst activity and performance [11]. Maintaining a lower TEAL/SCA ratio is critical for high stereoselectivity, as the Selectivity Control Agent must effectively displace and coordinate with the active sites to regulate crystallinity. A major concern in “green” transitions is the potential for trace impurities to cause reactor instability or catalyst poisoning. The production rate of 30.62 ± 0.69 t h−1 (relative standard deviation of 2.25%) indicates an exceptionally stable steady state. In industrial polyolefin plants, maintaining an RSD below 3% is a significant challenge due to the high complexity and transient behavior often observed during grade changeovers. Notably, distributor plate pressure drop and fouling indicators remained stable throughout the campaign, providing additional evidence that renewable electrolytic hydrogen integration did not adversely affect reactor operability. See Table 2.
Table 2.
Benchmarking of operational and product-quality indicators for industrial polypropylene production using renewable electrolytic hydrogen and reported reference systems.
The successful operation of the polymerization process throughout the evaluated industrial production intervals indicates that the renewable hydrogen was fully compatible with the commercial UNIPOL® polypropylene technology employed in this study. Since supported Ziegler–Natta catalysts and organoaluminum cocatalysts are highly sensitive to moisture, oxygen, sulfur-containing compounds, carbon monoxide, and carbon dioxide, the stable production performance and the consistent compliance with product quality specifications indirectly support the suitability of the electrolytic hydrogen supplied during the investigated operating period. Although the complete analytical impurity certificate cannot be disclosed due to industrial confidentiality agreements, the hydrogen met the internal acceptance criteria established for routine commercial polypropylene production.
The successful integration of renewable electrolytic hydrogen into an existing commercial UNIPOL® polypropylene process demonstrates that the transition from conventionally supplied hydrogen to renewable hydrogen can be accomplished without requiring modifications to the principal polymerization technology or the industrial operating strategy evaluated in this work. From an industrial perspective, this observation is particularly relevant because hydrogen acts primarily as the molecular-weight regulating chain-transfer agent. Consequently, maintaining stable catalyst performance, reactor operation, and commercial resin quality represents the principal technical requirement for successful industrial implementation.
The benchmarking exercise also provides indirect evidence that renewable electrolytic hydrogen did not introduce measurable deviations in process behavior. Although direct comparisons of production rates, pressure-drop profiles, and fouling indicators are rarely available in the open literature due to their proprietary nature, the simultaneous agreement between catalyst-ratio windows and product-quality specifications strongly suggests that the process remained within conventional industrial operating envelopes throughout the evaluated campaign. See Figure 1.
Figure 1.
Temporal evolution of the principal operational and catalyst-related variables during industrial polypropylene production using renewable electrolytic hydrogen: (A) hydrogen-to-propylene ratio (H2/C3); (B) reactor pressure; (C) reactor temperature-control variable; (D) triethylaluminum-to-titanium ratio (TEAL/Ti); (E) selectivity-control-agent-to-titanium ratio (SCA/Ti); (F) triethylaluminum-to-selectivity-control-agent ratio (TEAL/SCA); (G) production rate; and (H) space–time yield.
3.2. Catalyst System Stability and Performance
Figure 2 presents the temporal evolution of the TEAL/Ti, SCA/Ti, and TEAL/SCA ratios during the evaluated industrial campaign. The horizontal lines represent the respective mean values and descriptive bands corresponding to ±2 and ±3 standard deviations. Visual inspection shows that several observations exceeded the ±2 SD bands across all three ratios. Therefore, the process cannot be described as remaining consistently within ±2 SD throughout the complete monitoring period. These excursions indicate measurable temporal variability in catalyst and donor dosing and may reflect routine control adjustments, short-term operational transitions, or other process disturbances.
Figure 2.
Temporal evolution of (A) TEAL/Ti, (B) SCA/Ti, and (C) TEAL/SCA ratios during industrial polypropylene production under green-hydrogen operation. In each panel, the black line represents the time-resolved observed values, the red horizontal line indicates the corresponding mean, the blue lines represent the mean + 2 standard deviations (SD), and the green line represents the mean − 2 standard deviations (SD).
The TEAL/Ti and SCA/Ti ratios are relevant because variations in cocatalyst and external-donor concentrations may influence catalyst activation, active-site distribution, stereoselectivity, and hydrogen response in MgCl2-supported Ziegler–Natta systems [18]. The TEAL/SCA ratio fluctuated around an average of 2.35, but multiple observations fell outside the ±2 SD reference bands. These deviations should not automatically be interpreted as evidence of loss of catalyst performance because the corresponding polypropylene quality measurements remained within the acceptance criteria applied during the evaluated campaign. Nevertheless, Figure 2 indicates that the catalyst-feed ratios were not statistically constant but varied over time. The observed excursions also prevent the standard-deviation bands from being interpreted as formal statistical process-control limits. Because the DCS observations were collected sequentially and may exhibit temporal autocorrelation, assessment of statistical control would require autocorrelation-adjusted statistical process control (SPC) charts and the application of defined control-chart rules. Accordingly, Figure 2 is used as a descriptive visualization of catalyst-feed variability rather than as confirmatory evidence that all observations remained under statistical control. No persistent unidirectional shift is evident from visual inspection of the three time series; however, the isolated and clustered excursions beyond ±2 SD indicate that short-term changes occurred during the campaign. These variations may be associated with routine catalyst feed regulation, production rate adjustments, recipe management, or other operating interventions. They cannot be attributed specifically to electrolytic hydrogen without a matched reference campaign and an autocorrelation-aware statistical analysis [19,20].
The primary importance of these data lies in decarbonization without loss of performance. Industrial scalability: You have demonstrated that renewable electrolytic hydrogen can be integrated into the polypropylene PP value chain while maintaining a consistent production rate of >30 t/h, addressing a major challenge in industrial decarbonization. Product Consistency: The low variability in catalyst ratios ensures that the resulting polypropylene meets strict “Grade Changeover” and quality standards (such as MFI and xylene solubles), which are often the bottleneck to adopting green feedstocks [21].
3.3. Polypropylene Quality Assessment and Benchmarking
The data presented in Table 3 provide a source-specific benchmark for evaluating the quality of polypropylene obtained during the industrial campaign operated using electrolytic hydrogen. The comparison with the commercial grades Total PPH 3051, Total PP 3281, and PP-FH03 is intended to place the measured properties within commercially relevant ranges. However, because the reference grades were produced under different catalyst systems, reactor configurations, and operating conditions, the comparison should be interpreted as contextual benchmarking rather than evidence of direct equivalence or “drop-in” replacement.
Table 3.
Benchmarking of polypropylene quality parameters against commercial homopolymer polypropylene grades reported in the literature.
The final quality-controlled dataset comprised 97 melt flow index measurements, 82 xylene-soluble measurements, and 97 polymer-density measurements. As shown in Figure 3A, the mean MFI was 2.10 ± 0.11 g/10 min. This value falls within the 1.3–3.4 g/10 min range of the commercial polypropylene grades listed in Table 3. Hydrogen acts as the principal chain-transfer agent in Ziegler–Natta polymerization, and its controlled addition regulates polymer molecular weight and melt-flow behavior. The limited dispersion observed in the MFI measurements therefore indicates consistent molecular-weight control during the evaluated production intervals. This operational consistency is relevant in industrial polypropylene processes, particularly during production transitions and grade-control operations. The measured MFI was close to the value reported for Total PPH 3051 and remained within the range represented by the other commercial reference grades. Nevertheless, this agreement should not be interpreted as evidence of identical processing behavior, as the commercial-grade data were obtained under different production conditions.
Figure 3.
Variability and specification compliance of the polypropylene quality parameters: (A) melt flow index (MFI), (B) xylene-soluble fraction (XS), and (C) polymer density. Purple, green, and red boxes correspond to MFI, XS, and polymer density, respectively. Individual circles represent the measured observations; the horizontal line within each box represents the median, the × symbol indicates the arithmetic mean, and the box boundaries represent the interquartile range. The horizontal limits labeled “Upper spec”, and “Lower spec” indicate the corresponding industrial specification limits. Mean, standard deviation (SD), and number of measurements (n) are reported within each panel.
The xylene-soluble fraction was 1.19 ± 0.08 wt.% based on 82 valid measurements, as shown in Figure 3B. This value was below the 2.0 wt.% reference limit included in Table 3 for the selected commercial homopolymer grades. The relatively low and narrowly distributed XS content indicates that catalyst stereoselectivity and control of the low-stereoregularity polymer fraction were maintained throughout the investigated campaign. This observation is consistent with the expected behavior of modern supported Ziegler–Natta catalyst systems operated with controlled cocatalyst and external-donor ratios. The mean XS value was approximately 40.5% below the 2.0 wt.% comparison limit. However, because no matched fossil-hydrogen campaign was available, the measured XS values cannot by themselves demonstrate that electrolytic and conventional hydrogen produce equivalent stereochemical responses. They indicate only that the polypropylene produced during the evaluated campaign complied with the applicable quality requirements.
The sensitivity of Ziegler–Natta catalysts to polar contaminants is particularly relevant when assessing renewable hydrogen integration. Moisture, oxygenated compounds, sulfur-containing species, and other catalyst poisons may consume TEAL, deactivate titanium active sites, or interfere with donor–catalyst interactions. Consequently, the stable MFI and XS distributions provide indirect evidence that the electrolytic-hydrogen supply did not introduce impurity levels sufficient to cause a detectable deterioration in molecular-weight control or stereoselectivity during the investigated period. This conclusion is limited to the evaluated campaign and does not constitute a direct comparison with fossil-derived hydrogen [22,23]. Residual catalyst-related elements were also quantified in the final polypropylene. Titanium, aluminum, and chlorine concentrations were 1.53 ± 0.10, 39.30 ± 6.24, and 26.90 ± 5.30 ppm, respectively. These values indicate catalyst-, cocatalyst-, and support-related carryover into the polymer product. Residual transition-metal species are relevant because they may contribute to the oxidative degradation of polypropylene during processing or long-term exposure. The measured elemental concentrations met the internal industrial quality control criteria for the evaluated product. However, because equivalent residual-element values were not reported for the commercial grades included in Table 3, no direct quantitative comparison was made. The results instead confirm that catalyst-related residues remained under control during the analyzed campaign, consistent with the performance expected of modern industrial Ziegler–Natta systems. The polymer density determined from 97 valid measurements was 0.900 ± 0.011 g cm−3, as shown in Figure 3C. This value was consistent with the 0.900–0.905 g cm−3 range reported for the commercial polypropylene grades listed in Table 3. Polymer density reflects the intrinsic mass-to-volume relationship of the solid polypropylene phase. It should be distinguished from bulk density, which additionally depends on particle packing and interparticle void volume. The bulk density obtained from 14 measurements was 0.367 ± 0.137 g cm−3, indicating substantial variability relative to its mean. Unlike polymer density, bulk density is strongly affected by particle-size distribution, particle morphology, surface roughness, fines’ content, agglomeration, and packing efficiency. In gas-phase polypropylene production, these characteristics may vary due to catalyst-particle fragmentation, polymer growth around the catalyst support, local fluidization conditions, residence-time variation, and transient production changes. Bulk-density variability may therefore influence powder flowability, pneumatic conveying capacity, storage-volume requirements, reactor discharge behavior, and the mass of polymer transported per unit volume [24].
Despite the relatively large bulk-density dispersion, no progressive increase in distributor plate differential pressure, abnormal plate-fouling behavior, sustained reduction in production rate, or loss of product-quality compliance was detected during the campaign under investigation. The available operational indicators therefore do not suggest that the observed bulk-density variability caused a detectable deterioration in reactor discharge or powder-handling performance. Nevertheless, this interpretation should be approached with caution because only 14 bulk-density measurements were available. Additional measurements of particle-size distribution, fines’ content, morphology, and flowability would be required to identify the physical origin and long-term operational significance of this variability.
The bulk density obtained during the evaluated campaign was 0.367 ± 0.137 g cm−3, indicating substantial variability among the 14 analyzed samples. Unlike intrinsic polymer density, bulk density is strongly influenced by particle-size distribution, particle morphology, surface roughness, fines content, agglomeration, and the interparticle void fraction. In gas-phase polypropylene production, these characteristics may vary due to catalyst-particle fragmentation, polymer growth around the catalyst support, local fluidization conditions, and transient changes in reactor residence time or production rate. Therefore, the observed dispersion should not be interpreted directly as a change in the chemical composition or intrinsic density of the polypropylene [25,26,27,28].
From an operational perspective, large variations in bulk density may affect powder flowability, pneumatic conveying capacity, storage volume requirements, reactor discharge behavior, and the mass of polymer transported per unit volume. Lower-density powders generally occupy a larger volume and may exhibit less efficient packing. In contrast, samples with a higher fines content or irregular particle morphology may show greater susceptibility to segregation, entrainment, or unstable discharge. Nevertheless, during the investigated campaign, no progressive increase in distributor-plate differential pressure, abnormal plate-fouling behavior, sustained reduction in production rate, or loss of product-quality compliance was observed [29]. Thus, the available process indicators do not provide evidence that the observed bulk-density variability caused a detectable deterioration in reactor discharge, powder handling, or overall process stability under the evaluated conditions. The interpretation of this parameter should nevertheless be cautious, as bulk density was determined from only 14 samples, considerably fewer than the number of measurements available for melt flow index, xylene solubles, and polymer density. The relatively limited sampling frequency may have increased the influence of individual production intervals on the calculated standard deviation. Additional measurements of particle-size distribution, fines’ content, morphology, and powder-flow properties would be required to determine the specific physical origin of the bulk-density variability and its long-term implications for solids handling [30,31,32].
3.4. Correlation Analysis Between Process Variables and Product Quality
The correlation matrix reveals several key statistically significant relationships that define the operational landscape of GH2-based production. The most prominent correlation observed is between the H2/C3 ratio and melt flow index (r = 0.89, p < 0.01). This strong positive correlation confirms that green hydrogen retains its primary industrial role as a highly efficient chain-transfer agent. In ZN polymerization, hydrogen atoms terminate the growing polymer chain via chain transfer, thereby directly regulating molecular weight and, consequently, MFI [33,34,35,36]. This value aligns with industrial benchmarks, in which H2 concentration is the primary lever for MFI control. In contrast to processes using “green” monomers that may contain poisoning impurities such as furan, which can disrupt chain-transfer kinetics, the high r = 0.89 indicates that GH2 provides performance consistent with conventional hydrogen-based polypropylene production. The relationship between the co-catalyst (TEAL/Ti) and xylene solubles (r = −0.67) is particularly revealing. Traditionally, an increase in TEAL can lead to the “over-reduction” of the titanium active sites (Ti3+ rightarrow Ti2+), which often decreases stereoselectivity and increases atactic content. However, the negative correlation (r = −0.67) suggests that within this specific operational window, the catalyst system is highly optimized. The observed correlation may be associated with the scavenging role traditionally attributed to TEAL in industrial polypropylene production, which helps maintain catalyst activity and process stability until the catalyst poisons the Selectivity Control Agent. The moderate correlation between SCA/Ti and MFI (r = 0.71) suggests that the donor not only regulates stereochemistry but also influences the hydrogen response of the active sites, a phenomenon documented in advanced post-phthalate ZN catalysts. A strong correlation was found between production rate and density (r = 0.80, p < 0.05). This relationship suggests that at higher throughputs (>30 t/h), the reactor achieves a more consolidated steady state, potentially leading to higher crystallinity. This is consistent with industrial findings in which residence time and heat-removal efficiency in the fluidized-bed reactor directly affect the morphology and final density of the polymer granules [33,34].
The use of this Pearson matrix in the context of green hydrogen research offers the following three major scientific advantages: the high correlation coefficients (r > 0.80) for critical quality parameters suggest that conventional process–control relationships remain valid under the evaluated green-hydrogen operating conditions for GH2 operations with minimal recalibration. See Figure 4. The stable relationship between catalyst ratios and XS content (r = −0.67) demonstrates that the GH2 process is resilient. While other studies on “green” feedstocks report chaotic correlations due to variable impurity profiles (10–41% productivity loss), our matrix shows a structured, predictable catalytic environment. Although these correlations were calculated from a limited number of matched process–quality observations (n = 7), they provide preliminary evidence of structured relationships among catalyst ratios, hydrogen utilization, and polypropylene quality. For instance, the interaction between SCA/Ti and MFI (r = 0.71) identifies a secondary control loop that can be used to fine-tune product quality during grade changeovers [35].
Figure 4.
Pearson correlation matrix between process variables, catalyst ratios, and polypropylene quality parameters. Detailed statistical results are provided in Table S3.
3.5. Temporal Variability Assessment Using ANOVA
The one-way ANOVA summarized in Table 4 was used as an exploratory assessment of differences among the predefined production intervals. However, the 1441 distributed control system observations are chronologically ordered measurements from a continuously operating industrial process. Consequently, serial dependence among consecutive observations is expected, and the assumption of independent residuals required by conventional one-way ANOVA cannot be considered fully satisfied. Under these conditions, the conventional F-statistics and associated p-values may overstate the statistical evidence for temporal differences. Therefore, the results in Table 4 are interpreted primarily through their effect sizes as descriptive indicators of between-interval variability rather than as confirmatory tests of independent process shifts. Among the analyzed variables, the TEAL/SCA ratio exhibited the largest descriptive between-interval effect, with η2 = 0.643, followed by production rate, with η2 = 0.561. These values indicate that a substantial fraction of the observed variability in these variables was distributed among the defined production intervals. Nevertheless, they do not demonstrate that TEAL/SCA was the principal active control lever or that changes in production rate were necessarily associated with grade transitions. Such interpretations would require confirmation using the original production records and a statistical model that explicitly accounts for temporal dependence, operating grade, catalyst-feed adjustments, and other relevant covariates. The H2/C3, SCA/Ti, TEAL/Ti, reactor-pressure, compressor, and recycle-system variables also exhibited measurable between-interval effect sizes. These results suggest that hydrogen utilization, catalyst-feed management, reactor conditions, and mechanical variables changed over the course of the campaign. However, the observed temporal variability should not be attributed exclusively to the electrolytic-hydrogen supply [36]. It may also reflect routine process-control actions, changes in throughput, catalyst and donor adjustments, residence-time variation, thermal-control responses, and other normal operating interventions. The plate-fouling factor showed a comparatively small effect size of η2 = 0.009, whereas the cooler-fouling factor exhibited a larger descriptive effect of η2 = 0.190. This difference indicates that the two fouling-related indicators exhibited distinct temporal patterns during the production period evaluated. Nevertheless, the ANOVA does not establish that electrolytic hydrogen prevented polymer accumulation on the distributor plate or caused changes in cooling-system efficiency. Establishing such relationships would require an autocorrelation-adjusted time-series analysis together with a matched reference campaign using conventionally supplied hydrogen. Despite temporal variability in several process variables, the quality-controlled measurements shown in Figure 3 remained within the acceptance criteria for the commercial polypropylene grade produced during the evaluated campaign. The mean melt flow index was 2.10 ± 0.11 g/10 min, the xylene-soluble fraction was 1.19 ± 0.08 wt.%, and the polymer density was 0.900 ± 0.011 g cm−3. These results indicate that specification-compliant product quality was maintained during the analyzed production intervals. However, they should not be interpreted as demonstrating complete process equivalence with fossil-derived hydrogen or as proving that every individual process observation remained statistically controlled [37,38].
Table 4.
Exploratory one-way ANOVA results and eta-squared effect sizes for temporal variability in the industrial process variables.
Accordingly, the conventional ANOVA results provide an initial descriptive overview of temporal process variability but do not independently establish causality, process predictability, or the direct effect of electrolytic hydrogen on reactor stability, fouling, or mechanical performance. Future analyses should apply autocorrelation-aware approaches, such as generalized least-squares models with autoregressive residual structures, segmented time-series regression, mixed-effect models, or statistical process-control methods. These approaches would allow temporal dependence, repeated measurements, and interval-level operational factors to be incorporated explicitly into the statistical evaluation [39].
The analysis included N = 1.441 observations distributed across five temporal groups. The corresponding ANOVA degrees of freedom were four and 1436. Effect sizes were classified as negligible (η2 < 0.01), small (0.01 ≤ η2 < 0.06), moderate (0.06 ≤ η2 < 0.14), and large (η2 ≥ 0.14). Because the observations were chronologically ordered and potentially autocorrelated, the F-statistics and p-values were interpreted as exploratory. The DCS observations represent repeated time-resolved measurements and may exhibit serial autocorrelation. Therefore, conventional F-statistics and p-values are presented for exploratory purposes only, while η2 is interpreted as a descriptive measure of between-interval variability. Confirmatory inference requires an autocorrelation-adjusted time-series or mixed-effects model.
3.6. Multivariate Process Analysis
The PCA score plot in Figure 5 indicates that the first two principal components capture 67.89% of the total process variance (PC1 = 34.56%; PC2 = 33.33%). In complex chemical processes such as industrial polypropylene production, capturing more than two-thirds of the variance across two dimensions provides a useful representation of the dominant operational patterns. This agrees with the application of PCA for monitoring multigrade polypropylene plants, where nonlinear behavior and process noise commonly complicate the interpretation of individual variables. The relatively balanced contributions of PC1 and PC2 indicate that the observed process variability was not governed by a single dominant direction but by at least two comparable multivariate patterns.
Figure 5.
Principal component score plot of industrial polypropylene production during the renewable electrolytic hydrogen campaign. Each red point represents an individual standardized process observation projected onto the PC1–PC2 space. The horizontal and vertical reference lines indicate PC2 = 0 and PC1 = 0, respectively. PC1 and PC2 explain 34.56% and 33.33% of the total variance, respectively, accounting jointly for 67.89%.
The score plot reveals the distribution of the reactor operating states during the GH2 campaign. The high-density cluster located around the central region of the PC1–PC2 space represents the principal operating region of the industrial process. The compact distribution of most observations suggests that the process remained within a relatively well-defined multivariate operating window during electrolytic hydrogen utilization. The elongated trajectory extending across the PC1 axis reflects gradual changes in the combined process variables. Several observations with strongly negative PC2 values represent production intervals with operating conditions that differ from those of the main cluster. However, because the score plot does not explicitly identify the temporal origin of each observation, these points should not be assigned exclusively to grade-changeover, start-up, shutdown, or abnormal-operation periods without confirmation from the corresponding plant records. Figure 6 presents the loading plot and the relationships among the analyzed process variables. In this representation, PC1 explains 54.60% of the modeled variance, whereas PC2 explains 45.40%. The H2 Green/C3 ratio and the temperature-control variables load positively on PC1, indicating that hydrogen utilization and reactor thermal regulation are important contributors to the dominant pattern of variability. This observation is consistent with the established kinetic role of hydrogen as a chain-transfer agent in polypropylene production and with the need to coordinate hydrogen dosing with reactor-temperature control. The SCA/Ti ratio and TEAL/SCA ratio load in opposite directions, particularly along PC2. This reflects different contributions of donor dosage and cocatalyst-to-donor balance to the multivariate catalyst environment. Specifically, the strong negative loading of the TEAL/SCA ratio on PC2 underscores its role in defining the balance between catalyst activation and stereoselectivity. In contrast, the SCA/Ti ratio is positioned in the negative-PC1 and positive-PC2 region, confirming that these catalyst ratios influence the process through different multivariate directions. Variables such as compressor differential pressure, cooler differential pressure, TEAL/Ti ratio, and bed residence time are grouped in the negative-PC1 and negative-PC2 quadrant. This clustering indicates that recycle-gas resistance, solids’ residence behavior, and cocatalyst dosage exhibit related covariance patterns. Conversely, space-time yield, production rate, plate-fouling factor, and calculated cooler duty load positively on PC1 and negatively on PC2, indicating a relationship between production intensity, heat-removal demand, and fouling-related behavior [40].
Figure 6.
PCA loading plot showing the contributions of process and catalyst-related variables to the multivariate variability observed during industrial polypropylene production using renewable electrolytic hydrogen. Red labels identify the analyzed variables, positioned according to their loading coordinates on the PC1–PC2 plane. Variables located in similar directions exhibit similar covariance patterns, whereas variables positioned in opposite directions indicate inverse multivariate relationships. The horizontal and vertical reference lines indicate zero loading on PC2 and PC1, respectively. PC1 and PC2 explain 54.60% and 45.40% of the modeled variance, respectively.
By explaining 54.60% of the variance in the loading representation, PC1 is primarily associated with hydrogen utilization, production intensity, thermal control variables, and recycle system operation. PC2, which explains the remaining 45.40%, differentiates variables associated with reactor pressure and inlet conditions from those related to production rate, fouling behavior, and the TEAL/SCA balance. Unlike studies on green monomers that report unstable reactor behavior due to oxygenated impurities and substantial productivity losses, the present multivariate structure remains organized and interpretable [41,42]. The loading relationships shown in Figure 6 are consistent with the coordinated behavior expected in industrial gas-phase polypropylene production. In particular, the positive projection of the H2/C3 ratio, temperature-control variables, calculated cooler duty, and space-time yield along PC1 reflects the interaction among hydrogen regulation, heat removal, and production intensity. The clear grouping of compressor and cooler differential pressures also provides a basis for developing multivariate soft sensors capable of identifying changes in recycle-gas performance, fouling, or cooling limitations before they significantly affect product quality [43,44].
A summary of the variance explained by the principal components is provided in Table 5.
Table 5.
Principal component analysis summary of industrial polypropylene production data.
Statistical significance of pairwise correlations. In addition to the multivariate analyses, the statistical significance of the principal pairwise Pearson correlation coefficients was evaluated to quantify the observed linear relationships. For each correlation, the number of paired observations (n), the two-sided p-value, and the corresponding 95% confidence interval (95% CI) were calculated using Fisher’s z transformation. Because multiple pairwise comparisons were performed simultaneously, the resulting p-values were adjusted using the Benjamini–Hochberg false discovery rate (FDR) procedure to reduce the probability of false-positive findings. Correlations with adjusted q-values < 0.05 were considered statistically significant. The complete statistical results are provided in the Supplementary Materials (Table S1). The number of observations differed among some pairwise comparisons because certain process variables were only available for specific production campaigns or reactor configurations; therefore, all statistical analyses were performed using pairwise complete observations [43,44].
The present investigation was designed as a retrospective observational study evaluating the industrial implementation of renewable electrolytic hydrogen under routine commercial polypropylene production conditions. Consequently, the study did not include a parallel production campaign using conventionally supplied fossil hydrogen under identical operating conditions. Therefore, the present results should be interpreted as evidence for the operational feasibility of integrating renewable hydrogen rather than as a direct comparative assessment between renewable and fossil hydrogen sources. Future investigations incorporating matched historical datasets or controlled industrial campaigns would enable direct statistical comparisons between the two hydrogen supply strategies. The objective of the present investigation was to evaluate the technical feasibility and operational integration of electrolytically produced renewable hydrogen into a commercial polypropylene manufacturing process. Accordingly, the study was not designed as a life-cycle assessment (LCA) or greenhouse gas accounting investigation, and therefore quantitative estimates of carbon intensity, cradle-to-gate emissions, avoided CO2 emissions, or product carbon footprint were beyond the scope of the available industrial dataset [45,46,47]. The conclusions of the present work should consequently be interpreted in terms of industrial process feasibility rather than quantitative environmental performance. Although renewable hydrogen has the potential to contribute to greenhouse gas emission reductions, depending on the electricity source and hydrogen production pathway, the environmental benefit associated with the current industrial implementation cannot be quantified without a dedicated life-cycle assessment that incorporates hydrogen production, electricity generation, the propylene supply chain, and the overall process boundaries. The primary function of hydrogen in polypropylene polymerization is molecular-weight regulation through chain-transfer reactions rather than direct incorporation into the polymer backbone. The principal contribution of the present study is to provide industrial-scale evidence that high-purity electrolytic hydrogen was integrated into the investigated polypropylene process while acceptable operation and specification-compliant product quality were maintained during the evaluated campaign. However, these results do not establish equivalence, superiority, or complete replacement relative to conventionally supplied hydrogen [48].
4. Conclusions
This study provides an industrial operational assessment of a commercial UNIPOL® gas-phase polypropylene process operated with high-purity electrolytic hydrogen. The analyzed dataset comprised 1441 process observations collected over 425 production intervals, representing 9145.8 h of cumulative industrial operation. During the evaluated campaign, the process maintained an average production rate of 30.62 ± 0.69 t h−1. At the same time, the monitored catalyst-feed ratios, reactor variables, recycle-system indicators, and fouling-related parameters remained within the operating ranges observed for the investigated unit. The final quality-controlled dataset yielded a melt flow index of 2.10 ± 0.11 g/10 min, a xylene-soluble fraction of 1.19 ± 0.08 wt.%, and a polymer density of 0.900 ± 0.011 g cm−3. These values complied with the quality criteria applied to the commercial polypropylene grade produced during the campaign.
The statistical and multivariate analyses identified structured relationships among hydrogen utilization, catalyst-feed management, production intensity, thermal control, reactor conditions, and recycle-system behavior. However, these results should be interpreted as an operational description of the evaluated production period rather than as proof of causal effects attributable exclusively to electrolytic hydrogen. The temporal ANOVA was exploratory because the chronologically ordered DCS observations may exhibit serial dependence, and the correlation results were based on a limited number of matched process–quality measurements. Accordingly, the statistical findings primarily identify potential process relationships that require confirmation using larger synchronized datasets and autocorrelation-aware models. Several limitations define the scope of the present work. The investigation was conducted in a single industrial polypropylene unit and focused on one commercial product grade; therefore, the results cannot be generalized directly to other reactor technologies, catalyst systems, polypropylene grades, polyethylene processes, or olefin copolymerizations. No parallel or matched campaign using conventionally supplied fossil-derived hydrogen was available under identical plant, catalyst, grade, and operating conditions. Consequently, the study does not establish direct equivalence, complete replacement, or superior performance relative to conventional hydrogen. Although the electrolytic hydrogen met the internal purity specifications required for polypropylene production, the complete batch-specific impurity profiles could not be disclosed due to industrial confidentiality. The individual effects of trace moisture, oxygen, nitrogen, carbon oxides, sulfur-containing compounds, oxygenated species, and other contaminants on catalyst performance, therefore, could not be evaluated directly. In addition, the laboratory dataset was smaller than the process dataset, particularly for bulk density and residual catalyst-related elements. The study did not include tensile, flexural, impact, rheological, thermal-aging, or other mechanical property measurements that would permit a more comprehensive assessment of the final resin performance. The cumulative operating period of 9145.8 h provides relevant industrial evidence regarding process behavior over an extended production period. Nevertheless, the study was not designed as a dedicated catalyst-lifetime, corrosion, maintenance, or equipment-durability investigation. Therefore, the absence of progressive deterioration in the monitored variables should be regarded as indirect operational evidence rather than a direct measurement of catalyst or equipment life.
Finally, no life-cycle assessment, greenhouse gas inventory, carbon footprint calculation, or techno-economic analysis was performed. The environmental and economic benefits of the evaluated implementation cannot, therefore, be quantified from the present dataset. Such evaluation would require consideration of electricity origin, electrolyzer efficiency, hydrogen compression and distribution, propylene supply, process energy demand, capital and operating costs, and cradle-to-gate system boundaries. Accordingly, this work should be regarded as an industrial operational baseline showing that specification-compliant polypropylene quality and acceptable process operation were maintained during the defined electrolytic-hydrogen campaign. Future studies should incorporate matched conventional- and renewable-hydrogen campaigns, complete impurity characterization, multiple product grades and industrial units, expanded laboratory sampling, mechanical and rheological testing, dedicated catalyst- and equipment-lifetime monitoring, autocorrelation-adjusted statistical models, and integrated life-cycle and techno-economic assessments before broader conclusions are drawn regarding full process equivalence, long-term robustness, and decarbonization performance.
Supplementary Materials
The following supporting information can be downloaded at: https://www.mdpi.com/article/10.3390/chemengineering10080100/s1, Table S1: Industrial process configuration and green hydrogen supply characteristics; Table S2: Quality specifications high-purity electrolytic hydrogen; Table S3: Statistical significance of the principal pairwise correlations used in the multivariate analyses.
Author Contributions
Conceptualization, J.H.-F. and J.L.-M.; Methodology, J.H.-F. and J.L.-M.; Software, J.H.-F. and J.L.-M.; Validation, J.H.-F. and J.L.-M.; Formal Analysis, J.H.-F. and J.L.-M.; Investigation, J.H.-F. and J.L.-M.; Resources, J.H.-F. and J.L.-M.; Data Curation, J.H.-F. and J.L.-M.; Writing—Original Draft, J.H.-F. and J.L.-M.; Writing—Review and Editing, J.H.-F. and J.L.-M.; Visualization, J.H.-F. and J.L.-M.; Supervision, J.H.-F. and J.L.-M.; Project Administration, J.H.-F. and J.L.-M.; Funding Acquisition, J.H.-F. and J.L.-M. All authors have read and agreed to the published version of the manuscript.
Funding
This research was funded by MCIN/AEI/10.13039/501100011033 through grant PID2023-152869OB-C22.
Data Availability Statement
The original contributions presented in this study are included in the article/Supplementary Materials. Further inquiries can be directed to the corresponding author.
Conflicts of Interest
The authors declare no conflict of interest.
References
- Mallapragada, D.S.; Dvorkin, Y.; Modestino, M.A.; Esposito, D.V.; Smith, W.A.; Hodge, B.-M.; Harold, M.P.; Donnelly, V.M.; Nuz, A.; Bloomquist, C.; et al. Decarbonization of the chemical industry through electrification: Barriers and opportunities. Joule 2023, 7, 23–41. [Google Scholar] [CrossRef] [Scilit]
- Woodall, C.M.; Fan, Z.; Lou, Y.; Bhardwaj, A.; Khatri, A.; Agrawal, M.; McCormick, C.F.; Friedmann, S.J. Technology options and policy design to facilitate decarbonization of chemical manufacturing. Joule 2022, 6, 2474–2499. [Google Scholar] [CrossRef] [Scilit]
- Chung, C.; Kim, J.; Sovacool, B.K.; Griffiths, S.; Bazilian, M.; Yang, M. Decarbonizing the chemical industry: A systematic review of sociotechnical systems, technological innovations, and policy options. Energy Res. Soc. Sci. 2023, 96, 102955. [Google Scholar] [CrossRef] [Scilit]
- Zhen, Z.; Li, B.; Ou, X.; Zhou, S. How hydrogen can decarbonize the chemical industry in China: A review based on the EIC–TER industrial assessment framework. Int. J. Hydrogen Energy 2024, 60, 1345–1358. [Google Scholar] [CrossRef] [Scilit]
- Kloo, Y.; Nilsson, L.J.; Palm, E. Reaching net-zero in the chemical industry—A study of roadmaps for industrial decarbonization. Renew. Sustain. Energy Transit. 2024, 5, 100075. [Google Scholar] [CrossRef] [Scilit]
- Zaiter, I.; Ramadan, M.; Bouabid, A.; Mayyas, A.; El-Fadel, M.; Mezher, T. Enabling industrial decarbonization: Framework for hydrogen integration in industrial energy systems. Renew. Sustain. Energy Rev. 2024, 203, 114782. [Google Scholar] [CrossRef] [Scilit]
- Isella, A.; Manca, D. GHG emissions by (petro)chemical processes and decarbonization priorities—A review. Energies 2022, 15, 7560. [Google Scholar] [CrossRef] [Scilit]
- Griffiths, S.; Sovacool, B.K.; Kim, J.; Bazilian, M.; Uratani, J.M. Decarbonizing the oil refining industry: A systematic review of sociotechnical systems, technological innovations, and policy options. Energy Res. Soc. Sci. 2022, 89, 102542. [Google Scholar] [CrossRef] [Scilit]
- Nurdiawati, A.; Urban, F. Decarbonizing the refinery sector: A socio-technical analysis of advanced biofuels, green hydrogen and carbon capture and storage developments in Sweden. Energy Res. Soc. Sci. 2022, 84, 102358. [Google Scholar] [CrossRef] [Scilit]
- Yao, Y.; Lan, K.; Graedel, T.E.; Rao, N.D. Models for decarbonization in the chemical industry. Annu. Rev. Chem. Biomol. Eng. 2024, 15, 139–161. [Google Scholar] [CrossRef] [PubMed]
- ASTM D1238-23; Standard Test Method for Melt Flow Rates of Thermoplastics by Extrusion Plastometer. ASTM International: West Conshohocken, PA, USA, 2023.
- ASTM D5492-17; Standard Test Method for Determination of Xylene Solubles in Propylene Plastics. ASTM International: West Conshohocken, PA, USA, 2024.
- ISO 16152:2022; Plastics—Determination of Xylene-Soluble Matter in Polypropylene. International Organization for Standardization: Geneva, Switzerland, 2022.
- ASTM D1505-25; Standard Test Method for Density of Plastics by the Density-Gradient Technique. ASTM International: West Conshohocken, PA, USA, 2025.
- ASTM D1895-24; Standard Test Methods for Apparent Density, Bulk Factor, and Pourability of Plastic Materials. ASTM International: West Conshohocken, PA, USA, 2024.
- ASTM D6247-18; Standard Test Method for Determination of Elemental Content of Polyolefins by Wavelength-Dispersive X-Ray Fluorescence Spectrometry. ASTM International: West Conshohocken, PA, USA, 2024.
- Karol, F.J.; Jacobson, F.I. Catalysis and the UNIPOL process. In Catalytic Polymerization of Olefins (Studies in Surface Science and Catalysis); Keii, T., Soga, K., Eds.; Elsevier: Amsterdam, The Netherlands, 1986; Volume 25, pp. 323–337. [Google Scholar]
- Vittoria, A.; Meppelder, A.; Friederichs, N.; Busico, V.; Cipullo, R. Ziegler-Natta catalysts: Regioselectivity and “hydrogen response”. ACS Catal. 2020, 10, 644–651. [Google Scholar] [CrossRef] [Scilit]
- Albeladi, A.; Moman, A.; McKenna, T.F.L. Performance of post phthalate Ziegler-Natta catalysts with activity limiting agents for propylene gas phase polymerization. React. Chem. Eng. 2023, 8, 1684–1699. [Google Scholar] [CrossRef] [Scilit]
- Chadwick, J.C.; Morini, G.; Balbontin, G.; Camurati, I.; Heere, J.J.R.; Mingozzi, I.; Testoni, F. Effects of internal and external donors on the regio- and stereoselectivity of active species in MgCl2-supported catalysts for propene polymerization. Macromol. Chem. Phys. 2001, 202, 1995–2002. [Google Scholar] [CrossRef]
- Gupta, V.; Patil, H.R.; Naik, D.G. Propylene Polymerization Catalyst System. World Patent No. WO 2009/116056A2, 24 September 2009. [Google Scholar]
- TotalEnergies Petrochemicals & Refining USA, Inc. Polypropylene 3281 [Technical Data Sheet]. 2021. Available online: https://polymers.totalenergies.com/sites/g/files/wompnd5016/files/site_collection_documents/Technical%20Datasheets/3281-US.pdf (accessed on 3 March 2026).
- Piovano, A.; Signorile, M.; Braglia, L.; Torelli, P.; Martini, A.; Wada, T.; Takasao, G.; Taniike, T.; Groppo, E. Electronic properties of Ti sites in Ziegler-Natta catalysts. ACS Catal. 2021, 11, 9949–9961. [Google Scholar] [CrossRef] [Scilit]
- Alshaiban, A.; Soares, J.B.P. Effect of varying hydrogen concentration, external donor concentration, and temperature on propylene polymerization kinetics and microstructure of polypropylene made with a 4th generation Ziegler-Natta catalyst. Macromol. React. Eng. 2014, 8, 723–735. [Google Scholar] [CrossRef] [Scilit]
- Tangjituabun, K.; Kim, S.Y.; Hiraoka, Y.; Taniike, T.; Terano, M.; Jongsomjit, B.; Praserthdam, P. Effects of various poisoning compounds on the activity and stereospecificity of heterogeneous Ziegler-Natta catalyst. Sci. Technol. Adv. Mater. 2008, 9, 024402. [Google Scholar] [CrossRef] [Scilit] [PubMed]
- Ho, Y.K.; Shamiri, A.; Mjalli, F.S.; Hussain, M.A. Control of industrial gas phase propylene polymerization in fluidized bed reactors. J. Process Control 2012, 22, 947–958. [Google Scholar] [CrossRef] [Scilit]
- Shamiri, A.; Hussain, M.A.; Mjalli, F.S.; Shafeeyan, M.S.; Mostoufi, N. Experimental and modeling analysis of propylene polymerization in a pilot-scale fluidized bed reactor. Ind. Eng. Chem. Res. 2014, 53, 8694–8705. [Google Scholar] [CrossRef] [Scilit]
- Mori, H.; Hasebe, K.; Terano, M. Variation in oxidation state of titanium species on MgCl2-supported Ziegler catalyst and its correlation with kinetic behavior for propylene polymerization. Polymer 1999, 40, 1389–1394. [Google Scholar] [CrossRef] [Scilit]
- Khare, N.P.; Lucas, B.; Seavey, K.C.; Liu, Y.A.; Sirohi, A.; Ramanathan, S.; Lingard, S.; Song, Y.; Chen, C.-C. Steady-state and dynamic modeling of gas-phase polypropylene processes using stirred-bed reactors. Ind. Eng. Chem. Res. 2004, 43, 884–900. [Google Scholar] [CrossRef] [Scilit]
- Rambhujun, N.; Salman, M.S.; Wang, T.; Pratthana, C.; Sapkota, P.; Costalin, M.; Lai, Q.; Aguey-Zinsou, K.-F. Renewable hydrogen for the chemical industry. MRS Energy Sustain. 2020, 7, E33. [Google Scholar] [CrossRef] [Scilit] [PubMed]
- Kim, M.; Lee, Y.-H.; Han, I.-S.; Han, C. Clustering-based hybrid soft sensor for an industrial polypropylene process with grade changeover operation. Ind. Eng. Chem. Res. 2005, 44, 334–342. [Google Scholar] [CrossRef] [Scilit]
- Kissin, Y.V.; Rishina, L.A.; Vizen, E.I. Hydrogen effects in propylene polymerization reactions with titanium-based Ziegler-Natta catalysts. II. Mechanism of the chain-transfer reaction. J. Polym. Sci. Part A Polym. Chem. 2002, 40, 1899–1911. [Google Scholar] [CrossRef] [Scilit]
- Total Petrochemicals. Polypropylene PPH 3051; Technical data sheet; Total Petrochemicals: Paris La Défense, France, 2013. [Google Scholar]
- LyondellBasell Industries. Catalysts for Production of Polypropylene; Technical brochure; LyondellBasell: Houston, TX, USA, 2025. [Google Scholar]
- Hernández-Fernández, J.; González-Cuello, R.; Ortega-Toro, R. Evaluation of the reactivity of methanol and hydrogen sulfide residues with the Ziegler-Natta catalyst during polypropylene synthesis and its effects on polymer properties. Polymers 2023, 15, 4061. [Google Scholar] [CrossRef] [Scilit] [PubMed]
- Goss, B.G.S.; Nakatani, H.; George, G.A.; Terano, M. Catalyst residue effects on the heterogeneous oxidation of polypropylene. Polym. Degrad. Stab. 2003, 82, 119–126. [Google Scholar] [CrossRef] [Scilit]
- Gahleitner, M.; Resconi, L.; Doshev, P. Heterogeneous Ziegler-Natta, metallocene, and post-metallocene catalysis: Successes and challenges in industrial application. MRS Bull. 2013, 38, 229–233. [Google Scholar] [CrossRef] [Scilit]
- LyondellBasell. Optimized Ziegler-Natta Catalysts for Bulk PP Processes [Technical Brochure]. Available online: https://www.lyondellbasell.com/492c59/globalassets/products-technology/technology/bulk-pp-processes.pdf (accessed on 3 March 2026).
- Saygin, D.; Gielen, D. Zero-emission pathway for the global chemical and petrochemical sector. Energies 2021, 14, 3772. [Google Scholar] [CrossRef] [Scilit]
- Hernández-Fernández, J.; Puello-Polo, E.; Marquez, E. Experimental–density functional theory (DFT) study of the inhibitory effect of furan residues in the Ziegler-Natta catalyst during polypropylene synthesis. Int. J. Mol. Sci. 2023, 24, 14368. [Google Scholar] [CrossRef] [Scilit] [PubMed]
- Hu, J.; Shen, X.; Fu, Z.; Wang, Q.; Fan, Z. Mechanistic study on hydrogen effects in propylene polymerization with MgCl2-supported Ziegler-Natta catalysts: New evidences from active center counting and reaction kinetics. Appl. Catal. A Gen. 2023, 667, 119460. [Google Scholar] [CrossRef] [Scilit]
- Zhang, Z.; Jiang, B.Y.; Zhang, B.; Fu, Z.S.; Fan, Z.Q. Deactivation effect caused by catalyst–cocatalyst pre-contact in propylene polymerization with MgCl2-supported Ziegler-Natta catalyst. Chin. J. Polym. Sci. 2019, 37, 1023–1030. [Google Scholar] [CrossRef] [Scilit]
- Shen, X.R.; Fu, Z.S.; Hu, J.; Wang, Q.; Fan, Z.Q. Mechanism of propylene polymerization with MgCl2-supported Ziegler-Natta catalysts based on counting of active centers: The role of external electron donor. J. Phys. Chem. C 2013, 117, 15174–15182. [Google Scholar] [CrossRef] [Scilit]
- Liu, X.; Zhang, B.; Guo, W.; Jiang, B.; Du, M.; Fu, Z.; Fan, Z. Hydrogen responses of propylene polymerization with MgCl2-supported Ziegler-Natta catalysts in the presence of different silane external donors. Catalysts 2025, 15, 330. [Google Scholar] [CrossRef] [Scilit]
- Bumphenkiattikul, P.; Limtrakul, S.; Vatanatham, T.; Khongprom, P.; Ramachandran, P.A. Heat transfer effect in scaling-up a fluidized bed reactor for propylene polymerization. RSC Adv. 2018, 8, 28293–28312. [Google Scholar] [CrossRef] [Scilit] [PubMed]
- Lou, H.; Su, H.; Xie, L.; Gu, Y.; Rong, G. Inferential model for industrial polypropylene melt index prediction with embedded priori knowledge and delay estimation. Ind. Eng. Chem. Res. 2012, 51, 8510–8525. [Google Scholar] [CrossRef] [Scilit]
- Fernández, J.A.H.; Paternina, K.L.O.; Cano-Cuadro, H. Computational study of catalytic poisoning mechanisms in polypropylene polymerization: The impact of dimethylamine and diethylamine on the deactivation of Ziegler-Natta catalysts and co-catalysts. Polymers 2025, 17, 1834. [Google Scholar] [CrossRef] [Scilit] [PubMed]
- Silva, J.S.; Melo, P.A.; Pinto, J.C. Optimization of grade transitions in bulk poly(propylene) polymerizations. Macromol. React. Eng. 2023, 17, 2300001. [Google Scholar] [CrossRef] [Scilit]
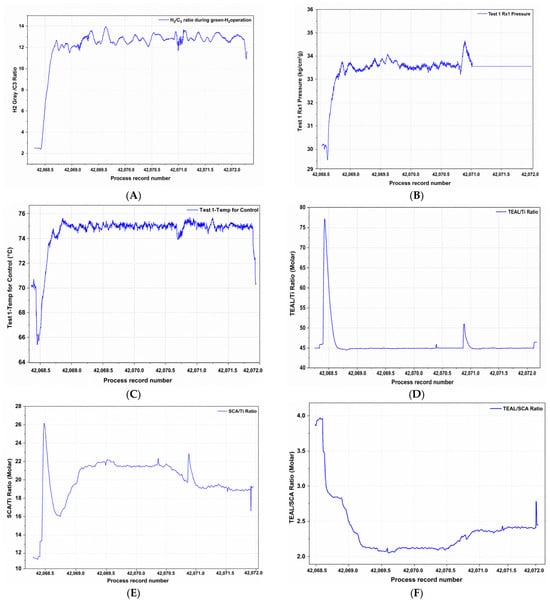
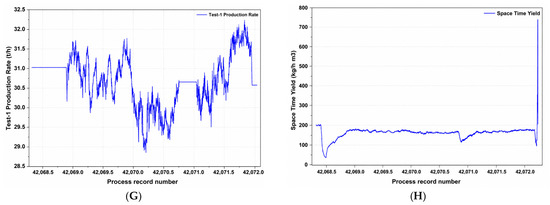
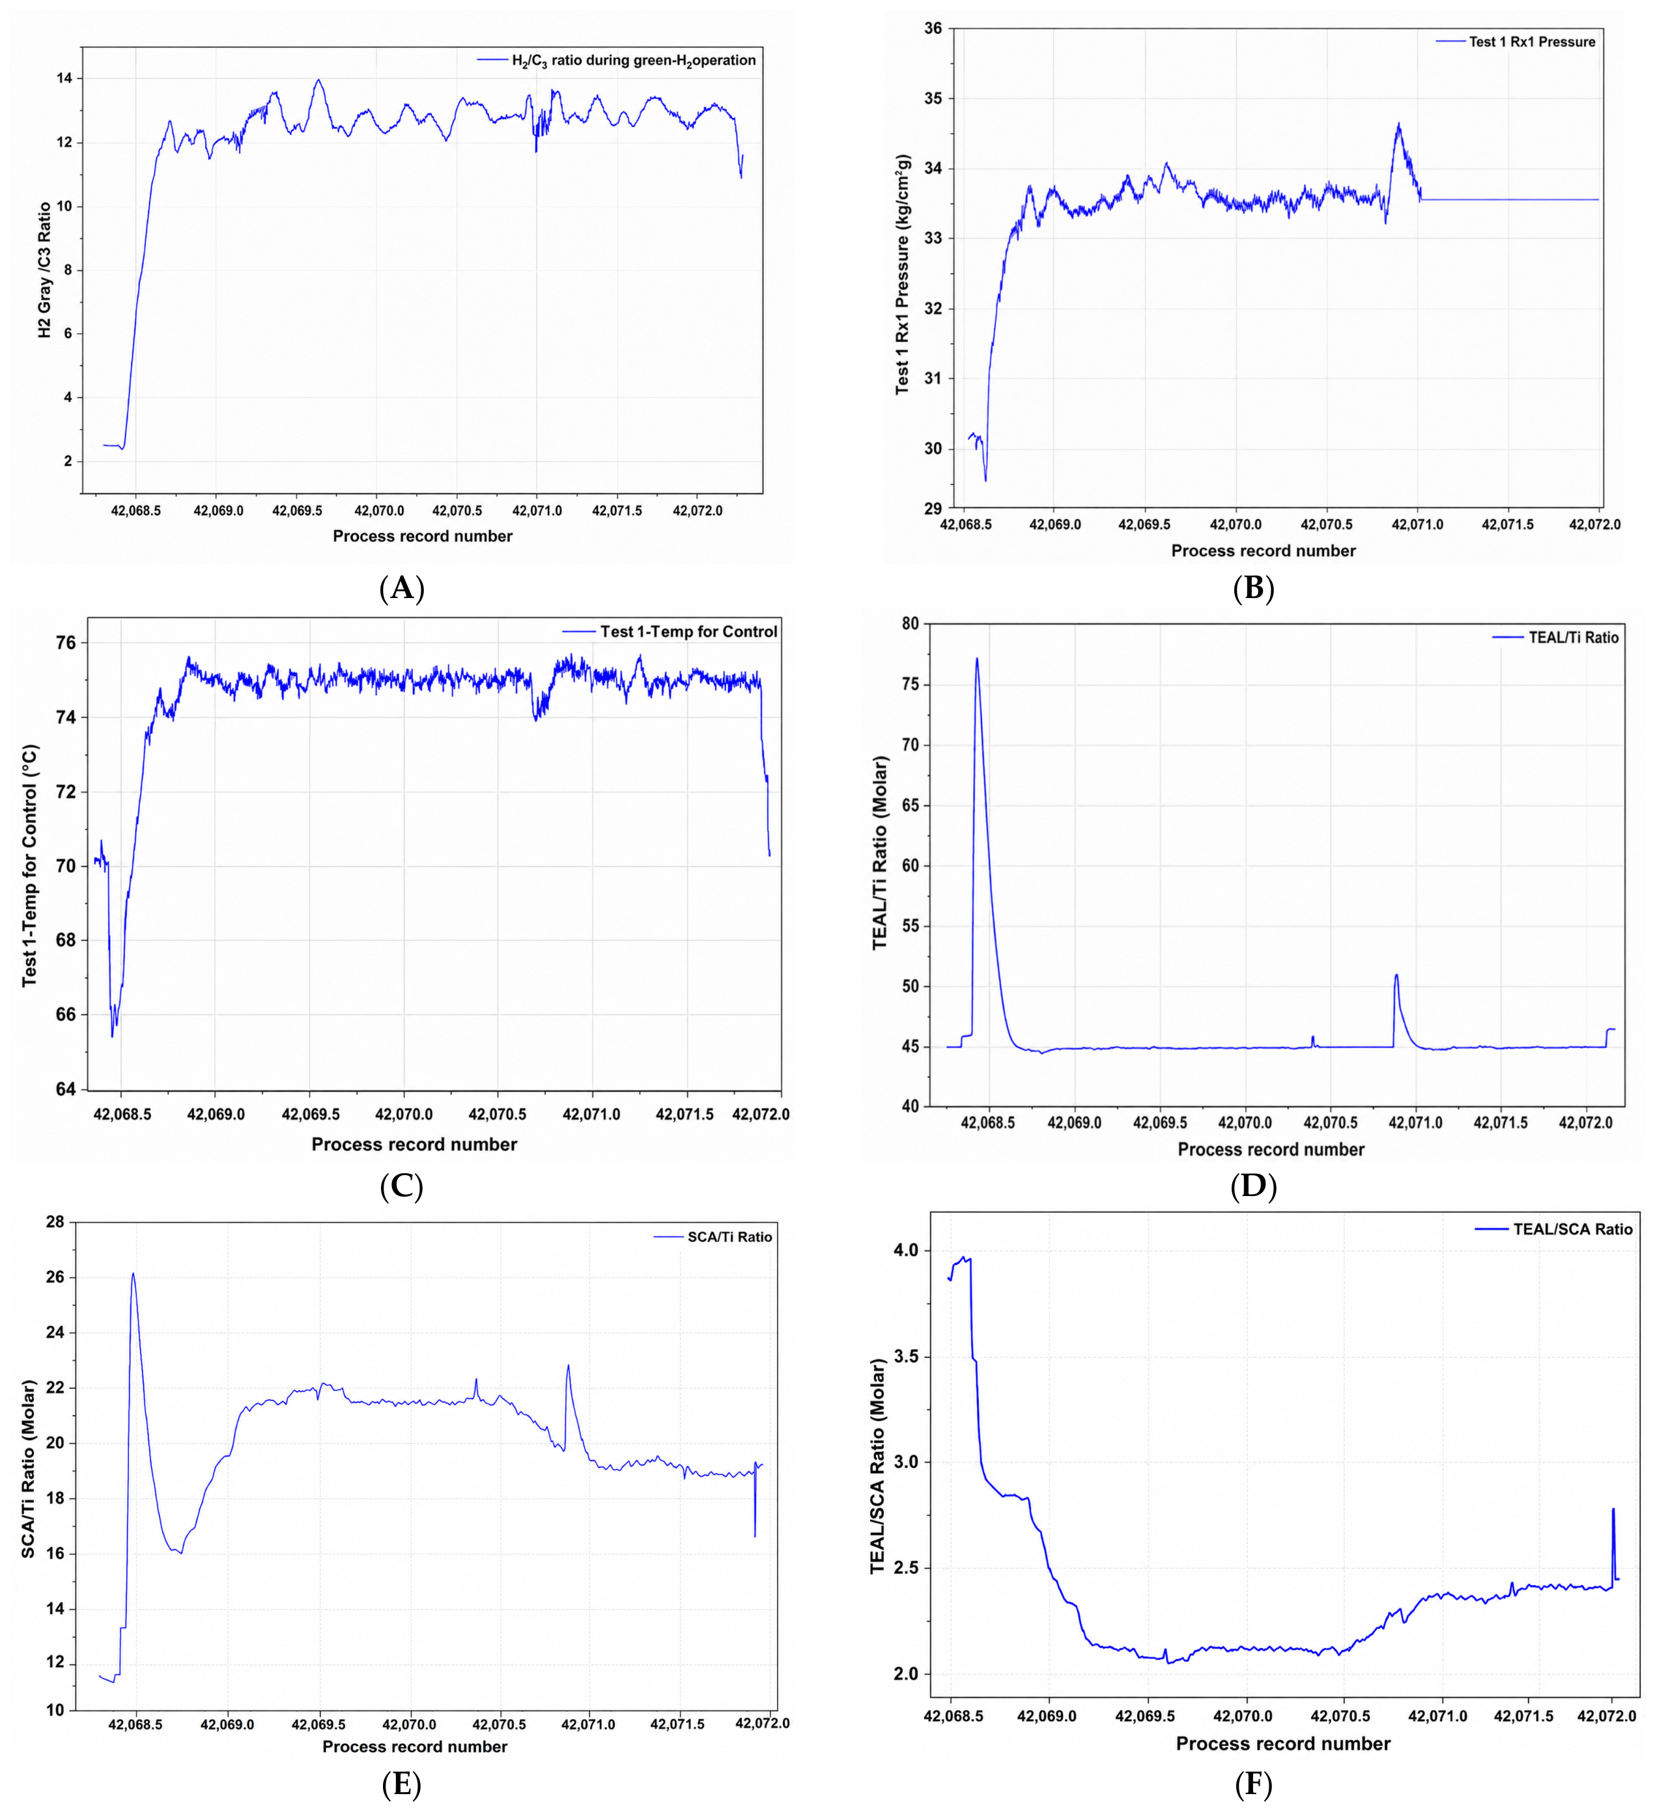
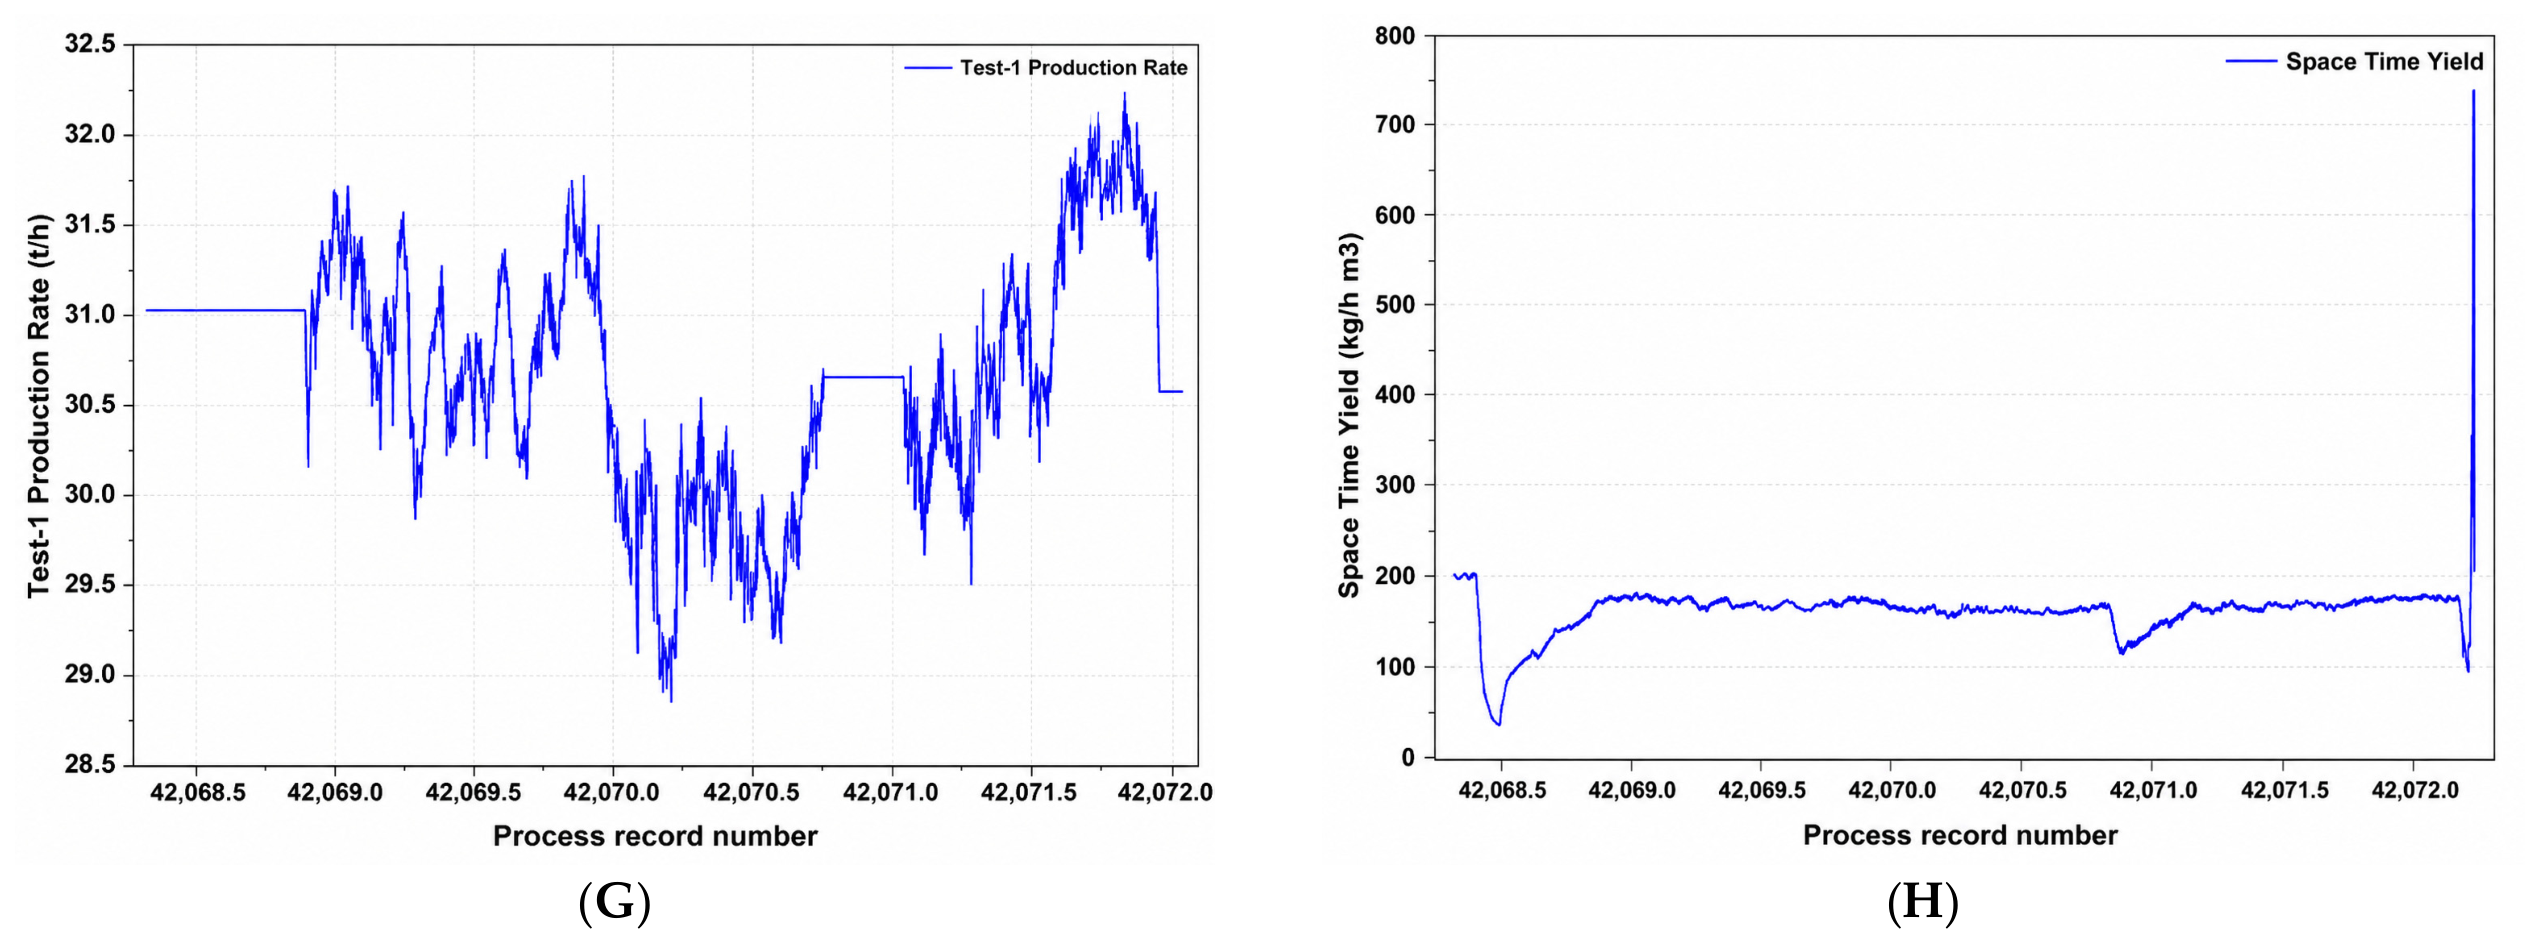
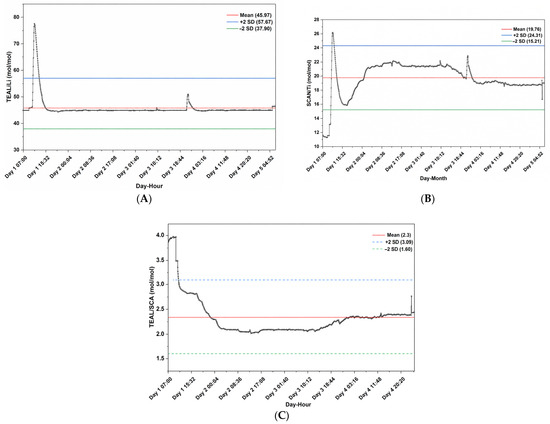
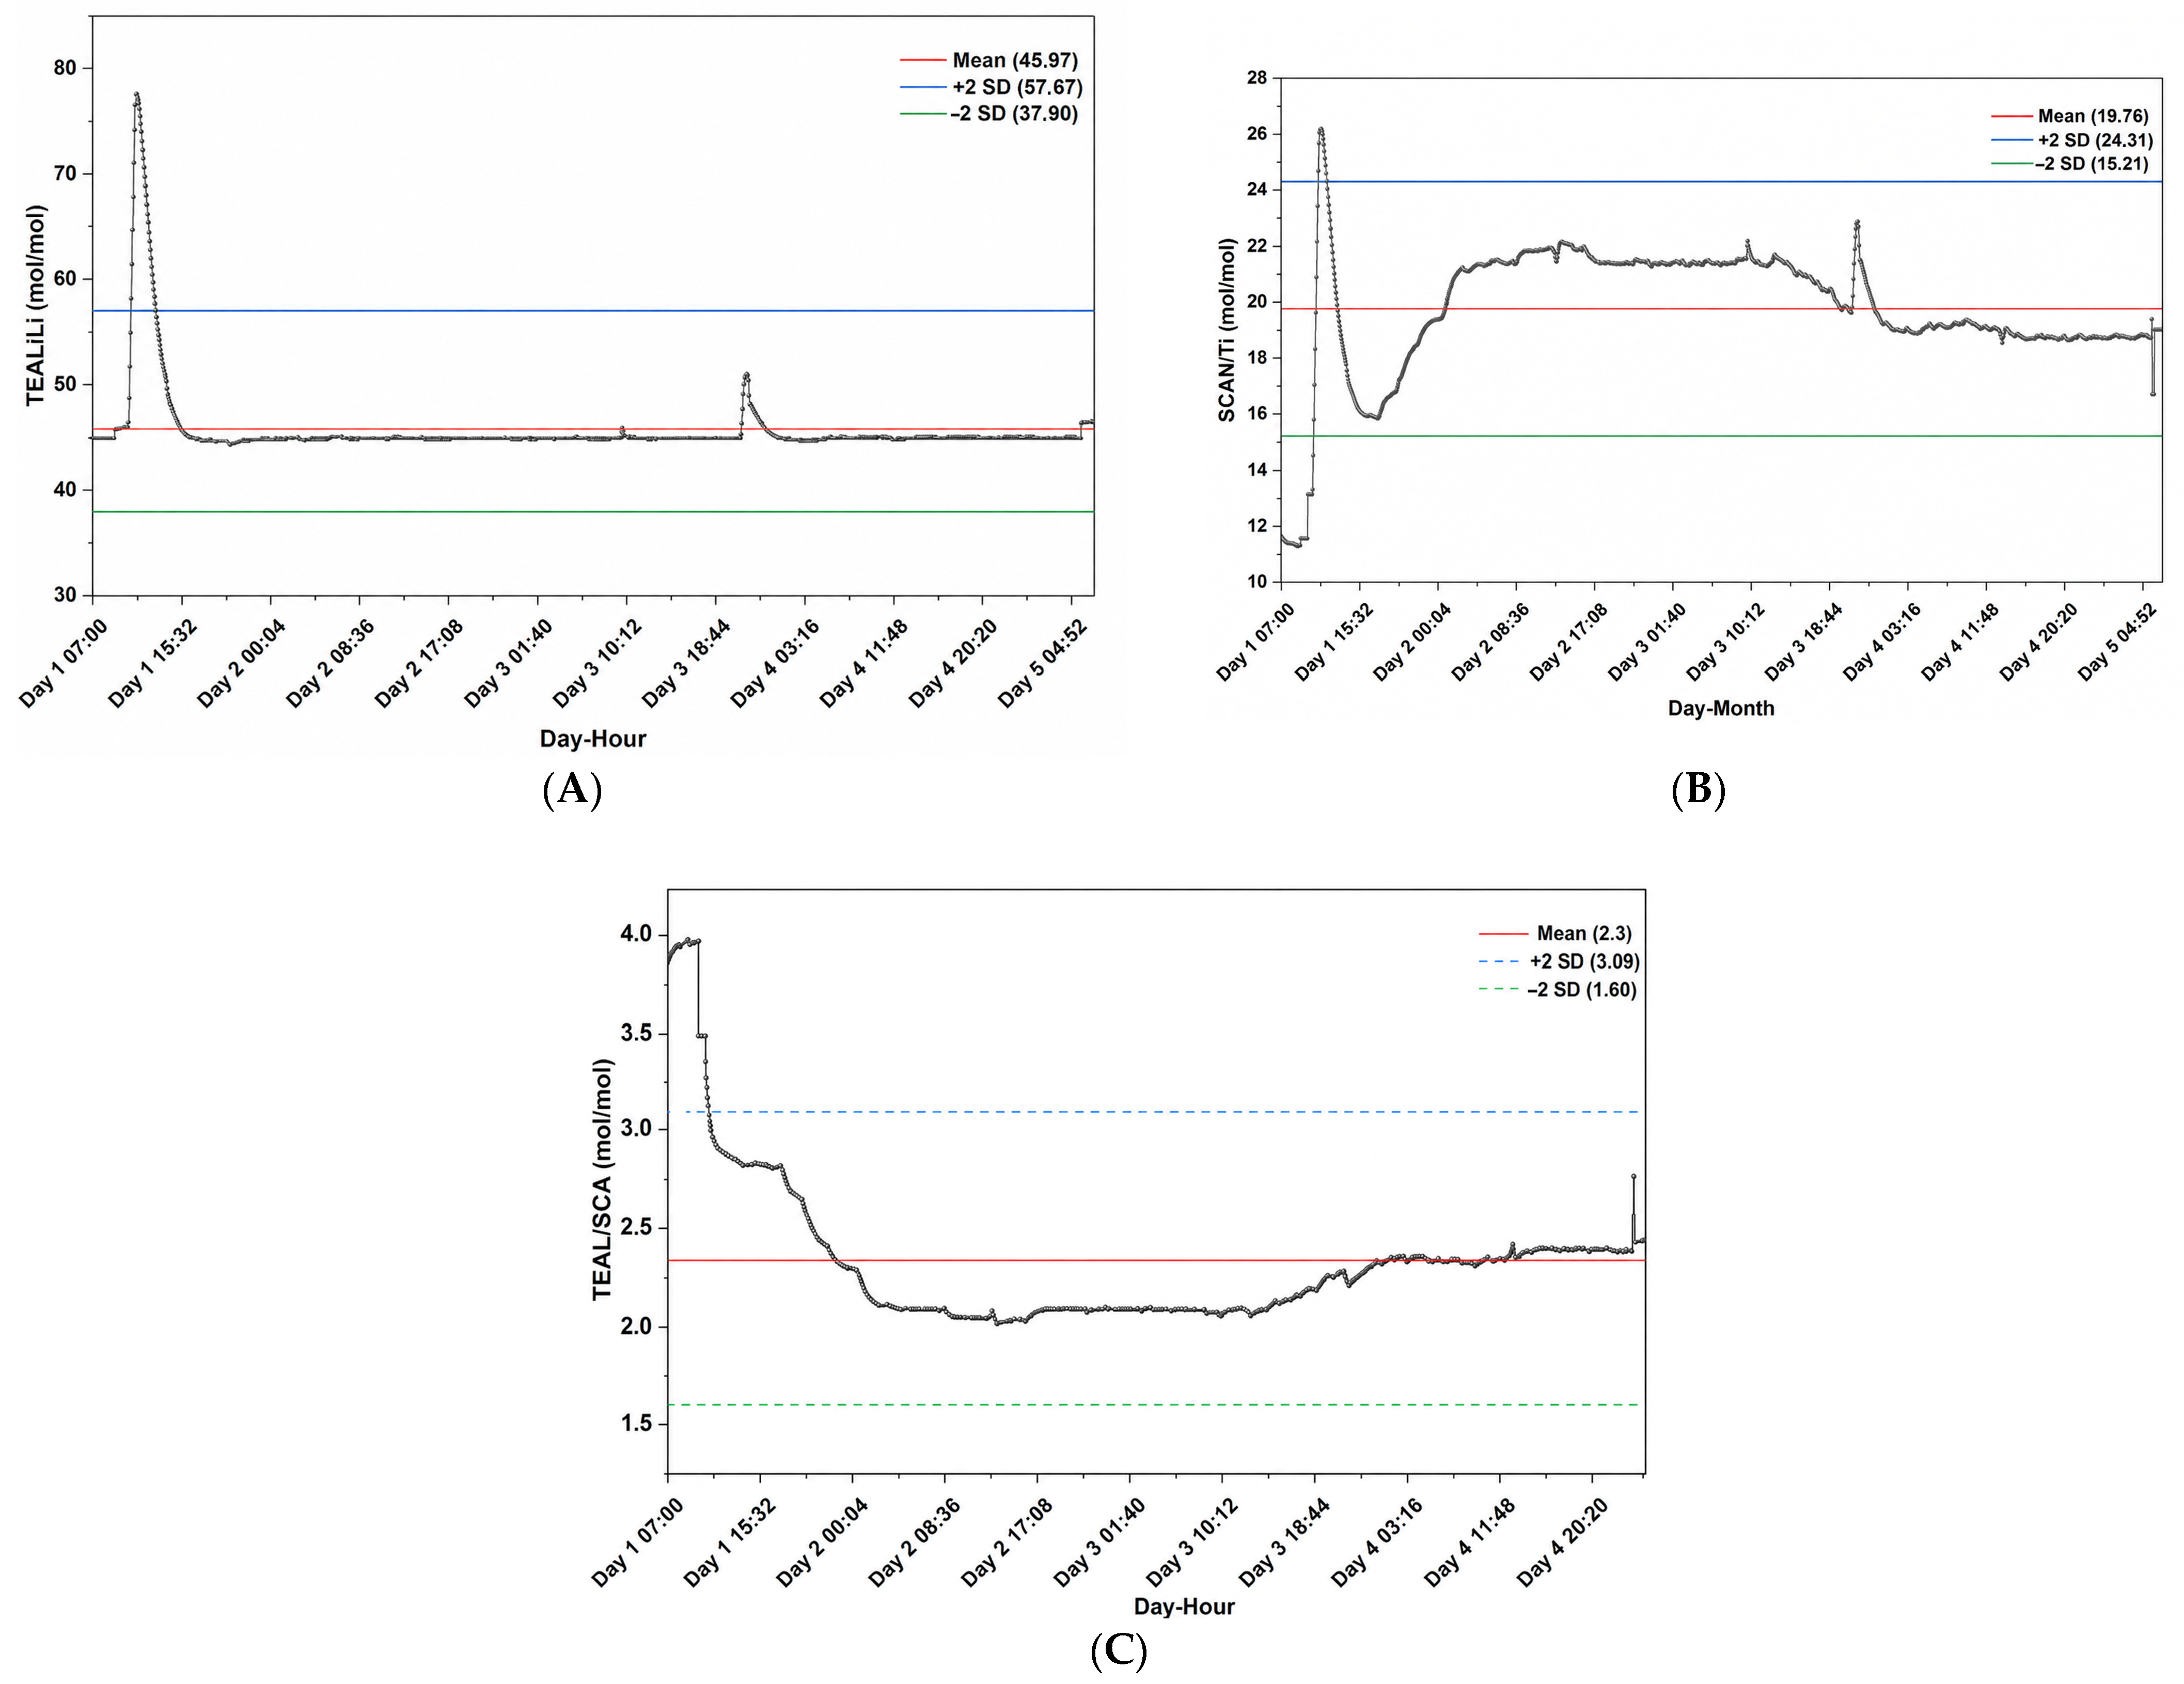
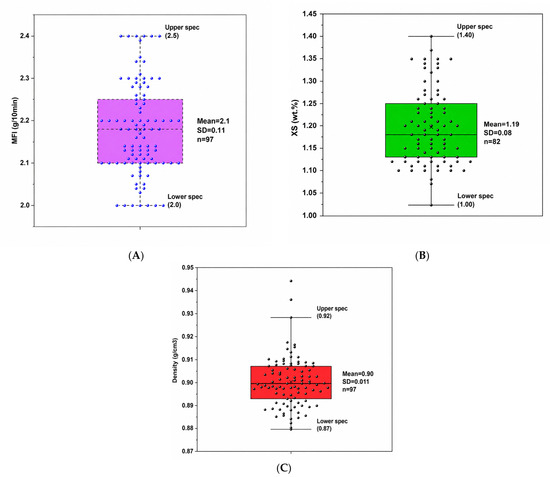
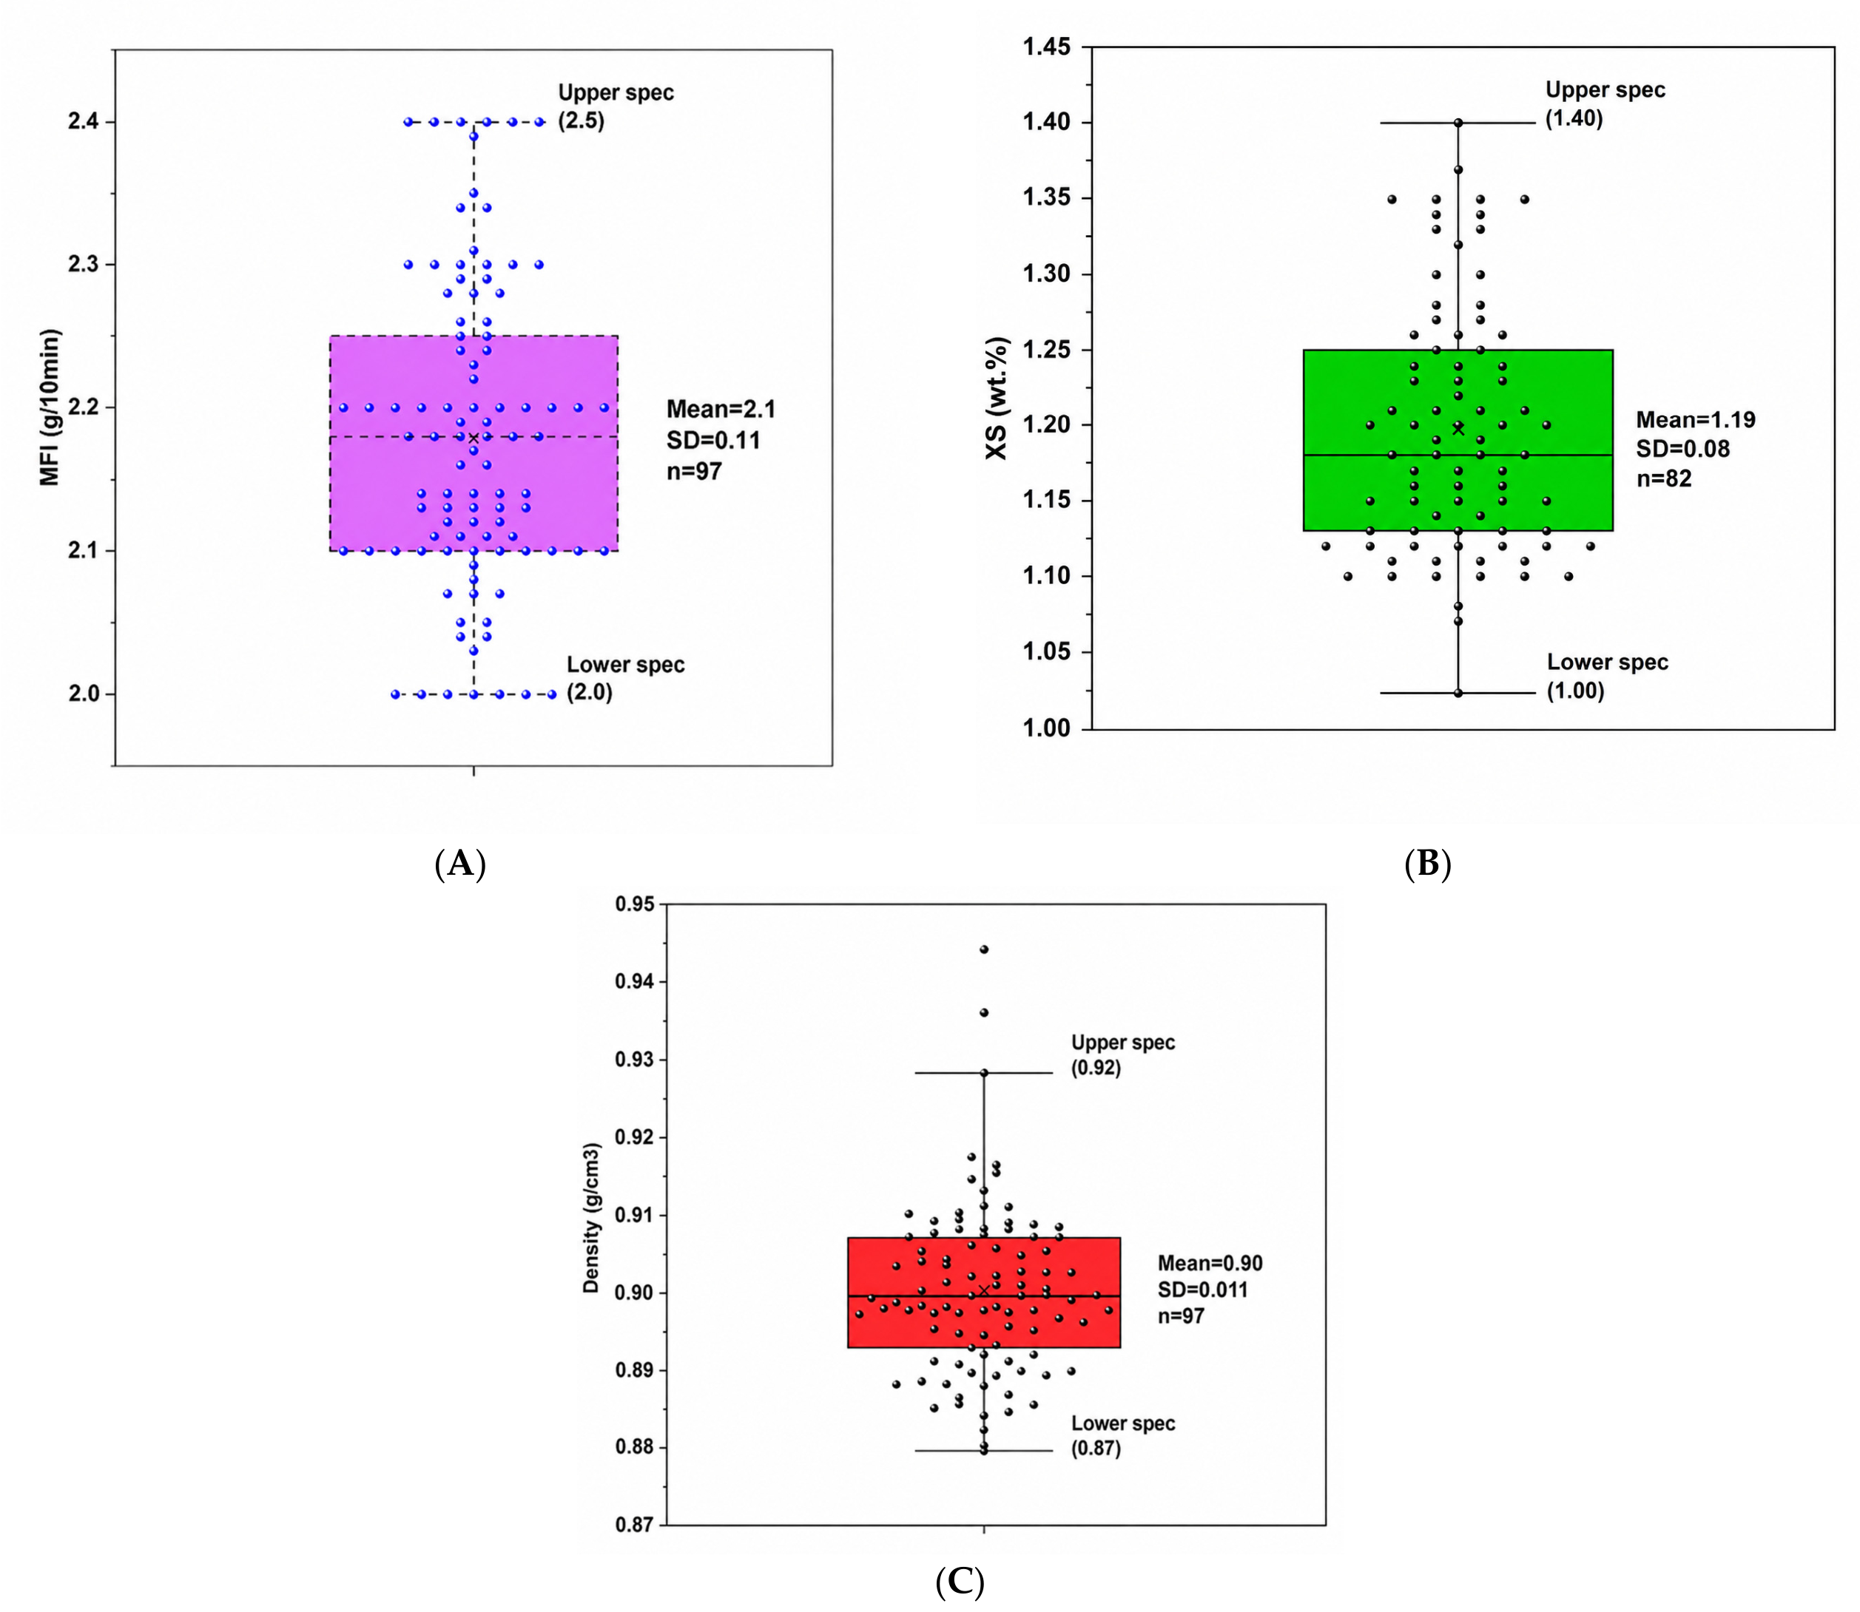
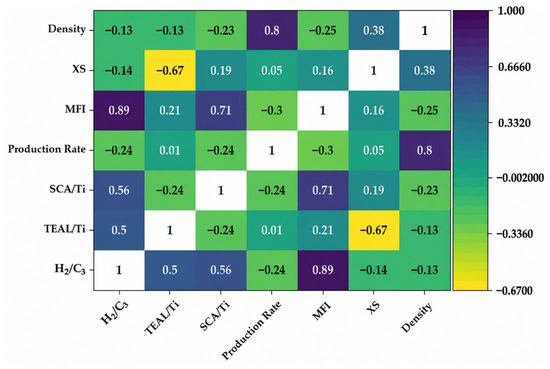
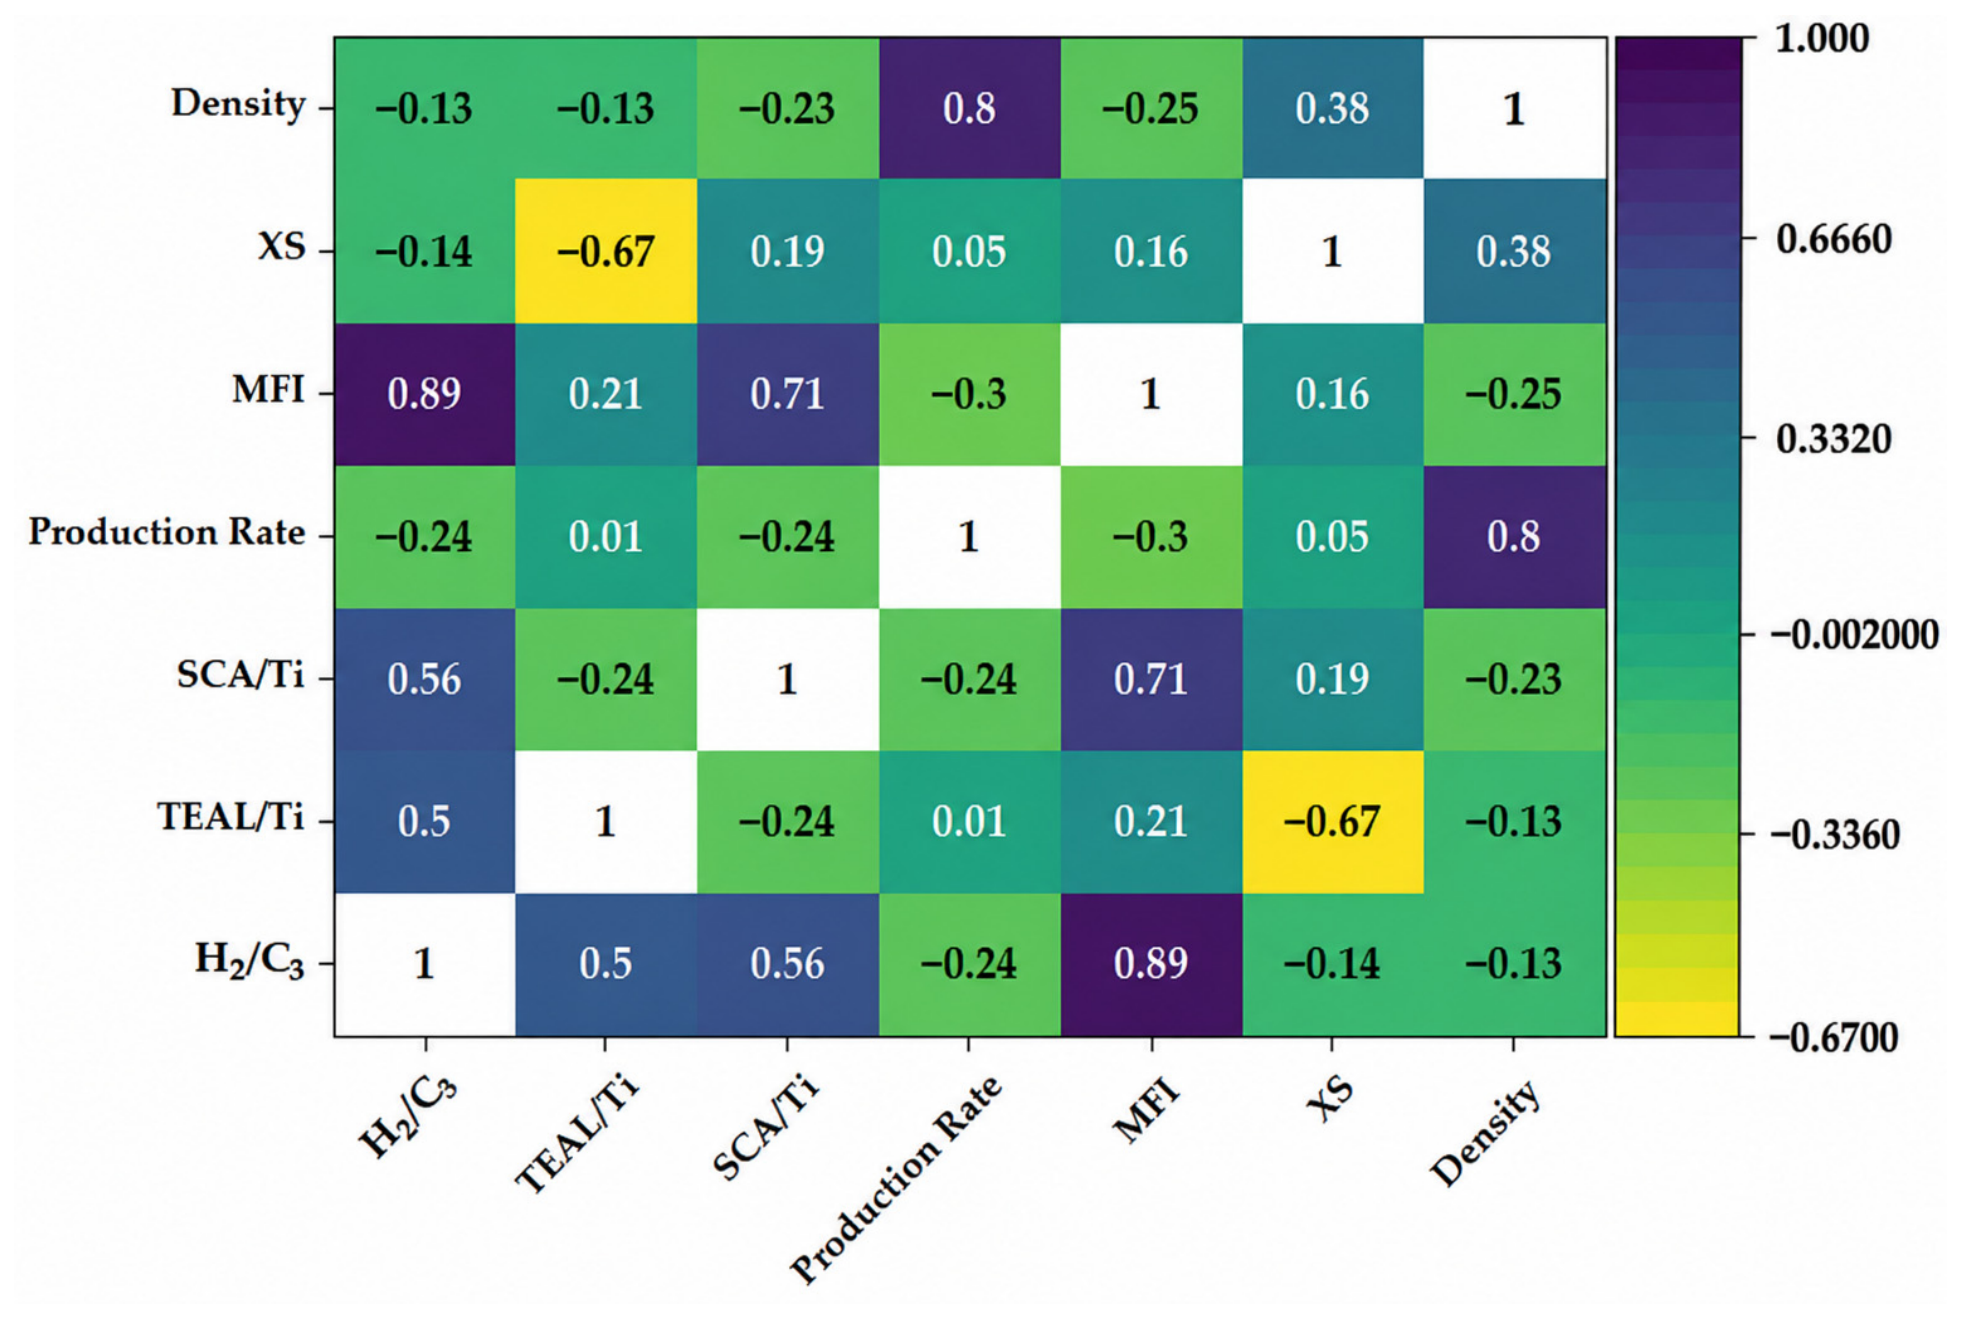
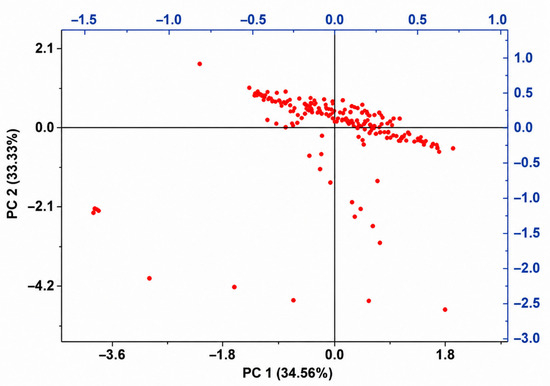
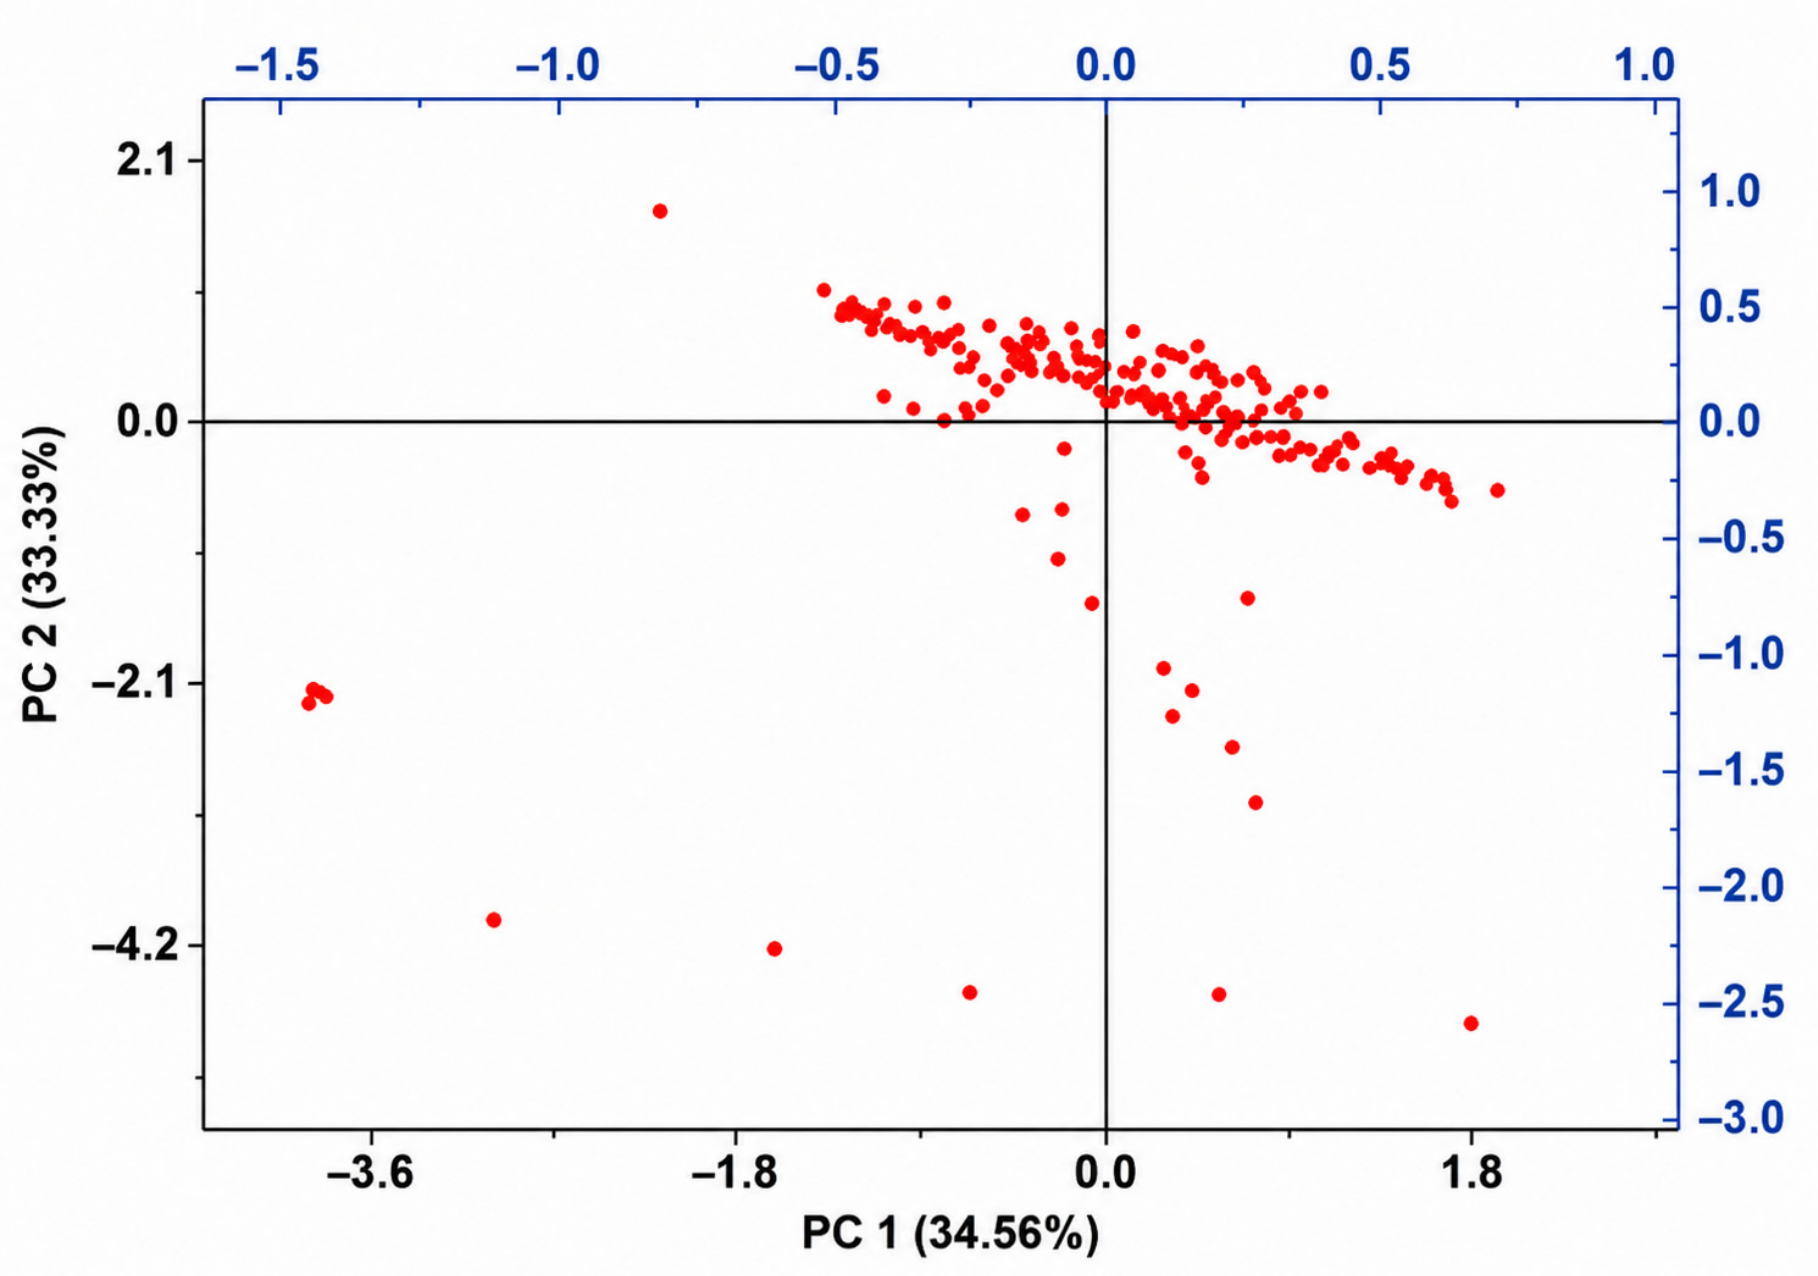
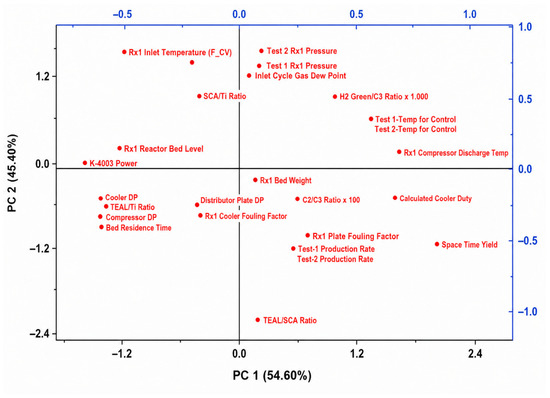
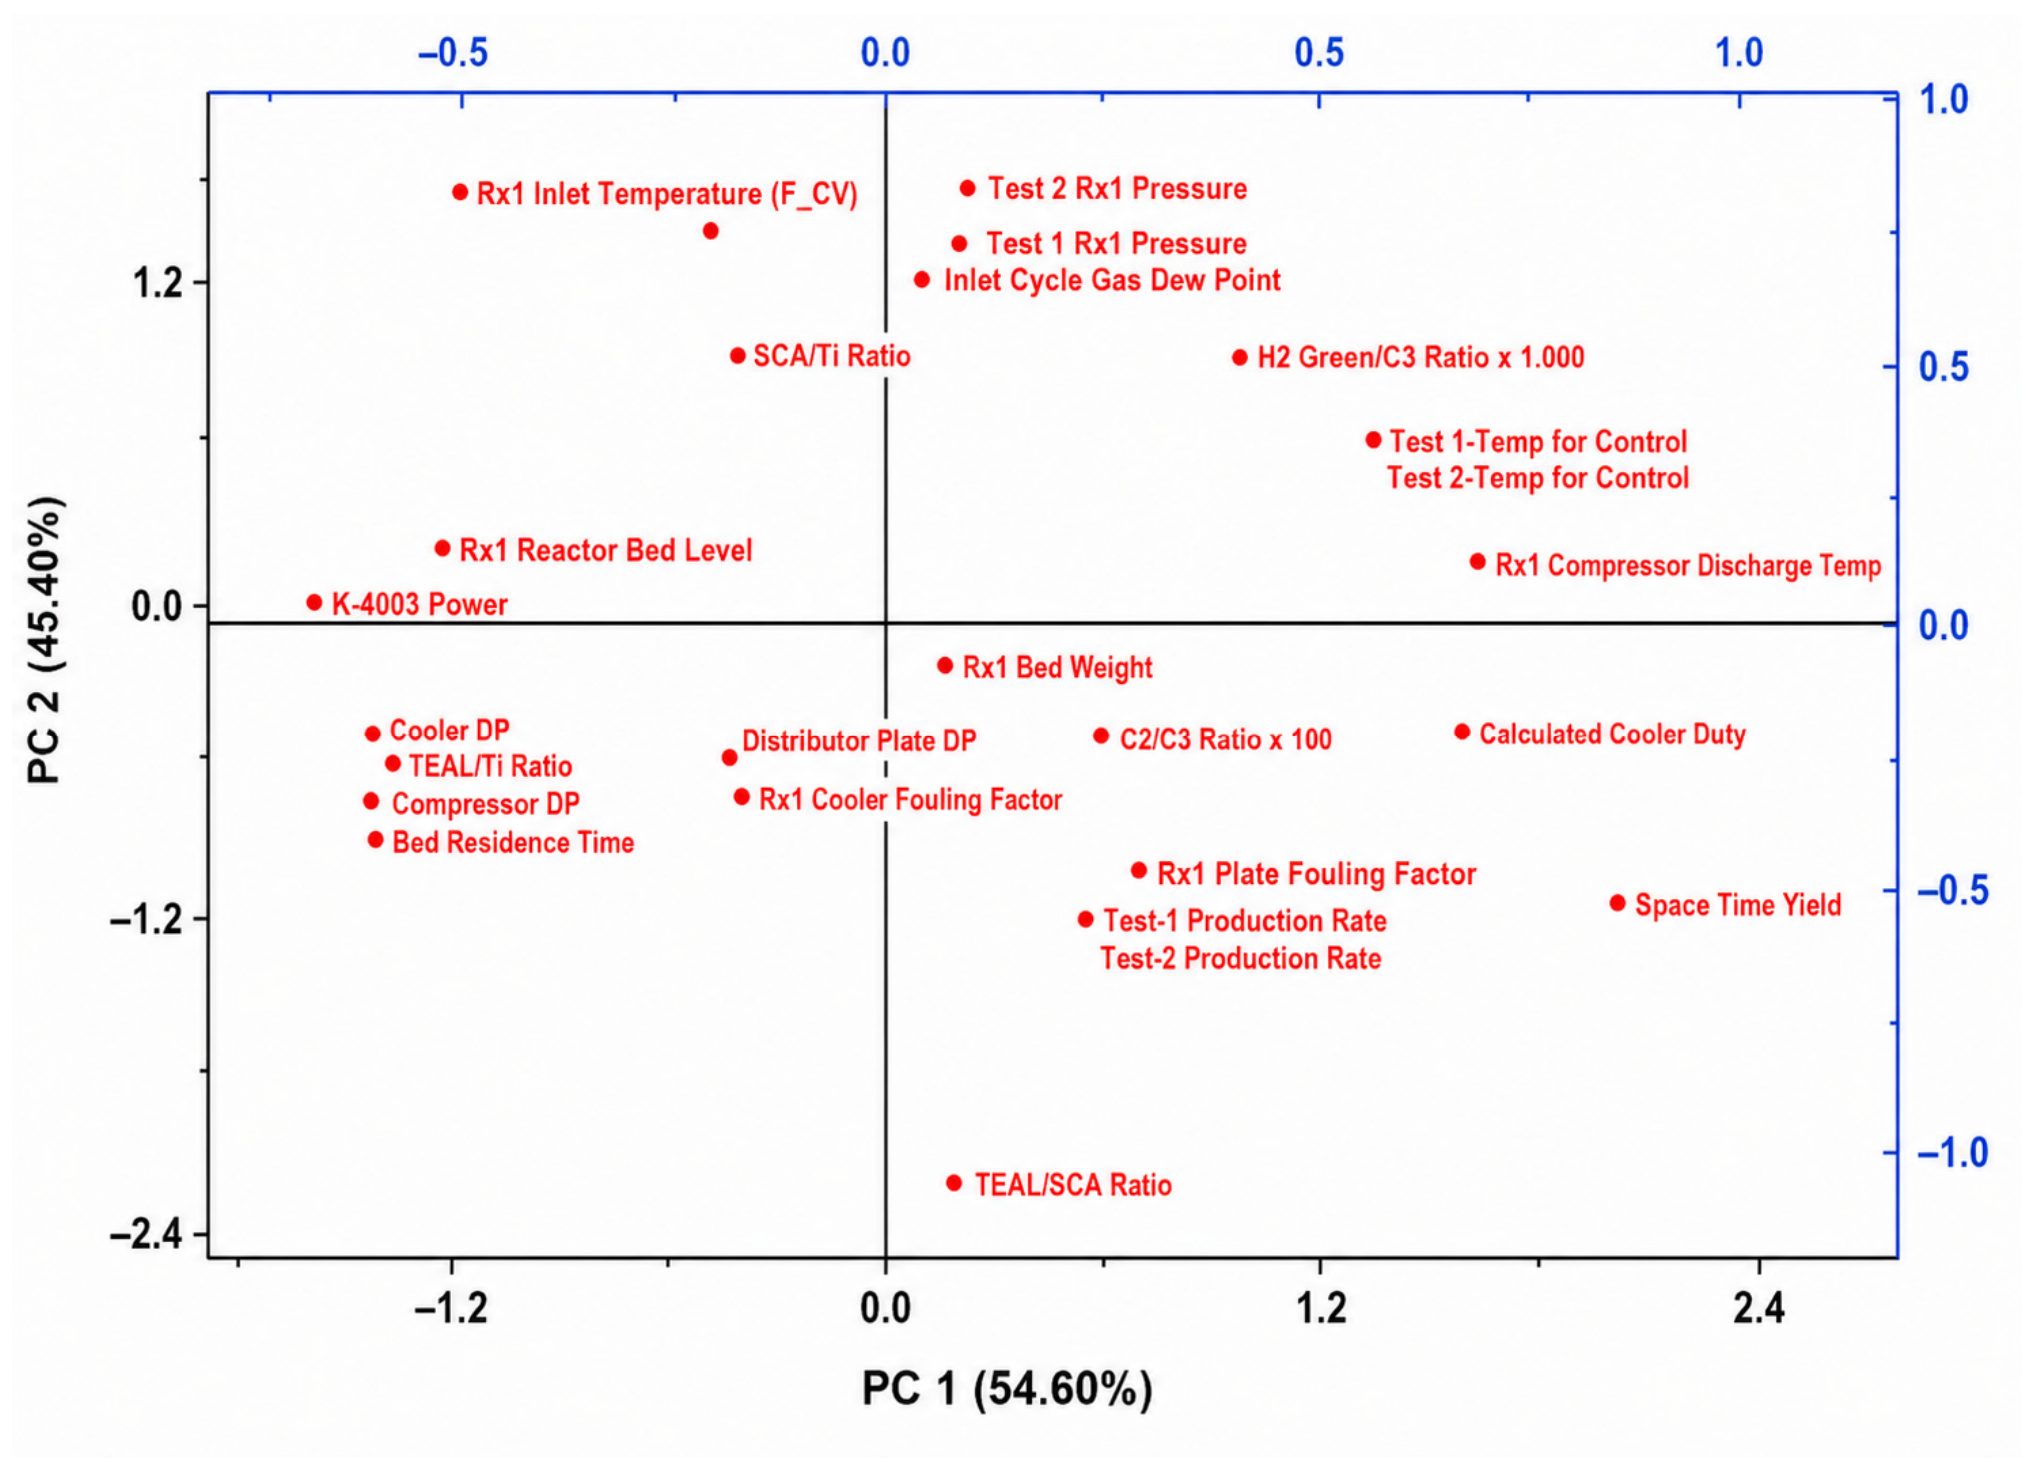

Disclaimer/Publisher’s Note: The statements, opinions and data contained in all publications are solely those of the individual author(s) and contributor(s) and not of MDPI and/or the editor(s). MDPI and/or the editor(s) disclaim responsibility for any injury to people or property resulting from any ideas, methods, instructions or products referred to in the content. |
© 2026 by the authors. Licensee MDPI, Basel, Switzerland. This article is an open access article distributed under the terms and conditions of the Creative Commons Attribution (CC BY) license.