


Abstract
False claims about foods, diets, supplements and food technologies circulate widely, but evidence on correcting them has not been synthesized for consumer outcomes. This review quantified how corrective interventions affect consumers’ acceptance of food-related false claims, attitudes, and choices (PROSPERO CRD420261533126). Four databases were searched during October 2026, with citation searching and author contact, for randomized or quasi-experimental studies with concurrent comparisons. Two reviewers independently screened, extracted, and appraised studies (RoB 2, ROBINS-I); effects were pooled with correlated and hierarchical effects models and robust variance estimation. Of 42 randomized studies (31,301 participants), 30 tested debunking alone, nine combined or compared corrections, two credibility cues, and one inoculation; 20 contributed to six exploratory pooled estimates. Corrections reduced acceptance of the false claim versus uncorrected misinformation (g = 0.49, 95% CI 0.27 to 0.70; four studies, two within-participant) and, versus unexposed controls, may have reduced acceptance (g = 0.38, 0.01 to 0.74) and improved correct knowledge (g = 0.60, 0.19 to 1.01) and attitudes (g = 0.37, 0.01 to 0.73). Confidence intervals included zero for purchase intention and willingness to pay. Heterogeneity was moderate to high (I2 69–94%), no study had low risk of bias, and certainty was very low throughout. Corrections may reduce belief in specific food claims; whether they change purchases remains uncertain.
1. Introduction
Misinformation about what people eat is unusually resilient. Claims that a food cures or causes disease, that an ingredient is toxic at the doses found in products, or that a production technology is inherently unsafe reach very large audiences through social media and are rarely accompanied by the evidence that would allow a reader to check them [1,2,3]. Content analyses of online nutrition information consistently report low accuracy and poor quality [2,4], and false stories spread faster and farther online than accurate ones, with health among the most affected topics [3,5]. Food is a domain in which misperceptions translate into purchases: beliefs about genetically modified (GM) foods, additives, sweeteners, or dietary supplements are related to avoidance, premium payments, and policy preferences [6,7,8], and the people most opposed to GM foods are also those who know least about them while believing they know most [9,10].
The general psychology of misinformation correction is well described. Once a false claim is encoded, it continues to shape inferences even after it has been retracted, a pattern known as the continued influence effect [11,12,13]. Corrections work better when they explain why the claim is wrong, offer an alternative account, come from a trusted source, and avoid repeating the myth without a clear warning [11,13,14]. Prebunking or inoculation, which warns people and exposes them to weakened versions of manipulation before they meet the real thing, has produced measurable gains in the recognition of manipulative content [15,16,17], and brief accuracy prompts or warning labels shift sharing and belief in the direction of accuracy [18,19,20]. Fears that corrections routinely backfire have not survived systematic testing [21,22,23].
Several meta-analyses have summarized this literature across topics. Chan et al. [14] reported large debunking effects (d = 1.14–1.33) together with substantial persistence of the misinformation after debunking (d = 0.75–1.06); Walter & Murphy [24] found a moderate overall correction effect (r = 0.35) that was smaller for political and marketing misinformation than for health misinformation; Walter & Tukachinsky [25] documented a continued influence that corrections attenuate but do not eliminate; and Walter et al. [26] estimated d = 0.40 for corrections of health misinformation on social media, with larger effects when experts delivered the correction. In the corrected version of the most recent synthesis, attempts to debunk science-relevant misinformation were, on average, not successful (d = 0.11, 95% CI −0.04 to 0.26), although corrections fared better for negative topics, for domains other than health, when recipients were familiar with both sides of the issue and when the issue was not politically polarized [27]; a re-analysis attributed this null average to the pooling of two distinct types of effect and found corrections effective on conventional outcome measures [28], a conclusion that the original authors disputed [29]. Food was not examined on its own in any of these syntheses, and belief measures were pooled with attitudes and intentions. Two recent scoping reviews confirm the gap: one mapped 148 studies of health and science misinformation mitigation, most of them short online experiments with cognitive outcomes on topics such as COVID-19, vaccines, and climate change [30], and the other identified 14 studies linking misinformation to nutritional health strategies without estimating the effects of corrections [31]. Meanwhile, agricultural economists and food scientists have run their own experiments on what happens to acceptance, willingness to pay, and choice when consumers receive information about GM foods, additives, or ingredients with a bad reputation [6,7,32]; these authors rarely describe what they study as the correction of misinformation, even when the stimulus is a false claim. The result is two bodies of work that barely cite each other. Correction researchers hardly ever ask what participants would buy; food acceptance researchers hardly ever name a false claim and then test a specific rebuttal of it.
This matters for three reasons. First, food-related claims differ from political ones in that many are not partisan and often rest on intuitions about naturalness and contamination [8,10], so effect sizes from political misinformation may not transfer. Second, the outcomes that regulators and food companies care about are behavioral, and the gap between stated intention and actual behavior is well documented [33,34], as is hypothetical bias in stated willingness to pay [35,36]. Third, the design of practical tools such as accuracy labels on food content, truth-sandwich formats for dietitians, or inoculation modules for consumers requires estimates specific to this domain [1,37,38].
Relative to these syntheses, the present review makes three contributions. First, it is restricted to specific false claims about foods, beverages, nutrients, diets, supplements, food technologies, and food safety, a domain in which many claims are not partisan, rest on intuitions about naturalness and contamination, and bear directly on purchases [8,10], bringing the food-science and agricultural-economics experiments into the same synthesis as the correction literature. Second, it keeps apart the outcomes that previous syntheses pooled (acceptance of the false claim, correct knowledge, attitudes, purchase intention, and willingness to pay) and distinguishes real from hypothetical payment. Third, it separates the comparison with uncorrected misinformation (C1) from the comparison with participants who never saw the claim (C2), and parallel-group from within-participant contrasts, because they estimate different quantities. Throughout, a correction is a message or cue aimed at a specific false claim that the study authors identified as such; general nutrition education, media-literacy training, and product information that do not target such a claim belong to a different literature and were not eligible.
The present review therefore set out to synthesize randomized and quasi-experimental studies in which consumers received a corrective intervention aimed at a specific false claim about foods, beverages, nutrients, diets, supplements, food technologies, or food safety, with misperceptions, attitudes, or choice-related measures as outcomes. The first question (RQ1) was whether such interventions lower acceptance of the false claim, both against uncorrected exposure to the claim and against a control group that never saw it. RQ2 asked about attitudes toward the food, ingredient, or technology, together with perceived credibility, risk perception, and policy support. RQ3 concerned choice-related outcomes: purchase intention, willingness to pay, and sharing. RQ4 asked whether the type, source, format, and timing of the correction, the topic, or participants’ prior attitudes modify the effects, and RQ5 asked whether any effect survives beyond the immediate measurement. Backfire effects and corrections deployed by platforms were recorded as exploratory outcomes.
2. Materials and Methods
2.1. Protocol and Reporting
The review followed the PRISMA 2020 statement [39] and the PRISMA-S extension for search reporting [40]; the completed checklists are provided as Supplementary Tables S1 and S2. The protocol was prepared following the PRISMA-P guidance [41] and is supplied, with its amendment, as Supplementary File S1. Version 1.0 is dated 7 October 2026. Web of Science, Scopus, and APA PsycInfo had been searched on 1 October and PubMed on 7 October (Supplementary Table S3), and the exports were imported for screening on 7 October; the dated file therefore shows that the eligibility criteria had been written down by the day screening began, but not that the search strategy was fixed before the searches were run. Amendment No. 1 (version 1.1, 7 October 2026) was adopted after full-text assessment, at the close of data extraction, and before risk-of-bias assessment, GRADE, or any statistical analysis, so that no pooled estimate was known when it was written. It added operational definitions and decision rules for the three comparator classes, rules for within-group pre–post contrasts and for effect-size computation, and the two clarifications described in Section 2.2; it did not change the eligible population, interventions, or outcomes. Its application to the extraction workbook was ratified by the three reviewers on 8 October 2026. Version 1.0 was written before the exports had been entered in the review workbook and therefore describes the database searches as pending, and the amendment did not revise those sections; version 1.2 of File S1 (5 November 2026) adds a dated note that records when each search was run, keeps the earlier wording unchanged, and corrects the attribution of the amendment without changing the criteria, methods, or decisions. Registration in PROSPERO (CRD420261533126, 8 October 2026; https://www.crd.york.ac.uk/PROSPERO/view/CRD420261533126, accessed on 8 November 2026) had been planned before screening but was completed after screening and extraction had begun. The registered record differs from this report in five respects: it gives 6 October 2026 as the start of the review, whereas the first searches were run on 1 October; it lists sources that were not searched (Section 2.3) and names Google Scholar for forward citation searching, which was run in Semantic Scholar; it names ROBINS-E, whereas ROBINS-I was applied to the within-participant contrasts (Section 2.7); it foresees de-duplication in reference-management software, which was done in the review workbook (Section 2.4); and it states that authors would be asked for data missing from the reports, which was not done (Section 2.5). The dated documents thus show that the comparator rules, the outcome hierarchy, and the analysis plan were fixed before risk-of-bias assessment and pooling, not before the searches and screening; this is discussed in Section 4.6. The protocol file attached to the PROSPERO record is also labelled version 1.1; its text differs from that of File S1 in one sentence of the ratification record of Amendment No. 1, which in the PROSPERO copy states that the ratification was carried out by the AI assistant acting as second reviewer and arbiter on the consolidated extraction, and it does not include the separate document of Amendment No. 1 appended to File S1 (Supplementary Table S1, item 24b).
2.2. Eligibility Criteria
Eligibility was defined with the PICOS framework [42].
Population. Consumers aged 13 years or older drawn from the general population, including online panels, students, parents, and household shoppers. Samples composed exclusively of health, nutrition, journalism, or communication professionals or students, clinical samples, and children under 13 were excluded, because their exposure to and processing of food claims differ from those of ordinary consumers.
Context. A specific false claim about foods, beverages, nutrients, diets, dietary supplements, food technologies (GM organisms, gene editing, additives, sweeteners, pesticides, organic production, cultivated meat), or food safety. Following Vraga & Bode [43], a claim was treated as misinformation when the study authors themselves described it as false, a myth, or misinformation with reference to the best available evidence (Clarification 1, adopted during full-text assessment). Open scientific controversies, labelling, or legal claims without demonstrated falsity, as well as purely quantitative misperceptions (for example, underestimating the sugar content of a product) without a specific false claim, were not eligible (Clarification 2). Misinformation about non-food topics was eligible only if the study reported separable data for a food item. Studies that corrected a misperception that participants already held, without presenting the claim in the experiment, were eligible when the authors named the misperception and described it as false (Clarification 1); their contrasts were flagged as lacking experimental exposure to the misinformation and removed in sensitivity analysis S2 (Section 2.8). The coding rules and the borderline cases decided under them (general health claims, quantitative or normative misperceptions, open controversies, pre-existing misperceptions, and studies covering several topics) are listed with examples in Supplementary Table S10.
Interventions. Five classes were pre-specified. I1 covers debunking or refutation presented after the claim, including truth sandwiches and corrections by experts, peers or authorities; I2, inoculation or prebunking presented before it; I3, credibility or accuracy cues (fact-check labels, warning labels, source indicators), eligible when the cue was attached to, or explicitly contradicted, a specific false or misleading claim; I4, alternative narratives or “bypassing” messages that promote the correct account without confronting the claim; I5, combinations of these approaches. Three kinds of material fell outside the review: media-literacy training with no target claim, front-of-pack nutrition labelling that provides nutrient information without addressing a specific claim, and tools that detect misinformation automatically.
Comparators. Three comparator classes were used: C1, the misinformation shown without any correction; C2, an unexposed control in which participants never saw the claim, either passive (no message or unrelated material) or active (a correct expository text that neither named nor refuted the claim); C3, a different correction. Amendment No. 1 set out the decision rules for coding them. Within-arm pre–post contrasts were coded C1 only when all participants had read the misinformation before the baseline measurement, so that the pre-correction measure recorded acceptance after uncorrected exposure; single-group pre–post studies without a concurrent comparison remained ineligible. C2 contrasts do not isolate the effect of the correction: the corrected participants met the claim, in the experiment, before it or restated in the refutation, whereas the controls met neither the claim in the study nor the correction. They therefore estimate the net position of corrected participants relative to people not exposed to the claim in the study, the comparison that earlier syntheses use to estimate the persistence of misinformation [14,28]. C1 and C2 contrasts were synthesized separately and never pooled, and C3 contrasts were restricted to RQ4.
Outcomes. O1, misperceptions, meaning acceptance of or belief in the false claim and, separately, correct knowledge; O2, attitudes toward the food, ingredient, or technology, the perceived credibility of the false or the corrective message, risk perception, and policy support; O3, choice-related measures, whether real or simulated choice, purchase or consumption intention, willingness to pay, self-reported consumption, or sharing. Any measurement time was acceptable. A measure taken 24 h or more after the intervention counted as persistence for RQ5.
Study design. Randomized or quasi-experimental studies with a concurrent comparison condition were eligible if published in English, Spanish, or Portuguese, with no restriction on year. We excluded single-group pre–post designs, surveys, content analyses, qualitative studies, reviews, preprints that had no peer-reviewed version, industry reports, and retracted articles.
2.3. Information Sources and Search Strategy
Four databases were searched: Web of Science Core Collection (SCI-EXPANDED, SSCI, A&HCI, ESCI; topic field), Scopus (TITLE-ABS-KEY), PubMed/MEDLINE (title/abstract field; run with E-utilities on 7 October 2026), and APA PsycInfo via EBSCOhost (title, abstract and keyword fields). Web of Science, Scopus, and PsycInfo were searched on 1 October 2026 through the university’s institutional subscription. No filters for date, language, or document type were applied. The search combined four blocks: misinformation terms (misinformation, disinformation, fake news, false claim, myth, rumor, misconception, misperception, pseudoscience, infodemic), food terms (food, nutrition, diet, supplement, genetically modified, additive, sweetener, pesticide, organic, food safety), correction terms (correction, debunking, refutation, prebunking, inoculation, fact-check, warning label, accuracy label) and study-design terms (experiment, randomized, between- or within-subject, trial, control group or condition, pre–post, quasi-experiment). The full strings, with field codes, dates, and record counts for each database, are reported in Supplementary Table S3. The strategies were peer-reviewed with the PRESS 2015 evidence-based checklist by C.A.L.M., who is not an author of this review and acted as the third reviewer in study selection (Section 2.4). The PubMed string was validated against a set of 17 reference articles identified a priori: it retrieved 11 of the 13 that are indexed in PubMed; the two misses lacked misinformation terms in their abstracts and were captured by the other databases or by citation searching (Supplementary Table S3).
Backward and forward citation searching of the 31 studies then included from the databases and of the prior meta-analyses [14,24,25,27,44] was run through the Semantic Scholar Graph API on 8 October 2026; 1386 unique records were returned, 34 of which were already in the database set, and 16 new candidates were screened. Searches of Google Scholar, Dialnet, SciELO, Redalyc and preprint servers, and contact with research groups active in the field were planned in the protocol, and the PROSPERO record also lists ERIC, ProQuest Dissertations, and Theses Global, which are grey-literature repositories and conference proceedings; none of these had been used at the time of submission. During the revision, the authors of the reports that could not be retrieved were contacted (Section 2.4). One of them also sent a further study of their own that the searches had not identified, which was screened and is reported as identified through contact with authors, and another sent the full text of a meta-analysis of refutation texts that he had co-authored [45]; the 68 references that it marks as included studies were screened as an additional citation source, which the protocol did not foresee (Section 4.6). The other planned sources were still not used, and citation searching was not repeated for the studies added during the revision. Databases specific to food science and agricultural economics (CAB Abstracts, FSTA, AGRIS, and AgEcon Search) were not searched; experiments from these fields, and studies published in Spanish or Portuguese, could enter the review only through the four multidisciplinary databases or citation searching (Section 4.6).
2.4. Selection Process
Records were de-duplicated in the review workbook (Microsoft Excel); the protocol and the PROSPERO record had foreseen reference-management software. Formulas matched DOIs and normalized titles; the matches were checked manually, and one duplicate that the formulas missed, because of a typographical variant in its title, was marked by hand (249 duplicates in all). Two reviewers who were not authors of this review (K.Y.B.C. as R1 and V.A.C.P. as R2; see Acknowledgments) screened titles and abstracts independently, blind to each other’s decisions, after a pilot on 100 records (Cohen’s κ = 0.96). Each reviewer recorded the first eligibility criterion that a record failed, in the order fixed by the protocol: publication type, language, food-related misinformation, specific false claim, population, corrective intervention, study design, and eligible outcome. When the two reviewers agreed on exclusion but had recorded different criteria, the criterion earlier in that order was taken as the reason reported in Figure 1. Full texts were sought through the publisher, PubMed Central, Unpaywall, OpenAlex, Semantic Scholar, CORE, and a web search for author versions (routes V1–V4) and then through the university library, by institutional subscription or inter-library loan (V5). The protocol requires a request to the authors before a report is classed as not retrievable (V6); this step had not been taken before submission, and the requests were sent during the revision, on 4 November 2026, for 12 of the 13 reports that could not be retrieved (the thirteenth is open access but could not be downloaded); by 7 November 2026, the authors had sent eight of them and one further study, and the working paper of another was used (Section 3.1 and Section 4.6). Full texts were assessed independently by the same two reviewers with a structured form that recorded the first failing criterion as the reason for exclusion; disagreements were resolved by a third reviewer (C.A.L.M., R3). Agreement was quantified with Cohen’s κ and interpreted with the Landis & Koch benchmarks [46]; the protocol set 0.70 as the minimum acceptable value. The two clarifications described in Section 2.2 were adopted and ratified by the team before the affected decisions were finalized.
Figure 1.
PRISMA 2020 flow diagram of the identification, screening, and inclusion of studies. Reasons for exclusion at title and abstract (first failing criterion in the protocol order), for non-retrieval, and for exclusion at full text are given with their counts; the breakdown at title and abstract is tabulated in Supplementary Table S4, the 16 reports excluded from the database arm and the five excluded in the other-methods arm are listed individually in Supplementary Table S6, and the three reports not retrieved are listed in Supplementary Table S5. Identification via other methods includes, besides citation searching, a study sent by an author contacted during the revision and the reference list of a meta-analysis sent by one of its authors.
2.5. Data Collection and Items
Data were extracted in duplicate into a structured workbook with pre-defined fields and drop-down lists; discrepancies were settled by consensus. The form first recorded bibliographic data, country, year of data collection, design, pre-registration, setting, sample type, and recruitment, and analyzed N and n per condition and age. It then recorded the misinformation topic, the false claim as literally stated and its format; the intervention class and the source, format, timing, and channel of the correction; the comparators; the outcomes, their instruments and measurement times; whether prior attitudes were measured; manipulation and attention checks; a priori power; whether the behavioral measure had real consequences; any backfire or reactance reported; platform-deployed corrections; and funding and conflicts of interest. For each eligible contrast, we took means, standard deviations, and n per group where they were given; otherwise, we took whatever test statistic, effect size, or confidence interval would allow conversion. In one study, the article reported inferential statistics only, and the required values were rebuilt from the authors’ public repository. We did not contact any author before the submission date.
2.6. Effect Measures
Hedges’ g with the small-sample correction served as the effect measure [47]. Between-subjects g was calculated from means, standard deviations, and n whenever these were available; where a study gave only t, an F with one degree of freedom, d, an odds ratio, or proportions, we converted them with the standard formulae. When a report gave only the total N, an approximate n per condition (total N divided by the number of conditions) was used only if the allocation was random and balanced and the reported degrees of freedom confirmed it; otherwise, no effect size was computed, and the study was synthesized narratively. Effect sizes based on such an approximate n, on standard deviations derived from the standard errors of covariate-adjusted means, on analysis-of-covariance F statistics, on rank-biserial correlations, or on standardized regression coefficients of condition indicators converted to d were flagged as approximate and removed in a sensitivity analysis (S3); standard deviations recovered from the standard errors of unadjusted means (SD = SE × √n) are exact and were retained. Within-participant pre–post contrasts were standardized by the mean of the pre- and post-correction standard deviations, and their sampling variance was estimated using the reported pre–post correlation or, when it was not reported, r = 0.50 [48]; values of 0.30 and 0.70 were tested in a sensitivity analysis. Signs were set so that positive values favor the correction, that is, movement toward the evidence: lower acceptance of the false claim, higher correct knowledge and lower intention to share misinformation. For attitudes, intentions, and willingness to pay, the direction depended on the claim. When the false claim attributed a benefit to a product (for example, that a supplement protects against disease), lower ratings, intentions, or bids favored the correction; when it attributed a risk (for example, that GM foods harm health), more favorable ratings, intentions, or bids did. The coding of every outcome is listed in Supplementary Table S11. One contrast per study, outcome, comparator, and measurement time was designated as principal before analysis, following the hierarchy specified in Amendment No. 1. Effects of about 0.2, 0.5, and 0.8 are described as small, moderate, and large, respectively [49].
2.7. Risk of Bias and Certainty of Evidence
Risk of bias was assessed with RoB 2 for the principal outcome of each study [50]. Two independent assessments were made, one applying explicit decision rules to the extracted data (randomization documented and n per arm reported; post-randomization exclusions ≤3% and documented; analyzed N equal to allocated N; self-reported outcomes without blinding as some concerns; pre-registration present) and one based on a reading of each full text with specific attention to randomization, exclusions per arm, attrition, pre-registration, power and blinding; disagreements were resolved by the third reviewer. Overall judgements followed the RoB 2 algorithm, with the additional rule that four or more domains with some concerns yielded a high-risk judgement. ROBINS-I [51] was specified in the protocol for quasi-experimental studies, none of which met the eligibility criteria. Because the two within-participant pre–post C1 contrasts compare the same participants before and after the correction, randomization does not protect them against time, testing, and regression-to-the-mean effects; during peer review, they were therefore also assessed with ROBINS-I, across confounding, selection of participants, classification of interventions, deviations from intended interventions, missing data, measurement of outcomes, and selection of the reported result (Supplementary Table S7, panel B). The ROBINS-I judgements were made in the independent passes for R1 and R2 described in Section 2.9, and their disagreement was resolved in the pass for R3. Certainty of evidence for each pooled outcome was rated with GRADE [52] across risk of bias, inconsistency, indirectness, imprecision, and publication bias, starting from high certainty for randomized experiments; evidence from the within-participant contrasts also started at high certainty and was rated down according to its ROBINS-I judgement [53]. Publication bias was not assessed, because no combination reached ten studies, and it was not used to rate down certainty.
2.8. Synthesis Methods
Studies were grouped by outcome and comparator class. Because most studies contributed several dependent effects (multiple corrective conditions, claims or measures), a correlated and hierarchical effects working model was fitted with a sampling correlation of ρ = 0.60 and random effects for studies and for effects within studies, estimated by restricted maximum likelihood [54]. Inference used robust variance estimation with the CR2 small-sample correction and Satterthwaite degrees of freedom [55,56], which keeps Type I error close to nominal when the number of studies is small. Pooled estimates were computed only when at least three studies contributed to an outcome-comparator combination and are reported with 95% confidence intervals, between-study (τ2) and within-study (ω2) variance components, I2 [57] (values of 50% to 75% are described as moderate and values above 75% as high), and 95% prediction intervals computed with the t distribution [58]. Combinations with fewer than three studies were synthesized narratively following the SWiM guideline [59], reporting direction and magnitude without pooling. With three to seven studies per combination and few degrees of freedom, all pooled estimates are treated as exploratory.
Pre-specified sensitivity analyses varied ρ (0.20 and 0.80), restricted C1 contrasts to parallel groups (S1), restricted the analysis to studies with experimental exposure to the misinformation (S2), removed approximated effect sizes (S3), used only principal contrasts, excluded studies at high risk of bias, and removed one study at a time. Four further analyses were added during peer review and are reported as post hoc: a study-level random-effects model estimated by restricted maximum likelihood with the Hartung-Knapp-Sidik-Jonkman adjustment [60]; a Bayesian random-effects model with a half-normal prior (scale 0.5) on τ [61], fitted with the bayesmeta package [62] with a uniform prior on the mean and repeated with a scale of 1.0; descriptive common-effect estimates for parallel-group and within-participant C1 contrasts separately; and pre–post correlations of 0.30 and 0.70 for the within-participant contrasts. For combinations with three studies, leave-one-out estimates were obtained from the study-level model. Moderator analyses for RQ4 (intervention type, source, format, timing, topic, and prior attitudes) were planned as meta-regressions but were not estimable, because no outcome-comparator combination reached ten studies; moderators are described narratively. Small-study effects could not be assessed for the same reason; with fewer than ten studies, funnel-plot tests and selection models have no useful power [63,64]. All meta-analytic computations were performed in R version 4.5.2 (R Foundation for Statistical Computing, Vienna, Austria) with the packages metafor 4.8.0 [65], clubSandwich 0.7.0, and bayesmeta 3.5, and the pooled estimates were cross-checked with an independent Python 3 implementation; the data file, scripts, and session information are provided as Supplementary File S2. Numbers in the text, tables, and the flow diagram were reconciled against the review workbook before submission.
2.9. Use of Artificial Intelligence Tools
During title-and-abstract screening, the tools Perplexity (Perplexity AI, San Francisco, CA, USA) and Gemini (Google LLC, Mountain View, CA, USA) returned, for each record, a proposed decision against the written eligibility rules; the two reviewers screened every record themselves: each checked the proposal against the record and entered an independent decision, blind to the other reviewer, and their decisions led to the same result as the tools’ proposals. The same tools produced first-pass data-extraction and risk-of-bias entries from the full texts and checked the analysis scripts against the protocol; the reviewers verified every entry against the source article and ratified or corrected it, and the final values are those recorded in the review workbook. All decisions, values, judgements, analyses, and interpretations are those of the reviewers and the authors, who take full responsibility for the content of this manuscript. The review workbook records the use of Perplexity Computer (Claude model) on 7 and 8 October 2026; the versions and dates of use of Gemini were not recorded. During the revision, the material added was handled in three AI-assisted passes run in Perplexity Computer on 7 November 2026 with the team’s written prompts, one for each reviewer role. The passes for R1 (Claude Opus 5.5) and R2 (GPT-6.1 Sol), each blind to the other’s output, screened the 64 records from the reference list of a meta-analysis by title and abstract, assessed 12 reports in full text, assessed the risk of bias of the nine studies added, and verified, field by field against the full texts, the data extraction drafted with the same tool (Claude Opus 5.5) at the authors’ request; the pass for R3 (Gemini 4 Argon) resolved their disagreements. The three reviewers and the authors ratified the results on 7 November 2026. The prompts are provided in Supplementary File S3.
3. Results
3.1. Study Selection
The database searches returned 670 records: 201 from Web of Science, 291 from Scopus, 100 from PubMed, and 78 from APA PsycInfo. After 249 duplicates were removed, 421 records were screened by title and abstract, and 369 were excluded. By first failing criterion, 131 were not primary empirical reports (reviews, meta-analyses, commentaries, book chapters, theses, and guidance pieces without original data), two were published in a language other than English, Spanish or Portuguese (both in German), 164 did not deal with food-related misinformation, 38 dealt with food but did not name a specific false claim (for example, general nutrition education or front-of-pack labelling), nine had no eligible consumer sample (students in health professions, farmers, or no human participants at all, as in laboratory, product-sampling, and automated-detection studies), 23 contained no corrective intervention aimed at a claim, and two had no concurrent comparison condition. In 33 of the 369 records, the two reviewers had recorded different failing criteria; the criterion earlier in the protocol order was kept, as described in Section 2.4, and the record-level criteria of both reviewers are preserved in the review workbook (Supplementary Table S4). Full texts were sought for 52 reports; at submission, six could not be retrieved because they were behind a paywall: no open-access copy or author version was found through routes V1–V4, and the institutional library confirmed that it holds no subscription to the outlets (route V5). Requests to the authors (route V6) were sent during the revision, on 4 November 2026. By 7 November 2026, the authors had sent four of these reports (IDs 118, 197, 285, and 290 in Supplementary Table S5), and a fifth was assessed from the authors’ working paper, which is publicly available [66]. One report remains unretrieved because its authors had not replied by 7 November 2026 (ID 293). Fifty-one reports were assessed in full, and 16 were excluded for the following reasons: no specific false claim about food, that is, an open controversy, a labelling or legal claim, or a quantitative misperception without a demonstrated falsity (n = 10); no corrective intervention aimed at the false claim (n = 2); misinformation about a non-food topic without separable food data (n = 1); no concurrent comparison condition (n = 1); no eligible O1–O3 outcome (n = 1); and duplicate publication of the same sample (n = 1). Thirty-five studies entered the review from the databases.
Citation searching yielded 16 new records; four were excluded at title and abstract (three with no corrective intervention and one with no food-related misinformation), and 12 were sought in full text. At submission, seven could not be retrieved: six were behind a paywall for the same reasons, and the seventh (ID 679) is open access, but the publisher’s server refused automated download. During the revision, the authors of the six paywalled reports were asked for a copy and, by 7 November 2026, four had sent it (IDs 671, 672, 673, and 682); ID 679 was read in the publisher’s HTML version on 7 November 2026. Two reports therefore remain unretrieved: those whose authors had not replied by 7 November 2026 (IDs 677 and 678). Ten were assessed, and five were excluded: population not eligible, early-intervention professionals (n = 1); no concurrent comparison (n = 2), a cross-sectional survey in one report and a single-group pre–post design in the other (ID 679); and non-food misinformation without separable data (n = 2), GM claims pooled with COVID-19 claims in one report and general-knowledge statements in the other. Five studies were added: two on dietary-supplement claims [67,68] and three with refutations of misconceptions about GM foods. Of these, two were written texts [69,70], and one was narrated by a virtual human in short videos [71]. Through contact with authors, one further study with refutation texts about GM foods was identified and included [72]. The reference list of the meta-analysis of refutation texts [45] marks 68 references as included studies; four were already among the records identified, and of the 64 screened, 63 were excluded at title and abstract (56 with no food-related misinformation and seven of an ineligible publication type: four master’s theses, two conference sessions, and one commentary). The remaining record, a doctoral dissertation, was assessed in full and included [73]. The review therefore includes 42 studies reported in 42 reports; 20 contributed to at least one pooled estimate, and 22 were synthesized narratively because their outcome-comparator combinations did not reach three studies or because their data did not permit an effect size. In total, three of the 66 reports sought (4.5%) could not be retrieved (Supplementary Table S5); Section 4.6 discusses their possible influence. Figure 1 shows the flow of records. The 16 reports excluded from the database arm and the five excluded from the other sources are listed with their reasons in Supplementary Table S6.
Agreement between the two reviewers was almost perfect at title and abstract (κ = 0.96, 95% CI 0.93 to 1.00; 437 records, 99.1% raw agreement) and substantial at full text (κ = 0.82, 95% CI 0.65 to 0.99; 51 reports assessed at submission, 92.2% agreement). The four disagreements at full text concerned the application of the two clarifications described in Section 2.2 and were resolved by the third reviewer in favor of the stricter reading. During the revision, the passes for R1 and R2 agreed on all 64 title-and-abstract decisions on the records from the meta-analysis reference list (κ = 1.00) and on the inclusion or exclusion of the 12 reports assessed in full text (κ = 1.00); they differed only in the reason for excluding one record, which R3 assigned. For the nine studies added, they agreed on six of the nine overall RoB 2 judgements (κ = 0.31), 31 of the 45 domain judgements (κ = 0.37), and on 13 of the 14 ROBINS-I domain judgements of the two within-participant contrasts; the pass for R3 resolved these disagreements and those found in the verification of the data extraction (Supplementary Table S7; Supplementary File S3).
3.2. Study Characteristics
Table 1 summarizes the 42 studies. They were published between 2013 and 2026, with 33 appearing from 2020 onward. Seventeen were conducted in the United States, five in Germany, two each in Canada and Singapore, one each in the Netherlands, Switzerland, Finland, Italy, South Korea, Australia, and China, two in more than one country, and six without a reported country. One report of two experiments recruited its first sample in the United States and did not report the country of the second. Forty studies reported an analyzed sample, totaling 31,301 participants (median 326; range 86–4906). Two reported only the full-survey N without the n per corrective arm [74,75]. Twenty-seven studies recruited online panels, three recruited other online samples (university students in two and adults through Reddit in one), one recruited an online student subject pool in one experiment and an online panel in the other, nine were laboratory studies, and two combined settings. Twenty-one samples were general adult populations, thirteen were university students, two were parents, two were household food shoppers, one consisted of social media users recruited through Reddit, and three mixed students with other adults.
Twenty-four studies targeted claims about food technology, most often that GM foods are unsafe, harmful to health, or equivalent to cloning; ten targeted diet-health claims about vitamins, supplements, carbohydrates, spinach, coconut oil, meat, breastfeeding, or children’s drinks; six targeted food-safety rumors about radiation in seafood, raw milk (three studies), romaine lettuce, or organic poultry; and two tested several food claims. Thirty studies evaluated debunking alone (I1), nine compared several corrective conditions that included debunking, prebunking, or credibility cues, two tested credibility cues alone (I3), and one tested inoculation alone (I2) [76]. Fourteen studies used only an unexposed control (C2), eight only an alternative correction (C3), four only uncorrected misinformation (C1), 14 combined two comparator classes, and two used all three. All 42 studies were randomized experiments: 19 used between-participants designs, 17 factorial designs, five mixed designs with between- and within-participant factors, and one a discrete choice experiment; no quasi-experimental study met the criteria. Thirty-eight studies measured outcomes only immediately after the intervention; four added or used a delayed measurement at 7, 14, 16, and 28 days [77,78,79,80]. Fourteen studies were pre-registered. Prior attitudes or beliefs were measured in 25 studies. Four studies used incentive-compatible mechanisms with real payment: Becker-DeGroot-Marschak auctions for a multivitamin product and for sweets with and without added multivitamins [81]; a second-price Vickrey auction for blood oranges [82]; in the second of its two experiments, an auction for a multivitamin product with an AU$5 endowment [67]; and a choice-based conjoint task in which participants had a one-in-20 chance of a USD 20 bonus that included one of the nutritional shakes they had chosen, with or without GMOs [66]; the remaining behavioral measures, including the first experiment of [67] and the vitamin E auction in [68], were stated intentions, hypothetical choices, or stated willingness to pay.
Table 1.
Characteristics of the 42 included studies, ordered alphabetically by first author.
3.3. Risk of Bias
No study was judged at low overall risk of bias; 29 had some concerns, and 13 were at high risk (Figure 2; domain-level judgements in Supplementary Table S7, panel A). Randomization was adequately described in 32 studies (D1). The main sources of concern were deviations from intended interventions (D2: 27 studies with some concerns and one at high risk, mostly because post-randomization exclusions after attention or manipulation checks were applied without reporting their distribution across arms) and outcome measurement (D4: 33 studies with some concerns, because their outcomes were self-reported by participants aware of the message they had read). Missing outcome data (D3) raised some concerns in 16 studies and high risk in none; in one of them, about a quarter of the randomized participants were lost between allocation and analysis without a breakdown by arm, which was judged as some concerns because nothing indicated that the losses depended on condition or outcome [95]. Selection of the reported result (D5) was at low risk in nine studies whose analyses matched a registration or a complete reporting plan and at high risk in two studies that reported a selected subset of conditions or outcomes [105,107]. The 13 high-risk studies were those with concerns in four or more domains or a single high-risk domain [69,73,74,75,80,85,92,95,97,101,104,105,107]. The within-participant pre–post C1 contrasts of two studies were at serious risk of bias with ROBINS-I, mainly because of confounding by time, testing, and regression to the mean [82,99] (Supplementary Table S7, panel B).
Figure 2.
Risk of bias of the 42 included studies [83, 77, 84, 74, 73, 85, 66, 86–88, 69, 70, 72, 89, 91, 90, 76, 92–94, 81, 67, 68, 95–100, 71, 78, 82, 101, 80, 102–105, 79, 75, 106, 107] assessed with RoB 2 for Humphriss immediate contrast. (a) Judgements per study and domain; (b) distribution of judgements by domain (also shown in Figure S1). D1, randomization process; D2, deviations from intended interventions; D3, missing outcome data; D4, measurement of the outcome; D5, selection of the reported result. The within-participant pre–post C1 contrasts of two studies were additionally assessed with ROBINS-I (Supplementary Table S7, panel B).
3.4. Pooled Effects
Six outcome-comparator combinations reached the threshold of three studies (Table 2; Figure 3). Effect sizes could be computed for 138 contrasts from 28 studies (136 immediate and 2 delayed), 50 of them principal; all are listed in Supplementary Table S8 and File S2, and five further delayed contrasts could not be converted for lack of data. The 32 contrasts of a ten-arm experiment on raw milk (16 immediate and 16 at one week) were extracted without effect sizes, because its report gave the total N but neither the n per condition nor the degrees of freedom that would confirm balanced allocation (Section 2.6) [80]. With three to seven studies per combination and 1.8 to 5.9 degrees of freedom, the pooled estimates below are exploratory.
Table 2.
Pooled effects of corrective interventions by outcome and comparator (correlated and hierarchical effects model, ρ = 0.60, REML, CR2 robust variance estimation). Positive values favor the correction.
Figure 3.
Forest plots of the six pooled outcome-comparator combinations. Each row shows one study [85, 100, 99, 82, 84, 89, 78, 79, 88, 70, 72, 95, 96, 71, 103, 87, 88, 95, 71, 103, 86, 87, 95, 94, 68, 67] with its effects aggregated assuming a within-study correlation of 0.60 (Hedges’ g, 95% CI), and the number of effects it contributes; the effect-level plots are provided in Figure S2. The diamond marks the pooled estimate from the correlated and hierarchical effects model with CR2 robust variance estimation, and the bar under it spans the 95% prediction interval. In (a), the design subtotals are descriptive common-effect estimates. All pooled estimates are exploratory. A positive value favors the correction. (a) Acceptance of the false claim vs. uncorrected misinformation (C1); (b) acceptance vs. unexposed control (C2); (c) correct knowledge vs. unexposed control; (d) attitude vs. unexposed control; (e) purchase or consumption intention vs. unexposed control; (f) willingness to pay vs. unexposed control, by whether the false claim was shown in the experiment; only one effect in (f) came from a real-money auction [67].
Acceptance of the false claim versus uncorrected misinformation (RQ1). Four studies with seven effects compared a correction with exposure to the same misinformation without correction [82,85,99,100]; in two of them, the comparison was within participants, between acceptance measured after the misinformation and again after the correction [82,99], and in the other two it was between parallel groups [85,100]. Participants who received the correction accepted the claim less, g = 0.49 (95% CI 0.27 to 0.70; Satterthwaite df = 2.0; p = 0.010). Heterogeneity was moderate (I2 = 69%; τ2 = 0.000; ω2 = 0.015) and the 95% prediction interval excluded zero (0.04 to 0.93). This is the only pooled estimate whose confidence and prediction intervals both lie above zero, but it rests on four studies and about two degrees of freedom. Analyzed descriptively by design, parallel-group contrasts gave g = 0.63 (95% CI 0.44 to 0.81) and within-participant contrasts g = 0.43 (0.34 to 0.52) (Table 2). A fifth parallel-group study, a ten-arm experiment on raw milk that compared eight corrections with the misinformation alone, could not be pooled for lack of the n per condition and is described in the narrative synthesis (Section 3.6) [80].
Acceptance of the false claim versus unexposed control (RQ1). Four studies with 13 effects compared a correction with a control that never saw the claim [78,79,84,89]. The pooled estimate favored the correction, g = 0.38 (95% CI 0.01 to 0.74; df = 3.0; p = 0.046), with high heterogeneity (I2 = 94%; prediction interval −0.62 to 1.37); leave-one-out estimates ranged from 0.26 to 0.44, and the confidence interval included zero when any three of the four studies were removed. This contrast is not a pure correction effect: the corrected participants also met the claim, restated in the correction, whereas the controls met neither. A positive value means that people who read a correction ended up accepting the claim less than people who were not exposed to it; in these four studies, which corrected beliefs that many participants already held, the truth-sandwich, boosting, and myth-busting messages lowered agreement below that of the unexposed control.
Correct knowledge versus unexposed control (RQ1). Seven studies with nine effects, six experiments with refutations of misconceptions about GM foods, five of them in written texts [70,72,88,96,103] and one in short narrated videos [71], and one experiment with health warning labels on sugary drinks [95], yielded g = 0.60 (95% CI 0.19 to 1.01; df = 5.9; p = 0.012), with high heterogeneity (I2 = 92%; τ2 = 0.130) and a prediction interval from −0.52 to 1.72. The largest knowledge gain came from one refutation-text experiment [88] and the smallest from the video experiment, g = 0.06 (95% CI −0.31 to 0.43) [71]; leave-one-out estimates ranged from 0.45 to 0.68, and without the refutation-text experiment with the largest gain, the estimate was 0.45 (95% CI 0.15 to 0.76).
Attitude toward the food, ingredient, or technology versus unexposed control (RQ2). Five studies with 19 effects [71,87,88,95,103] gave g = 0.37 (95% CI 0.01 to 0.73; df = 3.6; p = 0.046), I2 = 93%, prediction interval −0.47 to 1.20. The lower confidence limit was close to zero, and the interval included zero whenever any one of the five studies was left out (leave-one-out estimates 0.29 to 0.43). The study added during the revision found no additional improvement in attitudes after a refutation narrated in short videos relative to an expository video without refutation, g = −0.03 (95% CI −0.40 to 0.34), although attitudes improved from before to after the videos in all its conditions [71]; without it, the estimate was 0.43 with a lower confidence limit of −0.00003, as in the submitted version.
Purchase or consumption intention versus unexposed control (RQ3). Three studies with 14 effects [86,87,95] gave g = 0.29 (95% CI −0.06 to 0.64; df = 2.0; p = 0.069), I2 = 86%, prediction interval −0.60 to 1.18.
Willingness to pay versus unexposed control (RQ3). Three studies with 18 effects [67,68,94] gave g = 0.14 (95% CI −0.38 to 0.66; df = 1.8; p = 0.333), I2 = 84%, prediction interval −0.86 to 1.14. The three studies point in different directions: debunking, prebunking, and combined corrections of a GMO-risk claim produced effects on willingness to pay for apples close to zero and of both signs [94], whereas contingency information and refutations about supplements reduced willingness to pay by 0.2 to 0.4 standard deviations [67,68]. Only one of the 18 effects came from a real-money auction (the second experiment of [67]); the others were hypothetical bids or stated choices. The claim was shown before the correction in two of the studies [68,94] but not in the third, which corrected a belief that participants already held [67], and the pool combines false benefit claims about supplements with a false risk claim about GM foods, coded in opposite directions (Supplementary Table S11).
3.5. Sensitivity Analyses
Varying the assumed sampling correlation to 0.20 or 0.80 changed no rounded pooled estimate by more than 0.01; the lower confidence limits for acceptance vs. C2 (0.013 and 0.011) and for attitude (0.008 and 0.012) stayed above zero, though close to it (Supplementary Table S9). Restricting the analyses to principal contrasts moved five of the six estimates upward (acceptance vs. C1, 0.59; acceptance vs. C2, 0.50; knowledge, 0.63; intention, 0.41; willingness to pay, 0.18), because secondary contrasts tend to compare weaker variants of the correction, and left attitude practically unchanged (0.36). Removing approximated effect sizes (S3; Supplementary Table S8) removed only the willingness-to-pay effects derived from F statistics [67], which left the first five estimates unchanged and the willingness-to-pay estimate non-estimable. Restricting the analyses to studies with experimental exposure to the misinformation (S2) left acceptance vs. C1 unchanged and every combination with an unexposed control below three studies. Restricting C1 contrasts to parallel groups (S1) left two studies, below the threshold for pooling; analyzed descriptively, parallel-group contrasts gave g = 0.63 (95% CI 0.44 to 0.81; I2 = 51%) and within-participant contrasts g = 0.43 (0.34 to 0.52; I2 = 0%), a difference of −0.19 (SE 0.11; p = 0.066); with the Hartung-Knapp-Sidik-Jonkman adjustment, the corresponding intervals were −1.10 to 2.37 and 0.10 to 0.76 (Table 2; Supplementary Table S9). Assuming pre–post correlations of 0.30 or 0.70 gave 0.49 (0.26 to 0.72) and 0.48 (0.28 to 0.68). With a study-level model and the Hartung-Knapp-Sidik-Jonkman adjustment, the estimates were 0.50 (0.25 to 0.74) for acceptance vs. C1, 0.36 (0.04 to 0.67) for acceptance vs. C2, 0.62 (0.22 to 1.03) for knowledge, 0.41 (0.05 to 0.76) for attitude, 0.30 (0.12 to 0.49) for intention, and 0.17 (−0.25 to 0.58) for willingness to pay. The Bayesian model with a half-normal prior of scale 0.5 on τ gave posterior medians and 95% credible intervals of 0.49 (0.26 to 0.78), 0.36 (0.03 to 0.69), 0.62 (0.23 to 1.01), 0.41 (0.06 to 0.73), 0.31 (0.06 to 0.57), and 0.16 (−0.21 to 0.57), respectively; with a scale of 1.0, the intervals for acceptance vs. C2 (−0.05 to 0.76), attitude (0.00 to 0.78), and intention (−0.02 to 0.65) were wider. The alternative models thus led to the same conclusions for acceptance vs. C1, knowledge and willingness to pay; for intention, whose primary interval included zero, their intervals excluded zero, except with the wider prior; and for acceptance vs. C2 and attitude, whose primary intervals excluded zero by a small margin, the interval with the wider prior included zero for acceptance vs. C2 and had a lower limit of 0.00 for attitude. The correlated and hierarchical effects model was retained as the primary analysis because averaging within studies discards the variation among their effects (Supplementary Table S9). Leave-one-out ranges were 0.45–0.54 for acceptance vs. C1, 0.26–0.44 for acceptance vs. C2, 0.45–0.68 for knowledge and 0.29–0.43 for attitude with the primary model and, with the study-level model, 0.27–0.35 for intention and 0.10–0.26 for willingness to pay; for attitude, the confidence interval included zero whenever any one of the five studies was left out. Two studies at high risk of bias contributed to pooled estimates. Removing [85] gave 0.49 (0.12 to 0.85) for acceptance vs. C1; removing [95] gave 0.66 (0.15 to 1.17) for knowledge and 0.43 (−0.05 to 0.92) for attitude, whose interval then included zero, and left two studies for intention (0.35, 0.26 to 0.45). Small-study effects were not assessed because no combination had ten studies.
3.6. Narrative Synthesis
Combinations with fewer than three studies with effect sizes. Willingness to pay versus uncorrected misinformation was examined in three studies, one with a real-money auction, one with hypothetical bids and one with an incentive-compatible conjoint task: an enhanced refutation of the claim that vitamin C in blood oranges cures cancer reduced auction bids by 7% relative to the bids placed after the misinformation, whereas a tentative refutation did not [82]; refutations of a vitamin E claim reduced bids by 0.25–0.34 standard deviations relative to the misinformation-only group [68]; and, after an advertisement implying that GMOs are harmful, only debunking by the competing firm, not by the media or a regulator, significantly increased willingness to pay for a shake with GMOs in the full sample, an effect that was no longer significant among participants who passed the verification checks, whereas the effect averaged over the three sources was positive but not significant [66]. The last study reported willingness to pay in dollars estimated from a choice model, which could not be converted into a standardized mean difference, so this combination did not reach three studies with effect sizes. Purchase intention versus uncorrected misinformation was measured in two studies: in the ten-arm experiment on raw milk, synthesized narratively, all four debunking messages and the prebunking message from the WHO lowered the intention to drink raw milk (standardized regression coefficients −0.08 to −0.11, p < 0.05), whereas the other three prebunking messages did not (−0.02 to −0.04) [80]; and inoculation produced a small reduction in avoidance intention whose confidence interval included zero [76]. Correct knowledge versus uncorrected misinformation was measured in two studies, with effects favoring the correction [85,106]. Sharing was measured in two studies against uncorrected misinformation: a refutation of a seafood-radiation rumor reduced the intention to spread it, while a denial and an attack on the source did not [99]; and refutations reduced the intention to share a vitamin E article by 0.3–0.6 standard deviations [68]. Intention to correct the misinformation on social media was compared with an unexposed control that read a recipe post in one report of two experiments, which did not report n or standard deviations per condition: messages from the CDC that refuted a raw-milk claim and stressed its consequences raised this intention among students and adults, the same message from a layperson did so only among students, and a call to action, whose main effect was estimated across corrective and control posts, lowered it among students and did not significantly change it among adults [101]. Perceived credibility of the corrective message was compared only against alternative corrections: a chatbot with high stated expertise was judged more credible than one with low expertise [98], a human expert fact-checker more credible than an AI-based one [92], and a simple refutation with factual elaboration received more attention than a simple refutation without changing sharing intention [93]. Risk perception and policy support were measured in a single eligible C2 contrast [95].
Type, source, and format of the correction (RQ4). Across studies that compared corrective formats, refutation texts that named the misconception and explained the correct account outperformed expository texts for knowledge [70,72,96,97,103]; in one of them, seductive pictures added to the texts reduced learning [70], and in another study, three refutation texts that differed in their supporting information improved knowledge from before to after reading, with no significant differences among them [69]. When the refutation was delivered as a short video narrated by a virtual human, neither the refutation nor added deep reasoning questions improved knowledge or attitudes relative to an expository video [71]. Truth-sandwich formats lowered agreement with nutrition myths relative to plain corrections or controls [78,84,91], and corrections that supplied a causal alternative or explicit contingency information produced larger effects on belief and willingness to pay than simple denials [67,81,99]. In the ten-arm experiment on raw milk, debunking reduced misperceptions more consistently than prebunking relative to uncorrected misinformation (standardized regression coefficients −0.13 to −0.17 for the four debunking messages, all p < 0.001, vs. −0.04 to −0.14 for prebunking, significant only for the two WHO accounts); expert corrections outperformed non-expert ones only in the immediate measurement, and labeling the source as AI made little difference [80]. Expert sources were more effective than peer sources for belief accuracy when social endorsement was low, and equally effective when it was high [106]; one study found no source difference for intention to share the correction [107]. In a multiple-document experiment on GMOs, misconception prevalence was lower and understanding higher when the texts were attributed to high- rather than low-credibility sources, whereas the refutation structure improved fine-grained integration of information across documents but not misconception prevalence [73]. Accuracy labels attached to an inaccurate dietary tip reduced its credibility and the intention to follow it [83], and warning labels on sugary drinks reduced hypothetical selection [95]. The only study that tested inoculation alone found small reductions in the credibility of a GM-cancer claim and in avoidance intention, with confidence intervals that included zero [76].
Prior attitudes (RQ4). Of the 25 studies that measured prior attitudes or beliefs, those that tested moderation mostly reported a consistent pattern: corrections produced larger belief changes among participants who initially held the misperception or underestimated scientific consensus [74,75,79], and attitude change lagged behind knowledge change in students with strong prior attitudes toward GM foods [97,103]. In another study, trust in science, but not pre-existing beliefs, moderated the effect of myth-busting messages, and the reduction in misconceptions was in turn associated with greater attitude change [89]. One study reported a possible attitudinal backfire, in which greater knowledge after refutation was associated with less favorable attitudes among initially opposed participants [103]; another classified 19.7% of its participants as showing a knowledge backfire and 14% an attitude backfire at the individual level, with no differences among its three refutation texts [69]; no study reported a belief backfire at the group level.
Persistence (RQ5). Only four studies measured outcomes after at least 24 h, and two of them found that the immediate advantage had disappeared. The advantage of a consensus-plus-boosting message over a consensus-only message on belief in a GM claim was not detectable at about two weeks [79], and the agreement differences produced by truth-sandwich texts about meat myths were no longer present at 16 days [78]. The exceptions were a brochure correcting the belief that organic poultry carries less bacterial contamination, which still raised objective knowledge four weeks later (g = 0.80 vs. control) [77], and a two-wave experiment on raw milk, in which all groups, including the misinformation-only group, read a corrective debriefing at the end of the first session, so that the measurement one week later compares each correction plus the debriefing with the debriefing alone (C3): misperceptions were then still lower after the four debunking messages and the WHO prebunking message (standardized regression coefficients −0.08 to −0.14, vs. −0.13 to −0.17 for the debunking messages immediately), and intention to drink raw milk after three of the debunking messages and the WHO prebunking message (−0.07 to −0.09) [80]. No study measured a behavioral outcome at follow-up.
Platform-deployed corrections and misinformation effects. No study evaluated a correction deployed by a platform under field conditions. Three studies instead measured how much harm the misinformation itself did relative to a clean control. A GMO-risk message cut willingness to pay for bioengineered and gene-edited apples by 0.40 and 0.48 USD per pound [94]; after debunking, willingness to pay for bioengineered apples remained 0.41 USD per pound below the control, whereas after prebunking or the combined correction it no longer differed significantly from the control [94]. A false article about vitamin E did not raise hypothetical willingness to pay above the control value, but both refutations lowered it relative to the misinformation-only group [68]. An advertisement implying that GMOs are harmful did not significantly change willingness to pay for a shake with GMOs, which was already negative in the control condition [66].
3.7. Certainty of Evidence
Certainty was very low for all six pooled outcomes (Table 3). Every combination was downgraded for risk of bias (no contributing study at low risk), acceptance vs. C1 by two levels, because two of its four studies contributed within-participant contrasts at serious risk of bias with ROBINS-I [82,99] and a third was at high risk with RoB 2 [85]. All combinations were also downgraded for imprecision (three to seven studies, few degrees of freedom, and confidence intervals compatible with no effect or with effects of very different size). Inconsistency was rated serious for acceptance vs. C1 and very serious for the other five combinations, where I2 exceeded 80% and prediction intervals crossed zero widely. Indirectness was rated serious for knowledge, attitude, intention, and willingness to pay, because the contributing studies came from one or two topics and used stated or hypothetical measures. Publication bias could not be assessed with fewer than ten studies per combination; it was not used to rate down certainty, which does not imply that it is absent. The combinations with fewer than three studies with effect sizes (perceived credibility, risk perception and policy support, knowledge, intention and willingness to pay vs. C1, and sharing) were not graded.
Table 3.
GRADE summary of findings for the six pooled outcomes (randomized experiments, including within-participant contrasts assessed with ROBINS-I; starting level high).
4. Discussion
4.1. Principal Findings
This review brought together 42 studies on the correction of food-related misinformation, published in communication, psychology, education, marketing, agricultural economics and food science journals that seldom cite one another. The clearest, though still fragile, finding concerns belief: when a false food claim was corrected rather than left standing, acceptance of the claim fell by just under half a standard deviation, a moderate effect whose prediction interval did not reach zero. This estimate rests on four studies, two of which contributed within-participant pre–post contrasts at serious risk of bias, and the two designs gave somewhat different estimates (0.63 for parallel groups and 0.43 within participants). Relative to an unexposed control, corrections may also have reduced acceptance of the claim (0.38), although the lower confidence limit was close to zero and the estimate varied with the study left out (0.26 to 0.44), and they may have increased correct knowledge (0.60); the pooled gain in knowledge is moderate but rests mainly on refutation texts about GM foods and varies a great deal from study to study. Attitudes may also have improved (0.37, a small to moderate effect), but this estimate is the most fragile of the four: its lower confidence limit was close to zero, and the interval included zero whenever any one of its five studies was left out. Purchase intention and willingness to pay are a different matter. Their pooled estimates are small (0.29 and 0.14), and their confidence intervals include zero. Only four studies measured outcomes after the session: the advantages of the corrections on belief had faded at 14 and 16 days in two of them [78,79], whereas a brochure still improved knowledge after four weeks in a third [77]; in the fourth, misperceptions about raw milk were still lower one week later after the debunking messages than in the misinformation-only group, but all groups had read a corrective debriefing at the end of the first session, so this comparison is with another correction (C3) rather than with uncorrected misinformation [80]. Every one of these estimates was graded as very low certainty, and all pooled analyses are exploratory; they describe where a thin evidence base currently stands, not settled parameters.
4.2. Comparison with Previous Syntheses
The acceptance-vs-misinformation estimate of g = 0.49 is smaller than the debunking effect reported by Chan et al. [14] as well as the overall correction effect of Walter & Murphy (r = 0.35, about d = 0.75) [24], who found corrections of political and marketing misinformation less effective than corrections of health misinformation (r = 0.27, about d = 0.56); it is close to the effect of health corrections on social media reported by Walter et al. (d = 0.40) [26]. It is larger than the average effect in the corrected synthesis of science-relevant misinformation by Chan & Albarracín (d = 0.11) [27], an average that a re-analysis attributed to the pooling of two distinct types of effect [28] and that the original authors defended [29]. Whether a continued influence of the kind documented by Walter & Tukachinsky [25] persists after correction could not be examined directly: the four studies that compared corrected participants with an unexposed control all corrected beliefs that participants already held rather than a claim shown in the experiment, and in them the corrected participants ended up accepting the claim less than the controls. Two features of the present estimate deserve mention. It rests on four studies, two of which measured belief before and after the correction within the misinformation group, a design that cannot separate the correction from testing effects and regression to the mean; analyzed separately, these contrasts gave a smaller estimate (0.43) than the parallel-group contrasts (0.63). It also comes mostly from claims that are not politically polarized in the countries studied, such as radiation in seafood, vitamin C, and cancer, or allergic reactions to GM corn, which may make them easier to correct than the partisan claims that dominate earlier meta-analyses [23,108,109].
The knowledge estimate rests mainly on a specific tradition: refutation texts in educational psychology that name a misconception, state that it is wrong and explain the correct account [88,96,97,103]; five of the seven studies in the pooled estimate used such texts [70,72,88,96,103], a sixth adapted the refutation of one of them [88] into short videos narrated by a virtual human and found no advantage over an expository video [71], and the seventh tested health warning labels on sugary drinks [95]. Across scientific topics, a meta-analysis that compared refutation with non-refutation texts found a smaller advantage for accurate beliefs (g = 0.37; 67 studies) and no detectable effect on attitudes (g = 0.08; seven studies) [45]. In the present review, the heterogeneous effects of these texts on knowledge, combined with much smaller effects on attitudes toward GM foods, replicate the dissociation between belief and attitude change that Chan & Albarracín [27] and the inoculation literature [15,17] describe. For consumers, this dissociation is the central problem: knowing that GM foods are not cloned does not by itself make them more willing to buy them, and attitudes anchored in intuitions about naturalness respond weakly to factual correction [8,9,10].
4.3. Beliefs Move, Purchases Barely Do
The behavioral results are the most policy-relevant and the least conclusive. The pooled estimates for purchase intention (g = 0.29) and willingness to pay (g = 0.14) are small, and both confidence intervals include zero. Only one of the 18 willingness-to-pay effects in the pooled estimate came from a real-money auction [67], and the pool combines false benefit claims about supplements with a false risk claim about GM foods, whose effects were coded in opposite directions (Supplementary Table S11); it is therefore a heterogeneous summary rather than an estimate of a single effect. Against a misinformation baseline, an enhanced refutation lowered real-money bids for blood oranges by 7%, whereas a tentative refutation did not [82], and both refutations of a vitamin E claim lowered hypothetical bids [68]. In an incentive-compatible conjoint task, only debunking by a competing firm, not by the media or a regulator, significantly increased willingness to pay for a shake with GMOs after an advertisement implying that GMOs are harmful, although the differences between sources were not significant and the effect of the competitor was not significant among participants who passed the verification checks [66]. This pattern is consistent with the intention–behavior gap [33,34] and with hypothetical bias in stated willingness to pay [35,36], and it reinforces the long-standing observation in food acceptance research that information alone rarely shifts valuation of stigmatized foods [6,7,32]. Contingency information, showing that most people who take a supplement derive no benefit, lowered multivitamin bids in the most complete of the contingency conditions of one experiment, relative to a weak refutation [81], and in both experiments of another article, more with real money (g = 0.38) than with hypothetical bids (g = 0.27) [67]. This tentatively suggests that corrections framed around the causal evidence for a claimed benefit may travel further toward behavior than corrections framed around the falsity of a statement [11,13].
4.4. Features of Effective Corrections
The narrative comparisons align with general recommendations for debunking: explanations beat denials, alternative accounts beat retractions, and trusted expert sources beat peer sources when the audience has no other cue to the correction’s quality [11,13,14,99,106]. Truth-sandwich formats, which have become a standard recommendation for health communicators [11,13], lowered agreement with nutrition myths in three studies [78,84,91], although their advantage over plain corrections was inconsistent and did not survive a 16-day delay in the one study that tested it [78]. Credibility cues on food content worked in the direction expected from the broader labelling literature [18,19,20]: an accuracy label reduced the credibility of a dietary tip [83], and warning labels on sugary drinks reduced hypothetical selection [95]. A single study tested inoculation alone and found small, imprecise effects for a GM-cancer claim [76]; in a five-arm experiment, willingness to pay for bioengineered apples no longer differed significantly from the control after prebunking, alone or combined with debunking [94]; and in a ten-arm experiment on raw milk, prebunking reduced misperceptions, though less consistently than debunking [80]. Given the consistent gains that prebunking has produced in other domains [15,16,17], the scarcity of inoculation trials on food claims is a conspicuous gap.
Backfire effects were essentially absent at the group level. No study reported a group-level belief backfire; one reported a possible attitudinal backfire among initially opposed students [103], and another classified 19.7% of its participants as showing a knowledge backfire and 14% an attitude backfire at the individual level [69]. The group-level pattern mirrors the failure of the backfire effect to replicate elsewhere [21,22,23] and suggests that fear of entrenching misperceptions is not a reason to withhold corrections about food, although individual-level reversals deserve to be measured in future trials.
4.5. Implications for Practice and Research
For communicators and regulators, the evidence allows only tentative suggestions, given its very low certainty. Within the limits of this review, corrections of specific false food claims that explain why the claim is wrong and supply the correct account, preferably from sources with recognized expertise, may reduce belief in the claim, but they should not be expected to change purchasing by themselves. Proposed by the authors, and not yet tested in the included studies, are the pairing of corrections with structural measures such as labels at the point of choice, the use of contingency or base-rate information for claimed health benefits, and repeated exposure to maintain gains beyond the first two weeks.
For researchers, the gaps are clear. Twenty-one of the 42 studies were conducted wholly or partly in the United States and none in Latin America, Africa, or South Asia, where food misinformation on messaging platforms is widespread [2,3]; for Latin America, this gap may partly reflect the sources searched (Section 4.6). Only four studies measured outcomes after 24 h, and none measured behavior at follow-up; only four used real or probabilistic payment. Inoculation was tested alone in one study [76] and as one arm or component of three multi-arm experiments [79,80,94], corrections deployed by a platform in none, and accuracy or algorithmic labels in a handful of experiments. Because almost every outcome was self-reported, no study escaped at least some concerns in RoB 2, and two-thirds of the articles did not say how many participants were dropped after attention checks. What is needed from the next trials is not complicated: pre-registration, the n per arm before and after exclusions, at least one behavioral outcome that costs the participant something, a follow-up at two weeks or later, and data shared in a form from which any contrast between conditions can be recomputed.
4.6. Strengths and Limitations
The review used a dated protocol with a documented amendment, four databases plus citation searching and contact with authors, duplicate screening with high agreement, an explicit rule for what counts as a false claim, RoB 2 with two independent assessments, ROBINS-I for the within-participant contrasts, and a synthesis model that handles the dependence created by multiple effects per study [54,55]. It also has limitations that readers should weigh. Version 1.0 of the protocol is dated 7 October 2026, after three of the four database searches had been run and on the day the records were imported for screening, and the protocol was registered in PROSPERO (CRD420261533126) on 8 October 2026, after screening had begun; protection against selective reporting therefore rests on the dated protocol file and its amendment rather than on a prospective registry entry, and it covers the risk-of-bias assessment and the analyses but not the searches and screening; the registered record also differs from this report in the respects listed in Section 2.1. At submission, 13 of the 64 reports sought (20%; six from the databases and seven from citation searching) could not be retrieved, because they were behind paywalls not covered by the institutional subscription. The authors of 12 of them were asked for a copy on 4 November 2026, during the revision; by 7 November 2026, they had sent eight, four of the six from the databases and four of the six from citation searching, and one author also sent a further study of their own that the searches had not identified, while the working paper of another report was publicly available and was used [66]. Three of the 66 reports sought (4.5%) remain unretrieved, all behind paywalls, because their authors had not replied by 7 November 2026; they are listed with the routes attempted in Supplementary Table S5. No inter-library loan request is recorded for them (IDs 293, 677, and 678), and the institutional subscription did not cover them; replies received after 7 November 2026 were not integrated into this revision. Because their content is unknown, their absence may bias the pooled estimates in either direction; willingness to pay and sharing, which rest on the fewest studies, are the most exposed. The reference list of a recent meta-analysis of refutation texts, sent by one of its authors, was not a source foreseen in the protocol; it was screened in full with the same criteria and added one study (Section 3.1). One report was assessed from the authors’ working paper and could not be pooled [66], two reports on raw milk that gave neither the n nor the standard deviations per condition were synthesized narratively [80,101], and citation searching was not repeated for the studies added during the revision. The open-access report that could not be downloaded at submission was read in the publisher’s HTML version during the revision and excluded at full text (Supplementary Table S6). The grey-literature and supplementary searches specified in the protocol and in the PROSPERO record were not run, and no author was contacted for missing data, although both documents foresaw it, so the review may under-represent unpublished null results and over-represent studies with reportable statistics. The bibliographic databases specific to food science and agricultural economics (CAB Abstracts, FSTA, AGRIS, AgEcon Search) and the regional sources planned in the protocol (SciELO, Redalyc, Dialnet) were not searched either; experiments from these fields and studies published in Spanish or Portuguese are probably under-represented, and the absence of Latin American studies may partly reflect the search rather than the literature. With three to seven studies per combination, the pooled estimates are exploratory and fragile; moderators could not be tested, and small-study effects and publication bias could not be assessed [63,64]. The estimate for acceptance vs. C1 combines parallel-group contrasts with within-participant contrasts at serious risk of bias; analyzed separately, the two designs gave 0.63 and 0.43, each from two studies. A few effect sizes were derived from F statistics, from standard errors of covariate-adjusted means or from ordinal measures; removing them changed no pooled estimate except willingness to pay, which could then no longer be pooled. Since both reviewers were working from screening proposals generated against the same written rules (Section 2.9), part of the high agreement reflects how reproducible those rules are; the κ values would probably have been lower had the two reviewers read the records without that assistance. The agreement reported for the material added during the revision (Section 3.1) is agreement between two AI-assisted passes run with the same written rules, not between independent human reviewers, and the ratification by the reviewers and authors does not replace an independent human assessment. A last limitation is one of definition. We read “false claim” literally and therefore left out studies of quantitative misperceptions and of open scientific controversies. A looser definition would have brought in more studies, at the cost of blurring the line between correcting misinformation and ordinary nutrition education.
5. Conclusions
Across the available experiments, and in exploratory pooled analyses of three to seven studies each, corrections aimed at a specific false claim about food reduced acceptance of that claim relative to leaving it uncorrected (g = 0.49, four studies, two of them with within-participant contrasts), may have reduced acceptance relative to unexposed controls (g = 0.38, four studies, with a lower confidence limit close to zero), may have improved correct knowledge (g = 0.60, seven studies, six of them refutations of misconceptions about GM foods) and may have improved attitudes (g = 0.37, five studies, with a lower confidence limit close to zero). The confidence intervals included zero for purchase intention (g = 0.29) and willingness to pay (g = 0.14), so the effects of corrections on choices remain uncertain. Evidence on persistence comes from four studies: the advantages of the corrections on belief had faded at 14 and 16 days in two of them, whereas a brochure still improved knowledge after four weeks in a third and, in the fourth, misperceptions about raw milk one week later were lower after debunking than after a corrective debriefing alone; no study measured behavior at follow-up. The evidence behind every one of these numbers was graded very low: 42 studies, none of them at low risk of bias, most of them measuring self-reported outcomes a few minutes after a single message.
What this means for practice is that an explanatory correction from an expert source may move beliefs about a specific food claim, but there is as yet no evidence that it changes purchases on its own: none of the included studies observed real purchases outside the laboratory, and the behavioral evidence consists of stated intentions, hypothetical choices, three real-money auctions, and one incentive-compatible conjoint task. What it means for research is that the studies still missing are those that test inoculation and point-of-choice labels on food claims, measure real purchases or pay participants real money and come back to them later, and recruit outside North America and Western Europe. The data and code for every estimate are provided so that these conclusions can be updated as the three unretrieved reports and new trials become available.
Supplementary Materials
The following supporting information can be downloaded at: https://www.mdpi.com/article/10.3390/foods15224110/s1, Table S1: PRISMA 2020 checklists; Table S2: PRISMA-S checklist; Table S3: Search strategies, dates and record counts per database and validation of the PubMed string; Table S4: Records excluded at title and abstract by first failing criterion; Table S5: Reports not retrieved and access routes attempted; Table S6: Reports excluded at full text with reasons; Table S7: Risk-of-bias judgements per domain and study (A, RoB 2 for the 42 studies; B, ROBINS-I for the two within-participant pre–post contrasts); Table S8: Effect sizes for all extracted contrasts; Table S9: Sensitivity and additional analyses; Table S10: Coding rules and borderline eligibility decisions; Table S11: Direction coding of effect sizes by outcome and claim type; Figure S1: Distribution of RoB 2 judgements by domain across the 42 included studies; Figure S2: Effect-level forest plots of the six pooled outcome-comparator combinations; File S1: Review protocol version 1.2 (version 1.1 with Amendment No. 1 and a dated clarification note); File S2: Analysis code and data (R scripts, CSV data, output); File S3: Review workbook version 2.8 and the prompts used with the AI tools.
Author Contributions
Conceptualization, L.A.O.S., P.E.C.C. and W.A.Z.V.; methodology, L.A.O.S., P.E.C.C. and W.A.Z.V.; software, W.A.Z.V.; validation, P.E.C.C., H.D.R.C.T. and G.A.S.Z.; formal analysis, W.A.Z.V. and G.A.S.Z.; investigation, L.A.O.S., P.E.C.C., H.D.R.C.T. and J.L.A.P.; resources, H.D.R.C.T. and J.L.A.P.; data curation, L.A.O.S., H.D.R.C.T. and G.A.S.Z.; writing—original draft preparation, L.A.O.S., P.E.C.C. and W.A.Z.V.; writing—review and editing, H.D.R.C.T., G.A.S.Z., J.L.A.P. and E.H.M.; visualization, W.A.Z.V. and G.A.S.Z.; supervision, W.A.Z.V. and E.H.M.; project administration, L.A.O.S. and W.A.Z.V.; funding acquisition, L.A.O.S. and W.A.Z.V. All authors have read and agreed to the published version of the manuscript.
Funding
This research was funded by Universidad Estatal Península de Santa Elena, grant number GsYD_001c. The APC was funded by Universidad Estatal Península de Santa Elena.
Institutional Review Board Statement
Not applicable.
Informed Consent Statement
Not applicable.
Data Availability Statement
The data extracted from the included studies, the effect-size file, the R scripts, and the session information are provided in Supplementary File S2. The registration record is available in PROSPERO (https://www.crd.york.ac.uk/PROSPERO/view/CRD420261533126, accessed on 8 November 2026). The complete review workbook (version 2.8), with the screening decisions, extraction forms, risk-of-bias judgements and effect sizes, and the prompts used with the AI tools are provided in Supplementary File S3, and the protocol in Supplementary File S1; all supplementary files are distributed under the CC BY 4.0 license of the article. Further inquiries can be directed to the corresponding author.
Acknowledgments
The authors thank the psychologists Karla Yaritza Belduma Cabrera, Viviana Alexandra Carrera Panchana and Carlos Alexy Lucas Mero (Universidad Estatal Península de Santa Elena), who served as reviewers R1, R2 and R3 during study selection, data extraction and risk-of-bias appraisal; Carlos Alexy Lucas Mero also peer-reviewed the search strategies. During the preparation of this study, the authors used Perplexity (Perplexity AI, 2026) and Gemini (Google LLC, 2026) for the purposes described in Section 2.9 (screening proposals, first-pass extraction and risk-of-bias entries, script checks and, during the revision, the reviewer passes). The authors have reviewed and edited the output and take full responsibility for the content of this publication.
Conflicts of Interest
The authors declare no conflicts of interest. The funder had no role in the design of the study; in the collection, analyses, or interpretation of data; in the writing of the manuscript; or in the decision to publish the results.
Abbreviations
The following abbreviations are used in this manuscript:
| CHE | Correlated and hierarchical effects model |
| CI | Confidence interval |
| CR2 | Bias-reduced linearization small-sample correction for robust variance estimation |
| CrI | Credible interval |
| GM | Genetically modified |
| GRADE | Grading of Recommendations, Assessment, Development and Evaluation |
| HKSJ | Hartung-Knapp-Sidik-Jonkman adjustment |
| PICOS | Population, Intervention, Comparator, Outcome, Study design |
| PRESS | Peer Review of Electronic Search Strategies |
| PRISMA | Preferred Reporting Items for Systematic Reviews and Meta-Analyses |
| RCT | Randomized controlled trial |
| RoB 2 | Revised Cochrane risk-of-bias tool for randomized trials |
| ROBINS-E | Risk Of Bias In Non-randomized Studies of Exposures |
| ROBINS-I | Risk Of Bias In Non-randomized Studies of Interventions |
| RQ | Research question |
| RVE | Robust variance estimation |
| SWiM | Synthesis Without Meta-analysis guideline |
| WTP | Willingness to pay |
References
- Diekman, C.; Ryan, C.D.; Oliver, T.L. Misinformation and Disinformation in Food Science and Nutrition: Impact on Practice. J. Nutr. 2023, 153, 3–9. [Google Scholar] [CrossRef] [Scilit]
- Suarez-Lledo, V.; Alvarez-Galvez, J. Prevalence of Health Misinformation on Social Media: Systematic Review. J. Med. Internet Res. 2021, 23, e17187. [Google Scholar] [CrossRef] [Scilit]
- Wang, Y.; McKee, M.; Torbica, A.; Stuckler, D. Systematic Literature Review on the Spread of Health-related Misinformation on Social Media. Soc. Sci. Med. 2019, 240, 112552. [Google Scholar] [CrossRef] [Scilit]
- Denniss, E.; Lindberg, R.; McNaughton, S.A. Quality and accuracy of online nutrition-related information: A systematic review of content analysis studies. Public Health Nutr. 2023, 26, 1345–1357. [Google Scholar] [CrossRef] [Scilit]
- Vosoughi, S.; Roy, D.; Aral, S. The spread of true and false news online. Science 2018, 359, 1146–1151. [Google Scholar] [CrossRef] [Scilit]
- Frewer, L.J.; Van Der Lans, I.A.; Fischer, A.R.H.; Reinders, M.J.; Menozzi, D.; Zhang, X.; Berg, I.v.D.; Zimmermann, K.L. Public perceptions of agri-food applications of genetic modification—A systematic review and meta-analysis. Trends Food Sci. Technol. 2013, 30, 142–152. [Google Scholar] [CrossRef] [Scilit]
- Lusk, J.L.; Roosen, J.; Bieberstein, A. Consumer Acceptance of New Food Technologies: Causes and Roots of Controversies. Annu. Rev. Resour. Econ. 2014, 6, 381–405. [Google Scholar] [CrossRef] [Scilit]
- Siegrist, M.; Hartmann, C. Consumer acceptance of novel food technologies. Nat. Food 2020, 1, 343–350. [Google Scholar] [CrossRef] [Scilit]
- Fernbach, P.M.; Light, N.; Scott, S.E.; Inbar, Y.; Rozin, P. Extreme opponents of genetically modified foods know the least but think they know the most. Nat. Hum. Behav. 2019, 3, 251–256. [Google Scholar] [CrossRef] [Scilit]
- Scott, S.E.; Inbar, Y.; Rozin, P. Evidence for Absolute Moral Opposition to Genetically Modified Food in the United States. Perspect. Psychol. Sci. 2016, 11, 315–324. [Google Scholar] [CrossRef] [Scilit]
- Ecker, U.K.H.; Lewandowsky, S.; Cook, J.; Schmid, P.; Fazio, L.K.; Brashier, N.; Kendeou, P.; Vraga, E.K.; Amazeen, M.A. The psychological drivers of misinformation belief and its resistance to correction. Nat. Rev. Psychol. 2022, 1, 13–29. [Google Scholar] [CrossRef] [Scilit]
- Johnson, H.M.; Seifert, C.M. Sources of the continued influence effect: When misinformation in memory affects later inferences. J. Exp. Psychol. Learn. Mem. Cogn. 1994, 20, 1420–1436. [Google Scholar] [CrossRef]
- Lewandowsky, S.; Ecker, U.K.H.; Seifert, C.M.; Schwarz, N.; Cook, J. Misinformation and Its Correction: Continued Influence and Successful Debiasing. Psychol. Sci. Public Interest. 2012, 13, 106–131. [Google Scholar] [CrossRef] [Scilit]
- Chan, M.S.; Jones, C.R.; Hall Jamieson, K.; Albarracín, D. Debunking: A Meta-Analysis of the Psychological Efficacy of Messages Countering Misinformation. Psychol. Sci. 2017, 28, 1531–1546. [Google Scholar] [CrossRef] [Scilit]
- Lewandowsky, S.; Van Der Linden, S. Countering Misinformation and Fake News Through Inoculation and Prebunking. Eur. Rev. Soc. Psychol. 2021, 32, 348–384. [Google Scholar] [CrossRef] [Scilit]
- Lu, C.; Hu, B.; Li, Q.; Bi, C.; Ju, X.D. Psychological Inoculation for Credibility Assessment, Sharing Intention, and Discernment of Misinformation: Systematic Review and Meta-Analysis. J. Med. Internet Res. 2023, 25, e49255. [Google Scholar] [CrossRef] [Scilit]
- Roozenbeek, J.; Van Der Linden, S.; Goldberg, B.; Rathje, S.; Lewandowsky, S. Psychological inoculation improves resilience against misinformation on social media. Sci. Adv. 2022, 8, eabo6254. [Google Scholar] [CrossRef] [Scilit]
- Kozyreva, A.; Lorenz-Spreen, P.; Herzog, S.M.; Ecker, U.K.H.; Lewandowsky, S.; Hertwig, R.; Ali, A.; Bak-Coleman, J.; Barzilai, S.; Basol, M.; et al. Toolbox of individual-level interventions against online misinformation. Nat. Hum. Behav. 2024, 8, 1044–1052. [Google Scholar] [CrossRef] [Scilit]
- Martel, C.; Rand, D.G. Misinformation warning labels are widely effective: A review of warning effects and their moderating features. Curr. Opin. Psychol. 2023, 54, 101710. [Google Scholar] [CrossRef] [Scilit]
- Pennycook, G.; Epstein, Z.; Mosleh, M.; Arechar, A.A.; Eckles, D.; Rand, D.G. Shifting attention to accuracy can reduce misinformation online. Nature 2021, 592, 590–595. [Google Scholar] [CrossRef] [Scilit]
- Nyhan, B. Why the backfire effect does not explain the durability of political misperceptions. Proc. Natl. Acad. Sci. USA 2021, 118, e1912440117. [Google Scholar] [CrossRef] [Scilit]
- Swire-Thompson, B.; DeGutis, J.; Lazer, D. Searching for the backfire effect: Measurement and design considerations. J. Appl. Res. Mem. Cogn. 2020, 9, 286–299. [Google Scholar] [CrossRef] [Scilit]
- Wood, T.; Porter, E. The Elusive Backfire Effect: Mass Attitudes’ Steadfast Factual Adherence. Political Behav. 2019, 41, 135–163. [Google Scholar] [CrossRef] [Scilit]
- Walter, N.; Murphy, S.T. How to unring the bell: A meta-analytic approach to correction of misinformation. Commun. Monogr. 2018, 85, 423–441. [Google Scholar] [CrossRef] [Scilit]
- Walter, N.; Tukachinsky, R. A Meta-Analytic Examination of the Continued Influence of Misinformation in the Face of Correction: How Powerful Is It, Why Does It Happen, and How to Stop It? Commun. Res. 2020, 47, 155–177. [Google Scholar] [CrossRef] [Scilit]
- Walter, N.; Brooks, J.J.; Saucier, C.J.; Suresh, S. Evaluating the Impact of Attempts to Correct Health Misinformation on Social Media: A Meta-Analysis. Health Commun. 2021, 36, 1776–1784. [Google Scholar] [CrossRef] [Scilit]
- Chan, M.S.; Albarracín, D. A meta-analysis of correction effects in science-relevant misinformation. Nat. Hum. Behav. 2023, 7, 1514–1525, Correction in Nat. Hum. Behav. 2025, 9, 1992–1994. https://doi.org/10.1038/s41562-025-02294-3. [Google Scholar] [CrossRef] [Scilit]
- Butler, L.H.; DeGutis, J.; Tay, L.Q.; Ecker, U.K.H.; Swire-Thompson, B. Corrections are effective for science misinformation. Nat. Hum. Behav. 2025, 9, 2458–2460. [Google Scholar] [CrossRef] [Scilit]
- Chan, M.S.; Albarracín, D. Reply to: Corrections are effective for science misinformation. Nat. Hum. Behav. 2025, 9, 2461–2470. [Google Scholar] [CrossRef] [Scilit]
- Heley, K.; Chou, W.Y.S.; D’Angelo, H.; Senft Everson, N.; Muro, A.; Rohde, J.A.; Gaysynsky, A. Mitigating Health and Science Misinformation: A Scoping Review of Literature from 2017 to 2022. Health Commun. 2025, 40, 79–89. [Google Scholar] [CrossRef] [Scilit]
- Caballero, A.; Chapi-Nitcheu, C.; Vallan, L.; Flahault, A.; Hasselgard-Rowe, J. Relationships Between Misinformation Variables and Nutritional Health Strategies: A Scoping Review. Int. J. Environ. Res. Public Health 2025, 22, 891. [Google Scholar] [CrossRef] [Scilit]
- McPhetres, J.; Rutjens, B.T.; Weinstein, N.; Brisson, J.A. Modifying attitudes about modified foods: Increased knowledge leads to more positive attitudes. J. Environ. Psychol. 2019, 64, 21–29. [Google Scholar] [CrossRef] [Scilit]
- Sheeran, P.; Webb, T.L. The Intention–Behavior Gap. Soc. Personal. Psychol. Compass 2016, 10, 503–518. [Google Scholar] [CrossRef] [Scilit]
- Webb, T.L.; Sheeran, P. Does changing behavioral intentions engender behavior change? A meta-analysis of the experimental evidence. Psychol. Bull. 2006, 132, 249–268. [Google Scholar] [CrossRef] [Scilit]
- Lusk, J.L.; Schroeder, T.C. Are Choice Experiments Incentive Compatible? A Test with Quality Differentiated Beef Steaks. Am. J. Agric. Econ. 2004, 86, 467–482. [Google Scholar] [CrossRef] [Scilit]
- Penn, J.M.; Hu, W. Understanding Hypothetical Bias: An Enhanced Meta-Analysis. Am. J. Agric. Econ. 2018, 100, 1186–1206. [Google Scholar] [CrossRef] [Scilit]
- Bode, L.; Vraga, E.K. See Something, Say Something: Correction of Global Health Misinformation on Social Media. Health Commun. 2018, 33, 1131–1140. [Google Scholar] [CrossRef] [Scilit]
- Vraga, E.K.; Bode, L. Using Expert Sources to Correct Health Misinformation in Social Media. Sci. Commun. 2017, 39, 621–645. [Google Scholar] [CrossRef] [Scilit]
- Page, M.J.; McKenzie, J.E.; Bossuyt, P.M.; Boutron, I.; Hoffmann, T.C.; Mulrow, C.D.; Shamseer, L.; Tetzlaff, J.M.; Akl, E.A.; Brennan, S.E.; et al. The PRISMA 2020 statement: An updated guideline for reporting systematic reviews. BMJ 2021, 372, n71. [Google Scholar] [CrossRef] [Scilit]
- Rethlefsen, M.L.; Kirtley, S.; Waffenschmidt, S.; Ayala, A.P.; Moher, D.; Page, M.J.; Koffel, J.B.; PRISMA-S Group. PRISMA-S: An extension to the PRISMA Statement for Reporting Literature Searches in Systematic Reviews. Syst. Rev. 2021, 10, 39. [Google Scholar] [CrossRef] [Scilit]
- Moher, D.; Shamseer, L.; Clarke, M.; Ghersi, D.; Liberati, A.; Petticrew, M.; Shekelle, P.; Stewart, L.A. Preferred reporting items for systematic review and meta-analysis protocols (PRISMA-P) 2015 statement. Syst. Rev. 2015, 4, 1. [Google Scholar] [CrossRef]
- Amir-Behghadami, M.; Janati, A. Population, Intervention, Comparison, Outcomes and Study (PICOS) design as a framework to formulate eligibility criteria in systematic reviews. Emerg. Med. J. 2020, 37, 387. [Google Scholar] [CrossRef] [Scilit]
- Vraga, E.K.; Bode, L. Defining Misinformation and Understanding its Bounded Nature: Using Expertise and Evidence for Describing Misinformation. Political Commun. 2020, 37, 136–144. [Google Scholar] [CrossRef] [Scilit]
- Walter, N.; Cohen, J.; Holbert, R.L.; Morag, Y. Fact-Checking: A Meta-Analysis of What Works and for Whom. Political Commun. 2020, 37, 350–375. [Google Scholar] [CrossRef] [Scilit]
- Danielson, R.W.; Jacobson, N.G.; Patall, E.A.; Sinatra, G.M.; Adesope, O.O.; Kennedy, A.A.U.; Bhat, B.H.; Ramazan, O.; Akinrotimi, B.; Nketah, G.; et al. The effectiveness of refutation text in confronting scientific misconceptions: A meta-analysis. Educ. Psychol. 2025, 60, 23–47. [Google Scholar] [CrossRef] [Scilit]
- Landis, J.R.; Koch, G.G. The Measurement of Observer Agreement for Categorical Data. Biometrics 1977, 33, 159–174. [Google Scholar] [CrossRef] [Scilit]
- Hedges, L.V. Distribution Theory for Glass’s Estimator of Effect Size and Related Estimators. J. Educ. Stat. 1981, 6, 107–128. [Google Scholar] [CrossRef] [Scilit]
- Morris, S.B.; DeShon, R.P. Combining effect size estimates in meta-analysis with repeated measures and independent-groups designs. Psychol. Methods. 2002, 7, 105–125. [Google Scholar] [CrossRef]
- Cohen, J. A power primer. Psychol. Bull. 1992, 112, 155–159. [Google Scholar] [CrossRef]
- Sterne, J.A.C.; Savović, J.; Page, M.J.; Elbers, R.G.; Blencowe, N.S.; Boutron, I.; Cates, C.J.; Cheng, H.Y.; Corbett, M.S.; Eldridge, S.M.; et al. RoB 2: A revised tool for assessing risk of bias in randomised trials. BMJ 2019, 366, l4898. [Google Scholar] [CrossRef] [Scilit]
- Sterne, J.A.; Hernán, M.A.; Reeves, B.C.; Savović, J.; Berkman, N.D.; Viswanathan, M.; Henry, D.; Altman, D.G.; Ansari, M.T.; Boutron, I.; et al. ROBINS-I: A tool for assessing risk of bias in non-randomised studies of interventions. BMJ 2016, 355, i4919. [Google Scholar] [CrossRef] [Scilit]
- Guyatt, G.; Oxman, A.D.; Akl, E.A.; Kunz, R.; Vist, G.; Brozek, J.; Norris, S.; Falck-Ytter, Y.; Glasziou, P.; DeBeer, H.; et al. GRADE guidelines: 1. Introduction—GRADE evidence profiles and summary of findings tables. J. Clin. Epidemiol. 2011, 64, 383–394. [Google Scholar] [CrossRef] [Scilit]
- Schünemann, H.J.; Cuello, C.; Akl, E.A.; Mustafa, R.A.; Meerpohl, J.J.; Thayer, K.; Morgan, R.L.; Gartlehner, G.; Kunz, R.; Katikireddi, S.V.; et al. GRADE guidelines: 18. How ROBINS-I and other tools to assess risk of bias in nonrandomized studies should be used to rate the certainty of a body of evidence. J. Clin. Epidemiol. 2019, 111, 105–114. [Google Scholar] [CrossRef] [Scilit]
- Pustejovsky, J.E.; Tipton, E. Meta-analysis with Robust Variance Estimation: Expanding the Range of Working Models. Prev. Sci. 2022, 23, 425–438. [Google Scholar] [CrossRef] [Scilit]
- Hedges, L.V.; Tipton, E.; Johnson, M.C. Robust variance estimation in meta-regression with dependent effect size estimates. Res. Synth. Methods 2010, 1, 39–65. [Google Scholar] [CrossRef] [Scilit]
- Tipton, E. Small sample adjustments for robust variance estimation with meta-regression. Psychol. Methods 2015, 20, 375–393. [Google Scholar] [CrossRef] [Scilit]
- Higgins, J.P.T.; Thompson, S.G.; Deeks, J.J.; Altman, D.G. Measuring inconsistency in meta-analyses. BMJ 2003, 327, 557–560. [Google Scholar] [CrossRef] [Scilit]
- IntHout, J.; Ioannidis, J.P.A.; Rovers, M.M.; Goeman, J.J. Plea for routinely presenting prediction intervals in meta-analysis. BMJ Open 2016, 6, e010247. [Google Scholar] [CrossRef] [Scilit]
- Campbell, M.; McKenzie, J.E.; Sowden, A.; Katikireddi, S.V.; Brennan, S.E.; Ellis, S.; Hartmann-Boyce, J.; Ryan, R.; Shepperd, S.; Thomas, J.; et al. Synthesis without meta-analysis (SWiM) in systematic reviews: Reporting guideline. BMJ 2020, 368, l6890. [Google Scholar] [CrossRef] [Scilit]
- IntHout, J.; Ioannidis, J.P.; Borm, G.F. The Hartung-Knapp-Sidik-Jonkman method for random effects meta-analysis is straightforward and considerably outperforms the standard DerSimonian-Laird method. BMC Med. Res. Methodol. 2014, 14, 25. [Google Scholar] [CrossRef] [Scilit]
- Röver, C.; Bender, R.; Dias, S.; Schmid, C.H.; Schmidli, H.; Sturtz, S.; Weber, S.; Friede, T. On weakly informative prior distributions for the heterogeneity parameter in Bayesian random-effects meta-analysis. Res. Synth. Methods. 2021, 12, 448–474. [Google Scholar] [CrossRef] [Scilit]
- Röver, C. Bayesian Random-Effects Meta-Analysis Using the bayesmeta R Package. J. Stat. Softw. 2020, 93, 1–51. [Google Scholar] [CrossRef] [Scilit]
- Rodgers, M.A.; Pustejovsky, J.E. Evaluating meta-analytic methods to detect selective reporting in the presence of dependent effect sizes. Psychol. Methods 2021, 26, 141–160. [Google Scholar] [CrossRef] [Scilit]
- Sterne, J.A.C.; Sutton, A.J.; Ioannidis, J.P.A.; Terrin, N.; Jones, D.R.; Lau, J.; Carpenter, J.; Rücker, G.; Harbord, R.M.; Schmid, C.H.; et al. Recommendations for examining and interpreting funnel plot asymmetry in meta-analyses of randomised controlled trials. BMJ 2011, 343, d4002. [Google Scholar] [CrossRef] [Scilit]
- Viechtbauer, W. Conducting Meta-Analyses in R with the metafor Package. J. Stat. Softw. 2010, 36, 1–48. [Google Scholar] [CrossRef] [Scilit]
- Fong, J.; Guo, T.; Rao, A. Debunking Misinformation About Consumer Products: Effects on Beliefs and Purchase Behavior. J. Mark. Res. 2024, 61, 659–681. [Google Scholar] [CrossRef] [Scilit]
- MacFarlane, D.; Hurlstone, M.J.; Ecker, U.K.H. Countering demand for ineffective health remedies: Do consumers respond to risks, lack of benefits, or both? Psychol. Health 2021, 36, 593–611. [Google Scholar] [CrossRef] [Scilit]
- MacFarlane, D.; Tay, L.Q.; Hurlstone, M.J.; Ecker, U.K.H. Refuting spurious COVID-19 treatment claims reduces demand and misinformation sharing. J. Appl. Res. Mem. Cogn. 2021, 10, 248–258. [Google Scholar] [CrossRef] [Scilit]
- Jacobson, N.G.; Thacker, I.; Sinatra, G.M. Here’s Hoping It’s not Just Text Structure: The Role of Emotions in Knowledge Revision and the Backfire Effect. Discourse Process. 2022, 59, 13–35. [Google Scholar] [CrossRef] [Scilit]
- Jin, G.; Ramazan, O.; Danielson, R.W. Effects of Refutational Texts and Seductive Pictures on Conceptual Change. J. Exp. Educ. 2024, 92, 605–625. [Google Scholar] [CrossRef] [Scilit]
- Schroeder, N.L.; Siegle, R.F.; Verma, V.; Craig, S.D. When Refutation and Deep Reasoning Questions Lose Their Edge: The Case of Short, Narrated Videos. J. Educ. Comput. Res. 2022, 60, 1197–1219. [Google Scholar] [CrossRef] [Scilit]
- Jin, G.; Danielson, R.W.; Ramazan, O. Resurrecting a classic design: Examining the refutational text effect using a Solomon four-group design. Discourse Process. 2025, 62, 112–132. [Google Scholar] [CrossRef] [Scilit]
- Butterfuss, R. Revising Misconceptions Using Multiple Documents. Doctoral Dissertation, University of Minnesota, Minneapolis, MN, USA, 2020. Available online: https://hdl.handle.net/11299/216409 (accessed on 8 November 2026).
- Bode, L.; Vraga, E.K.; Tully, M. Correcting Misperceptions About Genetically Modified Food on Social Media: Examining the Impact of Experts, Social Media Heuristics, and the Gateway Belief Model. Sci. Commun. 2021, 43, 225–251. [Google Scholar] [CrossRef] [Scilit]
- Vidigal, R.; Jerit, J. Issue Importance and the Correction of Misinformation. Political Commun. 2022, 39, 715–736. [Google Scholar] [CrossRef] [Scilit]
- Kuru, O. Literacy training vs. psychological inoculation? Explicating and comparing the effects of predominantly informational and predominantly motivational interventions on the processing of health statistics. J. Commun. 2025, 75, 64–78. [Google Scholar] [CrossRef] [Scilit]
- Bearth, A.; Cousin, M.; Siegrist, M. Uninvited Guests at the Table—A Consumer Intervention for Safe Poultry Preparation. J. Food Saf. 2013, 33, 394–404. [Google Scholar] [CrossRef] [Scilit]
- Seffen, A.E.; Weingarten, N.; Mai, C.; Dohle, S. Debunking meat myths using the truth sandwich: A longitudinal experiment among German meat consumers. Food Qual. Prefer. 2026, 135, 105704. [Google Scholar] [CrossRef] [Scilit]
- Van Stekelenburg, A.; Schaap, G.; Veling, H.; Buijzen, M. Boosting Understanding and Identification of Scientific Consensus Can Help to Correct False Beliefs. Psychol. Sci. 2021, 32, 1549–1565. [Google Scholar] [CrossRef] [Scilit]
- Tang, R.; Fang, Y.; Sun, J.; Bode, L.; Vraga, E.K. Automating Accuracy: Scalable Approaches to Correcting Disinformation With Artificial Intelligence on Social Media. J. Mass Commun. Q. 2025, 102, 1044–1070. [Google Scholar] [CrossRef] [Scilit]
- MacFarlane, D.; Hurlstone, M.J.; Ecker, U.K.H. Reducing demand for ineffective health remedies: Overcoming the illusion of causality. Psychol. Health 2018, 33, 1472–1489. [Google Scholar] [CrossRef] [Scilit]
- Selvaggi, R.; Nayga, R.M.; Pecorino, B.; Pappalardo, G. Exploring the effects of misinformation and refutations on product valuation. Q. Open. 2024, 4, qoae010. [Google Scholar] [CrossRef] [Scilit]
- Alblas, M.C.; Verhoeven, K.; Fischer, V.M. Message accuracy labels but not source verification labels affect message engagement and persuasion of nutrition-related social media content through information credibility. Sci. Rep. 2026, 16, 30067. [Google Scholar] [CrossRef] [Scilit]
- Blase, R.; Dohle, S. The Role of the Information Source in Debunking Health Myths Using the Truth Sandwich Format. Health Commun. 2026, 41, 2272–2284. [Google Scholar] [CrossRef] [Scilit]
- Calabrese, C.; Albarracín, D. Bypassing misinformation without confrontation improves policy support as much as correcting it. Sci. Rep. 2023, 13, 6005. [Google Scholar] [CrossRef] [Scilit]
- Greenacre, L.; Patrick, S.; Yang, R.; Jaeger, V.; Martin, J. Correcting misperceptions about stigmatized ingredients: MSG. Food Qual. Prefer. 2016, 48, 93–98. [Google Scholar] [CrossRef] [Scilit]
- Harris, J.L.; Phaneuf, L.; Fleming-Milici, F. Effects of Sugary Drink Countermarketing Videos on Caregivers’ Attitudes and Intentions to Serve Fruit Drinks and Toddler Milks to Young Children. Am. J. Public Health 2022, 112, S807–S816. [Google Scholar] [CrossRef] [Scilit]
- Heddy, B.C.; Danielson, R.W.; Sinatra, G.M.; Graham, J. Modifying Knowledge, Emotions, and Attitudes Regarding Genetically Modified Foods. J. Exp. Educ. 2017, 85, 513–533. [Google Scholar] [CrossRef] [Scilit]
- Klimmt, C.; Spreen, N. Bettering Biotech Foods’ Foul Flavor: An Experiment on Correcting Citizens’ Misconceptions About Genetic Modification. Sci. Commun. 2025, 47, 767–799. [Google Scholar] [CrossRef] [Scilit]
- Kotz, J.; Giese, H.; König, L.M. How to debunk misinformation? An experimental online study investigating text structures and headline formats. Br. J. Health Psychol. 2023, 28, 1097–1112. [Google Scholar] [CrossRef] [Scilit]
- König, L.M. Debunking nutrition myths: An experimental test of the ‘truth sandwich’ text format. Br. J. Health Psychol. 2023, 28, 1000–1010. [Google Scholar] [CrossRef] [Scilit]
- Lee, S.Y.; Liu, W. Exploring generative AI in the misinformation Era: Impacts as a misinformation source and fact-checker on belief in the information. Telemat. Inform. 2025, 101, 102308. [Google Scholar] [CrossRef] [Scilit]
- Lee, Y.I.; Mu, D.; Hsu, Y.C.; Wojdynski, B.W.; Binford, M. Misinformation or hard to tell? An eye-tracking study to investigate the effects of food crisis misinformation on social media engagement. Public Relat. Rev. 2024, 50, 102483. [Google Scholar] [CrossRef] [Scilit]
- Lin, L.; Ortega, D.L.; Sun, J. The effectiveness of misinformation corrective strategies and implications for consumers’ food preferences and policy attitudes. Appl. Econ. Perspect. Policy 2025, 47, 217–240. [Google Scholar] [CrossRef] [Scilit]
- Moran, A.J.; Roberto, C.A. Health Warning Labels Correct Parents’ Misperceptions About Sugary Drink Options. Am. J. Prev. Med. 2018, 55, e19–27. [Google Scholar] [CrossRef] [Scilit]
- Muis, K.R.; Sinatra, G.M.; Pekrun, R.; Winne, P.H.; Trevors, G.; Losenno, K.M.; Munzar, B. Main and moderator effects of refutation on task value, epistemic emotions, and learning strategies during conceptual change. Contemp. Educ. Psychol. 2018, 55, 155–165. [Google Scholar] [CrossRef] [Scilit]
- Muis, K.R.; Etoubashi, N.; Denton, C.A. The catcher in the lie: The role of emotions and epistemic judgments in changing students’ misconceptions and attitudes in a post-truth era. Contemp. Educ. Psychol. 2020, 62, 101898. [Google Scholar] [CrossRef] [Scilit]
- Ou, M.; Ho, S.S.; Wijaya, S.A. Harnessing AI to Address Misinformation on Cultivated Meat: The Impact of Chatbot Expertise and Correction Sidedness. Sci. Commun. 2025, 47, 859–896. [Google Scholar] [CrossRef] [Scilit]
- Paek, H.J.; Hove, T. Effective strategies for responding to rumors about risks: The case of radiation-contaminated food in South Korea. Public Relat. Rev. 2019, 45, 101762. [Google Scholar] [CrossRef] [Scilit]
- Scholz, S.; Dutke, S. When Corrections Don’t Stick: How Attitudes and Knowledge Shape the Persistence of Misinformation About Genetically Modified Food. Appl. Cogn. Psychol. 2026, 40, e70210. [Google Scholar] [CrossRef] [Scilit]
- Tang, R. Effects of problem-recognition messages from different sources and cues-to-action on promoting corrective efforts on social media. J. Commun. Manag. 2026, 30, 93–111. [Google Scholar] [CrossRef] [Scilit]
- Thacker, I.; Sinatra, G.M.; Muis, K.R.; Danielson, R.W.; Pekrun, R.; Winne, P.H.; Chevrier, M. Using persuasive refutation texts to prompt attitudinal and conceptual change. J. Educ. Psychol. 2020, 112, 1085–1099. [Google Scholar] [CrossRef] [Scilit]
- Trevors, G.J.; Muis, K.R.; Pekrun, R.; Sinatra, G.M.; Winne, P.H. Identity and Epistemic Emotions During Knowledge Revision: A Potential Account for the Backfire Effect. Discourse Process. 2016, 53, 339–370. [Google Scholar] [CrossRef] [Scilit]
- Tully, M.; Bode, L.; Vraga, E.K. Mobilizing Users: Does Exposure to Misinformation and Its Correction Affect Users’ Responses to a Health Misinformation Post? Soc. Media Soc. 2020, 6, 2056305120978377. [Google Scholar] [CrossRef] [Scilit]
- Vainio, A.; Irz, X.; Hartikainen, H. How effective are messages and their characteristics in changing behavioural intentions to substitute plant-based foods for red meat? The mediating role of prior beliefs. Appetite 2018, 125, 217–224. [Google Scholar] [CrossRef] [Scilit]
- Wang, Y. Debunking Misinformation About Genetically Modified Food Safety on Social Media: Can Heuristic Cues Mitigate Biased Assimilation? Sci. Commun. 2021, 43, 460–485. [Google Scholar] [CrossRef] [Scilit]
- Wang, Y. Engaging with misinformation and misinformation corrective messages on social media: Examining the role of source cues, social endorsement cues, and prior attitudes. Atl. J. Commun. 2024, 32, 499–511. [Google Scholar] [CrossRef] [Scilit]
- Nyhan, B.; Reifler, J. When Corrections Fail: The Persistence of Political Misperceptions. Polit. Behav. 2010, 32, 303–330. [Google Scholar] [CrossRef] [Scilit]
- Porter, E.; Wood, T.J. The global effectiveness of fact-checking: Evidence from simultaneous experiments in Argentina, Nigeria, South Africa, and the United Kingdom. Proc. Natl. Acad. Sci. USA 2021, 118, e2104235118. [Google Scholar] [CrossRef] [Scilit]
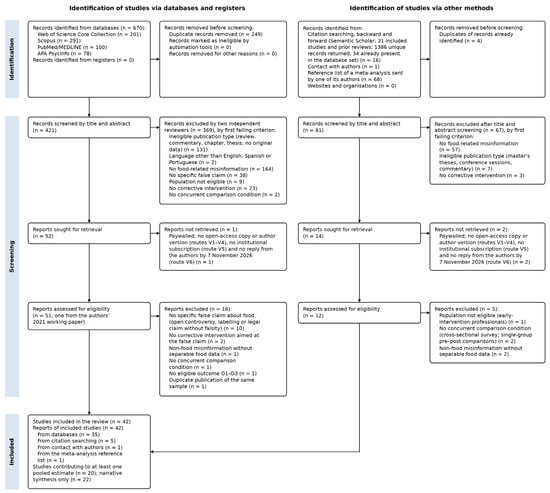
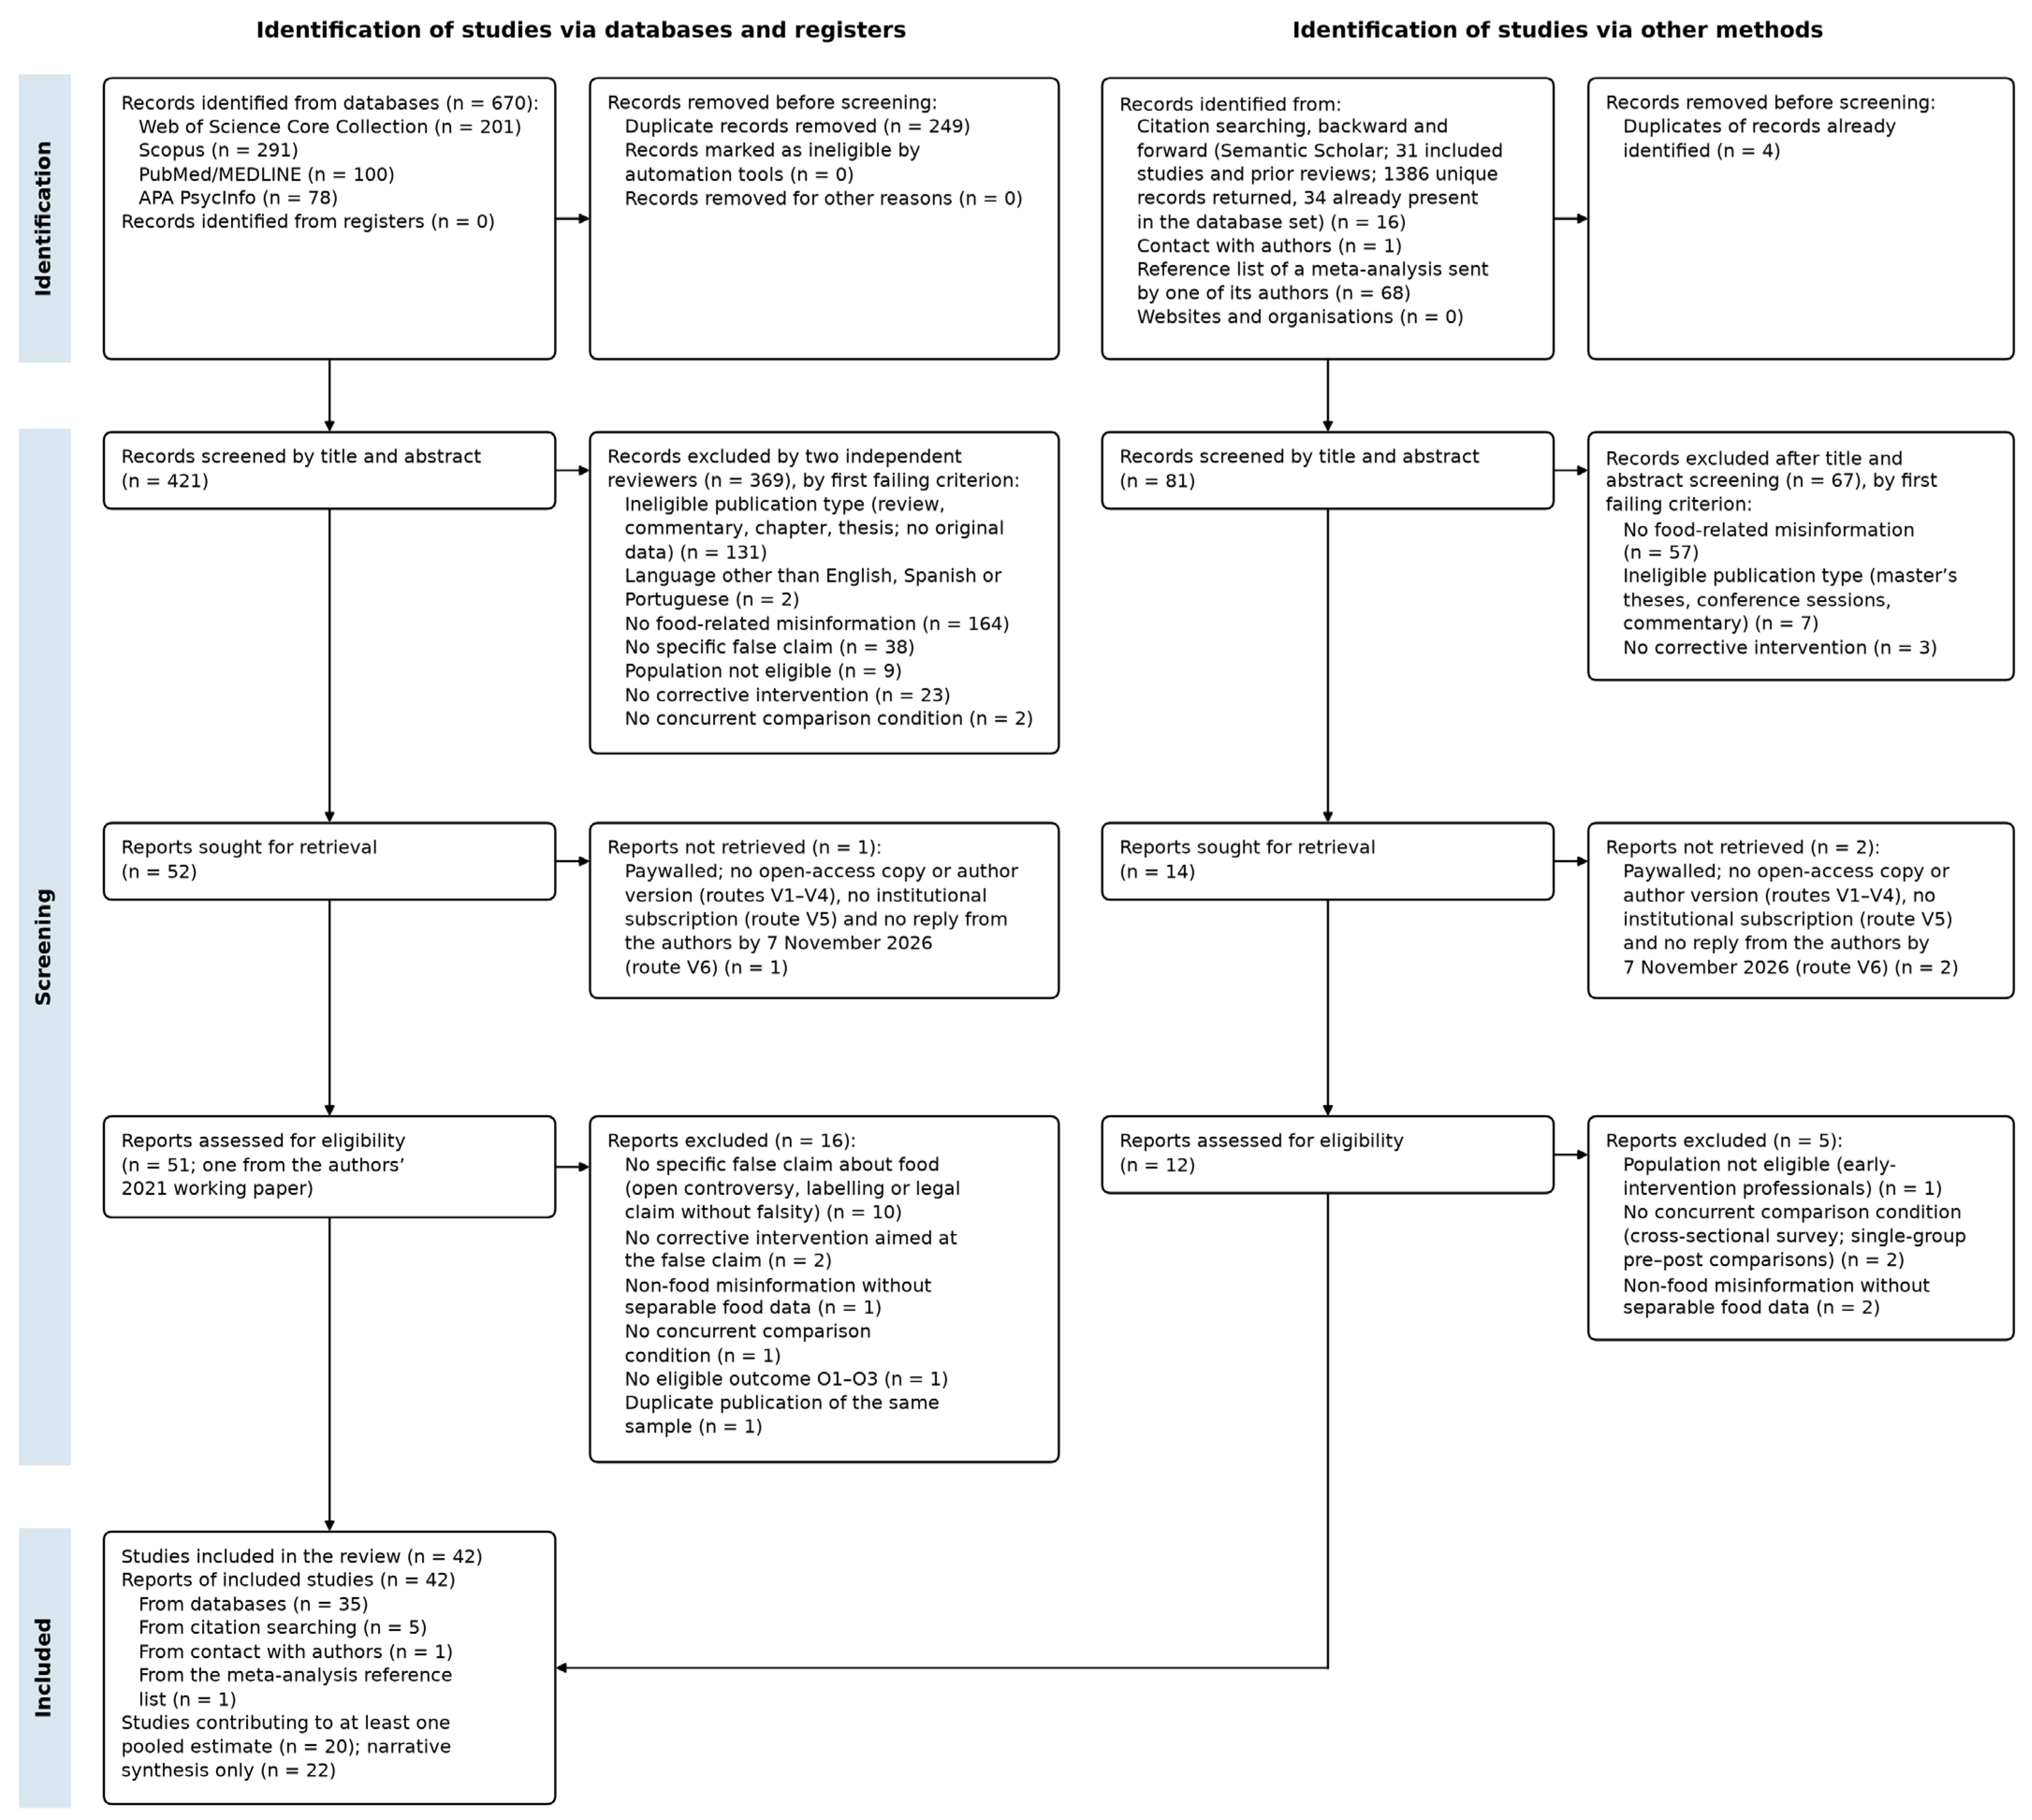
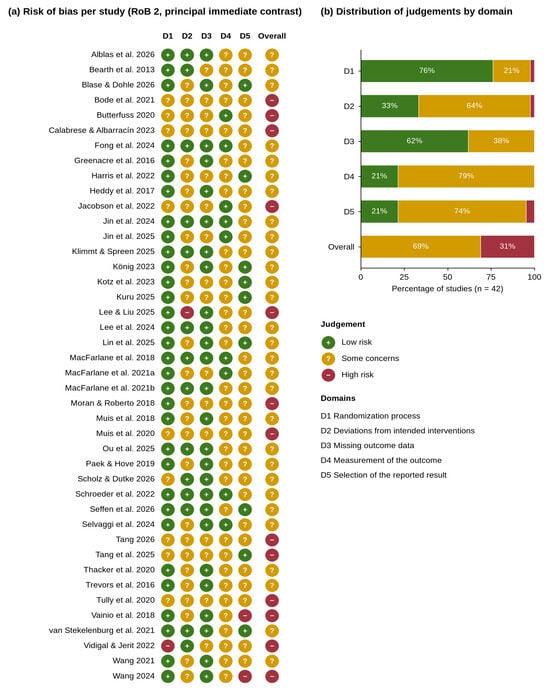
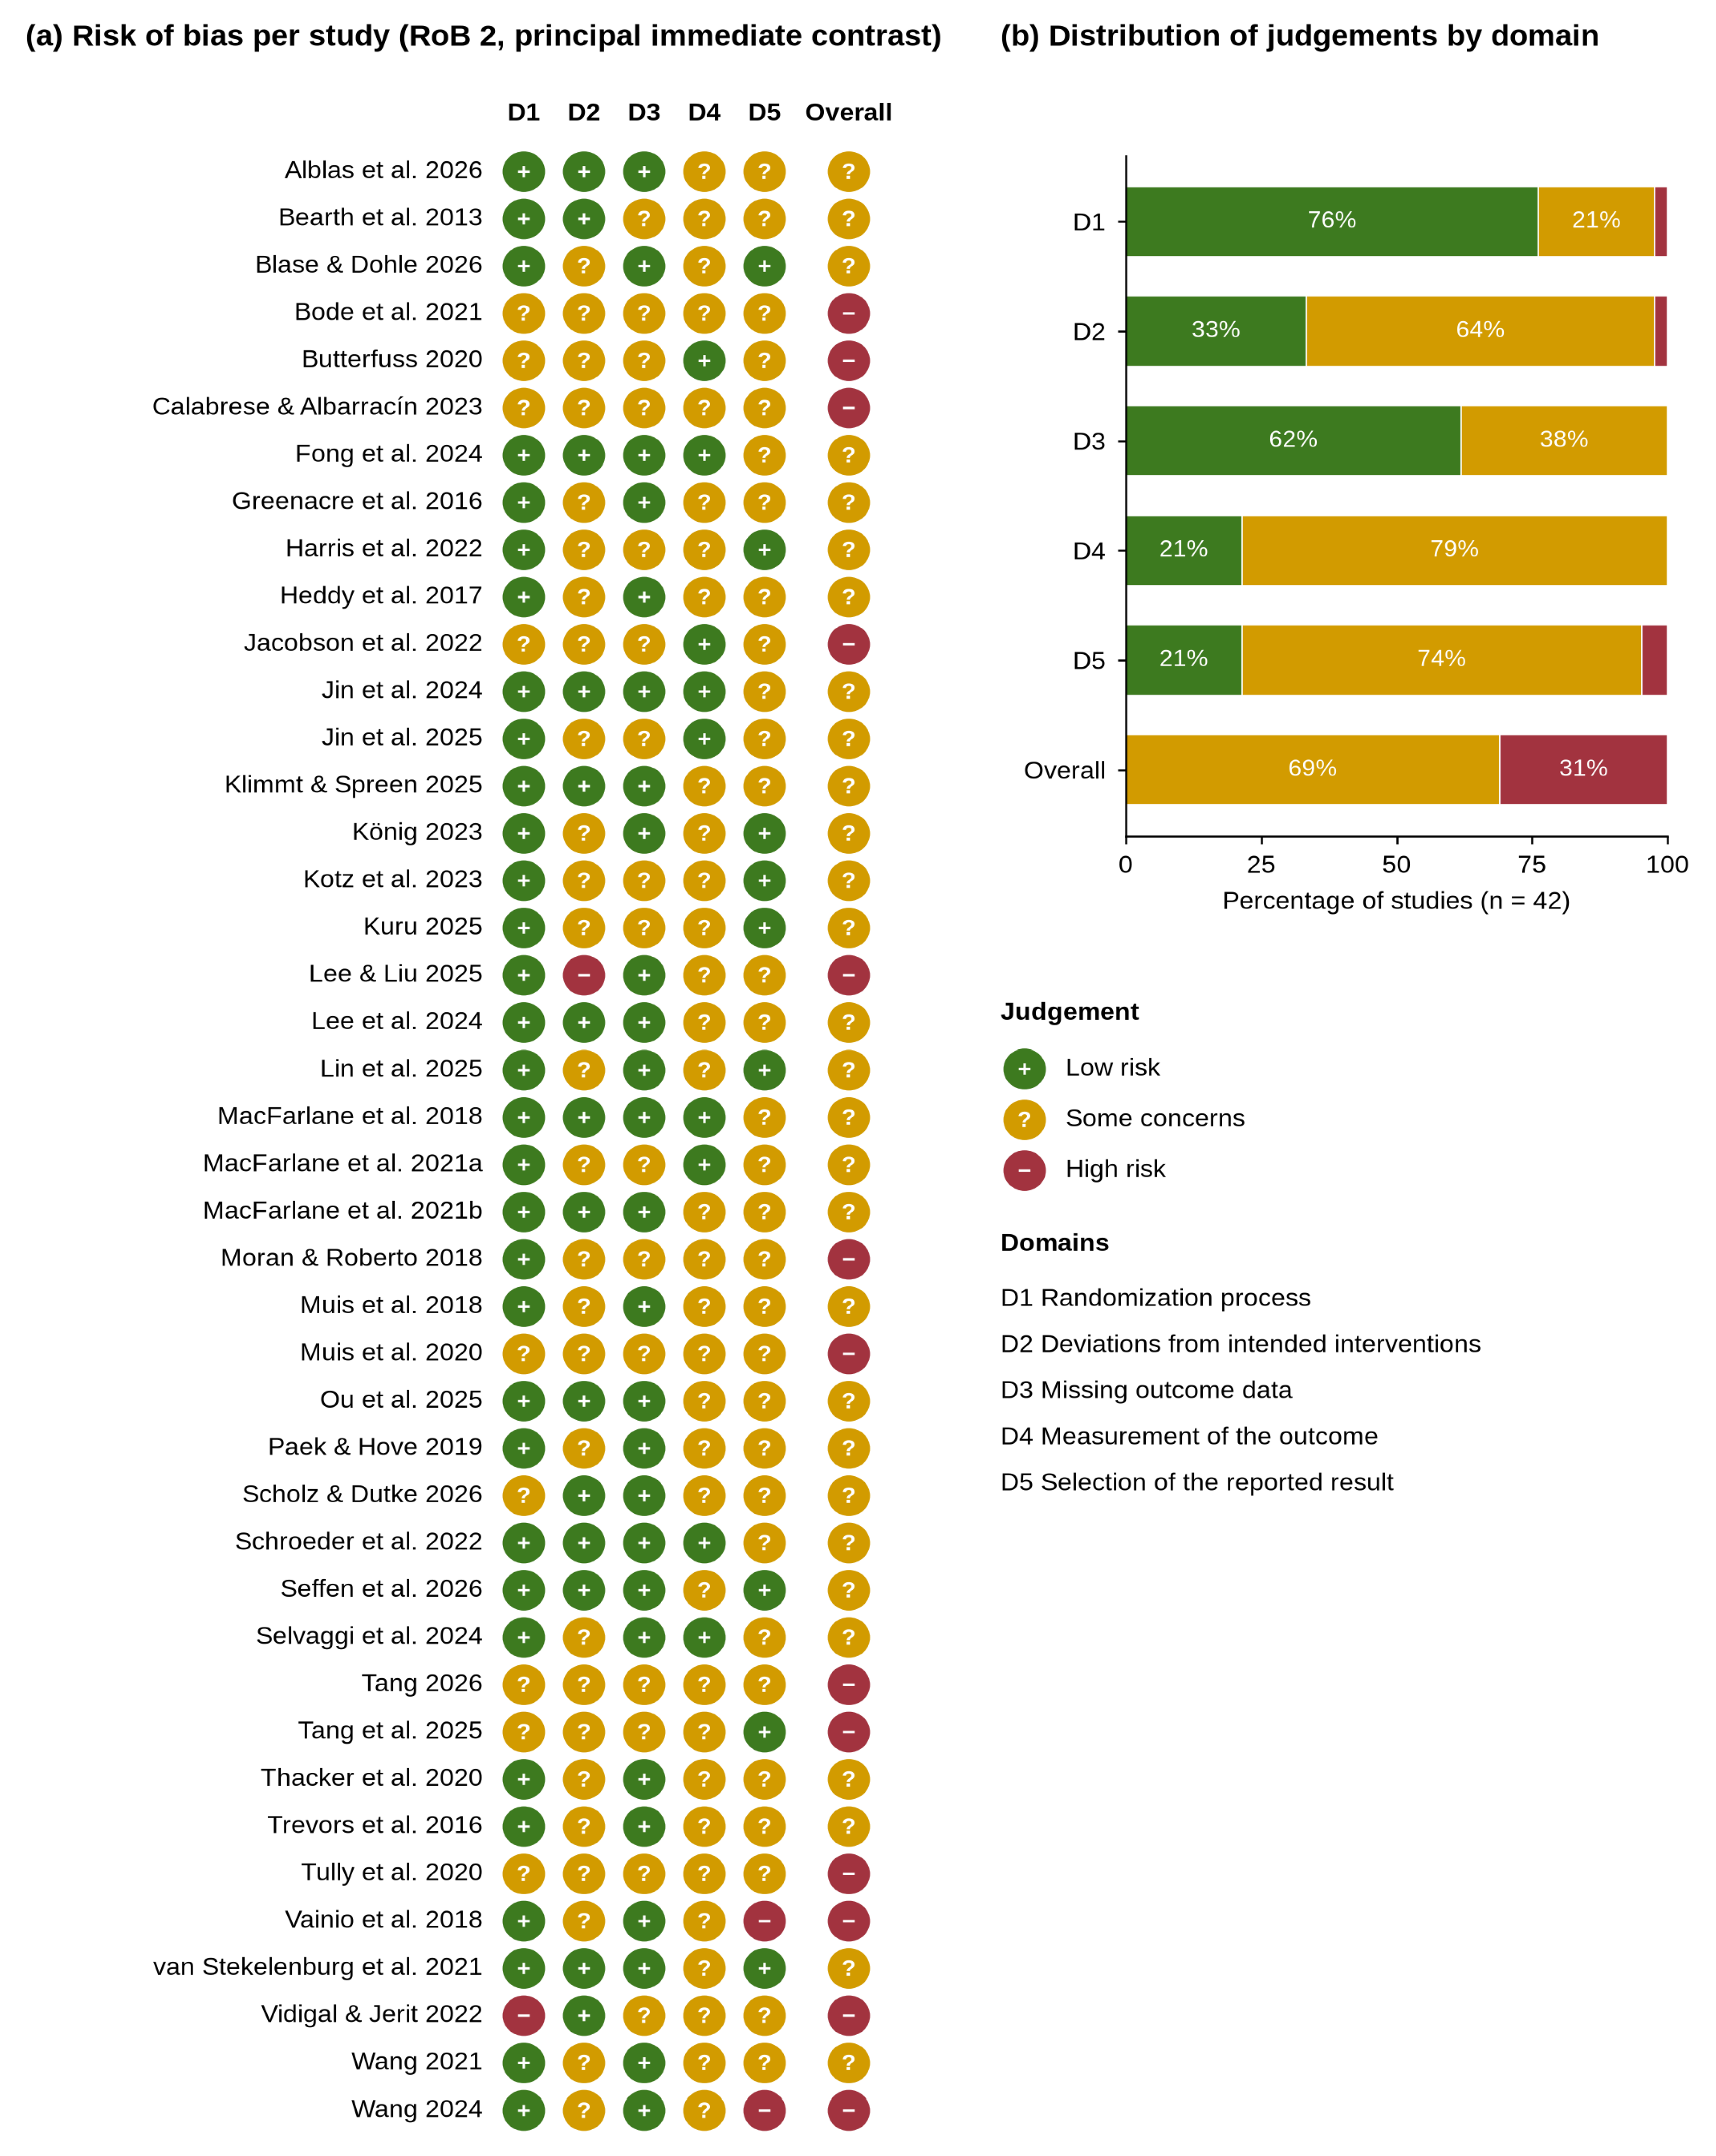
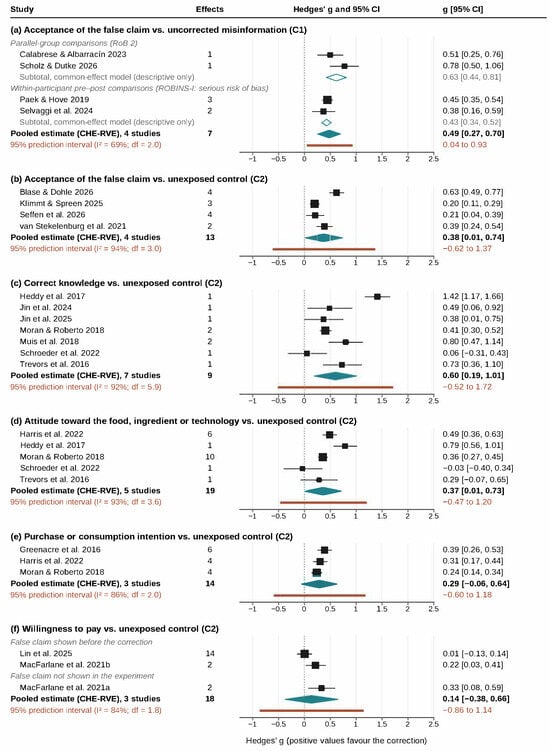
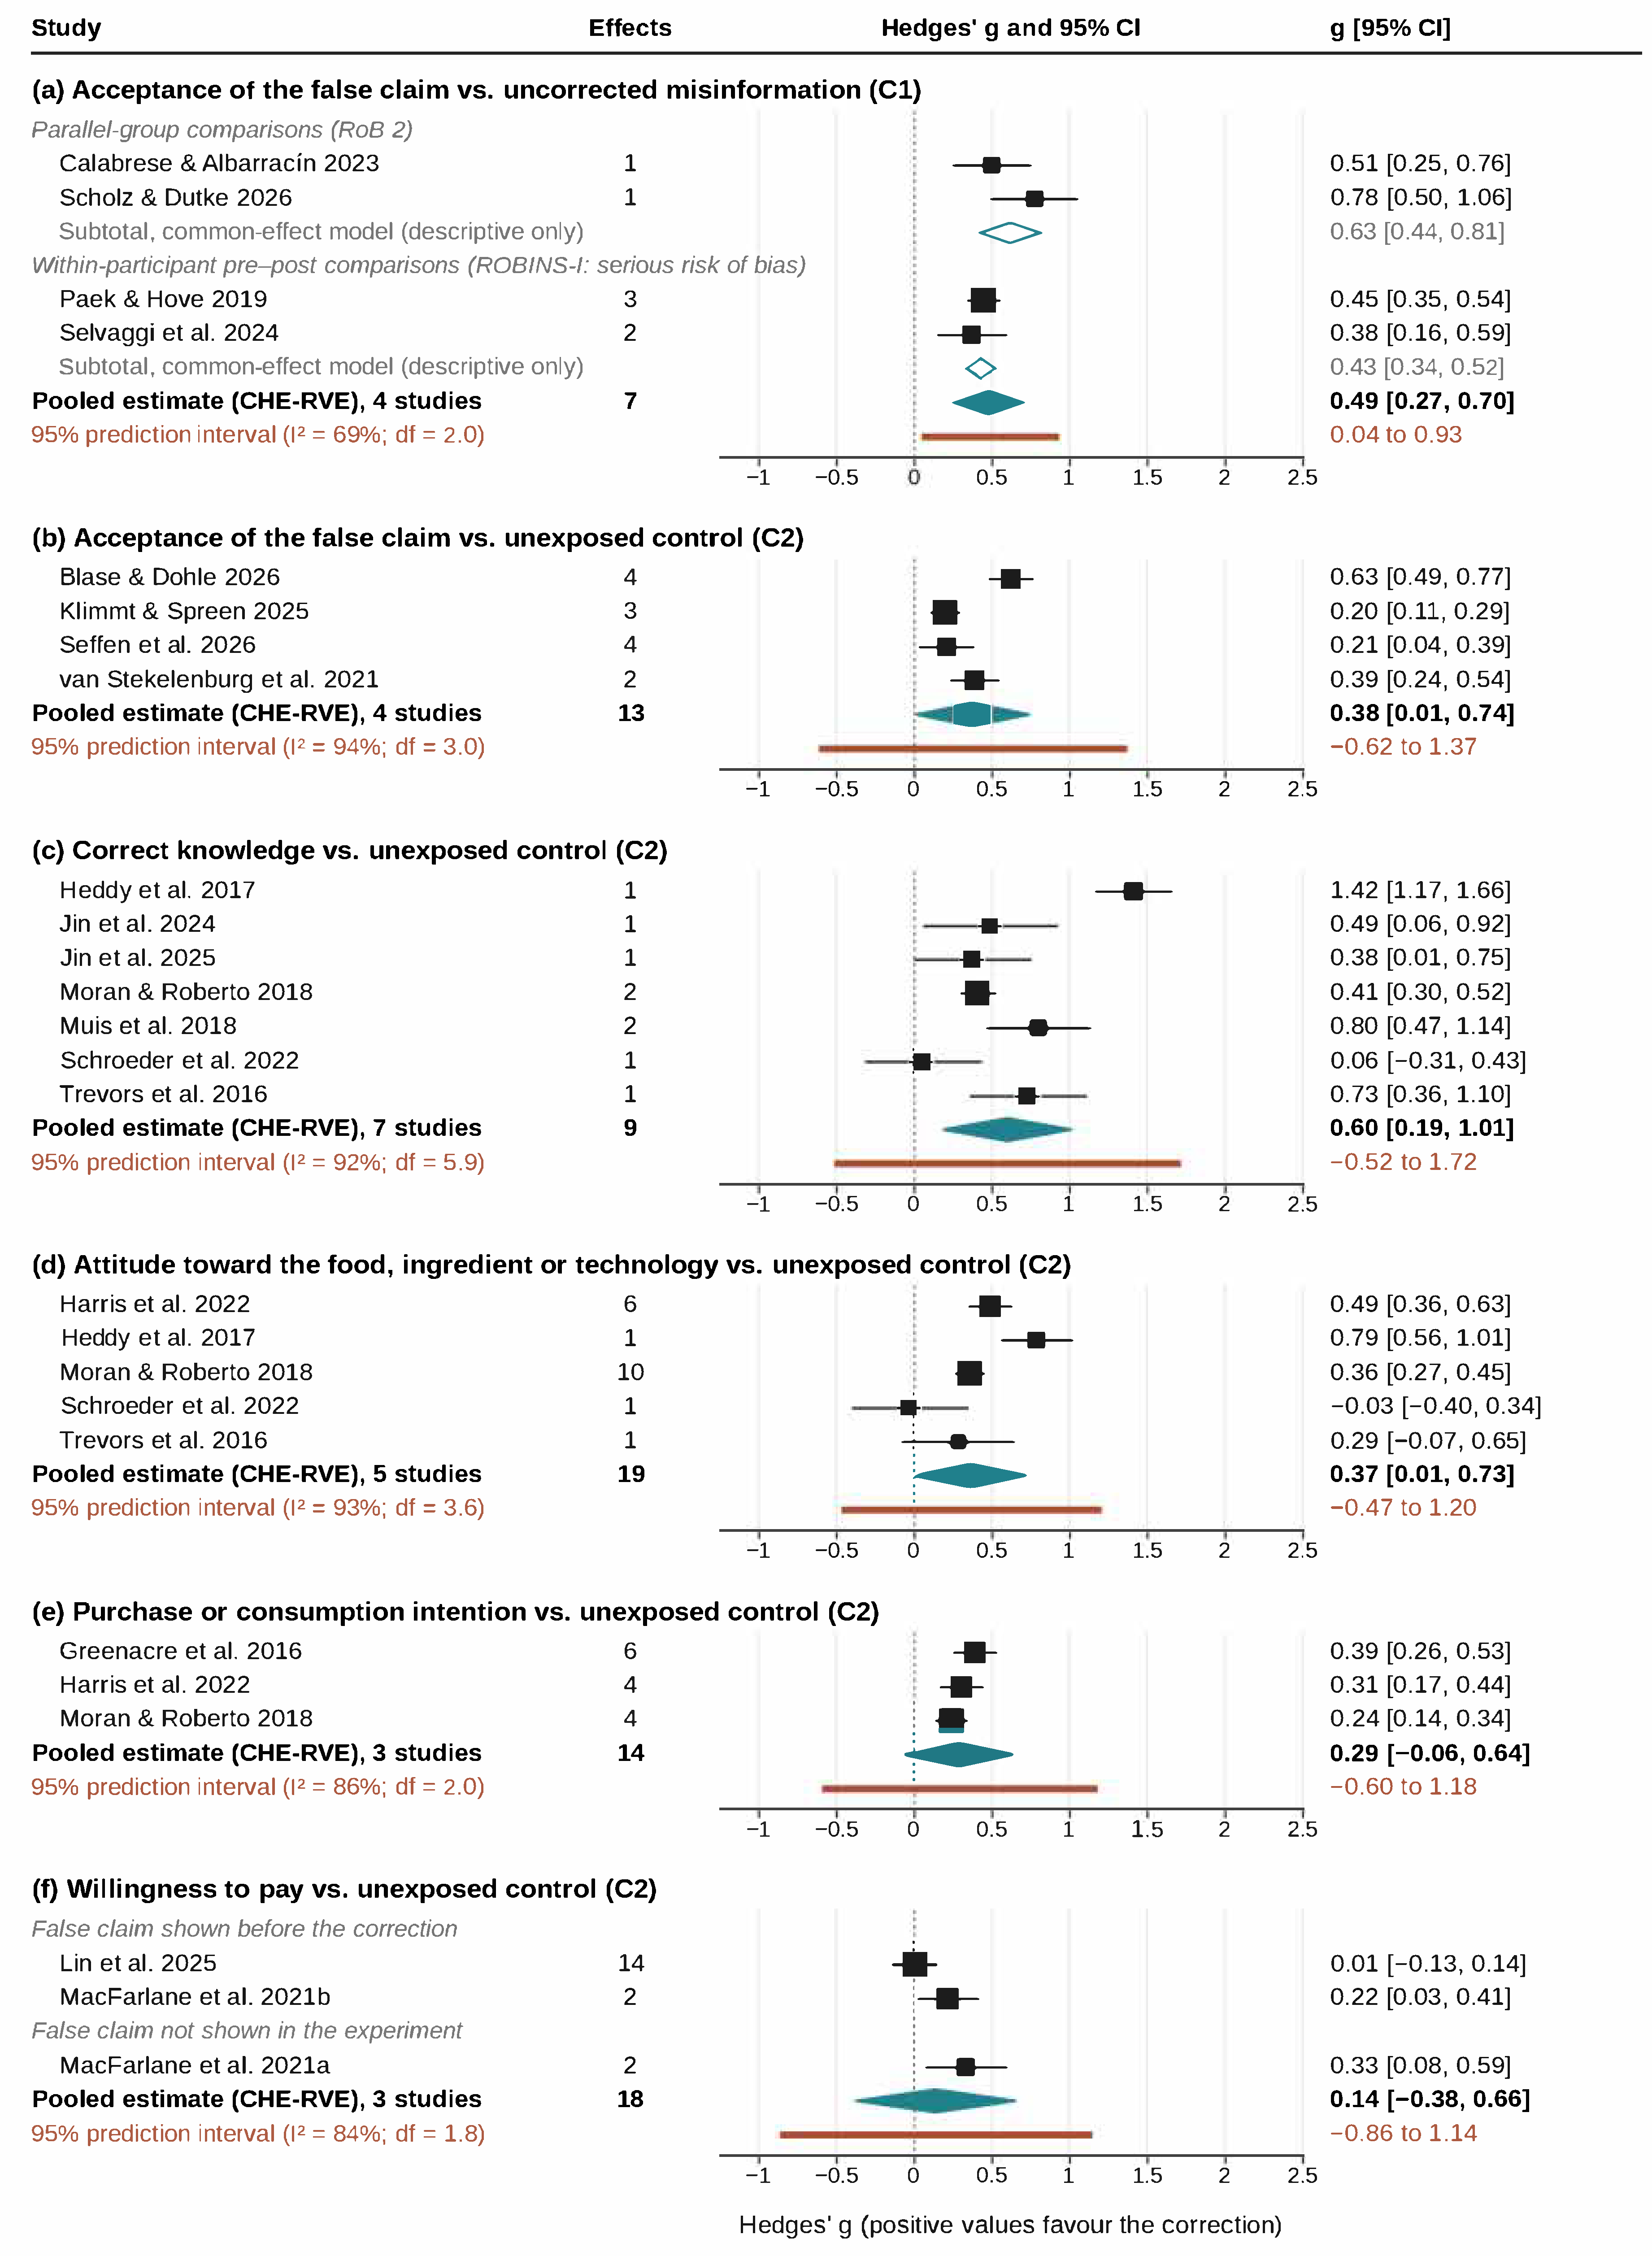

Disclaimer/Publisher’s Note: The statements, opinions and data contained in all publications are solely those of the individual author(s) and contributor(s) and not of MDPI and/or the editor(s). MDPI and/or the editor(s) disclaim responsibility for any injury to people or property resulting from any ideas, methods, instructions or products referred to in the content. |
© 2026 by the authors. Licensee MDPI, Basel, Switzerland. This article is an open access article distributed under the terms and conditions of the Creative Commons Attribution (CC BY) license.