


Abstract
Mulberry leaf tea has been consumed in China for thousands of years. Our previous study demonstrated that fermentation with Lacticaseibacillus rhamnosus improves the flavor and quality of mulberry leaf tea. To characterize fermentation-associated changes, we compared metabolite profiles and transcript abundances in raw and fermented mulberry leaf tea. In total, 37 characteristic metabolites were annotated in fermented mulberry leaf tea, including eight fatty acids, eight flavonoids, eleven terpenoids, two polypeptides, and three phenolic acids and phenylpropanoids. Relative to raw tea, fermented tea showed a distinct metabolite profile and higher relative peak-area sums for the annotated fatty acids and terpenoids. Differential-expression and enrichment analyses identified transcript sets annotated to fatty-acid- and terpenoid-related pathways, including terpenoid backbone biosynthesis, fatty acid biosynthesis, and pantothenate and coenzyme A (CoA) biosynthesis. These associations generate hypotheses concerning possible metabolic processes during fermentation, including routes involving acetyl-CoA, the mevalonate pathway, fructose-6-phosphate, and NADPH. However, because the fermentation matrix contained both plant material and microorganisms and no source-resolving controls were included, the present data do not establish enhanced de novo biosynthesis, metabolic flux, or the cellular origin of the detected metabolites or transcripts. The findings provide a descriptive basis for future studies designed to distinguish microbial metabolism, plant responses, enzymatic biotransformation, and release of pre-existing compounds during fermentation.
1. Introduction
The edible and medicinal values of mulberry leaves have been widely recognized through long-term practice. Besides being used as raw materials, mulberry leaves can be processed into mulberry leaf tea, which exhibits antioxidant, hypoglycemic, hypolipidemic and other bioactive properties [1]. However, as a tea product, mulberry leaf is considered cold in nature. Long-term consumption on an empty stomach may induce diarrhea; in particular, individuals with spleen–stomach cold deficiency should consume it with caution. In addition, mulberry leaf tea has a bitter and slightly astringent taste. Its flavor is commonly improved by blending with chrysanthemum, wolfberry and other ingredients, which limits its attractiveness to certain consumer groups [2]. Relevant studies have shown that the bitter taste of mulberry leaves arises from the combined action of multiple bitter-related metabolites, mainly including flavonoids, phenolic acids, alkaloids, coumarins and L-amino acids [3]. Bitterness represents one of the major bottlenecks restricting the industrial development of mulberry-leaf food products, and this inherent bitter taste is difficult to eliminate using conventional processing techniques [4]. Therefore, the application of microbial fermentation to improve mulberry leaf quality is of great significance for enhancing the market exploitation potential of mulberry leaf resources.
Solid-state fermentation (SSF) is a biological process in which microorganisms carry out fermentation on a solid substrate under conditions with no or nearly no free water. This fermentation approach maximizes the utilization of nutrients within the solid matrix and generates a variety of enzymes, such as tannase, esterase, phenolic acid decarboxylase, glycosidase, protease and ligninase. These enzymes can release bound compounds from the food matrix and enrich target active ingredients [5]. Existing solid-state fermentation processes for mulberry leaves mainly rely on anaerobic fermentation by lactic acid bacteria. This process can substantially modify the chemical composition and sensory properties of mulberry leaves and exert positive effects on improving their nutritional value. For instance, Duan et al. fermented mulberry leaf powder using Aspergillus niger and lactic acid bacteria. Their results showed significant increases in crude protein and total phenolic contents, effective degradation of anti-nutritional factors including crude fiber, phytic acid and tannins, as well as marked improvements in sensory quality [6]. Liang et al. performed sequential fermentation of mulberry leaf tea using lactic acid bacteria and Saccharomyces cerevisiae. Although polyphenol and flavonoid contents decreased notably in fermented mulberry leaf tea, its hypoglycemic activity was superior to that of raw mulberry green tea, indicating its potential for development as a natural hypoglycemic product [7].
Besides bioactive compounds such as flavonoids and alkaloids, mulberry leaves are also rich in nutrients, including diverse amino acids and crude protein. However, few studies have investigated changes in nutrients such as fatty acids after mulberry leaf fermentation, and the processes contributing to these changes remain poorly characterized [8]. Lacticaseibacillus rhamnosus exerts beneficial effects against multiple disorders including diarrhea, respiratory tract infections, allergies and cardiovascular diseases. Relevant studies have demonstrated that solid-state fermentation of traditional Chinese medicines using Lacticaseibacillus rhamnosus as a starter culture can alter the contents of bioactive substances such as total flavonoids and total polysaccharides [9,10]. Therefore, the present study investigated fermentation-associated changes in mulberry leaves inoculated with L. rhamnosus. We evaluated the sensory characteristics and metabolite profiles of fermented mulberry leaves and used pathway annotation of differentially expressed transcripts to generate hypotheses regarding fatty-acid- and terpenoid-related processes. These analyses do not distinguish de novo biosynthesis from microbial metabolism, enzymatic biotransformation, or release of pre-existing compounds.
In our previous work, our group screened four Lactobacillus strains, namely L. brevis, L. casei, L. delbrueckii and L. rhamnosus, to ferment fresh mulberry leaves for developing mulberry leaf tea with higher nutritional value [11]. Our prior studies revealed changes in the chemical composition of mulberry leaves upon fermentation, and L. rhamnosus was selected as the inoculated strain for the present work [11]. In the current study, mulberry leaves were used as the substrate and L. rhamnosus as the starter culture to characterize fermentation-associated sensory, metabolomic, and transcriptomic differences. Ultra-performance liquid chromatography–quadrupole time-of-flight mass spectrometry (UPLC-Q-TOF/MS) was adopted for comparative analysis of metabolic profiles before and after fermentation. Transcriptomic analysis of RNA recovered from the raw and fermented sample matrices was applied to identify differentially expressed transcripts and pathway annotations. These integrated data provide hypotheses for future source-resolving studies of microbial fermentation of mulberry leaf tea.
2. Materials and Methods
2.1. Materials
Mulberry leaves were harvested from the medicinal plant garden of Bozhou Vocational and Technical College. Lacticaseibacillus rhamnosus, with batch number SHBCC D25162, was purchased from the Shanghai Biological Technology Culture Collection Center (Shanghai, China). Asperulosidic acid (Purity ≥ 98.0%), evodine (Purity ≥ 98.0%), isoquercitrin (Purity ≥ 98.0%), and kaempferol-3-O-rutinoside (Purity ≥ 98.0%) were purchased from Chengdu Alpha Biotechnology Co., Ltd. (Chengdu, China). Kaempferol 3-O-galactoside (Purity ≥ 98.0%), euscaphic acid (Purity ≥ 95.0%), senegenin (Purity ≥ 98.5%), hederagenin 28-O-β-D-glucopyranosyl ester (Purity ≥ 98.0%), chlorogenic acid (Purity ≥ 99.35%), ursolic acid (Purity ≥ 98.74%) and rutoside (Purity ≥ 93.44%) were all purchased from the Chengdu Glip Biotechnology Co., Ltd. (Chengdu, China). Methanol was purchased from Tianjin Benchmark Chemical Reagent Co., Ltd. (Tianjin, China), acetonitrile and formic acid were purchased from Thermo Fisher Scientific Co., Ltd. (Waltham, MA, USA), and all solvents were of mass spectrometry grade. An Ultra-High Performance Liquid Chromatography Coupled with Triple TOF 6600 time-of-flight Mass Spectrometry System (AB Sciex LLC, Marlborough, MA, USA); a DNBSEQ-T7 sequencer (MGI Tech Co., Ltd., Shenzhen, China), an LX-B50L Vertical Automatic Electric-heated Pressure Steam Sterilizer (Hefei Huatai Medical Equipment Co., Ltd., Hefei, China), an SHP-160 Intelligent Biochemical Incubator (Shanghai Sanfa Scientific Instrument Co., Ltd., Shanghai, China), an SW-CJ-2FD Clean Bench (Laminar Flow Cabinet) (Shanghai Boxun Medical Biological Instrument Corp., Shanghai, China), NanoPhotometer® N60 UV-Vis Spectrophotometer (Implen GmbH, Munich, Germany), a GeneAmp 9700 PCR System (Applied Biosystems, Foster City, CA, USA), a DYY-8C Electrophoresis Instrument (Beijing Liuyi Biotechnology Co., Ltd., Beijing, China), and a SH-523 Gel Imaging System (Hangzhou Shenhua Technology Co., Ltd., Hangzhou, China) were used in this study.
2.2. Preparation of Mulberry Leaf Tea and Fermented Mulberry Leaf Tea
Mature mulberry leaves were collected and thoroughly rinsed with ultrapure water to remove contaminants. Approximately 5 g samples intended to represent the pre-fermentation state for transcriptomic sequencing were immediately transferred to cryovials and stored at −80 °C; this storage step was used only to preserve RNA in the raw-sample material. Subsequently, the mulberry leaves were transferred into sterilized Erlenmeyer flasks, followed by the addition of 4% glucose solution to the samples. The freeze-dried powder of Lacticaseibacillus rhamnosus was inoculated into MRS broth and incubated at 37 °C for 24 h to obtain a fully activated bacterial suspension. The suspension was centrifuged, the supernatant was discarded, and the bacterial pellet was resuspended in normal saline and diluted to approximately 1 × 10⁶ CFU/mL. The prepared bacterial suspension was inoculated into the leaf substrate for solid-state fermentation in Erlenmeyer flasks with an initial oxygen concentration of 12% at 37 °C for 24 h to yield fermented mulberry leaves. No active aeration or controlled gas atmosphere was applied; this study therefore does not assess the effect of fermentation atmosphere.
2.3. Preparation of Test Sample
Raw and fermented mulberry leaf tea samples were separately ground into fine powders and sieved through a 40-mesh sieve. Briefly, 1 g of powder from each of the three independent samples was accurately weighed into a stoppered conical flask, mixed with 90 mL of 50% methanol, tightly sealed, and weighed. Ultrasonic-assisted extraction (100 W, 40 kHz) was carried out for 1 h. After cooling to room temperature, the flask was reweighed, and weight loss was compensated with 50% methanol [12]. The mixture was centrifuged at 12,000 r/min for 15 min; the resulting supernatant was collected and filtered through a 0.22 μm Millipore membrane filter(Jinteng Experimental Equipment Co., Ltd., Tianjin, China) for subsequent UPLC-MS analysis, with six technical replicates per sample.
2.4. Chromatographic and Mass Spectrometric Analysis
Chromatographic separation was performed on a Waters ACQUITY UPLC BEH C18 column (2.1 mm × 50 mm, 1.7 μm). The mobile phase consisted of 0.1% aqueous formic acid (A) and acetonitrile (B), with the following gradient elution program: 0–5 min, 10–16% B; 5–9 min, 16–24% B; 9–14 min, 24–76% B; 14–20 min, 76–100% B; 20–25 min, 100–10% B. The flow rate was set at 0.3 mL/min, the injection volume was 1 μL, and the column temperature was maintained at 30 °C [11]. Mass spectrometry data were acquired in positive electrospray ionization (ESI) mode according to a previously reported method [11]. High-purity nitrogen served as the nebulizing and auxiliary gas, whereas argon was used as the collision gas. The ion source temperature was 120 °C, the desolvation temperature was 300 °C, the spray voltage was −4500 V, and the capillary temperature was 600 °C. The mass scan range was set to m/z 100–1200.
2.5. The Sensory Evaluation Method for Mulberry Leaf Tea
Sensory evaluation of twelve tea samples was conducted by seven systematically trained professional panelists (3 males and 4 females) from Bozhou Vocational and Technical College. The total number of panelists remained seven throughout the study; the number “five” refers exclusively to the five evaluated quality attributes: appearance, liquor color, aroma, taste, and infused leaf. All panelists had more than three years of experience in tea sensory evaluation, and the lead panelist holds a Level-3 Public Nutritionist qualification certificate. Before formal testing, all panelists received dedicated training combining theoretical lectures and hands-on practice with reference samples. Repeated discrimination training was performed using pre-experimental samples from the same batch. The training covered the evaluation criteria described in GB/T 23776-2018 [13], definitions of the five quality attributes, scoring rubrics, blind tasting protocols, as well as mouth-rinsing procedures and resting intervals between samples to mitigate sensory fatigue. All panelists were briefed on the study protocol and provided written informed consent prior to participation. This sensory evaluation only involved tasting tea infusions without any clinical intervention. In accordance with Article 32 of the Measures for the Ethical Review of Research Involving Human Beings in Life Sciences and Medicine (2023 Version) issued by the National Health Commission of China, this routine food sensory evaluation is outside the scope requiring ethical review and qualifies for exemption from ethical assessment.
Microorganisms generated during solid-state fermentation cannot be physically separated from the mulberry leaf matrix. Therefore, fermented mulberry leaf samples underwent extended drying at 50 °C to inactivate microbial cells before sensory assessment. Tea infusions were prepared strictly following standard tea sensory evaluation protocols with fixed parameters: 3.0 g tea dosage, tea-to-water ratio of 1:50 (w/v), infusion temperature of 100 °C, steeping time of 4 min, and sample serving temperature of 50 °C. All samples were coded and presented to panelists in random order. The evaluation indices comprised appearance, liquor color, aroma, taste, and infused leaf. Each index was scored independently on a 100-point scale. The overall sensory score for each tea sample was calculated using the following weighting factors: appearance 25%, liquor color 10%, aroma 25%, taste 30%, and infused leaf 10%. Detailed scent and taste descriptions of raw and fermented mulberry leaf tea samples are provided in Appendix A.
2.6. Metabolite Data Analysis
Data processing was performed using the metabolomics software Progenesis QI v3.0 (Waters Corporation, Milford, MA, USA). The workflow included baseline filtering, peak identification, peak integration, retention time correction, and peak alignment to generate the final data matrix. Subsequently, feature peak searching and annotation were carried out by matching MS and MS/MS spectral information against metabolomic databases. The mass error tolerance for MS was set to ≤10 ppm, and metabolite identification was achieved based on MS/MS spectrum matching scores. The primary databases used in this study were the Human Metabolome Database (HMDB, (http://www.hmdb.ca/, accessed on 5 March 2025), METLIN (https://metlin.scripps.edu/, accessed on 5 March 2025), and an in-house laboratory database. Systematic biases were corrected via Support Vector Regression (SVR) using quality control (QC) samples. During quality control and quality assurance, metabolites with a Relative Standard Deviation (RSD) >10% and Library Score < 80 in QC samples were removed to guarantee reliable data for subsequent multivariate statistical analysis.
2.7. Transcriptome Sequencing Analysis
Total RNA was recovered from six individual raw mulberry leaf tea samples and six fermented mulberry leaf tea samples, respectively. mRNA was reverse-transcribed into cDNA, which was amplified to construct the final sequencing library [14]. Transcript abundance was quantified for differential-expression analysis across the two sample matrices. RNA recovery and transcript detection demonstrate that RNA was present in the samples, but do not demonstrate that plant cells remained viable or transcriptionally active after the hot-water treatment. Because the fermented samples contained both leaf material and microorganisms, the present sequencing design does not independently assign transcript origin to plant or microbial cells. The acquired sequences were annotated against the Kyoto Encyclopedia of Genes and Genomes (KEGG), NCBI, UniProtKB/Swiss-Prot, Gene Ontology (GO), COG, TrEMBL, and Pfam databases to obtain functional annotation information and protein-domain predictions [15].
2.8. Reverse Transcription Quantitative PCR Analysis
In this study, 11 genes enriched in fatty acid and terpenoid biosynthetic pathways in fermented mulberry leaf tea were selected for expression analysis via quantitative real-time PCR (qRT-PCR). Specific primers were designed based on gene sequences, and are shown in Table 1. The amplification of quantitative PCR was validated by gel electrophoresis. qRT-PCR amplification was performed using the 2 × Phanta® Flash Master Mix (Nanjing Vazyme Biotech Co., Ltd., Nanjing, China) with a total reaction volume of 20 μL. The Quantitative PCR was performed following the manufacturer’s instructions. The relative expression of target genes was calculated using the 2−ΔΔCt method.
Table 1.
Identification of metabolites in raw mulberry leaf tea.
2.9. Data Analysis
SPSS v27 software was used for statistical analysis of the data. A two-tailed Student’s t-test was applied to assess statistical differences between the two groups. SIMCA 14.1 was employed to compare metabolite profiles of samples collected before and after fermentation. Owing to the large number of detected metabolites, principal component analysis (PCA) was performed. Venny 2.1.1 (interactive Venn diagram visualization; (https://bioinfogp.cnb.csic.es/tools/venny/index.html, accessed on 10 May 2025) and Prism 10 (GraphPad Software, San Diego, CA, USA) were used for result visualization and plotting.
Differentially expressed genes (DEGs) were identified using the DESeq2 package, with thresholds set at q-value ≤ 0.001, Fold Change ≥ 2, and FDR ≤ 0.05 to screen DEGs between the two sample groups. Functional enrichment analyses, including Gene Ontology (GO) and Kyoto Encyclopedia of Genes and Genomes (KEGG), were conducted using R and the KOBAS tool, respectively. PeakView 2.1 workstation was used for identification of characteristic chemical components in the samples. This software enables the construction of a library of candidate chemical constituents containing compound names, molecular formulas, chemical structures and other relevant information. Combined with the retention times and mass fragmentation patterns of ten reference standards, the chemical constituents present in the samples were annotated.
3. Results
3.1. Sensory Evaluation of Raw and Fermented Mulberry Leaf Tea Samples
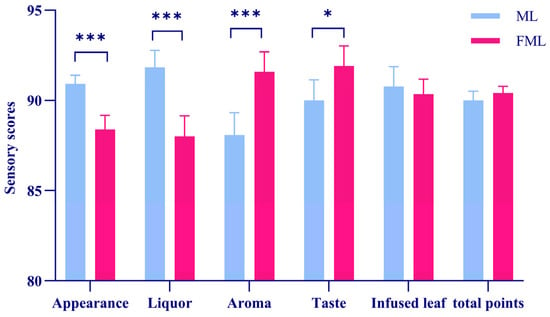
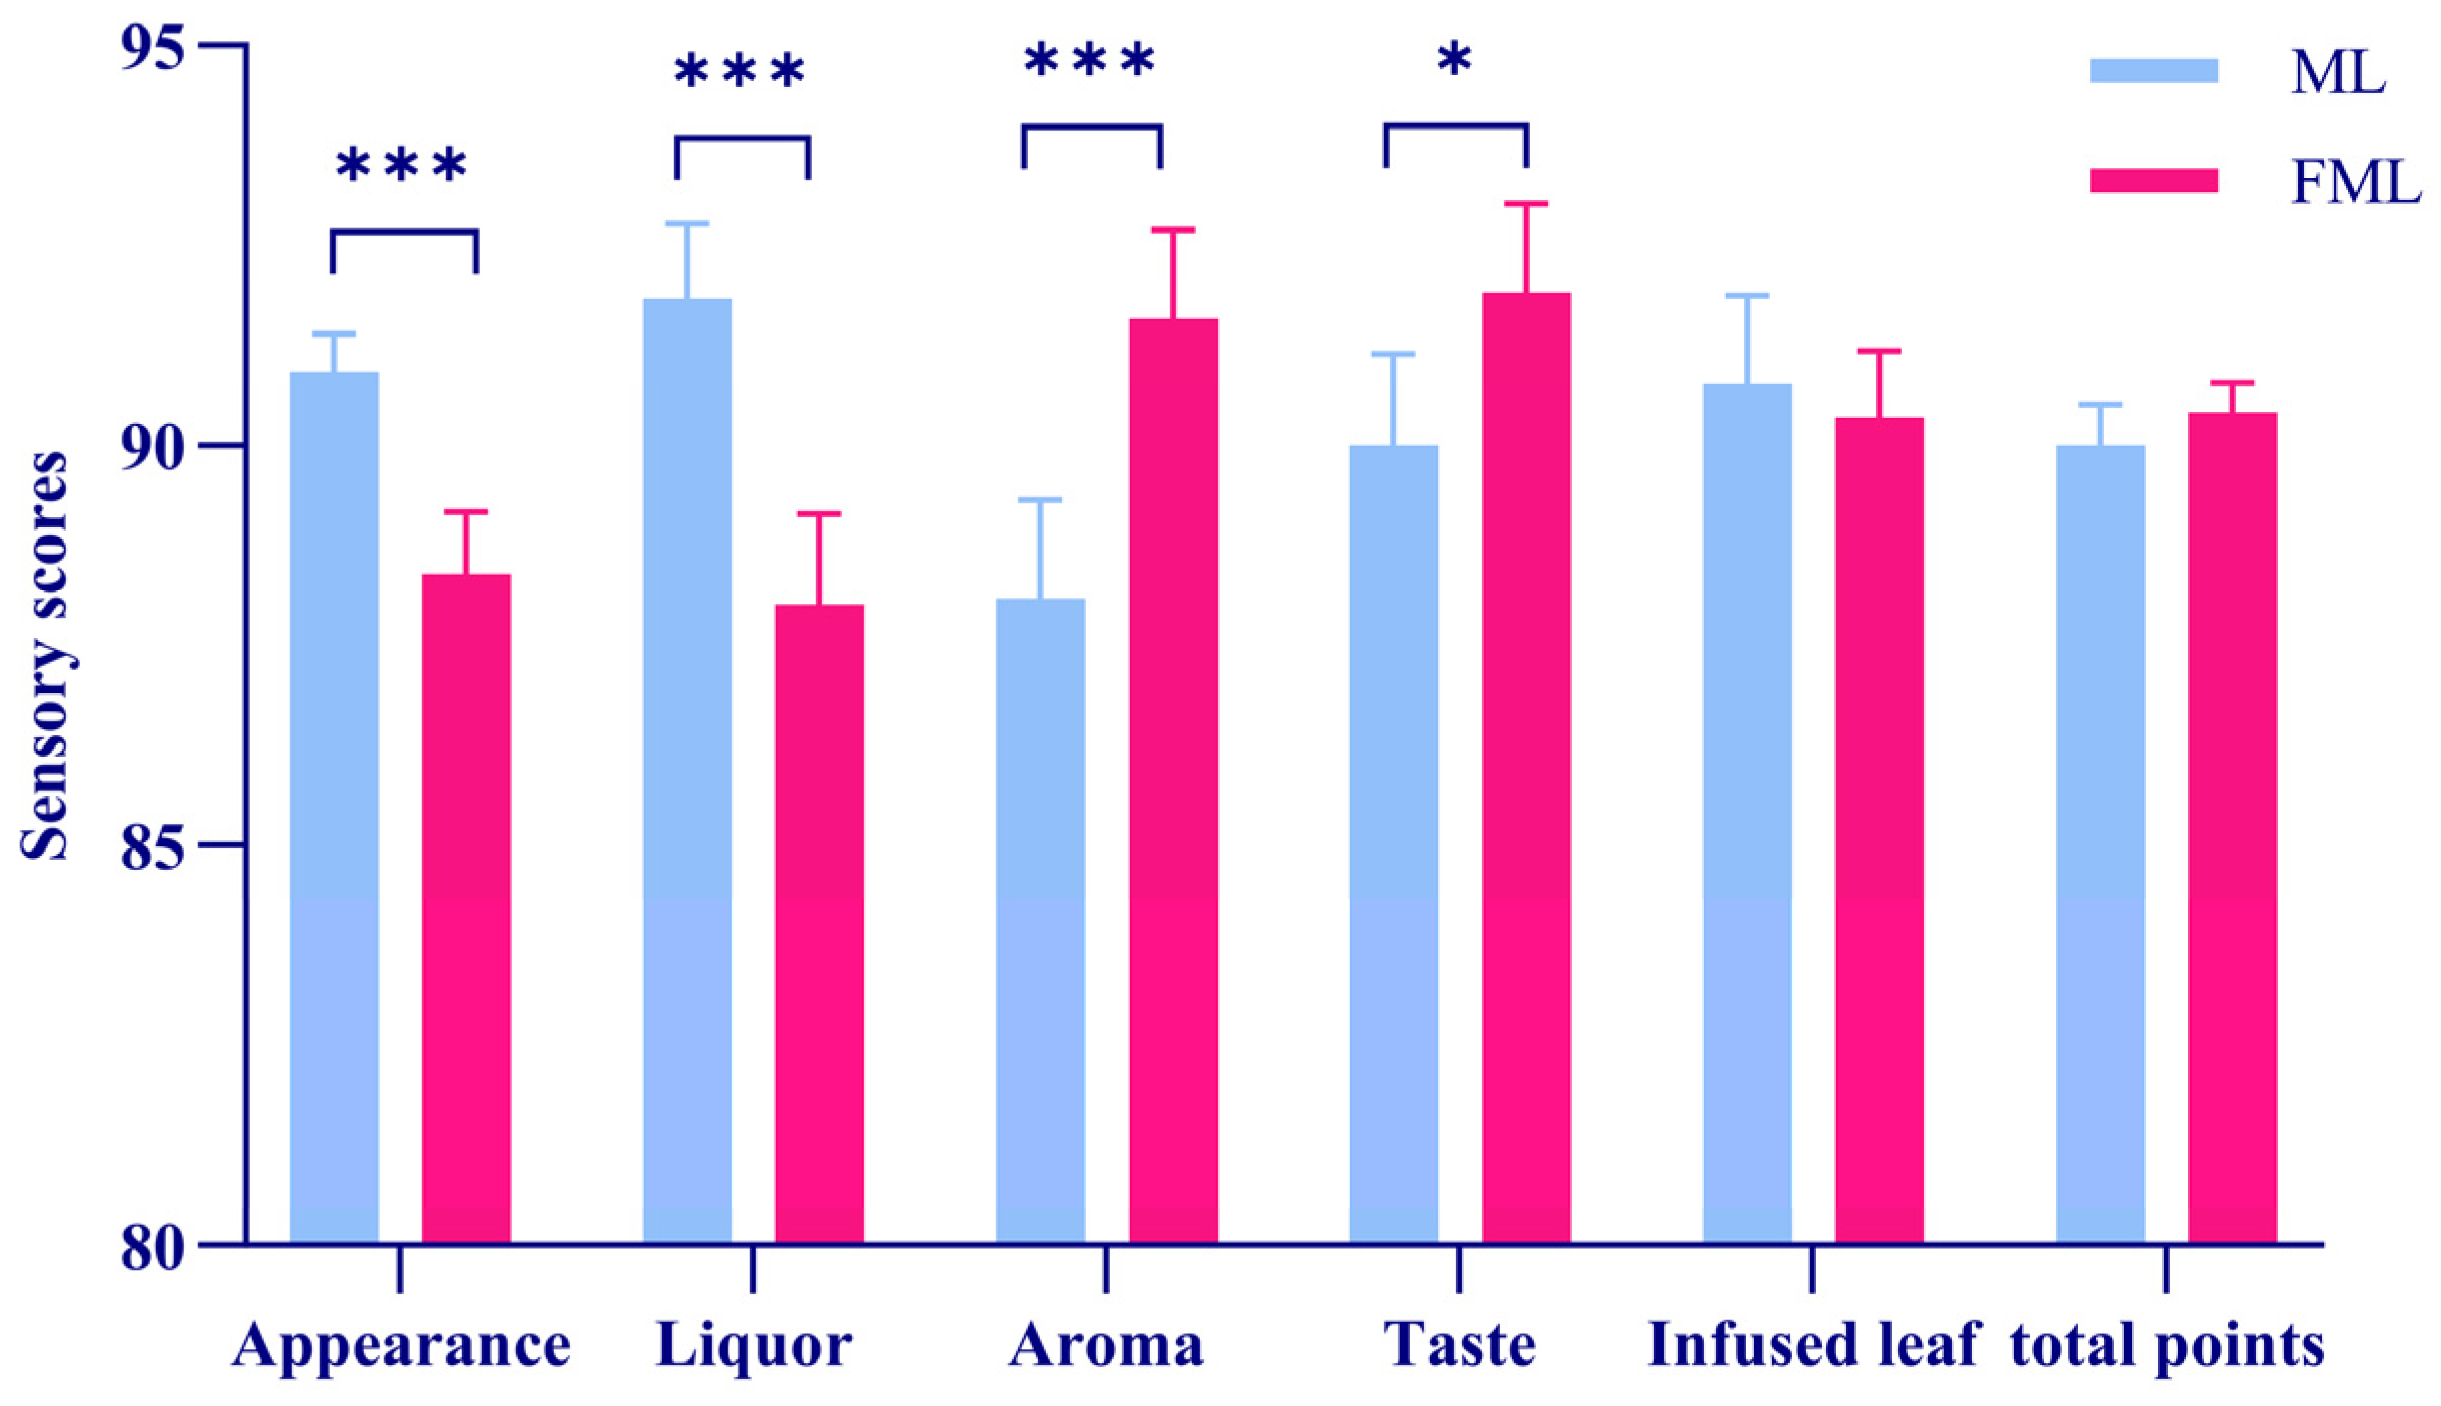
The 12 evaluated mulberry leaf tea samples displayed intact and uniform leaves, clear liquor color, rich aroma, and mellow, sweet, fresh, brisk taste, with each sample possessing distinctive sensory characteristics. The total sensory scores of fermented mulberry leaf tea (ranging from 90.00 to 91.06, average score: 90.40) were higher than those of non-fermented mulberry leaf tea (ranging from 89.41 to 90.08, average score: 90.01). A significant difference was observed in appearance scores between raw and fermented mulberry leaf tea (p < 0.05). However, fermented mulberry leaf tea achieved a lower score for appearance attributes (Figure 1). Raw mulberry leaf tea features an intact shape and bright color. In contrast, fermented mulberry leaf tea appears light and fluffy and exhibits a bright yellow hue. With respect to liquor color and taste, the infusion of raw mulberry leaf tea is pale green and bright, with a bitter-astringent taste accompanied by a subtle fresh fragrance. The infusion from fermented mulberry leaf tea is light yellow and delivers a sour-sweet flavor profile.
Figure 1.
Sensory scoring results between mulberry leaves (ML) and fermented mulberry leaves (FML). Sensory evaluation was performed according to GB/T 23776—2018, Methodology for Sensory Evaluation of Tea. A panel of seven trained professionals (3 males, 4 females) from Bozhou Vocational and Technical College evaluated twelve tea samples for appearance, liquor color, aroma, taste, and infused leaf. Each attribute was scored independently on a 100-point scale, and the total sensory score of each sample was calculated using the following weighting factors: appearance 25%, liquor color 10%, aroma 25%, taste 30%, and infused leaf 10%. ML denotes raw mulberry leaves, and FML denotes fermented mulberry leaves. * represents p < 0.05, and *** represents p < 0.001.
3.2. Identification of Metabolites in Mulberry Tea Before and After Fermentation
Using PeakView 1.2 software, sample mass spectra were imported to verify retention times and the matching scores of fragment ions from tandem mass spectra. A candidate chemical constituent library was constructed, containing compound names, molecular formulas, and chemical structures. Based on the retention times and MS fragmentation patterns of ten reference standards, 26 characteristic chemical constituents were annotated in raw mulberry leaf tea. Among these, fatty acids and flavonoid glycosides constituted the largest proportion, followed by peptides and amino acids. The 26 annotated metabolites comprised two fatty acid amides, four fatty acids, five flavonoids, three terpenoids, four amino acids, and three polypeptides. The detailed characteristic metabolites are listed in Table 1. In fermented mulberry leaf tea, 37 characteristic metabolites were annotated, including eight fatty acids, eight flavonoids, eleven terpenoids, two polypeptides, and three phenolic acids and phenylpropanoids.The detailed metabolite information for fermented mulberry leaf tea is summarized in Table 2. Relative to raw mulberry leaf tea, the fermented samples contained four additional annotated fatty acids and eight additional annotated terpenoids. These data demonstrate fermentation-associated differences in the annotated metabolite profile. They do not, in the absence of source-resolving controls, establish enhanced biosynthesis or identify whether the differences reflect microbial metabolism, enzymatic biotransformation, release of pre-existing compounds, or other processes.
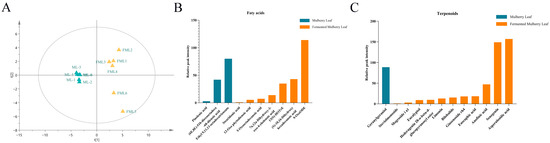
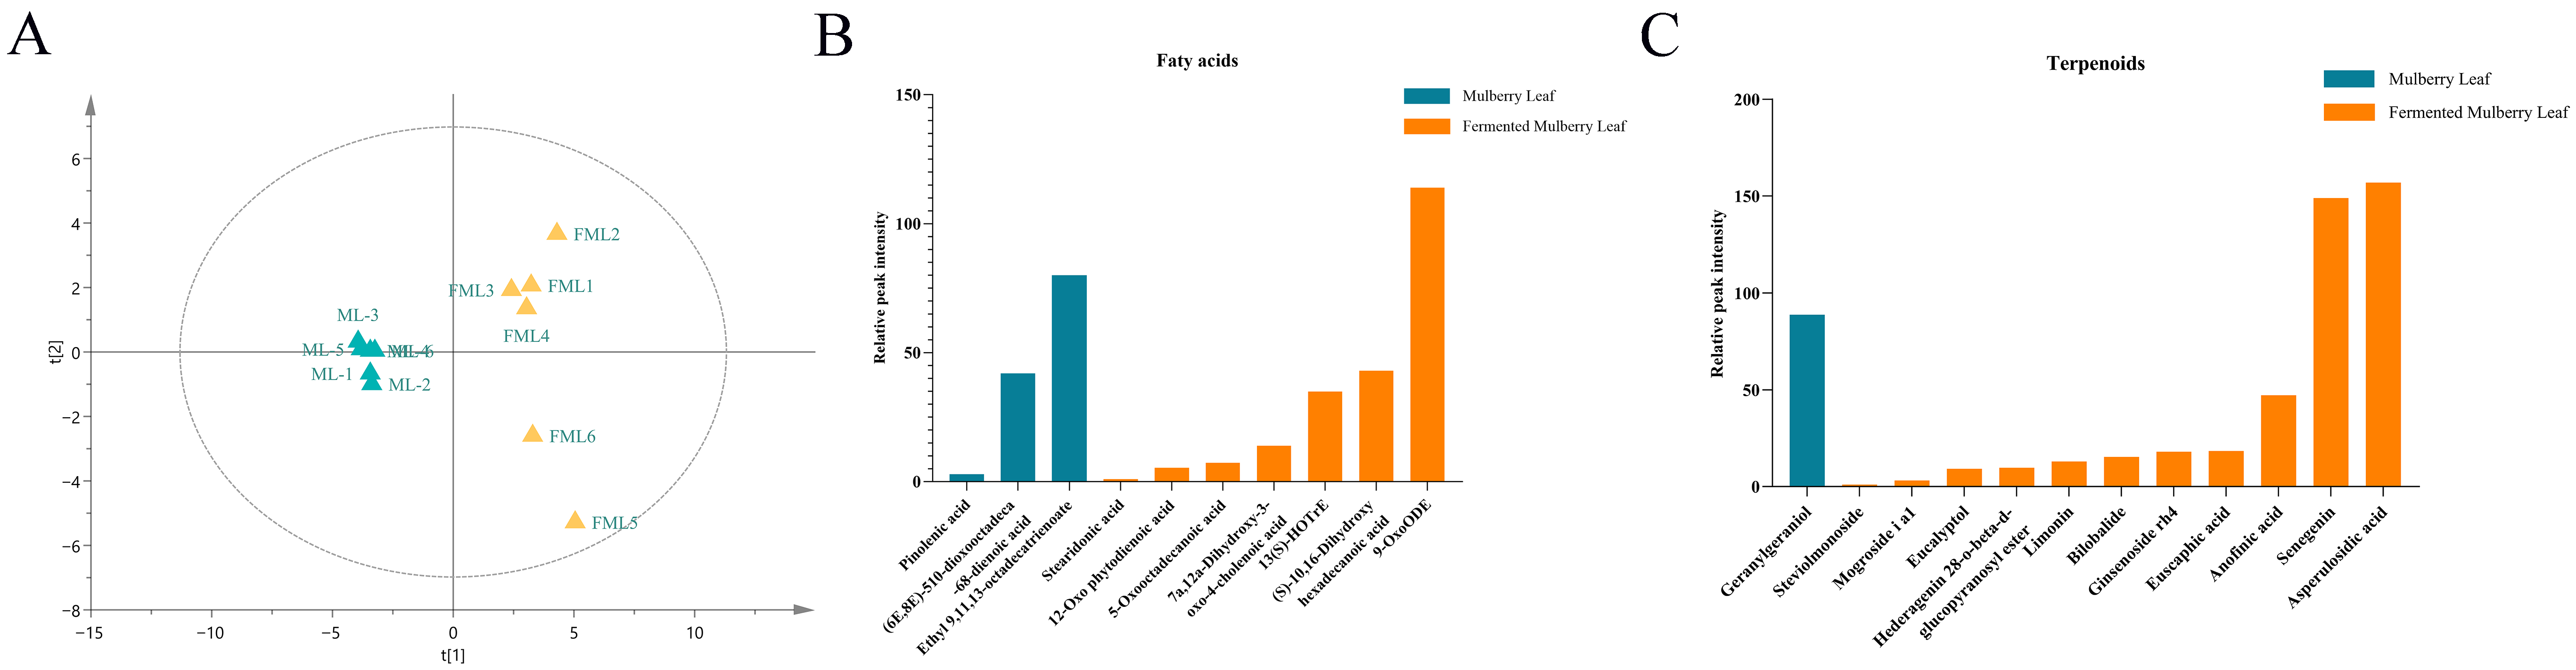
Multivariate statistical analysis was performed on the metabolic profiles of raw and fermented mulberry leaf tea. PCA results are presented in Figure 2A. The first principal component (PC1) explained 51.71% of the total variance, while the second principal component (PC2) explained 40.65% of the variance. Clear separation between the two groups was observed along PC1, indicating marked differences in their chemical compositions.
Figure 2.
PCA results of chemical constituents from raw and fermented mulberry leaf tea, and comparison of relative peak intensities of fatty acids and terpenoids. (A) PCA score plot; blue triangles represent raw mulberry leaf tea samples, and yellow triangles represent fermented mulberry leaf tea samples. Clear separation of the two groups was observed along PC1, with samples distributed on opposite sides of the axis. In this study, L. rhamnosus in the exponential growth phase was used as the inoculum for mulberry leaf fermentation. (B,C) Bar charts showing relative metabolite abundances calculated from UHPLC peak areas for fatty acids (B) and terpenoids (C). These values are intended solely for intergroup comparison and do not represent absolute concentrations of the target compounds.
The relative abundances of fatty acids and terpenoids were calculated from their peak areas, as shown in Figure 2B,C. Peak areas of target metabolites were used to represent relative abundances for intergroup comparison. According to peak area data, the total relative abundance of fatty acids in fermented mulberry leaves was approximately 10-fold higher than that in raw mulberry leaves, and the total relative abundance of terpenoids was approximately 17.6-fold higher than that in raw mulberry leaves.
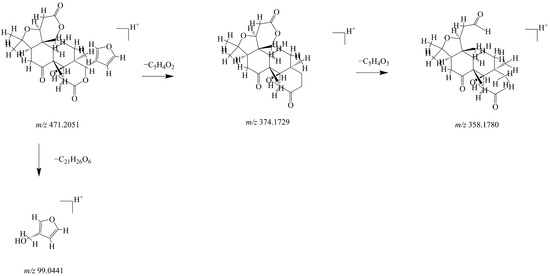
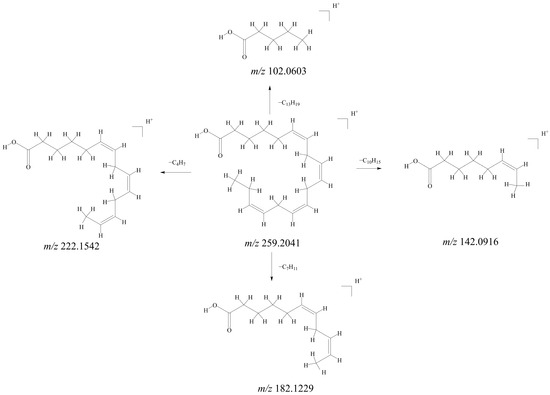
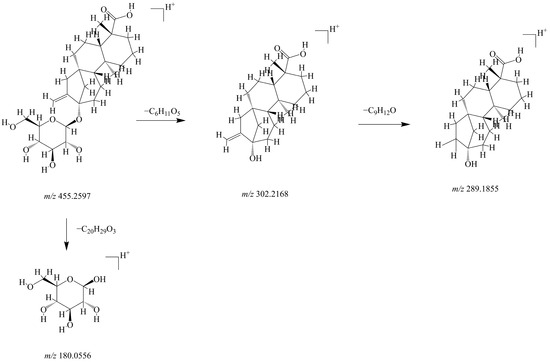
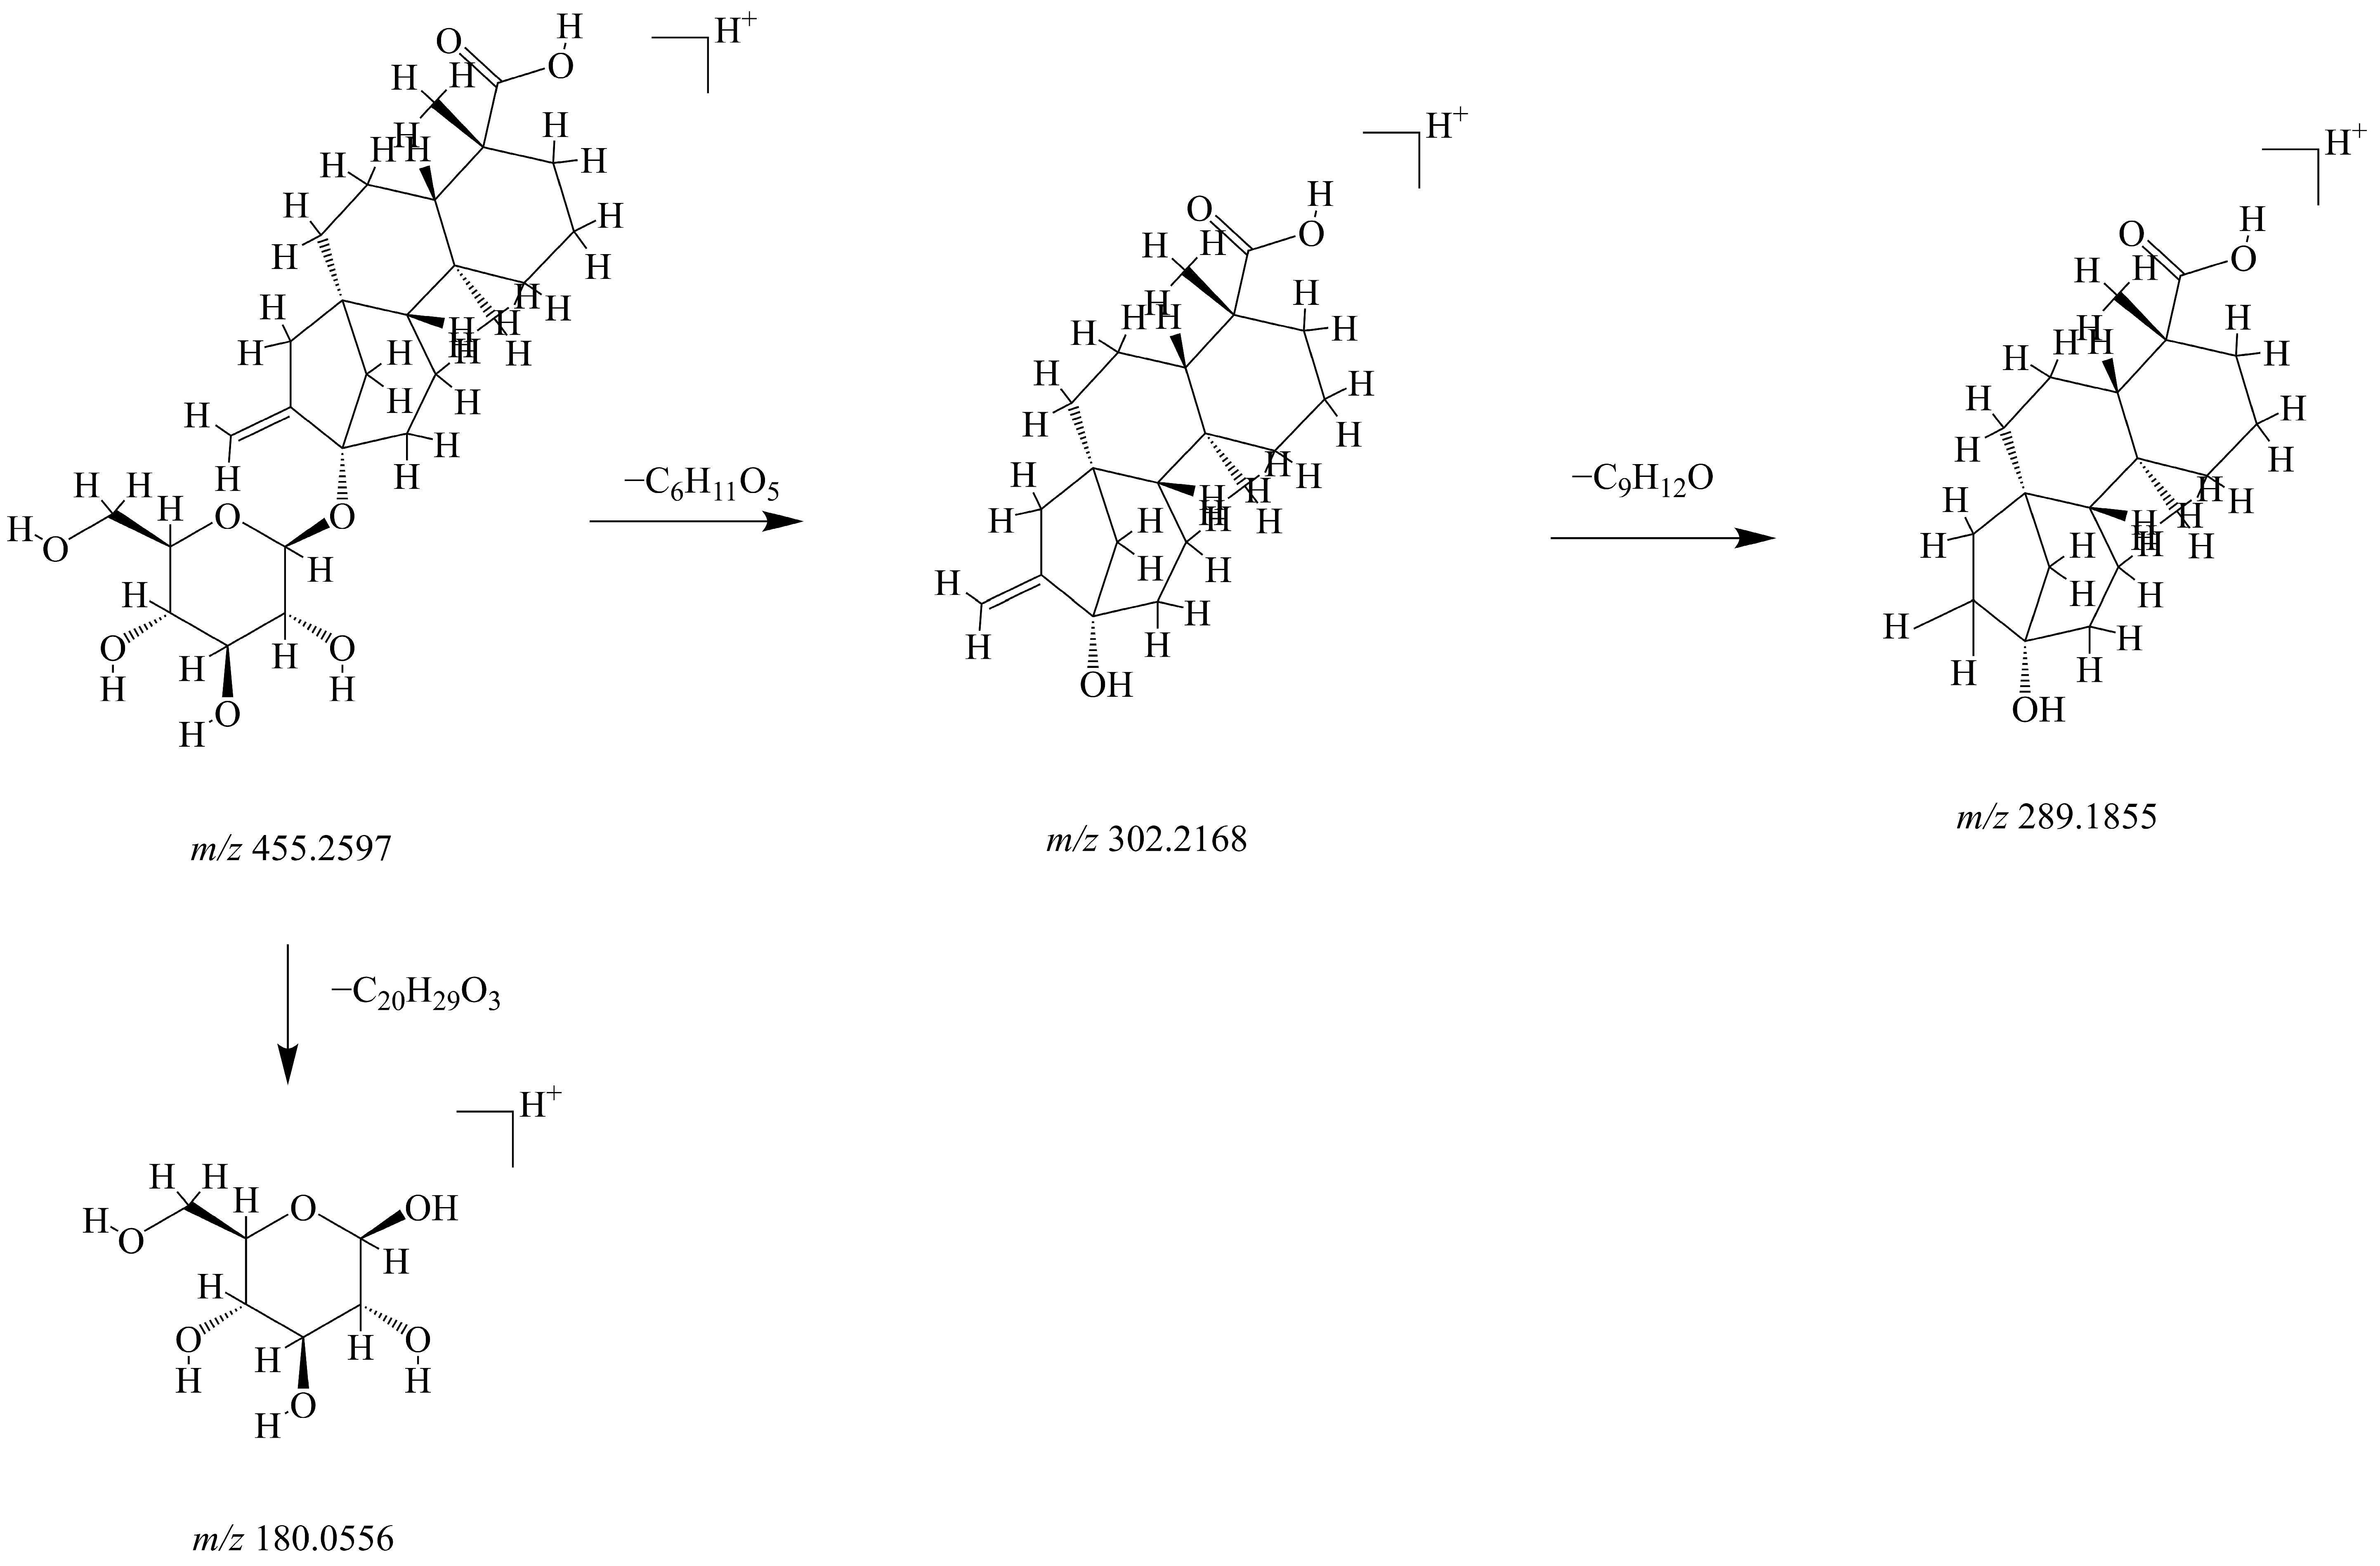
The fragmentation spectra shown in Figure 3, Figure 4 and Figure 5 were interpreted and plotted using PeakView 1.2 and ChemDraw 22.0.0 software on the basis of each compound’s m/z values, retention times, molecular formulas, fragment ions, and two-dimensional structures. These figures depict the hydrolytic fragmentation pathways of limonin, stearidonic acid, and steviolmonoside, respectively. The characteristic fragment ions generated during fragmentation support the structural annotation of metabolites identified in fermented mulberry leaves in this study.
Figure 3.
Proposed fragmentation pathway of limonin. The furan ring is an aromatic heterocycle. Owing to p-π conjugation, the electron density of the C-C bond linked to the D ring decreases. Loss of the furan-ring side chain yields the parent core ion at m/z 374.1729. Subsequently, the electron-withdrawing inductive effect of the carbonyl group increases the polarity of the C-O bond within the lactone ring, triggering α-cleavage. The molecule loses the lactone-ring side chain and produces a carbonyl-bearing fragment ion at m/z 358.1780.
Figure 4.
Proposed fragmentation pathway of stearidonic acid. Owing to π-electron delocalization across the double bond, the electron density of the adjacent α-position C-C bond is reduced, accompanied by decreased bond energy. Bond cleavage takes place at the C5-C6, C8-C9, C11-C12, and C14-C15 positions, producing a series of double-bond-containing fatty acid fragment ions, including C5H10O2 (m/z 102.0603), C8H14O2 (m/z 142.0916), and C11H18O2 (m/z 182.1229).
Figure 5.
Proposed fragmentation pathway of steviolmonoside. The ester glycosidic bond (-O-CO-) at the C13 position exhibits the lowest bond energy within the molecule and undergoes preferential heterolytic cleavage under high-energy bombardment. This cleavage produces the steviol radical cation and neutral glucose fragments. The steviol core skeleton also undergoes fragmentation; the dominant cleavage occurs at the C13-C14 bond, with loss of the vinyl side chain to yield a fragment ion at m/z 289.1855.
Table 2.
Identification of metabolites in fermented mulberry leaf tea.
The tabulated data were extracted from the data matrix generated after raw data processing using Progenesis QI v3., and ion fragmentation information was obtained from the ECI scripts exported by this software.
3.3. Fermentation-Associated Transcriptomic Differences in Mulberry Leaf Tea
Within the valid sequencing data across all samples, the proportion of bases with quality scores ≥ Q20 (sequencing error rate < 0.01) exceeded 99%, and the proportion of bases with quality scores ≥ Q30 (sequencing error rate < 0.001) exceeded 96%. The RIN values of all samples were greater than 7, demonstrating high data quality and suitability for subsequent downstream analyses.
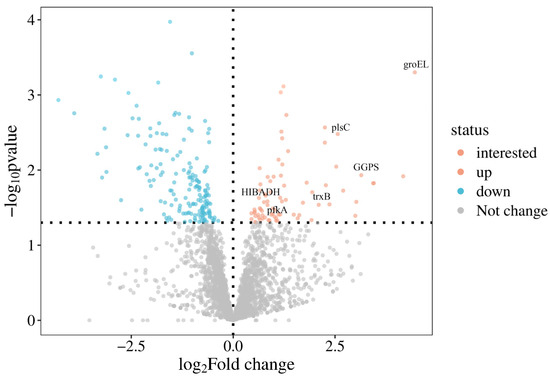
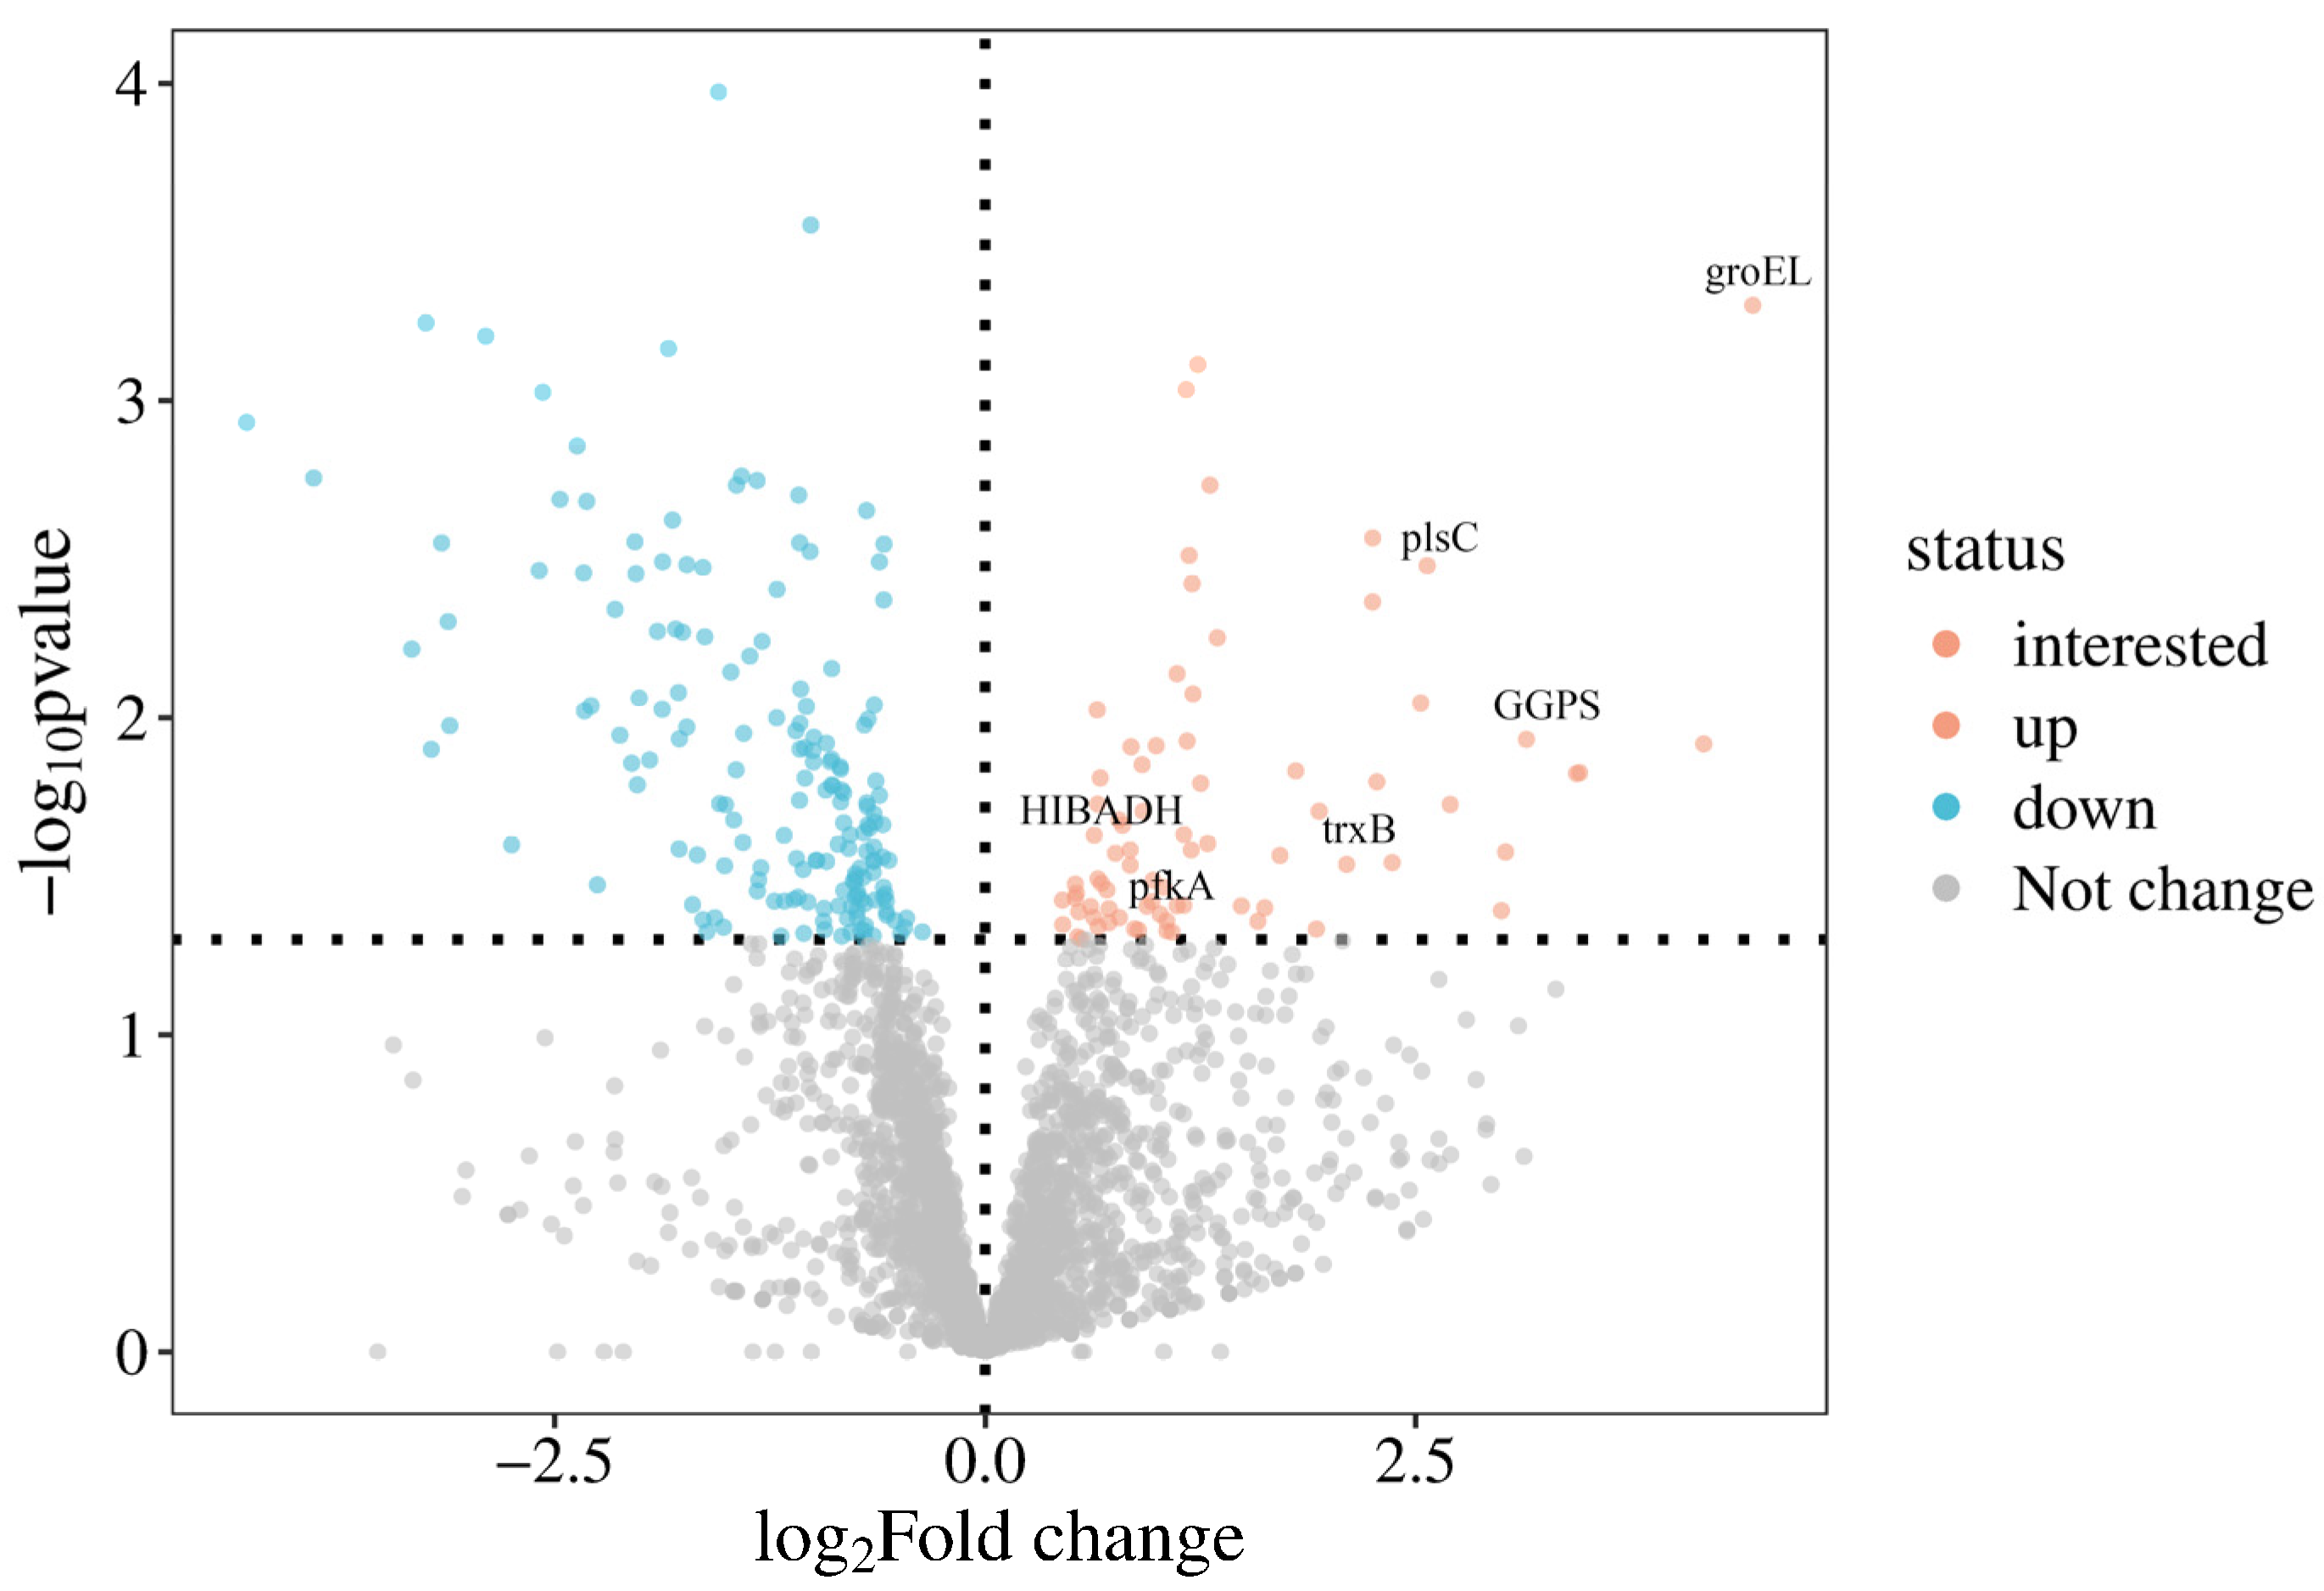
Given the fermentation-associated differences in the relative abundances of annotated fatty acids and terpenoids, transcriptomic comparison between raw and fermented sample matrices was conducted to identify differentially expressed transcripts and pathway annotations potentially associated with these differences. Differential expression analysis was performed using DESeq2, and the results were visualized in a volcano plot (Figure 6). In total, 250 genes were significantly upregulated, and 173 genes were significantly downregulated. These results describe differences in RNA abundance between the two sample matrices and do not, by themselves, demonstrate active plant transcription or causal metabolite biosynthesis.
Figure 6.
Volcano plot of differentially expressed genes (DEGs) between mulberry leaves (ML) and fermented mulberry leaves (FML). This volcano plot visualizes gene expression changes. The horizontal axis represents log2(Fold Change), and the vertical axis represents −log10(p-value). Genes with p < 0.05 and |log2(Fold Change)| ≥ 1 were defined as differentially expressed genes. Genes coloured in red represent significantly up-regulated DEGs, while genes in blue represent significantly down-regulated DEGs. Grey dots indicate genes with no significant expression difference. The specially marked points denote the key DEGs of interest, which are fatty acid and terpenoid biosynthesis-related DEGs focused on in this study.
3.4. Enrichment of Fatty Acid-Related Pathway Annotations Among Differentially Expressed Transcripts
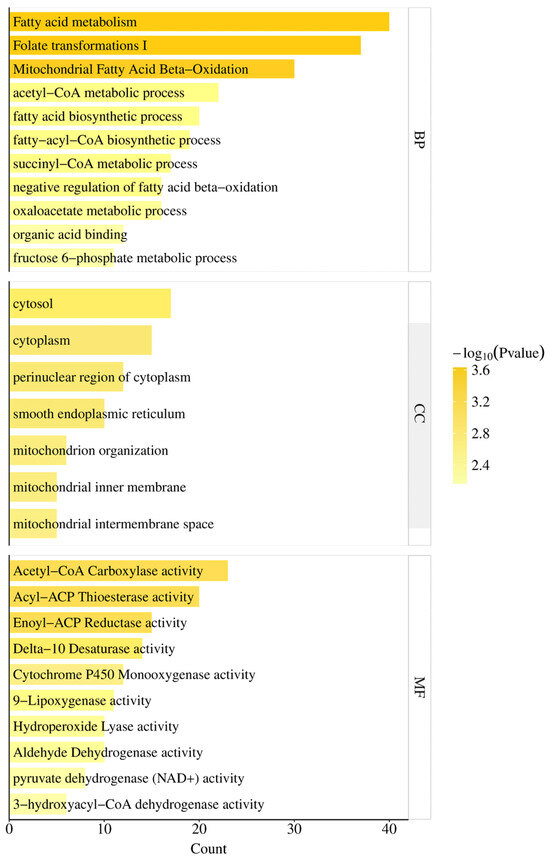
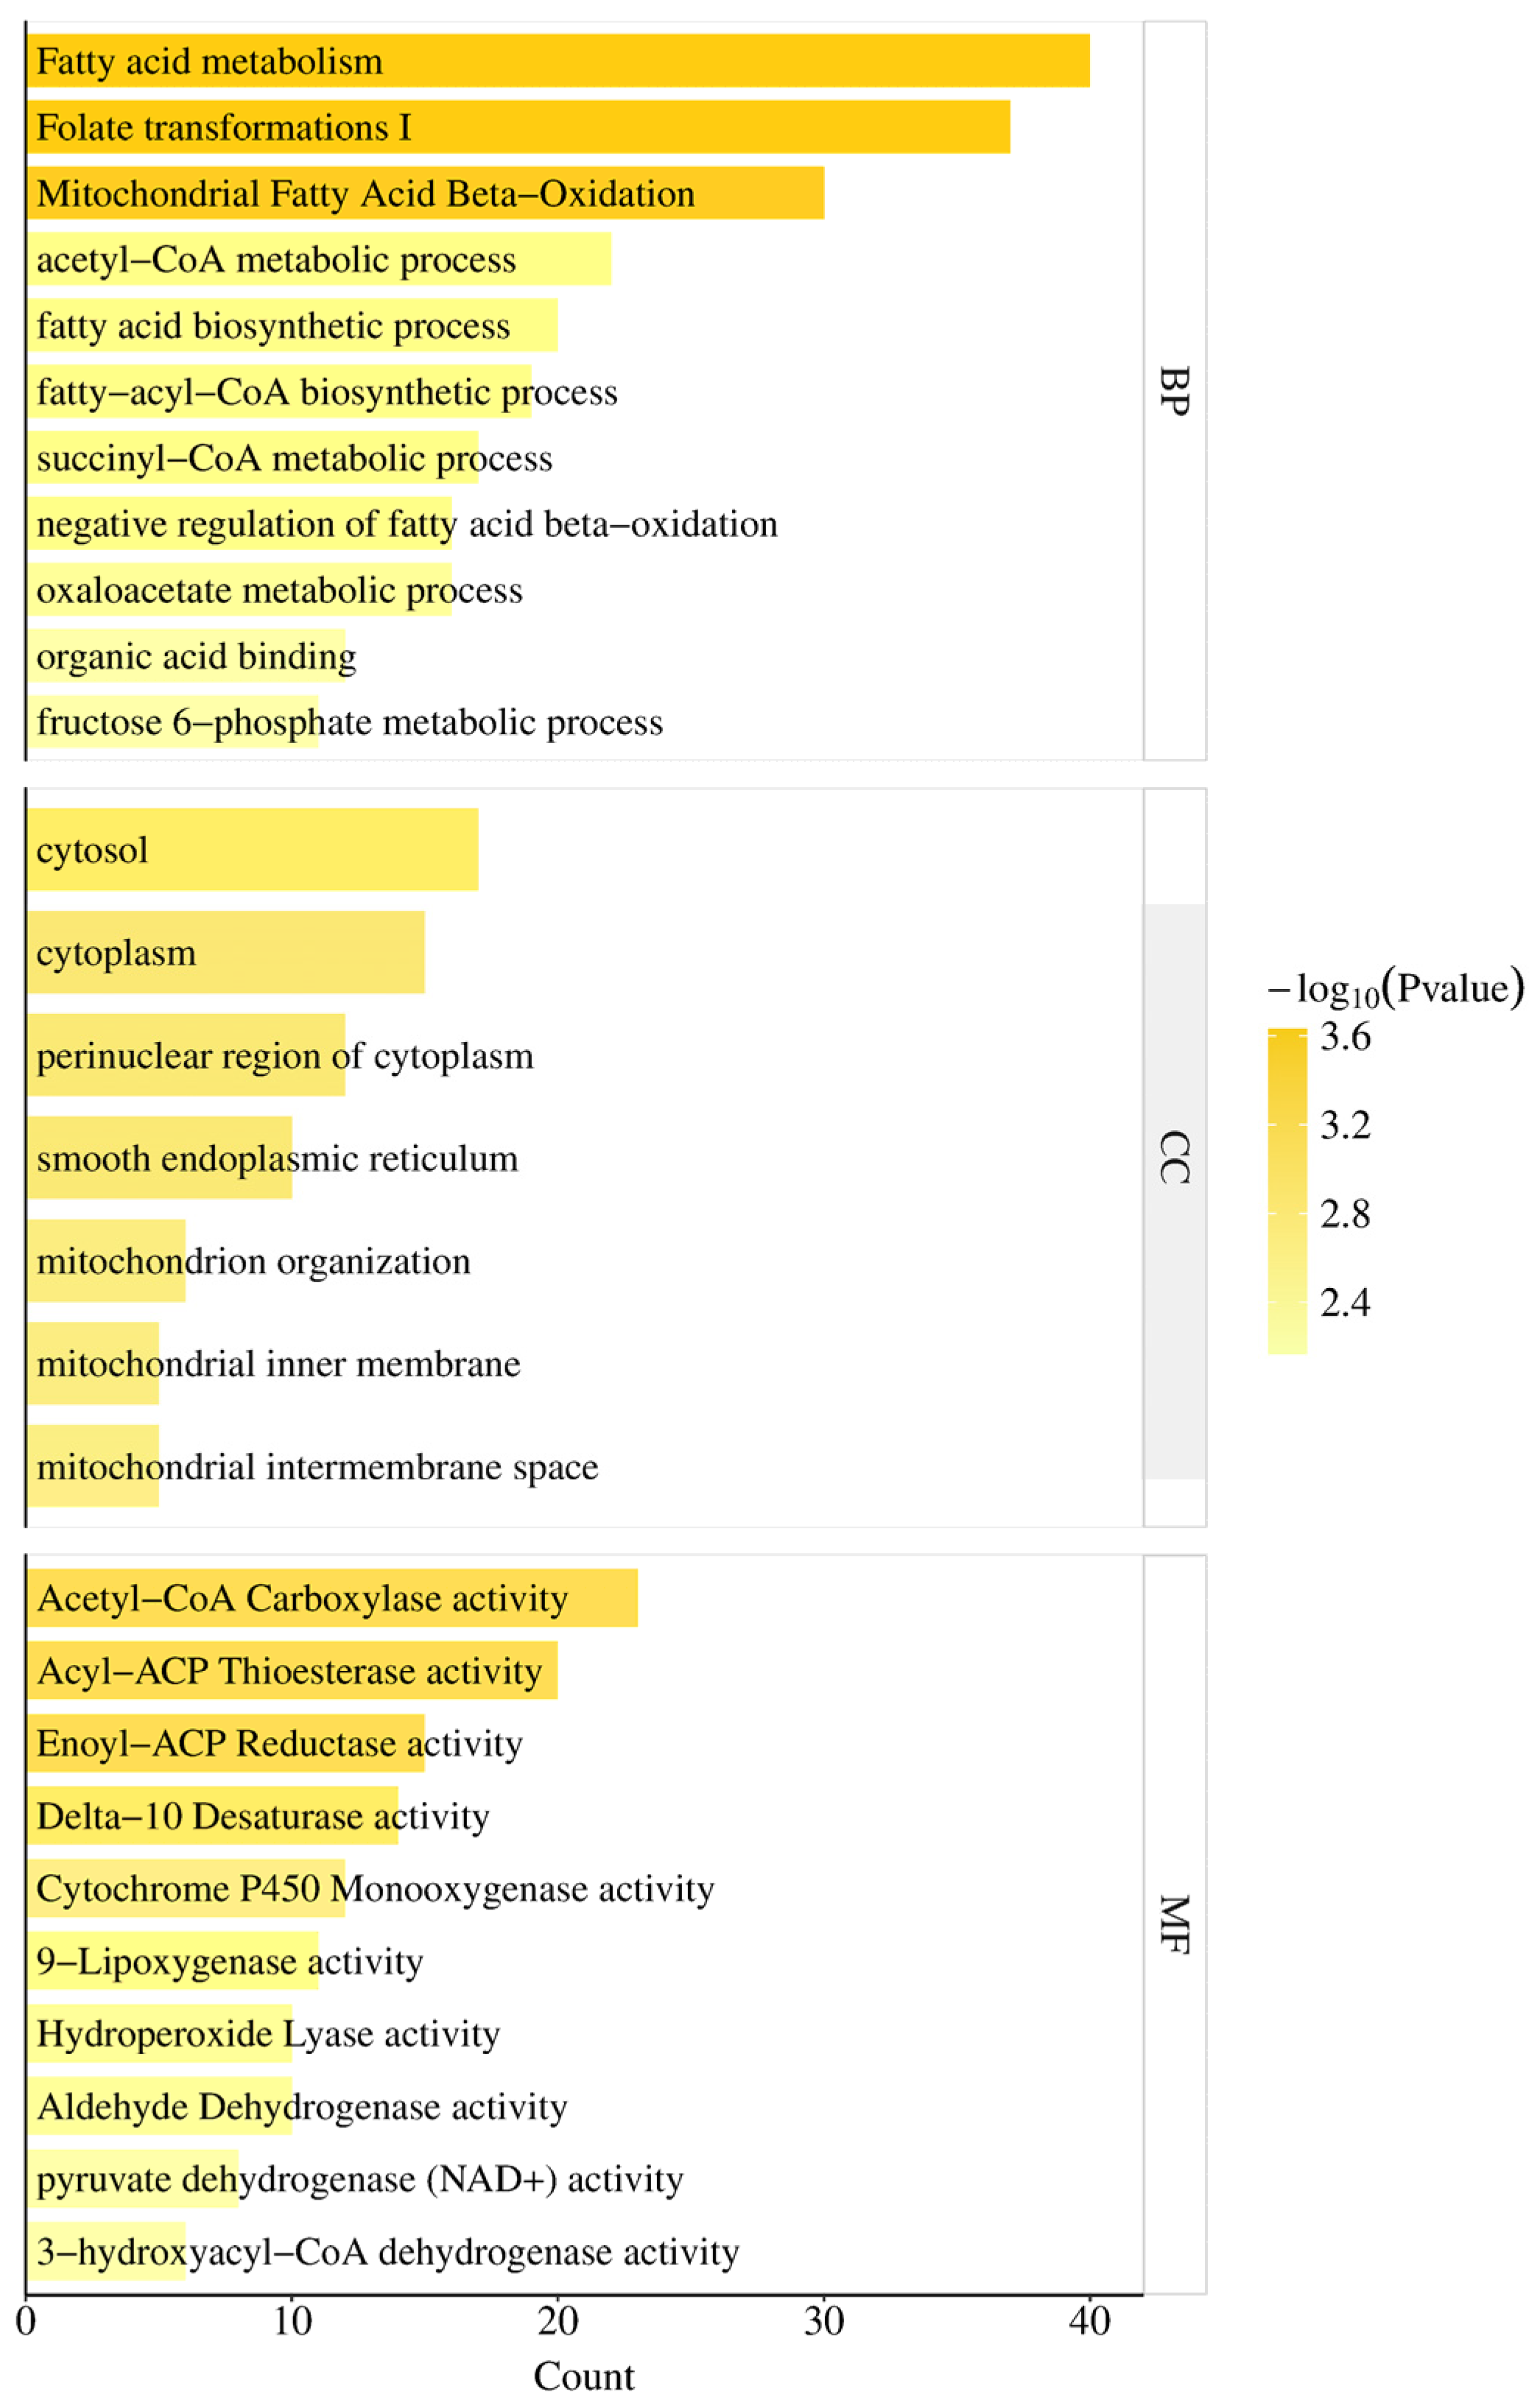
To characterize transcriptomic differences associated with L. rhamnosus-inoculated mulberry leaf fermentation, GO enrichment analysis was performed on differentially expressed genes (DEGs) between raw and fermented sample matrices, with a p-value < 0.05 set as the enrichment threshold. In total, 42 biological process (BP) terms, 10 cellular component (CC) terms, and 16 molecular function (MF) terms annotated as related to fatty acid biosynthesis were identified. Enrichment indicates over-representation of annotations among the detected DEGs and should not be interpreted as direct evidence of pathway activity or metabolite flux.
The top enriched terms within each GO category were selected for visualization and further analysis. DEGs enriched in the MF category were predominantly associated with the mitochondrial pyruvate dehydrogenase complex, acyl-CoA dehydrogenase activity, pyruvate dehydrogenase (NAD+) activity, 3-hydroxyacyl-CoA dehydrogenase activity, and acetyltransferase activity (Figure 7). For instance, acetyltransferases transfer the acetyl group from acetyl-CoA to target molecules (e.g., histones and proteases), thereby regulating the expression of genes involved in fatty acid biosynthesis.
Figure 7.
Gene Ontology enrichment analysis of differentially expressed genes related to fatty acid biosynthesis between mulberry leaves and fermented mulberry leaves. GO terms are classified into three categories: BP (biological process), CC (cellular component), and MF (molecular function). The X-axis represents the Count, namely the number of DEGs enriched in each GO term. The colour gradient indicates enrichment significance expressed as −log10(p-value); a yellower colour corresponds to a smaller p-value and more significant enrichment.
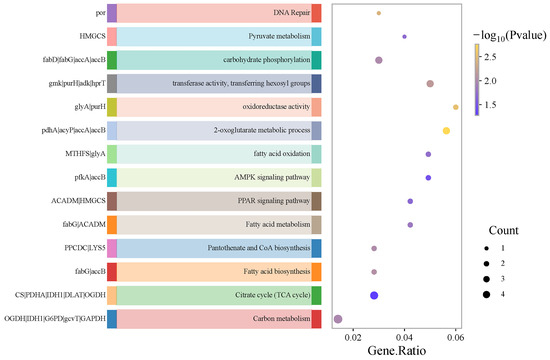
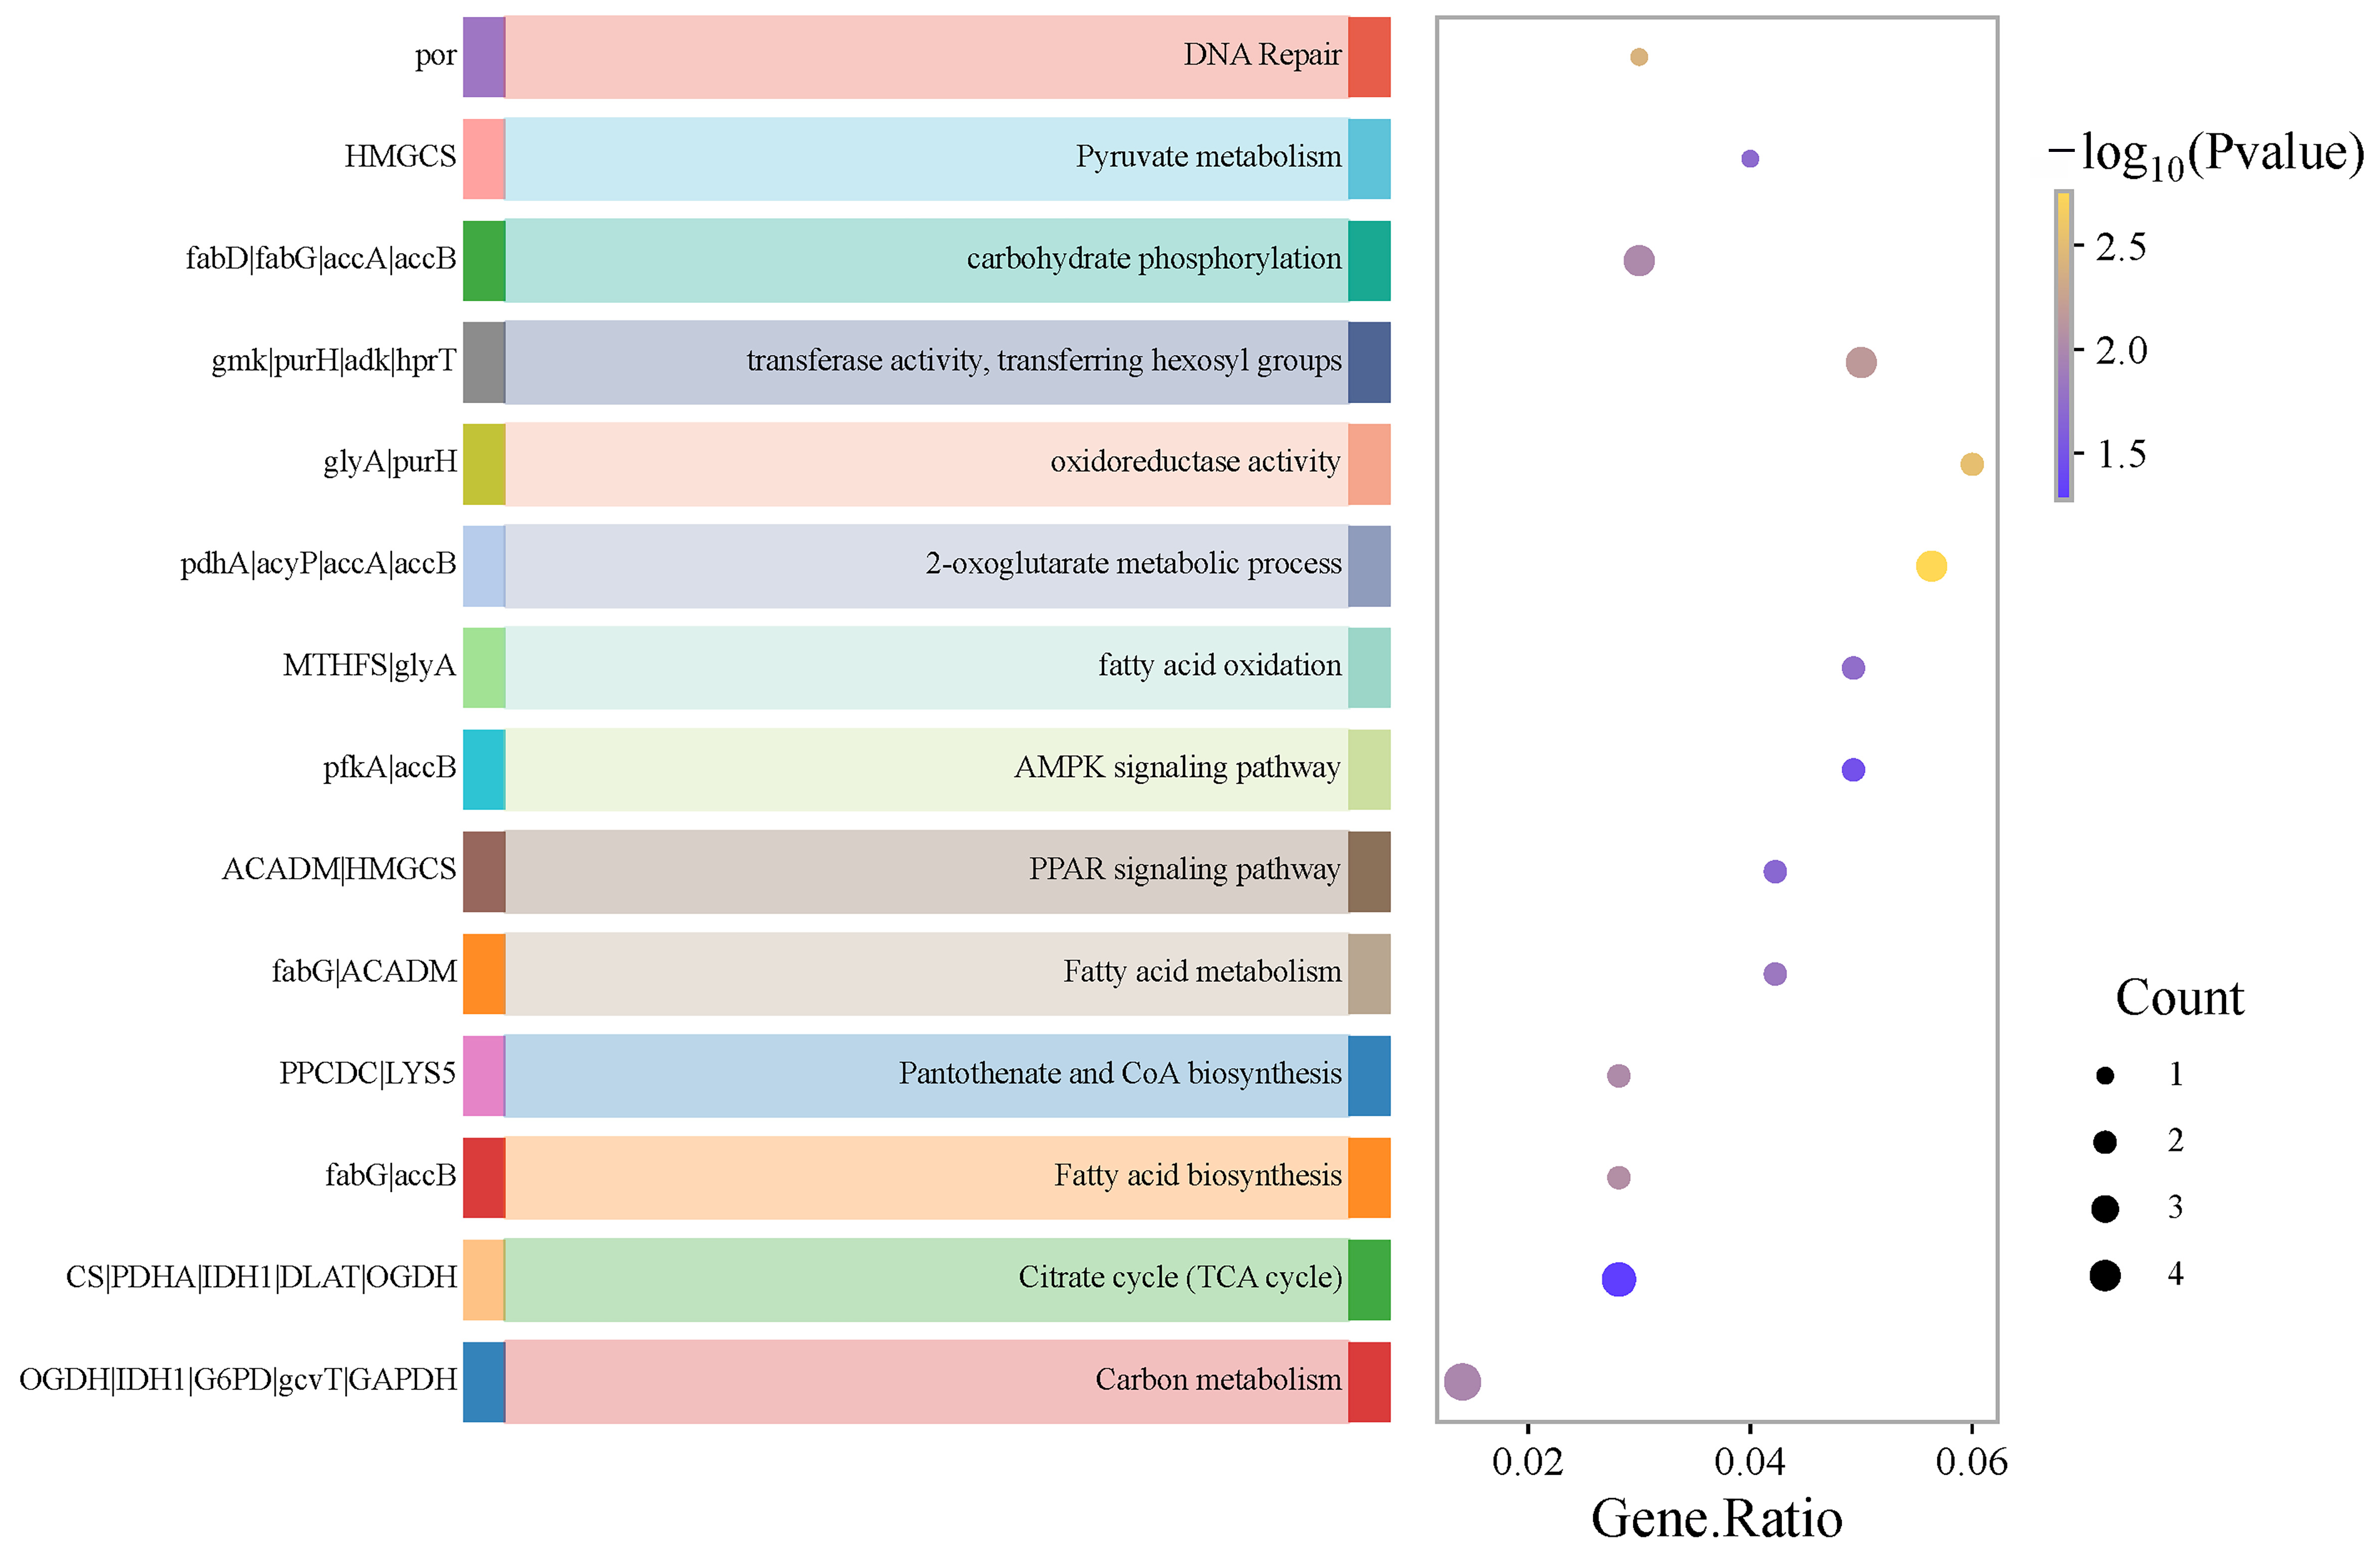
Functional annotation of DEGs against the KEGG database identified enrichment in pathways annotated to fatty acid metabolism and related functions, as illustrated in Figure 8. These annotations provide hypotheses for processes that may contribute to the observed fermentation-associated metabolite differences.
Figure 8.
KEGG enrichment analysis of fatty acid-related differentially expressed genes between mulberry leaves and fermented mulberry leaves. The X-axis, Gene Ratio, represents the gene ratio, defined as the number of differentially expressed genes enriched in the KEGG pathway divided by the total number of genes annotated to this pathway.
3.5. Enrichment of Terpenoid-Related Pathway Annotations Among Differentially Expressed Transcripts
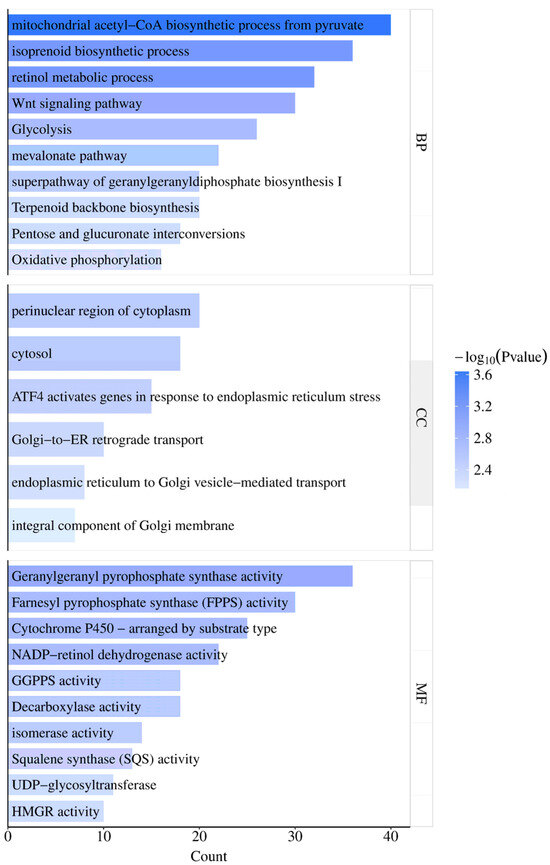
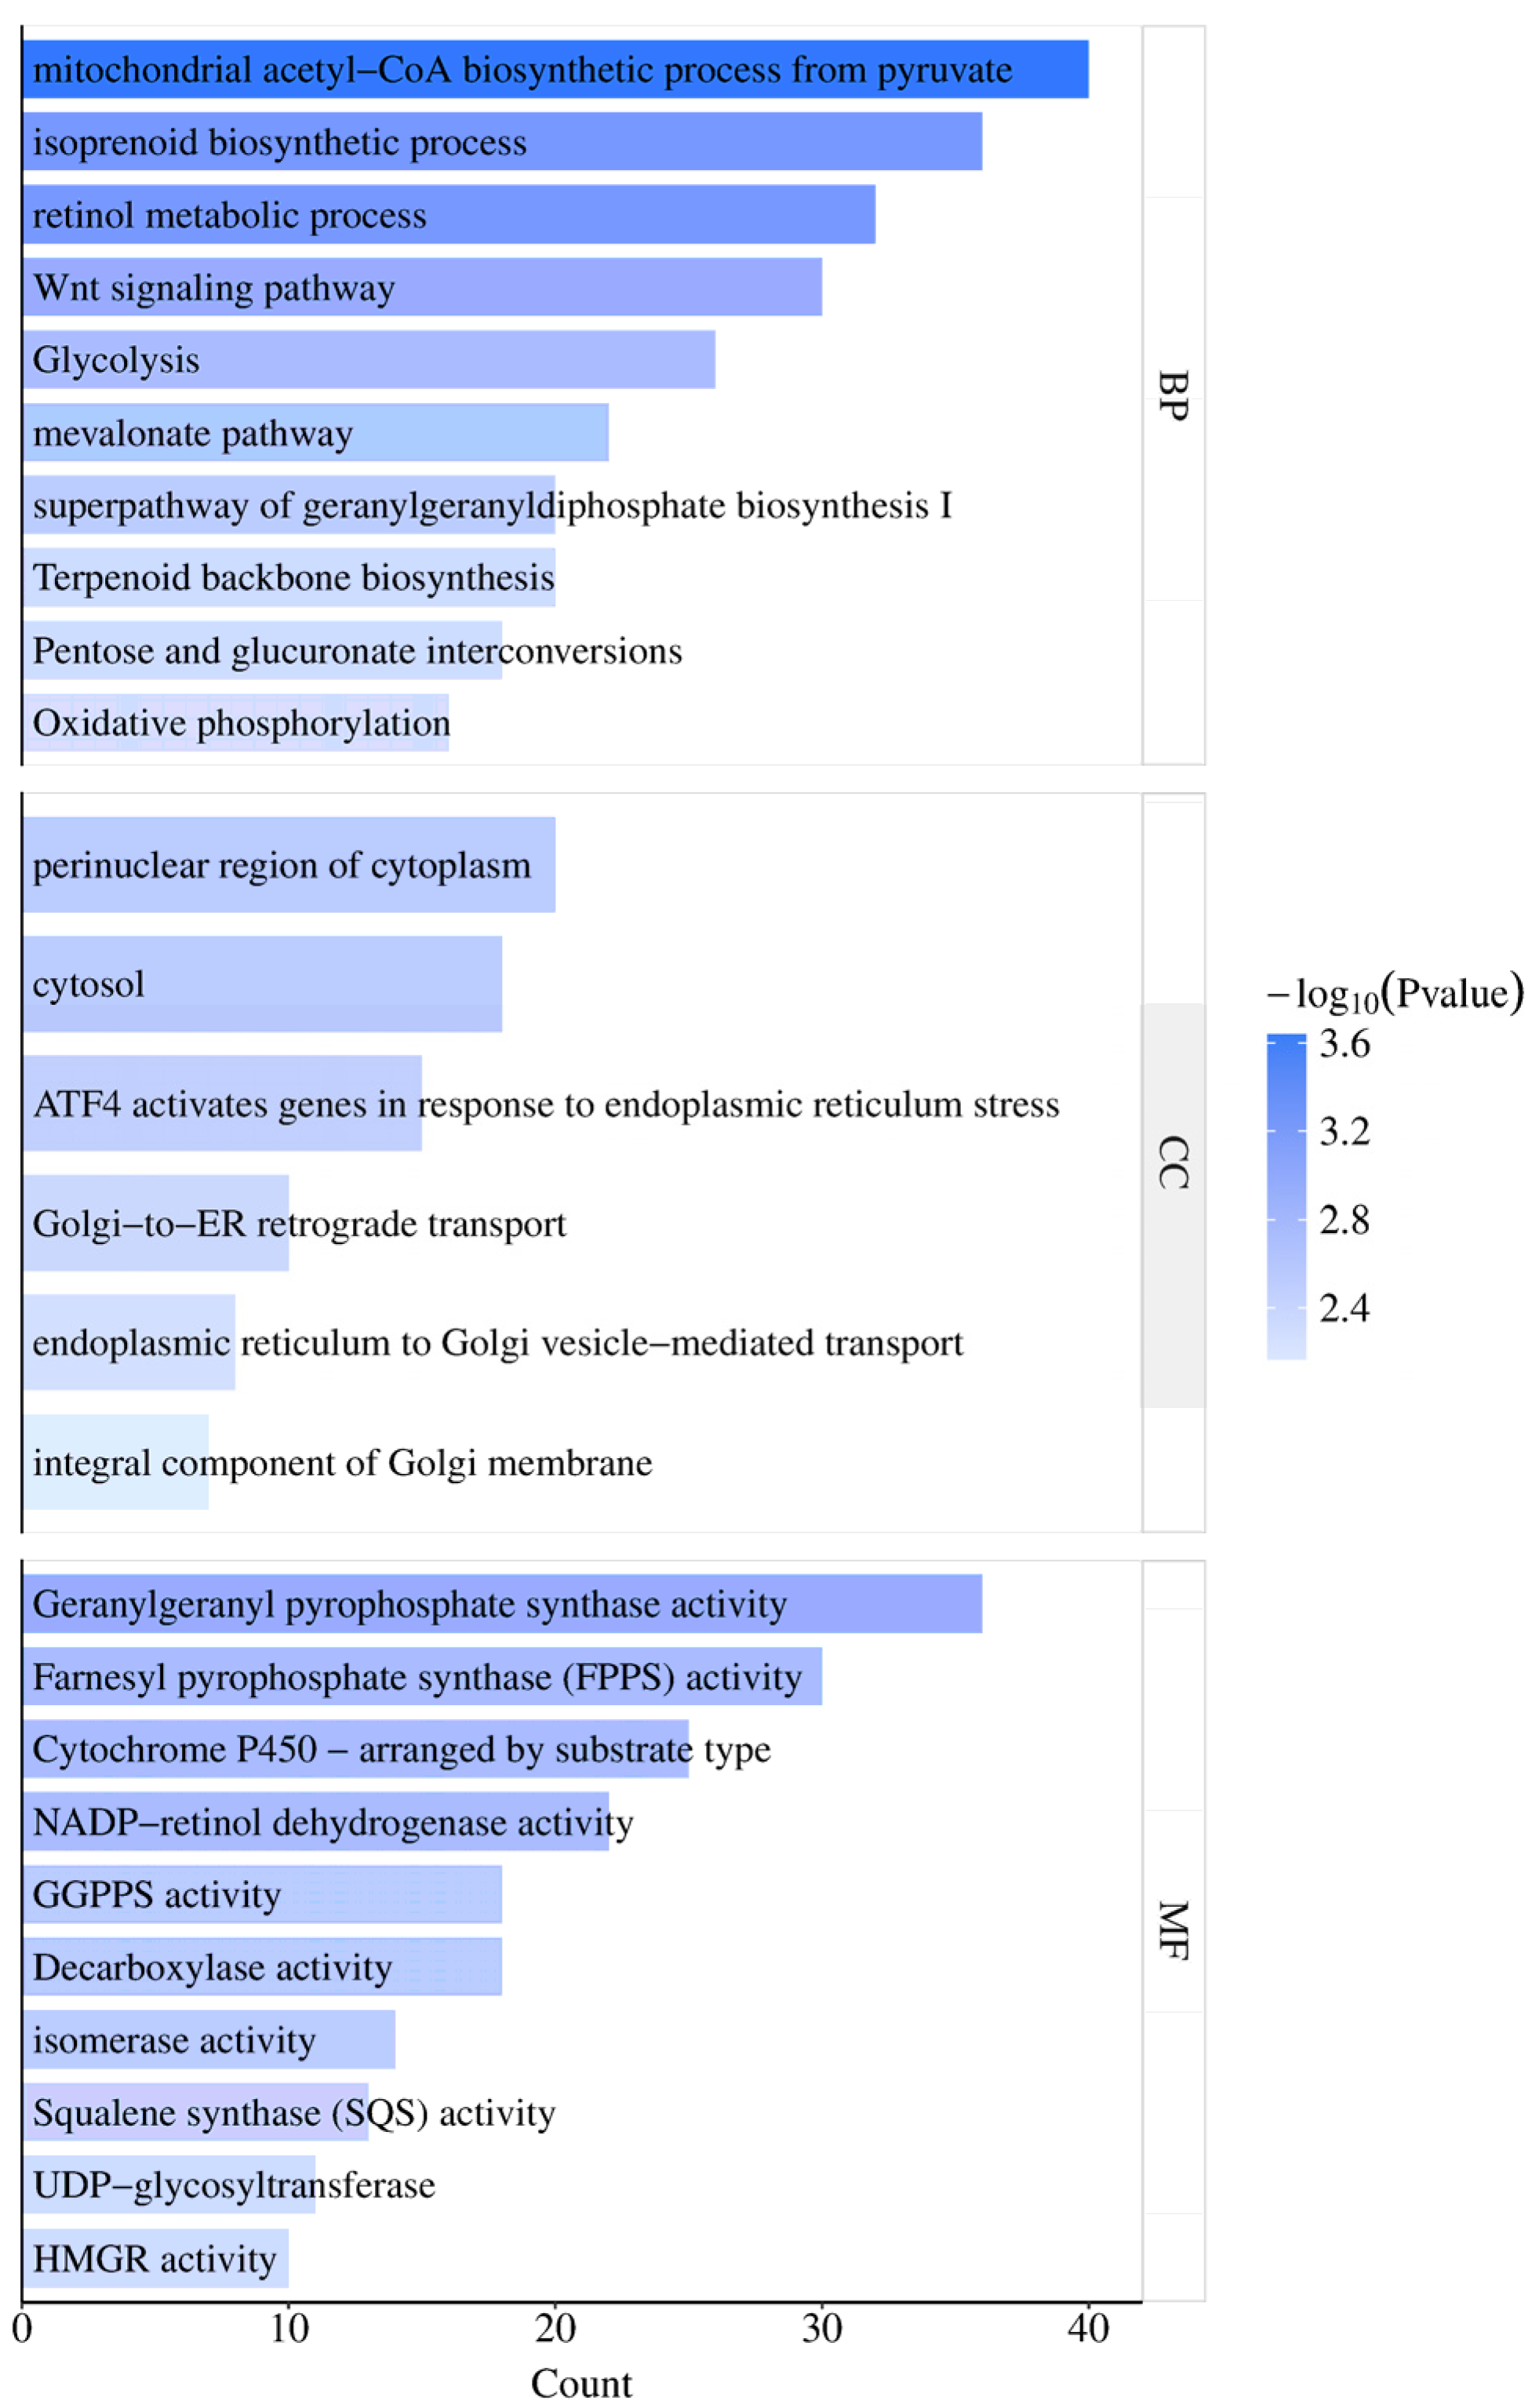
GO enrichment analysis of DEGs between raw and fermented sample matrices was performed with a p-value < 0.05 as the enrichment threshold. In total, 36 biological process (BP) terms, 10 cellular component (CC) terms, and 15 molecular function (MF) terms annotated as related to terpenoid metabolism were identified. The top enriched terms were selected for visualization and further analysis. These results are annotation-based associations and do not establish de novo terpenoid biosynthesis.
Among the enriched annotations were terpenoid backbone biosynthesis, glucose catabolic process, retinol metabolic process, the mevalonate pathway, the superpathway of geranylgeranyldiphosphate biosynthesis I, and pentose and glucuronate interconversions (Figure 9). Molecular-function annotations included retinol dehydrogenase activity, oxoglutarate dehydrogenase complex, isomerase activity, and cytochrome P450, whereas cellular-component annotations included the Golgi apparatus, endoplasmic reticulum (ER), cytosol, and Golgi membrane. These annotations suggest candidate pathways for subsequent targeted and source-resolving investigation.
Figure 9.
Gene Ontology enrichment analysis of terpenoid biosynthesis-related differentially expressed genes between mulberry leaves and fermented mulberry leaves. GO terms are classified into three categories: BP (biological process), CC (cellular component), and MF (molecular function). The X-axis has the same meaning as that in Figure 7.
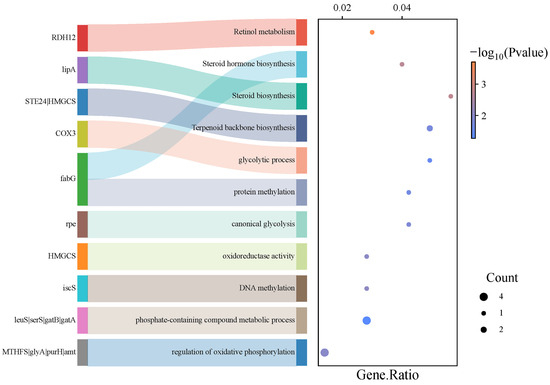
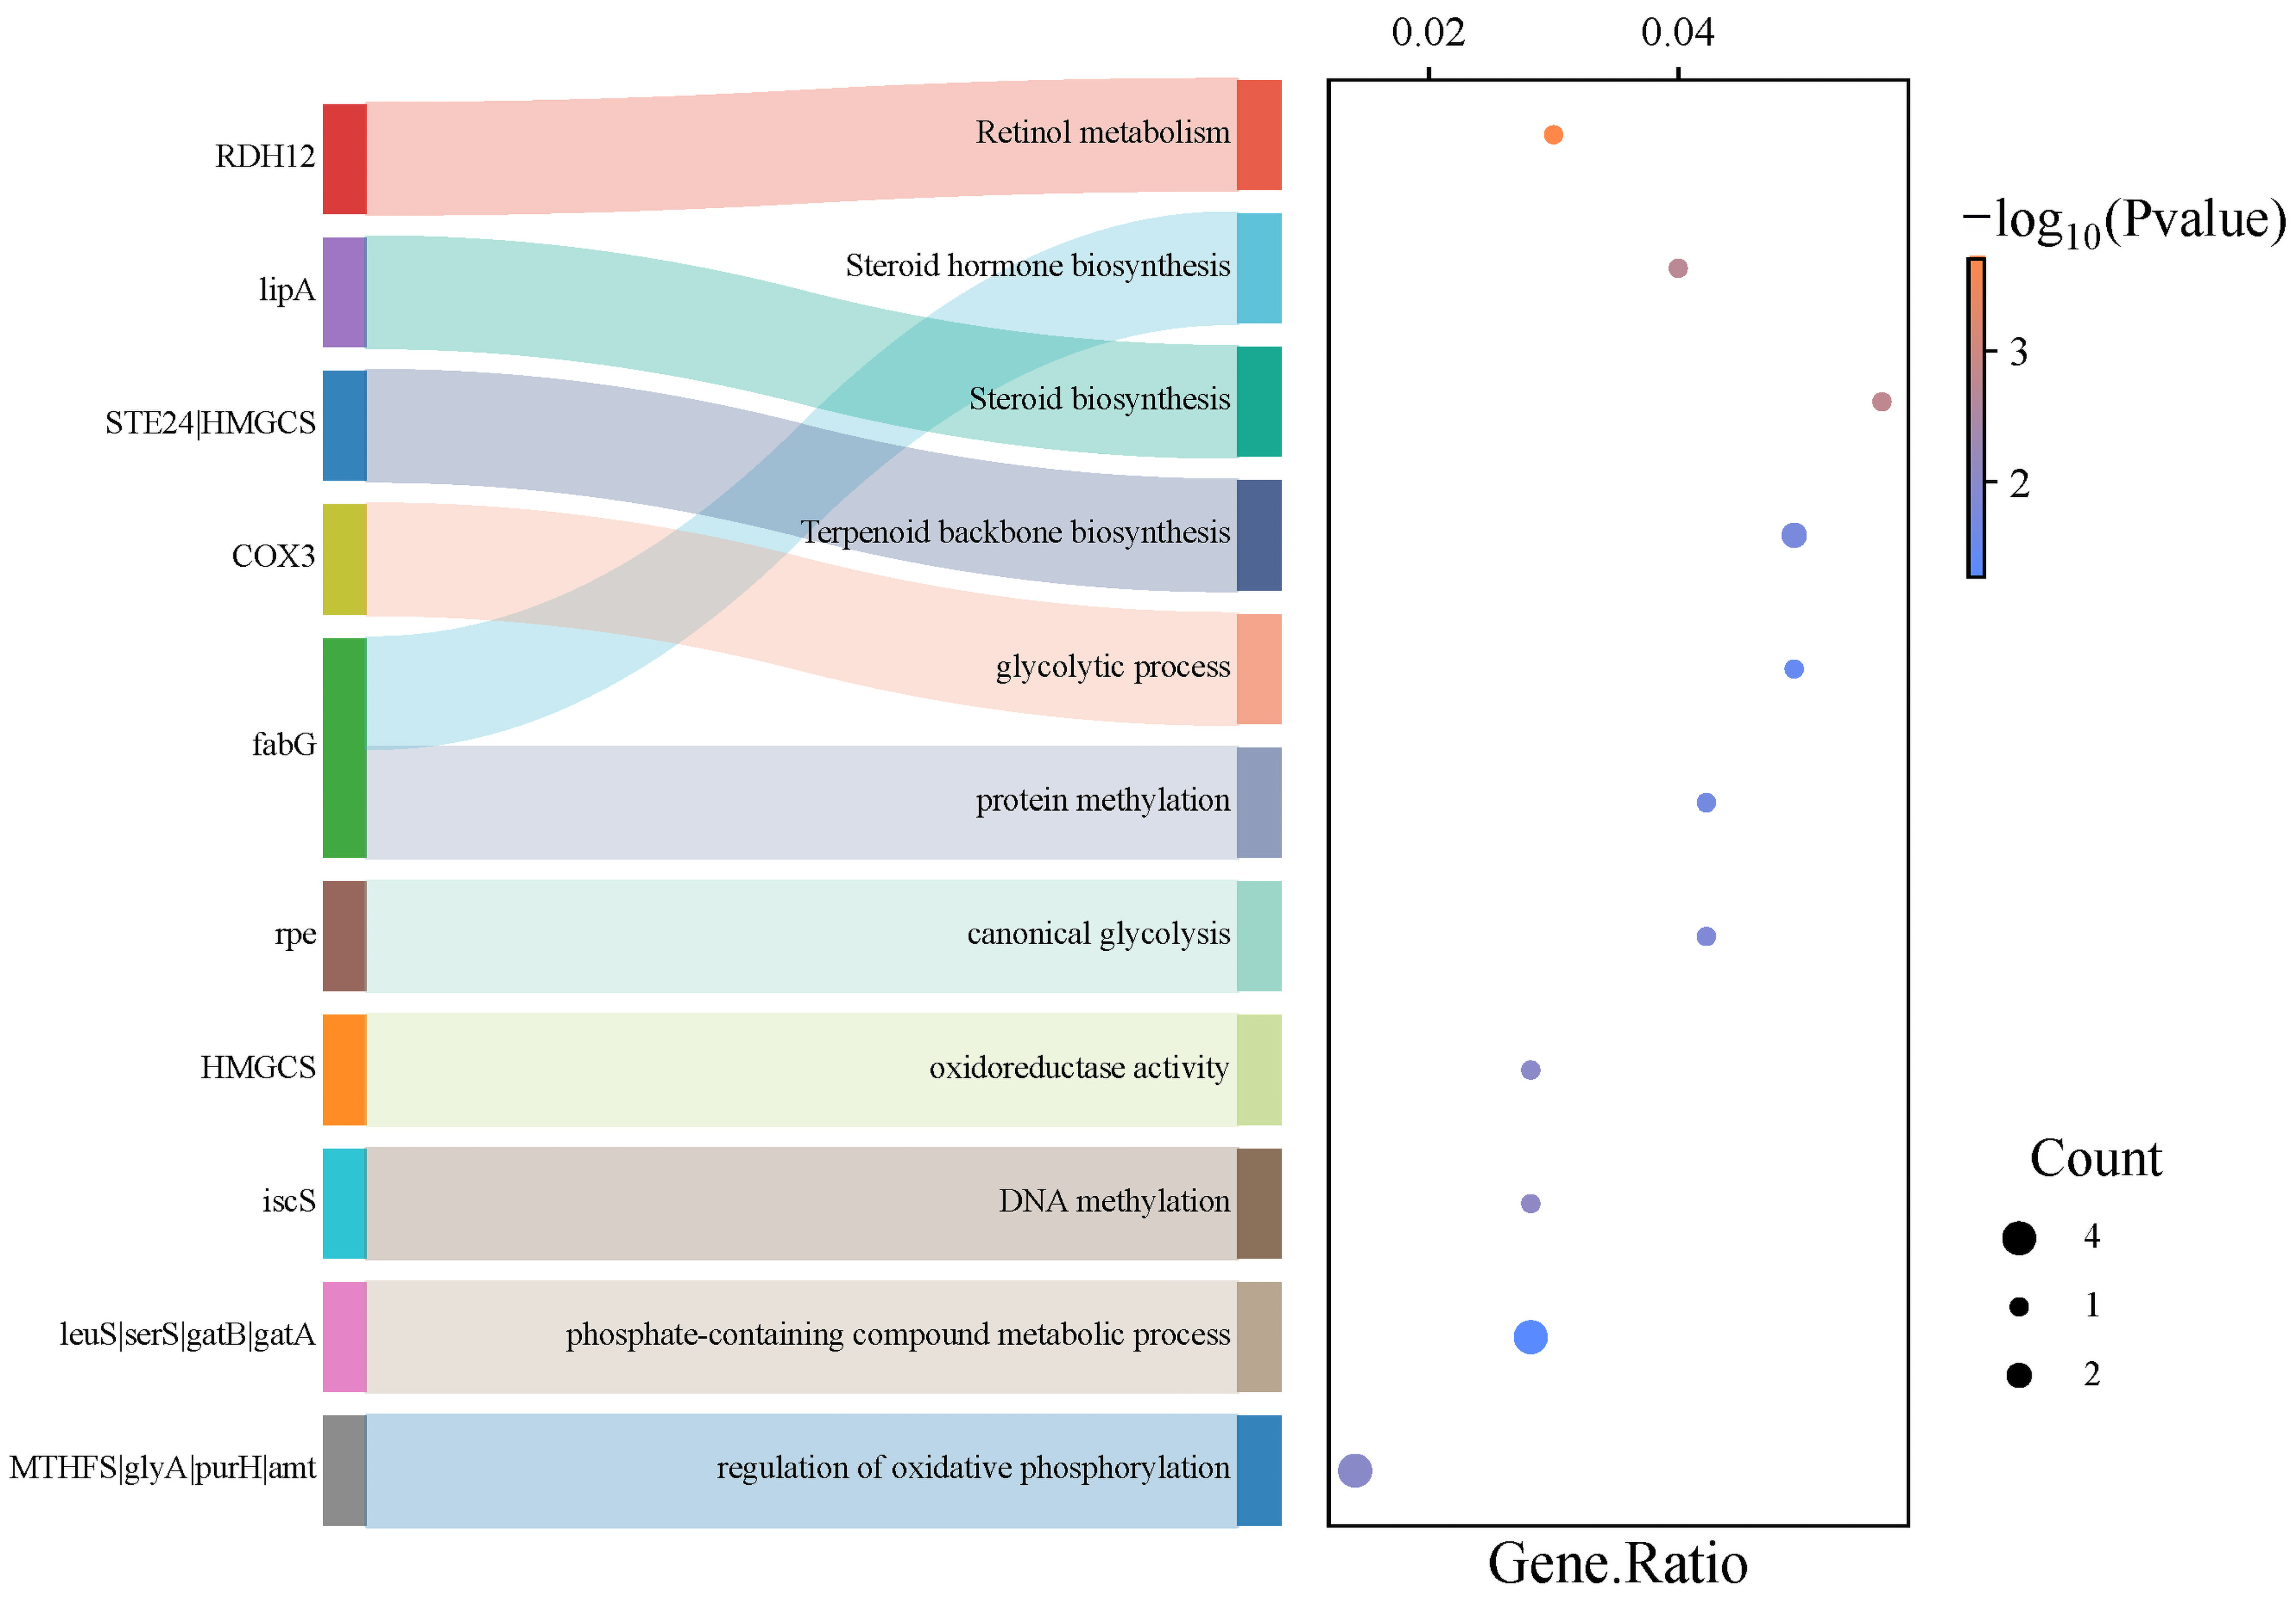
KEGG pathway annotation of these DEGs indicated enrichment in terpenoid backbone biosynthesis, canonical glycolysis, and oxidative-phosphorylation-related functions (Figure 10). The enrichment analysis does not distinguish microbial and plant contributions or demonstrate pathway flux.
Figure 10.
KEGG enrichment analysis of terpenoid-related differentially expressed genes between raw and fermented mulberry leaves. The X-axis represents the same parameter as described in Figure 8.
3.6. Putative Fatty Acid-Related Pathways Inferred from Annotation
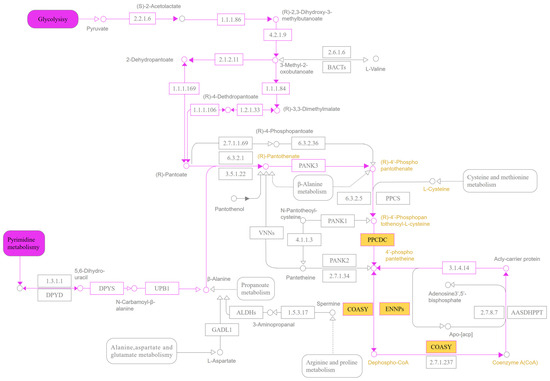
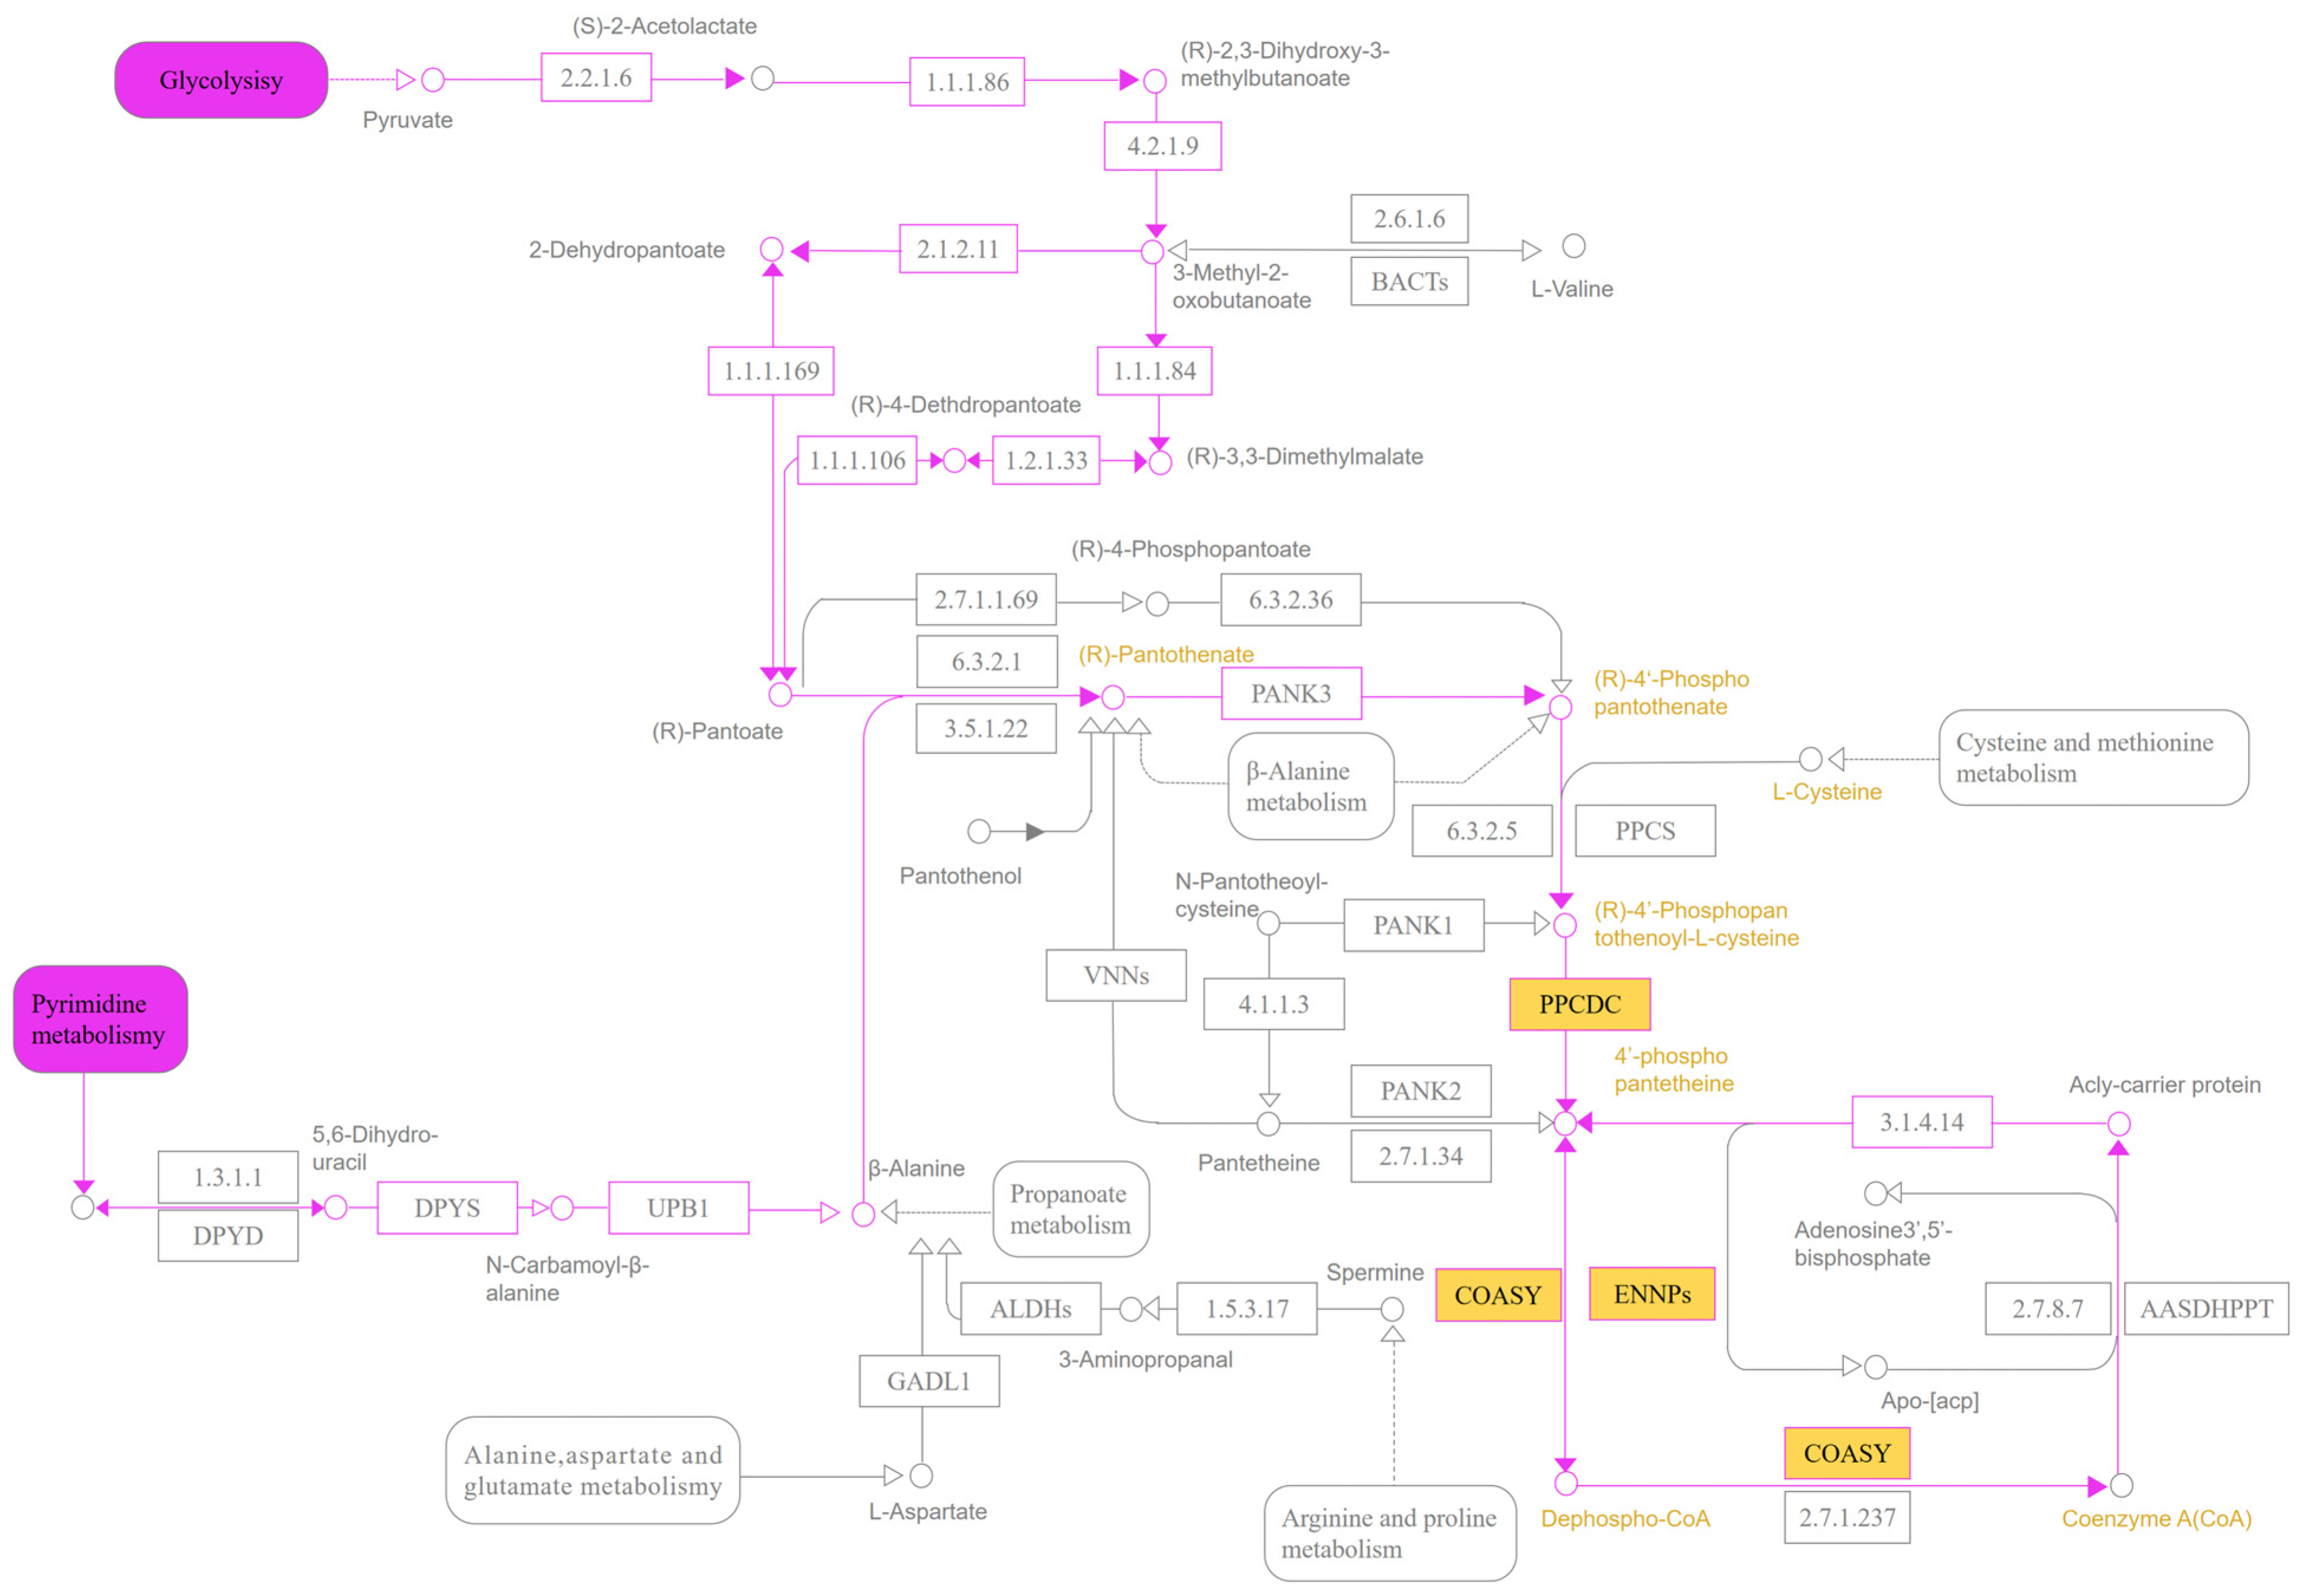
Figure 11 presents an annotation-based, putative pantothenate and CoA pathway relevant to the fermentation sample matrix. The map is intended to summarize candidate reactions associated with the enriched annotations; it does not establish that the reactions occurred in a particular organism or that they increased fatty acid biosynthesis. Transcript-origin assignment and metabolic-flux measurements will be required to test these hypotheses.
Figure 11.
Putative pantothenate and coenzyme A (CoA)-related pathway annotated from differentially expressed transcripts in raw and fermented mulberry leaf sample matrices. The map summarizes candidate reactions that could be relevant to CoA and acetyl-CoA metabolism. It does not demonstrate pathway flux, enhanced fatty acid biosynthesis, or the cellular origin of individual transcripts. Enzyme abbreviations: PPCDC, phosphopantothenoylcysteine decarboxylase; ENPP, phosphodiesterase; COASY, coenzyme A synthase; PANK1, pantothenate kinase 1; PPCS, phosphopantothenoylcysteine synthetase; DPYD, dihydropyrimidine dehydrogenase; DPYS, dihydropyrimidinase; UPB, β-ureidopropionase. Symbols in the pathway maps are defined as follows: circles denote metabolites, and yellow circles denote metabolites with significant differences between raw and fermented samples. Squares denote enzyme annotations, and yellow squares denote significantly different transcripts annotated to these enzymes. Solid purple lines represent putative connections in the annotation-based maps; dashed lines indicate indirect relationships. Arrows indicate the predicted direction of biochemical reactions. These symbols summarize associations in the mixed sample matrix and do not establish pathway activity, direction, or cellular origin.
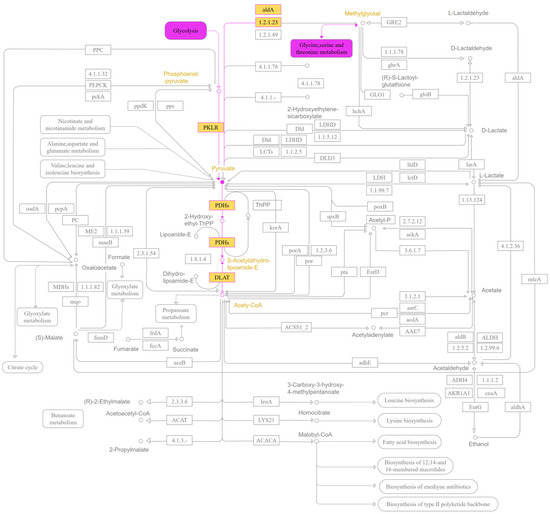
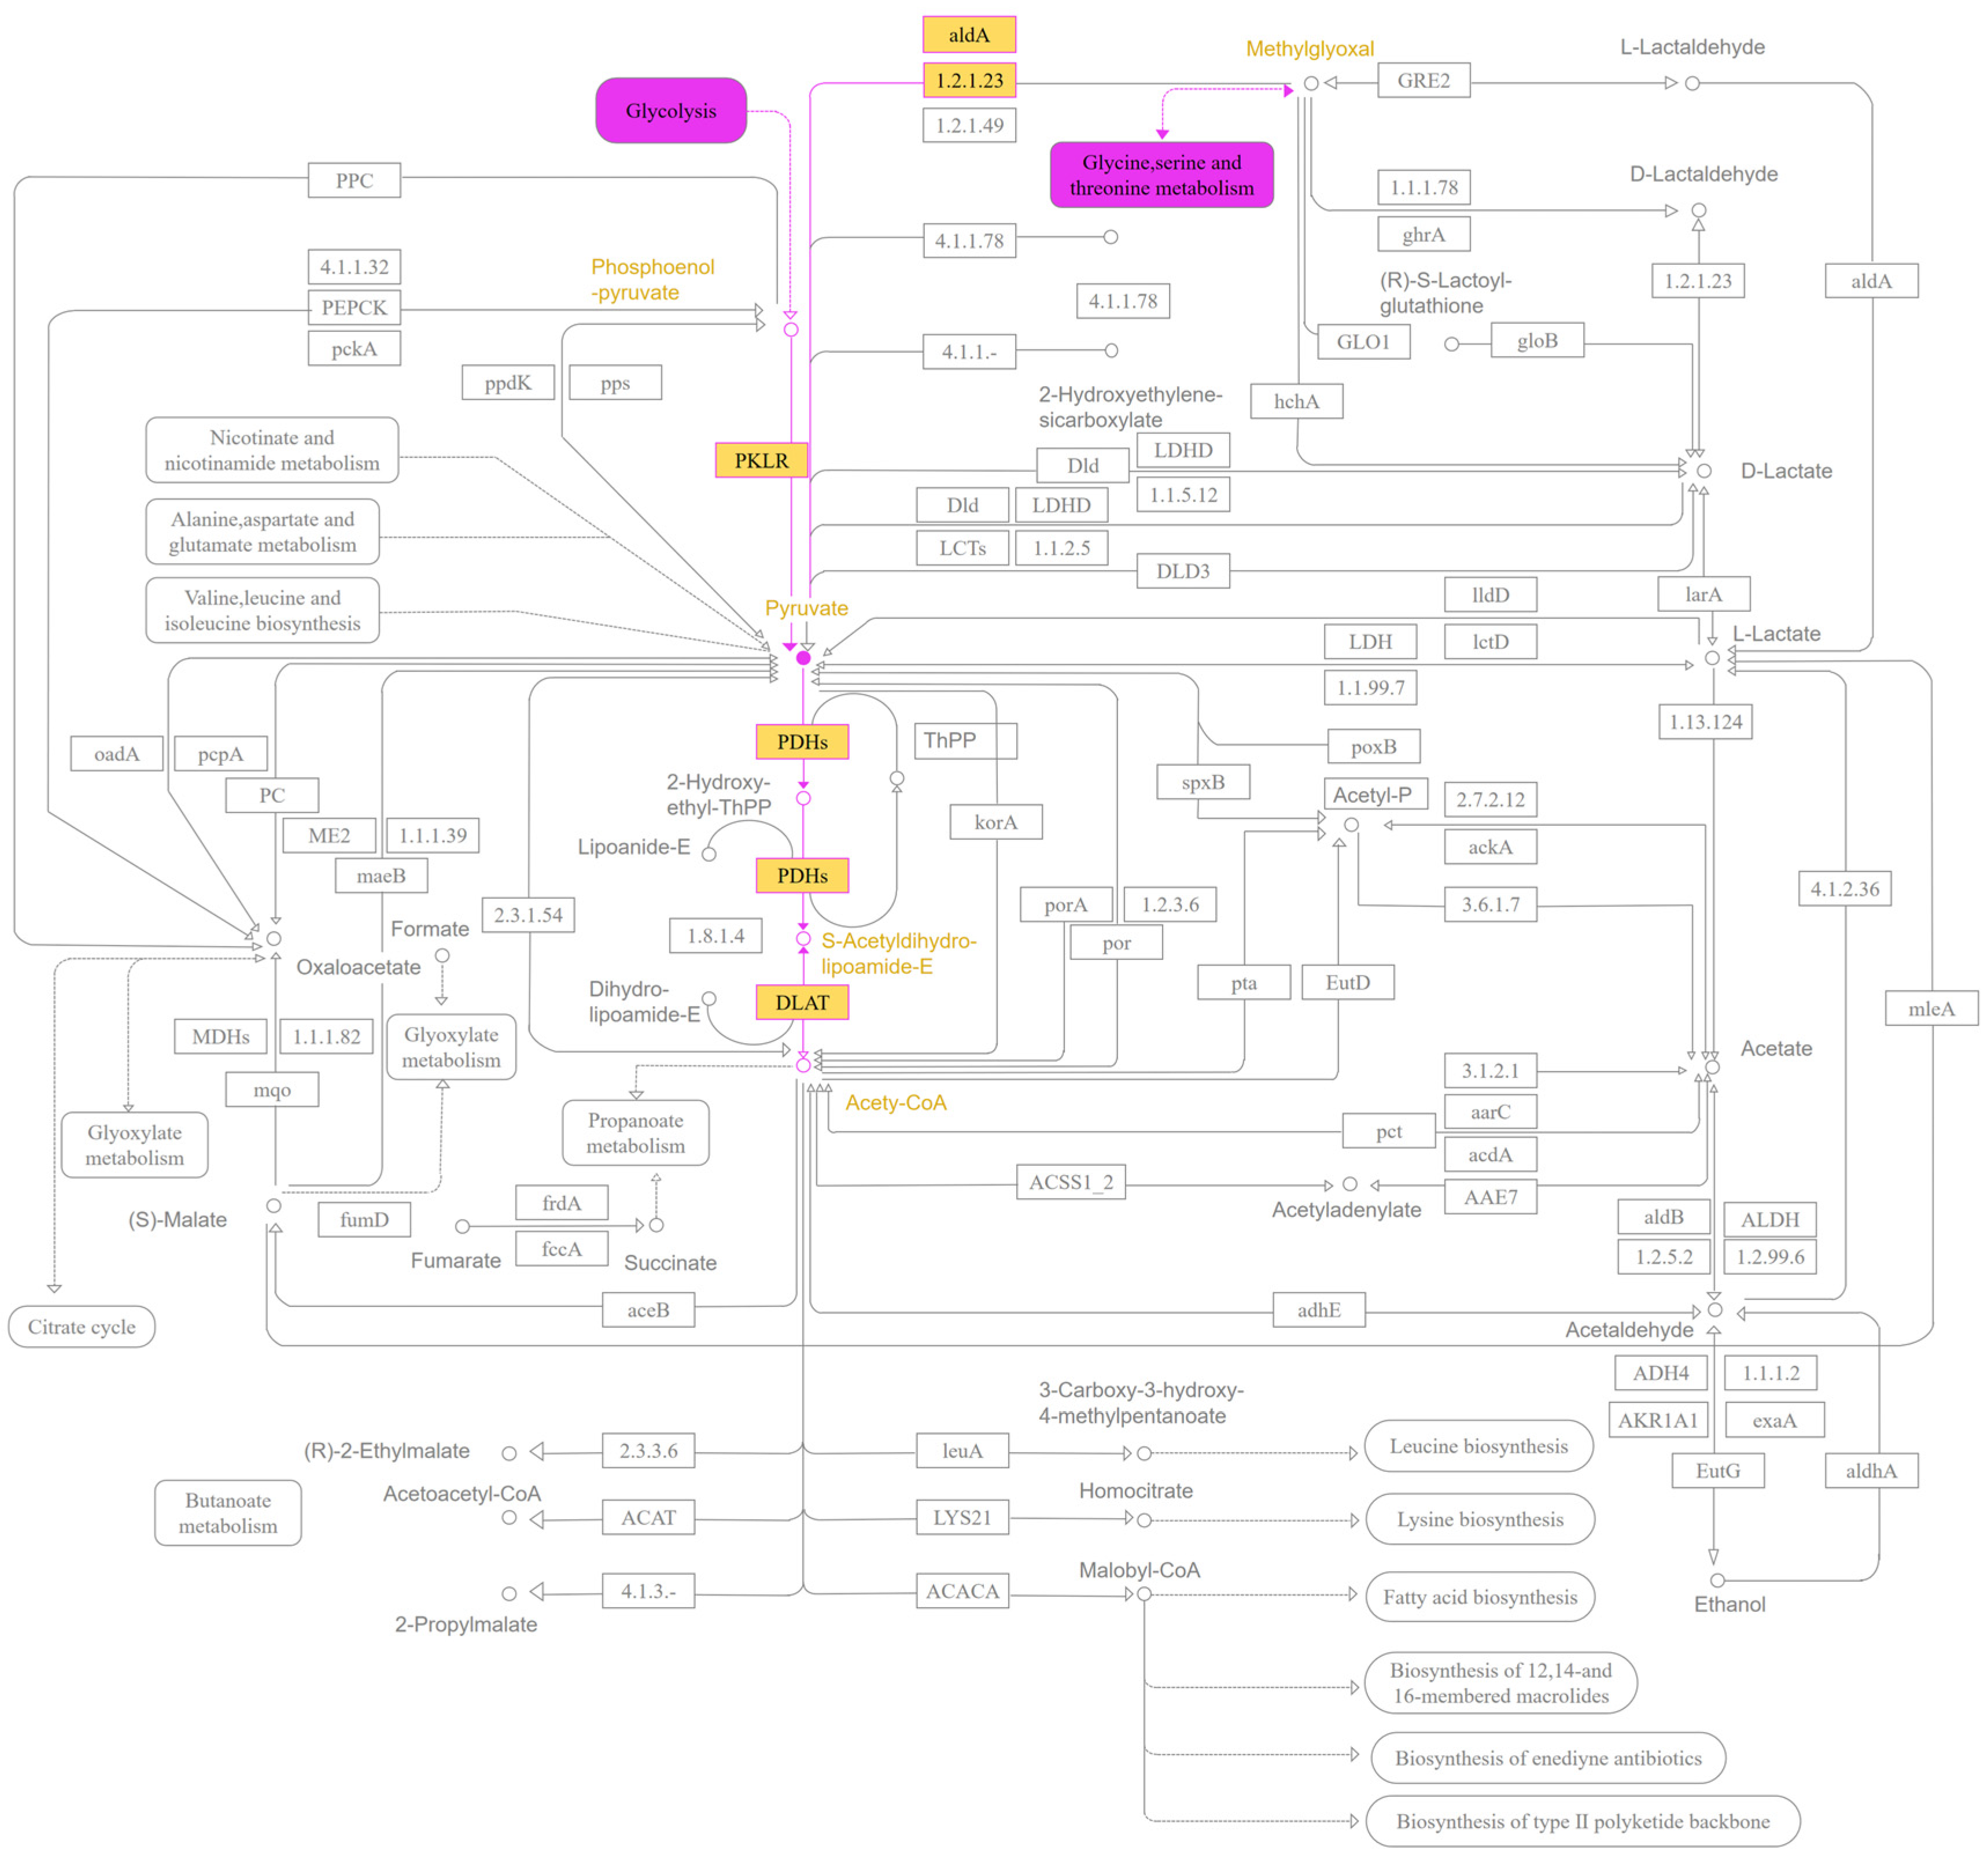
Figure 12 presents a putative pyruvate-metabolism map based on the annotation results. Genes such as aldA, PDHA, and PDHB are included because of their functional annotations. Their presence or differential abundance in the mixed fermentation matrix cannot be used to assign expression uniquely to L. rhamnosus or to demonstrate acetyl-CoA production in the system.
Figure 12.
Putative pyruvate-metabolism pathway annotated from differentially expressed transcripts in raw and fermented mulberry leaf sample matrices. The map shows candidate routes by which pyruvate can be related to acetyl-CoA metabolism. It does not demonstrate that the reactions occurred during fermentation or identify the organism responsible. Enzyme abbreviations: PKLR, pyruvate kinase L/R; DLAT, dihydrolipoamide S-acetyltransferase.Symbols in the pathway maps are defined as follows: circles denote metabolites, and yellow circles denote metabolites with significant differences between raw and fermented samples. Squares denote enzyme annotations, and yellow squares denote significantly different transcripts annotated to these enzymes. Solid purple lines represent putative connections in the annotation-based maps; dashed lines indicate indirect relationships. Arrows indicate the predicted direction of biochemical reactions. These symbols summarize associations in the mixed sample matrix and do not establish pathway activity, direction, or cellular origin.
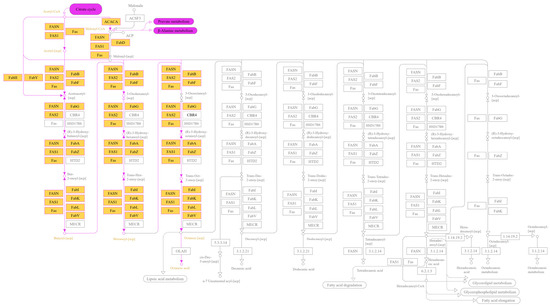
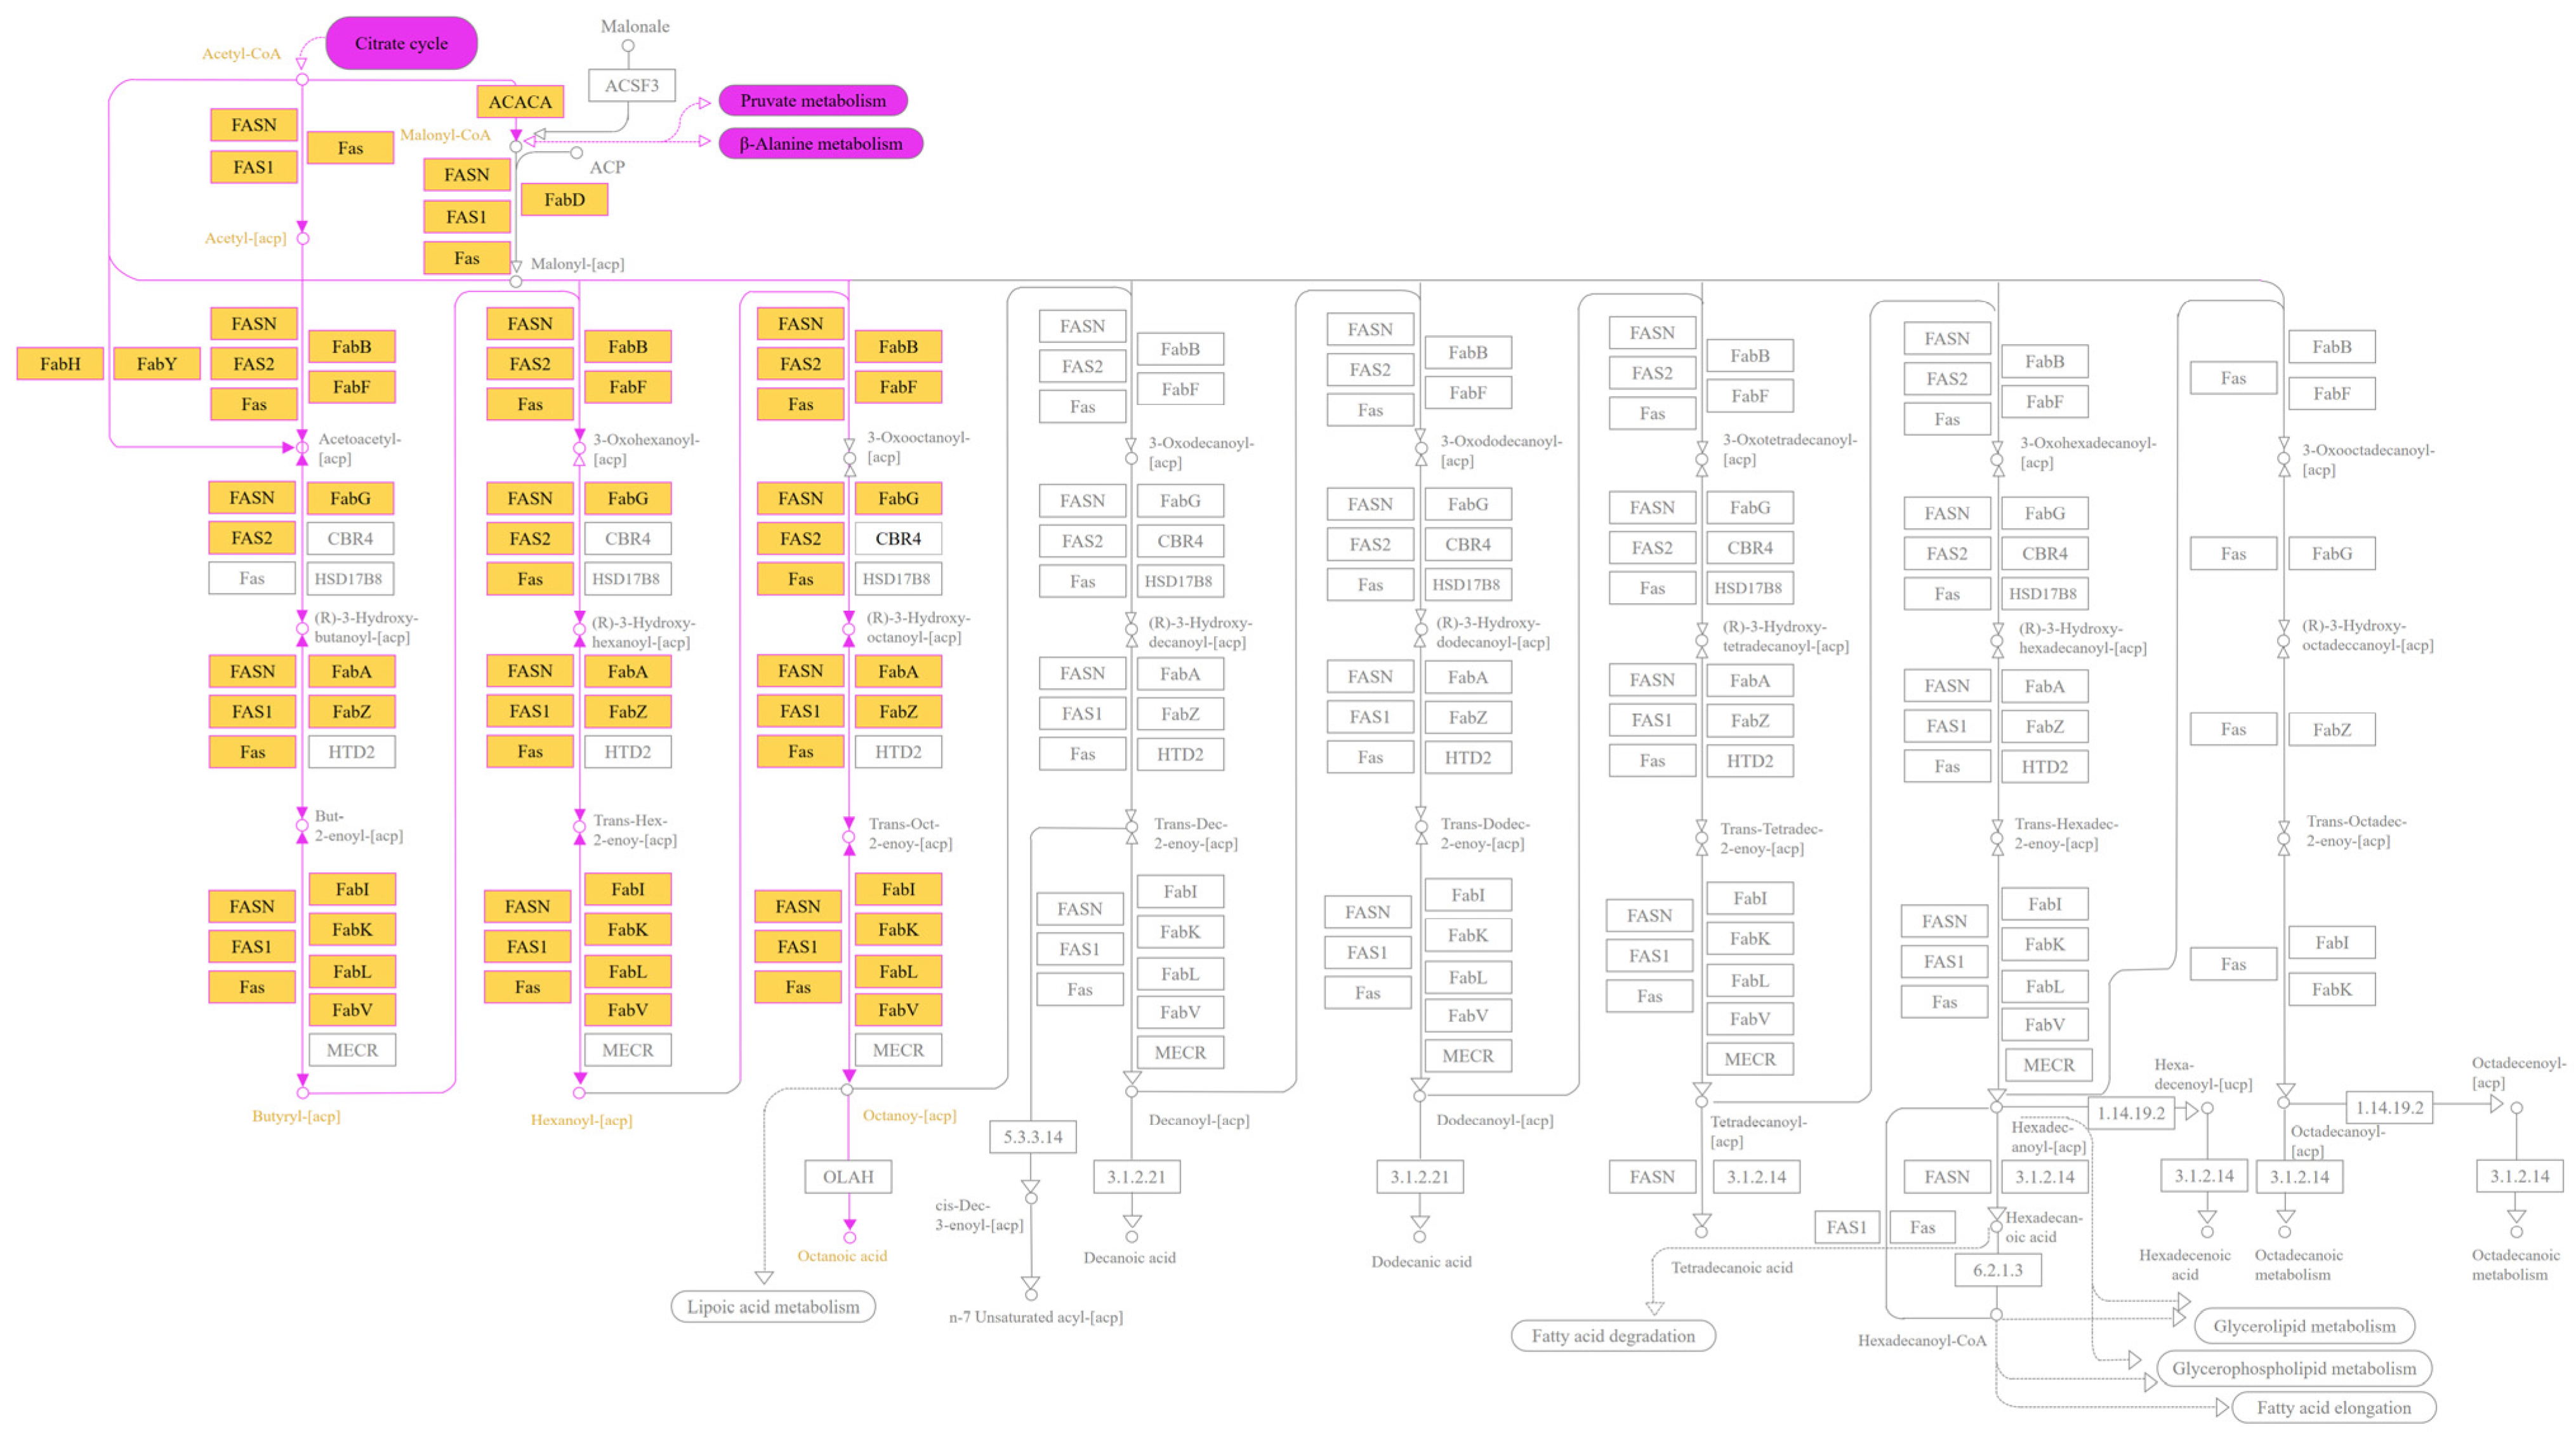
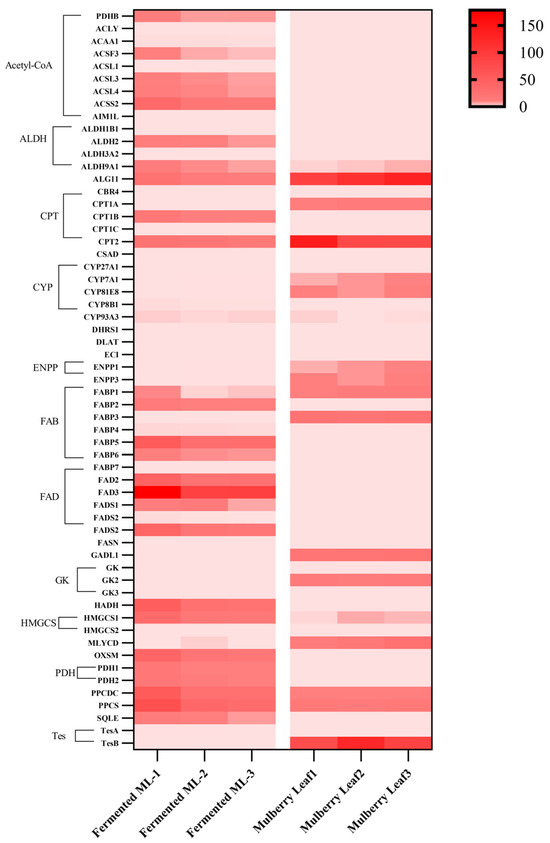
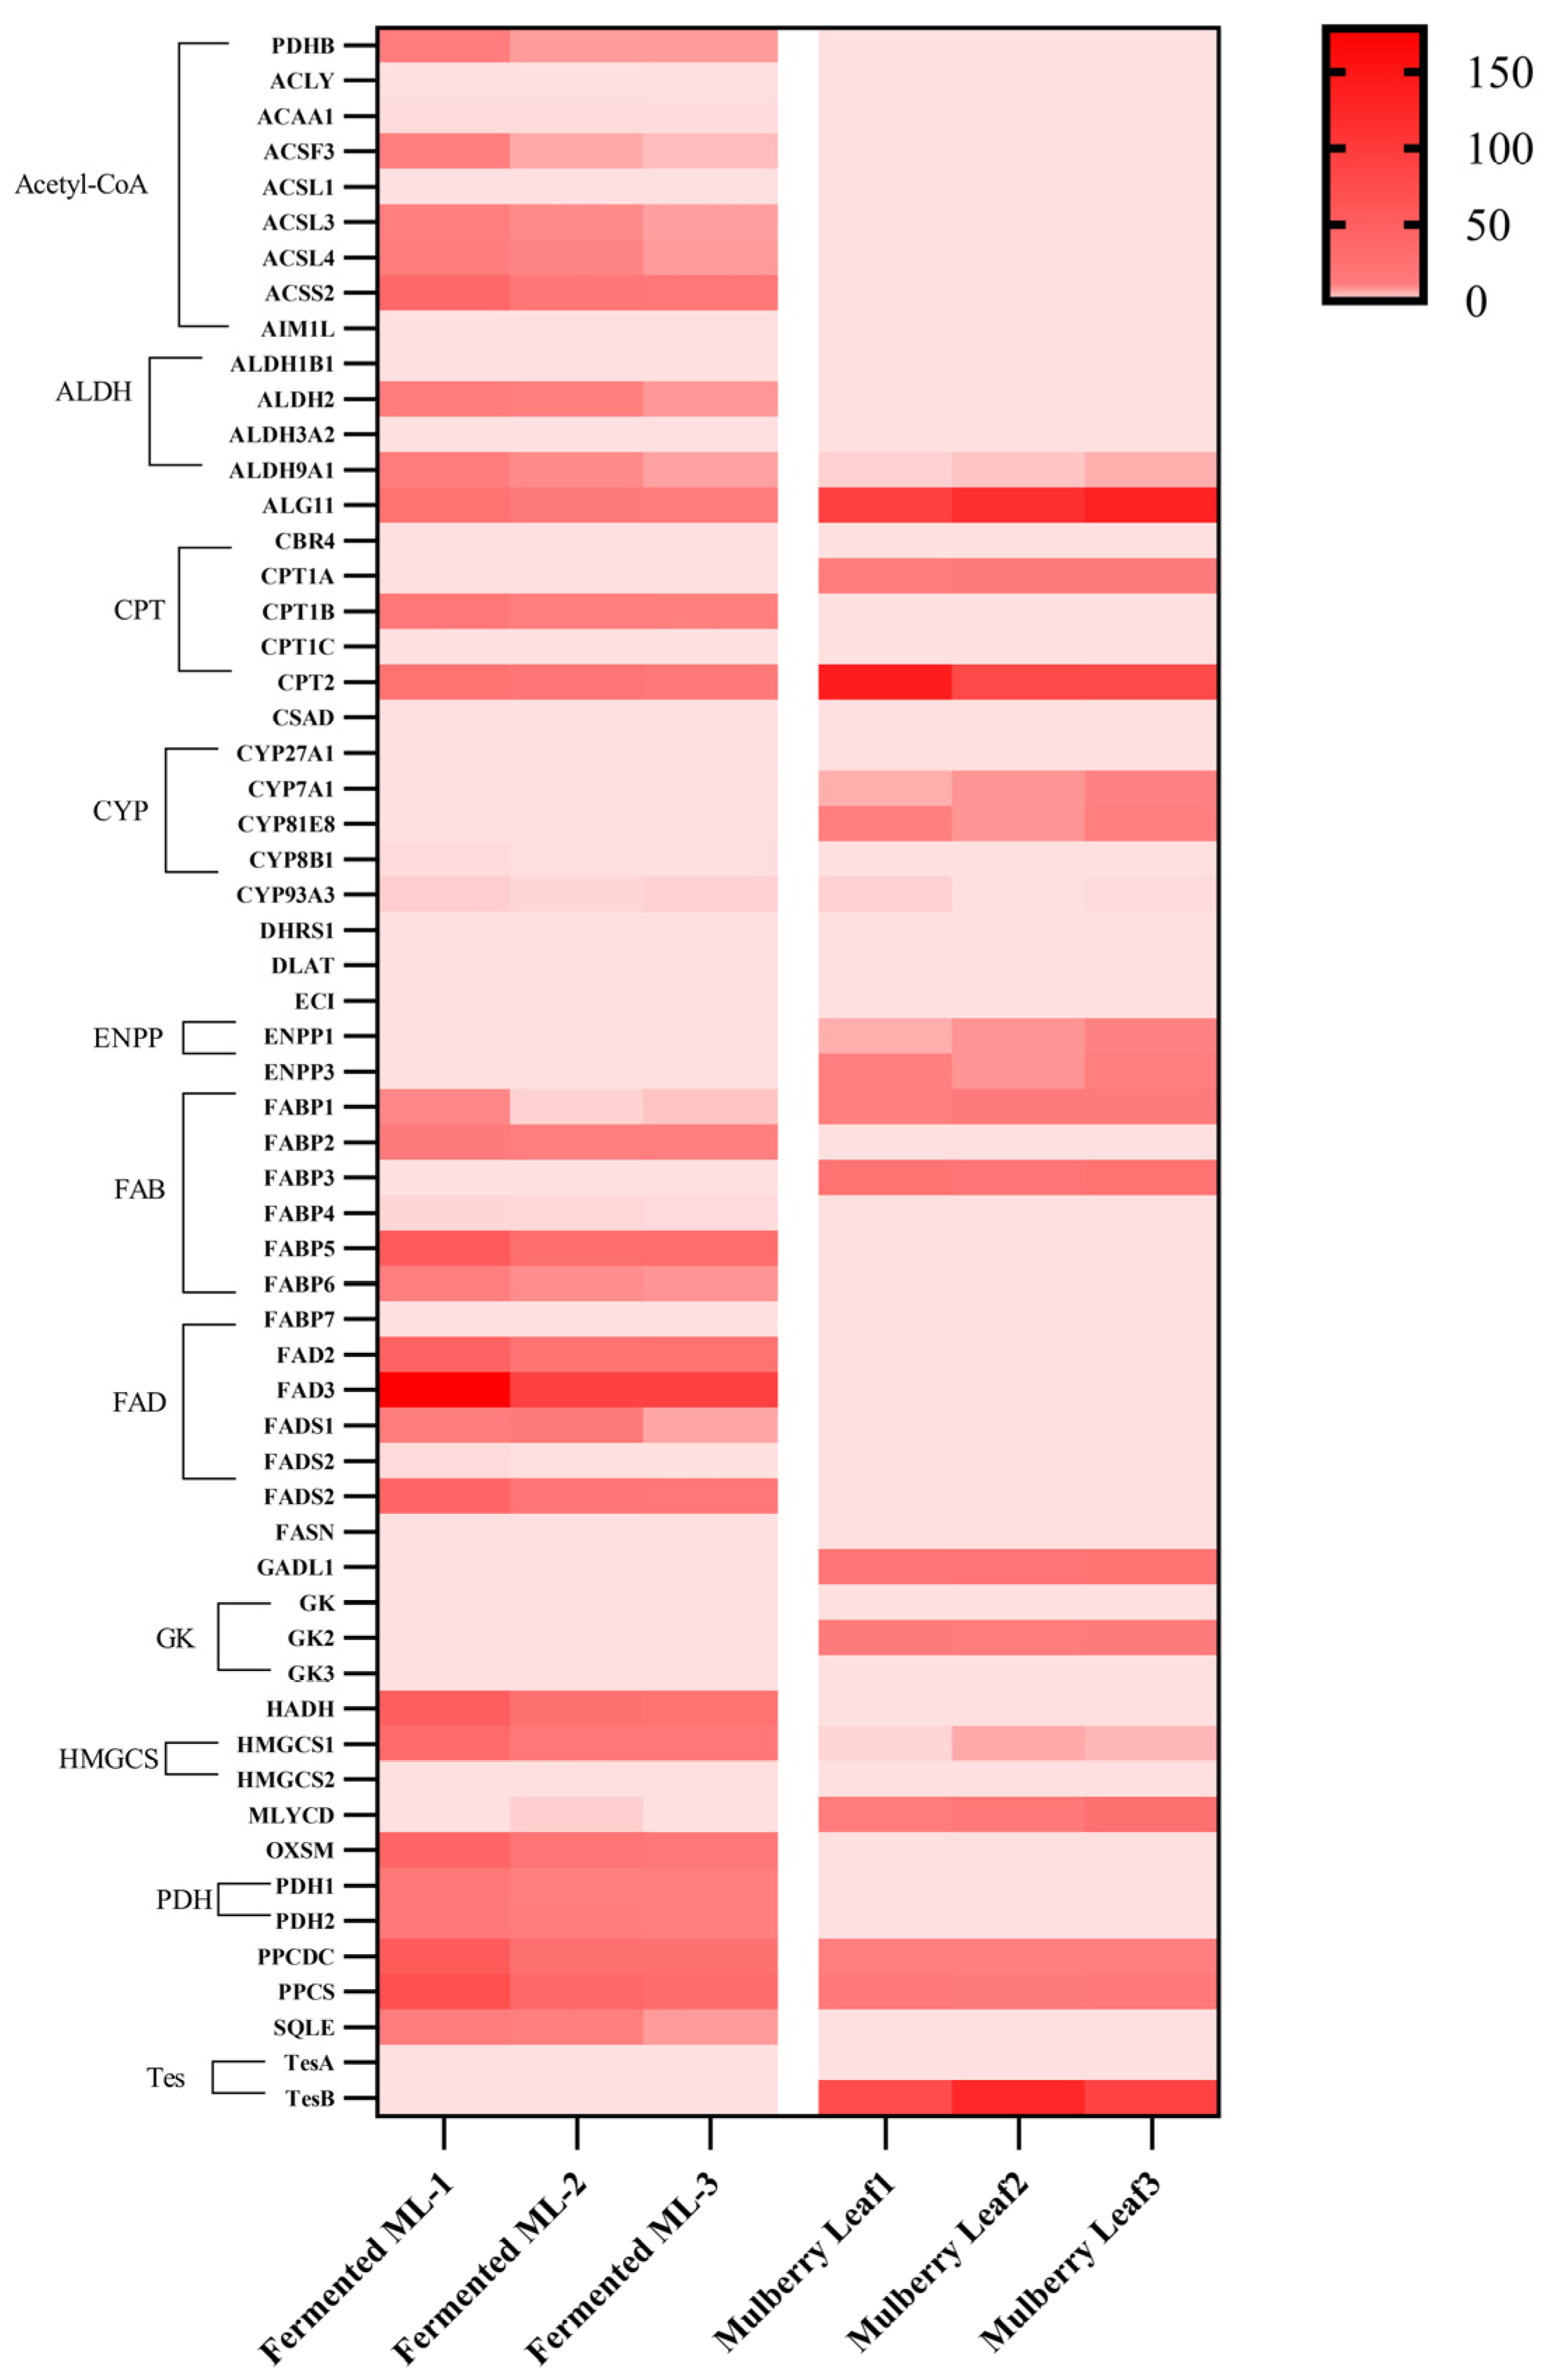
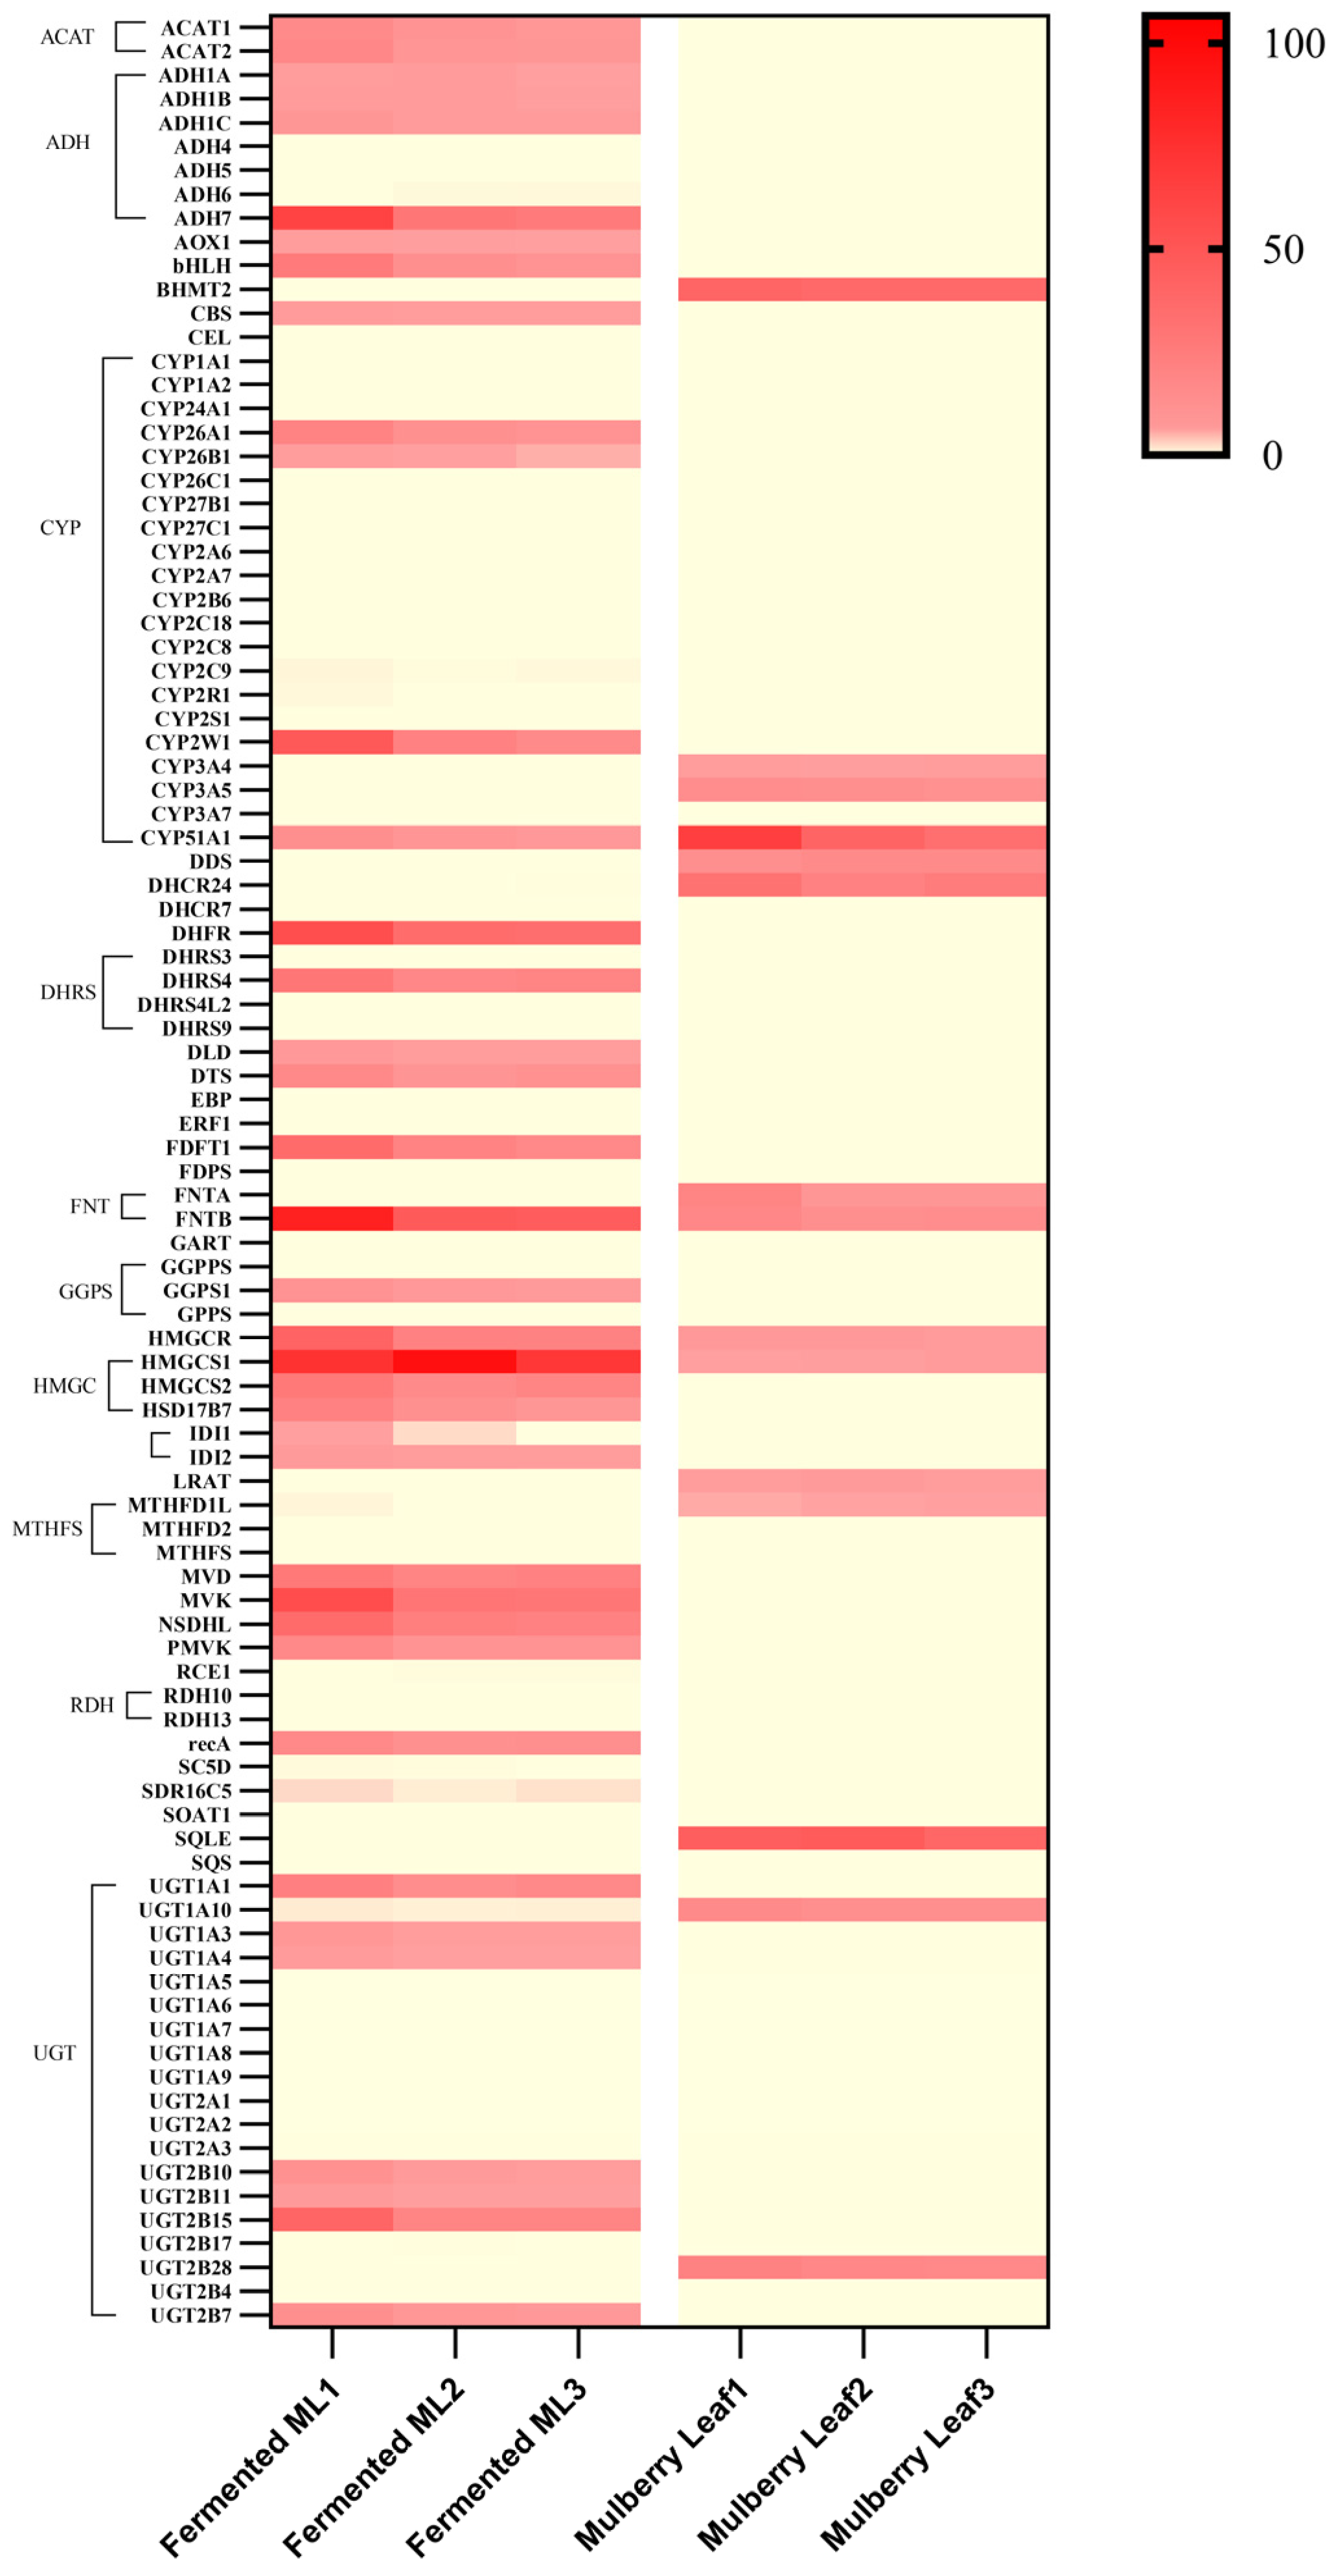
Figure 13 presents a putative fatty-acid-related pathway, and Figure 14 shows the corresponding transcript-abundance heatmap. Together, these figures are used for hypothesis generation rather than as direct evidence of de novo fatty acid synthesis during fermentation.
Figure 13.
Putative fatty-acid-related pathway annotated from differentially expressed transcripts in raw and fermented mulberry leaf sample matrices. The map depicts known reactions that may be relevant to fatty acid metabolism. It is not direct evidence of de novo fatty acid synthesis or enhanced pathway flux during fermentation. Enzyme abbreviations: FASN, fatty acid synthase; FAS, fatty acid synthase complex; FAB proteins, fatty acid biosynthesis enzymes; ACACA, acetyl-CoA carboxylase alpha. Gene color annotation: Genes highlighted in yellow represent significantly upregulated genes during fermentation.
Figure 14.
Heatmap showing transcript-abundance profiles of genes annotated to acetyl-CoA, fatty acid, and terpenoid metabolism in raw and L. rhamnosus-inoculated fermented mulberry leaf sample matrices. Rows represent individual annotated genes; columns correspond to biological replicates of fermented and raw samples. The color gradient indicates relative transcript abundance. Because the fermentation matrix contains plant material and microorganisms, the heatmap does not establish the cellular origin of transcripts or pathway activity.
Symbols in the pathway maps are defined as follows: circles denote metabolites, and yellow circles denote metabolites with significant differences between raw and fermented samples. Squares denote enzyme annotations, and yellow squares denote significantly different transcripts annotated to these enzymes. Solid purple lines represent putative connections in the annotation-based maps; dashed lines indicate indirect relationships. These symbols summarize associations in the mixed sample matrix and do not establish pathway activity, direction, or cellular origin.
Gene abbreviations: PDHB, pyruvate dehydrogenase E1 subunit beta; ACLY, ATP citrate lyase; ACAA1, acetyl-CoA acyltransferase 1; ACSF3, acyl-CoA synthetase family member 3; ACSLs, long-chain acyl-CoA synthetase family; ACSS2, acyl-CoA synthetase short-chain family member 2; AIM1L, melanoma deletion-like protein 1. These genes participate in acetyl-CoA metabolism and modulate acetyl-CoA production across multiple metabolic pathways. ALDHs, aldehyde dehydrogenases; ALG11, asparagine-linked glycosylation 11 homolog; CPTs, carnitine palmitoyltransferases; CYPs, cytochrome P450 family; DHRS1, dehydrogenase/reductase (SDR family) member 1; DLAT, dihydrolipoamide S-acetyltransferase; ECI, enoyl-CoA delta isomerase 1; FADs, fatty acid desaturases; FASN, fatty acid synthase; GADL1, glutamate decarboxylase-like 1; GKs, glucokinase family; HADH, hydroxyacyl-CoA dehydrogenase; HMGCSs, 3-hydroxy-3-methylglutaryl-CoA synthase family; MLYCD, malonyl-CoA decarboxylase; OXSM, mitochondrial 3-oxoacyl-ACP synthase; PDHs, pyruvate dehydrogenase complex; SQLE, squalene epoxidase; TESs, testin LIM domain protein gene family.
3.7. Putative Terpenoid-Related Pathways Inferred from Annotation
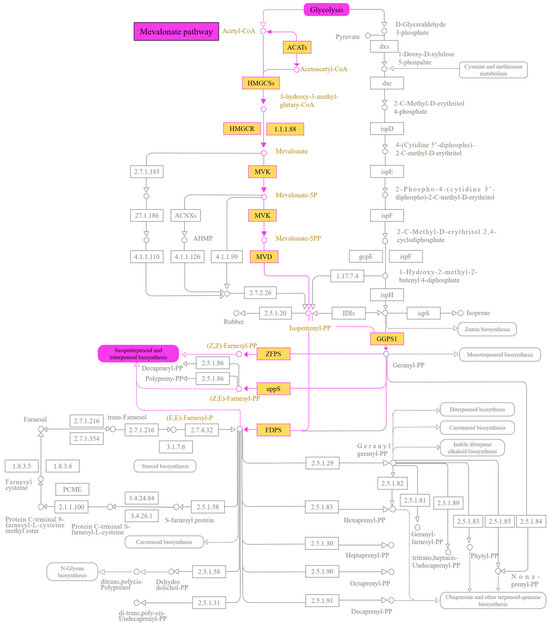
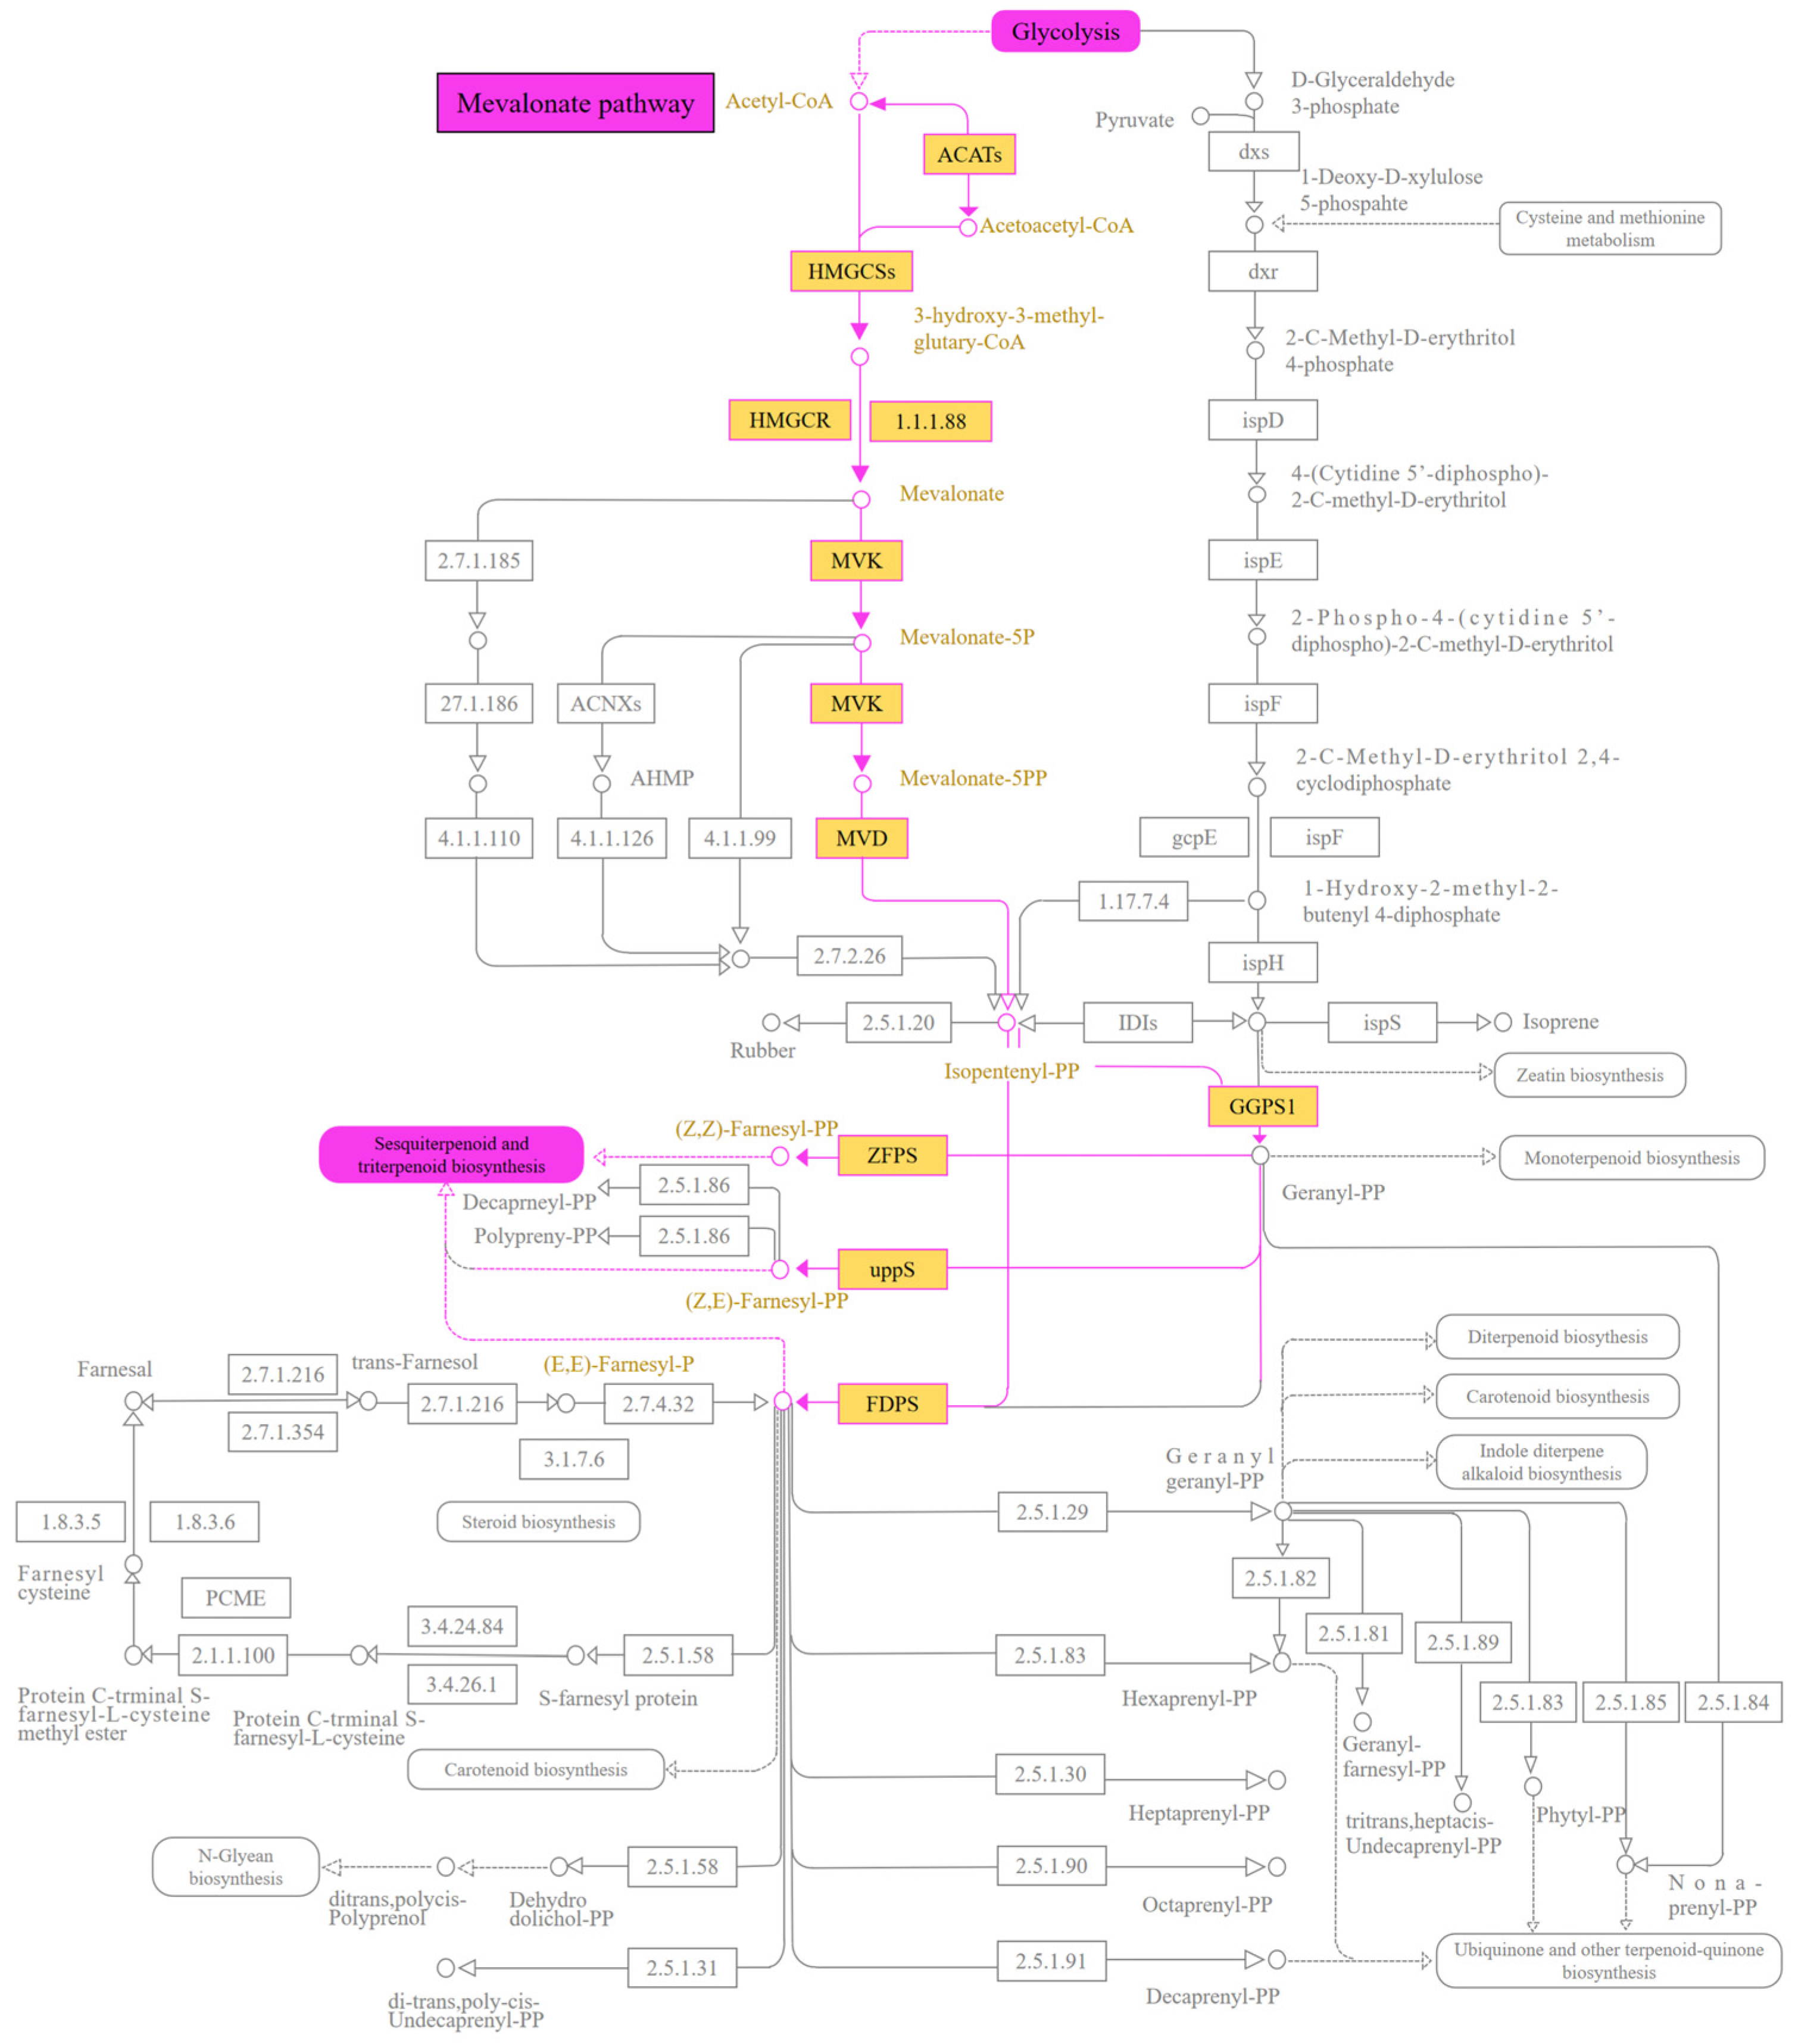
Figure 15 illustrates a putative terpenoid-backbone pathway inferred from pathway annotation of the mixed sample matrix. It summarizes known reactions connecting acetyl-CoA, the mevalonate pathway, isopentenyl diphosphate, and downstream terpenoid-related branches. The map is a mechanistic hypothesis and does not demonstrate flux through this pathway or de novo terpenoid biosynthesis during fermentation.
Figure 15.
Putative terpenoid-backbone pathway inferred from annotation of differentially expressed transcripts in raw and fermented mulberry leaf sample matrices. The pathway summarizes known reactions by which acetyl-CoA can be linked to isopentenyl diphosphate and diverse terpenoid classes. It does not establish pathway activity, metabolite flux, or cellular origin in the present samples. Enzyme abbreviations: ACATs, acyl-coenzyme A:cholesterol acyltransferase; HMGCR, 3-hydroxy-3-methylglutaryl-CoA reductase; HMGCSs, 3-hydroxy-3-methylglutaryl-CoA synthase family; MVD, mevalonate diphosphate decarboxylase; MVK, mevalonate kinase. Gene color annotation: Genes highlighted in yellow represent significantly upregulated genes during fermentation.
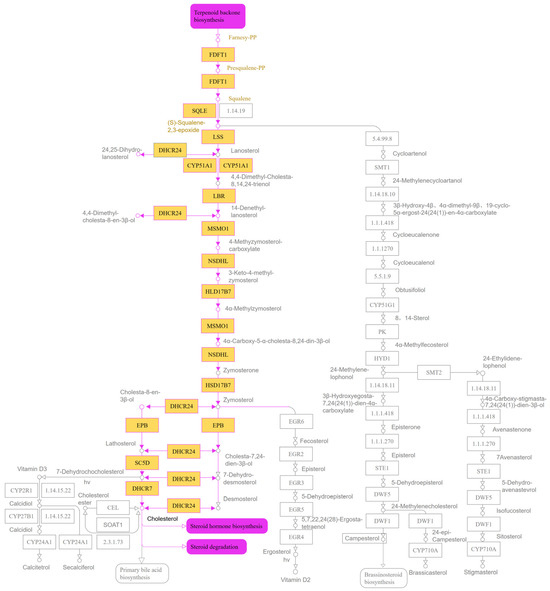
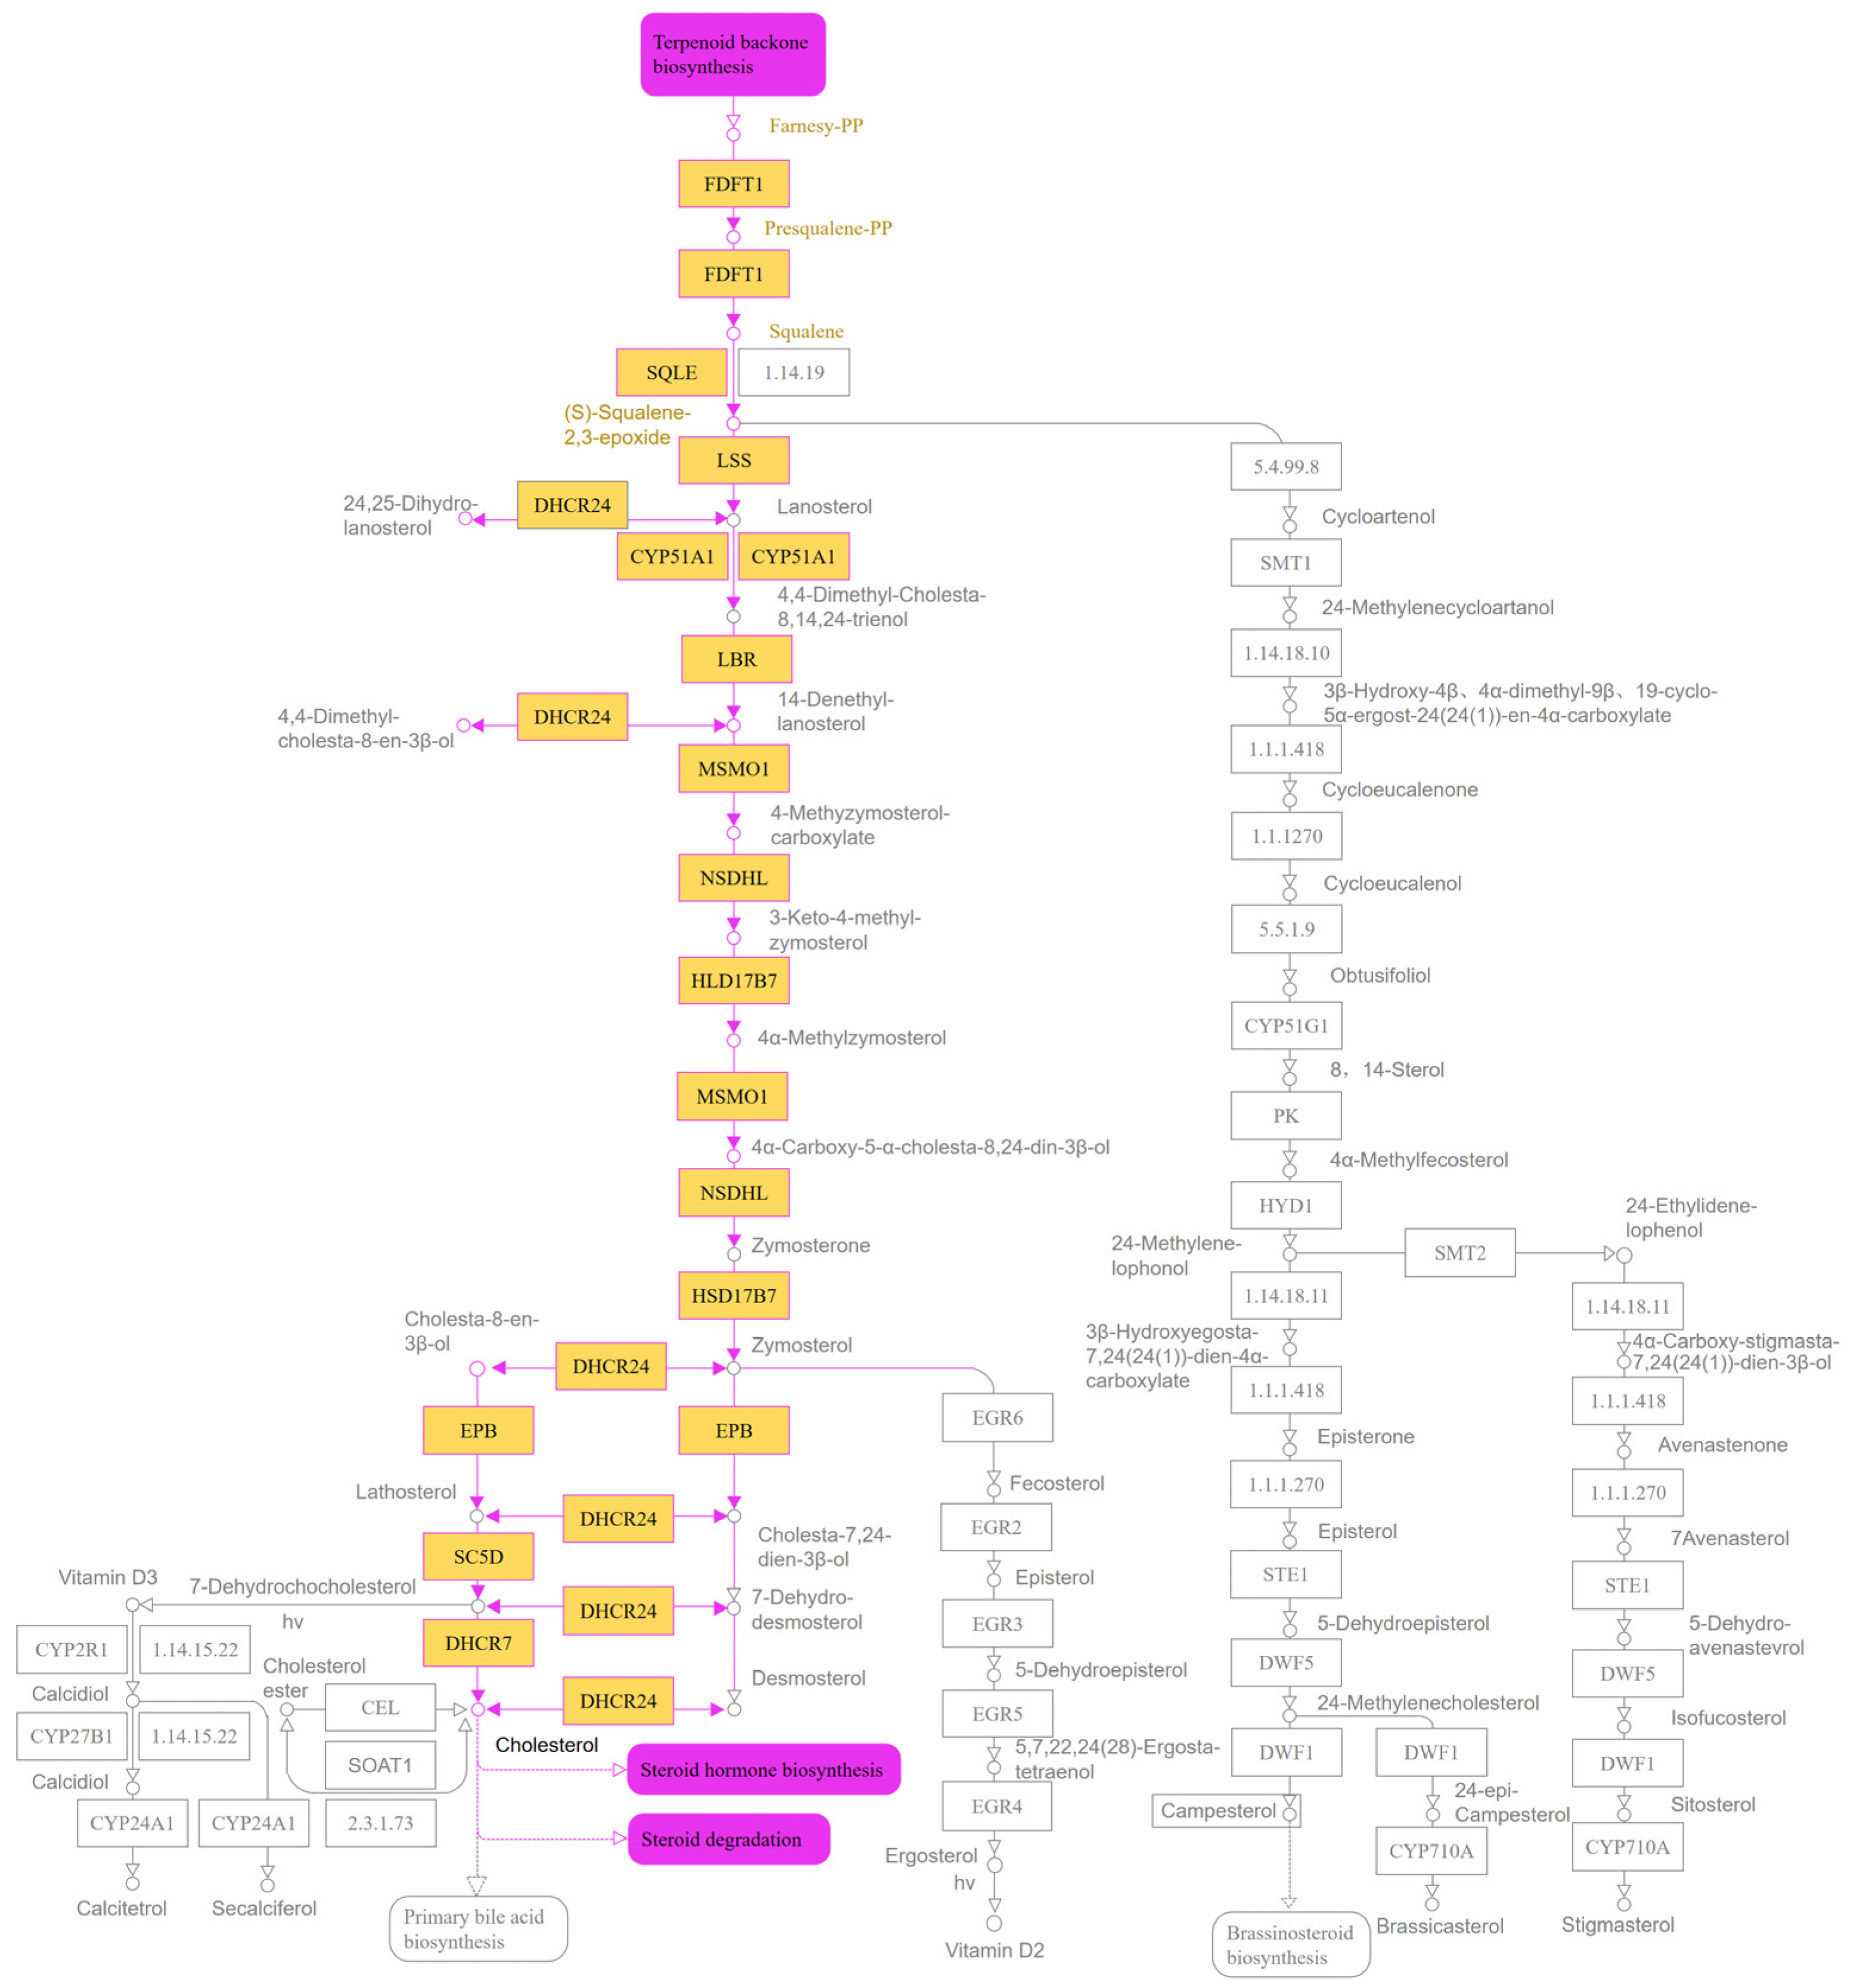
Figure 16 presents a putative steroid-related network inferred from pathway annotation. The figure is included to show a possible relationship between farnesyl diphosphate, squalene, lanosterol, and sterol metabolites; it is not evidence that this network was active in the present fermentation system.
Figure 16.
Putative steroid-related pathway inferred from annotation of differentially expressed transcripts in raw and fermented mulberry leaf sample matrices. The pathway illustrates known reactions linking farnesyl diphosphate, squalene, lanosterol, and sterol metabolites. It is presented as a hypothesis, not as direct evidence that the pathway was active during fermentation.
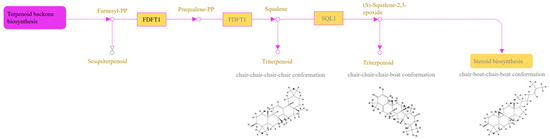
Figure 17 presents a putative sesquiterpenoid- and triterpenoid-related pathway inferred from pathway annotation. Farnesyl diphosphate and squalene are shown as candidate intermediates in known pathways. The present data do not establish that these reactions occurred or that the corresponding metabolites were synthesized de novo during fermentation.
Figure 17.
Putative sesquiterpenoid- and triterpenoid-related pathway inferred from annotation of differentially expressed transcripts in raw and fermented mulberry leaf sample matrices. The pathway illustrates known reactions involving farnesyl diphosphate and squalene. It does not establish de novo synthesis or a competing metabolic branch in the present system.
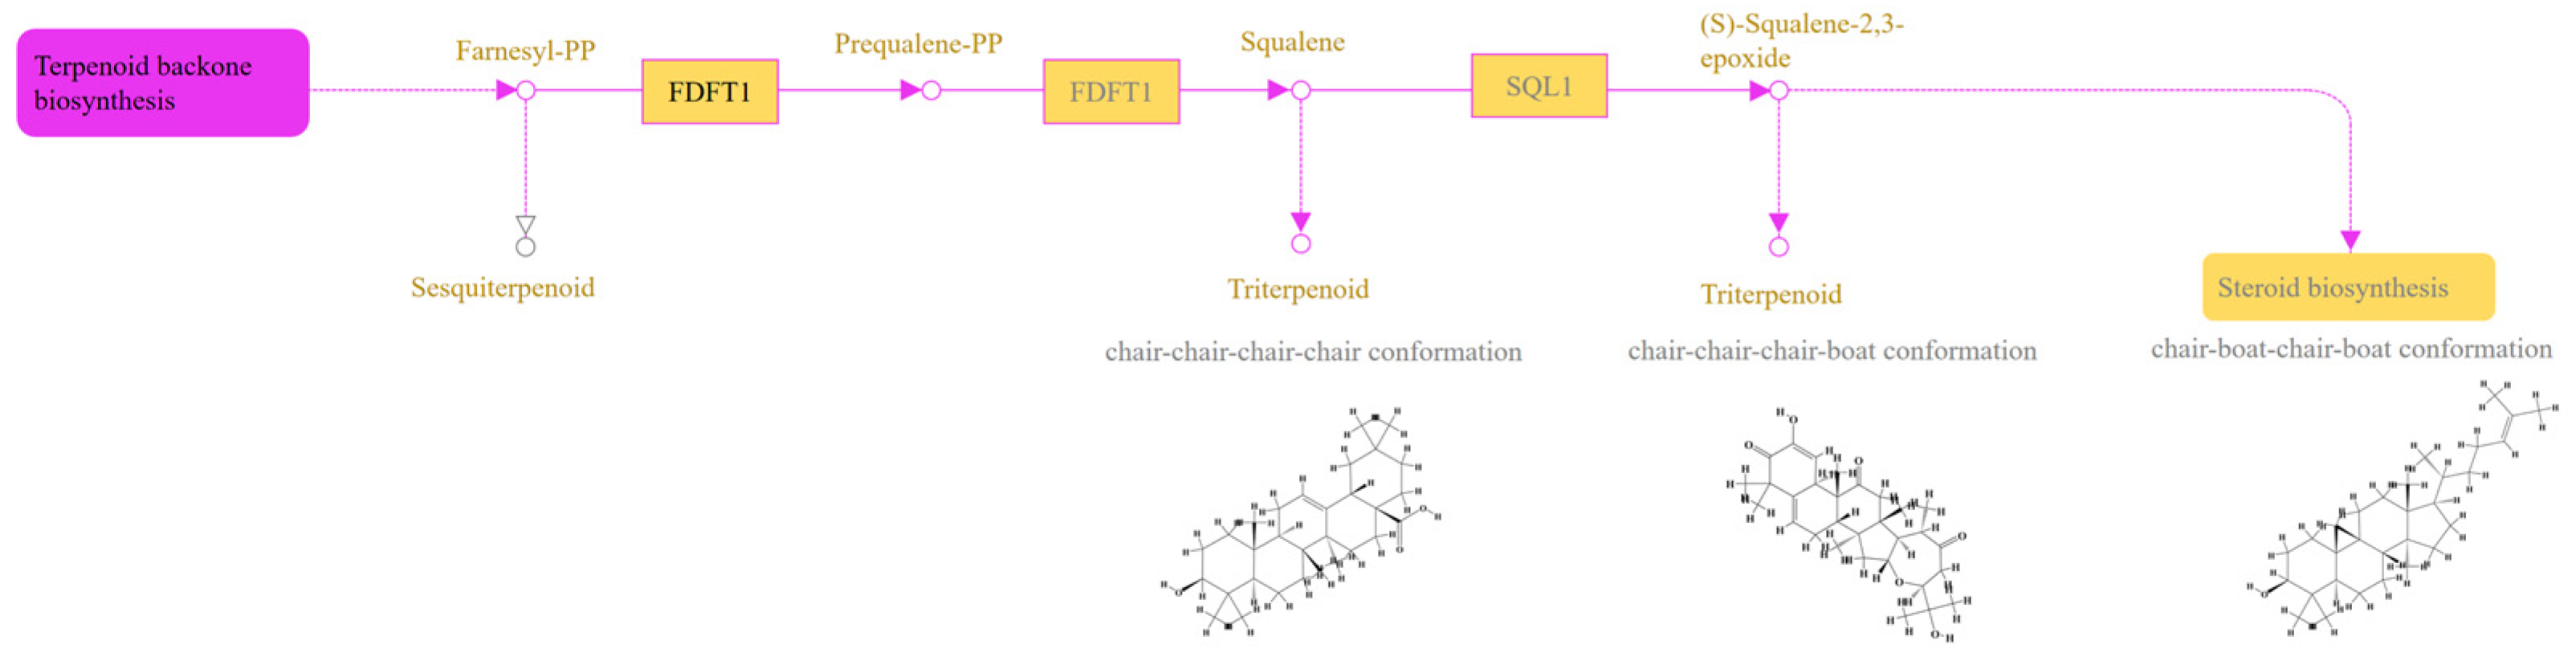
Figure 18 shows differences in the abundance of several transcripts annotated as HMGCS, HMGCR, MVD, GGPPS, and FDPS between the raw and fermented sample matrices. These differences support pathway-oriented hypotheses but cannot assign transcript origin to L. rhamnosus or mulberry cells and do not demonstrate enzyme activity.
Figure 18.
Heatmap showing transcript-abundance profiles of genes annotated to terpenoid- and steroid-related functions in raw and L. rhamnosus-inoculated fermented mulberry leaf sample matrices. Rows represent individual annotated genes; columns correspond to biological replicates of fermented and raw samples. The color gradient indicates relative transcript abundance. The mixed sample design does not permit assignment of transcript origin or confirmation of pathway activity.
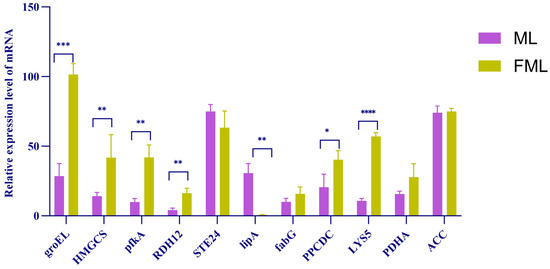
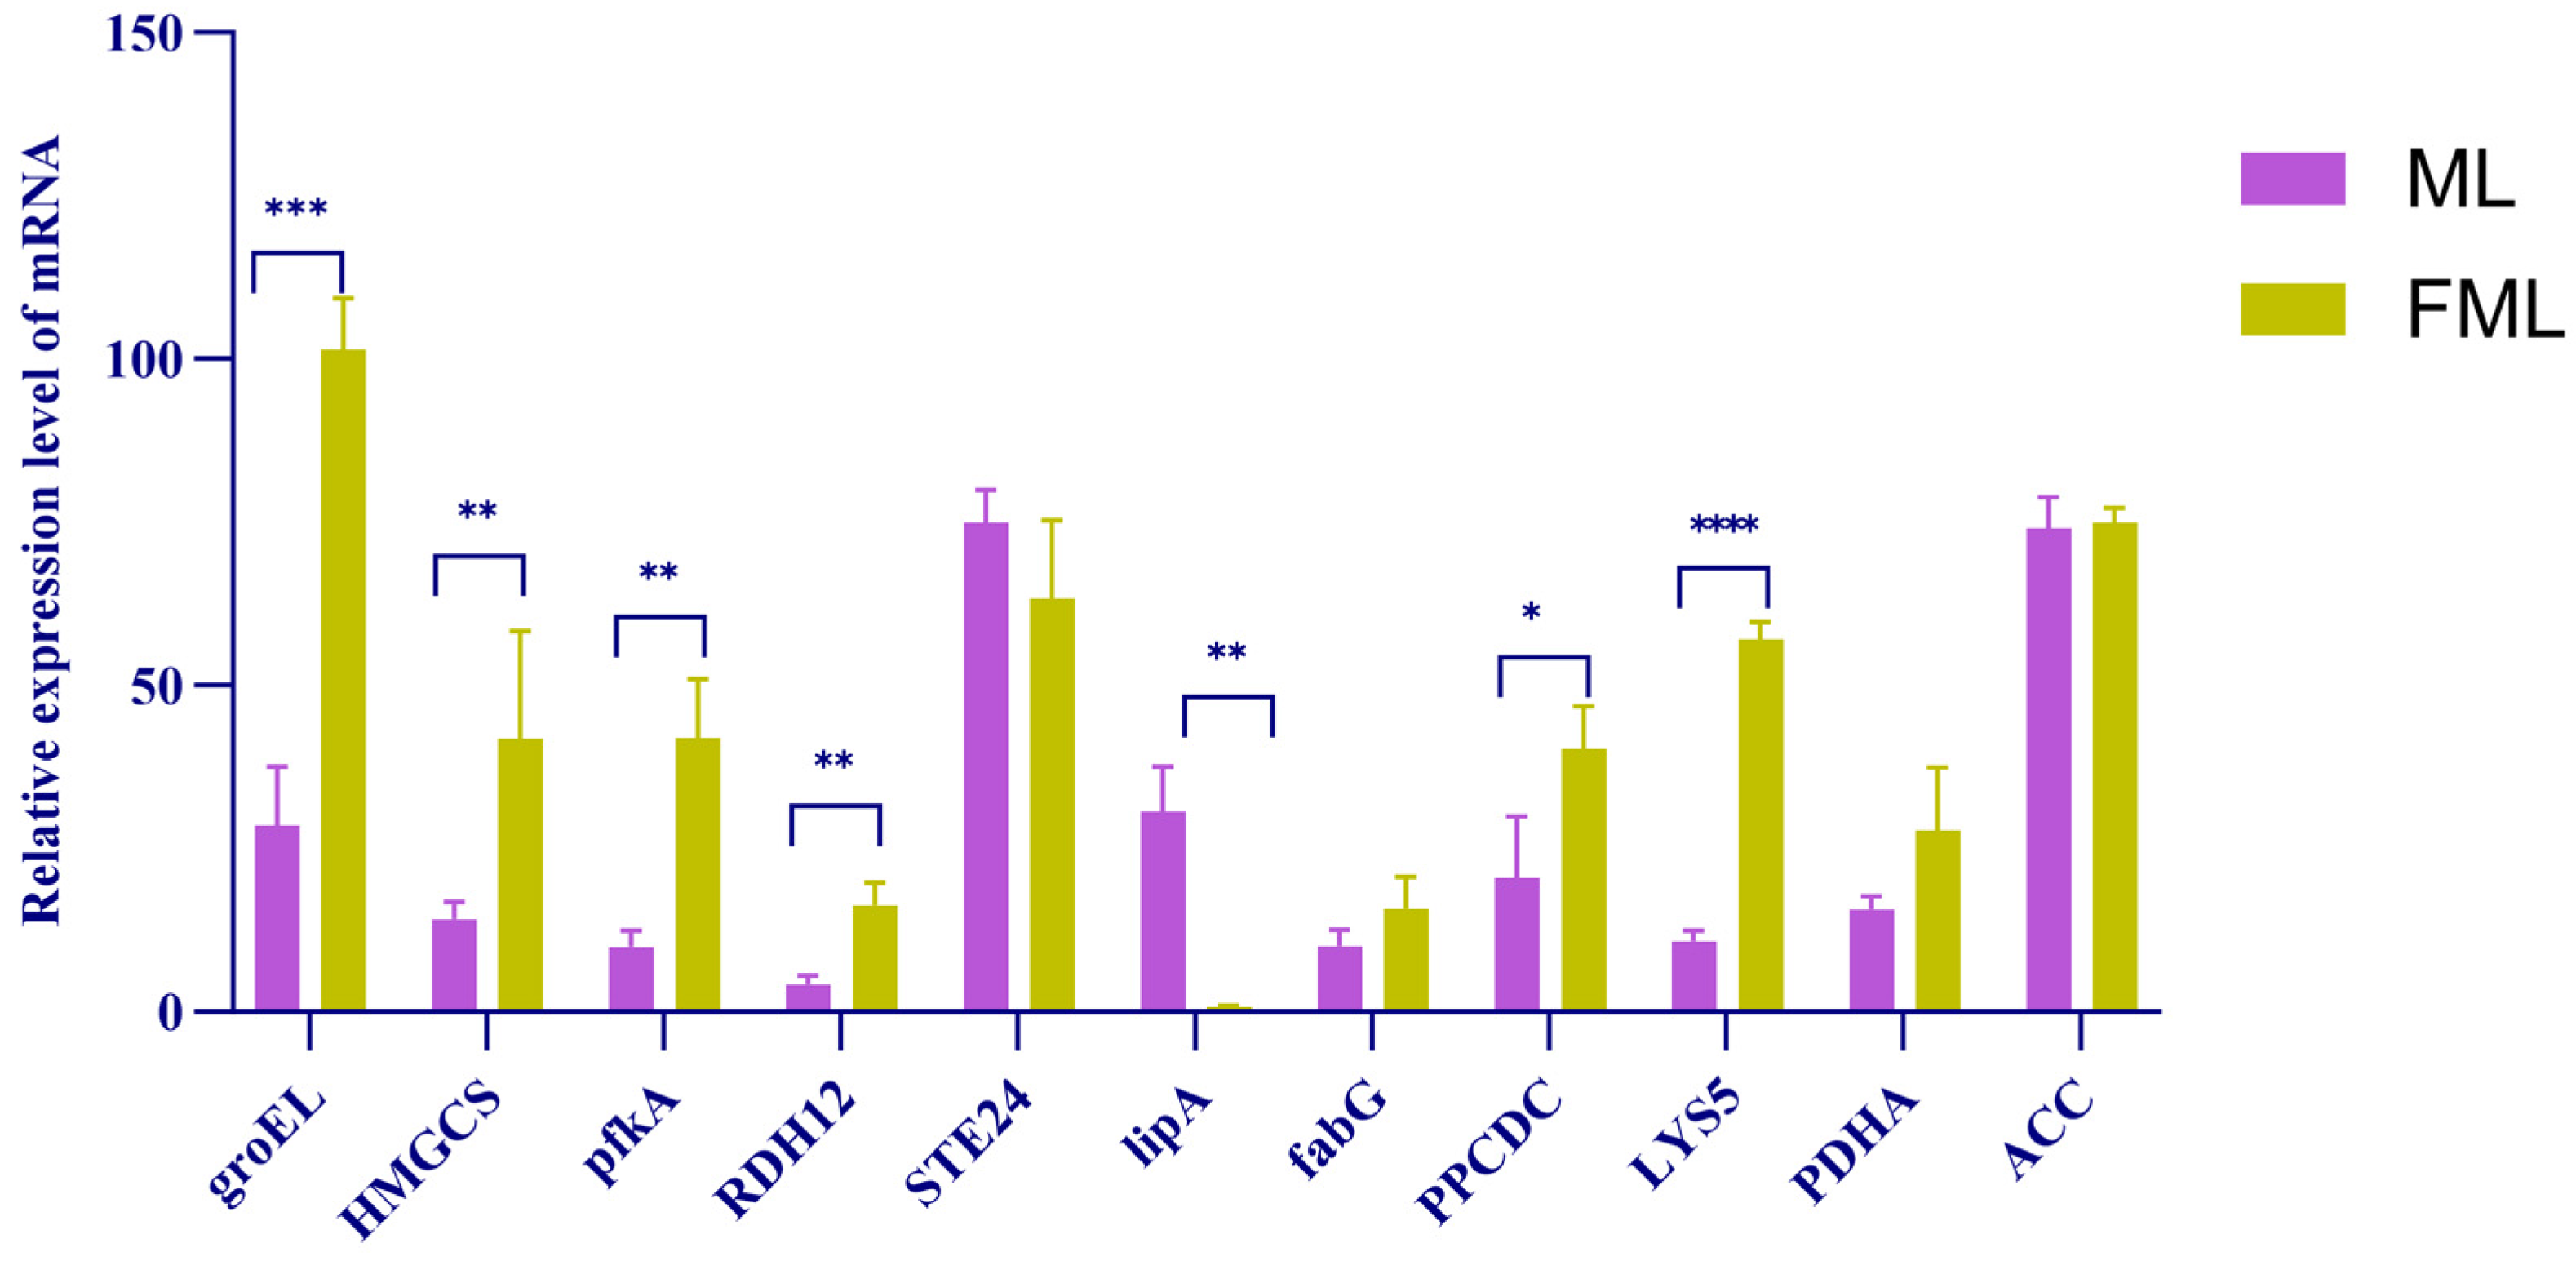
3.8. Real-Time PCR Electrophoresis Validation
To assess the consistency of selected transcriptomic measurements, specific primers were designed for eleven differentially expressed transcripts (Figure 19). PCR amplification followed by agarose gel electrophoresis yielded clear bands for RDH12, HMGCS, FabG, STE24, PDHA, PPCDC, groEL, and pfkA relative to the DNA size marker. Seven target sequences were successfully amplified under the tested conditions, and their band sizes were consistent with the predicted fragment lengths. These results support the detection of the selected transcripts in the sample matrices; they do not demonstrate de novo fatty acid or terpenoid biosynthesis, enzyme activity, or transcript origin.
Figure 19.
qRT-PCR measurement of selected transcripts annotated to fatty acid- and terpenoid-related pathways in raw mulberry leaf (ML) and L. rhamnosus-inoculated fermented mulberry leaf (FML) sample matrices, with three biological replicates per group. The y-axis represents relative mRNA abundance. Purple bars indicate ML, and yellow bars indicate FML. Error bars denote standard error. * p < 0.05, ** p < 0.01, *** p < 0.001, and **** p < 0.0001. These measurements support differential transcript abundance but do not establish pathway activity or cellular origin.
4. Discussion
4.1. Sensory Evaluation of Raw and Fermented Mulberry Leaf Tea
The morphological changes in mulberry leaves are mainly attributed to fermentation by Lacticaseibacillus rhamnosus using mulberry leaves as the substrate. This strain markedly degrades crude fiber in the leaves, which renders the leaf veins of fermented mulberry leaf tea less distinguishable [12]. Fermented mulberry leaf tea displays a bright yellow color, which is probably caused by chlorophyll degradation induced by thermal damage during the steaming process [16]. Additionally, flavonoids in fermented tea contribute to its yellowish-brown hue.
Raw mulberry leaf tea has an inherent bitter taste and intense grassy odor, whereas fermentation reshapes its chemical composition. After fermentation, fatty acids, flavonoids, and terpenoids become the predominant compounds in the tea. This metabolic shift yields a sour, aromatic flavor profile accompanied by sweet and mellow notes. Consequently, significant differences were observed between the two mulberry leaf tea groups in aroma (p < 0.01) and taste (p < 0.05), with fermented mulberry leaf tea exhibiting superior sensory performance in both attributes. Wang et al. reported that fatty acids act as critical flavor precursors; unsaturated fatty acids can be oxidized under specific conditions to generate volatile compounds, modulating the overall flavor profile [17]. Fu et al. revealed that terpenoids and flavonoids endow tea with characteristic pine and floral aromas. These metabolites act synergistically with polyphenols to modify astringency and bitterness, while aldehydes enhance the freshness and sweetness of the tea infusion [18]. These findings agree with our metabolomic results. Meanwhile, compounds including limonin, ginsenoside Rh4, and proanthocyanidin A1 detected in fermented mulberry leaf tea confer a slight bitter sensation and sweet-astringent aftertaste [19,20,21].
4.2. Metabolite Structural Characteristics and Associated Biological Functions
Among the annotated metabolites, flavonoid glycosides consist of flavonoid aglycones linked to sugar moieties via O-glycosidic bonds. Upon high-energy collision in mass spectrometry, sequential cleavage of glycosidic bonds takes place, resulting in the loss of sugar residues and the formation of high-intensity aglycone fragment ions. Representative examples include kaempferol-3-O-rutinoside, quercetin-3′-glucuronide, and apigenin 7-[rhamnosyl-(1 → 2)-galacturonide].
This category of metabolites comprises carboxylic lipid compounds. Most are oxidized long-chain fatty acids carrying hydroxyl and ketone functional groups; several species contain conjugated double bonds and are classified as lipid peroxidation derivatives, lacking aromatic conjugated chromophores. For instance, 7α,12α-dihydroxy-3-oxo-4-cholenoic acid adopts an α-configuration at the C-7 and C-12 positions, 13(S)-HOTrE has an S-configuration at carbon-13, and (S)-10,16-dihydroxyhexadecanoic acid presents an S-configuration at the C-10 position. These compounds exert biological functions in lipid metabolism and inflammatory responses [16].
Numerous terpenoid metabolites contain glycosidic moieties, such as steviolmonoside and asperulosidic acid, and these glycosylated structures generally endow the molecules with distinct bioactivities [17]. Certain terpenoids, including limonin, possess polycyclic skeletons. This structural characteristic underlies their versatile biological activities, such as antiviral and antitumor properties [18].
4.3. Interpretation of Transcriptomic Associations Related to Fatty Acid and Terpenoid Metabolism
Among the genes with significantly upregulated expression, several exert essential functions in fatty acid and terpenoid biosynthesis. For instance, phosphatidylglycerophosphate synthase (plsC) and groEL (GroEL protein) assist the correct folding of fatty acid synthases [22]. 6-phosphofructokinase A (pfkA), a rate-limiting enzyme in glycolysis, catalyzes the production of pyruvate, which can be further converted into acetyl-coenzyme A (acetyl-CoA) [23]. Thioredoxin reductase (trxB) sustains the intracellular reductive environment [24]. Geranylgeranyl pyrophosphate synthase (GGPS) catalyzes the transformation of farnesyl pyrophosphate (FPP) to geranylgeranyl pyrophosphate (GGPP), a pivotal reaction in diterpenoid and triterpenoid biosynthesis; diterpenoids and triterpenoids act as precursors for saponin formation [25]. 3-hydroxyisobutyrate dehydrogenase (HIBADH) is involved in branched-chain amino acid metabolism and may indirectly provide acetyl-CoA precursors for the mevalonate (MVA) pathway [26].
4.4. Interpretation of Fatty Acid-Related Pathway Annotations
GO and KEGG enrichment analyses of DEGs were used to identify fatty-acid-related pathway annotations associated with the raw and fermented sample matrices. Because RNA was recovered from a mixed plant-microbial matrix and no source-resolving controls were included, these analyses cannot demonstrate that a particular pathway was active in mulberry cells or in L. rhamnosus, nor can they establish metabolic flux or enhanced de novo synthesis.
The enrichment of fatty-acyl-CoA-related annotations identifies a possible biochemical context for the differential transcripts [27,28]. In established biochemical systems, carbohydrate metabolism, acetyl-CoA, CoA, and malonyl-CoA can contribute to fatty acid metabolism [29,30,31]. Here, this background is used only to frame candidate mechanisms. The enrichment results do not show that these reactions were active in mulberry tissue or in L. rhamnosus, or that they caused the observed metabolite differences.
Cellular-component annotations included smooth and rough endoplasmic reticulum, cytosol, and mitochondrial inner membrane. These annotations are compatible with known cellular locations of lipid-related reactions in reference organisms [32], but the present mixed-matrix data cannot localize reactions to a particular cell type or compartment during fermentation.
KEGG annotation identified transcripts assigned to fatty-acid-related functions, including reactions involving acetyl-CoA, malonyl-CoA, and CoA. These known biochemical relationships provide a framework for future testing [33,34]; the present enrichment analysis does not demonstrate fatty acid synthesis, homeostasis, or chain elongation in the fermented samples.
Collectively, these enrichment results identify carbohydrate metabolism, subcellular-compartment annotations, and fatty-acid-related enzyme annotations as candidate processes associated with the fermentation-associated metabolite profile. Their mechanistic roles require confirmation using controls and measurements that distinguish plant and microbial contributions.
4.5. Interpretation of Terpenoid-Related Pathway Annotations
GO and KEGG enrichment analyses revealed differential enrichment of annotations related to terpenoid metabolism, the mevalonate pathway, and carbohydrate metabolism. These annotations suggest candidate routes that may be relevant to the observed fermentation-associated metabolite differences, rather than demonstrating a defined terpenoid-biosynthetic mechanism.
The terpenoid-related annotations can be interpreted with reference to established biochemical relationships among glycolysis, acetyl-CoA, the mevalonate pathway, IPP, DMAPP, and prenyl-diphosphate intermediates [35,36,37,38]. In the present study, these relationships are offered as candidate explanatory pathways only. They do not establish that carbon was routed through these reactions in either component of the mixed fermentation matrix.
Annotations related to retinol dehydrogenase, oxoglutarate dehydrogenase, and cytochrome P450 point to additional known biochemical functions that may be relevant for future investigation [39,40,41]. Their detection or differential abundance does not demonstrate feedback regulation, oxidation, rearrangement, or other enzyme activity in the present samples.
Known compartmentalization and enzymatic roles in reference systems provide context for the terpenoid-related pathway maps [37,42,43]. Because the current design does not resolve plant and microbial transcript origins or measure enzyme activity, these reference functions should not be interpreted as evidence that the corresponding cellular processes occurred during the present fermentation.
The MVA pathway and related reactions provide a biologically plausible framework for interpreting the enriched annotations [36,37,44]. However, the present data do not establish that L. rhamnosus-mediated fermentation enhanced terpenoid biosynthesis through this pathway, because plant and microbial contributions, enzyme activity, and metabolite flux were not separately measured.
Taken together, the enrichment results provide hypotheses involving carbon metabolism, precursor conversion, and post-skeletal modification that can be tested in future source-resolving experiments.
4.6. Putative Links Between Fermentation-Associated Transcripts and Fatty Acid Metabolism
Further pathway interpretation based on DEG enrichment provides a conceptual map of reactions that could link glucose catabolism and fatty acid metabolism in the mixed fermentation matrix. This map is hypothesis-generating and is not evidence of a continuous metabolic cascade or de novo biosynthesis.
The pantothenate/CoA sequence shown in Figure 11 represents established biochemical reactions that can be considered when interpreting the annotation results [32,45]. The present study did not measure intermediate concentrations, enzyme activities, or reaction fluxes, and therefore does not demonstrate that this sequence operated in the fermentation matrix.
Similarly, the pyruvate-related reactions shown in Figure 12 are established biochemical relationships that provide a candidate framework for interpreting the detected annotations [46]. The data do not demonstrate conversion of glucose to acetyl-CoA, identify the responsible organism, or establish a causal link to fatty acid differences.
The fatty-acid-related map in Figure 13 summarizes known reactions involving acetyl-CoA, malonyl-CoA, fatty-acid synthases, and acyl-carrier intermediates [47,48]. It is retained as a hypothesis-generating reference map; no inference of de novo fatty acid synthesis, chain extension, or flux should be drawn from the present metabolomic and transcriptomic data alone.
In summary, the fermented sample matrix showed differential abundance of transcripts annotated to carbohydrate metabolism and fatty-acid-related pathways. These associations may be relevant to the observed sensory and metabolite differences, but they cannot establish the source, direction, or functional consequence of metabolic changes without appropriate controls and activity measurements.
4.7. Putative Terpenoid-Related Pathways and Steroid-Related Annotations
Consistent with the enrichment results, the mevalonate pathway constitutes a plausible reference framework for terpenoid-related annotations in the fermented sample matrix [37,49]. The reactions shown in Figure 15 are established biochemical reactions, but their occurrence, direction, and cellular location in the present system were not directly measured.
The pathway map also illustrates a possible relationship between terpenoid-related and steroid-related annotations at the squalene branch point [50,51]. This relationship should not be interpreted as evidence of metabolic competition or as a basis for targeted pathway modulation in the present fermentation system.
The maps in Figure 16 and Figure 17 summarize known reactions that may connect farnesyl diphosphate, squalene, sterol metabolites, and triterpenoid-related products [50,51]. They are included to guide future experiments, not to assert that these products were synthesized de novo during fermentation.
In summary, fatty-acid- and terpenoid-related annotations identify candidate biochemical processes associated with the fermentation treatment. The present study is limited to the L. rhamnosus-inoculated system investigated here and does not support generalization to the species as a whole.
5. Conclusions
In the present study, mulberry leaves were used as raw material and inoculated with a single Lacticaseibacillus rhamnosus strain to prepare fermented mulberry leaf tea with a golden hue, light fluffy texture, and sweet–sour taste. Although oolong tea and other conventional “fermented teas” are widely consumed, their manufacturing depends on endogenous enzyme-driven oxidation instead of microbial fermentation.
Most published studies on mulberry leaf fermentation use dried mulberry leaves as substrates; in those systems, extracellular enzymes secreted by microorganisms can modify mulberry leaf materials and product quality [52,53,54]. By contrast, the present work used fresh mulberry leaves inoculated with one L. rhamnosus strain. The fresh leaves were briefly rinsed with 100 °C hot water to reduce epiphytic microbes on the leaf surface. Although RNA was recovered from the samples, this does not demonstrate that plant cells remained viable or transcriptionally active after the treatment. Moreover, the experimental design did not include a sterile-substrate control, a microorganism-only control, or measurements that resolve plant and microbial contributions. Therefore, we cannot determine whether metabolite differences arose from plant biosynthesis, microbial metabolism, enzymatic biotransformation, release of pre-existing compounds, or a combination of these processes.
The experimental results demonstrate that mulberry leaves fermented in the present L. rhamnosus-inoculated system displayed distinct sensory and metabolomic profiles relative to raw mulberry leaves. The fermented samples contained a greater diversity of annotated fatty acids and terpenoids and showed differential transcript abundance for genes annotated to related pathways. These observations are consistent with fermentation-associated changes in the sample matrix. They do not establish enhanced de novo biosynthesis, altered metabolic flux, enzymatic activity, or the cellular origin of individual metabolites and transcripts.
The present study provides descriptive information on sensory, metabolomic, and transcriptomic differences associated with fermentation of mulberry leaves using the investigated L. rhamnosus strain. These results should not be generalized to all L. rhamnosus strains or to the species as a whole. Future work should include sterile-substrate, microbe-only, and viability/source-resolving controls, together with targeted metabolite and enzyme-activity measurements, to distinguish the mechanisms contributing to the observed differences.
Author Contributions
Conception, Methodology, Formal Analysis, Project Administration, Funding Acquisition, Software, and Writing—Original Draft, H.X.; Validation, Resource, Supervision, and Writing—Review & Editing, H.L.; Supervision, Visualization, Writing—Review & Editing, Z.X. All authors have read and agreed to the published version of the manuscript.
Funding
This work was supported by the Fundamental Research Funds for the Central Universities (No. JUSRP202504023), 2025 Anhui University Science and Engineering Teachers Enterprise Temporary Post Practice Program, and 2026 Action Project for the Cultivation of Young and Middle-Aged University Teachers.
Institutional Review Board Statement
Ethical review and approval were waived for this study because this study only carried out routine food sensory evaluation of tea infusions, without clinical intervention, biological sample collection or physiological‑related tests on human panelists. According to Article 32 of the Measures for the Ethical Review of Research Involving Human Beings in Life Sciences and Medicine (2023 Version) issued by the National Health Commission of China, this kind of routine food sensory evaluation does not fall within the scope requiring ethical review.
Informed Consent Statement
Informed consent was obtained from all subjects involved in the study.
Data Availability Statement
After publication, all raw data associated with this paper will be accessible to other researchers, together with detailed metadata for all existing datasets analysed in the manuscript.
Conflicts of Interest
The author declares no conflicts of interest.
Appendix A. Scent and Taste Descriptions of Raw and Fermented Mulberry Leaf Tea Samples
| No. | Appearance | Liquor Color | Aroma | Taste | Infused Leaf |
| ML-1 | The leaves are intact, deep green, with relatively uniform color and clear veins | Green, bright | Fresh fragrance, faint aroma, grassy scent, grassy odor | Astringent and then with a bitter aftertaste | Yellowish-green, leaves are fully expanded |
| ML-2 | The leaves are relatively intact, emerald green, with stems, and the veins are clearly visible | Greenish-blue, clear | Fresh fragrance, faint aroma, with a grassy smell | Astringent and bitter | Green, leaves are spread out |
| ML-3 | The leaves are broken, dark green, with distinct veins and attached to the stem | Greenish-brown, bright | The fragrance lasts for a long time and has a light grassy odor | Rich, bitter | The color is uniform, yellowish-green, and the leaves are spread out |
| ML-4 | The leaves are broken, yellowish-green, with distinct veins and a relatively uniform color | Green and clear | Fresh fragrance, faint aroma, with a hint of grassiness | Rich, bitter | Yellowish-green, uniform, leaves are spread out |
| ML-5 | The leaves are broken, dark green in color, with uneven shades, and the veins are clearly visible | Light green, bright | Fresh fragrance, grassy scent, grassy odor | Rich, bitter | Green, leaves are spread out |
| ML-6 | The leaves are relatively intact, greenish-brown in color, not evenly distributed, and the veins are clearly visible | Clear, bright, light green | Fresh fragrance, grassy odor | Rich, bitter | Yellowish-green, leaves are fully expanded |
| FML-1 | Yellow in color, light and airy, with uniform shade, thin leaves, and indistinct veins | Yellowish-brown, clear | Sour, sweet and lingering | Sour and sweet, with a delicious taste | Light yellow, bright |
| FML-2 | Bright yellow, light and airy, with thin leaves and indistinct veins, quite uniform in shape | Light yellow, bright | Sour and lasting fragrance | Sweet and sour; sweet and bitter | Bright yellow, relatively uniform |
| FML-3 | Golden yellow in color, relatively uniform in shape, thin leaves with unclear veins, light and airy | Yellowish-brown, bright | Rich and sour flavor | Sour; sweet and sour | Bright yellow, relatively uniform; yellow, uniform |
| FML-4 | Yellow color, fragmented leaves, thin leaves, unclear veins, light and airy | Orange-yellow, clear | Strong sour taste | Sweet and sour, delicate flavour | Bright yellow, relatively uniform; yellow, uniform yellowish-brown, with a few fragments |
| FML-5 | Yellowish-brown, with fragmented leaves, light and airy, thin leaves, uniform color | Yellowish-brown, clear | Sour and lasting fragrance | Sweet and sour, delicate flavour | Yellowish-brown, with fragmented leaves |
| FML-6 | Bright yellow, with broken leaves, light and airy, thin leaves, uniform color | Light yellow, relatively bright | Sweet and sour with a long-lasting flavor | Sweet and sour, with a hint of bitterness | Yellowish-brown, with fragmented leaves |
References
- Xu, W.; Lu, C.X.; Xiao, X.; Liu, K.L.; Mo, B.Q.; Li, A.H.; Chen, J.; Liang, G.Q. Research progress on bioactive substances and comprehensive utilization of mulberry leaf. J. Food Saf. Qual. 2024, 15, 219–228. [Google Scholar] [CrossRef]
- Liu, D.; Ding, Z.Z.; Hu, L.; Zhang, L.R.; Wang, J.; Liu, H.; Gao, X.L. Effect of fermented mulberry leaves replacing basic diet on growth performance, serum biochemical indexes, nutrient apparent digestibility, and meat quality of finishing pigs. Feed Res. 2023, 46, 17–22. [Google Scholar] [CrossRef]
- Huang, J.; Li, Y.; Yu, C.; Mo, R.; Zhu, Z.; Dong, Z.; Hu, X.; Deng, W. Metabolome and Transcriptome Integrated Analysis of Mulberry Leaves for Insight into the Formation of Bitter Taste. Genes 2023, 14, 1282. [Google Scholar] [CrossRef] [Scilit] [PubMed]
- Han, B.; Zhou, W.; Fan, R.; Zhang, S.; Ren, X.; Gong, H.; Tian, S.; Xu, Q.; Bian, M. The effects of exogenous GABA on the quality of processed mulberry leaf tea were investigated based on metabolomics. J. Agric. Food Res. 2025, 21, 101979. [Google Scholar] [CrossRef] [Scilit]
- Yu, G.Y. Analysis of the Application of Fermentation Technology in Modern Food Development and Innovation Trends. Chin. Food 2024, 22, 126–128. [Google Scholar]
- Duan, L.N.; Gao, Y.H.; Zi, S.P.; Zhang, D.; Chen, S.; Bao, G.; Lin, Q.; Cao, Z.; Xu, L. Optimization of solid-state fermentation process of mulberry leaf powder and its degradation effect on anti-nutritional factors. Chin. J. Anim. Nutr. 2026, 38, 3148–3160. [Google Scholar] [CrossRef]
- Liang, X.H.; Ge, S.T.; He, X.L.; Wang, W.Y.; Dong, L.N.; Wen, Y.Y.; Fan, M.L. Active components and hypoglycemic effect of mulberry leaf tea sequentially fermented by lactic acid bacteria and Saccharomyces cerevisiae. Acta Sericologica Sin. 2026, 52, 57–69. [Google Scholar] [CrossRef]
- Ye, Y.; Dong, J.X.; Yang, Q.M.; Gao, H.G.; Gao, L.L.; Han, B.X.; Liu, D.; Wang, W. Process optimization of compound oral liquid of polygonatum and cistanche fermented by Lactobacillus rhamnosus. Food Res. Dev. 2026, 47, 72–79. [Google Scholar] [CrossRef]
- Zhang, M.W.; Zhang, C.; Xie, X.D.; Liu, H.Y.; Fang, H.T.; Wei, X.B. Process optimization and quality analysis of jujube juice fermented by Lactobacillus rhamnosus. Food Res. Dev. 2026, 47, 122–133. [Google Scholar] [CrossRef]
- Li, L.Q.; Dong, H.H.; Pan, H.P.; Zang, Z.Z.; Zhu, W.F.; Guan, Y.M. Screening of fermentation strains and process optimization for medicinal and edible pueraria powder. J. Chin. Inst. Food Sci. Technol. 2026, 26, 271–282. [Google Scholar] [CrossRef]
- Xiu, H.D.; Liang, G.Y.; Chen, L. Analysis of Differences in Chemical Components of Fermented Mulberry Leaves with Different Strains of Lactic Acid Bacteria by Ultra-high Performance Liquid Chromatography-Quadrupole-Time of Flight-Mass Spectrometry. Food Sci. 2024, 45, 236–244. [Google Scholar] [CrossRef]
- Li, J.M.; Ding, X.W.; Zhang, L.X.; Ma, X.N. Metabolomic and transcriptomic studies on Aspergillus chinensis Fermented Fu Tea. Brew. China 2025, 44, 171–176. [Google Scholar] [CrossRef]
- Standard’s GB/T 23776-2018; Methodology for Sensory Evaluation of Tea. Standardization Administration of China: Beijing, China, 2018.
- Mouchbahani-Constance, S.; Sharif-Naeini, R. Proteomic and Transcriptomic Techniques to Decipher the Molecular Evolution of Venoms. Toxins 2021, 13, 154. [Google Scholar] [CrossRef] [Scilit] [PubMed]
- Dickinson, E.; Rusilowicz, M.J.; Dickinson, M.; Charlton, A.J.; Bechtold, U.; Mullineaux, P.M.; Wilson, J. Integrating transcriptomic techniques and k-means clustering in metabolomics to identify markers of abiotic and biotic stress in Medicago truncatula. Metabolomics 2018, 14, 126. [Google Scholar] [CrossRef] [Scilit] [PubMed]
- Aryal, P.; Syed, I.; Lee, J.; Patel, R.; Nelson, A.T.; Siegel, D.; Saghatelian, A.; Kahn, B.B. Distinct biological activities of isomers from several families of branched fatty acid esters of hydroxy fatty acids (FAHFAs). J. Lipid Res. 2021, 62, 100108. [Google Scholar] [CrossRef] [Scilit] [PubMed]
- Kurze, E.; Wüst, M.; Liao, J.; McGraphery, K.; Hoffmann, T.; Song, C.; Schwab, W. Structure–function relationship of terpenoid glycosyltransferases from plants. Nat. Product. Rep. 2022, 39, 389–409. [Google Scholar] [CrossRef] [Scilit] [PubMed]
- Wang, S.; Han, X.; Yang, Y.; Chen, R.; Guo, Z.; Zhu, Q.; Xu, Y. A practical synthesis of amino limonin/deoxylimonin derivatives as effective mitigators against inflammation and nociception. RSC Med. Chem. 2020, 11, 843–847. [Google Scholar] [CrossRef] [Scilit] [PubMed]
- Zhang, J.W.; Lu, Y.; Wang, L.L.; Zhang, J.; Liu, H.; Chen, Y. Sensory Evaluation and Physicochemical Component Analysis of Zunyi Black Tea. Anal. Test. 2025, 1, 216–219+224. [Google Scholar] [CrossRef]
- Wang, Y.; Liu, J.Q.; Han, L.J.; Hou, S.Z.; Gui, L.S.; Yuan, Z.Z.; Sun, S.N.; Yang, B.C. Effects of different rumen-protected amino acids on fatty acids composition and flavor substances in subcutaneous and tail fat of Tibetan sheep. Feed Res. 2025, 48, 11–21. [Google Scholar] [CrossRef]
- Fu, Y.M.; Zou, Y.Q.; Tian, X. Flavor Characterization and Bioactive Compound Analysis of Cyclocarya paliurus Tea from Different Origins Using E-Tongue Combined with HS-SPME-GC-MS. Food Ind. Technol. 2025, 47, 336–380. [Google Scholar] [CrossRef]
- Sigler, P.B.; Xu, Z.; Rye, H.S.; Burston, S.G.; Fenton, W.A.; Horwich, A.L. Structure and function in GroEL-mediated protein folding. Annu. Rev. Biochem. 1998, 67, 581–608. [Google Scholar] [CrossRef] [Scilit] [PubMed]
- Li, Y.; Xian, H.; Xu, Y.; Zhu, Y.; Sun, Z.; Wang, Q.; Qi, Q. Fine tuning the glycolytic flux ratio of EP-bifido pathway for mevalonate production by enhancing glucose-6-phosphate dehydrogenase (Zwf) and CRISPRi suppressing 6-phosphofructose kinase (PfkA) in Escherichia coli. Microb. Cell Fact. 2021, 20, 32. [Google Scholar] [CrossRef] [Scilit] [PubMed]
- Russel, M.; Model, P. Direct cloning of the trxB gene that encodes thioredoxin reductase. J. Bacteriol. 1985, 163, 238–242. [Google Scholar] [CrossRef] [Scilit] [PubMed]
- Feng, W.; Mehari, T.G.; Fang, H.; Ji, M.; Qu, Z.; Jia, M.; Wang, D.; Ditta, A.; Khan, M.K.R.; Cao, Y.; et al. Genome-wide identification of the geranylgeranyl pyrophosphate synthase (GGPS) gene family involved in chlorophyll synthesis in cotton. BMC Genom. 2023, 24, 176. [Google Scholar] [CrossRef] [Scilit] [PubMed]
- Huang, J.; Yu, Y.; Pang, D.; Li, C.; Wei, Q.; Cheng, Y.; Cui, Y.; Ou, R.; Shang, H. Lnc-HIBADH-4 regulates autophagy-lysosome pathway in amyotrophic lateral sclerosis by targeting Cathepsin D. Mol. Neurobiol. 2024, 61, 4768–4782. [Google Scholar] [CrossRef] [Scilit] [PubMed]
- Xiu, H.D.; Guo, X.X.; Liang, G.Y. Research on potential pharmacodynamic components and mechanism of Folium mori in clearing lung-heat and moistening dryness based on UPLC-Q-TOF-MS/MS combined with network pharmacology and molecular docking. J. Qiqihar Med. Univ. 2024, 45, 1208–1215. [Google Scholar] [CrossRef]
- Ikeda, M.; Takahashi, K.; Ohtake, T.; Imoto, R.; Kawakami, H.; Hayashi, M.; Takeno, S. A futile metabolic cycle of fatty acyl coenzyme A (acyl-CoA) hydrolysis and resynthesis in Corynebacterium glutamicum and its disruption leading to fatty acid production. Appl. Environ. Microbiol. 2021, 87, 24–69. [Google Scholar] [CrossRef] [Scilit] [PubMed]
- TeSlaa, T.; Ralser, M.; Fan, J.; Rabinowitz, J.D. The pentose phosphate pathway in health and disease. Nat. Metab. 2023, 5, 1275–1289. [Google Scholar] [CrossRef] [Scilit] [PubMed]
- Patra, K.C.; Hay, N. The pentose phosphate pathway and cancer. Trends Biochem. Sci. 2014, 39, 347–354. [Google Scholar] [CrossRef] [Scilit] [PubMed]
- Nelson, D.L.; Cox, M.M. Lehninger Principles of Biochemistry, 8th ed.; W.H. Freeman: New York, NY, USA, 2021. [Google Scholar]
- Wellen, K.E.; Hatzivassiliou, G.; Sachdeva, U.M.; Bui, T.V.; Cross, J.R.; Thompson, C.B. ATP-citrate lyase links cellular metabolism to histone acetylation. Science 2009, 324, 1076–1080. [Google Scholar] [CrossRef] [Scilit] [PubMed]
- Tong, L. Structure and function of biotin-dependent carboxylases. Cell. Mol. Life Sci. 2013, 70, 863–891. [Google Scholar] [CrossRef] [Scilit] [PubMed]
- Rock, C.O.; Calder, R.B.; Karim, M.A.; Jackowski, S. Pantothenate Kinase Regulation of the Intracellular Concentration of Coenzyme A. J. Biol. Chem. 2000, 275, 1377–1383. [Google Scholar] [CrossRef] [Scilit] [PubMed]
- Saadat, N.P.; van Aalst, M.; Brand, A.; Ebenhöh, O.; Tissier, A.; Matuszyńska, A.B. Shifts in carbon partitioning by photosynthetic activity increase terpenoid synthesis in glandular trichomes. Plant J. 2023, 115, 1716–1728. [Google Scholar] [CrossRef] [Scilit] [PubMed]
- Pathak, G.; Dudhagi, S.S.; Raizada, S.; Singh, R.K.; Sane, A.; Sane, V.A. Phosphomevalonate kinase regulates the MVA/MEP pathway in mango during ripening. Plant Physiol. Biochem. 2023, 196, 174–185. [Google Scholar] [CrossRef] [Scilit] [PubMed]
- Drummond, L.; Haque, P.J.; Gu, B.; Jung, J.S.; Schewe, H.; Dickschat, J.S.; Buchhaupt, M. High Versatility of IPP and DMAPP Methyltransferases Enables Synthesis of C6, C7 and C8 Terpenoid Building Blocks. ChemBioChem 2022, 23, 145–160. [Google Scholar] [CrossRef] [Scilit] [PubMed]
- Sharkey, T.D. Pentose Phosphate Pathway Reactions in Photosynthesizing Cells. Cells 2021, 10, 1547. [Google Scholar] [CrossRef] [Scilit] [PubMed]
- Sahu, B.; Maeda, A. Retinol Dehydrogenases Regulate Vitamin A Metabolism for Visual Function. Nutrients 2016, 8, 746. [Google Scholar] [CrossRef] [Scilit] [PubMed]
- Grice, G.L.; Minogue, E.; Coates, H.W.; Debela, M.; Kaneider-Kaser, N.; Antrobus, P.R.; Johnson, R.S.; Nathan, J.A. ABHD11 mediated deglutarylation regulates the TCA cycle and T cell metabolism. bioRxiv 2024, 5, 1–23. [Google Scholar] [CrossRef] [Scilit]
- Zhang, Y.; Ma, L.; Su, P.; Huang, L.; Gao, W. Cytochrome P450s in plant terpenoid biosythesis: Discovery, characterization and metabolic engineering. Crit. Rev. Biotechnol. 2023, 43, 1–21. [Google Scholar] [CrossRef] [Scilit] [PubMed]
- Rudolf, J.D.; Chang, C.Y. Terpene synthases in disguise: Enzymology, structure, and opportunities of non-canonical terpene synthases. Nat. Product. Rep. 2020, 37, 425–463. [Google Scholar] [CrossRef] [Scilit] [PubMed]
- Jin, K.; Xia, H.; Liu, Y.; Li, J.; Du, G.; Lv, X.; Liu, L. Compartmentalization and transporter engineering strategies for terpenoid synthesis. Microb. Cell Fact. 2022, 21, 92. [Google Scholar] [CrossRef] [Scilit] [PubMed]
- Berg, J.M.; Tymoczko, J.L.; Gatto, G.J.; Stryer, L. Lehninger Principles of Biochemistry, 8th ed.; Chapter 17: “Lipid Metabolism”; W.H. Freeman: New York, NY, USA, 2025; pp. 601–650. [Google Scholar]
- Murarka, A.; Clomburg, J.M.; Moran, S.; Shanks, J.V.; Gonzalez, R. Metabolic Analysis of Wild-type Escherichia coli and a Pyruvate DehydrogenaseComplex(PDHC)-deficient Derivative Reveals the Role of PDHCintheFermentative Metabolism of Glucose. Cell Metab. 2010, 285, 32548. [Google Scholar] [CrossRef] [Scilit] [PubMed]
- He, M.; Qin, C.X.; Wang, X.; Ding, N.-Z. Plant unsaturated fatty acids: Biosynthesis and regulation. Front. Plant Sci. 2020, 11, 390. [Google Scholar] [CrossRef] [Scilit] [PubMed]
- Razeq, F.M.; Kosma, D.K.; França, D.; Rowland, O.; Molina, I. Extracellular lipids of Camelina sativa: Characterization of cutin and suberin reveals typical polyester monomers and unusual dicarboxylic fatty acids. Phytochemistry 2021, 184, 112665. [Google Scholar] [CrossRef] [Scilit] [PubMed]
- Wiley, C.D.; Sharma, R.; Davis, S.S.; Lopez-Dominguez, J.A.; Mitchell, K.P.; Wiley, S.; Alimirah, F.; Kim, D.E.; Payne, T.; Rosko, A.; et al. Oxylipin biosynthesis reinforces cellular senescence and allows detection of senolysis. Cell Metab. 2021, 33, 1124–1136. [Google Scholar] [CrossRef] [Scilit] [PubMed]
- Geisler, K.; Jensen, N.B.; Yuen, M.M.S.; Madilao, L.; Bohlmann, J. Modularity of conifer diterpene resin acid biosynthesis: P450 enzymes of different CYP720B clades use alternative substrates and converge on the same products. Plant Physiol. 2016, 171, 152–164. [Google Scholar] [CrossRef] [Scilit] [PubMed]
- Lu, Y.; Luo, Y.; Zhou, J.; Hu, T.; Tu, L.; Tong, Y.; Su, P.; Liu, Y.; Wang, J.; Jiang, Z.; et al. Probing the functions of friedelane-type triterpene cyclases from four celastrol-producing plants. Plant J. 2022, 109, 555–567. [Google Scholar] [CrossRef] [Scilit] [PubMed]
- Ji, Q.; Liu, Y.; Chen, C.; Zhang, H.; Wang, J.; Mei, K. Expression, purification, characterization and crystallization of Panax quinquefolius ginsenoside glycosyltransferase Pq3-O-UGT2. Protein Expr. Purif. 2024, 216, 106430. [Google Scholar] [CrossRef] [Scilit] [PubMed]
- Liang, X.; He, X.; Wang, M.; Ge, S.; Wen, Y.; Jiang, Y.; Le, S.; Dong, L.; Lin, J. Effects of multi-strain co-fermentation on flavor quality and bioactive components of mulberry leaf tea. Food Ferment. Ind. 2026, 52, 222–229. [Google Scholar] [CrossRef]
- Wang, P. Preparation and Quality Analysis of Monascus Fermented Mulberry Leaf Tea. Master’s Thesis, Jiangsu University of Science and Technology, Zhenjiang, China, 2025. [Google Scholar]
- Huang, C. Process Optimization and Quality Analysis of Mulberry Tea Fermented by Eurotium cristatum and Sanghuangporus sanghuang. Master’s Thesis, Guangxi University, Nanning, China, 2024. [Google Scholar] [CrossRef]

Disclaimer/Publisher’s Note: The statements, opinions and data contained in all publications are solely those of the individual author(s) and contributor(s) and not of MDPI and/or the editor(s). MDPI and/or the editor(s) disclaim responsibility for any injury to people or property resulting from any ideas, methods, instructions or products referred to in the content. |
© 2026 by the authors. Licensee MDPI, Basel, Switzerland. This article is an open access article distributed under the terms and conditions of the Creative Commons Attribution (CC BY) license.