


Abstract
Thymol and carvacrol are bioactive monoterpenoids of recognized pharmacological value, and Plectranthus amboinicus leaves are a promising natural source for their recovery through ultrasound-assisted extraction. This study evaluated how forced-convection drying temperature (36–64 °C) and particle size affect dehydration kinetics and the recovery of thymol and carvacrol (thymol-equivalent response), total phenolic compounds (TPC), and extraction yield. The Midilli–Küçük model best fitted the drying kinetics (R2 > 0.99), with effective moisture diffusivity ranging from 6.68 × 10⁻¹² m2 s−1 to 1.72 × 10⁻¹¹ m2 s−1 and an activation energy of 41.19 kJ mol−1. Response surface methodology using a central composite design indicated that particle size had the strongest influence on the evaluated extraction responses. Multi-response optimization identified 46 °C and 0.18 mm as a model-predicted candidate condition, for which the fitted cubic models predicted 785.3 ppm thymol equivalents, 206.4 mg GAE g−1 dry extract for TPC, and 10.1% extraction yield. Experimental verification yielded relative prediction errors of −18.6%, +5.6%, and −34.4% for the thymol-equivalent response, TPC, and extraction yield, respectively. These discrepancies, particularly for the thymol-equivalent response and extraction yield, indicate limitations in predictive accuracy. Furthermore, the UV–Vis assay did not establish the specific identity of thymol or carvacrol in the extracts. The findings provide insight into the effects of drying preconditioning and particle size on the measured extraction responses under the evaluated conditions, while further chromatographic analysis and experimental verification are needed to establish compound-specific recovery and the robustness of the predicted conditions.
1. Introduction
Oregano (Plectranthus amboinicus Lour.) is an herbaceous, aromatic, and perennial plant belonging to the Lamiaceae family, commonly known as French oregano, Mexican mint, Indian oregano, or broadleaf thyme [1]. Oregano is native to the African continent, with a natural range that includes regions of eastern and southern Africa, the Arabian Peninsula, and India; however, it has now been introduced and is widely cultivated in tropical and subtropical regions around the world, especially in dry areas [2]. This species, characterized by a creeping or climbing habit, has traditionally been used for medicinal purposes, as animal feed, and in food and environmental applications [3].
Several studies have documented its use in traditional medicine for the treatment of respiratory, gastrointestinal, and dermatological conditions [4], which is associated with its complex phytochemical composition. In this context, the presence of bioactive compounds such as polyphenols, flavonoids, phenolic acids, terpenoids, and essential oils has been reported, with metabolites such as thymol and carvacrol standing out [4,5]. These compounds have been linked to antimicrobial [6], antioxidant [7], anti-inflammatory [6], insecticidal [8], and anticancer [9] activities, among other pharmacological properties described in the scientific literature [10].
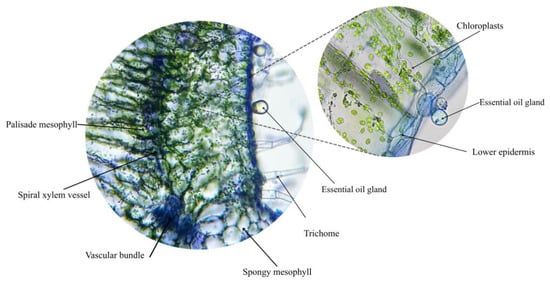
From an anatomical standpoint, the biosynthesis and accumulation of essential oils occur mainly in glandular trichomes present on the leaf surface. In P. amboinicus, capitate trichomes, including short- and long-stalked types, specialized in the secretion and storage of these compounds have been described; these compounds accumulate in subcuticular cavities formed by secretory cells [11]. These structures produce complex mixtures of monoterpenes, in which carvacrol and thymol predominate, together with other compounds such as γ-terpinene, p-cymene, and thymohydroquinone, which have been reported in the chemical profile of the essential oil of this species [5,12]. The anatomical organization of these secretory structures, documented by optical microscopy (see Section 2.3), comprises glandular trichomes associated with a differentiated mesophyll. The production of these metabolites can be modulated by environmental factors such as radiation and temperature, which influence the regulation of essential oil biosynthesis in these secretory structures [11].
The efficient recovery of bioactive metabolites from plant matrices largely depends on the processing conditions applied to the plant material. In this context, extraction constitutes a decisive step for obtaining essential oils and other compounds of interest [13]. Prior conditioning by drying is particularly relevant to ensure biomass stability, since reducing moisture content and water activity helps limit microbial proliferation and preserve the integrity of the metabolites present [14]. This process involves simultaneous heat and mass-transfer phenomena and can be carried out using different operating configurations, including natural or forced-convection systems [15].
In recent years, the development of more sustainable extraction technologies has promoted the implementation of alternative methods for recovering bioactive compounds from plant matrices [16]. Among these, ultrasound-assisted extraction has been widely studied for its ability to induce acoustic cavitation phenomena, which favor the disruption of cellular structures and improve mass transfer between the plant matrix and the solvent. As a result, this method can increase the recovery yield of metabolites and reduce processing time and operating costs compared with conventional techniques [17]. Likewise, several studies have shown that both drying conditions [14,18] and the extraction method [13,16,17] significantly influence process efficiency and the chemical composition of the compounds obtained from aromatic plant matrices.
Previous research [17] has optimized ultrasound-assisted extraction of thymol from Plectranthus amboinicus by evaluating extraction parameters such as temperature, time, and solid-to-solvent ratio. Building on this work, the present study focused on two complementary pre-extraction variables that have not been addressed jointly in the same optimization framework: convective drying temperature and particle size. Rather than re-optimizing the ultrasound extraction conditions, the study investigated how thermal preconditioning and particle-size reduction influence drying kinetics and the subsequent recovery responses under fixed ultrasound-assisted extraction conditions. This approach provides additional insight into the role of raw-material preparation in the extraction process and evaluates whether these preconditioning variables can improve the recovery of extractable constituents. In this context, the present study aimed to model the drying kinetics of P. amboinicus leaves, to determine the moisture transfer parameters associated with the process, and to optimize the drying and particle-size conditions to maximize the recovery of thymol and carvacrol (thymol-equivalent response), total phenolic compounds (TPC), and extraction yield by ultrasound-assisted extraction.
2. Materials and Methods
2.1. Raw Material
Oregano (Plectranthus amboinicus Lour.) leaves used in the central composite design (CCD; see Section 2.10) experiments were collected between February and April from the same plant population at the Universidad Nacional de Colombia, Campus de La Paz (10.3889° N, 73.1984° W). Leaves were selected based on morphological criteria, including color, size, and the absence of visible damage. Lower leaves were harvested, washed to remove surface impurities, and processed on the same day of each drying stage. The leaf petioles were removed, and the laminae were cut into sections approximately 1.5 cm long and 1.0 cm wide before convective drying. The drying stages were performed sequentially at 50 °C, 40 °C, 60 °C, 36 °C, and 64 °C. After each stage, the dried material was milled for 10 s using a POLYMIX System PX-MFC 90D mill (KINEMATICA AG, Malters, Switzerland) and sieved to obtain the particle-size fractions required for the 13 CCD experimental runs. Thus, the different particle-size treatments at each drying temperature were obtained from material processed during the corresponding drying stage rather than from separate harvests. Once all required particle-size fractions had been prepared, ultrasound-assisted extractions were performed in the randomized order generated by Design-Expert® software version 13 (Stat-Ease Inc., Minneapolis, MN, USA).
Experimental verification was performed using a separate group of leaves harvested in May from younger plants propagated from the original plant population and grown in another area of the same university. This material was used exclusively for experimental verification and was not included in the CCD experiments. Because the drying stages were performed sequentially using plant material collected over several months, potential biological variability associated with the harvesting schedule cannot be completely excluded when interpreting the effects of drying temperature.
2.2. Reagents
This study used absolute ethanol (HPLC, UV, and IR grade, PanReac, Castellar del Vallès, Spain), thymol (certified reference standard, ≥99.9%, GC, Sigma-Aldrich, Taufkirchen, Germany), carvacrol (certified reference standard, ≥99.9%, GC, Sigma-Aldrich, Germany), Folin & Ciocalteu reagent (2 M with respect to acid, Sigma-Aldrich, Germany), sodium carbonate (Na2CO3, 99.5%, PanReac AppliChem-ITW Reagents, PanReac, Spain), gallic acid (99%, Alfa Aesar, Ward Hill, MA, USA), and methylene blue (1% w/v aqueous solution, Loba Chemie, Mumbai, India). All reagents were used as received.
2.3. Preparation and Photography of the Leaf-Blade Cross-Section
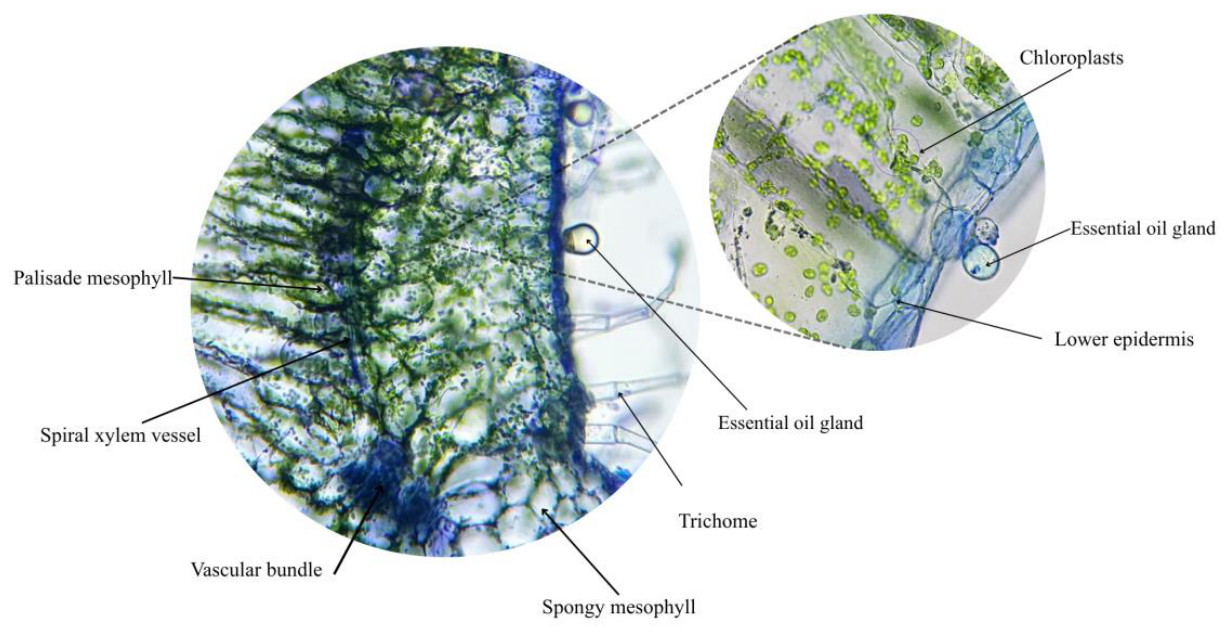
Cross-sections of the leaf blade of P. amboinicus were obtained by manual sectioning with a razor blade, using a piece of carrot as supporting tissue [19]. The sections were collected in water, and the thinnest ones were selected. The sections were stained with methylene blue to increase contrast between the mesophyll structures and the glandular trichomes [20], mounted in water on glass slides, and examined under an optical microscope (Primo Star, Carl Zeiss, Suzhou, China) using a 40× objective lens. Photographic records were obtained using a high-resolution smartphone camera coupled to the microscope eyepiece. Representative micrographs are presented in Figure 1.
Figure 1.
Cross-section of the oregano (Plectranthus amboinicus) leaf blade, stained with methylene blue, with glandular trichomes and differentiated mesophyll.
Figure 1 provides anatomical context for the study by illustrating the leaf tissues and glandular trichomes associated with essential oil storage. It is included to contextualize the plant structures relevant to compound recovery, rather than as evidence of trichome disruption or a direct explanation of the extraction results.
2.4. Drying
Samples of P. amboinicus were subjected to drying in a forced-convection oven (BINDER GmbH, model FED 115, Tuttlingen, Germany), at the temperature corresponding to each experimental run (see Section 2.10), with 100% fan operation and measured chamber relative humidity of 52–60%. Leaf sections were arranged in a single layer without overlap on trays positioned parallel to the airflow, at an estimated loading of approximately 0.48 kg m−2. Air velocity was not measured directly. The manufacturer specifies 32 air changes h−1 at 100 °C in an unloaded chamber with the fan set to 100%. The same model has been reported to achieve an air velocity of 1.5 m s−1 at 70 °C [21]. Drying curves at 40 °C, 50 °C, and 60 °C were obtained from three drying replicates. At each sampling time, two mass readings were recorded for each replicate and averaged to obtain the mass value used for the drying curve. The two readings were treated as repeated measurements within each replicate, not as independent experimental replicates. Results are reported as mean ± standard deviation across the three drying replicates. Initial moisture content was determined gravimetrically at 103 °C until constant mass (≤0.1% mass variation), following AOAC [22].
2.5. Drying Kinetic Modeling
Experimental drying data for P. amboinicus leaves at different temperatures were fitted using five empirical thin-layer kinetic models widely reported in the literature [23] to describe moisture transfer behavior during the drying process: Page [24], Modified Page [25], Henderson and Pabis [26], Logarithmic [27], and Midilli–Küçük [28]. The mathematical formulations of the evaluated models are presented in Table S1.
Nonlinear fitting of the experimental curves and estimation of the kinetic parameters were performed using IBM SPSS Statistics v32 (IBM, Armonk, NY, USA) and MATLAB (R2026b, MathWorks, Natick, MA, USA). The predictive capacity of each model was evaluated using the coefficient of determination (R2), the root mean square error (RMSE), the sum of squared errors (SSE), and the reduced chi-square (χ2), calculated using Equations (1)–(3), respectively. Models with higher R2 values and lower RMSE and χ2 values were considered the most suitable for describing the drying kinetics of P. amboinicus leaves.
where N is the number of observations; Z is the number of model parameters; and MRcal and MRexp are the calculated and experimental moisture ratio (MR), respectively.
2.6. Effective Moisture Diffusivity and Activation Energy
In the models described in Table S1, MR represents the dimensionless moisture, which was determined using Equation (4), as follows:
where xt is the moisture content of the matrix at time (t), xe is the equilibrium moisture content of the matrix, and x0 is the initial moisture content. Because xe is considerably smaller than xt and x0 under the forced-convection drying conditions employed [14], MR was simplified as shown in Equation (5):
Effective moisture diffusivity (Deff) was estimated by fitting Fick’s second law of diffusion to the experimental drying data obtained in this study, consistent with the falling-rate period that dominated the observed drying kinetics. The fit assumed a uniform initial moisture distribution, constant effective diffusivity, negligible shrinkage, and infinite-slab geometry. The analytical solution proposed by Crank [29] for this type of system was applied, as expressed in Equation (6).
where Deff corresponds to the effective moisture diffusivity (m2 s−1), L represents half the thickness of the sample (m), and t is the drying time (s). Thickness was measured on 10 fresh leaves at three positions per leaf (basal, middle, and apical), avoiding the central midrib, using a digital caliper with a resolution of 0.01 mm. L was calculated as half the mean thickness. For sufficiently long drying times, the general solution was simplified by considering only the first term of the Crank series, giving Equation (7). Subsequently, applying the natural logarithm yielded a linear relationship between Ln (MR) and t, as shown in Equation (8). The slope of the resulting linear relationship corresponded to the kinetic constant K, which is related to Deff through Equation (9), considering one-dimensional diffusion in slab geometry. Finally, the influence of temperature on Deff was described using the Arrhenius equation (Equation (10)), allowing the activation energy (Ae) and the pre-exponential factor D0 to be estimated from the linearization of Ln (Deff) as a function of T−1.
where R is the universal gas constant (8.314 × 10⁻³ kJ mol−1 K−1), and T is the absolute temperature (K).
2.7. Ultrasound-Assisted Extraction
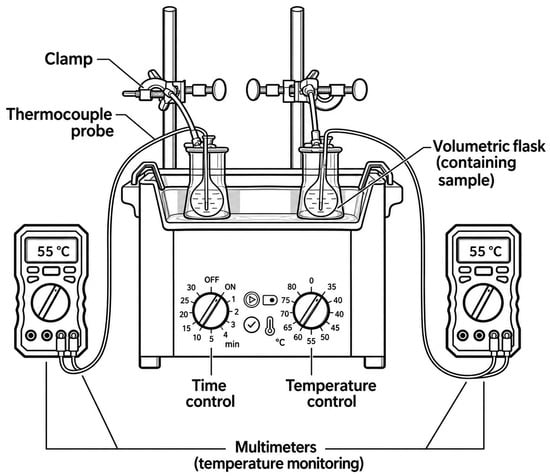
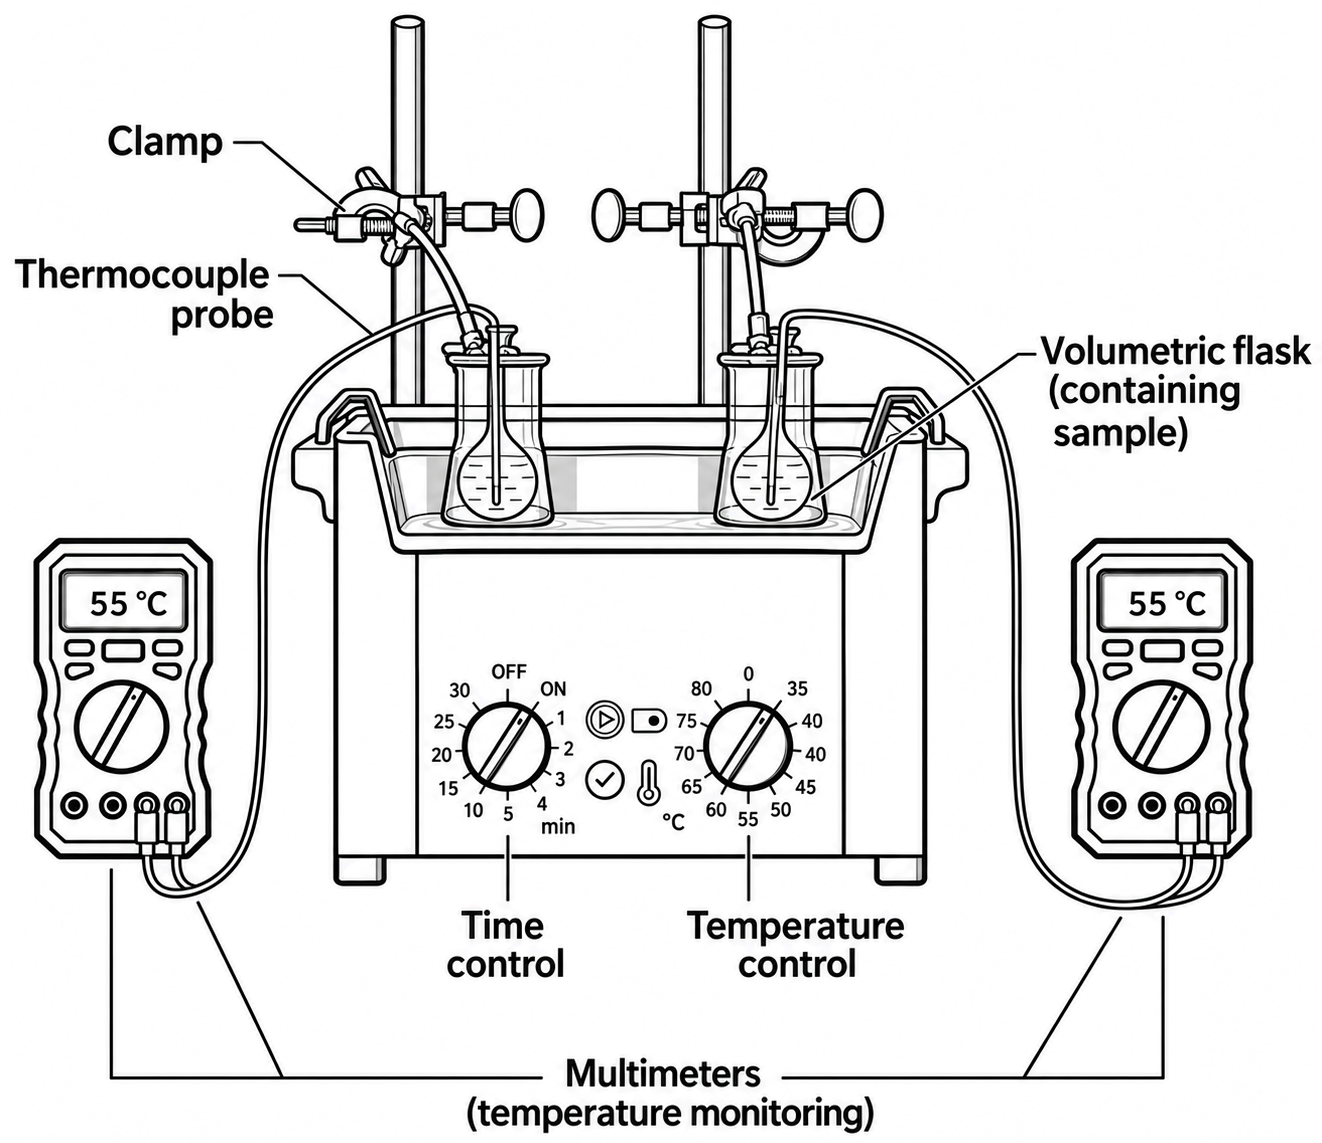
Ultrasound-assisted extraction was carried out using ethanol as the extraction solvent. The dried sample (140 mg) was mixed with 5.0 mL of ethanol, corresponding to a solid-to-solvent ratio of 1:35 w/v, and extracted in an Elmasonic Easy 30 H ultrasonic bath (Elma Schmidbauer GmbH, Singen, Germany; 37 kHz, 280 W total power, 80 W rated ultrasonic power) at 55 °C for 23 min. Sample temperature was continuously monitored using a thermocouple connected to a multimeter and immersed in the extraction vessel; ice was added to the surrounding bath as needed to keep the sample at 55 °C. Subsequently, the samples were centrifuged at 1449× g for 5 min, and the supernatant was used for UV-Vis analysis (Agilent Cary 60 UV-Vis, Agilent Technologies, Santa Clara, CA, USA). The extraction conditions were selected based on previously reported ultrasound-assisted extraction conditions for thymol from P. amboinicus [11,15]. The ultrasound-assisted extraction setup can be seen in Figure 2.
Figure 2.
Ultrasound-assisted extraction setup.
2.8. Thymol-Equivalent Response
The thymol-equivalent response was determined by UV–Vis spectrophotometry at 275 nm using an external calibration curve prepared with a certified thymol reference standard. The wavelength was selected based on the reported maximum ultraviolet absorption of thymol in ethanol (274 nm–276 nm) and previous applications of direct UV–Vis determination [30,31]. An independent calibration curve was also prepared with a certified carvacrol reference standard at 273 nm, under the same solvent and instrumental conditions, to evaluate the potential overlap of the two phenolic monoterpenes.
Thymol and carvacrol calibration curves are provided in Figure S1. The slopes differed by approximately 0.85%, and their difference was not statistically significant (p = 0.757), indicating very similar UV responses in this spectral region. These results show that absorbance at 275 nm cannot by itself provide unequivocal selectivity for thymol in the crude leaf extract. Accordingly, the measured response is reported as a thymol-equivalent UV–Vis response based on the external thymol standard, rather than as chromatographically confirmed thymol. Before measurement, extracts were diluted tenfold with absolute ethanol. The calibration-derived concentration therefore refers to the diluted analytical solution; the original-extract concentration was obtained by applying the 10-fold dilution factor. For comparison among treatments, the corrected concentration was also expressed as mg thymol equivalents (TE) per gram of dry leaves using the 5.0 mL extraction volume and 0.140 g dry-sample mass.
2.9. Determination of Total Phenolic Content and Extraction Yield
Extraction yield (% w/w) was determined gravimetrically by evaporating a known aliquot of the extract in a water bath at 60 °C. The dry residue obtained from the aliquot was used to estimate the total dry extract mass, accounting for the total extract volume. Extraction yield was calculated as the ratio of the estimated total dry extract mass to the initial dry leaf mass, multiplied by 100%. The dry extract was then reconstituted in absolute ethanol at a concentration of 1 mg mL−1 and used to determine total phenolic content (TPC) by the Folin–Ciocalteu method. Briefly, 50 µL of extract was mixed with 425 µL of type 1 water and 125 µL of Folin–Ciocalteu reagent. After 6 min, 400 µL of 7.1% w/v sodium carbonate was added. The mixture was incubated in the dark for 1 h, and absorbance was measured at 760 nm by UV–Vis spectrophotometry. Quantification was performed using a calibration curve prepared with gallic acid as the standard, and results were expressed as milligrams of gallic acid equivalents per gram of dry extract (mg GAE g−1 dry extract).
2.10. Experimental Design and Statistical Analysis
To identify model-predicted extraction conditions for P. amboinicus, an RSM was used. A CCD was employed to evaluate the independent variables and their interactions. The experimental data were initially evaluated using a second-order polynomial model, in accordance with the conventional approach employed for central composite designs. Model adequacy was assessed based on analysis of variance (ANOVA), the lack-of-fit test, and model fit statistics. When the quadratic model exhibited a significant lack of fit (p ≤ 0.05), higher-order polynomial terms were subsequently evaluated to determine whether the lack of fit could be adequately explained by additional model terms. Statistically significant cubic terms were identified for the corresponding response(s), and a reduced cubic model was therefore fitted by retaining only the significant cubic term(s) and the relevant lower-order terms required by model hierarchy. A reduced cubic model was selected when the inclusion of a third-order term resulted in a statistically significant improvement in model adequacy and yielded a non-significant lack of fit (p > 0.05). The adequacy of the selected reduced cubic model was further confirmed by the absence of significant lack of fit and by acceptable agreement between the adjusted and predicted coefficients of determination. Model selection was further supported by the adjusted and predicted coefficients of determination (R2_adj and R2_pred, respectively), the coefficient of variation, and adequate precision.
Simultaneous optimization of the three responses was carried out with a reduced number of experiments, using drying temperature and particle size as independent variables owing to their significant reported influence on the extraction efficiency of compounds from biological matrices. Each factor was evaluated at five coded levels, from the lower axial point (−α) to the upper axial point (+α), with α = 1.414: drying temperature ranged from 36 °C to 64 °C, with 40 °C, 50 °C, and 60 °C as factorial levels and 50 °C as the center point; particle size ranged from 0.19 mm to 2.31 mm, with 0.50 mm, 1.25 mm, and 2.00 mm as factorial levels and 1.25 mm as the center point. The complete coded and actual levels of each independent variable are presented in Table S2.
The rotatable CCD comprised a total of 13 experimental runs, consisting of four factorial points, four axial points, and five center points (see Table S2). The runs were performed in randomized order, and each condition was evaluated in triplicate, resulting in a total of 39 experimental trials; these replicates did not represent independent biological batches. Extraction yield (%), thymol-equivalent response (ppm), and TPC (mg GAE g−1) were selected as response variables to evaluate the individual and combined effects of drying temperature and particle size. The experimental design was developed using Design-Expert®. The interaction between factors and the significance of the effects were evaluated by ANOVA, considering a significance level of 95% (p ≤ 0.05). The predictive capacity of the model was determined through the coefficient of determination (R2), along with the adjusted and predicted coefficients of determination (R2_adj and R2_pred, respectively), to assess model fit and predictive performance.
3. Results and Discussions
3.1. Drying Curves
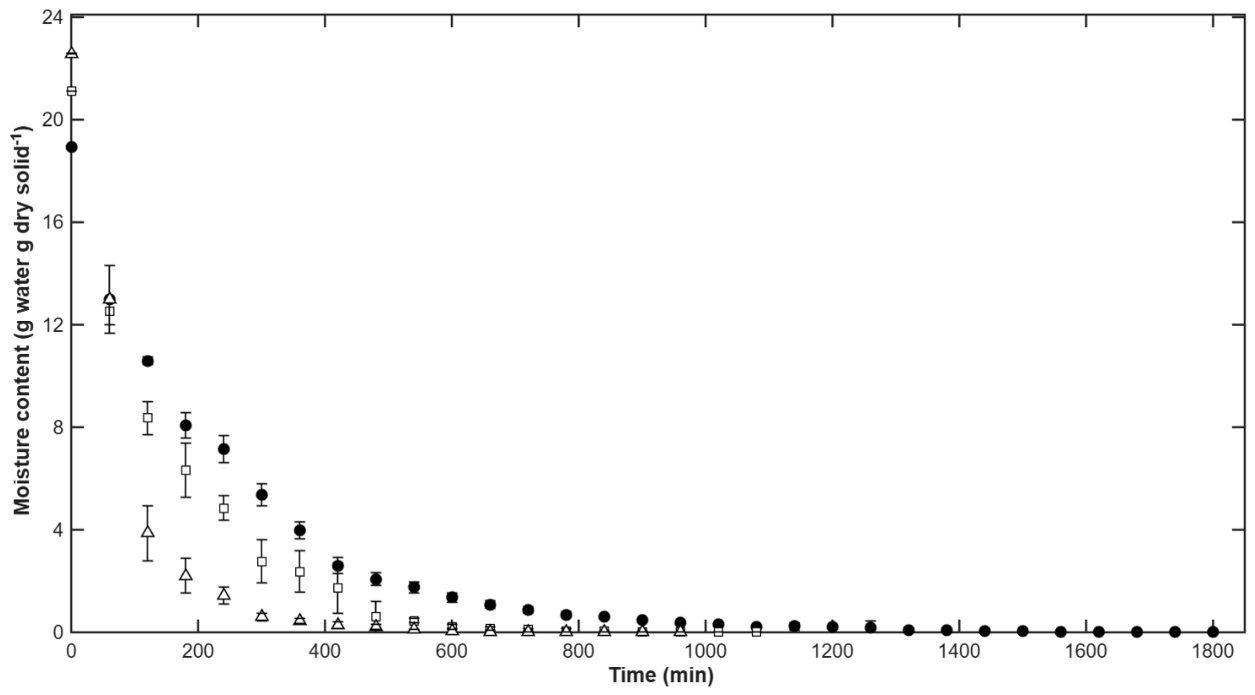
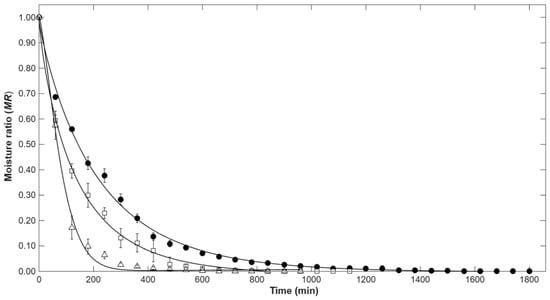
The initial moisture content of the P. amboinicus leaves was 95 ± 1% (wet basis, wb). As shown in Figure 3, the moisture content decreased continuously during convective drying at all temperatures, showing a marked influence of temperature on the dehydration kinetics. The time required to reach the equilibrium moisture content decreased progressively with increasing temperature, from approximately 1800 min at 40 °C, to 1140 min at 50 °C, and to 960 min at 60 °C, confirming that increasing temperature accelerates the drying kinetics. Similar results have been reported for aromatic and medicinal leaves dried by convection (i.e., tea), where temperature was one of the operating variables with the greatest influence on the overall rate of moisture removal [32]. Meanwhile, a previous study reported that leaves of Origanum vulgare dried at 50 °C required 24 h to reach a residual moisture content of 5.3%, whereas a shorter drying time was observed in the present study under the same temperature [18]. This discrepancy may be related to differences in plant tissue structure, sample thickness, and drying operating conditions.
Figure 3.
Drying curves of Plectranthus amboinicus leaf at 40 °C (●), 50 °C (□), and 60 °C (△).
The curves obtained showed the characteristic behavior of biological materials whose dehydration occurs predominantly during the falling-rate period. In this stage, the drying rate decreases progressively as the material’s water content is reduced, a behavior widely reported for aromatic and medicinal leaves subjected to convective drying [33]. The effect of temperature on the observed kinetics was reflected in the reduction in the time needed to reach equilibrium moisture content, showing an improvement in the overall process efficiency [34].
3.2. Effective Diffusion Coefficient and Activation Energy
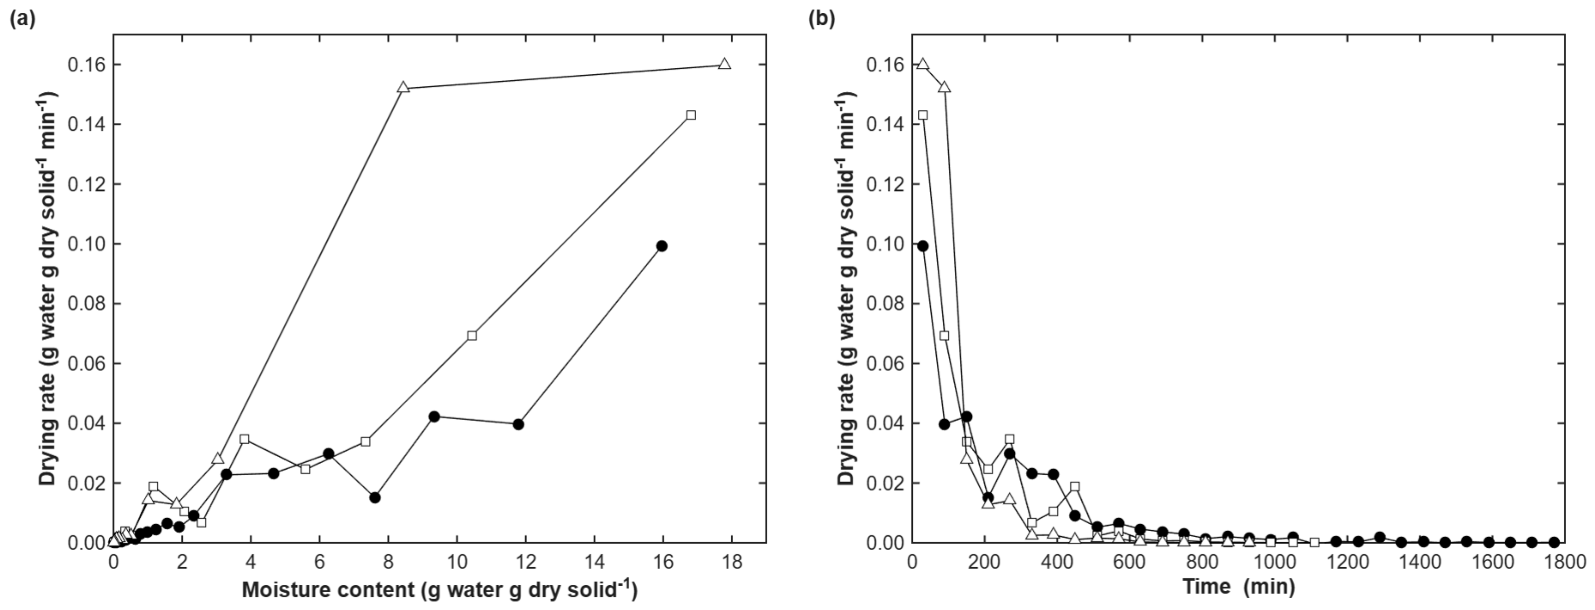
Deff was estimated from the analytical solution of Fick’s second law for a flat slab, assuming that internal moisture transfer is the main resistance during the falling-rate period. Meanwhile, the characteristic diffusion length (L) was defined as one-half of the mean leaf-lamina thickness (L = 0.25 mm; see Section 2.6). Deff increased progressively with temperature, from 6.68 × 10⁻¹² m2 s−1 at 40 °C to 1.35 × 10⁻¹¹ m2 s−1 at 50 °C and 1.72 × 10⁻¹¹ m2 s−1 at 60 °C (see Table S3). This increase reflected higher vapor pressure, lower water viscosity, and greater mobility of the water retained in the plant matrix, along with heat-induced microstructural changes favoring moisture migration toward the surface [35]. These results were consistent with the higher drying rates observed experimentally (see Figure 4) and with similar temperature-dependent trends reported for other hot-air-dried aromatic leaves [36].
Figure 4.
Variation of (a) drying rate versus moisture content and (b) drying rate versus time for a forced-convection oven at 40 °C (●), 50 °C (□), and 60 °C (∆).
Deff values obtained in this study were lower than those previously reported for P. amboinicus. Castillo-Téllez et al. [37] reported 1.14 × 10⁻¹⁰ m2 s−1, 2.28 × 10⁻¹⁰ m2 s−1, and 1.03 × 10⁻⁹ m2 s−1 for electric-oven drying at 45 °C, 55 °C, and 65 °C, respectively, while Rout et al. [38] found markedly higher diffusivities under microwave drying than under hot-air or vacuum drying. These differences likely reflected the combined effect of temperature, drying method, and the sample geometry and characteristic length used to estimate Deff.
The substantial reduction in leaf thickness observed after drying (~60%) should be considered when interpreting the estimated effective diffusivities. Since the model used the initial mean leaf thickness and did not account for dimensional changes during drying, the reported Deff values are apparent estimates that may be affected by shrinkage.
The temperature dependence of Deff was described by the Arrhenius equation, yielding an Ae of 41.19 kJ mol−1 and a pre-exponential factor (D0) of 5.31 × 10⁻⁵ m2 s−1. Ae reflects the thermal sensitivity of internal moisture transport and the minimum energy required to initiate diffusion within the plant matrix [39]. This value was within the range reported for aromatic leaves and other plant materials under convective drying and is close to the 39.30 kJ mol−1 reported for purple basil (Ocimum basilicum L.) [40], indicating similar temperature sensitivity of moisture diffusion in both matrices. The high coefficient of determination (R2 = 0.93) confirmed that the Arrhenius model adequately described the effect of temperature on Deff in P. amboinicus leaves.
Figure 4 shows the drying rate as a function of time and moisture content at the three temperatures evaluated. All curves displayed an initial high-rate stage followed by a pronounced decline toward near-zero values, reflecting the approach to hygroscopic equilibrium. The nonlinear relationship between drying rate and moisture content, with sharper variations at intermediate moisture levels, suggested progressive changes in the moisture accessible within the tissue as drying proceeds, confirming the non-stationary nature of leaf drying, governed by the interaction between material state and applied thermal conditions.
3.3. Drying Kinetic Models
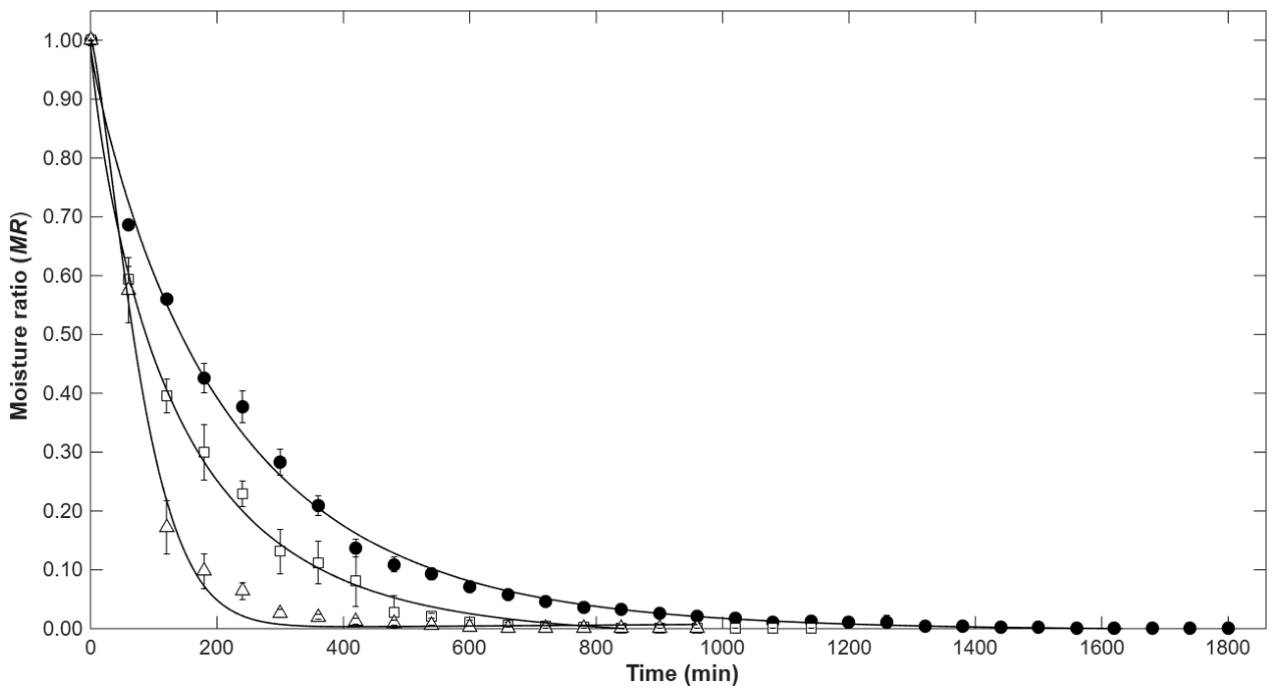
The fitting results revealed that the models analyzed adequately described the drying kinetics of P. amboinicus, as shown by the high coefficients of determination (R2 > 0.98) and the low RMSE, SSE, and χ2 values. However, the Midilli–Küçük model provided the best statistical fit at all operating temperatures, showing the smallest deviation between experimental and predicted values (see Table 1). This behavior suggested that the mathematical structure of the Midilli–Küçük model more accurately captured the combined mass transfer mechanisms governing the decrease in moisture content during drying.
Table 1.
Model parameters and statistical results for the drying of Plectranthus amboinicus at 40 °C, 50 °C, and 60 °C.
The predominance of the Midilli–Küçük model observed in the present study agreed with results reported for various plant materials, where this model has shown a high predictive capacity to describe the evolution of the moisture ratio during thin-layer drying. Previous studies identified the Midilli–Küçük model as providing the best fit for the drying kinetics of clove leaves and Mentha haplocalyx [39,41]. Likewise, the kinetic parameter k varied among the evaluated drying temperatures, consistent with the temperature-dependent behavior reported for drying kinetics in plant materials [42].
Figure 5 shows the evolution of the experimental and estimated MR during convective drying of P. amboinicus leaves at 40 °C, 50 °C, and 60 °C. In all cases, a continuous decrease in MR with time was observed, reaching values close to equilibrium in less time as the drying temperature increased. The closeness between the experimental and calculated values shows the ability of the Midilli–Küçük model to adequately represent the drying kinetics under the conditions evaluated. Similar behavior was reported during the drying of clove leaves, where the Midilli–Küçük model showed the best statistical performance for describing the evolution of the moisture ratio compared with other thin-layer models [43].
Figure 5.
Drying kinetics adjusted by the Midilli–Küçük model of Plectranthus amboinicus leaves at 40 °C (●), 50 °C (□), and 60 °C (∆).
3.4. Response Surface Optimization
The central composite design and the experimental results of the response variables are presented in Table 2. The UV–Vis thymol-equivalent response ranged from 244.6 ppm to 717.3 ppm in the original extract, corresponding to (8.7–25.6) mg TE g−1 dry leaves. TPC ranged from 62.8 mg GAE g−1 to 193.4 mg GAE g−1, and extraction yield ranged from 2.0% to 9.0%. The highest experimental values for the three responses were obtained at 0.19 mm and 50 °C, whereas the lowest values were observed at 2 mm and 60 °C. These observations indicate a marked influence of particle size and drying temperature on the responses evaluated, but the highest observed response combination should be distinguished from the model-derived multi-response compromise described below.
Table 2.
Experimental responses obtained from the central composite design (CCD).
A cubic polynomial model adequately fitted the experimental data, with low standard errors and R2 of 0.99 for the thymol-equivalent response, TPC, and yield. The ANOVA of the response surfaces identified that the linear effects of particle size were highly significant for all three responses (p < 0.0001), while the linear effect of temperature was significant for the thymol-equivalent response and total phenols, but not for extraction yield. The quadratic terms (A2 and B2) were significant in all three models, indicating nonlinear behavior of the responses within the experimental domain. Model adequacy was further supported by low coefficients of variation, high adjusted R2 values, and adequate precision ratios, confirming the reliability of the fitted models for navigating the design space.
Comparison of the initial quadratic models with the reduced cubic models showed that the quadratic formulation was insufficient to adequately describe the experimental responses, as indicated by the significant lack of fit. After inclusion of higher-order terms, the final reduced cubic models showed no significant lack of fit at the 5% significance level for the thymol-equivalent response, TPC, or extraction yield. Notably, the AB2 term was highly significant for all three responses (p = 0.0005, 0.0011, and 0.0003, respectively) and was retained in the final models. In addition, the A2B term was significant for extraction yield (p = 0.017) and was also retained in that model.
The regression coefficients obtained (see Tables S4–S6) made it possible to quantify the contribution of the factors studied to the responses evaluated. Particle size showed the largest absolute linear coefficients, showing its predominant influence on the thymol-equivalent response, TPC, and extraction yield. The predominant influence of particle size on the evaluated extraction responses may be explained by several complementary mass-transfer mechanisms. Reducing particle size generally increases the exposed solid–liquid interfacial area and shortens the internal diffusion pathways, potentially facilitating solvent access to extractable constituents and reducing internal mass-transfer resistance. In plant matrices, milling may also expose intracellular and subcellular structures that were less accessible in larger particles. These effects can facilitate the release of extractable constituents into the surrounding solvent, although the extent of structural disruption depends on the mechanical properties and anatomical organization of the tissue.
These mechanisms may be particularly relevant during ultrasound-assisted extraction. Acoustic cavitation generates localized mechanical effects and fluid motion that can improve solvent–solid contact and enhance mass transfer at the particle surface. Consequently, the greater accessibility associated with smaller particles may complement ultrasound-induced transport and mechanical effects, contributing to the higher extraction responses observed within the experimental domain. Nevertheless, the present study did not directly measure specific surface area, cellular disruption, solvent penetration, or cavitation-induced damage. Therefore, these mechanisms should be interpreted as plausible explanations for the observed particle-size effect rather than as experimentally confirmed pathways. Figure 1 provides anatomical context by illustrating the leaf mesophyll and glandular trichomes, but it does not directly demonstrate structural changes caused by milling or ultrasound treatment.
The linear temperature term was statistically significant for both the thymol-equivalent response (p = 0.0438) and TPC (p = 0.0112). Similar results have been observed in species of the Lamiaceae family, where drying differentially modified the chemical composition of the essential oil, significantly reducing the proportion of more volatile precursor monoterpenes, such as p-cymene and γ-terpinene, while more stable phenolic compounds, such as carvacrol, tended to remain unchanged or even increase after thermal processing [18]. Likewise, the significance of the interaction and curvature terms showed the presence of synergies and curvature effects within the experimental space, indicating that the system’s response could not be adequately described by purely linear relationships. In the model equations, and represented the coded factors corresponding to drying temperature and particle size, respectively, in accordance with the levels established in Table S2. Equation (11), Equation (12), and Equation (13) represented the selected models for the thymol-equivalent response (ppm), TPC (mg GAE g−1), and extraction yield (%) of P. amboinicus, respectively.
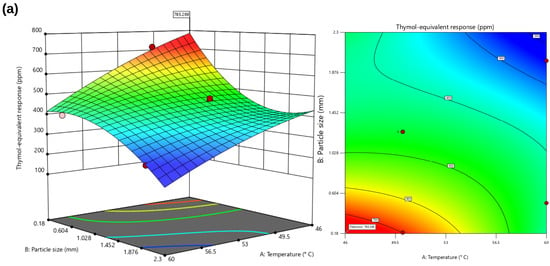
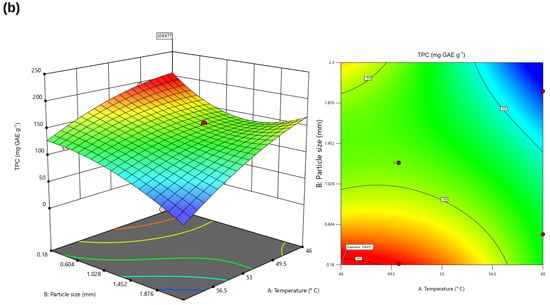
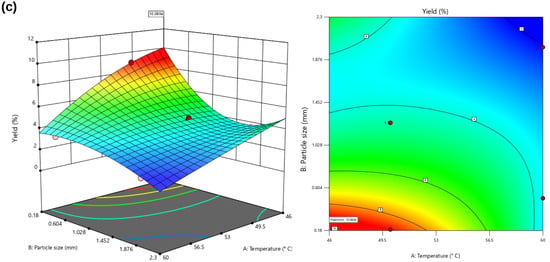
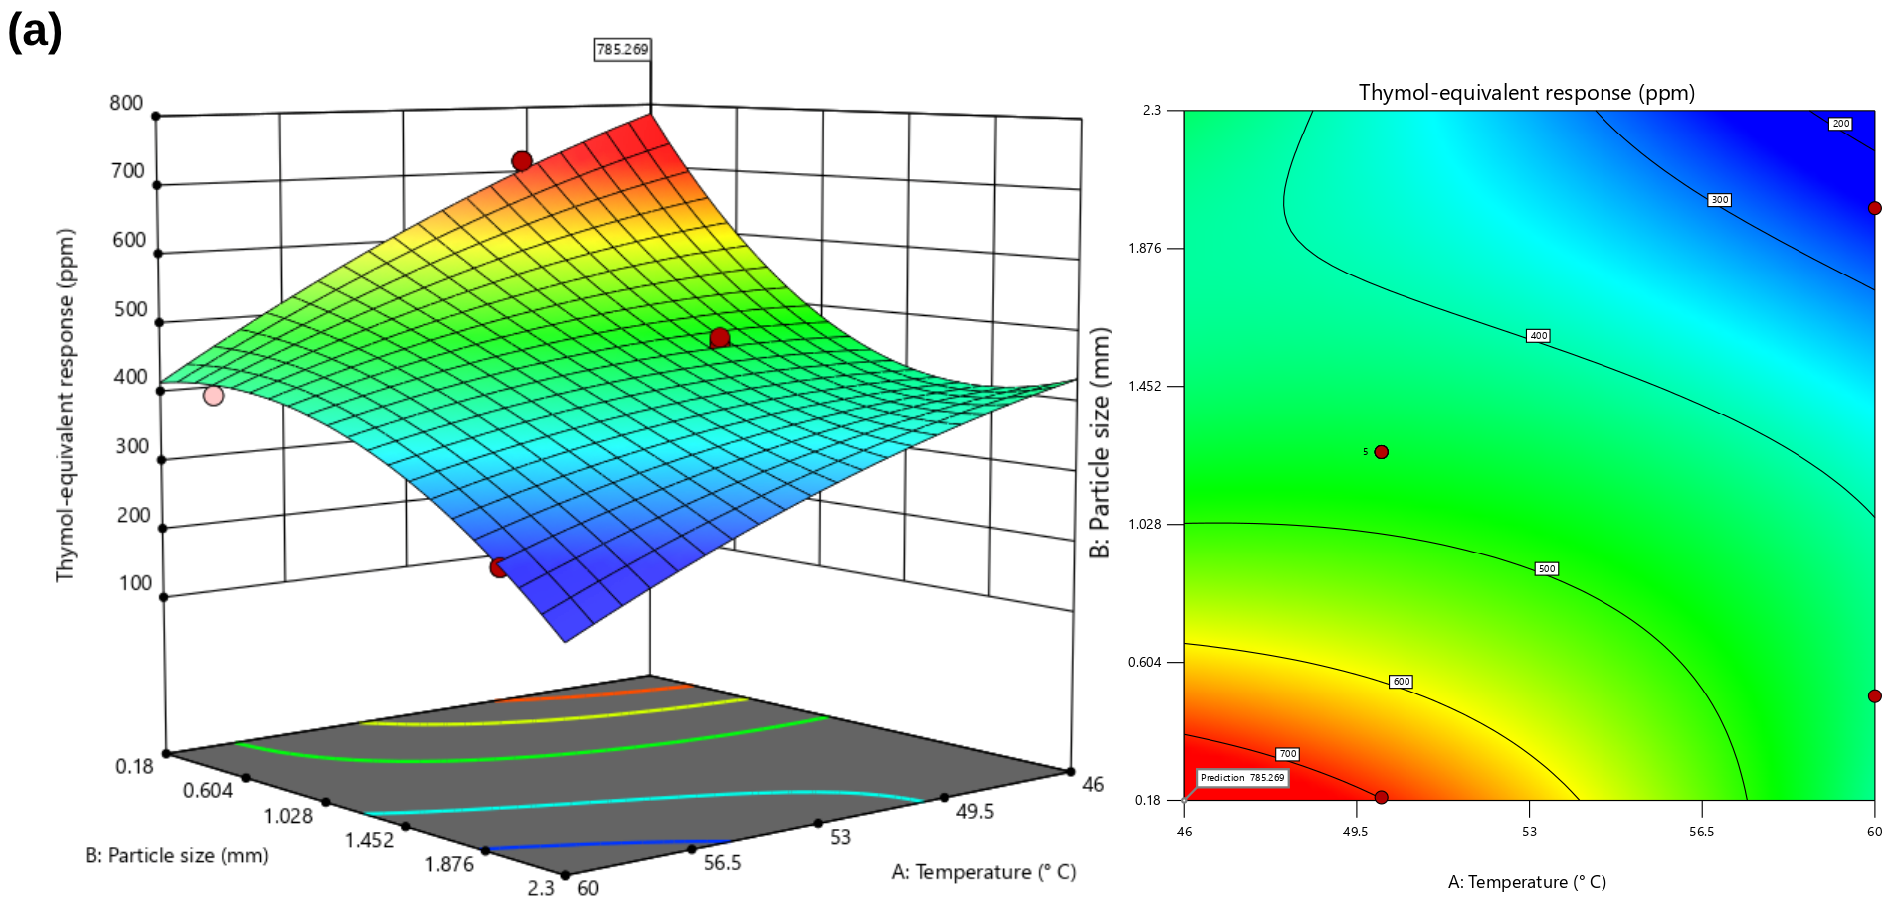
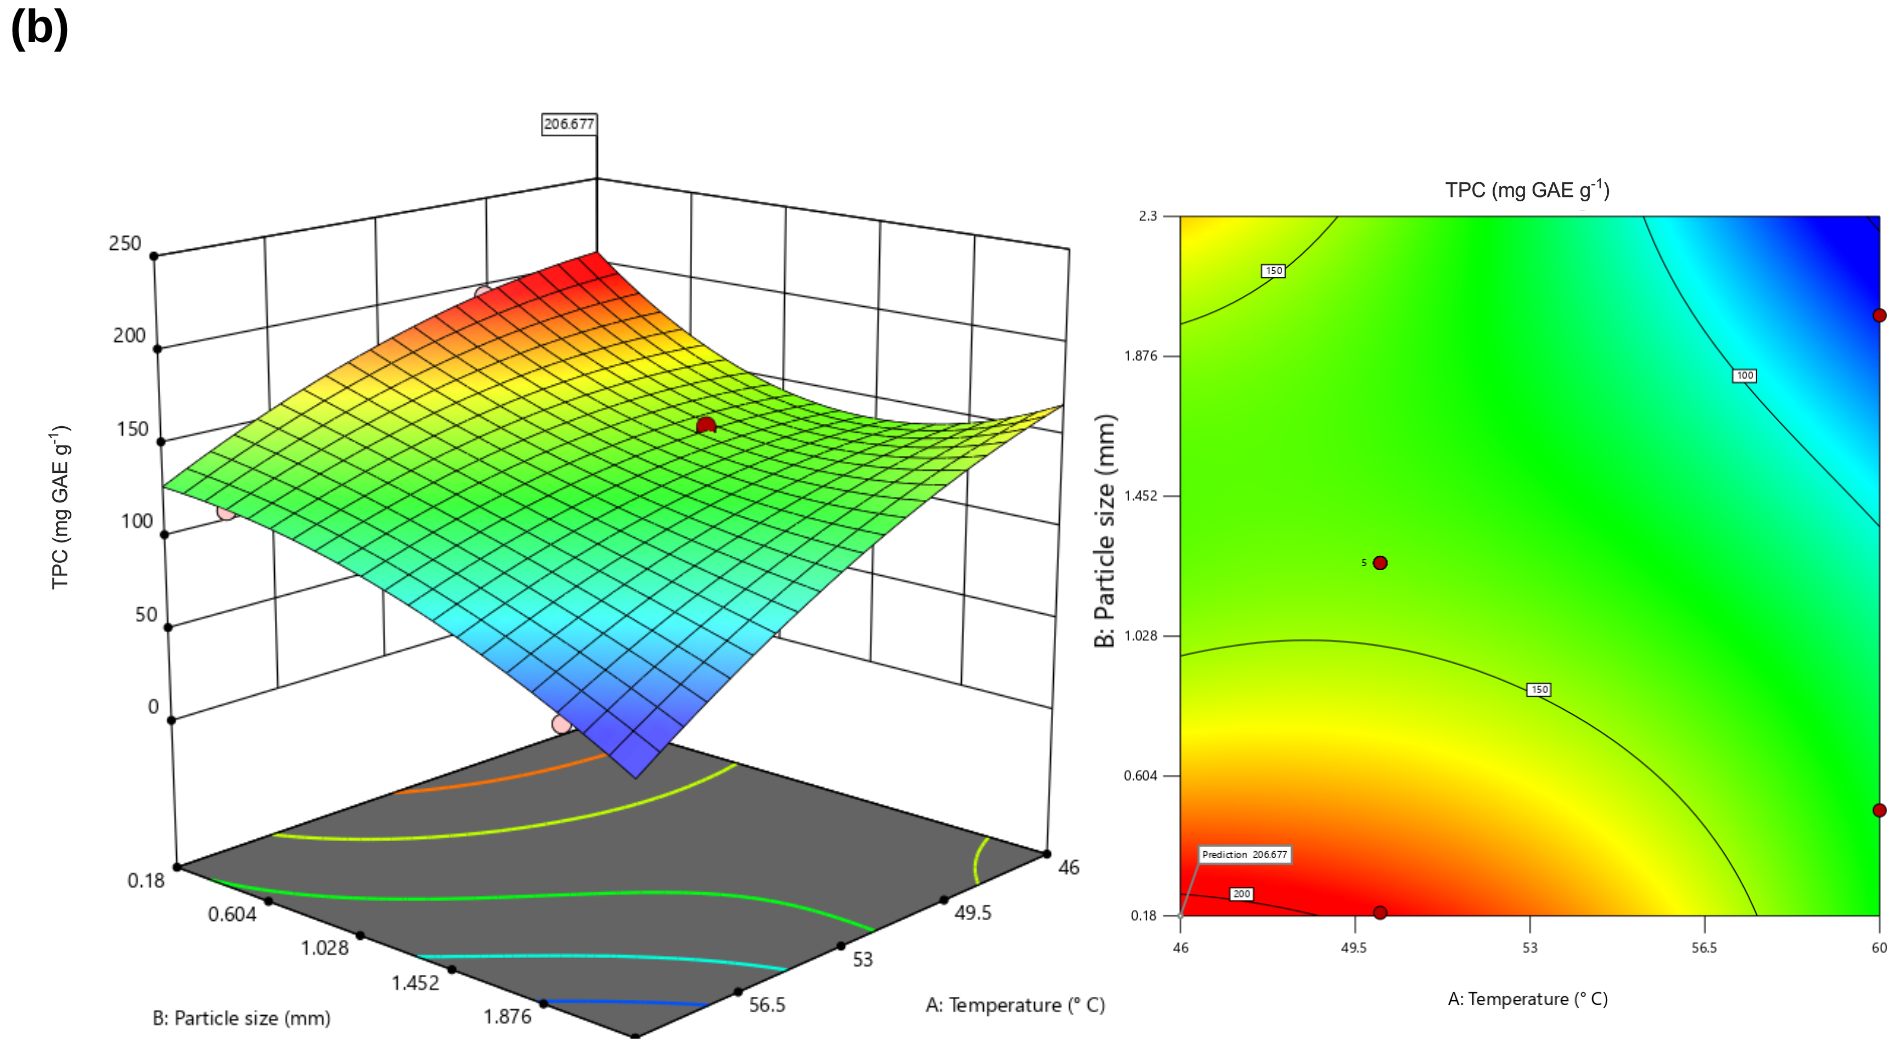
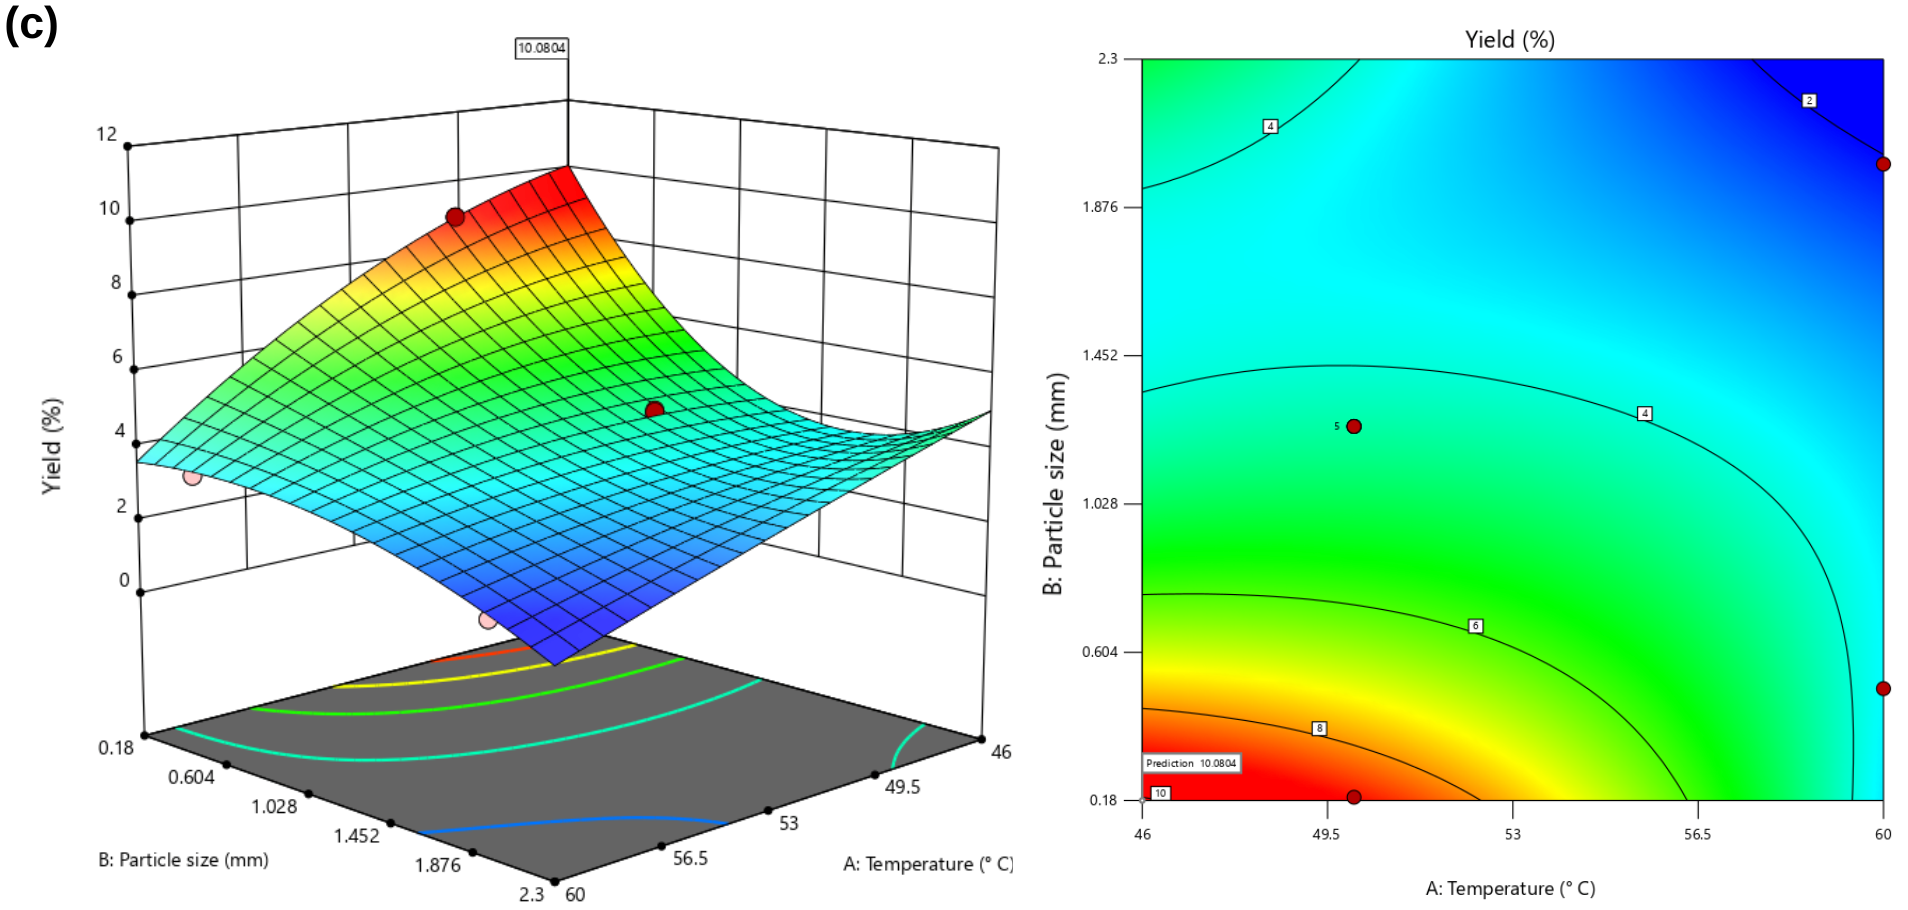
Additionally, 2D contour plots and 3D response surfaces were generated from the cubic model equations to evaluate the behavior of the responses within the experimental domain (see Figure 6). The surfaces obtained showed nonlinear behavior, associated with the significance of the quadratic terms and higher-order interactions (A2B and AB2), making it possible to identify locally favorable regions and trade-off zones among the thymol-equivalent response, TPC, and extraction yield.
Figure 6.
Response surfaces and contour maps obtained by response surface methodology (RSM) for (a) thymol-equivalent response (ppm), (b) TPC (mg GAE g−1 dry extract), and (c) yield (% w/w), as a function of temperature (X1) and particle size (X2).
A multi-response desirability approach was applied to jointly maximize the thymol-equivalent response, TPC, and extraction yield, using the importance levels and desirability weights specified in Table 3. The model-predicted preconditioning conditions were a drying temperature of 46 °C and a particle size of 0.18 mm, with an overall desirability of 0.78. These conditions represent the solution selected under the specified optimization criteria rather than an experimentally confirmed optimum.
Table 3.
Estimation of the relative error between the experimental and model-predicted values under the model-predicted conditions.
The numerical optimization was allowed to extend beyond the experimental particle-size range of 0.19 mm–2.31 mm. Consequently, the selected particle size of 0.18 mm represents a slight extrapolation below the lower experimental boundary, rather than a rounding difference. The corresponding model predictions should therefore be interpreted with additional caution. Although the selected condition was subsequently evaluated experimentally, this verification does not establish an optimum or demonstrate model reliability outside the experimental domain.
3.5. Validation
The predictive performance of the reduced cubic models was evaluated experimentally in triplicate at the selected preconditioning conditions of 46 °C and 0.18 mm particle size (see Table 3). Absolute relative prediction errors calculated using the experimental values as the denominator were 18.6%, 5.6%, and 34.4% for the thymol-equivalent response, TPC, and extraction yield, respectively. The models underestimated the thymol-equivalent response and extraction yield and overestimated TPC. Agreement was closest for TPC, whereas the larger deviations for the other responses indicate limitations in predictive accuracy at the selected condition.
The discrepancies observed for extraction yield and the thymol-equivalent response may partly reflect variability among the leaf batches used for model development and experimental verification. Differences in chemical composition and essential oil content have been reported among production batches of aromatic Lamiaceae species, even under similar agronomic conditions [44]. In this study, leaves were collected in stages between February and May, and experimental verification used an independent batch harvested in May. Differences in plant developmental stage and growing conditions may therefore have contributed to the observed deviations. Previous studies have reported effects of climatic conditions, soil factors, and environmental stress on essential oil content and secondary metabolism [45,46,47,48]. However, these factors were not independently evaluated in the present study, and their contribution cannot be separated from model prediction error.
4. Conclusions
Drying temperature affected dehydration kinetics and estimated effective moisture diffusivity in Plectranthus amboinicus leaves, whereas particle size had the greatest influence on the measured extraction responses. The Midilli–Küçük model described the drying behavior over the evaluated temperature range, with an activation energy of 41.19 kJ mol−1 and estimated effective moisture diffusivities on the order of (10−12–10−11) m2 s−1. The extraction experiments quantified a thymol-equivalent UV–Vis response, total phenolic content (TPC), and gravimetric extraction yield under the conditions investigated. Although multi-response optimization identified 46 °C and 0.18 mm as a model-predicted candidate condition, experimental verification revealed discrepancies between predicted and measured responses, particularly for the thymol-equivalent response and extraction yield. Moreover, the UV–Vis method did not establish the specific identity of thymol, and the potential contribution of differences between leaf batches could not be separated from model prediction error. Therefore, the proposed condition should be regarded as a candidate for further investigation rather than as an experimentally established optimum. Further studies incorporating compound-specific chromatographic analysis, independent biological batches, and additional experimental verification are required to assess the robustness of the predicted extraction conditions.
Supplementary Materials
The following supporting information can be downloaded at https://www.mdpi.com/article/10.3390/foods15213795/s1, Table S1. Mathematical models applied to the drying curve of the study; Table S2. Values of the independent variables and their corresponding levels in the central composite design (CCD); Table S3. Diffusivity coefficient (Deff) during the drying of Plectranthus amboinicus; Table S4. Analysis of variance and regression coefficients for the cubic model fitted to the thymol-equivalent response (ppm); Table S5. Analysis of variance and regression coefficients for the cubic model fitted to total phenolic content (mg GAE g−1); Table S6. Analysis of variance and regression coefficients for the cubic model fitted to extraction yield (%); Figure S1. Calibration curves for thymol and carvacrol determined by UV–Vis spectrophotometry.
Author Contributions
D.P.-I.: Data curation/Investigation/Formal analysis/Resources/Writing—original draft/Software; D.C.D.: Validation/Supervision/Writing—original draft; O.O.-M.: Funding acquisition; R.T.-G.: Validation; D.F.T.: Conceptualization/Validation/Data curation/Resources/Formal analysis/Writing—original draft/Writing—review & editing/Visualization/Supervision/Funding acquisition/Project administration/Methodology. All authors have read and agreed to the published version of the manuscript.
Funding
This research was funded by MINCIENCIAS-SGR (Project reference BPIN 2021000100086) and Universidad Nacional de Colombia (Hermes 59276).
Institutional Review Board Statement
Not applicable.
Informed Consent Statement
Not applicable.
Data Availability Statement
The original contributions presented in this study are included in the article and Supplementary Material. Further inquiries can be directed to the corresponding author.
Acknowledgments
The authors express their gratitude to the Universidad Nacional de Colombia Sede de La Paz.
Conflicts of Interest
The authors declare no conflicts of interest.
References
- Faisal, M.; Qahtan, A.A.; Alatar, A.A. Thidiazuron Induced In Vitro Plant Regeneration, Phenolic Contents, Antioxidant Potential, GC-MS Profiles and Nuclear Genome Stability of Plectranthus amboinicus (Lour.) Spreng. Horticulturae 2023, 9, 277. [Google Scholar] [CrossRef] [Scilit]
- Coleus Amboinicus Lour. Plants of the World Online. Kew Science. Available online: https://powo.science.kew.org/taxon/urn:lsid:ipni.org:names:445902-1 (accessed on 31 August 2026).
- Khandelwal, J.; Adhlakha, M.K.; Purviya, R.P.; Sharma, G.G. Pharmacological and Therapeutic Use of Coleus Aromaticus—A Review. Int. Ayurvedic Med. J. 2024, 12, 2258–2261. [Google Scholar] [CrossRef] [Scilit]
- Filipe, M.S.; Bangay, G.; Brauning, F.Z.; Ogungbemiro, F.O.; Palma, B.B.; Díaz-Lanza, A.M.; Hassan, A.; André, R.; Rijo, P. Plectranthus amboinicus: A Systematic Review of Traditional Uses, Phytochemical Properties, and Therapeutic Applications. Pharmaceuticals 2025, 18, 707. [Google Scholar] [CrossRef] [Scilit] [PubMed]
- Ahamed, A.N.; Yaser, S.M.; Idhris, S.M.; Padusha, M.S.A.; Sherif, N.A. Phytochemical and Pharmacological Potential of the Genus Plectranthus—A Review. S. Afr. J. Bot. 2023, 154, 159–189. [Google Scholar] [CrossRef] [Scilit]
- Gulla, S.; Jabeen, S.; Thummala, C.; Lebaka, V.R.; Chinni, S.V.; Gopinath, S.C.B.; Lomada, D.; Reddy, M.C. Anti-Inflammatory, Anti-Bacterial, and Anti-Cancer Activities of Ag-Nanoparticles Generated by Plectranthus amboinicus. Inorg. Chem. Commun. 2024, 167, 112702. [Google Scholar] [CrossRef] [Scilit]
- Rodrigues, F.F.G.; Boligon, A.A.; Menezes, I.R.A.; Galvão-Rodrigues, F.F.; Salazas, G.J.T.; Nonato, C.F.A.; Braga, N.T.T.M.; Correia, F.M.A.; Caldas, G.F.R.; Coutinho, H.D.M.; et al. HPLC/DAD, Antibacterial and Antioxidant Activities of Plectranthus Species (Lamiaceae) Combined with the Chemometric Calculations. Molecules 2021, 26, 7665. [Google Scholar] [CrossRef] [Scilit] [PubMed]
- Leesombun, A.; Sungpradit, S.; Boonmasawai, S.; Weluwanarak, T.; Klinsrithong, S.; Ruangsittichai, J.; Ampawong, S.; Masmeatathip, R.; Changbunjong, T. Insecticidal Activity of Plectranthus amboinicus Essential Oil Against the Stable Fly Stomoxys Calcitrans (Diptera: Muscidae) and the Horse Fly Tabanus Megalops (Diptera: Tabanidae). Insects 2022, 13, 255. [Google Scholar] [CrossRef] [Scilit] [PubMed]
- Gurning, K.; Kurniawan, Y.S.; Silitonga, F.S.; Primahana, G.; Astuti, E.; Haryadi, W. Exploration of Isolated Actives from Coleus amboinicus Leaves as Anticancer Agents: In Vitro Testing, Network Pharmacology Studies, and Molecular Docking. Sci. Rep. 2025, 15, 34445. [Google Scholar] [CrossRef] [Scilit] [PubMed]
- Dinakarkumar, Y.; Theivendren, P.; Al Lohedan, H.; Ramya, K.; Senthamarai, K.J.; Arokiyaraj, S.; Rajabathar, J.R. Therapeutic Potential of Coleus amboinicus Mediated Green Caesium Carbonate Nanoparticles: A Combined Experimental and Computational Approach. Surf. Interfaces 2025, 76, 107825. [Google Scholar] [CrossRef] [Scilit]
- Pinheiro, G.P.; Graciano, D.d.S.; Mayer, J.L.S.; Hantao, L.W.; Sawaya, A.C.H.F. Glandular trichomes of Coleus amboinicus Lour. and the effect of developmental stage on leaf headspace volatile composition. S. Afr. J. Bot. 2023, 152, 136–146. [Google Scholar] [CrossRef] [Scilit]
- Pinheiro, P.F.; Costa, A.V.; Alves, T.d.A.; Galter, I.N.; Pinheiro, C.A.; Pereira, A.F.; Oliveira, C.M.R.; Fontes, M.M.P. Phytotoxicity and Cytotoxicity of Essential Oil from Leaves of Plectranthus amboinicus, Carvacrol, and Thymol in Plant Bioassays. J. Agric. Food Chem. 2015, 63, 8981–8990. [Google Scholar] [CrossRef] [Scilit] [PubMed]
- Michalaki, A.; Karantonis, H.C.; Kritikou, A.S.; Thomaidis, N.S.; Dasenaki, M.E. Ultrasound-Assisted Extraction of Total Phenolic Compounds and Antioxidant Activity Evaluation from Oregano (Origanum vulgare ssp. hirtum) Using Response Surface Methodology and Identification of Specific Phenolic Compounds with HPLC-PDA and Q-TOF-MS/MS. Molecules 2023, 28, 2033. [Google Scholar] [CrossRef] [Scilit] [PubMed]
- Ayala-Aponte, A.A.; Cárdenas-Nieto, J.D.; Tirado, D.F. Aloe vera Gel Drying by Refractance Window®: Drying Kinetics and High-Quality Retention. Foods 2021, 10, 1445. [Google Scholar] [CrossRef] [Scilit] [PubMed]
- Muruganantham, P.; Kamalakannan, K.; Sathyamurthy, R.; Sundaram, K.M. Performance Analysis of a Tubular Solar Dryer for Drying Mexican Mint (Plectranthus amboinicus)—An Experimental Approach. Energy Rep. 2021, 7, 7–12. [Google Scholar] [CrossRef] [Scilit]
- Alara, O.R.; Abdurahman, N.H.; Ukaegbu, C.I. Extraction of Phenolic Compounds: A Review. Curr. Res. Food Sci. 2021, 4, 200–214. [Google Scholar] [CrossRef] [Scilit] [PubMed]
- Zahari, N.A.A.R.; Chong, G.H.; Abdullah, L.C.; Chua, B.L. Ultrasonic-Assisted Extraction (UAE) Process on Thymol Concentration from Plectranthus amboinicus Leaves: Kinetic Modeling and Optimization. Processes 2020, 8, 322. [Google Scholar] [CrossRef] [Scilit]
- Caputo, L.; Amato, G.; de Bartolomeis, P.; De Martino, L.; Manna, F.; Nazzaro, F.; De Feo, V.; Barba, A.A. Impact of Drying Methods on the Yield and Chemistry of Origanum vulgare L. Essential Oil. Sci. Rep. 2022, 12, 3845. [Google Scholar] [CrossRef] [Scilit] [PubMed]
- Thomas, D.J.; Rainbow, J.; Bartley, L.E. The Rapid-Tome, a 3D-Printed Microtome, and an Updated Hand-Sectioning Method for High-Quality Plant Sectioning. Plant Methods 2023, 19, 12. [Google Scholar] [CrossRef] [Scilit] [PubMed]
- Doolabh, K.; Naidoo, Y.; Dewir, Y.H.; Al-Suhaibani, N. Micromorphology, Ultrastructure and Histochemistry of Commelina benghalensis L. Leaves and Stems. Plants 2021, 10, 512. [Google Scholar] [CrossRef] [Scilit] [PubMed]
- Wyrwisz, J.; Moczkowska-Wyrwisz, M.; Kurek, M.A. Development of Modified Gas Composition for Atmosphere Packaging of Sliced Apple Chips. Appl. Sci. 2025, 15, 2832. [Google Scholar] [CrossRef] [Scilit]
- AOAC International Official Methods of Analysis of AOAC INTERNATIONAL, 22nd ed.; AOAC International: Rockville, MD, USA, 2023.
- Elwakeel, A.E.; Oraiath, A.A.T.; Ghanem, T.H.M.; Elbeltagi, A.; Salem, A.; Dewidar, A.Z.; Okasha, A.M.; Habib, A.; El-Messery, T.M.; Moustapha, M.E.; et al. Mathematical Modeling, Drying Kinetics, and Economic Analysis of a Hybrid Photovoltaic Thermal Solar Dryer for Henna Leaves. Sci. Rep. 2025, 15, 21392. [Google Scholar] [CrossRef] [Scilit] [PubMed]
- Mbegbu, N.N.; Ojediran, J.O.; Nwajinka, C.O.; Chukwuma, E.C.; Aniobi, M. Thin Layer Drying and Effect of Temperature on the Drying Characteristics of Bushbuck (Gongronema latifolium) Leaves. J. Agric. Food Res. 2024, 18, 101379. [Google Scholar] [CrossRef] [Scilit]
- Overhults, D.G.; White, G.M.; Hamilton, H.E.; Ross, I.J. Drying Soybeans with Heated Air. Trans. ASAE 1973, 16, 0112–0113. [Google Scholar] [CrossRef] [Scilit]
- Henderson, S.; Pabis, S. Grain Drying Theory. 1. Temperature Effect on Drying Coefficient. J. Agric. Eng. Res. 1961, 6, 169–174. [Google Scholar]
- Yagcioglu, A.; Degirmencioglu, A.; Cagatay, F. Drying Characteristics of Laurel Leaves Under Different Drying Conditions. In Proceedings of the 7th International Congress on Agricultural Mechanization and Energy, Adana, Turkey, 26–27May 1999; Bascetincelik, A., Ed.; Faculty of Agriculture, Çukurova University: Adana, Turkey, 1999; pp. 565–569. [Google Scholar]
- Midilli, A.; Kucuk, H.; Yapar, Z. A New Model for Single-Layer Drying. Dry. Technol. 2002, 20, 1503–1513. [Google Scholar] [CrossRef] [Scilit]
- Crank, J. The Mathematics of Diffusion, 2nd ed.; Clarendon Press: Oxford, UK, 1975. [Google Scholar]
- Zohdy, M.H.; El-Kamel, A.H.; Alseqely, M.; Bakr, B.A.; Heikal, L.A. Bilosomal Delivery of Thymol-Glycyrrhetinic Acid: A Multifaceted Strategy to Combat Multidrug-Resistant Wound Infections. J. Pharm. Investig. 2026, 56, 367–391. [Google Scholar] [CrossRef] [Scilit]
- Ramos, M.; Beltran, A.; Fortunati, E.; Peltzer, M.; Cristofaro, F.; Visai, L.; Valente, A.J.M.; Jiménez, A.; Kenny, J.M.; Garrigós, M.C. Controlled Release of Thymol from Poly(Lactic Acid)-Based Silver Nanocomposite Films with Antibacterial and Antioxidant Activity. Antioxidants 2020, 9, 395. [Google Scholar] [CrossRef] [Scilit] [PubMed]
- Zeng, Z.; Han, C.; Wang, Q.; Yuan, H.; Zhang, X.; Li, B. Analysis of Drying Characteristic, Effective Moisture Diffusivity and Energy, Exergy and Environment Performance Indicators during Thin Layer Drying of Tea in a Convective-Hot Air Dryer. Front. Sustain. Food Syst. 2024, 8, 1371696. [Google Scholar] [CrossRef] [Scilit]
- Mbegbu, N.N.; Nwajinka, C.O.; Amaefule, D.O. Thin Layer Drying Models and Characteristics of Scent Leaves (Ocimum gratissimum) and Lemon Basil Leaves (Ocimum africanum). Heliyon 2021, 7, e05945. [Google Scholar] [CrossRef] [Scilit] [PubMed]
- Kahraman, O.; Malvandi, A.; Vargas, L.; Feng, H. Drying Characteristics and Quality Attributes of Apple Slices Dried by a Non-Thermal Ultrasonic Contact Drying Method. Ultrason. Sonochem. 2021, 73, 105510. [Google Scholar] [CrossRef] [Scilit] [PubMed]
- Dajbych, O.; Kabutey, A.; Mizera, Č.; Sedláček, A.; Herak, D. Effect of Diffusion Path Lengths on Effective Moisture Diffusivity and Activation Energy of Red Delicious Apple Slices Under Convective Drying. Processes 2026, 14, 2015. [Google Scholar] [CrossRef] [Scilit]
- Chasiotis, V.; Tzempelikos, D.; Mitrakos, D.; Filios, A. Numerical and Experimental Analysis of Heat and Moisture Transfer of Lavandula x Allardii Leaves during Non-Isothermal Convective Drying. J. Food Eng. 2021, 311, 110708. [Google Scholar] [CrossRef] [Scilit]
- Castillo-Téllez, M.; Martínez, O.S.; Miranda-Mandujano, E.; Galvez, G.H.; López, D.A.; Castillo-Téllez, B.; Cetina-Quiñones, A.J. Solar Drying of Oregano Leaves (Plectranthus amboinicus, Lour): Analysis of Experimental Performance under a Tropical Climate. Energy Explor. Exploit. 2024, 42, 1895–1921. [Google Scholar] [CrossRef] [Scilit]
- Rout, R.K.; Kumar, A.; Rao, P.S. A Comparative Assessment of Drying Kinetics, Energy Consumption, Mathematical Modeling, and Multivariate Analysis of Indian Borage (Plectranthus amboinicus) Leaves. J. Food Process Eng. 2024, 47, e14630. [Google Scholar] [CrossRef] [Scilit]
- Guo, H.-L.; Chen, Y.; Xu, W.; Xu, M.-T.; Sun, Y.; Wang, X.-C.; Wang, X.-Y.; Luo, J.; Zhang, H.; Xiong, Y.-K. Assessment of Drying Kinetics, Textural and Aroma Attributes of Mentha haplocalyx Leaves during the Hot Air Thin-Layer Drying Process. Foods 2022, 11, 784. [Google Scholar] [CrossRef] [Scilit] [PubMed]
- Chaves, R.P.F.; Araújo, A.L.d.; Lopes, A.S.; Pena, R.d.S. Convective Drying of Purple Basil (Ocimum basilicum L.) Leaves and Stability of Chlorophyll and Phenolic Compounds during the Process. Plants 2023, 12, 127. [Google Scholar] [CrossRef] [Scilit] [PubMed]
- Pandiselvam, R.; Aydar, A.Y.; Kutlu, N.; Aslam, R.; Sahni, P.; Mitharwal, S.; Gavahian, M.; Kumar, M.; Raposo, A.; Yoo, S.; et al. Individual and Interactive Effect of Ultrasound Pre-Treatment on Drying Kinetics and Biochemical Qualities of Food: A Critical Review. Ultrason. Sonochem. 2023, 92, 106261. [Google Scholar] [CrossRef] [Scilit] [PubMed]
- Mabasso, G.A.; Cabral, J.C.O.; Barbosa, K.F.; Resende, O.; de Oliveira, D.E.C.; de Almeida, A.B. Drying Kinetics, Thermodynamic Properties and Physicochemical Characteristics of Rue Leaves. Sci. Rep. 2024, 14, 14526. [Google Scholar] [CrossRef] [Scilit] [PubMed]
- Kusuma, H.S.; Al Lantip, G.I.; Mutiara, X.; Iqbal, M. Evaluation of Mini Bibliometric Analysis, Moisture Ratio, Drying Kinetics, and Effective Moisture Diffusivity in the Drying Process of Clove Leaves Using Microwave-Assisted Drying. Appl. Food Res. 2023, 3, 100304. [Google Scholar] [CrossRef] [Scilit]
- Kosakowska, O.; Bączek, K.; Przybył, J.L.; Pawełczak, A.; Rolewska, K.; Węglarz, Z. Morphological and Chemical Traits as Quality Determinants of Common Thyme (Thymus vulgaris L.), on the Example of ‘Standard Winter’ Cultivar. Agronomy 2020, 10, 909. [Google Scholar] [CrossRef] [Scilit]
- Kurin, E.; Dokupilová, K.; Kostovčíková, E.; Slobodníková, L.; Drobná, E.; Čičová, I.; Lachová, V.B.; Sabová, J.; Gál, P.; Nagy, M.; et al. Bioactive Potential of Origanum Vulgare Rhizomes: Phenolic Composition, Antioxidant, Antibacterial, and Cytotoxicity Profiles. Food Sci. Nutr. 2026, 14, e71413. [Google Scholar] [CrossRef] [Scilit] [PubMed]
- Azimzadeh, Z.; Hassani, A.; Mandoulakani, B.A.; Sepehr, E.; Morshedloo, M.R. Intraspecific Divergence in Essential Oil Content, Composition and Genes Expression Patterns of Monoterpene Synthesis in Origanum vulgare Subsp. Vulgare and Subsp. Gracile under Salinity Stress. BMC Plant Biol. 2023, 23, 380. [Google Scholar] [CrossRef] [Scilit] [PubMed]
- Rad, S.B.; Mumivand, H.; Mollaei, S.; Khadivi, A. Effect of Drying Methods on Phenolic Compounds and Antioxidant Activity of Capparis spinosa L. Fruits. BMC Plant Biol. 2025, 25, 133. [Google Scholar] [CrossRef] [Scilit] [PubMed]
- Jangpangi, D.; Patni, B.; Chandola, V.; Chandra, S. Medicinal Plants in a Changing Climate: Understanding the Links between Environmental Stress and Secondary Metabolite Synthesis. Front. Plant Sci. 2025, 16, 1587337. [Google Scholar] [CrossRef] [Scilit] [PubMed]

Disclaimer/Publisher’s Note: The statements, opinions and data contained in all publications are solely those of the individual author(s) and contributor(s) and not of MDPI and/or the editor(s). MDPI and/or the editor(s) disclaim responsibility for any injury to people or property resulting from any ideas, methods, instructions or products referred to in the content. |
© 2026 by the authors. Licensee MDPI, Basel, Switzerland. This article is an open access article distributed under the terms and conditions of the Creative Commons Attribution (CC BY) license.