


Abstract
The economic impact of food fraud is difficult to quantify precisely, because fraud is structurally designed to evade detection; available estimates are indirect projections rather than direct forensic accounting and are commonly cited in the range of USD 10–15 billion annually. The integration of artificial intelligence (AI) with analytical instrumentation has generated a rapidly expanding body of research aimed at detecting adulteration, mislabeling, and substitution across food matrices. This systematic review examines the extent to which AI-assisted instrumental technologies contribute to food fraud prevention (as distinct from laboratory detection) and characterizes the structural factors that constrain real-world translation. A systematic search of the peer-reviewed literature published between 2021 and 2026 yielded 83 eligible records (80 primary studies and 3 review articles) after applying predefined inclusion criteria. Data were extracted into a structured seven-sheet workbook covering study characteristics, instrumental technologies, AI architectures, performance metrics, industrial-validation status, implementation evidence, and methodological quality. The corpus shows consistently high reported analytical accuracy under controlled laboratory conditions (median of extractable classification accuracies ≈ 99–100%; ≥95% in 86% of studies with an extractable value). At the same time, 68 of 83 studies (82%) reported no external validation, no study (0/83) achieved inter-laboratory validation, no study documented routine-monitoring application, and only one study reported testing in a genuine industrial environment. The most frequently featured platforms were NIR spectroscopy and electronic-nose arrays (each featuring in 30/83 studies, frequently in data-fusion combinations), followed by gas-chromatography-based systems (16/83) and hyperspectral imaging (13/83). Classical machine learning predominated (57/83 studies coded as classical ML, with a further 11 hybrid ML/DL designs and 12 deep-learning-only designs). A direct statistical comparison found no significant difference in reported accuracy between classical-ML and deep-learning studies (median 100% vs. 98.2%; Mann–Whitney U test, p = 0.16). A pre-specified test of the hypothesis that high reported accuracy is itself a marker of overfitting was not supported by the corpus: reported accuracy was not negatively associated with external-validation status (Fisher’s exact p = 0.51) or with methodological-quality score (Spearman ρ = 0.15, p = 0.23). Methodological quality was predominantly moderate (49/83 scored 3/5; 22 scored 2/5; 11 scored 4/5; one study scored 5/5), and 19/83 (23%) carried a high risk of bias. The review’s central observation—a measurable gap between demonstrated laboratory detection and evidenced real-world prevention—is well supported by the deployment, inter-laboratory, and routine-monitoring data. We deliberately separate this strongly evidenced conclusion from weaker inferences (e.g., the overfitting hypothesis) that the corpus cannot currently establish, and we outline a validation-driven, deployment-oriented research agenda.
1. Introduction
1.1. The Persistent Problem of Food Fraud
Food fraud—defined as the deliberate and intentional substitution, addition, tampering, or misrepresentation of food, food ingredients, or food packaging for economic gain—constitutes one of the most complex challenges confronting contemporary food safety governance. Unlike food safety failures resulting from unintentional contamination, food fraud is characterized by intentionality, economic motivation, and systematic evasion of existing detection mechanisms. Its manifestations range from geographic origin misrepresentation [1,2,3] and species substitution [4,5,6,7] to adulteration with chemically similar compounds [8,9,10,11], dilution with economically motivated adulterants [12,13,14,15], and addition of unauthorized synthetic compounds [16,17,18].
Global estimates place annual costs in the order of USD 10–15 billion [19], with cascading effects on consumer health, trade, and regulatory credibility. High-value commodities—olive oil, honey, spices, premium teas, dairy, and edible oils—are disproportionately targeted, a pattern mirrored by the matrices that dominate the present corpus (oils and fats, dairy, teas, spices, and honey) [9,10,14,15,20,21,22,23].
The detection challenge is compounded by the increasing chemical sophistication of fraudulent practices. Geographic-origin fraud exploits overlapping chemical profiles across origins (e.g., soybean origin classification [1]); substitution of premium oils with cheaper vegetable oils requires methods that resolve chemically similar lipid profiles (e.g., camellia oil [11,24]); and adulteration of teas with synthetic pigments at concentrations as low as 0.1% [16] demands analytical sensitivity near regulatory margins. These pressures have driven substantial investment in AI-assisted analytical systems.
1.2. The Rise of AI-Assisted Detection
The 2021–2026 period shows an accelerating convergence of analytical chemistry, instrumental spectroscopy, and machine learning in food authenticity. Publication volume in this corpus grew from two records in 2021 to 36 in 2025, with 16 already indexed in the first months of 2026. The most frequently featured analytical platform is NIR spectroscopy [2,9,10,15,17,23,25,26,27,28], valued for non-destructive, rapid, and relatively low-cost measurement; it is complemented by electronic-nose arrays [1,3,8,12,29,30,31,32,33,34], hyperspectral imaging, and increasingly by multi-sensor data-fusion architectures [4,11,28,31,34,35,36].
Classical algorithms—Support Vector Machines (SVM), Random Forest (RF), and Artificial Neural Networks (ANN)—dominate the methodological landscape, while deep-learning architectures (CNNs, Transformers, and hybrids) form a smaller but growing share [1,6,11,18,24,30,35,37,38,39,40,41,42,43,44]. Reported performance is consistently high, and this has generated considerable optimism about AI’s potential to transform fraud detection. As shown in Section 3, however, this optimism is concentrated almost entirely in internal performance, with limited evidence on external or operational performance.
1.3. The Central Research Question and Its Conceptual Frame
Despite analytical optimism, one question remains systematically under-addressed: to what extent do these systems contribute to the prevention of food fraud in real supply chains? Detection under controlled laboratory conditions—authenticated reference samples, known adulterant concentrations, single origins, and optimized instruments—is methodologically tractable. Prevention additionally requires validation across the variability of real supply chains, integration into enforcement workflows, economic viability for routine deployment, and robustness across instruments, laboratories, seasons, and origins.
This review addresses three questions: (1) What is the actual state of external validation and independent-dataset use in AI-driven food-fraud detection research? (2) What is the evidence for industrial implementation and regulatory integration? (3) What structural factors plausibly explain any gap between laboratory performance and real-world prevention impact? We treat (1) and (2) as primarily empirical questions answerable from the workbook, and (3) as an interpretive question on which we report both supporting and countervailing evidence.
1.4. From Analytical Accuracy to Decision-Theoretic Utility
A frequently overlooked dimension is the distinction between analytical accuracy and decision-theoretic utility. Metrics such as accuracy, AUC, or R2 quantify predictive performance under controlled conditions, but they do not directly translate into actionable decisions in regulatory or industrial environments, where detection operates under asymmetric error costs: false negatives may allow fraudulent products into the supply chain, whereas false positives may cause unnecessary economic loss and trade disruption. The operational value of a detector depends on the prior probability of fraud in a given context and on the cost structure of errors—parameters that, in this corpus, are not explicitly modeled in any study. This is a genuine conceptual limitation; we are careful, however, not to overstate it as evidence that deployed performance would necessarily collapse, since the corpus provides little direct measurement either way.
1.5. Objectives
The primary objective is to assess the contribution of AI-assisted instrumental technologies to food-fraud prevention and to characterize the limitations constraining translation from laboratory proof-of-concept to operational deployment. Secondary objectives are to characterize the distribution of analytical technologies and AI architectures; quantify the frequency and rigor of external validation; map the landscape of industrial and regulatory implementation evidence; statistically compare classical-ML and deep-learning performance; test directly whether high reported accuracy is associated with weaker validation; and evaluate methodological quality using a structured risk-of-bias framework.
2. Methods
2.1. Protocol and Registration
The review was conducted in accordance with the PRISMA 2020 guidelines for systematic reviews and meta-analyses. To ensure methodological transparency and reproducibility, the review protocol was prospectively deposited in Zenodo prior to study selection and data extraction (DOI: 10.5281/zenodo.20785718). The protocol predefined the research questions, eligibility criteria, search strategy, data extraction framework, methodological quality assessment procedures, and planned statistical analyses. The final database search was conducted on 12 June 2026.
2.2. Eligibility Criteria
Studies were eligible if they (1) reported at least one quantitative performance metric (accuracy, precision, recall, F1, AUC, R2, RMSE, or equivalent); (2) applied one or more AI/ML methods to a food-authentication, adulteration-detection, or fraud-related classification or regression problem; (3) described the instrumental technology used for data acquisition; (4) were published in peer-reviewed journals between January 2021 and June 2026; and (5) were available in English or provided sufficient tabular/graphical data for extraction. Review articles were retained when they offered meta-level analytical insight relevant to the review question. Studies were excluded if they addressed food-safety problems unrelated to fraud, reported only in vitro work, were conference abstracts lacking methodological detail, or addressed post-market surveillance without an AI modeling component.
2.3. Search Strategy and Study Selection
The search spanned Scopus/ScienceDirect, PubMed, IEEE Xplore, and MDPI (publisher platform searched supplementarily) databases using combinations of terms, including ‘food fraud detection’, ‘food adulteration’, ‘food authentication’, ‘machine learning food’, ‘deep learning food fraud’, ‘NIR spectroscopy adulteration’, ‘electronic nose food’, ‘hyperspectral imaging food fraud’, ‘AI food quality’, and ‘chemometrics adulteration’ as shown in Table 1. The final corpus comprised 83 eligible records published between 2021 and 2026 across 18 peer-reviewed journals. A representative Boolean expression is shown below and the complete strategy adapted to each base with its filters/limits are available in the Supplementary Materials.
Table 1.
General and specific Boolean equation.
2.4. Data Extraction
All 83 records were independently double-extracted by two reviewers working in parallel, each blinded to the other’s coding, using the same predefined seven-sheet framework. After independent extraction, the two coding sets were compared field by field, and discrepancies were reconciled by consensus; the agreed values were used for all downstream analyses. Inter-rater reliability was quantified on the six evaluative judgments of Sheet S7 (the fields requiring assessment rather than verbatim transcription). Inter-rater agreement on the six Sheet S7 judgments was high (96.6% overall; Cohen’s κ 0.83–1.00, “almost perfect” by Landis–Koch; PABAK 0.91–1.00), with all 17 discrepancies resolved by consensus.
Data were extracted independently and two reviewers assess the risk of bias of each study and its independence using a structured seven-domain framework operationalized as a seven-sheet Excel workbook: (Sheet S1) Study Information—authors, year, journal, country, food matrix, fraud type, sample size, and funding; (Sheet S2) Instrumental Technology—sensor type, specific instrument, target compounds, sample preparation, preprocessing, and measurement conditions; (Sheet S3) AI Models—algorithm category, specific model, input/output variables, training strategy, cross-validation, external validation, and software; (Sheet S4) Performance Metrics—accuracy, R2, RMSE, AUC, F1, sensitivity, specificity, and overfitting discussion; (Sheet S5) Industrial Validation—pilot-scale testing, industrial environment testing, inter-laboratory validation, real supply chain samples, TRL, industrial partners, cost analysis, and scalability; (Sheet S6) Implementation Evidence—routine monitoring application, regulatory integration, adoption barriers, economic constraints, technical expertise required, time-to-result, standard method comparison, and author conclusions; (Sheet S7) Methodological Quality—sample size adequacy, dataset diversity, preprocessing clarity, validation strategy robustness, risk of bias, and overall quality score (1–5).
2.5. Methodological Quality Assessment and Its Calibration
Quality was assessed with a five-point structured rubric over six domains: sample-size adequacy (adequate if n ≥ 150 total, or justified by design), dataset diversity (geographic, seasonal, and source diversity), preprocessing-description clarity, validation-strategy robustness (external validation weighted most heavily and treated as the pivotal criterion), risk-of-bias categorization (Low/Low–Moderate/Moderate/High), and an overall composite score from 1 (critically limited) to 5 (exemplary). The full decision matrix and modifier flags are provided as Supplementary Table S7. The justification, sensitivity, and potential over-restrictiveness of these thresholds are examined explicitly in Section 4.6. The full classification framework is summarized in Table 2.
Table 2.
Risk of bias classification framework.
2.6. Statistical Analysis
To move beyond narrative synthesis, three pre-specified quantitative analyses were conducted on values extracted verbatim from the workbook. (i) A representative classification accuracy per study was taken as the maximum reported classification accuracy in the Performance-Metrics sheet (values constrained to 50–100%); studies reporting only regression metrics were excluded from accuracy comparisons. (ii) Classical-ML versus deep-learning accuracy was compared with the Mann–Whitney U test (two-sided). (iii) The association between high reported accuracy and validation rigor was tested with Fisher’s exact test (accuracy ≥ 99% vs. <99% × robust-validation Y/N) and with Spearman correlation (accuracy vs. quality score). These analyses are descriptive of the literature; because external performance is rarely reported, they characterize reporting patterns rather than true generalization. Statistical analysis was performed using Python 3.14.5.
Formal GRADE certainty rating was not applied, as the review does not synthesize a comparative intervention-effect estimate; its principal outcomes are descriptive characterizations of reporting practice (external-validation frequency, deployment counts). Confidence in the body of evidence is instead conveyed through the six-domain risk-of-bias framework (Table 3), the threshold sensitivity analysis (Section 4.6), and the explicit distinction—maintained throughout Results and Discussion—between interpretation-independent counts and weaker inferential claims.
Table 3.
Field-level criteria of the risk-of-bias framework (condensed). Decision matrix: Low = all four Y; Moderate = robust validation plus ≥2 of remaining Y, or strong design with n ≥ 150 but validation N; High = validation N with ≥2 remaining N, or n < 50.
3. Results
3.1. Study Selection and General Characteristics
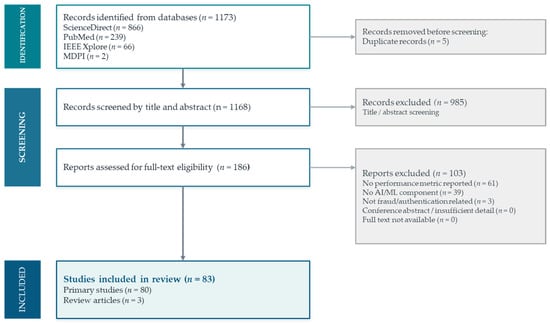
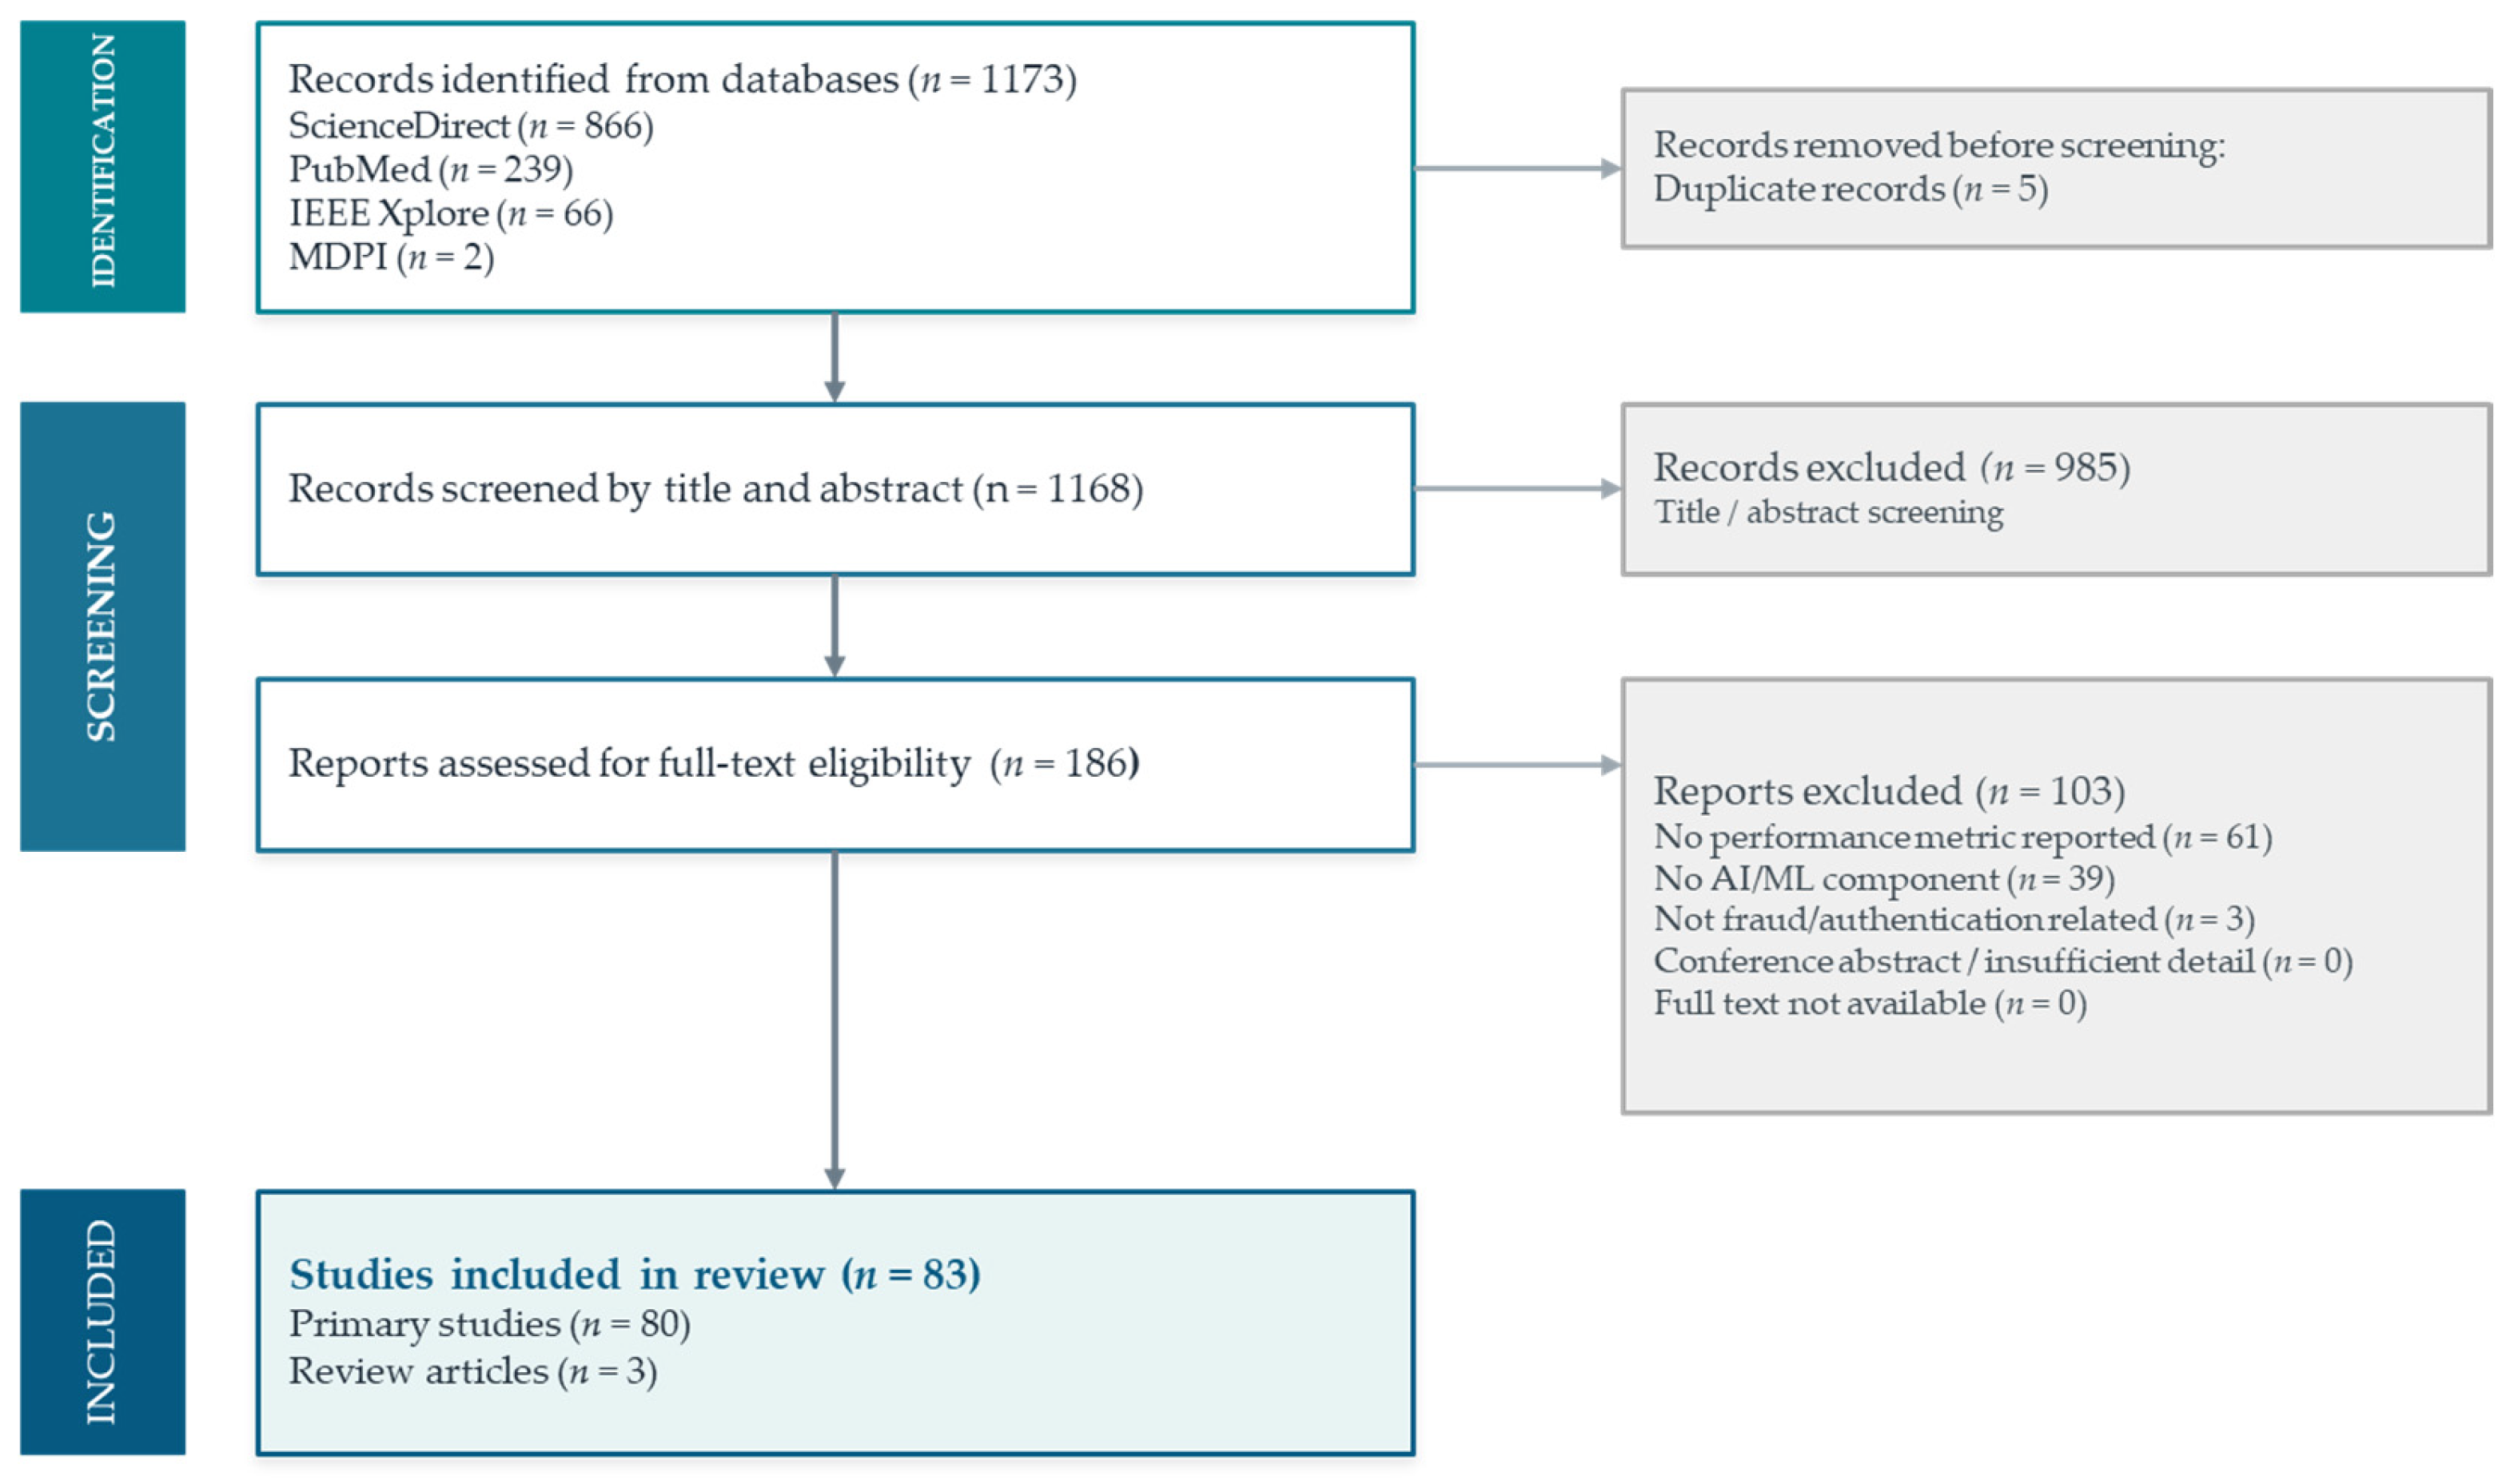
The final corpus comprised 83 records (See PRISMA diagram, Figure 1) across 18 peer-reviewed journals. The temporal distribution showed marked acceleration: two records in 2021, five in 2022, six in 2023, 18 in 2024, 36 in 2025, and 16 in early 2026. The leading venues were Food Chemistry (18 records, 22%), Journal of Food Composition and Analysis (10, 12%), Food Control (6, 7%), and LWT—Food Science and Technology (6, 7%), reflecting the field’s position at the intersection of analytical chemistry and computational science.
Figure 1.
PRISMA 2020 flow diagram.
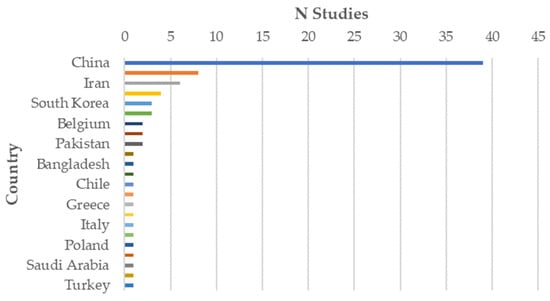
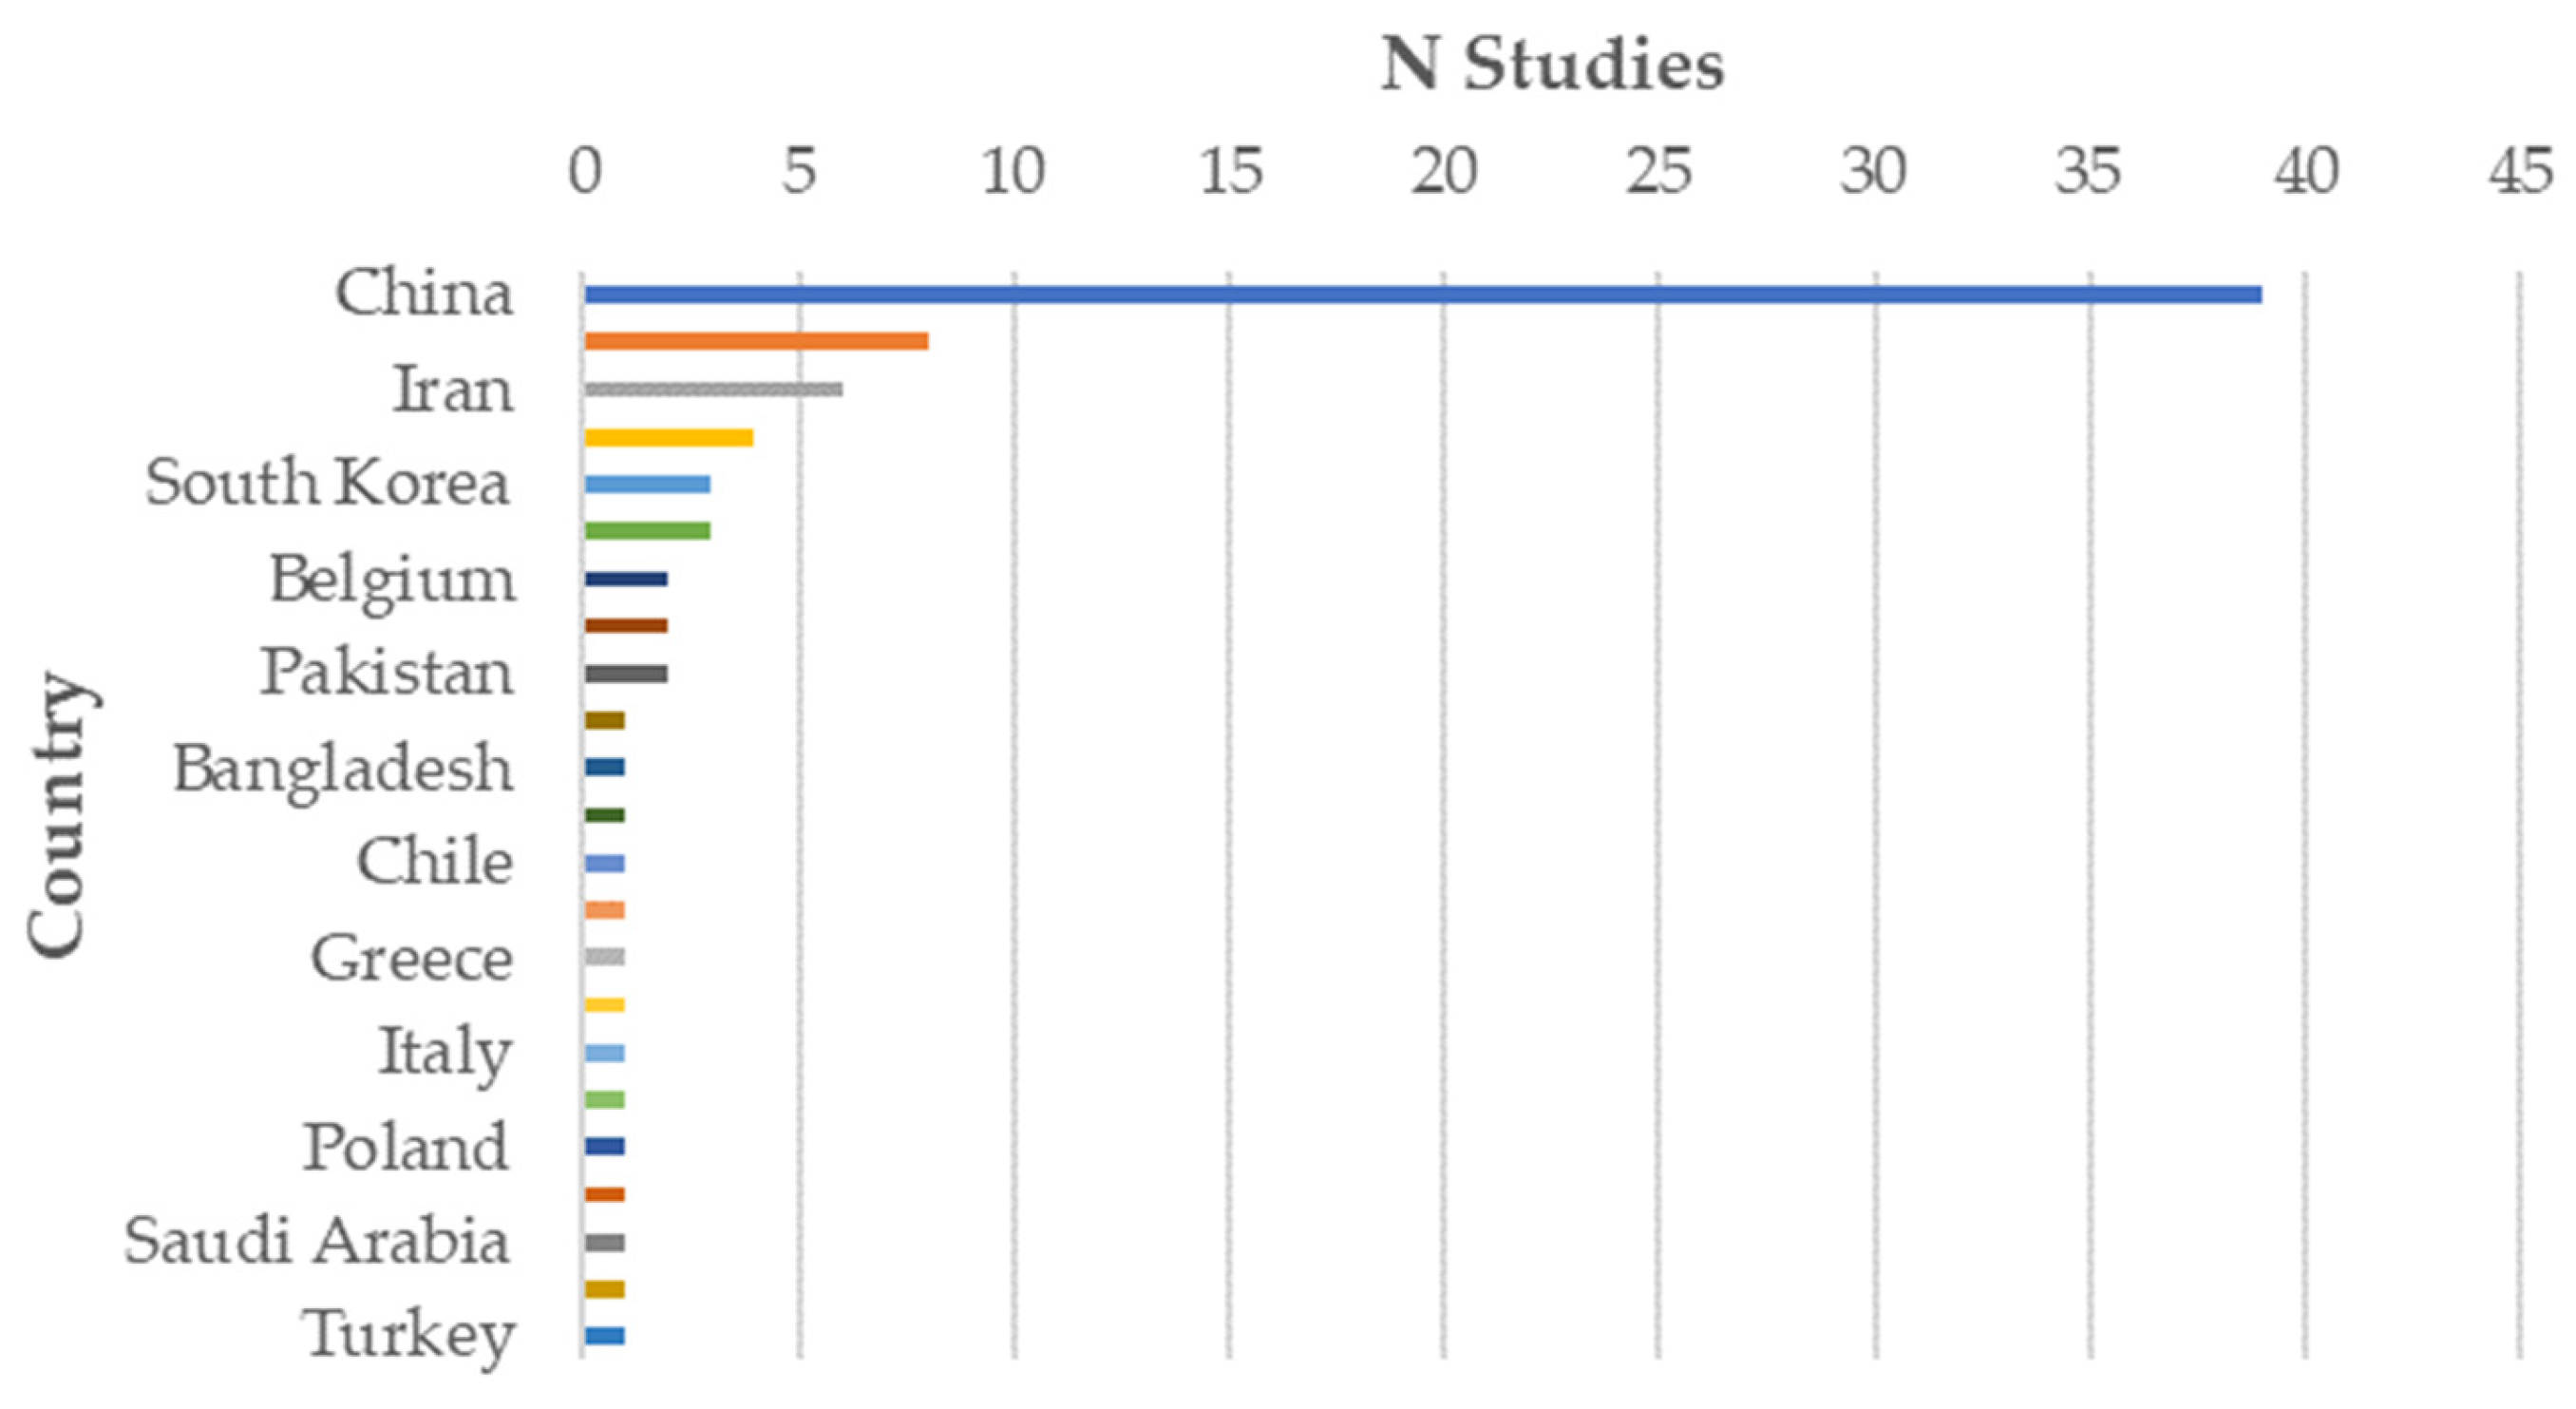
Geographically, China dominated with 38 records (46%), followed by India (8), Iran (6), Spain (4), South Korea (3), and the USA (3), with single-study contributions from many other countries. This concentration is consistent with the broader global distribution of food-science output, but it does raise generalizability questions, since fraud patterns, adulterant availability, and regulatory contexts differ across regions, as shown in Figure 2 and Table 4.
Figure 2.
Number of studies per country.
Food matrices were diverse, spanning oils and fats (olive [10,45], camellia [11,24], sesame [8,46], peanut [47], avocado [22], vegetable oils [37,48,49]), dairy (milk [12,15,50,51], milk powder [43,52], tallow [53]), beverages and teas (black/green tea [16,20,21,35], herbal/medicinal teas [31,36], spirits [54], wine [55]), meat and poultry (beef [6,56,57], pork [5,58], goose [4], lamb [42]), spices (turmeric [2,17], saffron [59], black pepper [60], cinnamon [27,61], chilli [3,44]), honey [14,62,63,64,65], rice [66,67,68], and others.
Table 4.
Summary of key indicators (recomputed from the 83-record workbook).
3.2. Instrumental Technologies
Because many studies combine sensors in data-fusion designs, technologies are reported here as the number of studies in which each platform features (counts therefore overlap). NIR spectroscopy featured in 30/83 studies [2,6,9,10,14,15,16,17,21,23,25,26,27,28,31,35,48,52,55,57,60,63,65,66,70,71,72,73,74] and electronic-nose arrays in 30/83 [1,2,3,4,8,12,21,22,29,30,31,32,33,34,35,36,39,41,58,64,66,69,70,71,72,75,76,77]; gas-chromatography-based systems in 16 [4,11,12,20,22,29,33,39,40,41,42,47,48,69,77,78]; hyperspectral imaging in 13 [9,10,13,16,48,52,57,60,62,73,74,79]; computer-vision/imaging in 15 [18,27,28,43,44,56,57,67,68,71,72,75,76,80,81]; mass spectrometry in seven [7,11,36,41,70,72,82]; FTIR in seven [11,24,37,50,54,55,83]; electrochemical/electronic-tongue in nine [4,32,34,35,36,42,70,72,84]; and UV–Vis/fluorescence [14,45,49] and dielectric/microwave [46,51] platforms in smaller numbers. NIR’s prevalence reflects non-destructive, rapid, low-preparation measurement and the availability of portable instruments suitable for field screening (e.g., the NeoSpectra-class miniaturized sensor used in [17] for turmeric, and the Vis–NIR LED multispectral sensor in [28] for coconut sugar).
A notable trend is the rise of multi-sensor data fusion, which several studies report as outperforming single-sensor baselines. Ren et al. [35] combined NIR, electronic eye, electronic tongue, and electronic nose in a CNN framework, reporting 99.14% on the prediction set; Song et al. [11] reported that mid-level fusion of LA-REIMS lipidomic fingerprints with GC fatty-acid data reached 99.56% classification accuracy for camellia-oil adulteration, exceeding either platform alone.
3.3. AI Models and Algorithms
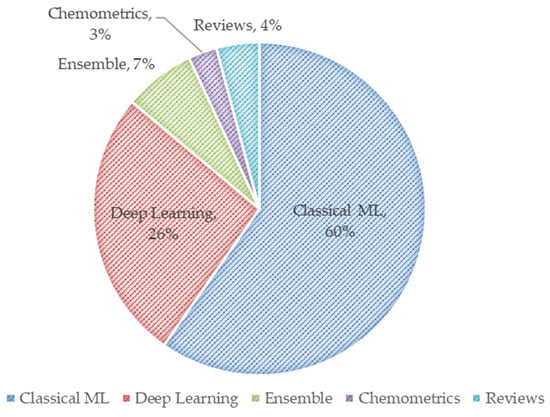
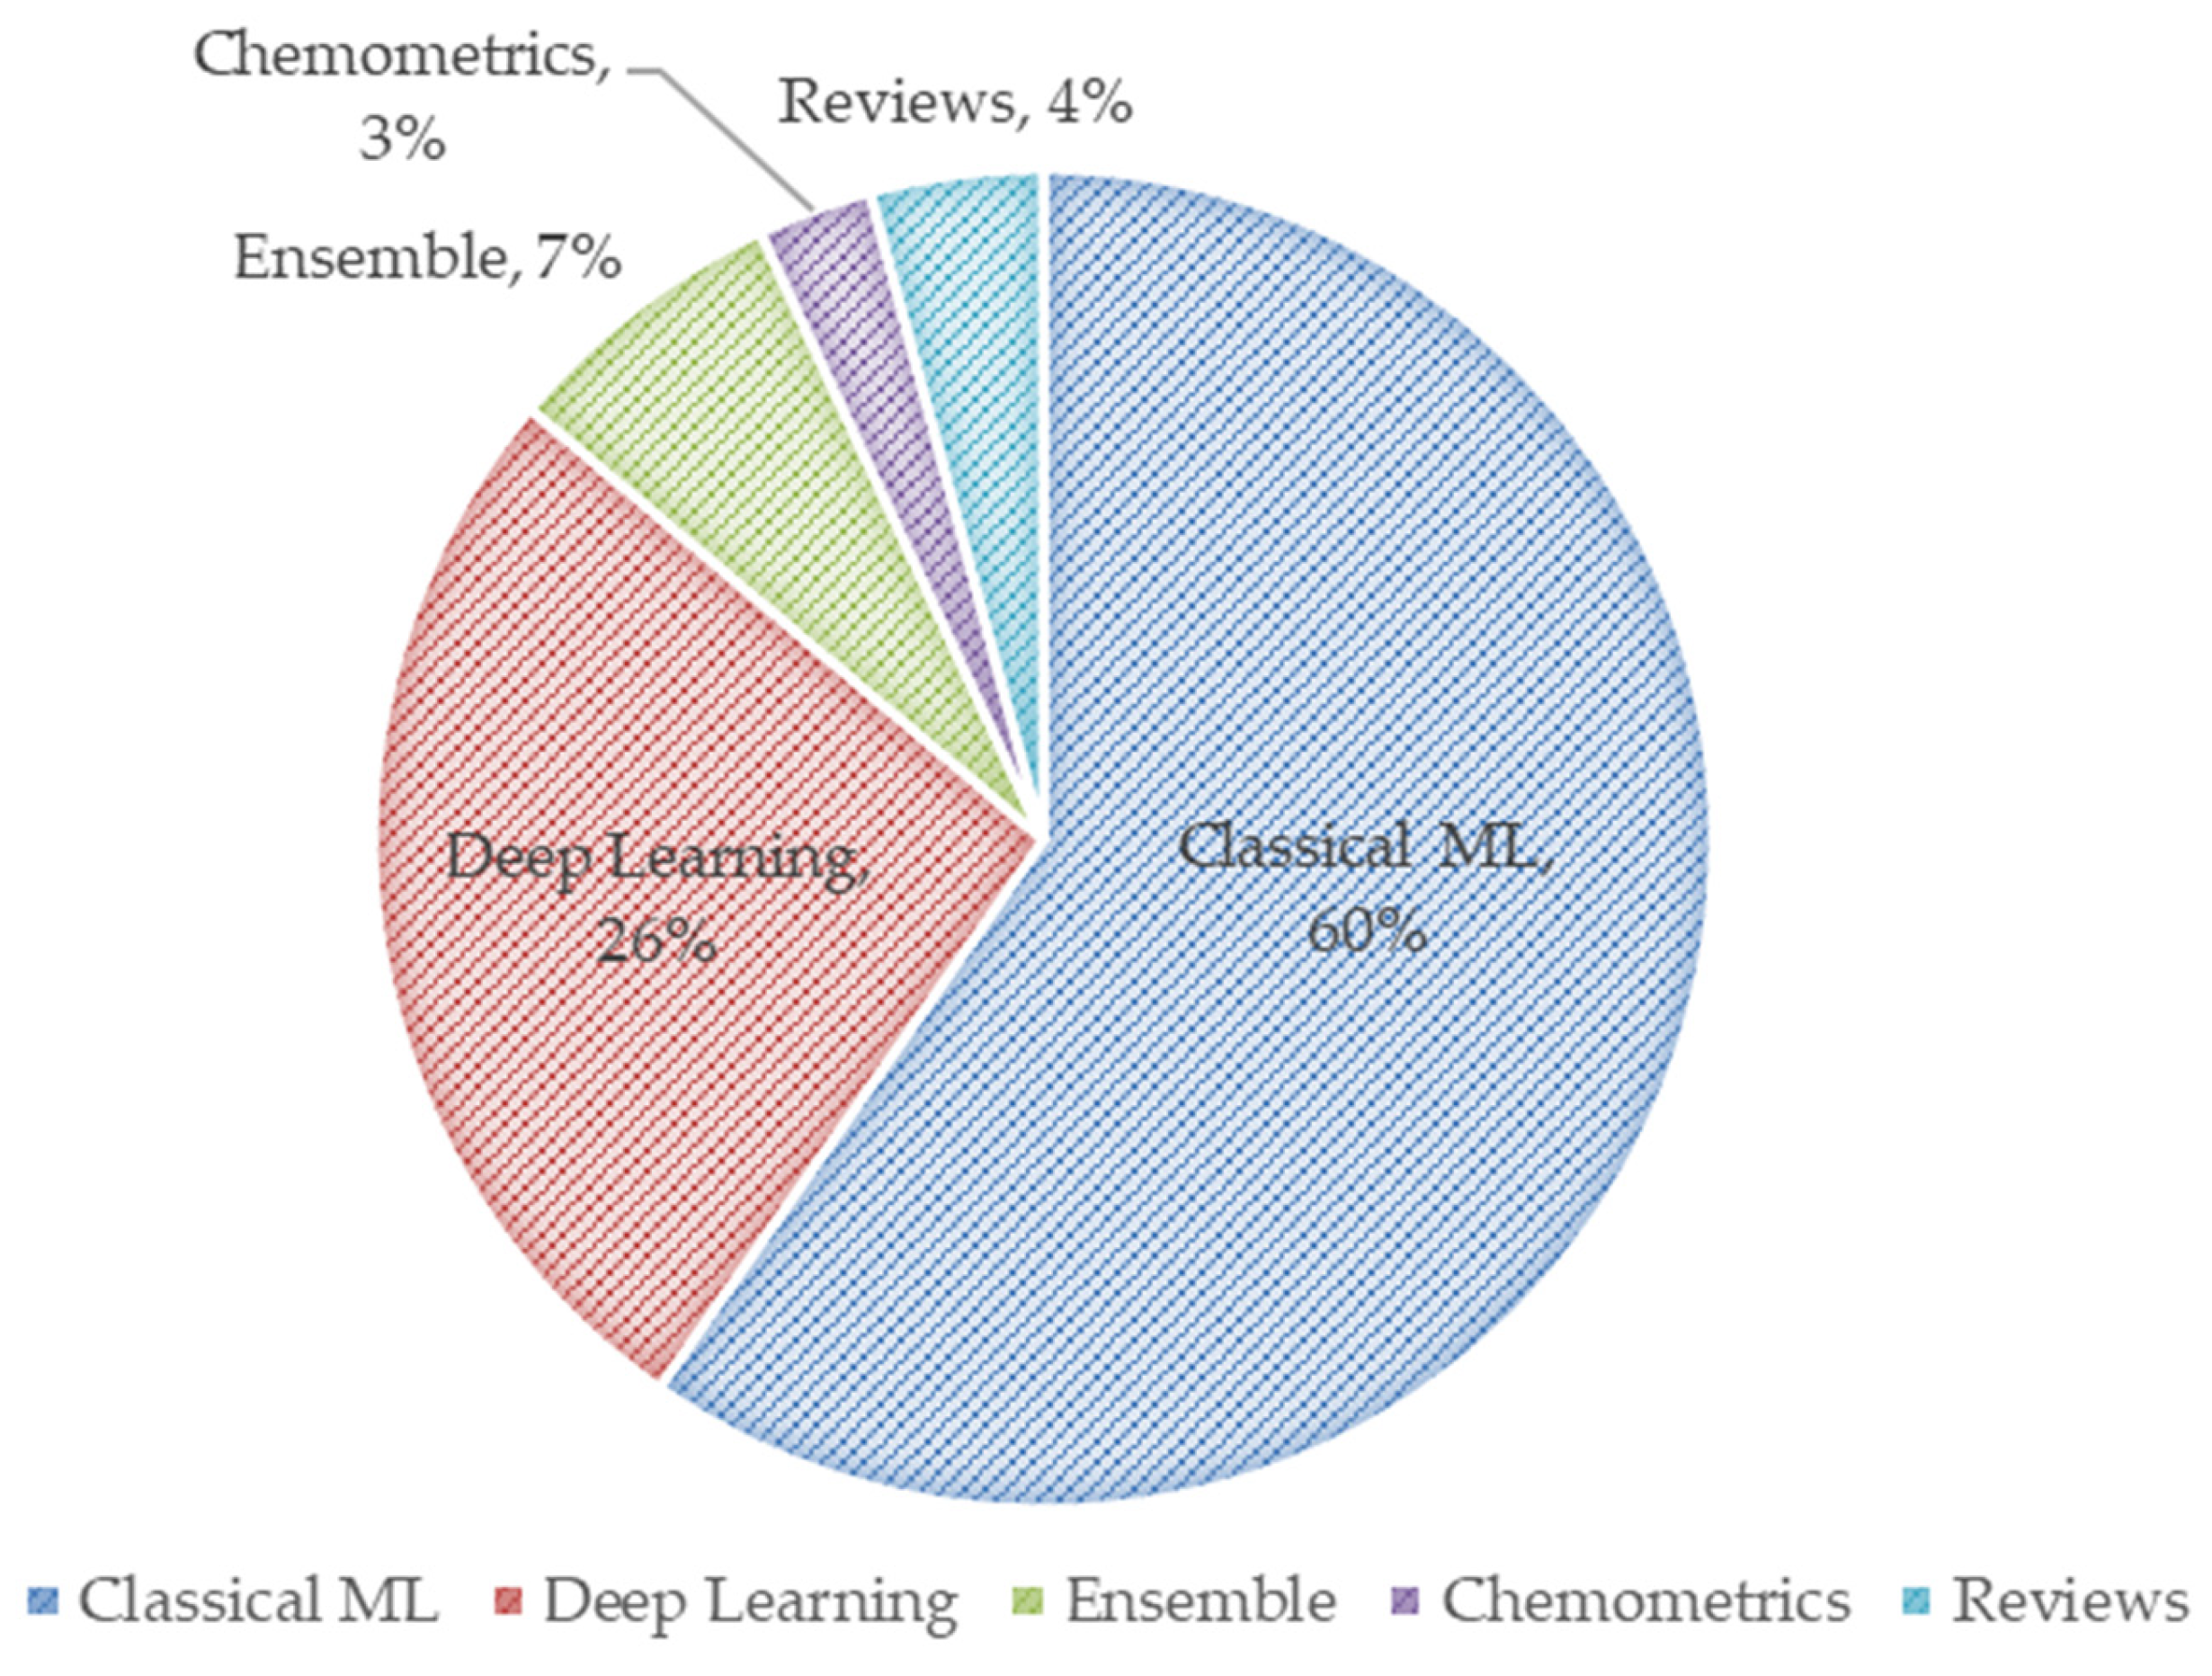
Classical machine learning predominated: 57/83 records were coded as classical-ML designs [3,5,8,12,13,22,25,26,36,41,53,54,56,58,59,65,69,71,84,85], with a further 11 hybrid ML/DL designs [15,35,49,67,80] and 12 deep-learning–only designs [1,4,6,18,30,43,44,57,76,77,79,81]; the three review articles [70,72,78] do not report a primary model. Within classical ML, SVM, Random Forest, and ANN/MLP recur most frequently, often in comparative benchmarking as shown in Figure 3. These methods are well established in chemometrics and remain effective with relatively small datasets—an advantage given the limited size of many authenticated reference collections. Deep-learning designs include CNNs, ResNet/DenseNet variants, and Transformer-based architectures (e.g., the CCST of Shen et al. [42]; the AKCA-Net of Sun et al. [1]).
Figure 3.
AI algorithm types.
Training and validation strategies varied: single random train–test splits (commonly 70/30 or 80/20) were the most frequent design, k-fold cross-validation was widely used (often alongside a fixed test set), and only a minority employed a genuinely independent external dataset (Section 3.5). The most rigorous external-validation design in the corpus was the cultivar-disjoint split of Malavi et al. [9], ensuring that no Arabica cultivar appeared in both calibration and external test sets.
Statistical Comparison: Classical ML Versus Deep Learning
A common assumption in the field is that deep-learning architectures deliver superior accuracy. The present corpus does not support this assumption. Among studies with an extractable classification accuracy, classical-ML designs (n = 49) reported a median of 100.0% and deep-learning designs (n = 8) a median of 98.2%; the difference was not statistically significant (Mann–Whitney U = 253.5, p = 0.16). Pooling deep learning with hybrid ML/DL designs (n = 15, median 99.1%) and comparing against classical ML likewise yielded no significant difference (U = 443.0, p = 0.21). Descriptively, classical-ML accuracies were slightly higher on the median and showed marginally greater spread (a small number of classical models at 87–90%), whereas deep-learning accuracies clustered tightly between 90% and 100%.
Two interpretations are consistent with these data and should be weighed jointly. First, on these controlled-laboratory tasks, classical chemometric methods remain at least as accurate as deep learning, while requiring far less data and computation—an argument for parsimony in a field constrained by small authenticated datasets. Second, the absence of a deep-learning advantage may itself reflect a ceiling effect: when median accuracies approach 100% under internal validation, the metric loses the resolution needed to discriminate methods, and any genuine generalization advantage of one family over another would only become visible under external evaluation—which is rarely performed. The non-result is therefore informative about reporting conditions as much as about intrinsic model capability. A counter-example worth noting is [6], in which a deep model (AlexNet) generalized to an external set far better than its classical baselines.
Table 5 describes three panels. Panel A shows that high reported accuracy is broadly distributed across platforms rather than concentrated in any single technology: every major modality has a median ≥ 98.7%, and the four most common platforms (NIR, HSI, electronic nose, imaging) all sit at or near the practical ceiling. Confidence intervals sharpen this picture: the mean accuracy of NIR, HSI, imaging, FTIR, and MS platforms cannot be distinguished from the 100% ceiling (upper bounds at or near 100%), whereas electronic-nose systems are the lone platform whose 95% CI (94.5–98.8%) sits clearly below ceiling and whose dispersion is appreciably larger (CV 4.35% vs. ≤2.6% elsewhere). Formal between-study heterogeneity is extreme by any meta-analytic measure, but—for the reasons detailed in Table 2’s note—this reflects evaluation design and ceiling truncation more than substantively different platform performance, as the non-significant Kruskal–Wallis comparison across platforms confirms (p = 0.53). This uniformity is itself diagnostic—when nearly every technology reports near-perfect internal accuracy, the metric provides little basis for choosing among them, and platform selection should instead be driven by deployment factors (cost, portability, throughput, robustness) that the corpus rarely reports. Panel B reinforces this point at the level of model families: the absence of a significant ML–DL difference implies that, on these tasks and under internal validation, architectural sophistication is not the binding constraint on reported performance. Panel C is perhaps the most consequential: external-validation frequency does not rise monotonically over time (0%, 0%, 33%, 6%, 19%, 31%). The apparent 2023 peak rests on only six records and is not stable; pooled across all years, fewer than one in five studies report external validation. The trend line, therefore, offers, at best, weak and noisy evidence of methodological maturation—and certainly not the steady improvement one would expect if the field were converging on deployment-grade evaluation standards.
Table 5.
Cross-cutting quantitative analyses derived from the workbook.
3.4. Performance Metrics: High Internal Precision and Sparse External Evidence
Reported metrics are consistent: classification accuracies almost universally exceed 90%, and many reach 100%. Illustrative examples include Sun et al. ([1], 98.21% ± 0.71% for soybean origin), Lu et al. ([20], 100% F1 for high-grade tea), the turmeric-origin study reaching 100% after SNV preprocessing [2], Tian et al. ([12], 100% for vegetable-oil adulteration in raw milk using a Flash-GC electronic nose with Random Forest), and Firouz et al. ([46], 100% classification with near-unity R2 for sesame-oil adulteration using dielectric spectroscopy and ANN).
Crucially, 42/83 studies (51%) do not include an explicit discussion of overfitting [1,2,3,7,8,15,20,24,26,27,28,34,35,36,37,38,41,44,45,46,47,48,49,51,52,53,54,55,56,59,60,64,68,73,74,75,77,80,82,84,85], even where reported accuracies approach the measurement ceiling. Where overfitting is addressed (41 studies; e.g., [4,5,6,9,10,11,12,13,14,16,17,18,21,22,23,29,30,31,33,39,40,43,50,57,58,62,63,65,66,67,69,71,78,79,81,83], it is typically handled through cross-validation, regularization, or permutation tests; genuinely independent external validation on novel samples from different laboratories or supply-chain positions remains infrequent. Several studies do, however, document train–test gaps within their own design—for example, Su et al. [47] reported a regression R2 of 0.9153 (train) versus 0.7254 (test), and Song et al. [11] reported 99.56% on the internal test set versus 97.80% on a 500-sample real-time blind validation in the LiveID™ system.
Direct Test: Does High Reported Accuracy Imply Overfitting?
A recurring critique—implicit in much of the literature and in earlier drafts of this review—is that very high accuracy is itself a signature of overfitting. We tested this proposition directly rather than asserting it. If high accuracy were primarily an artifact of overfitting, one would expect high-accuracy studies to be disproportionately associated with weak validation and lower methodological quality. The data shows:
- Accuracy × validation rigor. Among studies reporting ≥99% accuracy, 23.70% had robust external validation, versus 14.30% among studies reporting <99% (Fisher’s exact test, p = 0.51). The association is not significant and, if anything, runs opposite to the overfitting hypothesis.
- Accuracy × quality score. Reported accuracy did not decline with methodological-quality score; the correlation was weakly positive and non-significant (Spearman ρ = 0.15, p = 0.23). Mean accuracy was 97.50% (score 2), 98.30% (score 3), 99.60% (score 4), and 100% (the single score-5 study).
- Externally validated vs. internal-only. Studies with robust external validation did not report lower accuracy than internal-only studies (median 100.0% vs. 99.60%; Mann–Whitney p = 0.45).
These results caution against the simple equation, high accuracy = overfitting. Three readings are compatible with the evidence, and we present them without privileging the one most convenient for the review’s thesis. (a) The hypothesis may be false for much of this corpus: classical chemometric tasks on well-separated chemical classes can be genuinely easy, so near-perfect internal accuracy need not signal overfitting. (b) The test may be underpowered to detect the effect: external performance is reported in too few studies (15/83) for the comparison to be sensitive, and the within-study gaps that are reported (e.g.,: ΔR2 ≈ 0.19; logistic baseline: ≈99% internal vs. ≈69% external) show that substantial generalization loss does occur in specific cases. (c) Overfitting may be masked by the very practice the review critiques—without external evaluation, an overfit model and a genuinely generalizable model can report identical internal accuracy, so the metric cannot, even in principle, separate them. Reading (c) is the most defensible synthesis: the problem is not that high accuracy proves overfitting, but that the dominant evaluation design makes overfitting undetectable. This reframing is more precise than the original claim and shifts the argument from a contestable empirical assertion to a statement about evidential adequacy.
Proposed direct test for future studies. To convert this from an inference to a measurement, we recommend a standardized protocol that every study could report: train the model under internal validation and record P_internal, and then evaluate the frozen model on an independently collected set (different instrument, operator, batch, or laboratory) and record P_external. The generalization gap ΔG = P_internal − P_external would then be reported alongside headline accuracy. A field-level prediction follows: if high internal accuracy is benign, ΔG should remain small and uncorrelated with internal accuracy; if it reflects overfitting, ΔG should grow with internal accuracy and with model complexity relative to sample size. Because ΔG is currently observable in only a handful of studies, the hypothesis remains, at present, neither confirmed nor refuted—an honest position that the corpus, as it stands, requires.
3.5. External Validation: A Predominant but Not Universal Absence
Sixty-eight of 83 studies (82%) reported no external validation of any kind. Among the 15 studies that did [5,6,7,9,10,11,12,18,23,25,39,40,43,57,68], rigor varied: some used held-out concentration ranges from the same laboratory batch (e.g., [23]), supplementary conditions from the same design (e.g., [39,40]), or real-time blind tests on samples prepared by the same team (e.g., [11,18]). A smaller subset—[6,9,10,12,43,68], and [7]—employed validation that can be characterized as genuinely independent (independent commercial samples, cultivar-disjoint splits, or multi-origin/multi-cut external sets). The absence of inter-laboratory validation, by contrast, was absolute (0/83): no study validated across multiple laboratories using independently calibrated instruments. Measured against AOAC and [86] method-validation expectations, none of the reviewed systems would currently meet the standard required for accredited routine implementation. We note this as an empirical observation about the corpus rather than as proof that any individual method would fail such validation if it were attempted, as presented in Table 6.
Table 6.
Distribution of limitations by category (primary classification).
3.6. Industrial Validation and Implementation Evidence
The detection–prevention gap is most visible in deployment data. No study reported pilot-scale testing; one study ([69], Kan et al.) tested in a genuine industrial environment, using PTR-TOF-MS with machine learning to classify the fermentation stage of soy-sauce production across three 100 tonnes industrial fermenters (QDA 100%; Extra Trees 99.83%). This is a process-monitoring application rather than fraud detection, but it shares instrumental platforms, model families, and validation challenges with fraud detection, illustrating a plausible knowledge-transfer pathway. No study documented routine-monitoring application in an operational context, and no inter-laboratory validation was identified.
Explicit Technology Readiness Levels were not assigned in any study; a small number discussed deployment engineering qualitatively (e.g., Song et al. [11] describe factory installation of LA-REIMS as ‘challenging yet feasible’, requiring dedicated computing infrastructure, robotic handling, and automated pipelines; Zhu et al. [57] reports a working sub-USD-60 prototype; Machuca et al. [62] notes future real-time implementation). Cost analysis was provided in 14 studies [11,12,22,27,28,29,30,38,44,45,49,50,57,82] and scalability discussed in 69, though usually at the level of aspiration rather than quantified techno-economic assessment.
Regulatory integration was mentioned in 20 studies (24%) [2,7,10,12,17,18,22,34,43,50,62,63,65,66,68,69,70,79,81,83], typically by reference to existing frameworks (Codex Alimentarius, EU directives, national standards) as motivation. The most concrete regulatory linkage was Tian et al. [12], who validated against ISO 17678:2019 and confirmed one genuine positive among 300 real commercial milk samples. No study reported formal adoption or integration of its method into a regulatory enforcement workflow.
3.7. Methodological Quality Assessment
Quality was predominantly moderate. Forty-nine studies (59%) scored 3/5, 22 (27%) scored 2/5 [4,8,16,26,27,32,33,34,36,42,52,53,54,55,60,62,65,69,75,77,79,84], 11 (13%) scored 4/5 [6,7,10,11,12,18,25,31,43,57,68], and a single study—Malavi et al. [9], a NIR-HSI study of Robusta-in-Arabica coffee adulteration with cultivar-disjoint external validation—achieved 5/5. Risk of bias was Moderate in 49 studies (59%), High in 19 (23%) [4,8,16,27,32,33,34,42,52,53,54,55,60,62,65,75,77,79,84], Low or Low-to-Moderate in 11 (13%), and Not Applicable (reviews [70,72,78], plus one further review-type record) in four. Among the six quality domains, preprocessing was well described in most studies (73/80 non-review records), but dataset diversity was adequate in only 28/80 and robust validation in only 15/80, with sample size adequate in 44/80. The binding constraints on quality were therefore validation rigor and dataset diversity rather than preprocessing transparency.
4. Discussion
4.1. The Detection–Prevention Gap: What the Evidence Does and Does Not Establish
The corpus supports a well-evidenced central observation: AI-assisted instrumental systems demonstrate high analytical accuracy under controlled conditions, while the evidence that they prevent food fraud in real supply chains is minimal. This conclusion rests on hard, interpretation-independent counts: 0/83 inter-laboratory validations, 0/83 routine-monitoring deployments, 0/83 pilot-scale tests, and a single in-plant (process-monitoring) study. These are facts about the literature, not inferences, and they justify the claim that detection capability has substantially outpaced demonstrated prevention capability.
We are more cautious about the stronger causal claim that the gap is ‘primarily systemic rather than technological’. The limitation-coding in Table 6 shows systemic limitations outnumbering technological ones (161 vs. 100 coded statements), which is consistent with that interpretation. But coded limitation counts partly reflect what authors choose to disclose, and the same data are compatible with a more measured reading: the field is early in its translational trajectory, and the absence of deployment evidence may reflect the normal lag between proof-of-concept and operationalization as much as a misaligned incentive structure. Both readings are defensible; the data adjudicate the descriptive claim (the gap exists) far more firmly than the causal one (why it exists).
4.2. The Validation Deficit and Its Implications
The 82% rate of absent external validation is the most consequential methodological feature of the corpus. Without external validation, reported accuracies cannot be reliably extrapolated to deployment conditions that include seasonal compositional variation, different origins and processing, different operators, and different instrument calibration states. The most rigorous studies—[6,9,10,12], and [7]—share a substantial investment in validation design: cultivar-disjoint splits [9], multi-cut/multi-country external sets [6], validation against a regulatory reference method on 300 commercial samples [12], and independent commercial test samples in a proteomics workflow [7]. Their existence demonstrates that rigorous external validation is achievable within current resource constraints; their rarity indicates that it is not yet the norm. Importantly, these well-validated studies still report high accuracy, which tempers—without eliminating—concern that internal accuracies are uniformly inflated.
4.3. Technology Concentration and Generalizability
The concentration of research in China (46%) and the dominance of NIR and electronic-nose platforms create specific generalizability considerations. Models calibrated on regionally specific matrices (e.g., Yunnan black tea [35]; Jinhua ham [33]; Shanxi vinegar) encode reference databases and threshold calibrations that are not directly transferable to other regulatory and commercial contexts without revalidation. Certain fraud modalities—especially species substitution detectable mainly through DNA or proteomic methods—remain underrepresented; the proteomics study of Venegas et al. [7], which detected walnut adulteration at 1% w/w on independent commercial samples, illustrates a methodological direction that is largely absent from the broader literature.
4.4. Reporting Conventions and the Interpretation of High Accuracy
A recurrent rhetorical pattern describes methods as ‘promising’, ‘efficient’, or ‘feasible’ for ‘real-time on-site detection’, while the evidence base is laboratory-scale with internal validation only. The statistical analyses in Section 3.6 refine how this pattern should be criticized. The legitimate concern is not that a 100% accuracy on a small dataset necessarily indicates an overfit model, but that the prevailing evaluation design cannot distinguish an overfit model from a generalizable one. A Random Forest reporting 100% on 72 samples from three provinces [2], or a dielectric-spectroscopy ANN reporting 100% with near-unity R2 on 135 oil samples from one laboratory [46], is best described not as ‘proven to be overfit’ but as ‘not yet shown to generalize’. This distinction matters for fair appraisal of the literature and for the design of future studies.
4.5. What Would Genuine Translation Look Like?
Bridging the gap would require: (1) external validation using genuinely independent sources (different laboratories, operators, origins, seasons); (2) inter-laboratory ring-trial validation comparable to regulatory method-adoption standards; (3) inclusion of real commercial supply-chain samples rather than exclusively laboratory blends; (4) techno-economic analysis covering instrument, consumable, training, and throughput costs; and (5) explicit Technology Readiness Level assignment positioning each study on the path from concept (TRL 1) to operational deployment (TRL 9). Song et al. [11] come closest, combining high internal accuracy (99.56%) with a 500-sample real-time blind test (97.80%) and explicit discussion of factory-installation engineering—the kind of translational evidence the broader literature needs.
4.6. Are the Quality Criteria Too Restrictive? Threshold Justification and Sensitivity Analysis
Because the quality framework strongly shapes the headline conclusions, its thresholds deserve explicit scrutiny. We address four questions directly, using the workbook to test the framework against itself.
- (i)
- Could the criteria be too restrictive in some cases? The decision matrix is deliberately conservative: robust (independent) validation is the pivotal criterion, and its absence prevents a low-risk classification. This is defensible for a review whose question is about real-world prevention, where independent validation is the single most informative signal of deployability. However, the framework does not collapse to a single criterion. Empirically, all 19 high-risk studies failed both dataset-diversity and validation criteria simultaneously; none was rated high-risk on the basis of one failing field alone. This indicates that the rubric is not mechanically over-penalizing—high risk requires converging deficiencies, not a single threshold miss.
- (ii)
- Does the configuration penalize domains with naturally small datasets? This is the most important fairness concern, since proteomics, NMR, and certain spectroscopic authentication tasks are intrinsically low-n. The workbook shows the rubric already accommodates this. The clearest example is Venegas et al. [7]: with only 27 references + 8 independent commercial samples (sample size flagged inadequate against the n ≥ 150 threshold), the study still scored 4/5 (Low risk) because it satisfied dataset diversity and, critically, genuine external validation. Conversely, small-n studies that scored 2/5 (e.g., [56], tallow NMR, n = 28; [36], medicinal tea, n = 36; [78], soy sauce, n = 54) failed not because of n alone but because they also lacked diversity and independent validation and were exploratory in design. In other words, a small sample size is necessary but not sufficient for a low score; the rubric rewards small-but-rigorous studies that compensate with diversity and external testing.
- (iii)
- Why were these parameters/thresholds chosen? The n ≥ 150 threshold approximates the lower bound at which high-dimensional spectral models can be evaluated with a meaningful hold-out partition while retaining class balance; it is a heuristic, not a hard scientific constant, and the rubric explicitly permits intermediate n (50–149) to pass when class-balanced and dimensionality-reduced. Independent validation was given pivotal weight because it is the criterion most directly tied to the review’s prevention question. Preprocessing clarity and dataset diversity were included because they govern reproducibility and generalizability, respectively. These choices privilege deployability over in-lab optimization—an intentional alignment with the research question, which we state openly so readers can recalibrate if their interest is purely methodological.
- (iv)
- Were alternative scenarios tested, and how would results change under a less restrictive validation criterion? Yes. We re-scored the corpus under a relaxed definition that counts partial/quasi-external validation (e.g., held-out concentration ranges or same-team blind tests) as ‘robust’. Under this relaxation, the count of studies meeting the validation criterion rises modestly from 15 to 20 (18% → 24%), and the headline statement changes only in degree, not kind: a clear majority (≈76%) of studies would still lack robust validation. Notably, the high-risk tier is essentially unaffected, because every high-risk study fails on dataset diversity as well as validation—so loosening only the validation rule does not rescue them. The inter-laboratory finding (0/83) is invariant to any threshold choice as presented in Table 7, since it is a simple presence/absence count. The central conclusions are therefore robust to reasonable relaxation of the most contested threshold; what relaxation buys is a softer characterization of the degree of the deficit, not its existence.Table 7. Sensitivity of validation findings to threshold choice.
4.7. Limitations of This Review
Several limitations apply. The corpus of 83 records, while comprehensive for 2021–2026, may under-represent the gray literature, conference proceedings, and non-English studies. Publication bias may favor positive results, potentially inflating the typical reported performance. Accuracy figures were extracted as the maximum reported classification accuracy per study; this is a conservative, comparable proxy but discards within-study distributional detail and excludes regression-only studies, so the ML-vs-DL and accuracy-association analyses should be read as characterizations of reporting patterns rather than definitive performance estimates. Model-family coding (ML/DL/hybrid) involves judgment for studies that benchmark many algorithms. Methodological-quality scoring, though criterion-based, involves boundary judgments that another assessor might resolve differently; the sensitivity analysis in Section 4.6 partially addresses this. Finally, the rapid publication pace means some early-2026 studies may be incompletely indexed.
5. Conclusions
This systematic review of 83 records (2021–2026) yields three empirically grounded conclusions, stated at the level of confidence the evidence supports.
First, internal analytical precision is consistently high and architecture-agnostic. AI-assisted instrumental systems routinely achieve classification accuracies above 95% and regression R2 above 0.90 under laboratory conditions, and classical ML performs at least as well as deep learning on these tasks (no significant difference; p = 0.16). This reflects a methodologically mature analytical foundation and argues for parsimonious model choice given small authenticated datasets.
Second, external evidence is sparse and does not show clear temporal improvement. Sixty-eight of 83 studies (82%) reported no external validation; none achieved inter-laboratory validation; none documented routine monitoring; and external-validation frequency over time is noisy rather than rising. We deliberately do not claim that high internal accuracy proves overfitting—a hypothesis the corpus could neither confirm nor refute (Section 3.4)—but rather that the prevailing evaluation design leaves generalization, and therefore overfitting, undetectable.
Third, a measurable detection–prevention gap exists, strongly evidenced by deployment counts and weakly explained by the available data. The literature has shown that AI systems can detect adulteration under controlled conditions; it has not yet shown that they prevent fraud in real supply chains. Whether this gap is ‘primarily systemic’ is plausible but not established to the same standard as the gap itself.
Author motivations and constructive directions. Reading the authors’ own stated motivations across the corpus is illuminating and largely convergent. Recurrent drivers include: protecting high-value commodities and consumer health (e.g., toxic-adulterant detection in mustard [80]; allergen-relevant walnut adulteration [7]); enabling rapid, non-destructive, low-cost on-site screening as an alternative to slow reference methods (the dominant rationale behind portable-NIR and electronic-nose studies, e.g., [15,17,77]); supporting regulatory compliance against named standards (ISO 17678:2019 in [12]; Codex frameworks in olive- and avocado-oil studies [10,22]); and improving process control with direct industrial relevance (in-plant fermentation monitoring [69]; factory-deployment engineering [11]). These motivations are socially valuable; the gap this review identifies is not a failure of intent but of evaluation design. The most translation-oriented authors in the corpus [6,7,9,11] already model the path forward—independent validation, real commercial samples, and explicit deployment discussion—demonstrating that the required reorientation is achievable within current incentives rather than requiring their wholesale replacement.
Closing the gap will require a shift in success criteria: from maximizing classification performance under laboratory conditions toward demonstrating measurable, externally validated impact within real food systems. Concretely, the field would benefit from routine reporting of the generalization gap ΔG, inter-laboratory ring trials, inclusion of commercial supply-chain samples, techno-economic analysis, and TRL transparency. Until these become standard, the impressive analytical performance documented here is best understood as a demonstration of what is technically possible—a necessary precondition for, but not yet evidence of, prevention.
Supplementary Materials
The following supporting information can be downloaded at: https://www.mdpi.com/article/10.3390/foods15183185/s1.
Author Contributions
Conceptualization, D.P.H. and O.M.Q.; methodology, O.M.Q. and M.B.P.; software, O.M.Q.; validation, O.M.Q.; formal analysis, O.M.Q.; investigation, D.P.H. and M.B.P.; resources, O.M.Q.; data curation, D.P.H. and M.B.P.; writing—original draft preparation, O.M.Q.; writing—review and editing, O.M.Q. and M.B.P.; visualization, O.M.Q.; supervision, O.M.Q.; project administration, O.M.Q.; funding acquisition, O.M.Q. All authors have read and agreed to the published version of the manuscript.
Funding
This research received no external funding.
Institutional Review Board Statement
Not applicable. This study is a systematic review of previously published literature and did not involve human participants, animals, or identifiable personal data.
Informed Consent Statement
Not applicable.
Data Availability Statement
The review protocol is publicly available in Zenodo at DOI: 10.5281/zenodo.20785718. All data analyzed during this study were extracted from published peer-reviewed articles included in the reference list.
Conflicts of Interest
The authors declare no conflicts of interest.
References
- Sun, H.; Hua, Z.; Yin, C.; Li, F.; Shi, Y. Geographical traceability of soybean: An electronic nose coupled with an effective deep learning method. Food Chem. 2024, 440, 138207. [Google Scholar] [CrossRef] [Scilit] [PubMed]
- Guo, Q.; Li, M.X.; Fu, R.; Wan, X.; Dong, W.H.; Mao, C.Q.; Bian, Z.H.; Ji, D.; Lu, T.L.; Li, Y. Rapid evaluation of Curcuma origin and quality based on E-eye, flash GC e-nose, and FT-NIR combined with machine learning technologies. Food Chem. 2025, 481, 143953. [Google Scholar] [CrossRef] [Scilit] [PubMed]
- Chen, Y.A.; Chen, J.; Zou, F.; Chen, Y.; Wang, X.; Peng, G.; Yin, Y.; Yan, J. A novel manifold discriminant extreme learning machine combined with an E-nose for chili pepper identification via aroma analysis. J. Food Compos. Anal. 2025, 148, 108350. [Google Scholar] [CrossRef] [Scilit]
- Shen, C.; Wang, R.; Jin, Q.; Chen, X.; Cai, K.; Xu, B. Chemometrics methods, sensory evaluation and intelligent sensory technologies combined with GAN-based integrated deep-learning framework to discriminate salted goose breeds. Food Chem. 2024, 461, 140919. [Google Scholar] [CrossRef] [Scilit] [PubMed]
- Lu, H.; Song, A.; Li, M.; Yao, X.; Cai, Y.; Dong, L.; Kang, D.; Liu, Y. Evaluation of the freshness (TVB-N) of pork patty during storage based on PLS-DA, SVM and BP-ANN models. Food Control 2025, 171, 111121. [Google Scholar] [CrossRef] [Scilit]
- Jo, E.; Lee, Y.; Lee, Y.; Baek, J.; Kim, J.G. Rapid identification of counterfeited beef using deep learning-aided spectroscopy: Detecting colourant and curing agent adulteration. Food Chem. Toxicol. 2023, 181, 114088. [Google Scholar] [CrossRef] [Scilit] [PubMed]
- Venegas, S.; Mauser, A.; Dalabasmaz, S.; Gensberger-Reigl, S.; Pischetsrieder, M. Detection of adulteration in walnuts with edible nuts using bottom-up proteome analysis. Food Chem. 2026, 506, 148124. [Google Scholar] [CrossRef] [Scilit] [PubMed]
- Aghili, N.S.; Rasekh, M.; Karami, H.; Azizi, V.; Gancarz, M. Detection of fraud in sesame oil with the help of artificial intelligence combined with chemometrics methods and chemical compounds characterization by gas chromatography–mass spectrometry. LWT 2022, 167, 113863. [Google Scholar] [CrossRef] [Scilit]
- Malavi, D.; Raes, K.; Van Haute, S. Hyperspectral imaging, chemometrics, feature selection, and machine learning for rapid, non-destructive detection and quantification of Robusta adulteration in ground and instant Arabica coffee. Food Control 2026, 183, 111955. [Google Scholar] [CrossRef] [Scilit]
- Malavi, D.; Raes, K.; Van Haute, S. Integrating near-infrared hyperspectral imaging with machine learning and feature selection: Detecting adulteration of extra-virgin olive oil with lower-grade olive oils and hazelnut oil. Curr. Res. Food Sci. 2024, 9, 100913. [Google Scholar] [CrossRef] [Scilit] [PubMed]
- Song, G.; Xiang, T.; Xu, Z.; Hou, H.; Ge, Y.; Lai, H.; Wang, D.; Yuan, T.; Li, L.; Wang, Z.; et al. Rapid identification of multiplex camellia oil adulteration based on lipidomic fingerprint using laser assisted rapid evaporative ionization mass spectrometry and data fusion combined with machine learning. LWT 2025, 228, 118078. [Google Scholar] [CrossRef] [Scilit]
- Tian, H.; Wu, D.; Chen, B.; Yuan, H.; Yu, H.; Lou, X.; Chen, C. Rapid identification and quantification of vegetable oil adulteration in raw milk using a flash gas chromatography electronic nose combined with machine learning. Food Control 2023, 150, 109758. [Google Scholar] [CrossRef] [Scilit]
- Aqeel, M.; Sohaib, A.; Iqbal, M.; Ullah, S.S. Milk adulteration identification using hyperspectral imaging and machine learning. J. Dairy Sci. 2025, 108, 1301–1314. [Google Scholar] [CrossRef] [Scilit] [PubMed]
- Al Noman, M.A.; Nijhum, A.B.; Hossain, I.; Aziz, M.G.; Rahman, A. Quantification of adulteration in Bangladeshi honey varieties using UV-vis-NIR spectroscopy and SHAP-guided machine learning. NFS J. 2026, 43, 100268. [Google Scholar] [CrossRef] [Scilit]
- Liang, Q.; Xia, Y.F.; Che, J.K.; Liu, Y.; Zhang, H.; Guo, J.C.; Xu, Q.; Xue, H.N. Detection of water adulteration levels in milk using near-infrared spectroscopy combined with chemometrics. J. Dairy Sci. 2025, 108, 6852–6866. [Google Scholar] [CrossRef] [Scilit] [PubMed]
- Wang, Z.; Peng, W.; Tian, Z.; Zhu, L.; Guo, M.; Chen, Z.; Meng, H.; Dong, C. Rapid detection of synthetic pigments in black tea using hyperspectral imaging technology and machine learning. Food Chem. X 2025, 31, 103192. [Google Scholar] [CrossRef] [Scilit] [PubMed]
- Xenitopoulou, D.; Tsakiridis, N.L.; Zalidis, A.P.; Zalidis, G.C. Real-time detection of turmeric adulteration with metanil yellow using a miniaturized NIR sensor and AI techniques. Future Foods 2025, 12, 100695. [Google Scholar] [CrossRef] [Scilit]
- Pérez-Calabuig, A.M.; Pradana-López, S.; Cancilla, J.C.; Mena, M.L.; Torrecilla, J.S. AI-powered optical quality control of yogurt: Detecting melamine adulteration and monitoring shelf-life. Appl. Food Res. 2025, 5, 101510. [Google Scholar] [CrossRef] [Scilit]
- Food and Drugs Administration. Economically Motivated Adulteration. 2026. Available online: https://www.fda.gov/food/compliance-enforcement-food/economically-motivated-adulteration-food-fraud (accessed on 12 June 2026).
- Lu, L.; Wang, L.; Liu, R.; Zhang, Y.; Zheng, X.; Lu, J.; Wang, X.; Ye, J. An efficient artificial intelligence algorithm for predicting the sensory quality of green and black teas based on the key chemical indices. Food Chem. 2024, 441, 138341. [Google Scholar] [CrossRef] [Scilit] [PubMed]
- Xia, H.; Chen, W.; Hu, D.; Miao, A.; Qiao, X.; Qiu, G.; Liang, J.; Guo, W.; Ma, C. Rapid discrimination of quality grade of black tea based on near-infrared spectroscopy (NIRS), electronic nose (E-nose) and data fusion. Food Chem. 2024, 440, 138242. [Google Scholar] [CrossRef] [Scilit] [PubMed]
- Mayorga-Martínez, A.A.; Gonzalez Viejo, C.; Clorio-Carrillo, J.A.; Obispo-Fortunato, D.J.; Villarreal-Lara, R.; Torrico, D.D.; Patiño-González, V.; Hernández-Brenes, C.; Fuentes, S. Electronic nose and machine learning for rapid, sustainable detection of avocado oil adulteration. J. Agric. Food Res. 2026, 27, 102775. [Google Scholar] [CrossRef] [Scilit]
- Schumer, N.G.; Ahmed, M.W.; Rausch, K.; Singh, V.; Kamruzzaman, M. Chemometric-based approach for economically motivated fraud detection in organic spices via NIR spectroscopy. J. Food Compos. Anal. 2025, 142, 107538. [Google Scholar] [CrossRef] [Scilit]
- Wang, X.; Gu, Y.; Lin, W.; Zhang, Q. Rapid quantitative authentication and analysis of camellia oil adulterated with edible oils by electronic nose and FTIR spectroscopy. Curr. Res. Food Sci. 2024, 8, 100732. [Google Scholar] [CrossRef] [Scilit] [PubMed]
- Ratnasekhar, C.H.; Khan, S.; Rai, A.K.; Mishra, H.; Verma, A.K.; Lal, R.K.; Ananda Kumar, T.M.; Elliott, C.T. Rapid metabolic fingerprinting meets machine learning models to identify authenticity and detect adulteration of essential oils with vegetable oils: Mentha and Ocimum study. Food Chem. 2025, 471, 142709. [Google Scholar] [CrossRef] [Scilit] [PubMed]
- Chen, Y.; Li, S.; Jia, J.; Sun, C.; Cui, E.; Xu, Y.; Shi, F.; Tang, A. FT-NIR combined with machine learning was used to rapidly detect the adulteration of pericarpium citri reticulatae (chenpi) and predict the adulteration concentration. Food Chem. X 2024, 24, 101798. [Google Scholar] [CrossRef] [Scilit] [PubMed]
- Ku, H.H.; Liao, Y.C.; Chi, C.H. Advanced AI-driven detection of cinnamon powder adulteration using near-infrared spectroscopy and deep learning image recognition technique. J. Agric. Food Res. 2025, 22, 102119. [Google Scholar] [CrossRef] [Scilit]
- Sulistyo, S.B.; Sudarmaji, A.; Haryanti, P.; Kuncoro, P.H. A novel approach for detection of granulated coconut sugar adulteration using LED-based spectrometer and machine learning. Inf. Process. Agric. 2025, 12, 300–311. [Google Scholar] [CrossRef] [Scilit]
- Li, D.; Jiang, H.; Yang, G.; Gong, Z.; Wen, T. Qualitative and quantitative detection of camellia oil adulteration using electronic nose based on wavelet decomposition humidity correction. LWT 2024, 210, 116822. [Google Scholar] [CrossRef] [Scilit]
- Wei, G.; Lv, X.; Zhao, J.; Zhang, W.; Wang, B.; Dou, Q.; Zhang, X. A prior knowledge boosted CNN-LSTM prediction model for oyster freshness evaluation based on an electronic nose. J. Food Compos. Anal. 2025, 148, 108397. [Google Scholar] [CrossRef] [Scilit]
- Hu, Y.; Chen, W.; Gouda, M.; Yao, H.; Zuo, X.; Yu, H.; Zhang, Y.; Ding, L.; Zhu, F.; Wang, Y.; et al. Fungal fermentation of Fuzhuan brick tea: A comprehensive evaluation of sensory properties using chemometrics, visible near-infrared spectroscopy, and electronic nose. Food Res. Int. 2024, 186, 114401. [Google Scholar] [CrossRef] [Scilit] [PubMed]
- Li, H.; Wang, Y.; Zhang, J.; Li, X.; Wang, J.; Yi, S.; Zhu, W.; Xu, Y.; Li, J. Prediction of the freshness of horse mackerel (Trachurus japonicus) using E-nose, E-tongue, and colorimeter based on biochemical indexes analyzed during frozen storage of whole fish. Food Chem. 2023, 402, 134325. [Google Scholar] [CrossRef] [Scilit] [PubMed]
- Zhang, B.; Wang, Y.; Wang, J.; Zhang, Y.; Wang, W.; Cao, J.; Kong, B.; Teng, W. The establishment of ham grade, sensory scores and key flavor substances prediction models for Jinhua ham via E-nose combined with machine learning. Food Chem. 2025, 472, 142847. [Google Scholar] [CrossRef] [Scilit] [PubMed]
- Li, H.; Gui, X.; Wang, P.; Yue, Y.; Li, H.; Fan, X.; Li, X.; Liu, R. Research on rapid quality identification method of Panax notoginseng powder based on artificial intelligence sensory technology and multi-source information fusion technology. Food Chem. 2024, 440, 138210. [Google Scholar] [CrossRef] [Scilit] [PubMed]
- Ren, G.; Wu, R.; Yin, L.; Zhang, Z.; Ning, J. Description of tea quality using deep learning and multi-sensor feature fusion. J. Food Compos. Anal. 2024, 126, 105924. [Google Scholar] [CrossRef] [Scilit]
- Sun, R.B.; Chen, Y.H.; Zhang, X.R.; Liu, F.T.; Wang, W.Y.; Zhang, J.N.; Wang, Y.F.; Zhang, H.; Xie, M.; Xin, G.Z.; et al. Discrimination of easily confused tea leaves with similar appearance (Gougu tea vs. Gonglao tea) via an integrated method of electronic tongue, HPLC-QTOF-MS-VirtualTaste, electronic nose, electrochemical fingerprinting and machine learning. J. Food Compos. Anal. 2025, 148, 108404. [Google Scholar] [CrossRef] [Scilit]
- Zhang, X.; Wu, X.; Du, Z.; Yang, D.; Wang, S.; Wang, J.; Zhao, X.; Zhao, X. Discrimination of edible vegetable oils from different processing techniques and rapeseed oil adulteration using fused Raman-FTIR spectroscopy and 1D CNN. J. Food Compos. Anal. 2026, 149, 108785. [Google Scholar] [CrossRef] [Scilit]
- Acharyya, S.; Sarkar, B.; Lekhashree, L.K.; Mukherji, S. Efficacious paper-based colorimetric detection of bacterial contamination in vegetables utilizing indicator dyes and machine learning. Food Chem. 2025, 495, 146408. [Google Scholar] [CrossRef] [Scilit] [PubMed]
- Hu, Z.; He, Y.; Gu, S.; He, W.; Zhang, P.; Pan, Z.; Fan, G.; Tian, H.; Wei, H.; Wang, P. Machine learning-assisted aroma profile prediction in tomato puree based on flavoromics. Food Chem. 2025, 478, 146915. [Google Scholar] [CrossRef] [Scilit] [PubMed]
- El Harkaoui, S.; Ortiz Cruz, C.; Roggenland, A.; Schneider, M.; Rohn, S.; Drusch, S.; Matthäus, B. Adulteration detection in cactus seed oil: Integrating analytical chemistry and machine learning approaches. Curr. Res. Food Sci. 2025, 10, 100986. [Google Scholar] [CrossRef] [Scilit] [PubMed]
- Li, H.; Zhao, X.; Li, X.; Liang, J.; Qin, S.; Li, J.; Zhang, A.; Xu, L.; Tang, D.; Li, F. Characterization of volatile flavour compounds and characteristic flavour precursors in poultry eggs based on multi-omics and machine learning. Food Chem. 2025, 489, 144840. [Google Scholar] [CrossRef] [Scilit] [PubMed]
- Shen, C.; Cai, G.; Tian, J.; Wu, X.; Ding, M.; Wang, B.; Liu, D. Characterization of lamb shashliks with different roasting methods by intelligent sensory technologies and GC–MS to simulate human muti-sensation: Based on multimodal deep learning. Food Chem. 2024, 440, 138265. [Google Scholar] [CrossRef] [Scilit] [PubMed]
- Ortiz-Chiliquinga, A.; Pérez-Calabuig, A.M.; Pradana-López, S.; Cancilla, J.C.; Torrecilla, J.S. Intelligent thermography for detecting melamine adulteration in powdered milk. Food Control 2026, 179, 111575. [Google Scholar] [CrossRef] [Scilit]
- Brar, D.S.; Singh, B.; Nanda, V. An XAI-enabled 2D-CNN model for non-destructive detection of natural adulterants in the wonder hot variety of red chilli powder. Sustain. Food Technol. 2025, 3, 1099–1113. [Google Scholar] [CrossRef] [Scilit]
- Ghavidelan, M.A.; Sahari, M.A.; Banakar, A.; Minaei, S.; Zarein, M. Detection of adulteration in pure olive oil using the UV-Vis spectroscopy coupled with machine learning. Appl. Food Res. 2026, 6, 101763. [Google Scholar] [CrossRef] [Scilit]
- Soltani Firouz, M.; Omid, M.; Babaei, M.; Rashvand, M. Dielectric spectroscopy coupled with artificial neural network for classification and quantification of sesame oil adulteration. Inf. Process. Agric. 2022, 9, 233–242. [Google Scholar] [CrossRef] [Scilit]
- Su, G.; Yao, Z.; Wang, D.; Lv, X.; Jia, W.; Hui, J.; Chu, B.; Wang, X.; Deng, Q.; Huang, H.; et al. Machine learning assisted intelligent identification strategy for adulteration peanut oil based on fatty acid GC fingerprint. Food Chem. X 2026, 34, 103686. [Google Scholar] [CrossRef] [Scilit] [PubMed]
- Hwang, J.; Choi, K.O.; Jeong, S.; Lee, S. Machine learning identification of edible vegetable oils from fatty acid compositions and hyperspectral images. Curr. Res. Food Sci. 2024, 8, 100742. [Google Scholar] [CrossRef] [Scilit] [PubMed]
- Wu, M.; Li, M.; Fan, B.; Sun, Y.; Tong, L.; Wang, F.; Li, L. A rapid and low-cost method for detection of nine kinds of vegetable oil adulteration based on 3-D fluorescence spectroscopy. LWT 2023, 188, 115419. [Google Scholar] [CrossRef] [Scilit]
- Chu, C.; Wang, H.; Luo, X.; Fan, Y.; Nan, L.; Du, C.; Gao, D.; Wen, P.; Wang, D.; Yang, Z.; et al. Rapid detection and quantification of melamine, urea, sucrose, water, and milk powder adulteration in pasteurized milk using Fourier transform infrared (FTIR) spectroscopy coupled with modern statistical machine learning algorithms. Heliyon 2024, 10, e32720. [Google Scholar] [CrossRef] [Scilit] [PubMed]
- Paul, A.; Member, G.S.; Kumari, H.; Member, G.S. Dual-Band Microwave Spectroscopy and Machine Learning for Rapid Milk Adulteration Detection. IEEE Trans. AgriFood Electron. 2026, 4, 137–144. [Google Scholar] [CrossRef] [Scilit]
- Zhang, W.; Xue, H.; Pan, X.; Liu, J. Research on an improved black winged kite algorithm for detecting adulteration in camel milk powder. J. Food Compos. Anal. 2026, 153, 109101. [Google Scholar] [CrossRef] [Scilit]
- Alharbi, H.; Dutta, A.; Kahfi, J.; Jaremko, M.; Emwas, A.H. Utilizing NMR and UHPLC–timsTOF–MS based metabolomics approaches for the detection of adulterated tallow. LWT 2025, 233, 118454. [Google Scholar] [CrossRef] [Scilit]
- López-Rosas, A.E.; Gómez-Navarro, C.S.; Warren-Vega, W.M.; Zárate-Guzmán, A.I.; Romero-Cano, L.A. Advancements towards the development artificial intelligence for sensory analysis: Integrating pattern recognition and signal processing in ATR-FTIR analysis of spirits. J. Food Compos. Anal. 2024, 131, 106224. [Google Scholar] [CrossRef] [Scilit]
- Aliaño-González, M.J.; Vázquez-Espinosa, M.; González-de-Peredo, A.V.; Chinchilla, N.; Fernández Barbero, G.; Palma, M.; Carrera, C. Machine learning-assisted spectroscopic methods for detecting adulteration in Barrantes wine from Folla Redonda grapes. Spectrochim. Acta-Part A Mol. Biomol. Spectrosc. 2026, 344, 126723. [Google Scholar] [CrossRef] [Scilit] [PubMed]
- Rady, A.M.; Adedeji, A.; Watson, N.J. Feasibility of utilizing color imaging and machine learning for adulteration detection in minced meat. J. Agric. Food Res. 2021, 6, 100251. [Google Scholar] [CrossRef] [Scilit]
- Zhu, Y.; Hu, H.; Yang, B.; Kang, H.; Chen, S.; Huang, Q.; Zhang, Q. MeatSpec-G: Generalized Low-Cost Spectral Imaging for Ubiquitous Meat Fraud Inspection. IEEE Trans. Mob. Comput. 2025, 25, 4664–4680. [Google Scholar] [CrossRef] [Scilit]
- Lu, H.; Yao, C.; An, L.; Song, A.; Ling, F.; Huang, Q.; Cai, Y.; Liu, Y.; Kang, D. Classification and identification of chicken-derived adulteration in pork patties: A multi-dimensional quality profile and machine learning-based approach. Food Control 2025, 176, 111381. [Google Scholar] [CrossRef] [Scilit]
- Angeli, L.; Muñoz, E.C.; Ballabio, D.; Morozova, K.; Scampicchio, M. 1H NMR spectroscopy combined with chemometrics for detection of turmeric adulteration in Italian saffron (Crocus sativus L.). Food Control 2026, 179, 111560. [Google Scholar] [CrossRef] [Scilit]
- Nargesi, M.H.; Amiri Parian, J.; Kheiralipour, K. Detection of wheat, chickpea, and sea foam in black pepper using hyperspectral imaging technique. Appl. Food Res. 2025, 5, 101031. [Google Scholar] [CrossRef] [Scilit]
- Nargesi, M.H.; Amiriparian, J.; Bagherpour, H.; Kheiralipour, K. Detection of different adulteration in cinnamon powder using hyperspectral imaging and artificial neural network method. Results Chem. 2024, 9, 101644. [Google Scholar] [CrossRef] [Scilit]
- Machuca, G.; Staforelli, J.; Rondanelli-Reyes, M.; Garces, R.; Contreras-Trigo, B.; Tapia, J.; Sanhueza, I.; Jara, A.; Lamas, I.; Troncoso, J.M.; et al. Hyperspectral Microscopy Technology to Detect Syrups Adulteration of Endemic Guindo Santo and Quillay Honey Using Machine-Learning Tools. Foods 2022, 11, 3868. [Google Scholar] [CrossRef] [Scilit] [PubMed]
- Al-Awadhi, M.; Deshmukh, R. Enhancing Honey Adulteration Detection with Optimal Subspace Wavelength Reduction in Vis-NIR Reflection Spectroscopy. IEEE Access 2023, 11, 144226–144243. [Google Scholar] [CrossRef] [Scilit]
- Abraham, V.K.; Binson, V.A. Real-Time Detection of Honey Adulteration Using a Portable E-Nose System. IEEE Sens. Lett. 2025, 9, 5505604. [Google Scholar] [CrossRef] [Scilit]
- Kumar, N.; Gupta, K.K.; Prajapati, D.; Panchariya, P.C. Water as Sensing Probe for Honey Adulteration Detection via Extended Aquaphotomics. IEEE Sens. J. 2026, 26, 871–880. [Google Scholar] [CrossRef] [Scilit]
- Aznar Jiménez, A. Determinación de los parámetros fisico-químicos de calidad de las aguas. Gest. Ambient. 2000, 2, 12–19. [Google Scholar]
- Yang, S.; Lin, Y.; Li, Y.; Xu, D.; Zhang, S.; Peng, L. Deep Neural Network-Based Sorghum Adulteration Detection in Baijiu Brewing. IEEE Open J. Instrum. Meas. 2022, 1, 5000308. [Google Scholar] [CrossRef] [Scilit]
- Filho, W.d.N. Fingerprints based on digital images integrated with DD-SIMCA for detection of food fraud in Type 1 Rice in the Brazilian market. Microchem. J. 2024, 224, 117455. [Google Scholar] [CrossRef] [Scilit]
- Kan, Q.; Cao, L.; He, L.; Wang, P.; Deng, G.; Li, J.; Fu, J.; Huang, Q.; Ho, C.T.; Li, Y.; et al. Tracing the change of the volatile compounds of soy sauce at different fermentation times by PTR-TOF-MS, E-nose and GC–MS. Food Chem. X 2025, 25, 102002. [Google Scholar] [CrossRef] [Scilit] [PubMed]
- Liang, C.; Xu, Z.; Liu, P.; Guo, S.; Xiao, P.; Duan, J. Integrating different detection techniques and data analysis methods for comprehensive food authenticity verification. Food Chem. 2025, 463, 141471. [Google Scholar] [CrossRef] [Scilit] [PubMed]
- Zhang, X.; Huang, X.; Tian, X.; Wang, L.; Dai, C.; Chang, X.; Ren, Y.; Yu, S.; Wang, C.; Han, F. Non-destructive quality monitoring of Shanxi vinegar production during the fumigation stage using computer vision, electronic nose and near-infrared spectroscopy assisted by machine learning. J. Food Compos. Anal. 2025, 146, 107908. [Google Scholar] [CrossRef] [Scilit]
- Jo, D.M.; Han, S.J.; Ko, S.C.; Kim, K.W.; Yang, D.; Kim, J.Y.; Oh, G.W.; Choi, G.; Lee, D.S.; Tabassum, N.; et al. Application of artificial intelligence in the advancement of sensory evaluation of food products. Trends Food Sci. Technol. 2025, 165, 105283. [Google Scholar] [CrossRef] [Scilit]
- Fathi, G.; Mireei, S.A.; Jafari, M.; Sadeghi, M.; Karimmojeni, H.; Nazeri, M. Spatial analysis of hyperspectral images for detecting adulteration levels in bon-sorkh (Allium jesdianum L.) seeds: Application of voting classifiers. Smart Agric. Technol. 2025, 10, 100810. [Google Scholar] [CrossRef] [Scilit]
- Jounela, P.; Karhu, J.; Karhu, S.; Välimaa, A.L. Authenticity markers of cultivated blueberries (Vaccinium sp.) and European wild blueberry (V. myrtillus) assessed by hyperspectral imaging and machine learning algorithms. Appl. Food Res. 2024, 4, 100597. [Google Scholar] [CrossRef] [Scilit]
- Fedorov, F.S.; Yaqin, A.; Krasnikov, D.V.; Kondrashov, V.A.; Ovchinnikov, G.; Kostyukevich, Y.; Osipenko, S.; Nasibulin, A.G. Detecting cooking state of grilled chicken by electronic nose and computer vision techniques. Food Chem. 2021, 345, 128747. [Google Scholar] [CrossRef] [Scilit] [PubMed]
- Shen, C.; Cai, Y.; Ding, M.; Wu, X.; Cai, G.; Wang, B.; Gai, S.; Liu, D. Predicting VOCs content and roasting methods of lamb shashliks using deep learning combined with chemometrics and sensory evaluation. Food Chem. X 2023, 19, 100755. [Google Scholar] [CrossRef] [Scilit] [PubMed]
- Zhu, K.; Zhang, X.; Ma, J.; Mubeen, H.M.; Zhang, T.; Lei, H.; Zhao, W.; Xu, H.; Li, M. Electronic nose, HS-GC-IMS, HS-SPME-GC-MS, and deep learning model were used to analyze and predict the changes and contents of VOCs in in-shell walnut kernels under different roasting conditions. Food Chem. 2025, 492, 145342. [Google Scholar] [CrossRef] [Scilit] [PubMed]
- Kirtil, E. Machine learning-driven integration of GC–MS and sensory panel data for aroma prediction in food systems. J. Food Compos. Anal. 2025, 148, 108594. [Google Scholar] [CrossRef] [Scilit]
- Aqeel, M.; Sohaib, A.; Iqbal, M.; Ullah, S.S. Hyperspectral Identification of Milk Adulteration Using Advance Deep Learning. IEEE Access 2024, 12, 174965–174982. [Google Scholar] [CrossRef] [Scilit]
- Guru Prasad, M.S.; Kumar, V.; Pant, S.; Sardar, T.H.; Kanyal, R. Robust machine learning-based mustard seed adulteration detection using multimodal fusion of image, spectral, and colorimetric features. J. Agric. Food Res. 2026, 26, 102741. [Google Scholar] [CrossRef] [Scilit]
- Gwardys, G.; Grodkowski, G.; Kostusiak, P.; Mendelowski, W.; Slósarz, J.; Satława, M.; Śmietanka, B.; Gwardys, K.; Gołębiewski, M.; Puppel, K. Molecular Remodeling of Milk Fat Globules Induced by Centrifugation: Insights from Deep Learning-Based Detection of Milk Adulteration. Int. J. Mol. Sci. 2025, 26, 11919. [Google Scholar] [CrossRef] [Scilit] [PubMed]
- Núñez, N.; Saurina, J.; Núñez, O. An FIA-MS Method for Rapid Coffee Adulteration Detection: A Comparative Study with a Non-Targeted LC-MS Approach. Foods 2025, 14, 2931. [Google Scholar] [CrossRef] [Scilit] [PubMed]
- Chen, L.; Yang, S.; Nan, Z.; Li, Y.; Ma, J.; Ding, J.; Lv, Y.; Yang, J. Detection of dextran, maltodextrin and soluble starch in the adulterated Lycium barbarum polysaccharides (LBPs) using Fourier-transform infrared spectroscopy (FTIR) and machine learning models. Heliyon 2023, 9, e17115. [Google Scholar] [CrossRef] [Scilit] [PubMed]
- Fu, B.; Li, M.; Chang, Z.; Yi, J.; Cheng, S.; Du, M. Identification of novel umami peptides from oyster hydrolysate and the mechanisms underlying their taste characteristics using machine learning. Food Chem. 2025, 473, 142970. [Google Scholar] [CrossRef] [Scilit] [PubMed]
- Zhao, Y.; Ni, X.; Tang, M. Feature selection-driven machine learning for parallel species authentication and adulteration quantification in commercial dairy products via Raman fingerprints. LWT 2025, 238, 118839. [Google Scholar] [CrossRef] [Scilit]
- ISO/IEC 17025:2017; General Requirements for the Competence of Testing and Calibration Laboratories. ISO: Geneva, Switzerland, 2017. Available online: https://www.iso.org/obp/ui/?__cf_chl_f_tk=KcpGveb7pCLgXs74aDul4IwY6Xg0yYIyfZiDv.zbBeQ-1783394921-1.0.1.1-MkkfnenPPeOVhHILA18kodD2mFS6DL_6Z5SHogXUen8#iso:std:iso-iec:17025:ed-3:v1:en (accessed on 5 July 2026).

Disclaimer/Publisher’s Note: The statements, opinions and data contained in all publications are solely those of the individual author(s) and contributor(s) and not of MDPI and/or the editor(s). MDPI and/or the editor(s) disclaim responsibility for any injury to people or property resulting from any ideas, methods, instructions or products referred to in the content. |
© 2026 by the authors. Licensee MDPI, Basel, Switzerland. This article is an open access article distributed under the terms and conditions of the Creative Commons Attribution (CC BY) license.