1. Introduction
Current global challenges, including climate change, natural resource depletion, and increasing competition in international markets, necessitate a transition from a linear production model based on production, consumption, and disposal to a circular system that emphasizes resource reuse and recycling, thereby closing material loops [
1]. In this context, the valorization of agro-industrial by-products represents a key strategy for promoting circular economy models, reducing competition for land and water resources, and supporting more sustainable livestock production [
2]. The Mediterranean region accounts for approximately 95% of the world’s olive (
Olea europaea L.) cultivation and contributes nearly 70% of global olive oil production [
3], with Italy representing about 15% of total European output. However, olive processing generates substantial quantities of by-products; for every 1000 kg of olives processed, approximately 800 kg of waste is produced [
4]. These residues are often underutilized or improperly managed, potentially posing significant environmental concerns [
5].
Among olive-processing by-products, partially destoned olive cake (PDOC) has emerged as a promising feed ingredient for ruminants. Partial removal of the stones reduces lignin content and improves digestibility compared with conventional olive cake [
6,
7,
8]. Olive cake is also rich in fiber, oleic acid, and polyphenolic compounds and contains moderate levels of crude protein [
9,
10], making it a potentially suitable alternative to conventional feed resources in dairy sheep systems.
From a human nutrition perspective, reducing dietary saturated fatty acid (SFA) intake has long been recommended to improve cardiovascular health. Dairy products are important contributors to SFA intake and have traditionally been associated with increased plasma cholesterol levels [
11]. Accordingly, dietary guidelines from the USDA recommend limiting saturated fat consumption, including that derived from dairy products [
12]. Consequently, strategies aimed at modifying the fatty acid (FA) profile of milk and dairy products have attracted increasing interest.
Dietary manipulation of dairy animals can modify milk fat composition, potentially reducing medium-chain saturated fatty acids (MCSFA), which have traditionally been considered hypercholesterolemic, while increasing fatty acids with recognized nutritional interest, including n-3 polyunsaturated fatty acids (PUFA) and conjugated linoleic acid (CLA), particularly cis-9 and trans-11 C18:2 [
13]. Dietary supplementation with unsaturated plant sources has also been shown to modify the FA profile of ruminant milk [
14]. These effects are particularly relevant for dairy products because changes in milk fat composition can be transferred, at least partially, to derived cheeses and may influence their nutritional characteristics.
Olive-processing by-products are of particular interest in this context because their high oleic acid content and other bioactive compounds may contribute to changes in the FA composition of milk and dairy products. Previous studies have reported that the inclusion of olive cake or related olive by-products in ruminant diets can decrease short- and medium-chain saturated fatty acids while increasing unsaturated fatty acids, including oleic acid, vaccenic acid, and CLA [
15,
16]. In cheese, these changes have been associated with improved nutritional indices, including higher UFA/SFA ratios, increased n-3 and n-6 FA contents, and reduced atherogenic and thrombogenic indices, together with modifications in sensory properties during ripening [
15].
Although the effects of olive by-products on milk and dairy products have been investigated in several ruminant production systems, their effects on traditional and seasonal dairy products obtained from grazing dairy ewes remain less well documented. In particular, previous research has generally focused on milk or cheeses with relatively short ripening periods, whereas information on the effects of olive by-product supplementation on long-ripened traditional ewe cheeses is more limited [
15,
17,
18].
This aspect is particularly relevant for Pecorino Siciliano PDO, a traditional cheese whose characteristics are influenced not only by milk composition but also by cheesemaking procedures and the extended ripening process. The six-month ripening period adopted for Pecorino Siciliano PDO in the present study provides an opportunity to evaluate whether potential dietary effects on milk composition and fatty acid profile are retained, attenuated, or otherwise expressed in the final ripened cheese. Moreover, the production of Ricotta from the whey generated during cheesemaking allows the evaluation of the potential effects of the dietary treatment on an additional traditional dairy product.
Given that olive-processing by-products, in combination with grazing-based feeding systems, may modify the milk FA profile by increasing the proportion of long-chain fatty acids, particularly oleic and linoleic acids, these dietary changes could potentially influence lipid-related processes occurring during cheese ripening. Such effects may, in turn, contribute to differences in the sensory characteristics of the final product.
A further objective was to assess whether the inclusion of stabilized PDOC could be used as a sustainable feeding strategy without negatively affecting the technological, microbiological, nutritional, or sensory quality of traditional dairy products. We hypothesized that dietary supplementation with stabilized partially destoned olive cake would produce ripened cheeses with a distinctive sensory profile, potentially characterized by enhanced aromatic complexity and modified flavour intensity.
3. Results and Discussion
3.1. Chemical Composition of Feeds
The chemical composition and fatty acid profile of the concentrates, partially destoned olive cake (PDOC), and pasture are reported in
Table 2. The inclusion of PDOC in the experimental (EXP) concentrate (17%, as-fed basis) modified its chemical composition compared with the control (CTR) concentrate. Although the two concentrates were designed to have a comparable estimated energy content (approximately 1800 kcal/kg DM), the EXP diet was characterized by greater amounts of crude protein (CP; 20.97 vs. 19.06% DM) and ether extract (EE; 5.68 vs. 2.75% DM) than the control concentrate. The greater EE content of the EXP concentrate reflected the relatively high lipid concentration of PDOC (21.70% DM). The EXP concentrate also showed higher fiber fractions, with greater concentrations of neutral detergent fiber (NDFom; 64.27 vs. 60.12% DM) and acid detergent lignin (ADL; 22.08 vs. 19.35% DM), likely reflecting the presence of lignified olive stone residues. Total polyphenol content was greater in the EXP concentrate than in the CTR concentrate, reaching 5.60 mg GAE/g DM compared with 3.79 mg GAE/g DM, respectively.
The chemical composition of PDOC, particularly its crude protein (CP) content, differed from that reported by Molina-Alcaide and Yáñez-Ruiz [
4] and Terramoccia et al. [
48], confirming the considerable compositional variability commonly observed among olive cake by-products. This variability has been attributed to differences in processing techniques, olive cultivar, environmental conditions, fruit maturity, and production year [
49,
50]. Pasture was characterized by a high proportion of polyunsaturated fatty acids (PUFA; 63.35% of total fatty acids), mainly α-linolenic acid (35.38% of total fatty acids), and by a relatively high total polyphenol content (14.34 mg GAE/g DM), consistent with previous reports [
22,
51].
Considering that two isoenergetic concentrates were formulated, the inclusion of PDOC also resulted in significant changes in other parameters, such as crude protein, ether extract, and fatty acid composition. Therefore, when discussing the effects of PDOC on the chemical, microbiological, and sensory characteristics of dairy products the potential combined effects of these changes should also be taken into account.
3.2. Physicochemical and Technological Characteristics of Bulk Milk
Dietary treatment did not affect bulk milk composition or technological parameters (
Table 3). Somatic cell count (SCC) was higher in the EXP group (
p < 0.05), although this parameter is known to be influenced by a wide range of nutritional and non-nutritional factors, including animal health status, management practices, environmental conditions, and stage of lactation. Therefore, the observed increase in SCC should not be attributed solely to the dietary treatment [
52]. Milk composition is generally influenced by dietary factors [
53]; however, the inclusion of PDOC in the EXP concentrate did not affect milk composition in the present study.
In contrast, PDOC supplementation appeared to improve the cheese-making aptitude of the milk, as indicated by the higher curd firmness (p < 0.01) and shorter curd-firming time (p < 0.05) observed in EXP bulk milk. These coagulation properties may contribute positively to the technological suitability of milk for the production of ripened cheese.
The present results are consistent with those of previous studies showing that milk composition was not adversely affected by the inclusion of dried olive cake at levels of 15–20% of dietary DM in dairy cow and ewe diets. Similarly, the inclusion of olive cake obtained from either two-phase (135 g/kg DM) or three-phase (112.5 g/kg DM) olive oil extraction processes in diets for Comisana dairy ewes did not adversely affect milk composition [
15,
54,
55,
56,
57].
3.3. Physical Properties and Chemical Composition of Ricotta and Ripened Pecorino Cheese
The physical properties and chemical composition of Ricotta and ripened Pecorino cheeses are presented in
Table 4.
Dietary inclusion of olive cake by-products did not affect the chemical composition of either ripened Pecorino or Ricotta cheese, in agreement with Abbeddou et al. [
58], who reported no effect of olive cake supplementation on the composition of farmhouse-type fresh ewe cheese, and with previous studies showing that olive cake supplementation has little influence on milk composition [
15,
59]. Likewise, no significant differences among dietary treatments were observed in the titratable acidity, color parameters (L*, a*, and b*), or hardness of PDO Pecorino cheese. Furthermore, the composition of Ricotta was consistent with the limited information available for this traditional Sicilian dairy by-product in the literature [
22].
Previous studies have reported that olive cake supplementation increased the total phenolic content (TPC) of cheese [
59,
60,
61], an effect generally attributed to the transfer of dietary polyphenols from feed to milk and, subsequently, to cheese. In contrast, no differences in cheese TPC were detected between treatments in the present study. Likewise, peroxide value (POV) and thiobarbituric acid reactive substances (TBARS), two indicators of lipid oxidation, were unaffected by dietary treatment. Given the close relationship between phenolic antioxidants and oxidative stability, the absence of an increase in cheese TPC may explain the lack of differences in these oxidative stability markers. This finding suggests that its relatively low inclusion level in the total diet (forage-to-concentrate ratio of 75:25) may not have provided sufficient polyphenols to enhance the antioxidant status of the cheese. Moreover, results from the same experimental trial, previously reported by Hassan et al. [
62], showed no significant effects of diet on ruminal pH, total volatile fatty acid (VFA) concentration, NH
3 concentration, protozoal counts, or CH
4 production, suggesting that the overall ruminal fermentation profile was not markedly affected despite the reduction in feed degradability. The limited impact of PDOC on ruminal fermentation may also have contributed to the lack of detectable changes in the transfer of bioactive compounds to milk and cheese. This differs from previous studies in dairy cows, in which supplementation with polyphenol-enriched olive cake increased the total polyphenol content (TPC) of cheese [
60,
61], likely reflecting differences in the phenolic composition of the dietary supplement.
In contrast, dietary treatment significantly affected the TPC of Ricotta cheese (
p < 0.01), with higher values observed in the CTR group. This unexpected finding may be related to differences in the polyphenolic composition of whey, which could affect the transfer and retention of individual phenolic compounds during Ricotta manufacture [
63]. Polyphenols are known to interact with milk proteins, although the extent of these interactions depends on several factors, including pH, ionic strength, and the structural characteristics of both proteins and phenolic compounds. Furthermore, the heat treatment applied during Ricotta manufacture may alter protein conformation and polyphenol solubility, thereby modifying protein–polyphenol interactions and, consequently, the retention of phenolic compounds in the final product [
63].
3.4. Fatty Acid Composition of Ricotta and Ripened Pecorino Cheeses
Dietary inclusion of olive cake affected only a limited number of fatty acids, most of which were present in relatively low proportions in both Ricotta and 6-month-ripened Pecorino cheese (
Table 5 and
Table 6). In the 6-month-ripened Pecorino cheese, the EXP group showed significantly lower proportions of medium-chain unsaturated fatty acids, namely C10:1, C12:1, C14:1, and C16:1 (
p < 0.05), which contributed to the significantly lower total MUFA and MCFA content observed in the EXP group (
p < 0.05).
The reduction in individual unsaturated fatty acids was accompanied by a significant decrease in total MCFA in Pecorino cheese (
p < 0.05). These findings are consistent with previous studies reporting reductions in short- and medium-chain saturated fatty acids following olive by-product supplementation [
15,
16,
17]. In the present study, this response was observed for MCFA in ripened Pecorino cheese, but not for SCFA, and was not detected in Ricotta cheese.
Among the long-chain fatty acids, PDOC supplementation increased linoleic acid (C18:2 n-6) in Pecorino cheese (p < 0.05), while reducing rumenic acid (C18:2 c9,t11; RA/CLA) in both Pecorino (p < 0.05) and Ricotta (p < 0.01). In contrast, trans-vaccenic acid (TVA), oleic acid, and α-linolenic acid (ALA) were not affected by dietary treatment in either dairy product (p > 0.05). The absence of a significant effect on TVA, despite the reduction in CLA, suggests that the response was not consistent across individual C18:1 and C18:2 fatty acids.
At the fatty acid group level, neither SFA nor total PUFA was affected by dietary treatment in Pecorino cheese. In Ricotta, however, total PUFA decreased in the EXP group (p < 0.05), although neither n-3 nor n-6 PUFA differed between treatments. The n-3/n-6 ratio was also lower in EXP Pecorino cheese (p < 0.05), reflecting the combined changes in individual fatty acids rather than a significant alteration in total n-3 or n-6 PUFA.
In previous studies, olive cake supplementation generally increased oleic acid and total monounsaturated fatty acids (MUFA), while reducing saturated fatty acids (SFA) and the atherogenicity index in ewe [
17] and cow [
15] milk. However, these responses have not been consistent across studies. Calabrese et al. [
59] reported that supplementation of dairy cow diets with the same PDOC reduced total MUFA content in Provola cheese, without affecting total fatty acid or SFA contents, despite significant changes in individual fatty acids and lipid health indices.
Several factors may explain the lack of dietary effects on the cheese fatty acid profile observed in the present study. First, the forage-to-concentrate ratio (75:25) was considerably higher than that adopted in previous studies, in which concentrates accounted for a greater proportion of total dry matter intake [
15]. Consequently, the inclusion of the same proportion of olive cake in the concentrate resulted in a lower contribution of olive cake-derived fatty acids to total dietary fatty acid intake. Second, the ewes were managed under continuous grazing, whereas previous studies involved either partial grazing [
60,
61] or total mixed ration feeding [
17]. Because fresh pasture is naturally rich in unsaturated fatty acids, its substantial contribution to total dietary fatty acid intake may have reduced the potential to detect additional effects of olive cake supplementation. Third, the Pecorino cheese was ripened for 6 months, considerably longer than the fresh or 60-day cheeses evaluated in earlier studies [
15,
17,
59,
61]. The extended ripening period may have promoted lipolytic processes that altered the fatty acid profile independently of dietary treatment. Collectively, differences in feeding system, forage-to-concentrate ratio, and ripening time may help explain the absence of significant dietary effects on the fatty acid profile of Pecorino and Ricotta cheeses, as well as the variability reported across studies. Interestingly, some of the ewes involved in the present feeding trial were subsequently slaughtered, and their meat was used in cured-meat processing trials. Analysis of the fatty acid composition of meat fat revealed a significant enrichment in unsaturated fatty acids, particularly oleic acid, in meat and salami from ewes fed PDOC [
7]. This finding suggests that the effects of PDOC supplementation on fatty acid deposition may be tissue-specific and may be more readily detectable in adipose tissues than in milk fat or dairy products under the feeding and processing conditions adopted in the present study.
3.5. Evolution of Microbial Populations During Cheese Making Assessed by Culture-Dependent Approach
Table 7 reports the results of plate count analyses performed throughout the cheese-making process, from the wooden vat biofilm to cheese after six months of ripening. The wooden vat biofilm exhibited high microbial loads, with total mesophilic microorganisms (TMM) and lactic acid bacteria (LAB) with coccus morphology, both mesophilic and thermophilic, exceeding 10
6 CFU/cm
2. These findings confirm that wooden surfaces act as reservoirs of autochthonous microbiota, as widely documented in traditional Sicilian PDO cheese production systems [
21,
64]. Significant differences between CTR and EXP dietary treatments were observed in raw milk. Specifically, TMM and the main mesophilic and thermophilic LAB groups were approximately one logarithmic cycle higher in milk from the EXP group, suggesting that animal diet can influence the microbial composition of milk at milking. This is consistent with previous studies highlighting the role of feeding and management practices in shaping milk microbiota [
65,
66]. However, following contact with the wooden vat, no significant differences were detected between CTR and EXP productions. This apparent homogenization can be attributed to the dominant and stable microbiota harboured by the wooden surfaces, which standardize the microbial profile of milk regardless of its initial composition. Similar effects have been reported in traditional cheese-making, where resident biofilms act as a natural inoculum [
67,
68].
As cheese-making progressed, the microbial composition of both fresh cheese and cheese after six months of ripening remained comparable between the two dietary treatments. This convergence is likely driven by the strong selective pressure exerted by LAB during fermentation and ripening, which rapidly dominate the microbial ecosystem through acidification and competition for nutrients [
69,
70]. During ripening, additional factors including progressive pH reduction, decreased water activity, and limited oxygen availability further contribute to the establishment of a stable and homogeneous microbial community, as widely reported for traditional sheep cheeses [
71,
72]. Notably, no pathogenic microorganisms relevant to dairy products, such as
Listeria monocytogenes,
Salmonella spp., or coagulase-positive staphylococci (CPS), were detected in any of the samples analysed throughout the production process. Therefore, these data were not included. Overall, these findings indicate that the dietary treatment did not compromise the microbiological safety of the final cheese, in agreement with previous studies on traditional cheeses produced using silages derived from prickly pear (
Opuntia spp.) by-products [
73].
3.6. Dynamics of Microbial Populations Investigated Through Illumina Technology
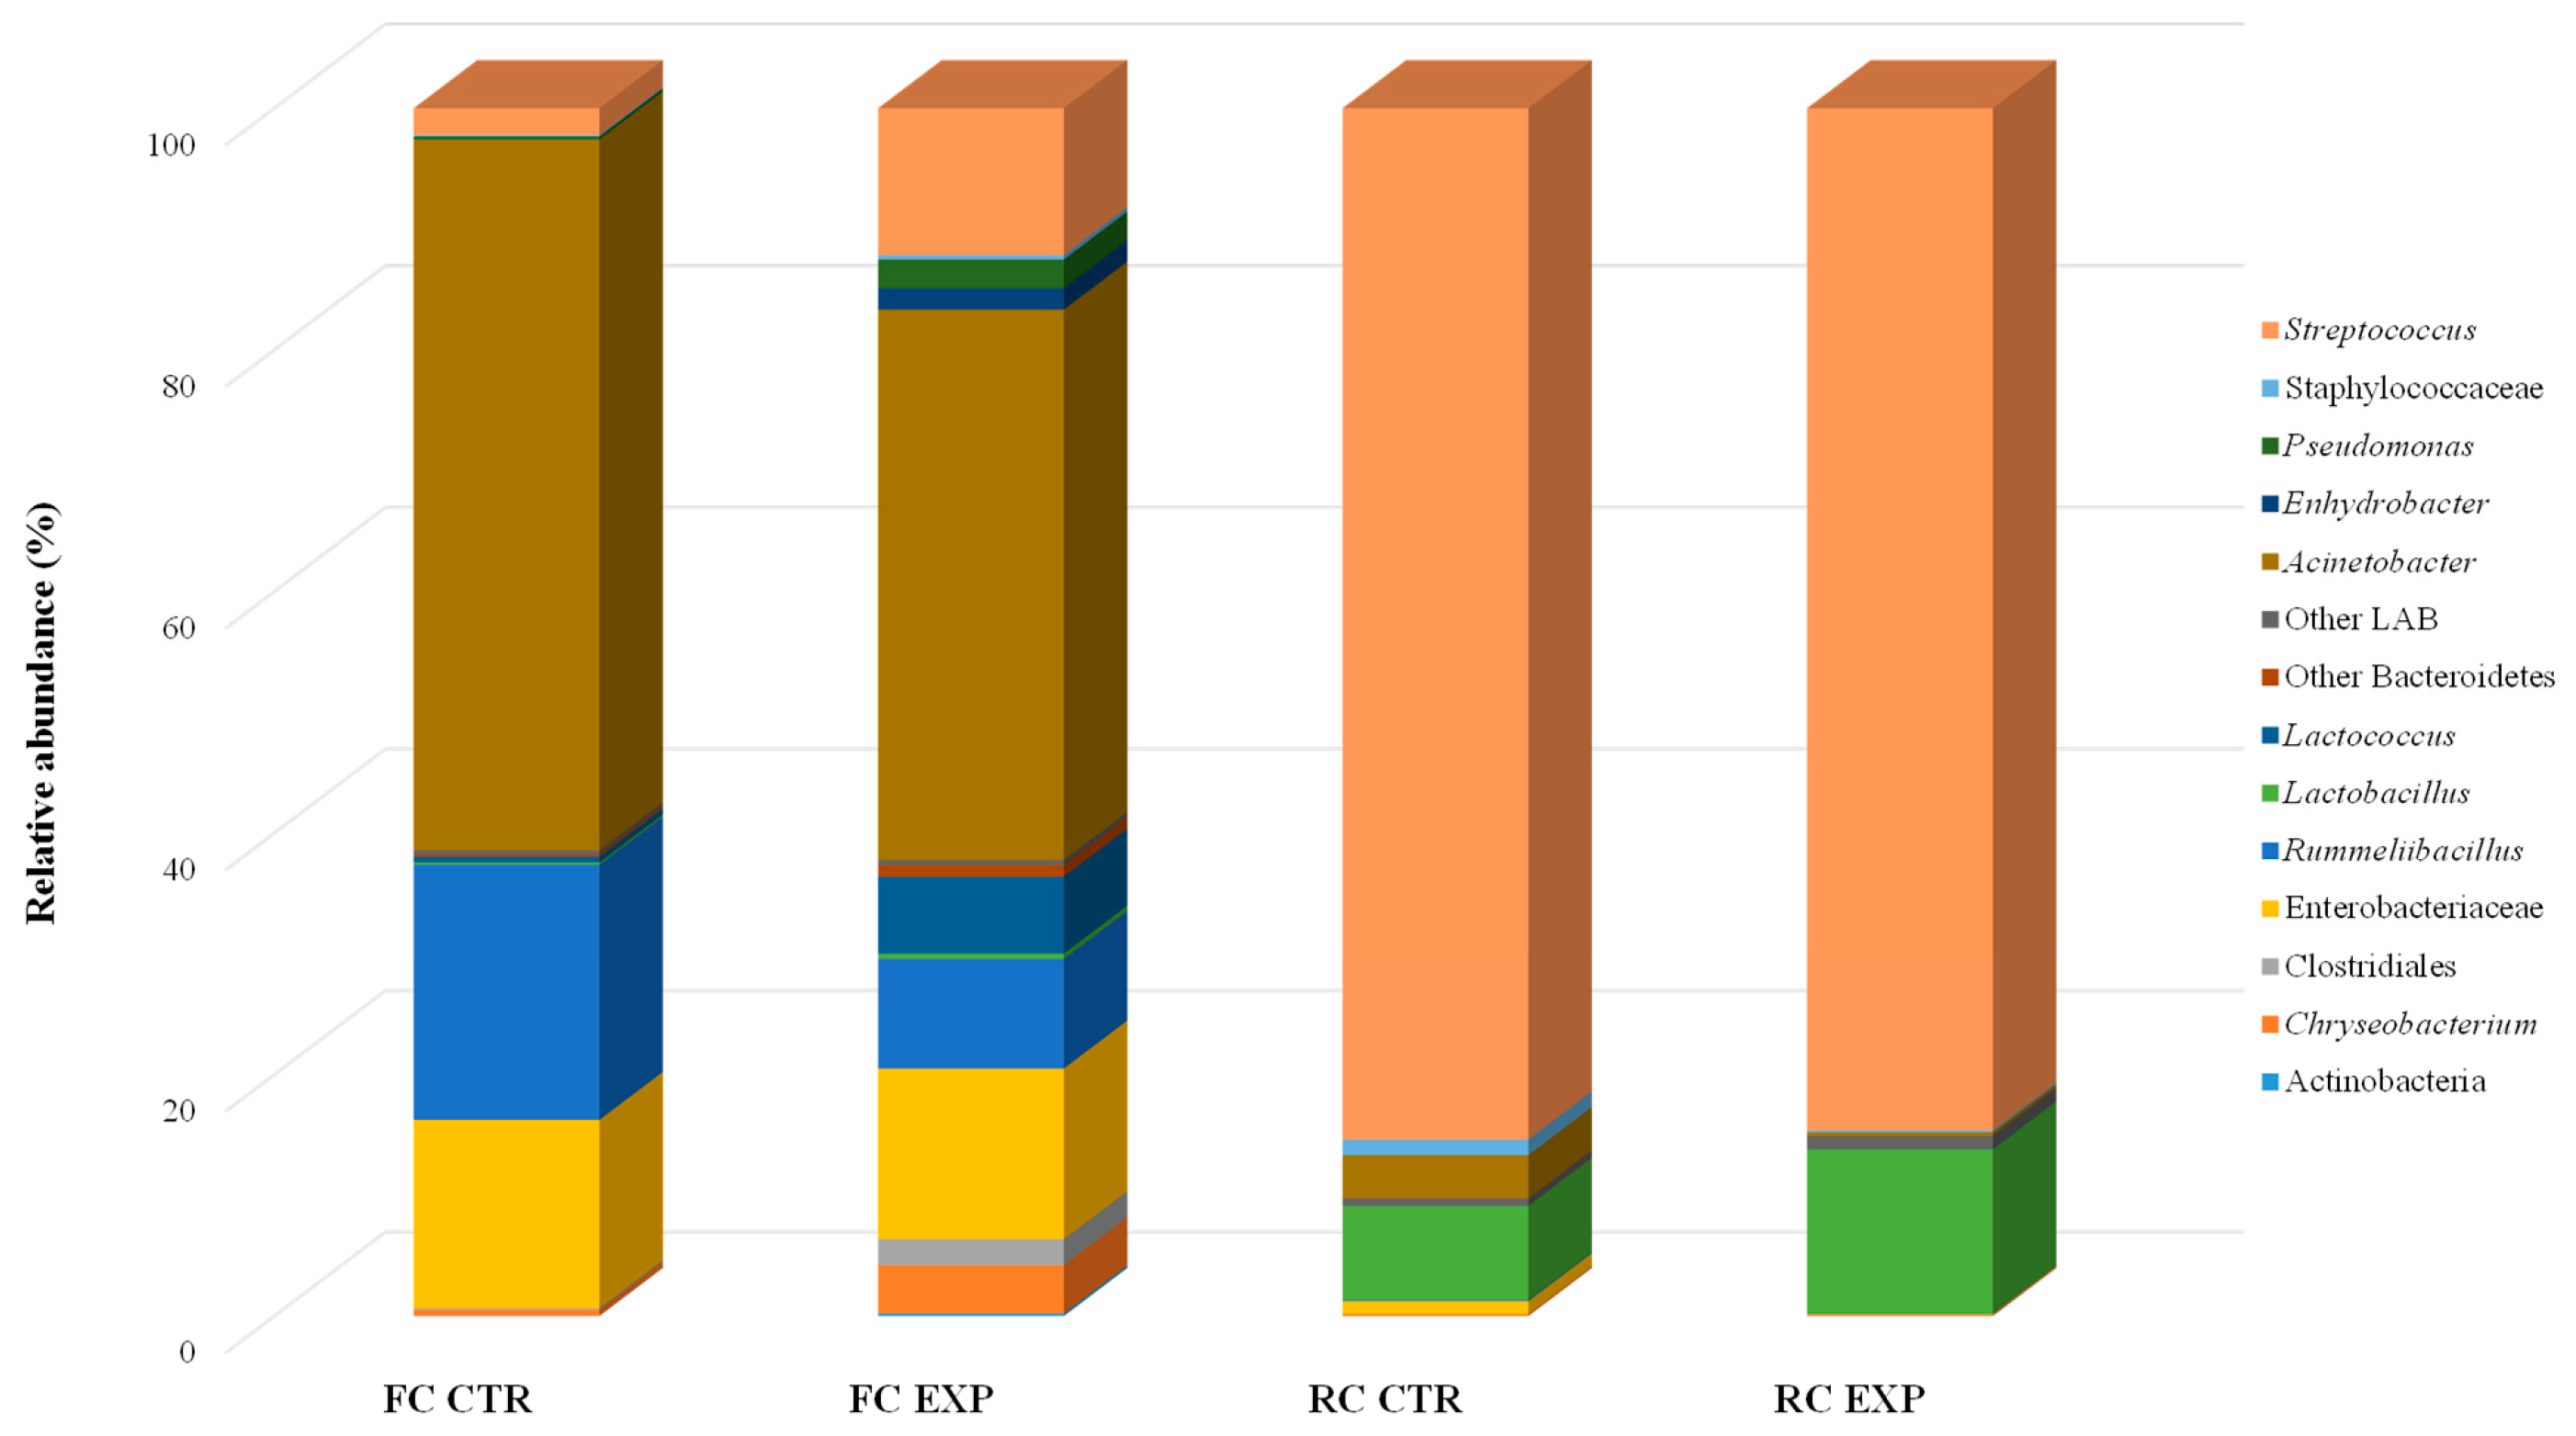
Analysis of the bacterial communities by high-throughput sequencing of the 16S rRNA gene (
Figure 1) showed a complex microbial profile in fresh cheeses from both the CTR and EXP groups. After six months of ripening, the bacterial composition had undergone substantial changes. Overall, two phyla, two orders, two families, and eight genera were identified.
Figure 1 shows only the taxa exhibiting a relative abundance (RA) greater than 0.1%. Fresh cheeses from both production groups were characterized by a marked predominance of
Gammaproteobacteria, with
Acinetobacter representing the most abundant genus, accounting for 58% and 45% of the total bacterial community in CTR and EXP samples, respectively.
Acinetobacter is a well-known psychrotrophic genus commonly associated with food spoilage during refrigerated storage and is frequently detected in both food products and processing environments. Its high prevalence in fresh dairy products is therefore consistent with previous reports [
73,
74,
75,
76,
77,
78]. Enterobacteriaceae represented the second most abundant bacterial group in fresh cheeses, with relative abundances of 15.58% in CTR samples and 14.11% in EXP samples. However, this bacterial family was no longer detected in cheeses after six months of ripening, likely as a consequence of adverse environmental conditions such as low pH, increased salinity, and reduced water activity [
79]. After six months of ripening, NGS analysis indicated that the bacterial communities of both CTR and EXP cheeses were largely dominated by LAB, particularly members of the genera
Streptococcus and
Lactobacillus.
Streptococcus reached 85.36% RA in CTR cheeses and 84.61% RA in EXP cheeses. Although
Streptococcus is a typical component of LAB starter cultures [
80], the high relative abundance detected by sequencing may partly reflect the persistence of DNA from dead or viable-but-non-culturable cells, a known limitation of DNA-based approaches previously reported in Sicilian cheeses [
21]. Lower relative abundances of
Lactobacillus were observed in ripened cheeses from both productions. However, their presence is expected, as these bacteria are commonly encountered in cheeses manufactured from raw ewe’s milk [
81].
3.7. Sensory Profile of Ripened Pecorino Siciliano PDO Cheese
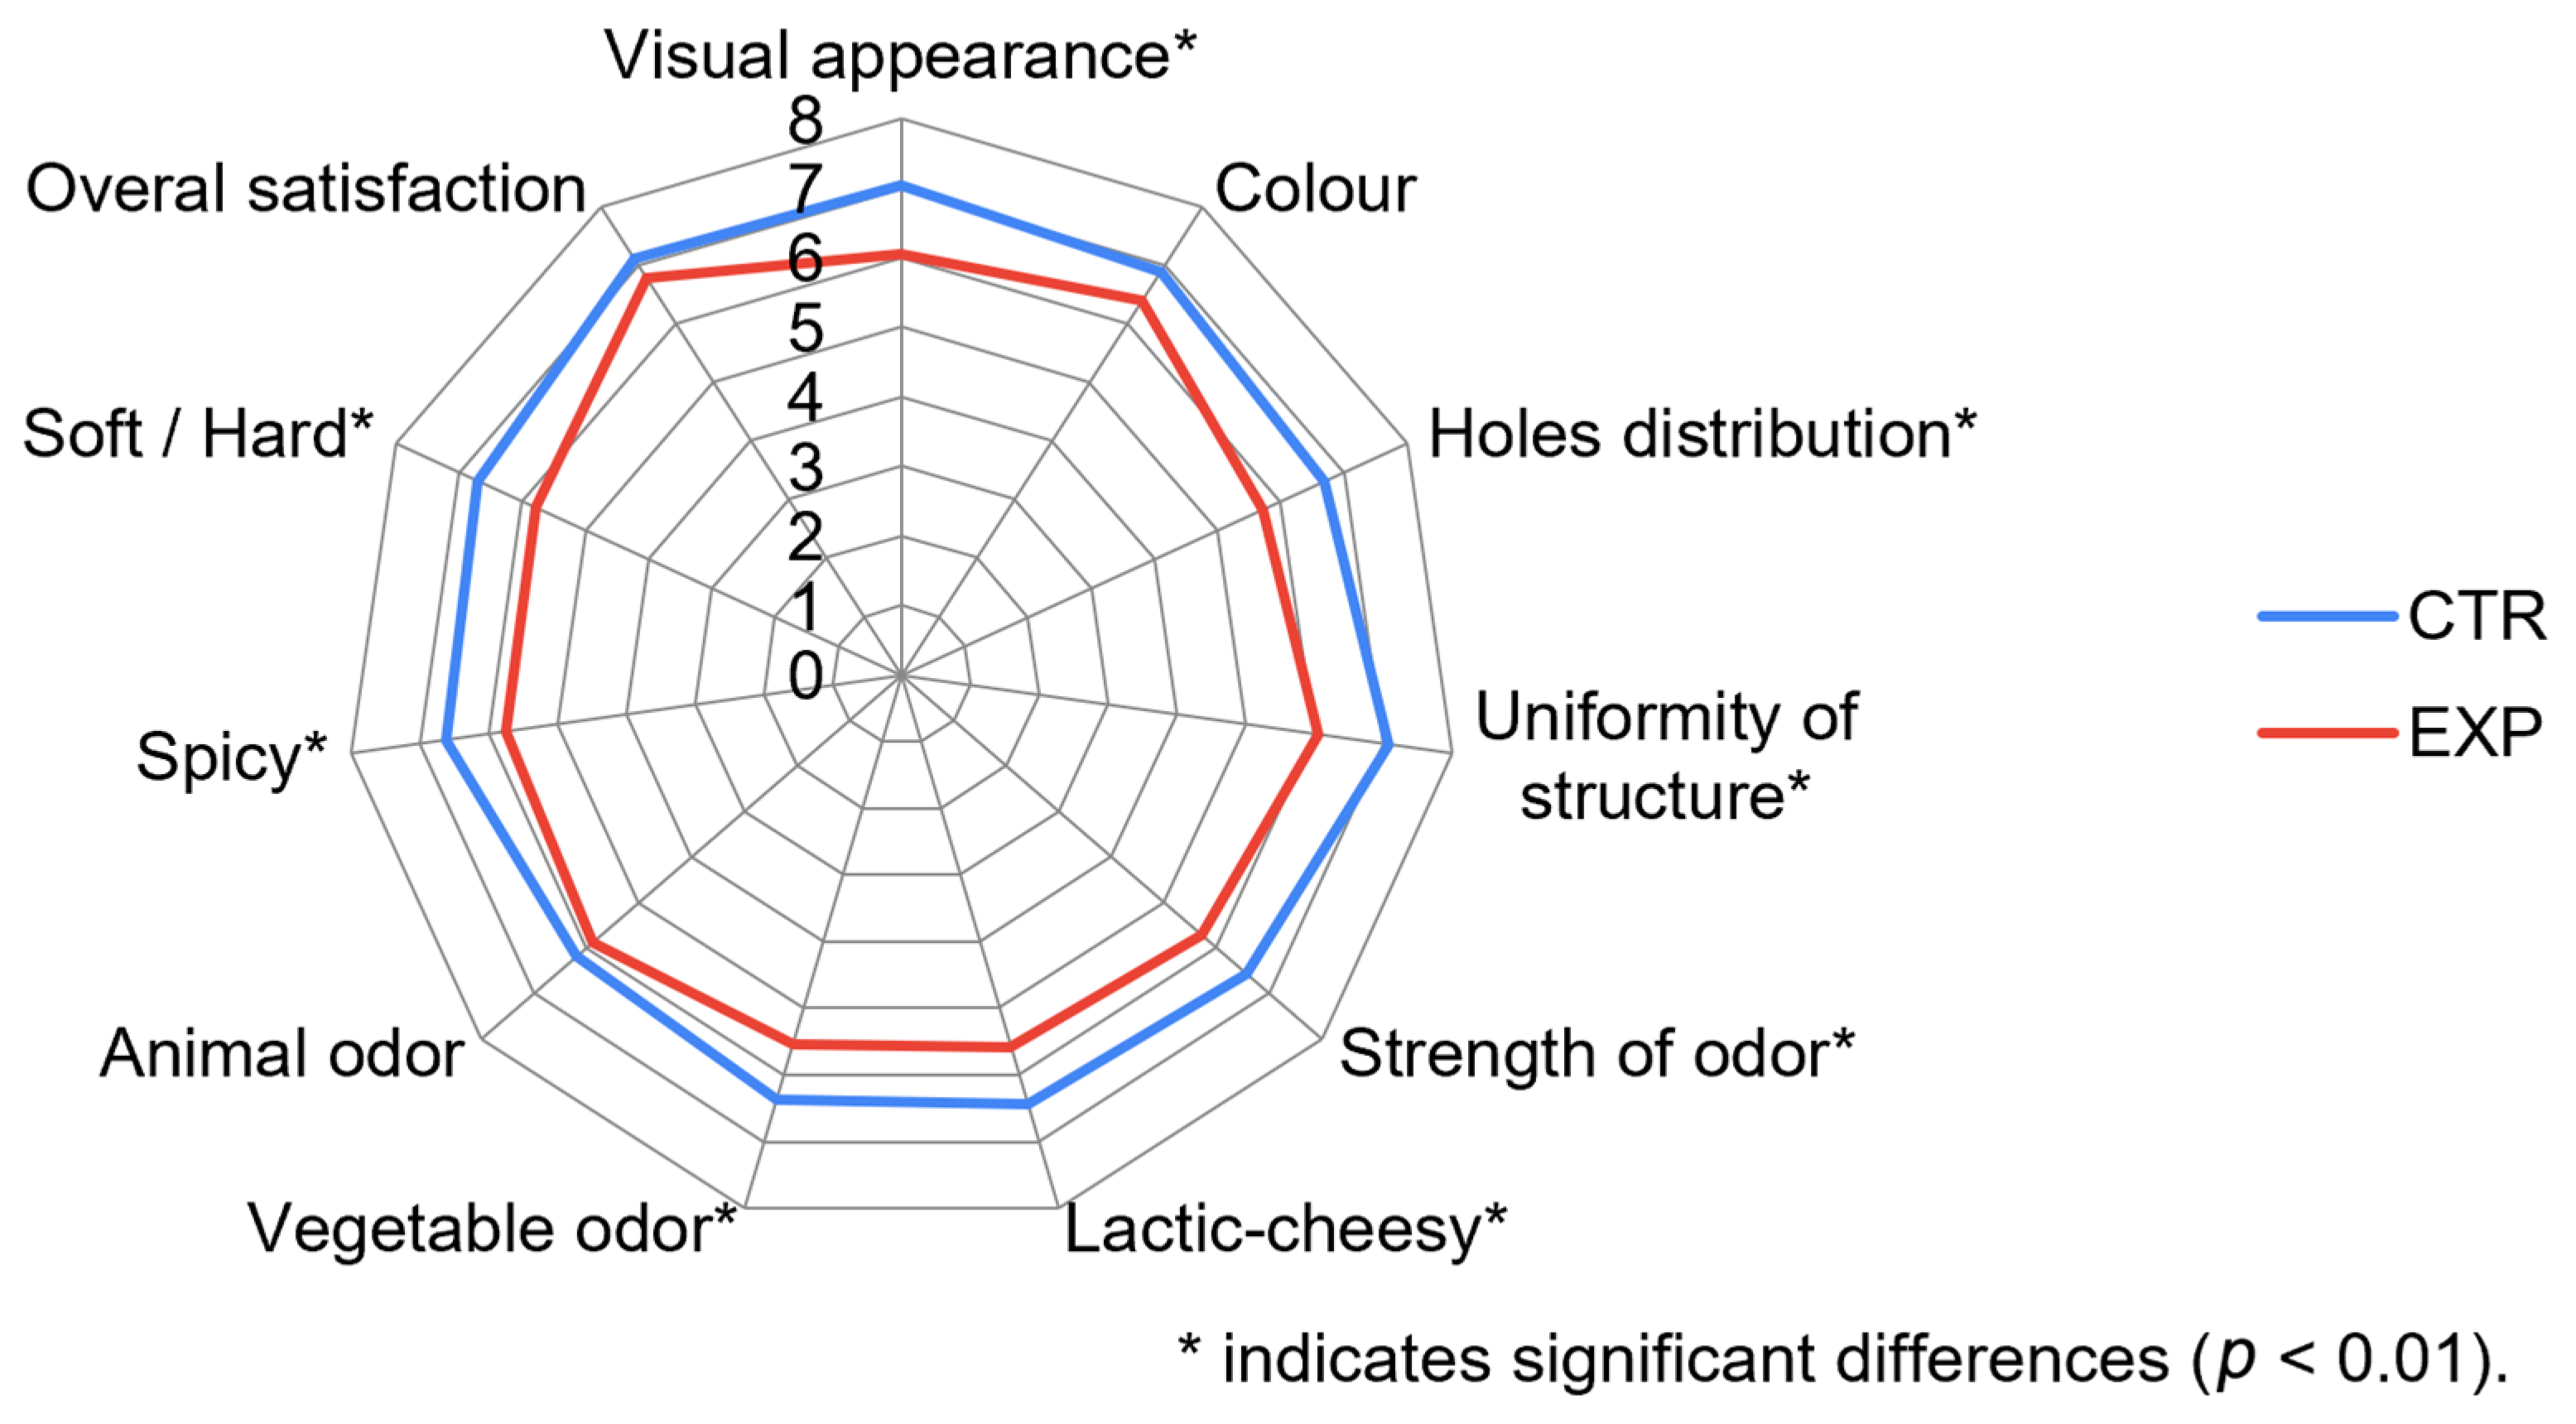
The sensory profiles of ripened cheeses are presented in
Figure 2. Sensory evaluation is an essential step in the assessment of dairy products prior to commercialization, as alternative feeding strategies and production practices may influence consumer perception and product acceptability [
82]. The sensory properties of cheese are affected by several factors, including animal diet, farm management practices [
83], and the microbiological quality of milk used for cheesemaking [
84].
With the exception of hole distribution and vegetable odor, cheeses produced from the milk of ewes receiving the PDOC-supplemented diet generally received lower scores for visual appearance, structural uniformity, odor intensity, lactic and cheesy odor, spicy note, and texture than those from the CTR group. Despite these differences in individual sensory attributes, the two cheese types showed comparable overall acceptability, indicating that PDOC supplementation altered specific sensory characteristics without negatively affecting consumer appreciation. In contrast, Chiofalo et al. [
15] reported greater consumer acceptance of cheese produced from the milk of dairy cows supplemented with PDOC at 15% of dietary dry matter. This discrepancy may be attributed to differences in animal species, feeding system, cheesemaking technology, and ripening conditions, as Chiofalo et al. [
15] evaluated a semi-ripened cow milk cheese, whereas the present study focused on a 6-month-ripened ewe milk Pecorino cheese.
Table 2.
Chemical composition of diets and ingredients used to formulate diets (means ± SD) adapted from Maniaci et al. [
7].
Table 2.
Chemical composition of diets and ingredients used to formulate diets (means ± SD) adapted from Maniaci et al. [
7].
| Items | Concentrate | Pasture | PDOC |
|---|
| CTR | EXP |
|---|
| Dry Matter, % | 88.72 ± 0.32 | 89.20 ± 0.24 | 21.42 ± 8.00 | 93.91 ± 0.22 |
| Crude Protein, % of DM | 19.06 ± 0.48 | 20.97 ± 0.28 | 14.92 ± 3.54 | 11.50 ± 0.34 |
| Ether extract, % of DM | 2.75 ± 0.08 | 5.68 ± 0.39 | 2.28 ± 0.32 | 21.70 ± 0.55 |
| aNDFom, % of DM | 32.19 ± 2.58 | 36.48 ± 1.14 | 46.06 ± 9.47 | 62.27 ± 1.10 |
| ADFom, % of DM | 15.23 ± 1.74 | 16.70 ± 1.06 | 28.90 ± 6.02 | 48.78 ± 0.54 |
| ADL, % of DM | 2.04 ± 0.08 | 3.88 ± 0.05 | 4.77 ± 1.36 | 22.08 ± 1.70 |
| Ash, % of DM | 5.76 ± 0.43 | 4.97 ± 0.18 | 2.98 ± 0.57 | 3.40 ± 0.65 |
| NFC | 40.25 ± 2.99 | 31.89 ± 1.38 | 24.43 ± 5.95 | 1.14 ± 0.12 |
| NEL (kcal/kg DM) * | 1872 ± 27.3 | 1800 ± 23.6 | - | - |
| NEL (UFL/kg DM) * | 1.06 ± 0.03 | 1.02 ± 0.02 | - | - |
| C16:0 | 18.65 ± 0.92 | 17.78 ± 0.84 | 18.37 ± 1.45 | 19.14 ± 1.07 |
| C18:0 | 1.58 ± 0.18 | 2.23 ± 0.27 | 2.23 ± 0.53 | 2.91 ± 0.25 |
| C18:1 n-9 OA | 19.27 ± 1.05 | 35.55 ± 1.27 | 10.63 ± 4.50 | 55.56 ± 1.29 |
| C18:2 n-6 LA | 51.49 ± 3.17 | 35.67 ± 2.41 | 24.23 ± 8.36 | 12.36 ± 1.23 |
| C18:3 n-3 ALA | 5.21 ± 0.43 | 3.13 ± 0.27 | 35.38 ± 10.61 | 0.76 ± 0.09 |
| SFA | 20.98 ± 0.83 | 20.84 ± 0.77 | 23.92 ± 2.38 | 22.94 ± 1.13 |
| MUFA | 21.54 ± 1.12 | 38.36 ± 1.57 | 12.73 ± 5.27 | 59.87 ± 1.31 |
| PUFA | 57.48 ± 2.26 | 40.80 ± 2.17 | 63.35 ± 7.52 | 17.20 ± 1.49 |
| Polyphenols mg GAE/g DM | 3.79 ± 0.47 | 5.60 ± 0.06 | 14.34 ± 3.21 | 7.52 ± 0.44 |
Table 3.
Physicochemical parameters of bulk milk used for cheesemaking.
Table 3.
Physicochemical parameters of bulk milk used for cheesemaking.
| Items | Bulk Milk | SEM | p-Value |
|---|
| CTR | EXP |
|---|
| Fat (%) | 6.01 | 6.15 | 0.289 | 0.063 |
| Protein (%) | 5.40 | 5.38 | 0.041 | 0.629 |
| Casein (%) | 4.11 | 4.09 | 0.034 | 0.571 |
| Non-protein N (%) | 0.038 | 0.029 | 0.010 | 0.551 |
| Whey protein (%) | 1.08 | 1.38 | 0.139 | 0.176 |
| Lactose (%) | 4.66 | 4.66 | 0.035 | 0.999 |
| Urea (mg/dL) | 40.51 | 39.64 | 0.709 | 0.178 |
| SCC (log10) | 5.92 | 6.19 | 0.087 | 0.039 |
| TBC (log10 cfu/mL) | 5.53 | 5.80 | 0.167 | 0.069 |
| pH | 6.70 | 6.73 | 0.017 | 0.064 |
| r (min) | 20.56 | 21.10 | 1.019 | 0.401 |
| a30 (mm) | 42.35 | 45.58 | 2.229 | 0.013 |
| K20 (min) | 2.25 | 1.71 | 0.252 | 0.031 |
Table 4.
Physical properties and chemical composition of Ricotta and ripened Pecorino Siciliano PDO cheeses.
Table 4.
Physical properties and chemical composition of Ricotta and ripened Pecorino Siciliano PDO cheeses.
| Items | PDO Cheeses | SEM | p-Value | Ricotta | SEM | p-Value |
|---|
| CTR | EXP | CTR | EXP |
|---|
| DM (%) | 69.44 | 70.19 | 1.400 | 0.414 | 30.78 | 31.91 | 1.51 | 0.108 |
| CP (%DM) | 43.24 | 43.45 | 0.867 | 0.868 | 31.49 | 30.50 | 1.66 | 0.657 |
| EE (%DM) | 45.06 | 44.91 | 0.72 | 0.798 | 56.83 | 57.74 | 2.694 | 0.803 |
| Ash (%DM) | 9.11 | 9.44 | 0.296 | 0.328 | 4.86 | 4.86 | 0.243 | 0.980 |
| POV (mEq O2/kg fat) | 2.26 | 2.96 | 0.445 | 0.316 | 2.05 | 1.94 | 0.169 | 0.673 |
| TPC (mg GAE/g DM) | 7.46 | 7.34 | 0.175 | 0.649 | 3.26 | 2.61 | 0.079 | 0.002 |
| TBARS (mg/kg DM) | 0.20 | 0.24 | 0.048 | 0.568 | | | | |
| Titratable acidity | 0.43 | 0.42 | 0.028 | 0.716 | | | | |
| L*, lightness | 74.28 | 70.46 | 2.503 | 0.331 | | | | |
| a*, redness | −3.45 | −3.65 | 0.261 | 0.437 | | | | |
| b*, yellowness | 11.02 | 11.38 | 0.283 | 0.429 | | | | |
| Hardness (kg/cm2) | 0.80 | 0.92 | 0.115 | 0.285 | | | | |
Table 5.
Total fatty acids (% DM) and short- and medium-chain fatty acid profiles (g/100 g FA) of Ricotta and ripened Pecorino Siciliano PDO cheeses.
Table 5.
Total fatty acids (% DM) and short- and medium-chain fatty acid profiles (g/100 g FA) of Ricotta and ripened Pecorino Siciliano PDO cheeses.
| Fatty Acid (FA) | Pecorino Cheese | SEM | p-Value | Ricotta Cheese | SEM | p-Value |
|---|
| CTR | EXP | CTR | EXP |
|---|
| Total FA, % DM | 45.26 | 43.78 | 1.581 | 0.537 | 53.06 | 52.13 | 2.690 | 0.763 |
| C4:0 | 2.12 | 2.37 | 0.315 | 0.562 | 2.54 | 2.40 | 0.128 | 0.475 |
| C6:0 | 2.79 | 2.56 | 0.130 | 0.259 | 2.49 | 2.51 | 0.989 | 0.868 |
| C8:0 | 2.86 | 2.63 | 0.172 | 0.312 | 2.49 | 2.47 | 0.152 | 0.778 |
| C10:0 | 8.12 | 7.61 | 0.492 | 0.278 | 7.01 | 7.17 | 0.445 | 0.234 |
| C10:1 | 0.37 | 0.34 | 0.019 | 0.027 | 0.32 | 0.32 | 0.020 | 0.940 |
| C12:0 | 4.40 | 4.21 | 0.244 | 0.143 | 4.10 | 4.20 | 0.265 | 0.234 |
| C12:1 | 0.18 | 0.17 | 0.011 | 0.004 | 0.05 | 0.04 | 0.003 | 0.137 |
| C14:0 iso | 0.14 | 0.13 | 0.004 | 0.232 | 0.30 | 0.30 | 0.013 | 0.596 |
| C14:0 | 10.31 | 10.43 | 0.181 | 0.669 | 10.88 | 11.08 | 0.170 | 0.453 |
| C14:1 | 1.01 | 0.97 | 0.032 | 0.033 | 0.66 | 0.65 | 0.018 | 0.233 |
| C15:0 iso | 0.32 | 0.32 | 0.013 | 0.990 | 0.31 | 0.31 | 0.010 | 0.667 |
| C15:0 | 1.33 | 1.32 | 0.026 | 0.693 | 1.33 | 1.33 | 0.023 | 0.775 |
| C15:1 | 0.16 | 0.17 | 0.015 | 0.674 | 0.26 | 0.26 | 0.400 | 0.865 |
| C16:0 | 22.29 | 23.32 | 0.834 | 0.390 | 24.46 | 24.55 | 0.736 | 0.707 |
| C16:1 | 1.64 | 0.99 | 0.143 | 0.023 | 1.72 | 1.66 | 0.032 | 0.003 |
| C17:0 | 0.80 | 0.82 | 0.030 | 0.637 | 0.33 | 0.30 | 0.019 | 0.162 |
| C17:1 | 0.21 | 0.21 | 0.011 | 0.772 | 0.19 | 0.17 | 0.019 | 0.369 |
| C17:0 anteiso | 0.34 | 0.33 | 0.022 | 0.710 | 1.26 | 1.19 | 0.069 | 0.269 |
Table 6.
Long-chain fatty acid profile (g/100 g FA) and nutritional lipid indices of Ricotta and ripened Pecorino Siciliano PDO cheeses.
Table 6.
Long-chain fatty acid profile (g/100 g FA) and nutritional lipid indices of Ricotta and ripened Pecorino Siciliano PDO cheeses.
| Fatty Acids | Pecorino Cheese | SEM | p-Value | Ricotta Cheese | SEM | p-Value |
|---|
| CTR | EXP | CTR | EXP |
|---|
| C18:0 | 10.07 | 10.49 | 0.064 | 0.501 | 9.97 | 10.15 | 0.390 | 0.241 |
| C18:1 t11, TVA | 2.92 | 2.55 | 0.310 | 0.155 | 2.86 | 3.27 | 0.437 | 0.260 |
| C18:1 c9 OA | 16.18 | 17.10 | 0.707 | 0.106 | 19.69 | 19.07 | 0.602 | 0.147 |
| C18:2 n 6, LA | 1.91 | 2.06 | 0.117 | 0.044 | 1.92 | 1.92 | 0.123 | 0.968 |
| C18:2 c9 t11 RA, CLA | 1.21 | 1.00 | 0.123 | 0.047 | 0.93 | 0.82 | 0.108 | 0.008 |
| C18:3 n-6, GLA | 0.06 | 0.06 | 0.004 | 0.944 | 0.24 | 0.25 | 0.025 | 0.296 |
| C18:3 n-3, ALA | 1.14 | 1.09 | 0.065 | 0.514 | 0.92 | 0.90 | 0.068 | 0.289 |
| C19:0 | 0.40 | 0.36 | 0.031 | 0.279 | 0.15 | 0.14 | 0.019 | 0.220 |
| C20:0 | 0.27 | 0.29 | 0.028 | 0.269 | 0.10 | 0.09 | 0.010 | 0.050 |
| C20:4 n-6, AA | 0.10 | 0.10 | 0.008 | 0.595 | 0.09 | 0.09 | 0.010 | 0.796 |
| C20:5 n-3, EPA | 0.13 | 0.13 | 0.003 | 0.380 | 0.09 | 0.09 | 0.014 | 0.849 |
| C22:0 | 0.15 | 0.15 | 0.010 | 0.436 | 0.13 | 0.13 | 0.012 | 0.231 |
| SFA | 66.81 | 67.44 | 0.288 | 0.108 | 67.85 | 68.31 | 0.216 | 0.148 |
| MUFA | 27.49 | 27.14 | 0.130 | 0.050 | 27.40 | 27.09 | 0.221 | 0.257 |
| PUFA | 5.70 | 5.42 | 0.217 | 0.258 | 4.75 | 4.60 | 0.114 | 0.027 |
| n-6 PUFA | 2.26 | 2.41 | 0.046 | 0.393 | 2.37 | 2.38 | 0.134 | 0.906 |
| n-3 PUFA | 1.27 | 1.21 | 0.064 | 0.503 | 1.02 | 0.99 | 0.074 | 0.321 |
| n-3/n-6 | 0.57 | 0.52 | 0.202 | 0.043 | 0.44 | 0.42 | 0.051 | 0.224 |
| SCFA | 7.77 | 7.56 | 0.396 | 0.719 | 7.51 | 7.37 | 0.295 | 0.696 |
| MCFA | 26.34 | 25.66 | 0.766 | 0.024 | 22.67 | 23.11 | 0.839 | 0.234 |
| LCFA | 65.89 | 66.78 | 0.922 | 0.285 | 67.25 | 66.96 | 1.036 | 0.392 |
| Thrombogenic index | 2.22 | 2.34 | 0.082 | 0.281 | 2.47 | 2.53 | 0.063 | 0.182 |
| Health promoting Index | 0.49 | 0.47 | 0.012 | 0.357 | 0.45 | 0.43 | 0.006 | 0.206 |
Table 7.
Microbial evolution during cheese production.
Table 7.
Microbial evolution during cheese production.
| Samples | Growth Media |
|---|
| SMA 30 °C | MRS 30 °C | M17 30 °C | MRS 44 °C | M17 44 °C | BP | E. coli |
|---|
| Wooden vat surface | 6.35 ± 0.71 | 4.09 ± 0.16 | 6.16 ± 0.14 | 4.65 ± 0.19 | 6.22 ± 0.17 | <1 | 1.57 ± 0.11 |
| Bulk Milk (BM) | | | | | | | |
| CTR | 4.98 ± 0.04 B | 3.40 ± 0.14 B | 4.49 ± 0.23 B | 3.40 ± 0.14 B | 4.05 ± 0.10 B | 1.98 ± 0.22 | 1.38 ± 0.25 |
| EXP | 5.39 ± 0.16 A | 4.53 ± 0.18 A | 5.21 ± 0.14 A | 4.72 ± 0.25 A | 5.13 ± 0.18 A | 2.02 ± 0.13 | 1.30 ± 0.28 |
| p value | 0.045 | 0.007 | 0.037 | 0.009 | 0.006 | 0.847 | 0.794 |
| Milk after contact (MAC) | | | | | | | |
| CTR | 6.08 ± 0.25 | 4.35 ± 0.35 | 5.97 ± 0.10 | 4.27 ± 0.23 | 5.57 ± 0.40 | 2.06 ± 0.16 | 1.64 ± 0.21 |
| EXP | 6.16 ± 0.17 | 4.93 ± 0.11 | 6.03 ± 0.18 | 4.36 ± 0.18 | 5.70 ± 0.28 | 2.30 ± 0.18 | 2.02 ± 0.14 |
| p value | 0.746 | 0.124 | 0.722 | 0.707 | 0.745 | 0.274 | 0.137 |
| Curd (C) | | | | | | | |
| CTR | 6.51 ± 0.21 | 6.18 ± 0.25 | 6.31 ± 0.29 | 5.39 ± 0.30 | 5.25 ± 0.21 | 3.01 ± 0.14 | 3.00 ± 0.15 |
| EXP | 6.75 ± 0.14 | 6.61 ± 0.52 | 6.60 ± 0.42 | 5.69 ± 0.30 | 5.70 ± 0.14 | 3.10 ± 0.10 | 3.29 ± 0.39 |
| p value | 0.292 | 0.391 | 0.501 | 0.413 | 0.097 | 0.533 | 0.420 |
| Fresh cheese (FC) | | | | | | | |
| CTR | 7.32 ± 0.31 | 7.21 ± 0.14 | 7.29 ± 0.29 | 7.24 ± 0.11 | 7.35 ± 0.10 | 3.20 ± 0.17 | 3.24 ± 0.21 |
| EXP | 7.54 ± 0.23 | 7.65 ± 0.42 | 7.28 ± 0.18 | 7.35 ± 0.18 | 7.77 ± 0.12 | 3.43 ± 0.15 | 3.49 ± 0.16 |
| p value | 0.500 | 0.275 | 0.971 | 0.535 | 0.137 | 0.267 | 0.294 |
| Ripened cheese (RC) | | | | | | | |
| CTR | 7.95 ± 0.16 | 7.36 ± 0.24 | 7.80 ± 0.14 | 7.63 ± 0.19 | 7.94 ± 0.21 | <2 | <2 |
| EXP | 7.99 ± 0.15 | 7.41 ± 0.12 | 7.89 ± 0.19 | 7.74 ± 0.26 | 8.01 ± 0.18 | <2 | <2 |
| p value | 0.822 | 0.819 | 0.644 | 0.678 | 0.757 | n.e. | n.e. |
4. Conclusions
The inclusion of stabilized, partially destoned olive cake (17%, as-fed basis) in the concentrate of grazing dairy ewes did not affect bulk milk composition and improved milk coagulation properties. In Pecorino Siciliano PDO cheese, PDOC supplementation reduced the proportions of some medium-chain unsaturated fatty acids and the omega-3/omega-6 ratio, while overall sensory acceptability of Pecorino Siciliano PDO cheese was not affected. Although the microbial communities of raw milk differed between dietary treatments, those of ripened Pecorino Siciliano PDO cheese converged during cheesemaking and ripening, highlighting the predominant influence of cheesemaking and ripening processes over dietary treatment on the final cheese microbiota.
The absence of significant dietary effects on the overall fatty acid profile and oleic acid content of cheese contrasts with findings from previous studies and may be related to differences in forage-to-concentrate ratio, grazing management, olive cake processing, and the extended ripening period adopted in the present trial. A limitation of the present study is that only one inclusion level of PDOC was evaluated, preventing assessment of possible dose-dependent effects. Nevertheless, the 17% inclusion level was selected based on previous evidence in dairy sheep, which indicated its suitability without detrimental effects on animal performance and milk production. Further studies evaluating different inclusion levels would therefore be useful to identify the optimal dietary level of stabilized, partially destoned olive cake and to better characterize potential dose-dependent effects on milk and cheese quality.
Overall, stabilized, partially destoned olive cake represents a promising sustainable feed ingredient for grazing dairy ewes, as its inclusion at 17% in the concentrate maintained the technological and microbiological quality of Pecorino Siciliano PDO and the compositional and microbiological quality of Ricotta, while overall sensory acceptability of Pecorino Siciliano PDO cheese was not affected, although some changes in the nutritional characteristics of cheese were observed.




 ,
,