
Exploring Interrelationships between Colour, Composition, and Coagulation Traits of Milk from Cows, Goats, and Sheep

 ,
,  ,
,  , , and
Abstract
1. Introduction
2. Materials and Methods
2.1. Dataset
2.2. Laboratory Analysis
2.3. Statistical Analysis
3. Results
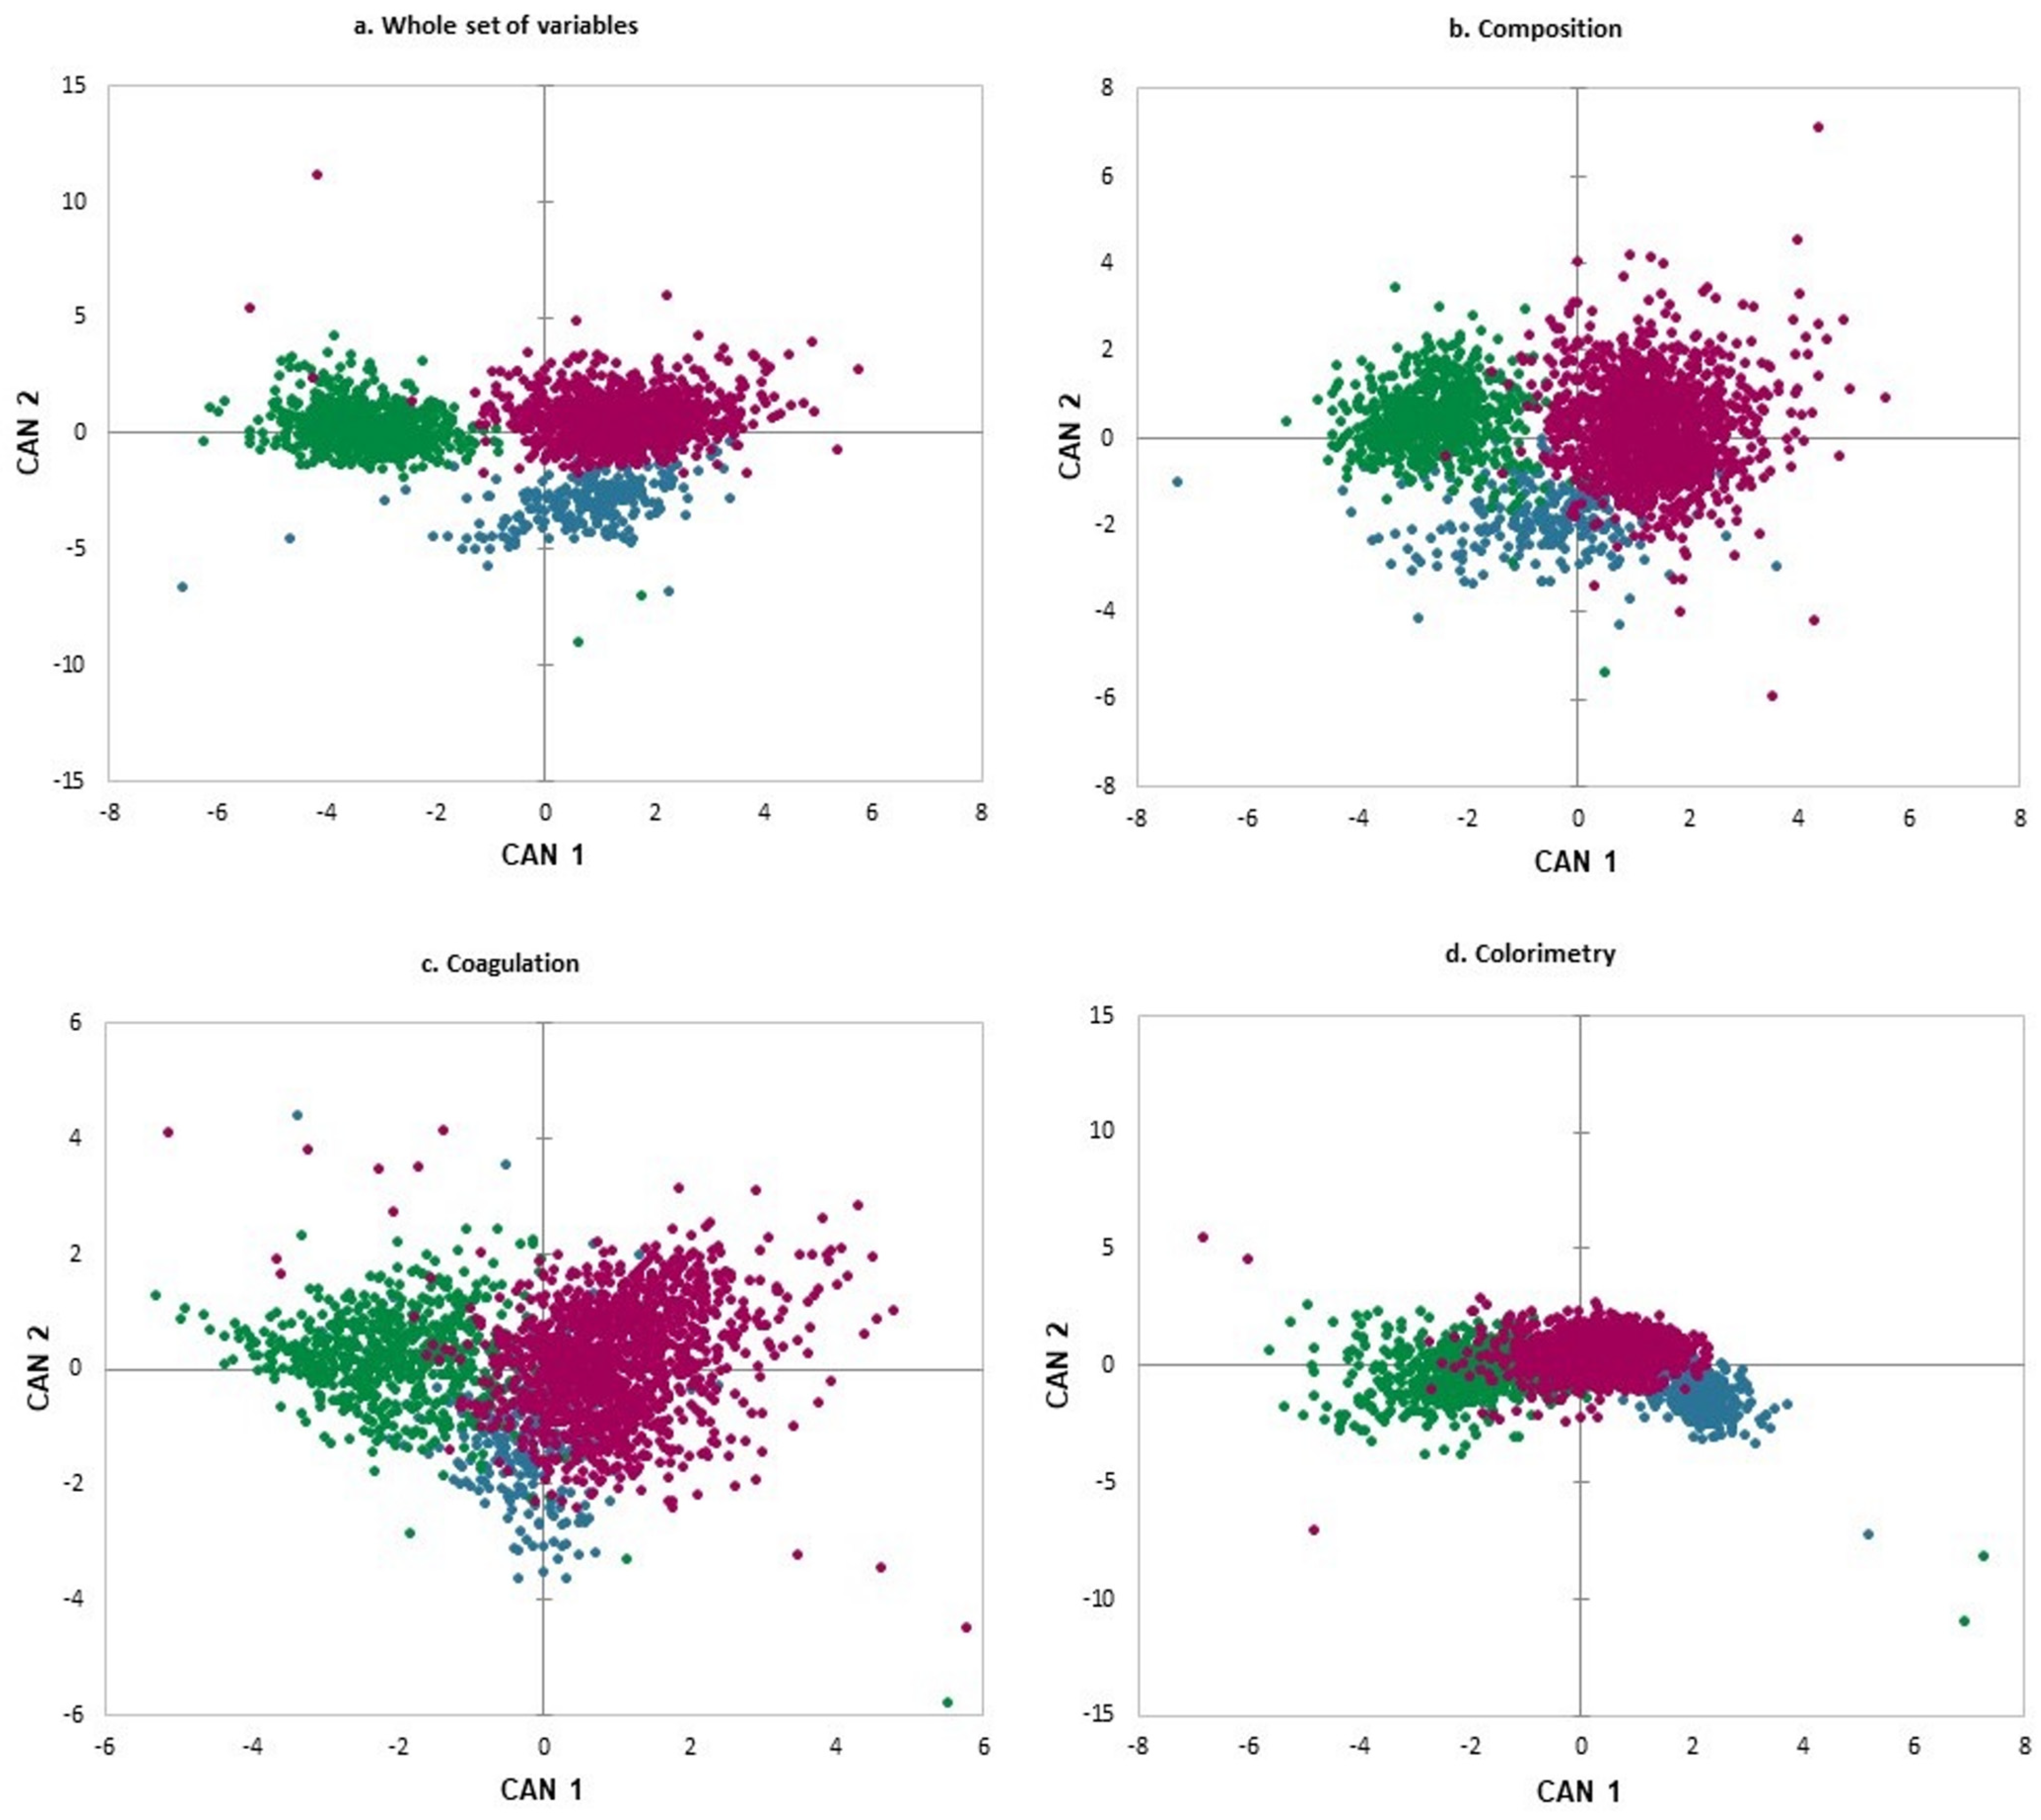
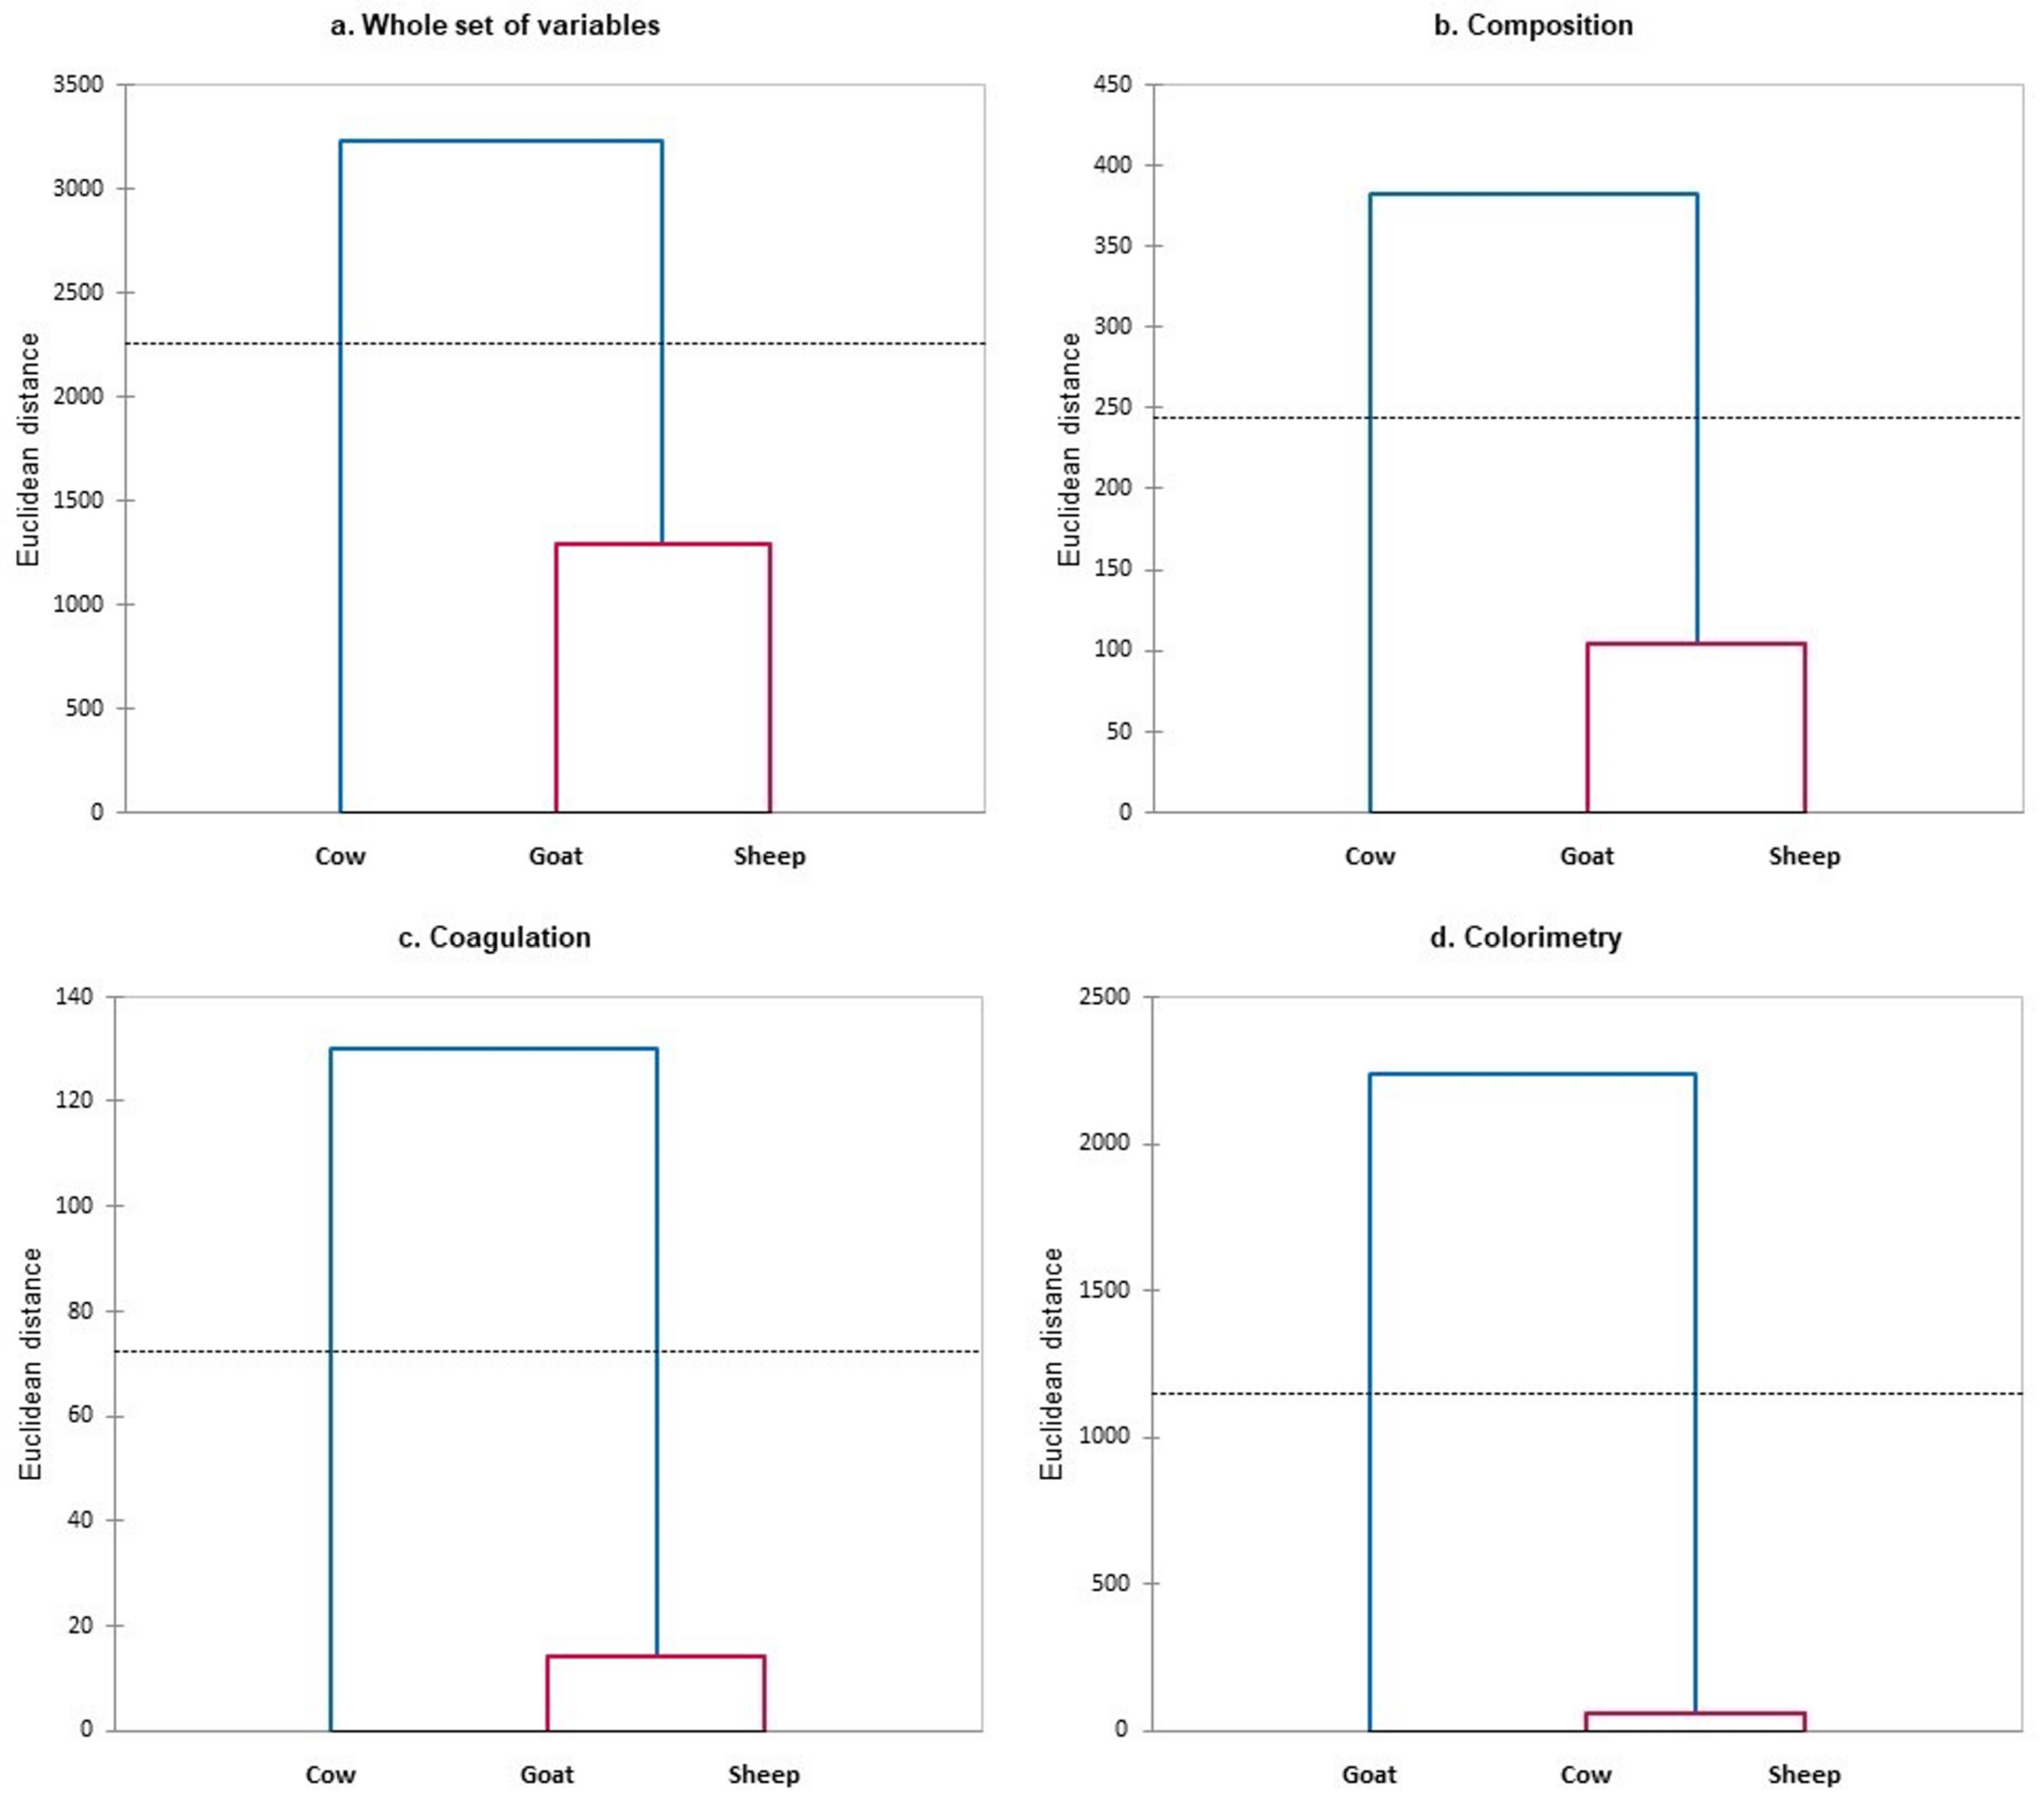
3.1. Differentiation of Milk from Dairy Species
3.2. Relationship among the Groups of Variables
4. Discussion
5. Conclusions
Author Contributions
Funding
Institutional Review Board Statement
Informed Consent Statement
Data Availability Statement
Acknowledgments
Conflicts of Interest
References
- Jiménez, M.A.; Jurado, J.J. Estudio Sobre La Calidad de Los Registros Genealógicos de La Raza Assaf En España. ITEA Inf. Tec. Econ. Agrar. 2015, 111, 247–258. [Google Scholar] [CrossRef]
- Smulders, J.P.; Serrano, M.; Pérez-Guzmán, M.D.; Jimenez, M.A.; Uribe, H.; Jurado, J.J. Stochastic Simulation of Manchega Sheep Breed Selection Scheme. Impact of Artificial Insemination, Progeny Testing System and Nucleus Size on Genetic Progress and Inbreeding. Livest. Sci. 2007, 106, 218–231. [Google Scholar] [CrossRef]
- Pazzola, M.; Stocco, G.; Ferragina, A.; Bittante, G.; Dettori, M.L.; Vacca, G.M.; Cipolat-Gotet, C. Cheese Yield and Nutrients Recovery in the Curd Predicted by Fourier-Transform Spectra from Individual Sheep Milk Samples. J. Dairy Sci. 2023, 106, 6759–6770. [Google Scholar] [CrossRef] [PubMed]
- Abdelgawad, A.R.; Rovai, M.; Caja, G.; Leitner, G.; Castillo, M. Evaluating Coagulation Properties of Milk from Dairy Sheep with Subclinical Intramammary Infection Using near Infrared Light Scatter. A Preliminary Study. J. Food Eng. 2016, 168, 180–190. [Google Scholar] [CrossRef]
- Pazzola, M.; Cipolat-Gotet, C.; Bittante, G.; Cecchinato, A.; Dettori, M.L.; Vacca, G.M. Phenotypic and Genetic Relationships between Indicators of the Mammary Gland Health Status and Milk Composition, Coagulation, and Curd Firming in Dairy Sheep. J. Dairy Sci. 2018, 101, 3164–3175. [Google Scholar] [CrossRef]
- Figueroa Sánchez, A.; Perea Muñoz, J.; Caballero-Villalobos, J.; Arias Sánchez, R.; Garzón, A.; Angón Sánchez de Pedro, E. Coagulation Process in Manchega Sheep Milk from Spain: A Path Analysis Approach. J. Dairy Sci. 2021, 104, 7544–7554. [Google Scholar] [CrossRef]
- Garzón, A.; Figueroa, A.; Caballero-Villalobos, J.; Angón, E.; Arias, R.; Perea, J.M. Derivation of Multivariate Indices of Milk Composition, Coagulation Properties, and Curd Yield in Manchega Dairy Sheep. J. Dairy Sci. 2021, 104, 8618–8629. [Google Scholar] [CrossRef]
- Garzón, A.; Perea, J.M.; Arias, R.; Angón, E.; Caballero-Villalobos, J. Efficiency of Manchega Sheep Milk Intended for Cheesemaking and Determination of Factors Causing Inefficiency. Animals 2023, 13, 255. [Google Scholar] [CrossRef] [PubMed]
- Bittante, G.; Amalfitano, N.; Bergamaschi, M.; Patel, N.; Haddi, M.-L.; Benabid, H.; Pazzola, M.; Vacca, G.M.; Tagliapietra, F.; Schiavon, S. Composition and Aptitude for Cheese-Making of Milk from Cows, Buffaloes, Goats, Sheep, Dromedary Camels, and Donkeys. J. Dairy Sci. 2022, 105, 2132–2152. [Google Scholar] [CrossRef]
- Li, S.; Delger, M.; Dave, A.; Singh, H.; Ye, A. Acid and Rennet Gelation Properties of Sheep, Goat, and Cow Milks: Effects of Processing and Seasonal Variation. J. Dairy Sci. 2023, 106, 1611–1625. [Google Scholar] [CrossRef] [PubMed]
- Winkelman, A.M.; Johnson, D.L.; MacGibbon, A.K.H. Estimation of Heritabilities and Correlations Associated with Milk Color Traits. J. Dairy Sci. 1999, 82, 215–224. [Google Scholar] [CrossRef] [PubMed]
- Espada, E.; Vijverberg, H.; Maasland, N.V. Milk Color Analysis as a Tool for the Detection of Abnormal Milk. In Proceedings of the North American Conference on Robotic Milking, Toronto, ON, Canada, 20–22 March 2002; pp. 28–38. [Google Scholar]
- McDermott, A.; Visentin, G.; McParland, S.; Berry, D.P.; Fenelon, M.A.; De Marchi, M. Effectiveness of Mid-Infrared Spectroscopy to Predict the Color of Bovine Milk and the Relationship between Milk Color and Traditional Milk Quality Traits. J. Dairy Sci. 2016, 99, 3267–3273. [Google Scholar] [CrossRef] [PubMed]
- Figueroa, A.; Caballero-Villalobos, J.; Angón, E.; Arias, R.; Garzón, A.; Perea, J.M. Using Multivariate Analysis to Explore the Relationships between Color, Composition, Hygienic Quality, and Coagulation of Milk from Manchega Sheep. J. Dairy Sci. 2020, 103, 4951–4957. [Google Scholar] [CrossRef]
- Milovanovic, B.; Djekic, I.; Miocinovic, J.; Djordjevic, V.; Lorenzo, J.M.; Barba, F.J.; Mörlein, D.; Tomasevic, I. What Is the Color of Milk and Dairy Products and How Is It Measured? Foods 2020, 9, 1629. [Google Scholar] [CrossRef]
- Caballero-Villalobos, J.; Perea, J.M.; Angón, E.; Arias, R.; Garzón, A. Coagulation Efficiency and Its Determinant Factors: A Case Study for Manchega Ewe Milk in the Region of Castilla-La Mancha, Spain. J. Dairy Sci. 2018, 101, 3878–3886. [Google Scholar] [CrossRef] [PubMed]
- Jiménez, L.; Caballero-Villalobos, J.; Garzón, A.; Oliete, B.; Pérez-Guzmán, M.D.; Arias, R. Exploring the Relationships between Coagulation, Composition, and Hygienic Quality of Bulk Tank Milk from Manchega Sheep. Small Rumin. Res. 2023, 228, 107106. [Google Scholar] [CrossRef]
- ISO/CIE 11664-4; 2019 Colorimetry—Part 4: CIE 1976 L*a*b* Colour Space. ISO: Geneva, Switzerland, 2019.
- García-Gudiño, J.; Blanco-Penedo, I.; Gispert, M.; Brun, A.; Perea, J.; Font-i-Furnols, M. Understanding Consumers’ Perceptions towards Iberian Pig Production and Animal Welfare. Meat Sci. 2021, 172, 108317. [Google Scholar] [CrossRef]
- Miles, A.; Perea Muñoz, J.M.; Bayle-Sempere, J.T. Low Satisfaction and Failed Relational Coordination among Relevant Stakeholders in Spanish Mediterranean Marine Protected Areas. J. Environ. Manag. 2020, 272, 111003. [Google Scholar] [CrossRef]
- Everitt, B.S.; Dunn, G. Applied Multivariate Data Analysis; Arnold: London, UK, 1991; pp. 128–148. [Google Scholar]
- Tabachnick, B.G.; Fidell, L.S. Using Multivariate Statistics, 3rd ed.; Harper Collins: New York, NY, USA, 1996; pp. 381–383. [Google Scholar]
- Rivas, J.; Perea, J.M.; De-Pablos-Heredero, C.; Angon, E.; Barba, C.; García, A. Canonical Correlation of Technological Innovation and Performance in Sheep’s Dairy Farms: Selection of a Set of Indicators. Agric. Syst. 2019, 176, 102665. [Google Scholar] [CrossRef]
- Liu, J.; Drane, W.; Liu, X.; Wu, T. Examination of the Relationships between Environmental Exposures to Volatile Organic Compounds and Biochemical Liver Tests: Application of Canonical Correlation Analysis. Environ. Res. 2009, 109, 193–199. [Google Scholar] [CrossRef]
- Yin, X. Canonical Correlation Analysis Based on Information Theory. J. Multivar. Anal. 2004, 91, 161–176. [Google Scholar] [CrossRef]
- Gelé, M.; Minery, S.; Astruc, J.M.; Brunschwig, P.; Ferrand-Calmels, M.; Lagriffouls, G.; Larroque, H.; Legarto, J.; Leray, O.; Martin, P.; et al. Phénotypage et Génotypage à Grande Échelle de La Composition Fine Des Laits Dans Les Filières Bovine, Ovine et Caprine. INRAE Prod. Anim. 2014, 27, 255–268. [Google Scholar] [CrossRef]
- Legarto, J.; Gelé, M.; Ferlay, A.; Hurtaud, C.; Lagriffoul, G.; Palhière, I.; Peyraud, J.L.; Rouillé, B.; Brunschwig, P. Effets Des Conduites d’élevage Sur La Production de Lait, Las Taux Butyreux et Protéique et La Composition En Acides Gras Du Lait de Vache…. INRAE Prod. Anim 2014, 27, 269–282. [Google Scholar] [CrossRef]
- Calvo, M.M.; Balcones, E. Some Factors Influencing the Syneresis of Bovine, Ovine, and Caprine Milks. J. Dairy Sci. 2000, 83, 1733–1739. [Google Scholar] [CrossRef]
- Barłowska, J.; Szwajkowska, M.; Litwińczuk, Z.; Król, J. Nutritional Value and Technological Suitability of Milk from Various Animal Species Used for Dairy Production. Compr. Rev. Food Sci. Food Saf. 2011, 10, 291–302. [Google Scholar] [CrossRef]
- Roy, D.; Ye, A.; Moughan, P.J.; Singh, H. Gelation of Milks of Different Species (Dairy Cattle, Goat, Sheep, Red Deer, and Water Buffalo) Using Glucono-δ-Lactone and Pepsin. J. Dairy Sci. 2020, 103, 5844–5862. [Google Scholar] [CrossRef]
- Bittante, G.; Cipolat-Gotet, C.; Malchiodi, F.; Sturaro, E.; Tagliapietra, F.; Schiavon, S.; Cecchinato, A. Effect of Dairy Farming System, Herd, Season, Parity, and Days in Milk on Modeling of the Coagulation, Curd Firming, and Syneresis of Bovine Milk. J. Dairy Sci. 2015, 98, 2759–2774. [Google Scholar] [CrossRef] [PubMed]
- Stocco, G.; Pazzola, M.; Dettori, M.L.; Paschino, P.; Bittante, G.; Vacca, G.M. Effect of Composition on Coagulation, Curd Firming, and Syneresis of Goat Milk. J. Dairy Sci. 2018, 101, 9693–9702. [Google Scholar] [CrossRef]
- Claeys, W.L.; Verraes, C.; Cardoen, S.; De Block, J.; Huyghebaert, A.; Raes, K.; Dewettinck, K.; Herman, L. Consumption of Raw or Heated Milk from Different Species: An Evaluation of the Nutritional and Potential Health Benefits. Food Control 2014, 42, 188–201. [Google Scholar] [CrossRef]
- Leitner, G.; Lavon, Y.; Matzrafi, Z.; Benun, O.; Bezman, D.; Merin, U. Somatic Cell Counts, Chemical Composition and Coagulation Properties of Goat and Sheep Bulk Tank Milk. Int. Dairy J. 2016, 58, 9–13. [Google Scholar] [CrossRef]
- Marina, H.; Pelayo, R.; Gutiérrez-Gil, B.; Suárez-Vega, A.; Esteban-Blanco, C.; Reverter, A.; Arranz, J.J. Low-Density SNP Panel for Efficient Imputation and Genomic Selection of Milk Production and Technological Traits in Dairy Sheep. J. Dairy Sci. 2022, 105, 8199–8217. [Google Scholar] [CrossRef]
- Kondyli, E.; Pappa, E.C.; Bosnea, L.; Vlachou, A.-M.; Malamou, E. Chemical, Textural and Organoleptic Characteristics of Greek Semihard Goat Cheese Made with Different Starter Cultures during Ripening and Storage. Int. Dairy J. 2023, 145, 105717. [Google Scholar] [CrossRef]
- Santos, R.N.; de Sá Marquim, G.H.M.; Nogueira, F.; Nogueira, D.M.; Voltolini, T.V.; Júnior, E.S.L. Physicochemical Composition of the Milk and Cheese Yield of Sheep Supplemented with Concentrate Based on Corn Grain or Whole Cottonseed. Small Rumin. Res. 2023, 227, 107085. [Google Scholar] [CrossRef]
- Pazzola, M. Coagulation Traits of Sheep and Goat Milk. Animals 2019, 9, 540. [Google Scholar] [CrossRef]
- Park, Y.W. Rheological Characteristics of Goat and Sheep Milk. Small Rumin. Res. 2007, 68, 73–87. [Google Scholar] [CrossRef]
- Vacca, G.M.; Stocco, G.; Dettori, M.L.; Pira, E.; Bittante, G.; Pazzola, M. Milk Yield, Quality, and Coagulation Properties of 6 Breeds of Goats: Environmental and Individual Variability. J. Dairy Sci. 2018, 101, 7236–7247. [Google Scholar] [CrossRef]
- Solah, V.A.; Staines, V.; Honda, S.; Limley, H.A. Measurement of Milk Color and Composition: Effect of Dietary Intervention on Western Australian Holstein-Friesian Cow’s Milk Quality. J. Food Sci. 2007, 72, 560–566. [Google Scholar] [CrossRef] [PubMed]
- Chudy, S.; Bilska, A.; Kowalski, R.; Teichert, J. Colour of Milk and Milk Products in CIE L*a*b* Space. Med. Weter. 2020, 76, 77–81. [Google Scholar] [CrossRef]

| Variable | Description | Unit/Range |
|---|---|---|
| FAT | Fat content | % |
| CP | Crude protein | % |
| LAC | Lactose content | % |
| pH | pH | −log[H+] |
| L* | Lightness | 0, 100 |
| a* | red/green balance | −60, +60 |
| b* | blue/yellow balance | −60, +60 |
| RCT | Rennet clothing time | min |
| k20 | Curd firming time | min |
| A60 | Curd firmness at 60 min | mm |
| CY | Curd yield | g/10 mL of milk |
| DCY | Dry curd yield | % |
| Variable 1,* | Cow | Goat | Sheep | Wilks’ λ | F-Value | p-Value | R2 2 | CAN1 3 | CAN2 3 |
|---|---|---|---|---|---|---|---|---|---|
| All variables | |||||||||
| FAT | 2.44 ± 1.12 c | 5.56 ± 1.23 b | 6.54 ± 1.81 a | 0.429 | 1518.51 | <0.001 | 0.867 | 0.835 | 0.072 |
| CP | 4.18± 0.47 b | 3.98 ± 0.54 c | 5.59 ± 0.79 a | 0.474 | 1264.47 | <0.001 | 0.775 | 0.632 | 0.603 |
| LAC | 4.62 ± 0.26 c | 4.86 ± 0.45 b | 4.95 ± 0.36 a | 0.850 | 201.44 | <0.001 | 0.283 | 0.427 | 0.052 |
| pH | 6.70 ± 0.08 a | 6.66 ± 0.13 b | 6.61 ± 0.14 c | 0.898 | 130.12 | <0.001 | 0.423 | −0.343 | −0.111 |
| RCT | 20.48 ± 6.00 | 20.07 ± 7.38 | 19.88 ± 10.03 | 0.999 | 1.07 | 0.343 | 0.473 | −0.034 | −0.005 |
| k20 | 9.39 ± 6.01 a | 6.06 ± 3.95 b | 3.53 ± 3.09 c | 0.730 | 420.56 | <0.001 | 0.518 | −0.562 | −0.145 |
| A60 | 30.94 ± 9.44 b | 25.09 ± 9.65 c | 38.69 ± 10.99 a | 0.817 | 255.28 | <0.001 | 0.384 | 0.280 | 0.464 |
| CY | 16.64 ± 3.72 c | 20.59 ± 4.78 b | 26.76 ± 5.77 a | 0.558 | 903.79 | <0.001 | 0.879 | 0.695 | 0.295 |
| DCY | 35.02 ± 4.09 b | 42.17 ± 6.08 a | 42.37 ± 5.43 a | 0.694 | 502.89 | <0.001 | 0.536 | 0.611 | −0.059 |
| L* | 78.27 ± 2.87 c | 83.47 ± 1.28 b | 83.61 ± 2.21 a | 0.483 | 1221.35 | <0.001 | 0.736 | 0.794 | −0.077 |
| a* | −4.13 ± 1.34 c | −1.12 ± 0.51 a | −2.46 ± 0.71 b | 0.483 | 1217.35 | <0.001 | 0.707 | 0.679 | −0.505 |
| b* | 2.52 ± 3.17 c | 3.29 ± 1.22 b | 4.49 ± 1.93 a | 0.870 | 169.63 | <0.001 | 0.572 | 0.377 | 0.159 |
| Composition | |||||||||
| FAT | 2.44 ± 1.12 c | 5.56 ± 1.23 b | 6.54 ± 1.81 a | 0.429 | 1518.51 | <0.001 | 0.491 | 0.855 | −0.266 |
| CP | 4.18± 0.47 b | 3.98 ± 0.54 c | 5.59 ± 0.79 a | 0.474 | 1264.47 | <0.001 | 0.482 | 0.770 | 0.512 |
| LAC | 4.62 ± 0.26 c | 4.86 ± 0.45 b | 4.95 ± 0.36 a | 0.850 | 201.44 | <0.001 | 0.021 | 0.441 | −0.116 |
| pH | 6.70 ± 0.08 a | 6.66 ± 0.13 b | 6.61 ± 0.14 c | 0.898 | 130.12 | <0.001 | 0.077 | −0.370 | 0.004 |
| Coagulation | |||||||||
| RCT | 20.48 ± 6.00 | 20.07 ± 7.38 | 19.88 ± 10.03 | 0.999 | 1.07 | 0.343 | 0.286 | −0.038 | 0.004 |
| k20 | 9.39 ± 6.01 a | 6.06 ± 3.95 b | 3.53 ± 3.09 c | 0.730 | 420.56 | <0.001 | 0.467 | −0.647 | −0.048 |
| A60 | 30.94 ± 9.44 b | 25.09 ± 9.65 c | 38.69 ± 10.99 a | 0.817 | 255.28 | <0.001 | 0.223 | 0.385 | 0.797 |
| CY | 16.64 ± 3.72 c | 20.59 ± 4.78 b | 26.76 ± 5.77 a | 0.558 | 903.79 | <0.001 | 0.307 | 0.819 | 0.289 |
| DCY | 35.02 ± 4.09 b | 42.17 ± 6.08 a | 42.37 ± 5.43 a | 0.694 | 502.89 | <0.001 | 0.132 | 0.668 | −0.374 |
| Colorimetry | |||||||||
| L* | 78.27 ± 2.87 c | 83.47 ± 1.28 b | 83.61 ± 2.21 a | 0.483 | 1221.35 | <0.001 | 0.605 | 0.821 | 0.564 |
| a* | −4.13 ± 1.34 c | −1.12 ± 0.51 a | −2.46 ± 0.71 b | 0.483 | 1217.35 | <0.001 | 0.597 | 0.903 | −0.047 |
| b* | 2.52 ± 3.17 c | 3.29 ± 1.22 b | 4.49 ± 1.93 a | 0.870 | 169.63 | <0.001 | 0.409 | 0.300 | 0.504 |
| Model | Variables in Model, No. | Wilks’ λ | F-Value | p-Value |
|---|---|---|---|---|
| Whole set | 12 | 0.083 | 468.30 | <0.001 |
| Composition | 4 | 0.172 | 802.49 | <0.001 |
| Coagulation | 5 | 0.308 | 364.78 | <0.001 |
| Colorimetry | 3 | 0.261 | 725.89 | <0.001 |
| Dairy System | Goat | Cow | Sheep |
|---|---|---|---|
| Goat | 13.51 (37.04) | 7.87 (15.70) | |
| Cow | 6.58 (10.69) | 7.64 (25.61) | |
| Sheep | 3.13 (9.41) | 11.98 (21.91) |
| Model | Goat | Cow | Sheep |
|---|---|---|---|
| All variables | |||
| Goat | 94.72 | 1.51 | 3.77 |
| Cow | 0.15 | 98.66 | 1.19 |
| Sheep | 1.49 | 0.59 | 97.92 |
| Error level | 0.08 | 0.02 | 0.01 |
| Priors | 0.33 | 0.33 | 0.33 |
| Composition | |||
| Goat | 87.92 | 3.02 | 9.06 |
| Cow | 3.86 | 94.95 | 1.19 |
| Sheep | 8.25 | 0.59 | 91.16 |
| Error level | 0.37 | 0.02 | 0.01 |
| Priors | 0.33 | 0.33 | 0.33 |
| Coagulation | |||
| Goat | 76.98 | 6.04 | 16.98 |
| Cow | 10.57 | 86.90 | 2.53 |
| Sheep | 17.25 | 1.78 | 80.97 |
| Error level | 0.60 | 0.06 | 0.05 |
| Priors | 0.33 | 0.33 | 0.33 |
| Colorimetry | |||
| Goat | 96.23 | 0.38 | 3.40 |
| Cow | 0.00 | 85.88 | 14.12 |
| Sheep | 3.64 | 7.50 | 88.86 |
| Error level | 0.16 | 0.15 | 0.08 |
| Priors | 0.33 | 0.33 | 0.33 |
| Root | Eigenvalue | Canonical Correlation | Cumulative Variability (%) | Lambda | F-Value | p-Value |
|---|---|---|---|---|---|---|
| Composition—coagulation model for cow | ||||||
| F1 | 0.721 | 0.849 | 64.17 | 0.175 | 29.32 | <0.001 |
| F2 | 0.299 | 0.547 | 90.77 | 0.629 | 10.84 | <0.001 |
| F3 | 0.089 | 0.298 | 98.77 | 0.898 | 4.77 | <0.001 |
| Composition—coagulation model for goat | ||||||
| F1 | 0.801 | 0.895 | 64.43 | 0.121 | 97.99 | <0.001 |
| F2 | 0.271 | 0.521 | 86.27 | 0.606 | 30.52 | <0.001 |
| F3 | 0.155 | 0.394 | 98.77 | 0.832 | 21.37 | <0.001 |
| Composition—coagulation model for sheep | ||||||
| F1 | 0.797 | 0.893 | 61.41 | 0.110 | 209.99 | <0.001 |
| F2 | 0.402 | 0.634 | 92.39 | 0.540 | 77.43 | <0.001 |
| F3 | 0.087 | 0.295 | 99.09 | 0.902 | 23.52 | <0.001 |
| Composition—colorimetric model for cow | ||||||
| F1 | 0.476 | 0.690 | 78.07 | 0.454 | 19.77 | <0.001 |
| F2 | 0.123 | 0.350 | 98.16 | 0.868 | 6.36 | <0.001 |
| Composition—colorimetric model for goat | ||||||
| F1 | 0.592 | 0.769 | 83.33 | 0.361 | 68.94 | <0.001 |
| F2 | 0.088 | 0.297 | 95.75 | 0.884 | 14.09 | <0.001 |
| Composition—colorimetric model for sheep | ||||||
| F1 | 0.516 | 0.719 | 74.37 | 0.401 | 121.71 | <0.001 |
| F2 | 0.104 | 0.323 | 89.35 | 0.830 | 43.71 | <0.001 |
| Coagulation—colorimetric model for cow | ||||||
| F1 | 0.387 | 0.622 | 84.75 | 0.571 | 10.65 | <0.001 |
| F2 | 0.049 | 0.221 | 95.48 | 0.931 | 2.33 | 0.018 |
| Coagulation—colorimetric model for goat | ||||||
| F1 | 0.577 | 0.760 | 68.91 | 0.319 | 62.58 | <0.001 |
| F2 | 0.166 | 0.407 | 88.69 | 0.755 | 25.05 | <0.001 |
| Coagulation—colorimetric model for sheep | ||||||
| F1 | 0.386 | 0.621 | 85.22 | 0.574 | 54.89 | <0.001 |
| F2 | 0.044 | 0.210 | 94.98 | 0.934 | 11.61 | <0.001 |
| Variable * | Canonical Component | |||||
|---|---|---|---|---|---|---|
| Cow | Goat | Sheep | ||||
| F1 | F2 | F1 | F2 | F1 | F2 | |
| Composition—coagulation models | ||||||
| pH | −0.324 | 0.823 | −0.150 | −0.104 | 0.217 | 0.890 |
| FAT | −0.829 | −0.359 | 0.809 | 0.569 | −0.954 | −0.127 |
| CP | −0.800 | −0.112 | 0.825 | −0.519 | −0.864 | 0.184 |
| LAC | −0.119 | −0.455 | −0.076 | −0.126 | −0.087 | −0.301 |
| RCT | −0.449 | 0.661 | −0.078 | −0.322 | −0.117 | 0.898 |
| k20 | 0.151 | 0.702 | −0.397 | 0.409 | 0.499 | 0.478 |
| A60 | −0.633 | 0.251 | 0.234 | −0.563 | −0.627 | 0.161 |
| CY | −0.952 | −0.157 | 0.968 | 0.010 | −0.948 | 0.103 |
| DCY | −0.561 | −0.231 | 0.130 | −0.346 | −0.555 | −0.446 |
| Composition—colorimetric models | ||||||
| pH | −0.091 | 0.677 | −0.199 | 0.272 | −0.099 | −0.774 |
| FAT | −0.865 | 0.260 | 0.943 | 0.257 | 0.899 | 0.165 |
| CP | −0.796 | −0.154 | 0.618 | −0.755 | 0.823 | −0.228 |
| LAC | −0.337 | −0.671 | −0.360 | −0.239 | −0.793 | 0.350 |
| L* | −0.920 | −0.166 | 0.653 | −0.136 | 0.472 | 0.840 |
| a* | −0.055 | 0.869 | 0.746 | 0.516 | 0.748 | 0.371 |
| b* | −0.791 | 0.490 | 0.985 | −0.040 | 0.951 | −0.186 |
| Coagulation—colorimetric models | ||||||
| RCT | −0.255 | 0.630 | 0.028 | −0.820 | 0.191 | −0.630 |
| k20 | 0.227 | 0.735 | 0.041 | −0.693 | −0.119 | −0.712 |
| A60 | −0.493 | −0.426 | 0.138 | 0.793 | 0.324 | −0.401 |
| CY | −0.966 | 0.096 | −0.852 | 0.153 | 0.840 | −0.080 |
| DCY | 0.314 | −0.501 | −0.361 | 0.026 | 0.265 | 0.271 |
| L* | −0.889 | −0.104 | −0.673 | 0.590 | 0.526 | 0.836 |
| a* | −0.187 | 0.982 | −0.821 | −0.120 | 0.735 | 0.272 |
| b* | −0.851 | 0.150 | −0.983 | 0.185 | 0.953 | −0.212 |
Disclaimer/Publisher’s Note: The statements, opinions and data contained in all publications are solely those of the individual author(s) and contributor(s) and not of MDPI and/or the editor(s). MDPI and/or the editor(s) disclaim responsibility for any injury to people or property resulting from any ideas, methods, instructions or products referred to in the content. |
© 2024 by the authors. Licensee MDPI, Basel, Switzerland. This article is an open access article distributed under the terms and conditions of the Creative Commons Attribution (CC BY) license (https://creativecommons.org/licenses/by/4.0/).
Share and Cite
Garzón, A.; Perea, J.M.; Angón, E.; Ryan, E.G.; Keane, O.M.; Caballero-Villalobos, J. Exploring Interrelationships between Colour, Composition, and Coagulation Traits of Milk from Cows, Goats, and Sheep. Foods 2024, 13, 610. https://doi.org/10.3390/foods13040610
Garzón A, Perea JM, Angón E, Ryan EG, Keane OM, Caballero-Villalobos J. Exploring Interrelationships between Colour, Composition, and Coagulation Traits of Milk from Cows, Goats, and Sheep. Foods. 2024; 13(4):610. https://doi.org/10.3390/foods13040610
Chicago/Turabian StyleGarzón, Ana, José M. Perea, Elena Angón, Eoin G. Ryan, Orla M. Keane, and Javier Caballero-Villalobos. 2024. "Exploring Interrelationships between Colour, Composition, and Coagulation Traits of Milk from Cows, Goats, and Sheep" Foods 13, no. 4: 610. https://doi.org/10.3390/foods13040610
APA StyleGarzón, A., Perea, J. M., Angón, E., Ryan, E. G., Keane, O. M., & Caballero-Villalobos, J. (2024). Exploring Interrelationships between Colour, Composition, and Coagulation Traits of Milk from Cows, Goats, and Sheep. Foods, 13(4), 610. https://doi.org/10.3390/foods13040610