


Abstract
Hyperbolic mode resonance (HMR) has emerged as a solution to conventional sensing limitations. HMR is introduced into a photonic crystal fiber (PCF) for sensing in this research. A dual-channel PCF sensor for both refractive index (RI) and temperature measurement is proposed. The device has two independent sensing channels on the dual-side polishing surface of the PCF. An Au/SnO2 bilayer in the RI channel induces HMR, while the SnO2/PDMS bilayer in the temperature channel induces lossy mode resonance, with PDMS as the temperature-sensitive material. By introducing an Au layer to excite the HMR effect, the sensor achieves enhanced resonance depth and figure of merit (FOM) without sacrificing sensitivity. When the RI ranges from 1.34 to 1.426 and the temperature varies from 25 °C to 100 °C, the optimized sensor achieves a maximum RI sensitivity of 9100 nm/RIU and a maximum temperature sensitivity of −5 nm/°C. A sensitivity-matrix analysis confirms effective dual-parameter decoupling, with demodulation errors below RIU and 0.1 °C under simultaneous RI and temperature variations. This PCF sensor offers high sensitivity, quantifiably low crosstalk, wide detection range and good fabrication tolerance, making it promising for biomedical, environmental and industrial applications.
1. Introduction
Optical fiber sensors have been widely adopted for refractive index and temperature monitoring in biochemical assays [1], environmental surveillance [2], and industrial process control [3,4] owing to their immunity to electromagnetic interference, compact footprint, and low cost [5,6,7]. Sensors based on surface plasmon resonance (SPR) detect changes in refractive index through the phase-matched excitation of surface plasmon polaritons at the metal–dielectric interface and have become one of the successful label-free sensing technologies [8,9]. To further expand these functions, researchers have developed lossy mode resonance (LMR) sensors that use dielectric films instead of metals. The latter can operate in both TE and TM polarization states, generate multi-order resonances, and shift the resonance peaks in the visible to near-infrared wavelength range by adjusting the film thickness [10,11].
Despite the above progress, these two techniques still have limitations on different sensing platforms. For SPR sensors using gold or silver as plasmonic materials, in the near-infrared region, due to the relatively large imaginary part of the refractive index of the metals, the resonance peaks are broad, which limits the signal-to-noise ratio and the quality factor values [12,13,14]. LMR sensors in planar slab waveguides face problems such as the fading of resonance peaks in the near-infrared band [10]. To address these deficiencies, a hybrid resonance called hyperbolic mode resonance (HMR) was proposed in 2024 [15]. When a metal film is deposited beneath the dielectric film and the double-layer film meets the conditions of hyperbolic metamaterials (HMM), the resonance depth can be significantly improved. HMR, as the coupling of surface plasmons at the metal–dielectric interface and guided modes in the dielectric layer, combines the deep resonance depth of SPR and the tunability of LMR.
Simultaneous measurement of refractive index and temperature is often necessary to compensate for the temperature-induced refractive index changes of the analyte [16]. Most dual-parameter photonic crystal fiber (PCF) sensors utilize the same resonance mechanism for both channels, which can lead to spectral overlap and mutual interference [16,17,18,19]. HMR, by combining the distinct characteristics of SPR and LMR, offers a promising solution to this problem. However, to date, sensors based on HMR have mainly focused on planar slab waveguides [15,20]. Extending HMR to the fiber platform, especially into photonic crystal fibers (PCFs), is highly attractive and innovative because PCFs enable flexible dispersion, enhancement of the evanescent field for higher sensitivity, and easy integration with fiber systems [21].
This work proposes a dual-channel PCF sensor which integrates an HMR channel for refractive index measurement and an LMR channel for temperature sensing on the same optical fiber. The refractive index channel is composed of the Au/SnO2 double-layer film deposited on a polished surface, while the temperature channel consists of a SnO2/PDMS double-layer film on the opposite polished surface. The two channels are spatially separated, thus minimizing crosstalk. The finite element method is used to optimize the fiber geometric parameters and film thickness of the coating layers. We evaluate the sensing performance in terms of wavelength sensitivity, figure of merit (FOM), and fabrication tolerance. The proposed structure simultaneously achieves high refractive index sensitivity and temperature sensitivity in the near-infrared band, demonstrating the application potential of the HMR-enhanced PCF sensor in biomedical and environmental multi-parameter detection. The combination of different resonance mechanisms broadens the usable spectral range and helps to avoid spectral congestion during dual-parameter interrogation.
2. Sensor Structure and Theoretical Modelling
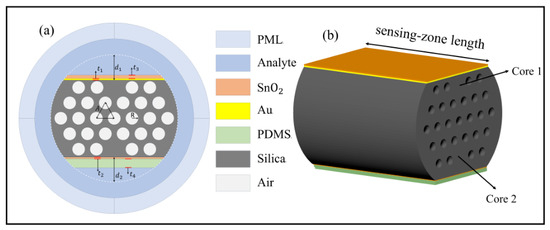
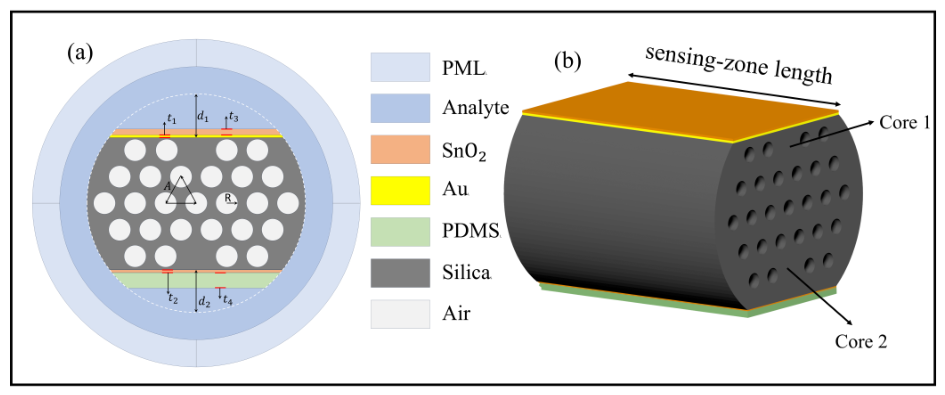
Figure 1a illustrates the cross-sectional geometry of the sensor, and Figure 1b presents the 3D model of the sensor without the analyte. The structure is built on a dual-core PCF whose cladding comprises a hexagonal periodic lattice of air holes. Core 1 and Core 2, positioned in the first and fifth ring layers, respectively, are formed by selectively removing specific air holes and backfilling the vacancies with silica. The hexagonal hole array (radius R, pitch A) provides strong optical confinement for both cores by suppressing leakage into cladding modes, while the three-layer barrier of air holes that separates the two cores blocks inter-core crosstalk. The dual-side polishing surface of the PCF has asymmetric double-side depths ( = 10 m, = 9.75 m). The resulting mismatch in propagation constants between the two channels further suppresses crosstalk during dual-parameter detection. As shown in Figure 1b, the two channels are arranged on the two opposite polished sides of the same fiber section and share a sensing-zone length = 15 mm. In a conceptual microfluidic implementation, the analyte would be delivered along the sensing region through inlet and outlet ports, directly contacting the Au/SnO2 bilayer of the RI channel. On the opposite side, the analyte contacts the PDMS layer, which serves as the temperature-sensitive material and follows the analyte temperature, so that the analyte temperature is measured through the SnO2/PDMS bilayer while the SnO2 film remains optically isolated from the analyte.
Figure 1.
(a) Cross-section of the sensor; (b) 3D model of the sensor without the analyte.
In the refractive index-sensing channel, a gold film with a thickness of and a SnO2 film with a thickness of are successively deposited to excite HMR. In the temperature-sensing channel, a SnO2 film with a thickness of and a PDMS layer with a thickness of are deposited to excite LMR. The geometric parameters of the sensor are summarized in Table 1.
Table 1.
Geometric parameters of the proposed sensor.
The refractive index (RI) of silica, which serves as the background material, as a function of wavelength can be calculated using the Sellmeier equation [22,23]:
where represents the free-space wavelength, and the values of the Sellmeier coefficients and are given in Table 2.
Table 2.
Sellmeier equation parameters of silica.
The dielectric function of gold is described by the Brendel–Bormann (BB) model, which takes into account both the contribution of free electrons and that of interband transitions [24]:
where is the photon energy and , with being the plasma frequency, and and being the oscillator strength and the damping constant of the free-electron term, respectively. In the BB model, the interband contribution of the j-th oscillator is a Lorentzian whose resonance energy obeys a Gaussian distribution of width [24]:
where is the center energy of the j-th oscillator and denotes the integration variable of the photon energy. This integral can be evaluated in closed form in terms of the Faddeeva function [24]:
The Gaussian broadening , which is absent from the conventional Drude–Lorentz model, accounts for the inhomogeneous line broadening of the interband transitions. To ensure high-accuracy fitting to the experimental data for gold, is adopted, and the complete parameter set is listed in Table 3, where all energy parameters are given in eV and the oscillator strengths are dimensionless. The model data set covers the wavelength range of 0.248–6.20 , which fully contains the simulated spectral window.
Table 3.
Brendel–Bormann model parameters of gold [24].
The dispersion of the film is described by a Lorentz oscillator model, expressed as [25]:
where is the high-frequency dielectric constant offset, while , , and correspond to the amplitude, center energy, and broadening of the j-th oscillator, respectively, with E representing the photon energy. The photon energy is converted from the free-space wavelength through with . A single oscillator () is adopted. The oscillator parameters, , , , and , are taken from Ref. [25], where they were obtained by fitting the spectroscopic ellipsometry data of a radio-frequency-sputtered film. The complex permittivity is converted into the optical constants via , i.e., and with . With a high real part of the refractive index and a low extinction coefficient, is particularly well-suited for exciting LMR.
The optical constants of are also temperature-dependent. This effect is incorporated by shifting the center energy of the oscillator in Equation (5) to account for the temperature-induced narrowing of the electronic bandgap:
where and is the bandgap temperature coefficient of rutile obtained from first principles, consistent in magnitude with experimental absorption-edge measurements [26]. The temperature coefficient of the interband transition energy is here approximated by that of the fundamental bandgap. Since this temperature dependence enters the model through the complex permittivity in Equation (5), both the refractive index and the extinction coefficient become temperature-dependent.
is employed as the temperature-sensitive material due to its high thermo-optic coefficient of and is thus widely applied in temperature sensing [27,28]. The relationship between its RI and temperature can be expressed as [17,29]
In comparison, the thermo-optic coefficient of pure silica is positive and amounts to only about near at room temperature [30], more than one order of magnitude smaller than that of PDMS, and its influence on the sensing results is therefore neglected. The aqueous analyte also exhibits a thermo-optic effect, which must be included for a reliable temperature analysis, and the RI is defined as
where denotes the analyte RI at the reference temperature = , and is the thermo-optic coefficient of water [31,32]. Unless otherwise specified, the analyte RI quoted in this work refers to , which is also referred to as the surrounding refractive index (SRI). Accordingly, the measurands retrieved by the dual-parameter demodulation are the temperature T and the analyte RI referred to as the reference temperature = 25 °C, i.e., a temperature-compensated refractive index.
We use 6.4 to analyze the modal properties of the dual-channel sensor by means of the finite element method. A cylindrical perfectly matched layer (PML) with a thickness of 6.25 m with the default scaling settings is employed as the outermost layer to absorb radiative energy at all incident angles and prevent interference with the modal field. Scattering boundary conditions are also applied to enhance numerical accuracy [33]. The PML region is discretized with a mapped mesh along the radial (absorption) direction, while the remaining geometry is discretized with free triangular elements. The loss is given by the following equation [33,34]:
where is the imaginary part of the effective , and is expressed in units of .
The key parameters for evaluating the sensor performance include sensitivity, measurement range, bandwidth, and FOM. The refractive index sensitivity is defined as the ratio of the resonance wavelength shift to the change in the environmental refractive index [33]:
where is the resonance wavelength shift, and is the change in the surrounding refractive index.
The temperature sensitivity can be obtained by analogy from the refractive index sensitivity formula, i.e., by replacing the refractive index change with the temperature change [16]:
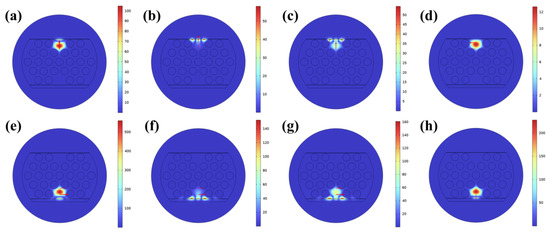
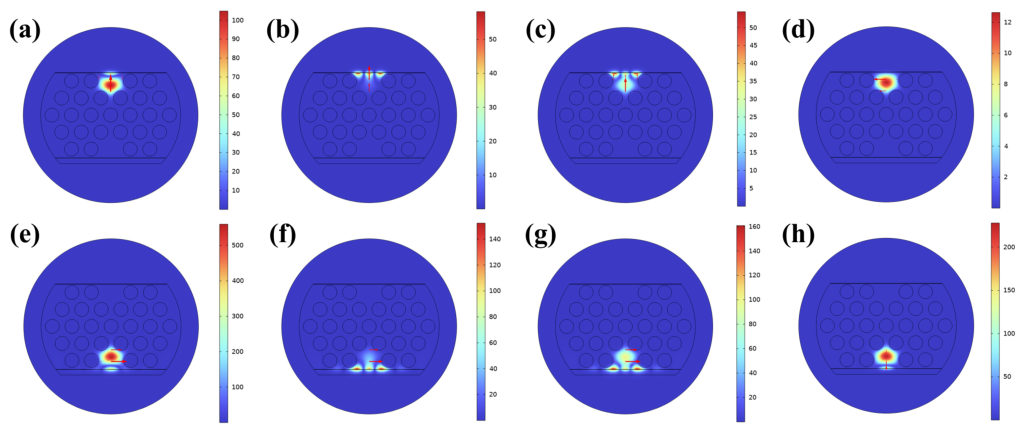
Figure 2 shows the electric field distributions of the two sensing channels of the proposed PCF sensor when the surrounding refractive index () is 1.35 and the temperature is 25 °C. Figure 2a and Figure 2e present the electric field distributions of the -Pol core mode in the channel and the -Pol core mode in the channel, respectively, indicating that light is stably transmitted in the fiber core. The red arrows mark the direction of the electric field. Figure 2b and Figure 2f show the field distributions of the Y-Pol lossy mode in the channel and the X-Pol lossy mode in the channel, respectively. When the phase-matching condition is met, the and effects are excited at the resonance wavelengths respectively. It can be observed that the energy in the core mode decays and transfers to the lossy modes within the thin-film coating, indicating the existence of mode coupling. Figure 2c,g display the resonance modes of their respective channels. Figure 2d shows the X-Pol core mode of Core 1 and Figure 2h shows the Y-Pol core mode of Core 2, whose resonance characteristics are discussed below.
Figure 2.
Electric field distributions at SRI of 1.35 and a temperature of 25 °C. Core 1: (a) Y-Pol core mode; (b) Y-Pol lossy mode; (c) Y-Pol resonant mode; (d) X-Pol core mode. Core 2: (e) X-Pol core mode; (f) X-Pol lossy mode; (g) X-Pol resonant mode; (h) Y-Pol core mode.
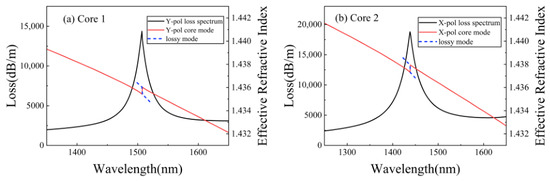
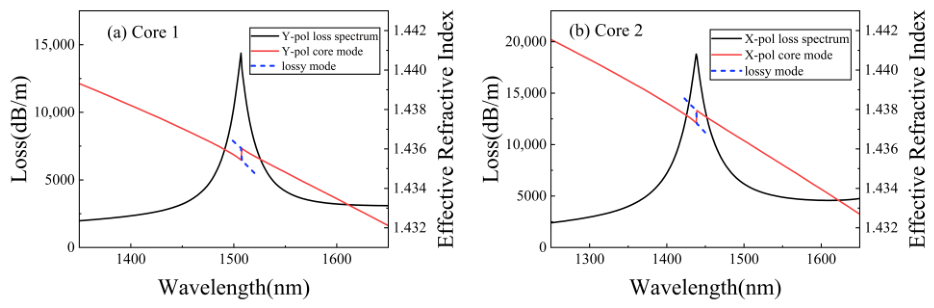
Figure 3 shows the loss spectrum and dispersion relations of the - mode of and the - mode of at a fixed surrounding refractive index () and a fixed temperature (). The horizontal axis represents the incident wavelength, and the vertical axes represent the loss and the effective refractive index, respectively. In Figure 3a, the effective refractive index of the - core mode intersects with that of the lossy mode at 1506 , indicating that the phase matching condition is satisfied at this point. Similarly, in Figure 3b, the effective refractive index of the - core mode achieves phase matching with that of the lossy mode at 1437 . Owing to the structural symmetry of the PCF, the orthogonally polarized modes of both cores were also examined. The X-polarized mode of Core 1 exhibits no discernible resonance peak in the range, which is consistent with the original HMR work [15], where the TE-like resonance supported by the bilayer fades as the Au thickness increases and becomes unresolvable at . The Y-polarized mode of Core 2 supports a resonance at at , which is spectrally separated from both operating channels and therefore introduces no crosstalk into the dual-parameter demodulation.
Figure 3.
Dispersion relationship and loss spectrum at SRI = 1.35 and T = 25 °C for (a) Core 1 (b) Core 2. The polishing depths are = 10 µm and = 9.75 µm, the pitch of the air holes is A = 7 µm, and the radius of the air holes is R = 2.5 µm, respectively.
3. Results and Discussion
3.1. Channel Independence and Optimization of Film Thicknesses
For dual-parameter sensors, ensuring the independence of the two sensing channels is a prerequisite for improving detection accuracy and reliability. To verify the independence of the HMR refractive index channel and the LMR temperature channel, the control variable method is employed to investigate the response of the resonance wavelengths when a single parameter changes.
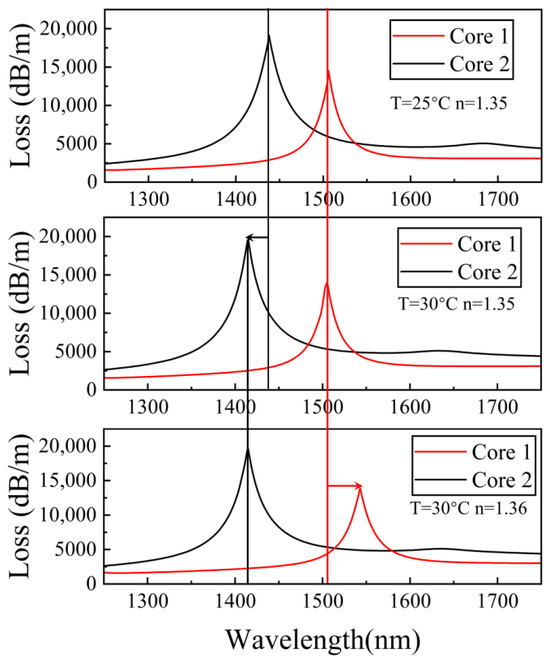
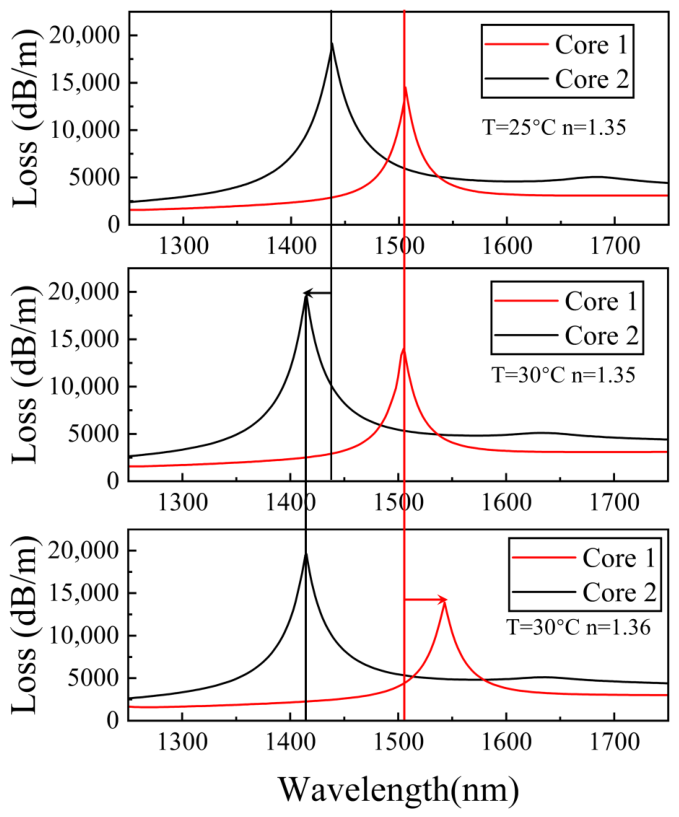
The results are shown in Figure 4. With a fixed analyte RI (), when the temperature increases from to , the resonance wavelength of the HMR channel (Core 1) shifts by only , from to , corresponding to a temperature cross-sensitivity of about , whereas the resonance peak of the LMR channel (Core 2) exhibits a blue shift, from to . Conversely, at a fixed temperature, when increases from to , the resonance peak of the HMR channel shows a red shift, from to , while the resonance wavelength of the LMR channel remains unchanged. The RI cross-sensitivity of the temperature channel is further examined at . As varies from to , the LMR resonance wavelength stays constant at , indicating a negligible cross-sensitivity.
Figure 4.
Loss spectra as RI changes from 1.35 to 1.36 and temperature changes from 25 °C to 30 °C.
The above results indicate that the two channels are dominated by a single physical quantity, respectively. This originates from two aspects. Firstly, the PDMS layer, as a temperature-sensitive material, covers only the LMR sensing area, and the 2–m thick PDMS film effectively isolates the temperature channel from the analyte. Secondly, the three-layer air-hole barrier and the asymmetric double-side polished structure cause a difference in the propagation constants of the modes in the two cores, suppressing mode-field coupling between the channels. It should be noted that the HMR channel still exhibits a small but nonzero temperature cross-sensitivity, which arises from the thermo-optic effect of the aqueous analyte and the temperature-induced band-edge shift of the SnO2 film. A quantitative decoupling analysis is therefore provided in Section 3.3.
The thicknesses of both Au and SnO2 films strongly influence the generation conditions and resonance characteristics of HMR, and thus determine the RI sensing performance. Consequently, we systematically investigate the sensor response for different Au and SnO2 film thicknesses.
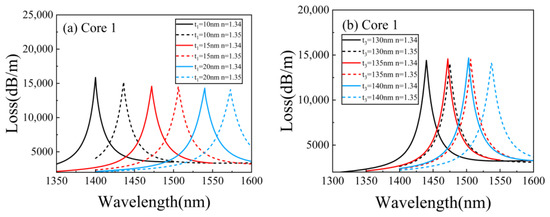
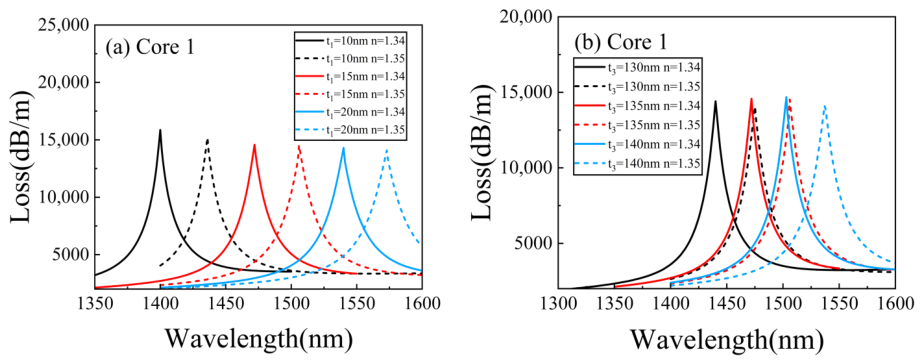
Figure 5a shows the evolution of the loss spectra of Core 1 at different film thicknesses under the conditions of , with the film thickness fixed at 135 , for the increasing from 1.34 to 1.35. As the film thickness increases, the resonance peak exhibits an obvious red-shift. When the film thickness is 10 , the RI sensitivity of the channel is 3600 , but the reduced film thickness shifts the HMR peak too close to the temperature channel. For , the sensitivity remains at 3400 , and the distance between the resonance peaks of the two channels is moderate, with good spectral discrimination. When the thickness is further increased to 20 , the separation of the resonance peaks of the two channels increases. However, the sensitivity drops to 3300 . Therefore, in this work, is selected as the optimal thickness of the film.
Figure 5.
Loss spectra for different (a) gold film thickness and (b) SnO2 film thickness.
Figure 5b shows the loss spectra of the resonance peak in Core 1 as the film thickness varies at , with the film thickness fixed at 15 . When the thickness is 130 , the RI sensitivity is 3500 . For , the sensitivity is 3400 . For , the sensitivity remains 3400 while the full width at half maximum () increases. Conversely, when thickness is 130 , the reduced film thickness results in blue-shifts of the peaks, thereby compressing the spectral space available for the temperature channel. Balancing sensitivity and channel separation, we therefore choose as the optimal thickness.
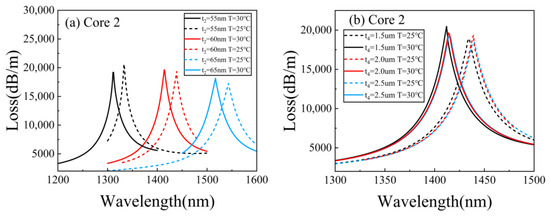
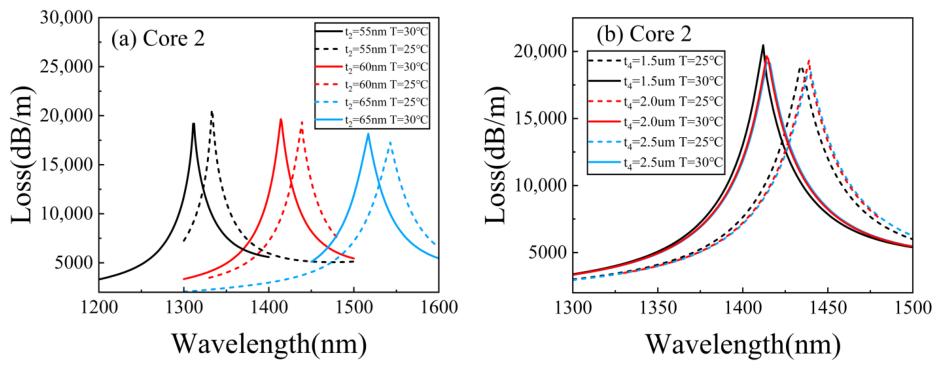
For the LMR temperature sensing (Core 2), the SnO2 film thickness is a key parameter that governs sensing performance. Figure 6a shows how the loss spectrum of Core 2 evolves with SnO2 thickness at SRI = 1.35. As SnO2 film thickness increases from 55 nm to 65 nm, the LMR resonance peak undergoes a redshift. When the SnO2 film thickness is 55 nm, the temperature sensitivity is nm/°C. When the SnO2 film thickness is 60 nm, it rises to nm/°C. When the SnO2 film thickness is 65 nm, the sensitivity increases slightly, but the FWHM of the LMR resonance undergoes a notable increase. Balancing sensitivity and channel independence, we therefore select nm as the optimal SnO2 film thickness for the LMR channel.
Figure 6.
Loss spectra for different (a) SnO2 film thickness and (b) PDMS film thickness.
Figure 6b shows the influence of the PDMS film thickness on the LMR loss spectra. When the PDMS thickness increases from 1.5 m to 2.5 m, neither the resonance wavelength nor the depth of the loss peak changes significantly. The PDMS thickness is therefore not an optical optimization parameter, and = 2.0 m is adopted as an engineering assumption.
3.2. Sensing Performance and Fabrication Tolerance
After optimizing the structural parameters and film thicknesses, this work systematically evaluates the refractive index and temperature-sensing performance of the sensor under the optimal configuration.
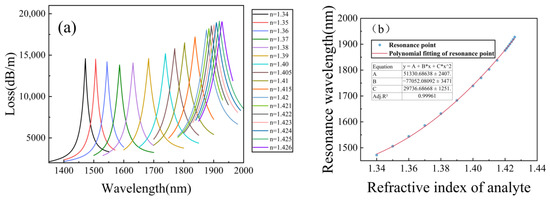
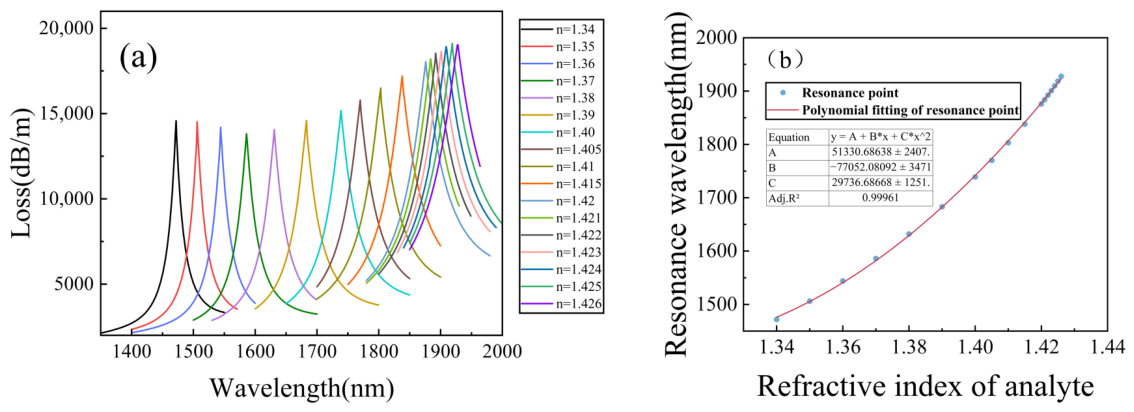
Figure 7a shows the loss spectra of Core 1 (HMR channel) at different refractive indices of the analyte under the condition of T = C. When the RI of the analyte gradually increases from 1.34 to 1.426, the resonance peak exhibits an obvious red shift, moving from 1472 nm to 1927.8 nm. As the RI increases, the offset of the resonance wavelength shows a nonlinear accelerating growth trend, and this phenomenon is particularly significant in the high-refractive-index region.
Figure 7.
(a) Loss spectra for RI variation. (b) Fitting curve of the resonance wavelength.
Figure 7b presents the polynomial fitting curve between the resonance wavelength and the RI of the analyte to be measured. The adjusted value of the goodness of fit reaches 0.99961, indicating that the sensor has excellent detection ability, which facilitates calibration and demodulation in practical applications.
The sensitivity increases monotonically from to , averaging over , which is shown in Table 4. Since the response is strongly nonlinear near the cutoff, this maximum sensitivity depends on the sampling interval and the peak-extraction method. The segment sensitivity is therefore verified on a refined 0.001-RIU grid over in Table 4, which rises from 8000 to . By local quadratic and cubic fits of the resonance wavelength, the midpoint derivatives for the final interval, and , lie within of the differential value with fit residuals below . This agreement confirms that the differential maximum is a reliable estimate of the local derivative rather than a sampling artifact, and the maximum sensitivity is accordingly reported as , with the uncertainty denoting the spread among the extraction methods, as a local value specific to the cutoff-adjacent interval. The resonance remains strong in this interval, with the peak depth attaining its maximum of 19,113 dB/m at and decreasing by only at . Trackability near the cutoff is therefore limited not by the resonance strength but by the FWHM broadening varying from to across the range. The FOM nevertheless stays above over the entire range and rises to in the final interval, indicating that the linewidth broadening does not offset the sensitivity enhancement. The upper detection limit of is thus physically set by the cutoff of the lossy mode. As the analyte RI approaches this value, the effective refractive index of the lossy mode approaches that of the analyte and the modal field extends deeply into the analyte region with progressively weakened confinement, until the dispersion curves of the core mode and the lossy mode cease to intersect and the phase-matching condition can no longer be satisfied. The key parameters for evaluating the performance of the sensor include sensitivity, measurement range, and figure of merit (FOM). The figure of merit is defined as the ratio of the wavelength sensitivity to the of the resonance peak [34]:
Table 4.
Performance as RI sensing for Core 1.
A high FOM is an important guarantee for achieving high-resolution and high-reliability sensing. Table 4 summarizes the detailed performance of Core 1 as a RI sensor at different refractive indices.
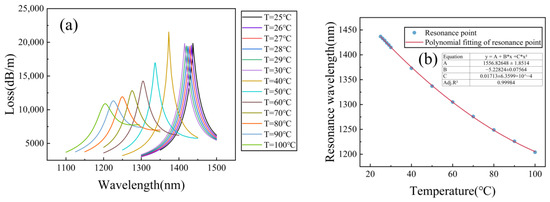
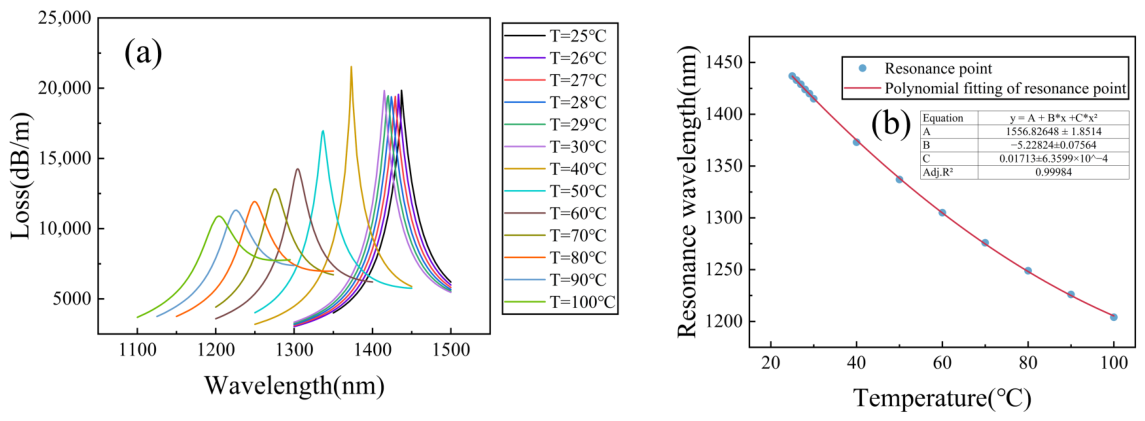
Figure 8a shows the evolution of the loss spectra of Core 2 (LMR channel) for the temperature increasing from to with n fixed at , where the thermo-optic effect of PDMS and the band-edge shift of are taken into account. As the temperature rises, the RI of PDMS decreases due to its negative thermo-optic coefficient, which dominates the blue shift of the resonance peak. Specifically, the resonance wavelength gradually blue-shifts from at to at , with a total shift of . Meanwhile, the FWHM of the resonance peak broadens and the depth of the loss peak decreases with increasing temperature. The broadening of the FWHM can be attributed to the gradual deviation of the phase-matching condition from the optimal coupling state caused by the temperature-dependent RI change.
Figure 8.
(a) Loss spectra for temperature variation. (b) Fitting curve of the resonance wavelength.
Figure 8b presents the polynomial fitting curve between the resonance wavelength and temperature. The adjusted value of the goodness of fit is 0.99984, indicating that the sensor has good predictability of temperature response in the range of . The temperature response of the LMR channel is dominated by the large thermo-optic coefficient of PDMS.
When the temperature is in the range of 27–30 °C, the sensor achieves the highest temperature sensitivity of −5 nm/°C. The negative sign indicates that the resonance wavelength exhibits a blue shift as the temperature increases. The FOM for temperature sensing can be defined in a similar form as the ratio of the temperature sensitivity to the FWHM:
Table 5 lists the detailed performance of the Core 2 as a temperature sensor under different temperatures.
Table 5.
Performance of temperature sensing for Core 2.
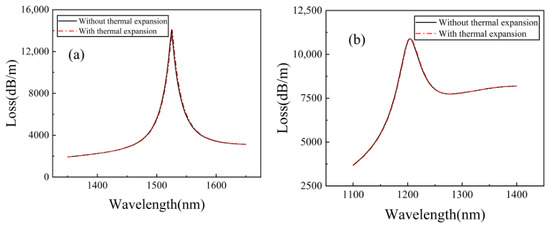
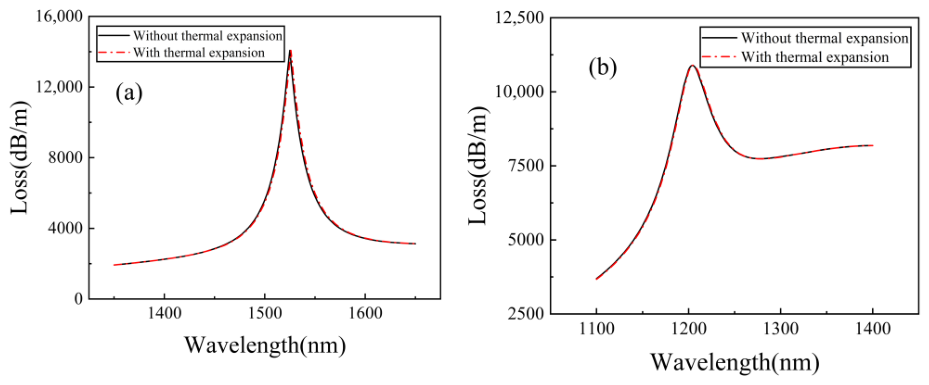
In addition to the thermo-optic effects, the thermal expansion of the PDMS layer, the silica host and the deposited films is evaluated quantitatively. Over the operating range (), the geometry change of each part is bounded by its coefficient of thermal expansion (CTE). The PDMS film has the largest CTE of [25,35]: even with the out-of-plane expansion amplified to by the substrate-imposed in-plane constraint [36,37], its thickness grows by at most at . The silica cross-section, with a CTE of about 5.5 × [38], expands by only relatively. The SnO2 and Au films, whose CTEs are about [39] and [40], respectively, expend by at most 0.1 nm. Since the geometry change due to thermal expansion is maximal at , Figure 9 compares the loss spectra of both cores at and with (red dash-dotted lines) and without (black solid lines) these geometry changes. The spectra nearly coincide for both channels, with resonance-wavelength differences below . Thermal expansion is therefore negligible for both channels and is excluded from the model.
Figure 9.
Loss spectra of (a) Core 1 and (b) Core 2 at n = 1.36 and T = 100 °C with (red dash-dotted lines) and without (black solid lines) the thermal expansion-induced geometry changes.
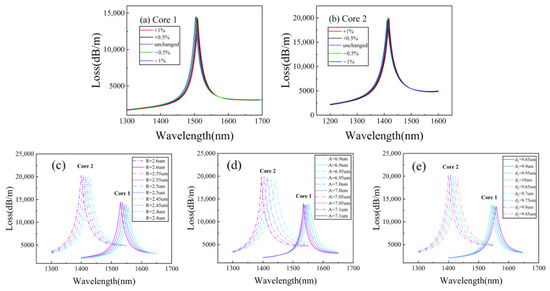
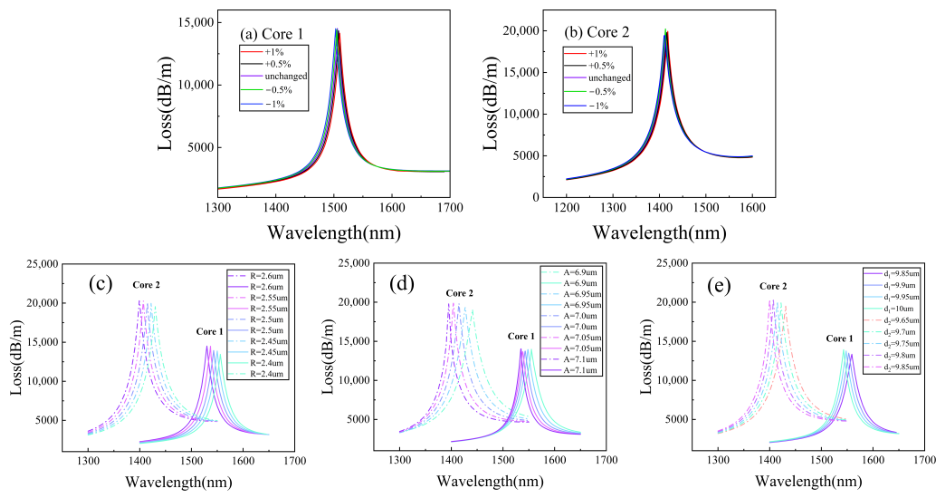
The geometric parameters of the sensor have a significant impact on its sensing performance. If the sensor performance is overly sensitive to changes in the key structural dimensions, the actual fabrication difficulty will increase significantly. To evaluate the fault tolerance of the designed dual-channel sensor during the fabrication process, the fiber cross-section is scaled by and of the standard size while keeping the coating thickness constant, and the corresponding loss spectra are calculated, respectively.
Figure 10a,b show the loss spectra of Core 1 and Core 2 for different cross-section scaling ratios. When the cross-section varies by , the resonance wavelengths in both channels shift negligibly and the loss-peak depths change slightly. The hyperbolic mode resonance of Core 1 remains near 1506 nm, and the lossy mode resonance of Core 2 stays near 1437 nm, consistent with the results for standard cross-section. Thus, the resonance wavelengths are highly stable against cross-section variations, and the sensor demonstrates excellent fabrication tolerance.
Figure 10.
Loss spectra of the (a) Core 1 and (b) Core 2 with the size varying independently at n = 1.36 and T = 30 °C for (c) the air-hole radius R from 2.4 to 2.6 m, (d) the lattice pitch A from 6.9 to 7.1 m and (e) the polishing depths from 9.85 to 10 m and from 9.65 to 9.85 m.
The uniform scaling above, however, cannot represent localized fabrication imperfections. Figure 10c–e therefore present the loss spectra of both channels when the air-hole radius R, the lattice pitch A, and the polishing depths and independently vary around the nominal geometry at n = 1.36 and T = 30 °C. In all cases, reducing the parameter value induces a slight red shift of the resonance peaks of both channels, which can be attributed to the weak perturbation of the core-mode dispersion by the cladding geometry, while the loss-peak depth changes only slightly. The resonance wavelengths thus depend weakly on each individual geometric parameter, confirming that the nominal geometry (A = 7 m, R = 2.5 m, = 10 m, = 9.75 m) lies in a flat region of the design space rather than at a critically tuned point. Together with the uniform-scaling results, the sensor demonstrates excellent fabrication tolerance, which lowers the process-accuracy requirements during manufacture and improves the yield.
3.3. Dual-Parameter Demodulation and Decoupling Error Analysis
For practical interrogation, where the RI and temperature may vary simultaneously, the sensor output is described by the sensitivity matrix
where the matrix elements are obtained from the calibration data. is the sensitivity of Core 1 over the interval of 1.35–1.36 (Table 4), and is the temperature sensitivity of Core 2 in the vicinity of the operating point within 27–30 °C (Table 5); both serve as the local Jacobian at the operating point. The RI cross-sensitivity of the temperature channel is negligible, with below (less than of ), as evidenced by the constant LMR wavelength in Figure 4. The temperature cross-sensitivity of the RI channel, , is evaluated from the temperature scan of Core 1 between 25 and .
The determinant °C) is clearly nonzero, so that the matrix is invertible and the two parameters can be uniquely retrieved:
Since the sensor responses are nonlinear over the full range, the matrix elements serve as the local Jacobian rather than a global linear fit. Demodulation is performed sequentially: the temperature is first retrieved from through the calibration polynomial of Figure 8b, and the analyte RI is then obtained from after subtracting the temperature-induced shift via the calibration of Figure 7b.
To quantify the decoupling accuracy under simultaneous and drastic variations, validation points covering the full range are simulated, as listed in Table 6. The model wavelengths are constructed as , where maps the thermo-optic shift of the aqueous analyte onto the reference-temperature calibration of Figure 7b, and denotes the contribution of the band-edge shift, which equals at and at in the scan where only the SnO2 band-edge shift is activated. is obtained directly from the temperature calibration of Figure 8b. The simulated wavelengths agree with the model predictions within , corresponding to a maximum RI demodulation error below , while the temperature retrieved from the RI-independent LMR channel remains accurate to below . With a wavelength resolution of , the error propagation of Equation (15),
yields theoretical resolutions of and , respectively. These results are instrument-limited estimated resolutions rather than actual overall resolutions, since the effects of FWHM, SNR, peak-fitting uncertainty, and fabrication tolerances on the resolutions are not included. The residual mutual interference can be quantified by the crosstalk coefficients and .
Table 6.
Validation of dual-parameter demodulation under simultaneous RI and temperature variations.
Finally, the role of the analyte thermo-optic coefficient is clarified. The demodulation above returns the analyte RI n at the reference temperature . The actual RI at the measurement temperature can alternatively be recovered from using only the measured temperature, without any assumption on , by mapping onto the reference-temperature calibration of Figure 7b, whereas the conversion to the reference-temperature value requires . The temperature retrieved from the LMR channel is unaffected by , since the PDMS layer isolates Core 2 from the analyte, as verified by simulations in which the resonance wavelength of Core 2 remained unchanged. Aqueous and biological liquids are dominated by water, whose reported near-infrared thermo-optic coefficient ranges from to [31,32,41]. Table 7 lists the demodulation results of simulations performed with and at , and for and , where and denote the errors of the actual-temperature RI and of the reference-temperature RI demodulated with assumed, respectively. The actual-temperature RI is recovered within in all cases. The reference-temperature RI deviates by to at and by to at , in good agreement with the first-order relation , which predicts to at and to at for the two coefficients, and is nearly independent of n. For analytes with thermo-optic coefficients outside this range, can be calibrated beforehand and directly substituted into Equation (8), leaving the demodulation procedure unchanged.
Table 7.
Demodulation results for analytes with different thermo-optic coefficients Cx.
3.4. Verification of the Hyperbolic Mode Resonance
To clarify the physical origin of the resonance observed in the Au/SnO2 composite film, the following analysis combines spectral characteristics and signed mode-field distributions. The loss spectra of three structures, namely with the Au film alone, the SnO2 film alone, and the Au/SnO2 bilayer, are compared to reveal the improvements in resonance depth, FWHM, and FOM induced by the Au layer. Furthermore, the profiles of the normal component of the electric displacement field Re() and of the transverse magnetic field component Re() are presented.
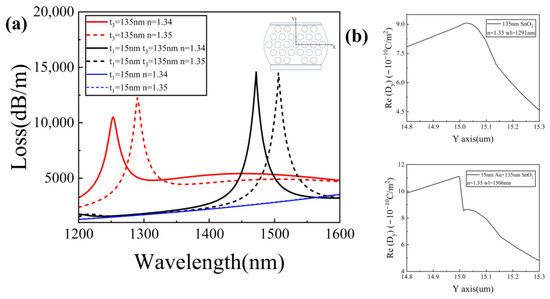
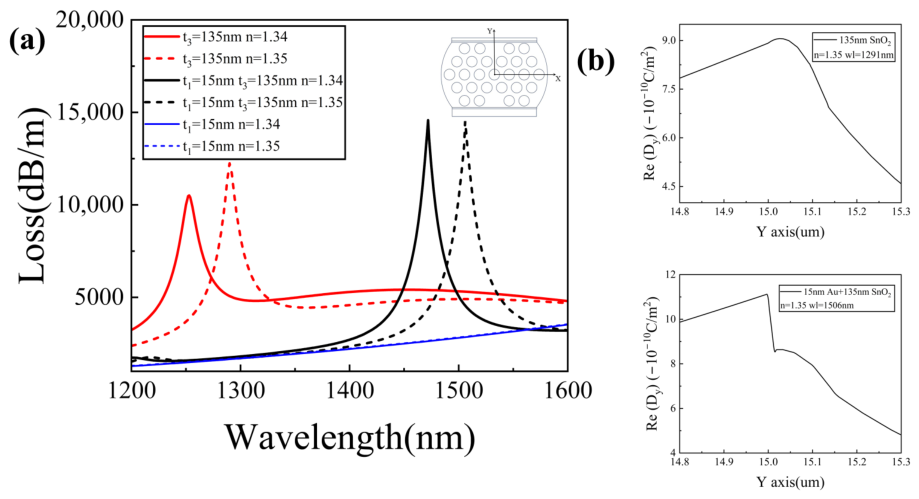
Figure 11a presents the loss spectra for three structures corresponding to the sensors coated with a 15 nm thick film alone, a 135 nm thick film alone, and a bilayer of 15 nm thick and 135 nm thick , respectively. When only a 15 nm thick film is deposited, no resonance peaks are observed in the entire wavelength range from to . This result indicates that within this wavelength range, the 15 nm thick gold layer cannot support effective SPR excitation in the proposed sensor, although in SPR sensors the electric field intensity at the interface is strongly enhanced when resonance occurs.
Figure 11.
(a) Comparison of loss spectra of Core 1 for three structures. (b) Signed Re() profiles across the coating region for the two structures.
A 135 nm thick film produces a typical in the near-infrared band, with resonance wavelengths between and . After adding a 15 nm thick layer beneath the film, the resonance spectrum exhibits three notable changes. The resonance wavelength undergoes a pronounced red shift. The resonance-peak depth increases markedly with an increase of about , from 12,236 dB/m for pure to 14,519.7 dB/m for the composite. The narrows, falling from for film alone to for the composite. The RI sensitivities of the PCF sensor with the composite remain almost the same as that of the sensor with the film alone, while the rises substantially, from for film alone to for the composite. It is found that introducing a metal intermediate layer enhances resonance visibility and improves the FOM without sacrificing sensitivity.
Figure 11b presents the profiles across the coating region, which directly distinguish the proposed HMR from a conventional LMR. For the 135 nm film alone, exhibits a single maximum inside the layer, i.e., the typical shape of a guided mode, consistent with the LMR character of its resonance in Figure 11a. For the bilayer, two in-phase maxima of the same sign appear at the two interfaces with a dip at the center of the Au film. The resonance therefore hybrids the surface plasmon at the metal–dielectric interface and the guided mode of the dielectric layer, which is the modal evidence identifying an HMR in the original work [15].
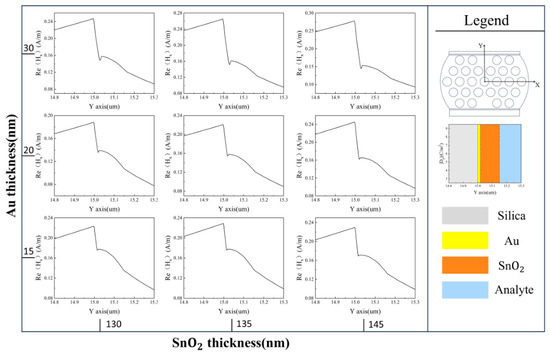
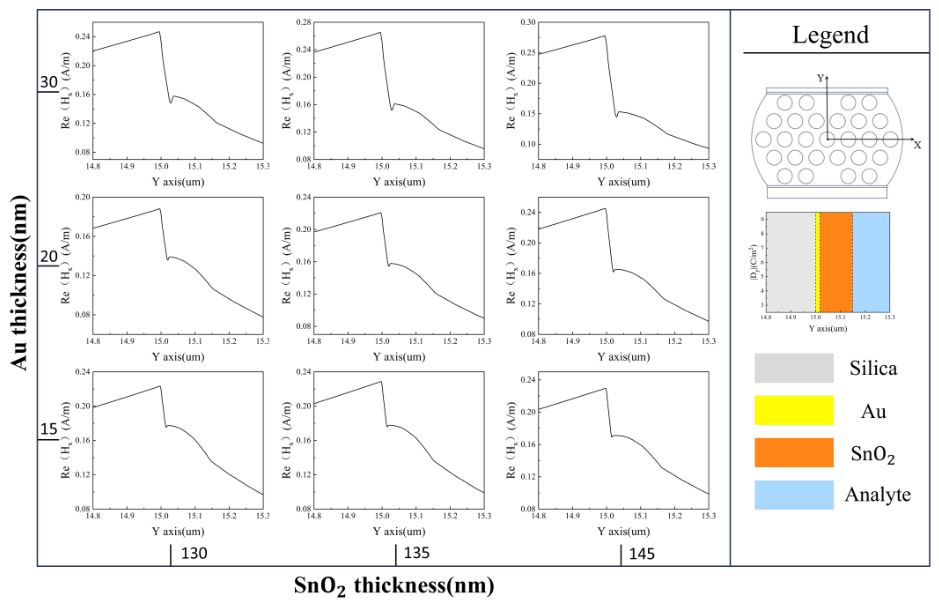
For the bilayer, Figure 12 presents the Re() profiles at the resonance wavelength of Core 1 for nine combinations of Au (15, 20 and ) and (130, 135 and ) thicknesses. All profiles share two features: a dip is centered in the Au region with two maxima at its interfaces; a slowly varying field lies inside the layer resembling a guided mode, confirming the hybrid nature of the resonance. As the Au thickness increases, the dip becomes progressively deeper. In contrast, increasing the thickness weakens the dip and the guided-mode-like field becomes dominant, demonstrating a mode transition in agreement with planar HMR structures [15]. These profiles confirm the resonance as hyperbolic mode resonance–a hybrid of surface plasmons at the metal–dielectric interface and the guided mode of the dielectric layer.
Figure 12.
Re() profiles at the resonance wavelength of Core 1 for Au thicknesses of 15, 20 and (rows) and thicknesses of 130, 135 and .
Table 8 compares the proposed sensor with reported dual-parameter sensors in terms of sensing structure, resonance mechanisms, sensitivity, FOM, etc. The distinctive features of the proposed sensor lie in the combination of two different resonance mechanisms (HMR and LMR) on a single fiber, higher FOM and sensitivity.
Table 8.
Comparison of dual-parameter sensors for RI and temperature detection.
4. Conclusions
This work proposes a dual-channel photonic crystal fiber sensor that integrates hyperbolic mode resonance and lossy mode resonance on a single platform for simultaneous and independent measurement of refractive index and temperature. The sensor incorporates two spatially separated sensing channels on the dual-side polishing surface. The RI channel uses an bilayer to excite HMR, which enhances resonance visibility and promotes the sensing performance. The temperature channel employs a composite to excite LMR, yielding a strong temperature response. The sensor achieves a maximum RI sensitivity of 9100 nm/RIU over the RI range of 1.34–1.426, a peak FOM of 314.5 RIU−1, and a maximum temperature sensitivity of within the temperature range of 25–100 °C. By separating the channels spatially and distinguishing them spectrally, the design suppresses crosstalk to a quantified low level during dual-parameter detection. This sensor presents the following notable advantages: (a) Two distinct resonance mechanisms, HMR and LMR, are combined on a single PCF, and the Au/SnO2 bilayer enhances the resonance depth and FOM without sacrificing sensitivity, addressing the resonance fading of conventional LMR in the near-infrared band. (b) The temperature responses of the SnO2 film, PDMS and the aqueous analyte are incorporated through a physically consistent permittivity model, and the residual crosstalk is quantified by a sensitivity matrix, with demodulation errors below and 0.1 °C over the entire operating range. (c) The resonance wavelengths are insensitive to small variations in the cross-sectional geometry of the PCF, demonstrating high fabrication tolerance that eases practical manufacturing.
Author Contributions
Conceptualization, Y.H. and Q.S.; methodology, Q.S.; data curation, Q.S.; writing—original draft preparation, Q.S.; writing—review and editing, Q.S., M.Y., Y.H. and Y.Y.; visualization, Q.S.; supervision, Y.H.; funding acquisition, Y.H. All authors have read and agreed to the published version of the manuscript.
Funding
This research was funded by the National Natural Science Foundation of China (62365005).
Data Availability Statement
The data underlying the results presented in this paper may be obtained from the authors upon reasonable request.
Conflicts of Interest
The authors declare no conflicts of interest.
References
- Luo, J.; Sun, J.; Chen, H.; Zhao, C.; Ye, M. A review of high-sensitivity SERS-active photonic crystal fiber sensors for chemical and biological detection. Sensors 2025, 25, 6982. [Google Scholar] [CrossRef] [Scilit]
- Wang, X.; Al Noman, A.; Liu, Y.; Yu, C. SMNS structure based fiber optic interferometer for cadmium detection. Opt. Express 2025, 33, 17233–17244. [Google Scholar] [CrossRef] [Scilit]
- Kundu, D.; Sutradhar, A.K.; Iftekharul Ferdous, A.H.M.; Islam, S.; Badhon, N.U.; Noman, S.; Akter, R.; Nisha, T.K. Floral-core zeonex photonic crystal fiber for high-sensitivity terahertz detection of hazardous industrial gases. Appl. Phys. A 2025, 131, 898. [Google Scholar] [CrossRef] [Scilit]
- Tsao, Y.-C.; Tsai, W.-H.; Shih, W.-C.; Wu, M.-S. An in-situ real-time optical fiber sensor based on surface plasmon resonance for monitoring the growth of TiO2 thin films. Sensors 2013, 13, 9513–9521. [Google Scholar] [CrossRef] [Scilit]
- Zheng, J.; Zhu, J.; Yang, Z. Extremely narrow resonant linewidths in metal–dielectric heterostructures. Photonics Res. 2022, 10, 1754–1762. [Google Scholar] [CrossRef] [Scilit]
- Yin, Z.; Jing, X.; Li, K.; Wu, B. Experimental study of an intensity-modulated curvature sensor with high sensitivity based on microstructured optical fiber. Opt. Express 2023, 31, 4770–4782. [Google Scholar] [CrossRef] [Scilit]
- Zhang, J.; Pu, S.; Rao, J.; Yao, T. Refractive index and temperature sensors based on no-core fiber cascaded with long period fiber grating. J. Mod. Opt. 2018, 65, 1098–1103. [Google Scholar] [CrossRef] [Scilit]
- Tang, S.; Chang, C.; Zhou, P.; Zou, Y. Numerical study on a bound state in the continuum assisted plasmonic refractive index sensor. Photonics 2022, 9, 224. [Google Scholar] [CrossRef] [Scilit]
- Rifat, A.A.; Ahmed, R.; Yetisen, A.K.; Butt, H.; Sabouri, A.; Mahdiraji, G.A.; Yun, S.H.; Adikan, F.R.M. Photonic crystal fiber based plasmonic sensors. Sens. Actuators B Chem. 2017, 243, 311–325. [Google Scholar] [CrossRef] [Scilit]
- Fuentes, O.; Goicoechea, J.; Corres, J.M.; Del Villar, I.; Ozcariz, A.; Matias, I.R. Generation of lossy mode resonances with different nanocoatings deposited on coverslips. Opt. Express 2020, 28, 288–301. [Google Scholar] [CrossRef] [Scilit]
- Letko, E.; Bundulis, A.; Mozolevskis, G. Theoretical development of polymer-based integrated lossy-mode resonance sensor for photonic integrated circuits. Photonics 2022, 9, 764. [Google Scholar] [CrossRef] [Scilit]
- Hou, D.; Jing, X.; Yin, Z.; Song, M.; Hu, G. Dual-parameter Ag/SiC PCF-SPR sensor for RI and temperature in NIR. Phys. Scr. 2026, 101, 075503. [Google Scholar] [CrossRef] [Scilit]
- Teng, C.; Li, X.; Min, R.; Deng, S.; Qin, Z.; Yuan, L.; Hu, X. Low crosstalk plastic optical fiber-based dual-parameter SPR sensor with stepped side-polished structure and differentiated Au-film thickness. IEEE Trans. Instrum. Meas. 2023, 73, 7001107. [Google Scholar] [CrossRef] [Scilit]
- Gonzalez-Salgueiro, L.; Del Villar, I.; Corres, J.M.; Matias, I.R. Experimental study of sensing performance using hyperbolic mode resonances. Opt. Laser Technol. 2025, 180, 111463. [Google Scholar] [CrossRef] [Scilit]
- Gonzalez-Salgueiro, L.; Del Villar, I.; Corres, J.M.; Goioechea, J.; Matias, I.R. Metallic-dielectric layer based hyperbolic mode resonances in planar waveguides. J. Light. Technol. 2024, 42, 4626–4635. [Google Scholar] [CrossRef] [Scilit]
- Chen, H.; Chen, Z.; Xu, X.; Liu, H.; Wan, L. Highly sensitive PCF-SPR sensor for simultaneous and independent sensing of refractive index and temperature. Appl. Phys. B 2025, 131, 34. [Google Scholar] [CrossRef] [Scilit]
- Ullah, S.; Chen, H.; Guo, P.; Song, M.; Zhang, S.; Hu, L.; Li, S. A highly sensitive D-shaped PCF-SPR sensor for refractive index and temperature detection. Sensors 2024, 24, 5582. [Google Scholar] [CrossRef] [Scilit]
- Wu, Q.; Liang, X.; Geng, Z.; Liu, S.; Liu, J. Mode-enhanced surface plasmon resonance in few-mode fibers via dual-groove architecture. Photonics 2025, 12, 925. [Google Scholar] [CrossRef] [Scilit]
- Li, D.; Li, S.; Huo, T.; Zhang, Z.; Gao, T. Refractive index and temperature dual-parameter sensor with independent channels based on asymmetric dual-core photonic crystal fiber and composite membrane. Plasmonics 2026, 21, 1491–1502. [Google Scholar] [CrossRef] [Scilit]
- Gallego Martínez, E.E.; Ruiz Zamarreño, C.; Matías, I.R. HMR-based optical gas detection with CuO and ZnO coatings. IEEE Sens. Lett. 2025, 9, 2001204. [Google Scholar] [CrossRef] [Scilit]
- Skorobogatiy, M. Microstructured and photonic bandgap fibers for applications in the resonant bio- and chemical sensors. J. Sens. 2009, 2009, 524237. [Google Scholar] [CrossRef] [Scilit]
- Trisha, I.J.; Patwary, A.K.; Sayem, M.A.; Rahman, A.; Hossain, R.; Mollah, A. Numerical analysis of a single channel exposed core elliptical shaped PCF based highly sensitive SPR sensor for wide RI sensing. Opt. Express 2024, 32, 25472–25487. [Google Scholar] [CrossRef] [Scilit] [PubMed]
- Ehyaee, A.; Rahmati, A.; Bosaghzadeh, A.; Olyaee, S. Machine learning-enhanced surface plasmon resonance based photonic crystal fiber sensor. Opt. Express 2024, 32, 13369–13383. [Google Scholar] [CrossRef] [Scilit]
- Rakić, A.D.; Djurišić, A.B.; Elazar, J.M.; Majewski, M.L. Optical properties of metallic films for vertical-cavity optoelectronic devices. Appl. Opt. 1998, 37, 5271–5283. [Google Scholar] [CrossRef] [Scilit]
- Xue, Y.; Yang, J.; Ye, P.; Li, B.; Gao, S.; Liu, Y.; Shi, J.; Yang, J.; Yuan, L.; Guan, C. High-sensitivity fiber temperature sensor based on composite film structure and lossy mode resonance. Opt. Laser Technol. 2025, 181, 111998. [Google Scholar] [CrossRef] [Scilit]
- Park, J.; Saidi, W.A.; Chorpening, B.; Duan, Y. Quantifying temperature dependence of electronic band gaps and optical properties in SnO2 and SnO via first-principles simulations. J. Phys. Chem. C 2021, 125, 22231–22238. [Google Scholar] [CrossRef] [Scilit]
- Hao, Z.; Pu, S.; Wang, J.; Liu, W.; Zhang, C.; Fan, Y.; Lahoubi, M. Dual-channel temperature-compensated vector magnetic field sensor based on lab-on-a-fiber-tip. Opt. Express 2022, 30, 25208–25218. [Google Scholar] [CrossRef] [Scilit]
- Fu, J.; Pu, S.; Hao, Z.; Zhang, C.; Liu, W.; Duan, S.; Han, S. Reflective magnetic field and temperature dual-parameter sensor based on no-core fiber probe. Opt. Laser Technol. 2024, 174, 110550. [Google Scholar] [CrossRef] [Scilit]
- Sun, L.; Yang, Z.; Ma, W.; Wang, Q.; Yin, Y. Dual-parameter fiber optic surface plasmon resonance sensor with narrow FWHM based on an incidence angle adjusting method. Opt. Express 2024, 32, 37480–37491. [Google Scholar] [CrossRef] [Scilit]
- Rego, G. Temperature dependence of the thermo-optic coefficient of SiO2 glass. Sensors 2023, 23, 6023. [Google Scholar] [CrossRef] [Scilit]
- Zhang, Y.; Liu, M.; Zhang, Y.; Liu, Z.; Yang, X.; Zhang, J.; Yang, J.; Yuan, L. Simultaneous measurement of temperature and refractive index based on a hybrid surface plasmon resonance multimode interference fiber sensor. Appl. Opt. 2020, 59, 1225–1229. [Google Scholar] [CrossRef] [Scilit]
- Jin, A.; Chang, J.; Hu, Z.; Xu, Y.; Chen, M. Cascaded fiber-optic FPI-SPR liquid thermo-optic coefficient sensor. Chin. J. Lasers 2024, 51, 171001. [Google Scholar]
- Li, B.; Li, Z.; Zhang, F.; Lu, B.; Guo, P.; Guo, L.; Hou, W. A dual-parameter optical fiber sensor based on SPR and LMR for measuring liquid refractive index and temperature. IEEE Sens. J. 2025, 25, 12907–12914. [Google Scholar] [CrossRef] [Scilit]
- Wang, H.; Liu, S.; Liu, W.; Wang, S. Dual-parameter surface plasmon resonance photonic crystal fiber sensor for simultaneous magnetic field and temperature detection with potential SERS applications. Photonics 2025, 12, 355. [Google Scholar] [CrossRef] [Scilit]
- Zhu, Z.; Liu, L.; Liu, Z.; Zhang, Y.; Zhang, Y. Surface-plasmon-resonance-based optical-fiber temperature sensor with high sensitivity and high figure of merit. Opt. Lett. 2017, 42, 2948–2951. [Google Scholar] [CrossRef] [Scilit]
- Müller, A.; Wapler, M.C.; Wallrabe, U. A quick and accurate method to determine the Poisson’s ratio and the coefficient of thermal expansion of PDMS. Soft Matter 2019, 15, 779–784. [Google Scholar] [CrossRef] [Scilit]
- Freund, L.B.; Suresh, S. Thin Film Materials: Stress, Defect Formation and Surface Evolution; Cambridge University Press: Cambridge, UK, 2004. [Google Scholar]
- Hahn, T.A.; Kirby, R.K. Thermal expansion of fused silica from 80 to 1000 K—Standard Reference Material 739. AIP Conf. Proc. 1972, 3, 13–24. [Google Scholar] [CrossRef] [Scilit]
- Seki, H.; Ishizawa, N.; Mizutani, N.; Kato, M. High temperature structures of the rutile-type oxides, TiO2 and SnO2. Yogyo-Kyokai-Shi 1984, 92, 219–223. [Google Scholar]
- Haynes, W.M. (Ed.) CRC Handbook of Chemistry and Physics, 97th ed.; CRC Press: Boca Raton, FL, USA, 2016. [Google Scholar]
- Cao, Z.; Jiang, L.; Wang, S.; Wang, M.; Liu, D.; Wang, P.; Zhang, F.; Lu, Y. All-glass extrinsic Fabry–Perot interferometer thermo-optic coefficient sensor based on a capillary bridged two fiber ends. Appl. Opt. 2015, 54, 2371–2375. [Google Scholar] [CrossRef] [Scilit]
- Liu, C.; Zhang, Y.; Li, X.; Fan, X.; Chen, Q.; Wu, B.; Chen, H. A gold film coated dual-core photonic crystal fiber for refractive index and temperature sensing with high isolation. Opt. Fiber Technol. 2022, 72, 102975. [Google Scholar] [CrossRef] [Scilit]
- Sayyad Tondro, A.; Sadeghi, M.; Kamaly, A.; Adelpour, Z.; Emamghorashi, S.A. Modeling and analysis of D-shaped plasmonic refractive index and temperature sensor using photonic crystal fiber. Opt. Quantum Electron. 2022, 54, 603. [Google Scholar] [CrossRef] [Scilit]
- Feng, Y.; Zhang, W.; Xu, T.; Huang, L.; Liu, C.; Shen, T. Design and research of a dual-parameter photonic crystal fiber sensor. J. Opt. Soc. Am. B 2023, 40, 1267–1276. [Google Scholar] [CrossRef] [Scilit]
- Jin, Y.; Gao, L.; Xue, Y.; Yang, J.; Liu, Y.; Zhu, Z.; Shi, J.-H.; Grattan, K.T.V.; Guan, C. Refractive index and temperature dual-parameter sensors based on loss mode resonance and directional coupler in side-polished hole-assisted dual-core fiber. Opt. Express 2025, 33, 573–582. [Google Scholar] [CrossRef] [Scilit]
- Lu, X.; Yu, X.; Zhou, J.; Chang, M.; Lu, D. An ultra-wide range D-shaped fiber SPR sensor with a nanostructure of Gold–MoS2 and sodium for the simultaneous measurement of refractive index and temperature. Sensors 2025, 25, 377. [Google Scholar] [CrossRef] [Scilit]
- Fuentes, O.; Corres, J.M.; Domínguez, I.; Del Villar, I.; Matias, I.R. Lossy mode resonances generated in planar configuration for two-parameter sensing. IEEE Sens. J. 2022, 22, 11264–11270. [Google Scholar] [CrossRef] [Scilit]

Disclaimer/Publisher’s Note: The statements, opinions and data contained in all publications are solely those of the individual author(s) and contributor(s) and not of MDPI and/or the editor(s). MDPI and/or the editor(s) disclaim responsibility for any injury to people or property resulting from any ideas, methods, instructions or products referred to in the content. |
© 2026 by the authors. Licensee MDPI, Basel, Switzerland. This article is an open access article distributed under the terms and conditions of the Creative Commons Attribution (CC BY) license.