


Abstract
Raman spectroscopy has emerged as a powerful tool for gas detection due to its label-free operation, molecular specificity, and multi-component analysis capabilities. However, its widespread application is hindered by limited sensitivity, particularly for trace gas analysis. To overcome this challenge, this study introduced an effective Raman spectroscopy detection system that synergistically combines a 532 nm high-power laser with a near-concentric multipass cell (MPC), enabling dual enhancement of both Raman excitation and signal collection. We simultaneously determined three critical performance metrics, including gas Raman signal intensity, signal-to-noise ratio (SNR), and limit of detection (LOD). Under the optimized experimental conditions, the CO2 Raman signal reached an SNR of approximately 58 for laboratory air containing 916 ppm CO2, corresponding to a concentration-equivalent detection limit of 48 ppm according to the 3σ criterion. Notably, the intensity of the generated Raman scattering signal is proportional to the average power. The intensity of Raman signals at different wave numbers increases at different rates with the increase in the average excitation power. The system achieves a remarkable LOD of 48 ppm for CO2, representing an advancement over conventional Raman gas sensors. This work validates high-power near-concentric cavity-enhanced Raman spectroscopy as a reliable method for trace gas detection, with potential implications for multi-component gas analyzers in environmental monitoring, industrial safety, and medical diagnostics.
1. Introduction
The rapid accumulation of atmospheric trace gases is a critical driver of global climate change, with rising emissions threatening to destabilize ecological systems and exacerbate stratospheric ozone depletion [1,2]. Real-time and precise monitoring of trace gas concentrations is essential for both adapting to and mitigating the ongoing global warming crisis. Raman spectroscopy stands out as a powerful analytical tool, offering label-free, multi-component detection with a broad dynamic range and minimal sample preparation. The technique relies on inelastic scattering of incident photons by molecular vibrations, producing a unique spectral fingerprint for each species. However, despite its versatility, Raman spectroscopy suffers from a fundamental limitation: the Raman scattering cross-section is intrinsically extremely small (typically in the order of 10−30 to 10−25 cm2 per molecule for gases), resulting in exceedingly weak signals that are often buried in fluorescence or background noise [3]. Consequently, the sensitivity of conventional Raman systems is severely constrained, restricting their application in critical areas such as atmospheric trace gas monitoring [4], industrial emission surveillance [5], and hazardous leak detection [6], where detection limits in the ppm or even ppb range are required. Overcoming this sensitivity bottleneck has therefore become the central pursuit in modern Raman gas sensing.
The fundamental challenge in Raman gas detection lies in overcoming the intrinsic weakness of spontaneous scattering. Generally, the intensity of the Raman scattering signal can be expressed as follows [7]:
where Ii is the intensity of Raman scattered light, k is the collection efficiency of Raman scattered light, I0 is the laser intensity, ni is the gas molecular density, l is the effective optical path, ∂σ/∂Ω is the differential Raman scattering cross section per unit solid angle, and Ω is the collection of solid angles.
According to Formula (1), the Raman signal intensity is governed by two key leverage points. On the one hand, increasing the excitation power can directly improve the intensity of Raman signal. On the other hand, increasing the effective optical path length can effectively enhance the intensity of Raman signal. Optical path length extension via multipass cells (MPCs) offers a more scalable solution [8,9,10,11]. Thus, the strategy should combine a high-power excitation light source with optimized MPC geometries, achieving ideal sensitivity through the simultaneous optimization of both critical parameters in a field-deployable system.
Since White’s [12] and Herriott’s [13] pioneering MPC designs, researchers have progressively refined cavity geometries to enhance Raman signals. Early breakthroughs, such as R.A. Hill et al.’s [14] plano-concave cavity (93× signal gain), demonstrated MPCs’ potential. In recent years, innovations have further improved the detection sensitivity of Raman spectroscopy. For instance, Utsav et al. [15] enhanced the performance of the multiple-pass Raman gain cell [16] by designing a concentric cavity, thereby significantly increasing both the Raman signal intensity and the signal-to-noise ratio (SNR). To date, researchers have also developed several novel technologies based on the concentric cavity, such as near-concentric cavity [17], folded-cavity system [18], and dual cavity system [19]. For example, Yang et al. [17] modified the traditional concentric cavity by introducing a near-concentric cavity through a subtle adjustment of the angle on one side of the spherical mirror. This modification led to an increased number of reflections of the incident beam, thereby enhancing the signal intensity and signal-to-noise ratio by over 70 times. The same basic near-concentric scheme was subsequently employed in a highly sensitive Raman system for dissolved-gas analysis, where the Raman signals were reported to be approximately 21 times stronger than those obtained using conventional side-scattering measurements [20], providing additional verification of its effective optical path length enhancement capability. However, the vast majority of these optimally engineered MPCs achieve signal enhancement purely through geometrical path extension, while the potential of high-power laser integration remains largely unexploited. This omission inherently limits the total achievable gain of next-generation Raman detection systems. Consequently, there is a clear and urgent need to develop integrated systems that simultaneously amplify both the excitation and collection stages, yielding a dual enhancement effect on gas Raman signals.
The total collected Raman signal intensity, IRaman, in our system can be expressed as a function of both excitation power and effective optical path length. Building upon the fundamental Raman Equation (1), and considering the optical collection efficiency η of our system, the detected signal is given by:
Here, Leff is the effective optical path length within the near-concentric MPC, defined as the product of the single-pass path length and the number of reflections. The excitation intensity I0 is proportional to the incident laser power P0 and inversely proportional to the beam waist area A at the focal point. Therefore, the total signal enhancement factor Ftotal of our system, compared to a conventional single-pass configuration, can be factorized into two components, the power enhancement factor FP = P0/Psingle and the multipass enhancement factor FMPC = Leff/Lsingle, such that Ftotal ≈ FP × FMPC, assuming similar focusing and collection geometries. This framework allows us to quantitatively evaluate the synergistic effects of our dual-enhancement strategy.
To this end, the present study proposed and designed an integrated gas Raman spectroscopy enhancement system based on a near-concentric cavity and 532 nm high-power laser. The aim of this study was to (1) evaluate the effect of pump power on CO2 signal intensity, (2) explore the effect of frequency on signal intensity and the full width at half maximum of Raman signals in normalized Raman spectroscopy, and (3) determine the impact of the system on the LOD of CO2. By synergizing high-power excitation with advanced MPC design, the study could establish an ideal performance benchmark for Raman gas sensing. These findings not only advance fundamental spectroscopic capabilities but also empower climate science, industrial monitoring, and public health with high analytical precision.
2. Experiment Design
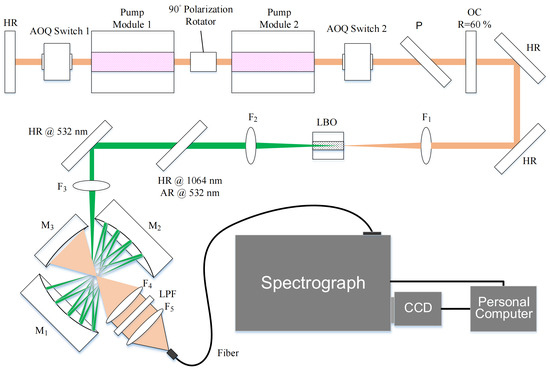
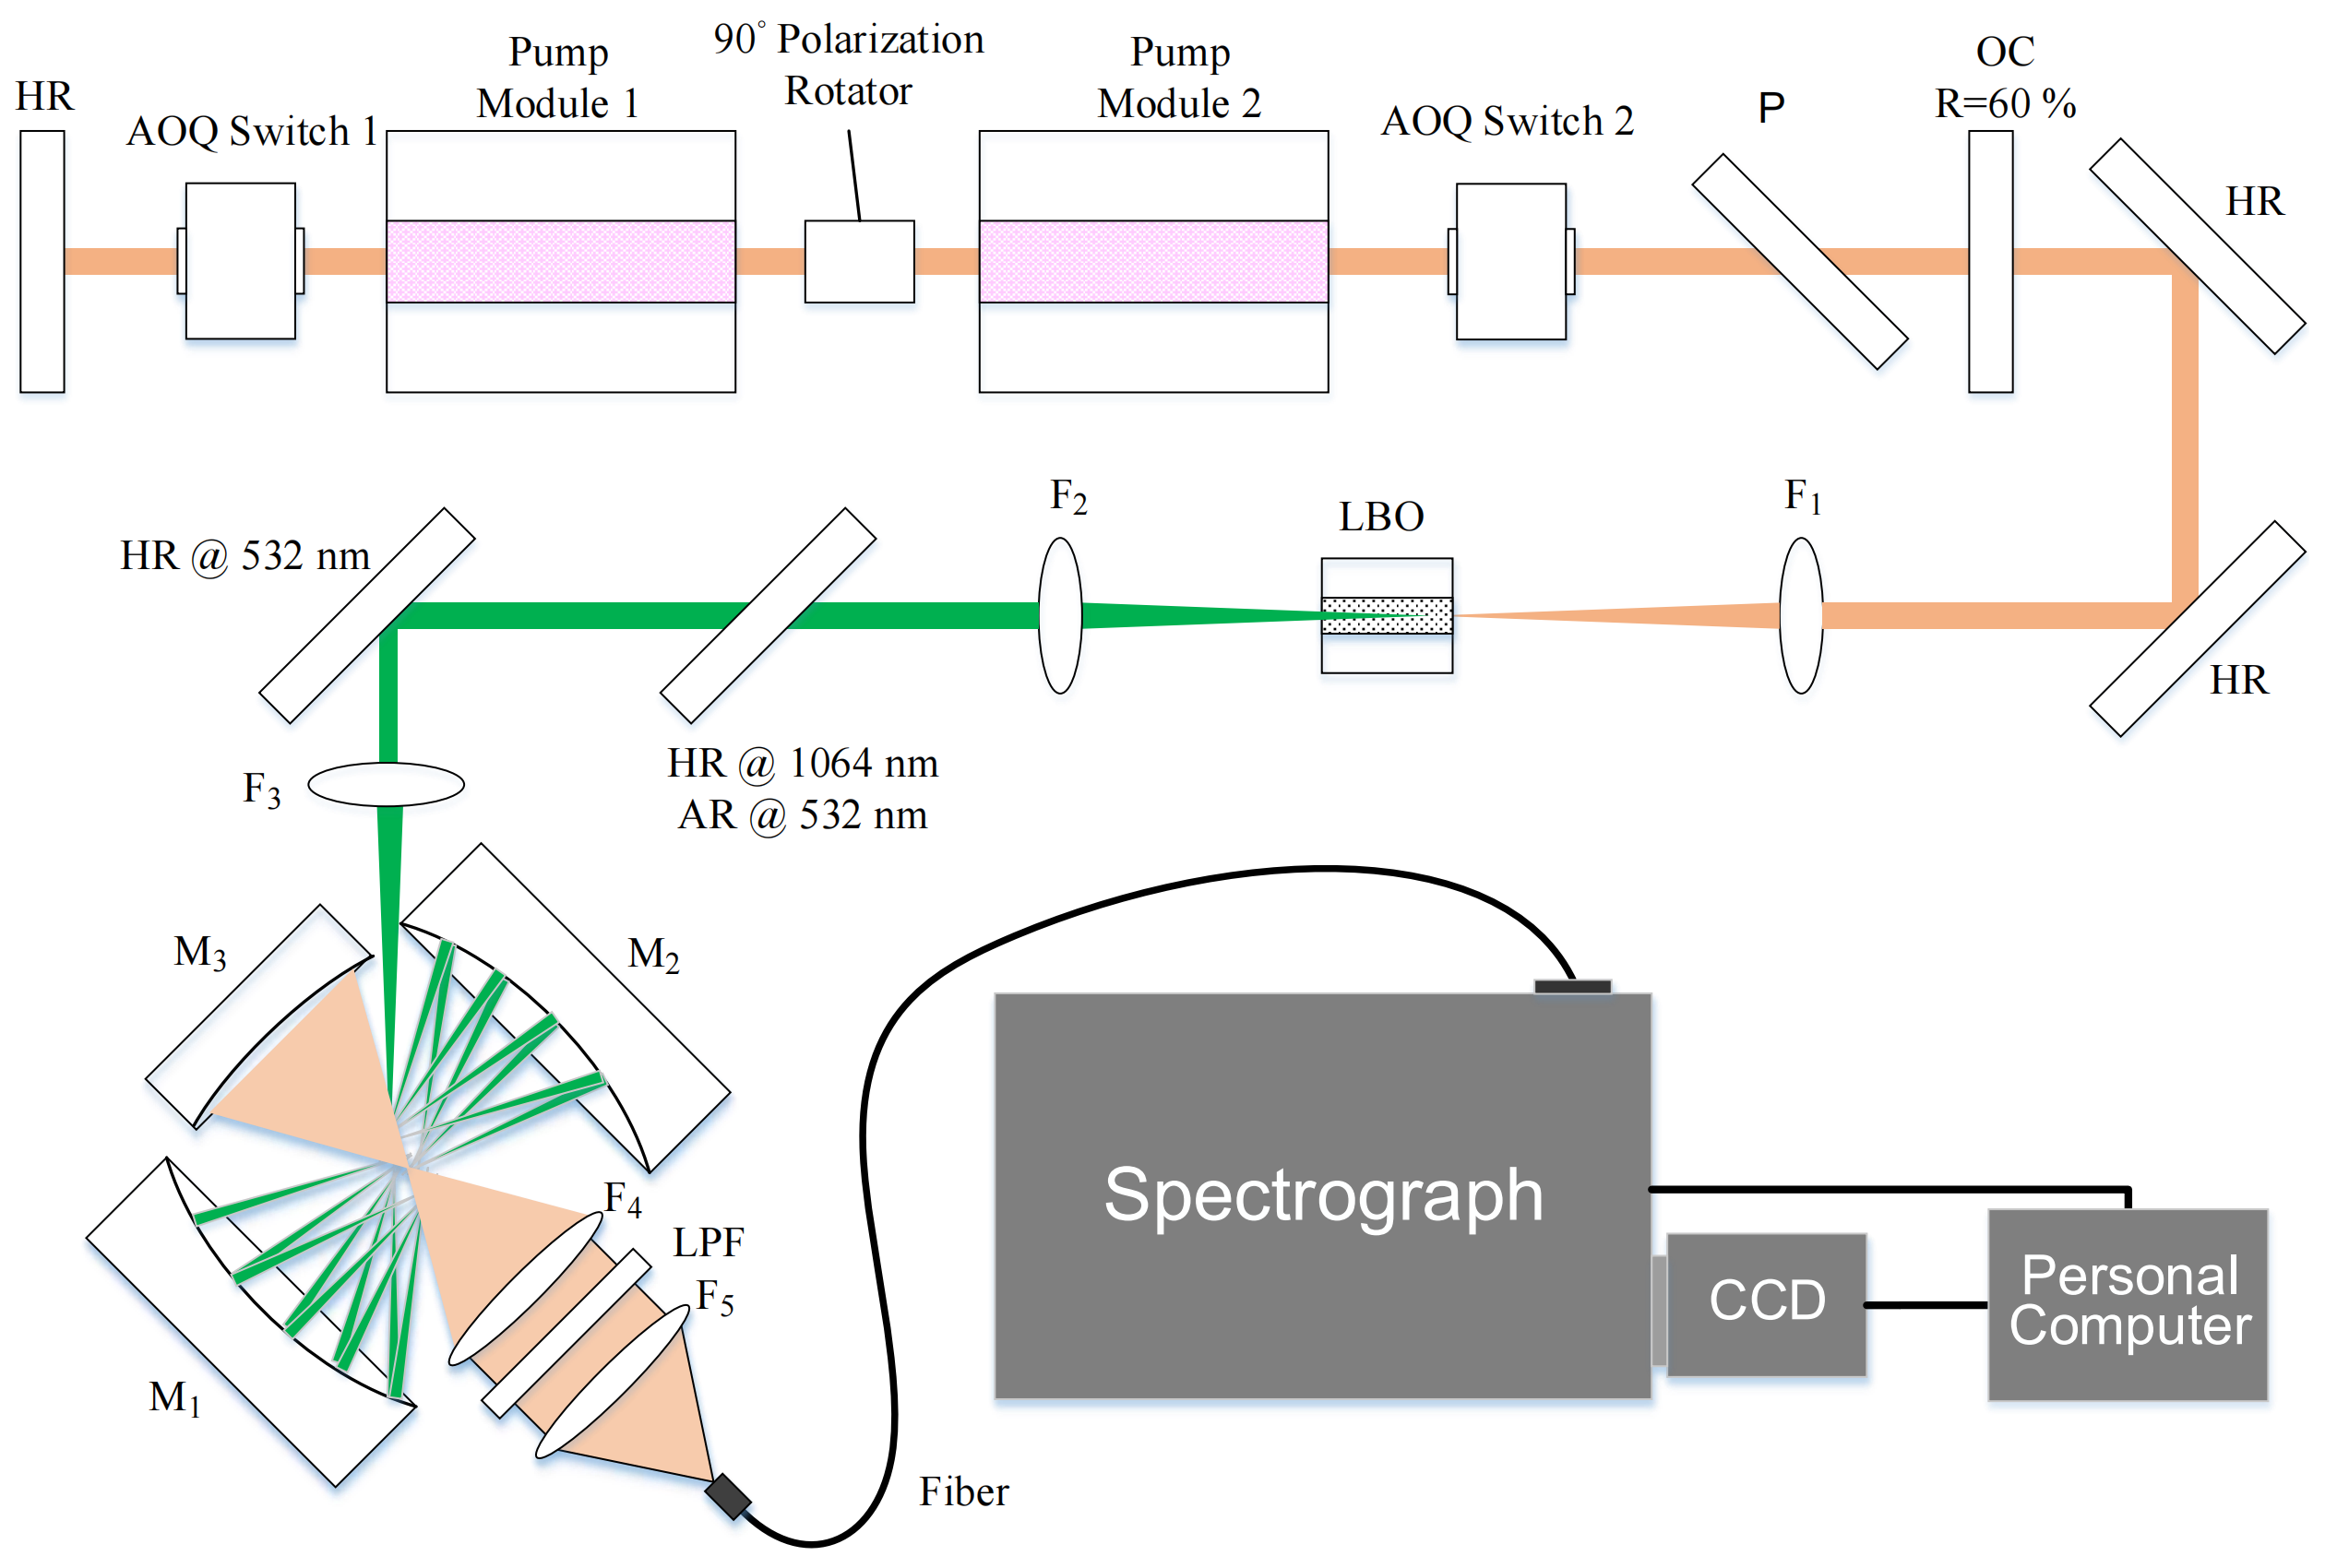
In this study, the gas Raman spectroscopy detection system consisted of a high-power 532 nm pulse laser and a near-concentric cavity (cf. Figure 1). Briefly, we connected two 808 nm side-pump modules (3 × 3 mm) in series and inserted a 90° polarization rotator between them. The gain medium of the pump module was a Nd:YAG crystal with a Nd3+ doping concentration of 0.6 at. % and a crystal rod size of φ3 × 64 mm. We incorporated an acousto-optic Q-switch (AOQ switch) to achieve pulse output. The reflectance of the output mirror was 60%. Subsequently, a polarizer was incorporated to manipulate the polarization orientation of the output laser. The main reason for changing the polarization direction of the laser was that the intensity of the collected Raman scattering signal is related to the polarization direction of the incident excitation light, and the signal intensity is strongest in the direction perpendicular to the polarization direction [21]. In this research, the resonant cavity was a dynamically stable cavity, characterized by a short arm length of 145 mm and a long arm length of 450 mm. The two mirrors were planar, and the pump module approximated a thin lens. The laser wavelength output of the oscillator was 1064 nm. Meanwhile, in order to reduce the spot diameter of the laser, we used a lens F1 (f = 100 mm) to couple the laser into a lithium triborate (LBO) crystal (matching temperature is 129 °C, size is 3 × 3 × 20 mm3). The 532 nm laser output was obtained through LBO frequency doubling. Subsequently, we used a lens F2 (f = 100 mm) to reduce the divergence angle of the output laser. A dichroic mirror (HR @ 1064 nm, AR @ 532 nm) was used to filter out the incompletely doubled 1064 nm laser. In this study, a lens F3 (f = 75 mm) was used to focus the 532 nm laser beam at the center of a near-concentric cavity.
Figure 1.
Schematic diagram of the experimental setup. HR, high-reflection; AR, anti-reflection; AOQ switch, acousto-optic Q-switch; P, polarizer; OC, output mirror; LBO, lithium triborate; LPF, long-pass filter; CCD, charge-coupled device.
The near-concentric cavity was composed of two concave mirrors M1 and M2 (diameter 25.4 mm, focal length −50 mm). The reflectivity of the concave mirrors exceeded 99.6% at 532 nm. The incident light reflected multiple times in the near-concentric cavity and converged at the center of the cavity, generating Raman signals. The Raman signal was further collected into the fiber by a collection lens group consisting of lenses F4 (f = 38.1 mm) and F5 (f = 100 mm). In order to eliminate the influence of the excitation light on the Raman signal, a 532 nm long-pass filter (LPF) was added in the middle of the lens group. In addition, the addition of concave mirror M3 (f = −50 mm) further improved the efficiency of signal collection. The Raman signal obtained was transformed into a Raman spectrum through the use of a spectrometer (SR-500i-B1, Andor Company, Belfast, UK). A spectrometer with a grating notch density of 1200 G mm−1, a blaze wavelength of 500 nm, and an incident slit of 200 μm was used. In this study, the detector utilized was a scientific charge-coupled device (CCD) camera (DR-316B-LDC-DD, Andor company). The operating temperature was −60 °C. The integration time of the CCD was set to 10 s, with a cumulative count of 9 repetitions. Before Raman measurements, the wavelength axis of the spectrometer was calibrated using a neon-argon lamp (Ne/Ar, Newport) with known emission lines. The spectrometer was calibrated to an accuracy of ±0.5 cm−1. The calibration was further checked using the characteristic Raman bands of the known signal of atmospheric N2 (O2 Raman peak at 1555 cm−1) as an internal standard, correcting for day-to-day variations in alignment and ambient conditions. The background spectrum was recorded under the same acquisition conditions and subtracted from the measured Raman spectra before peak-intensity analysis.
3. Results and Discussion
3.1. High-Power 532 nm Laser
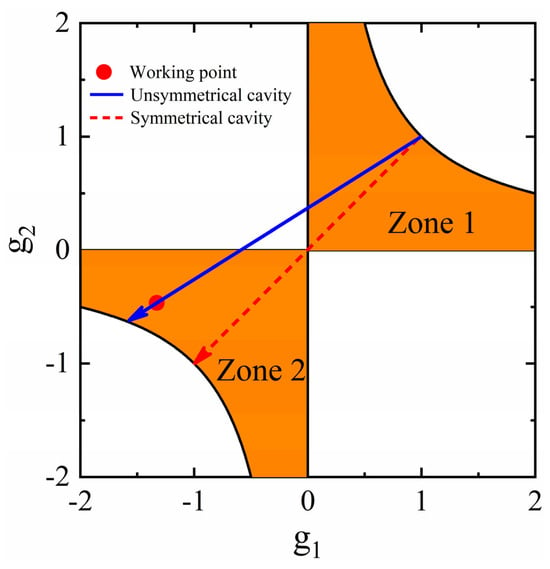
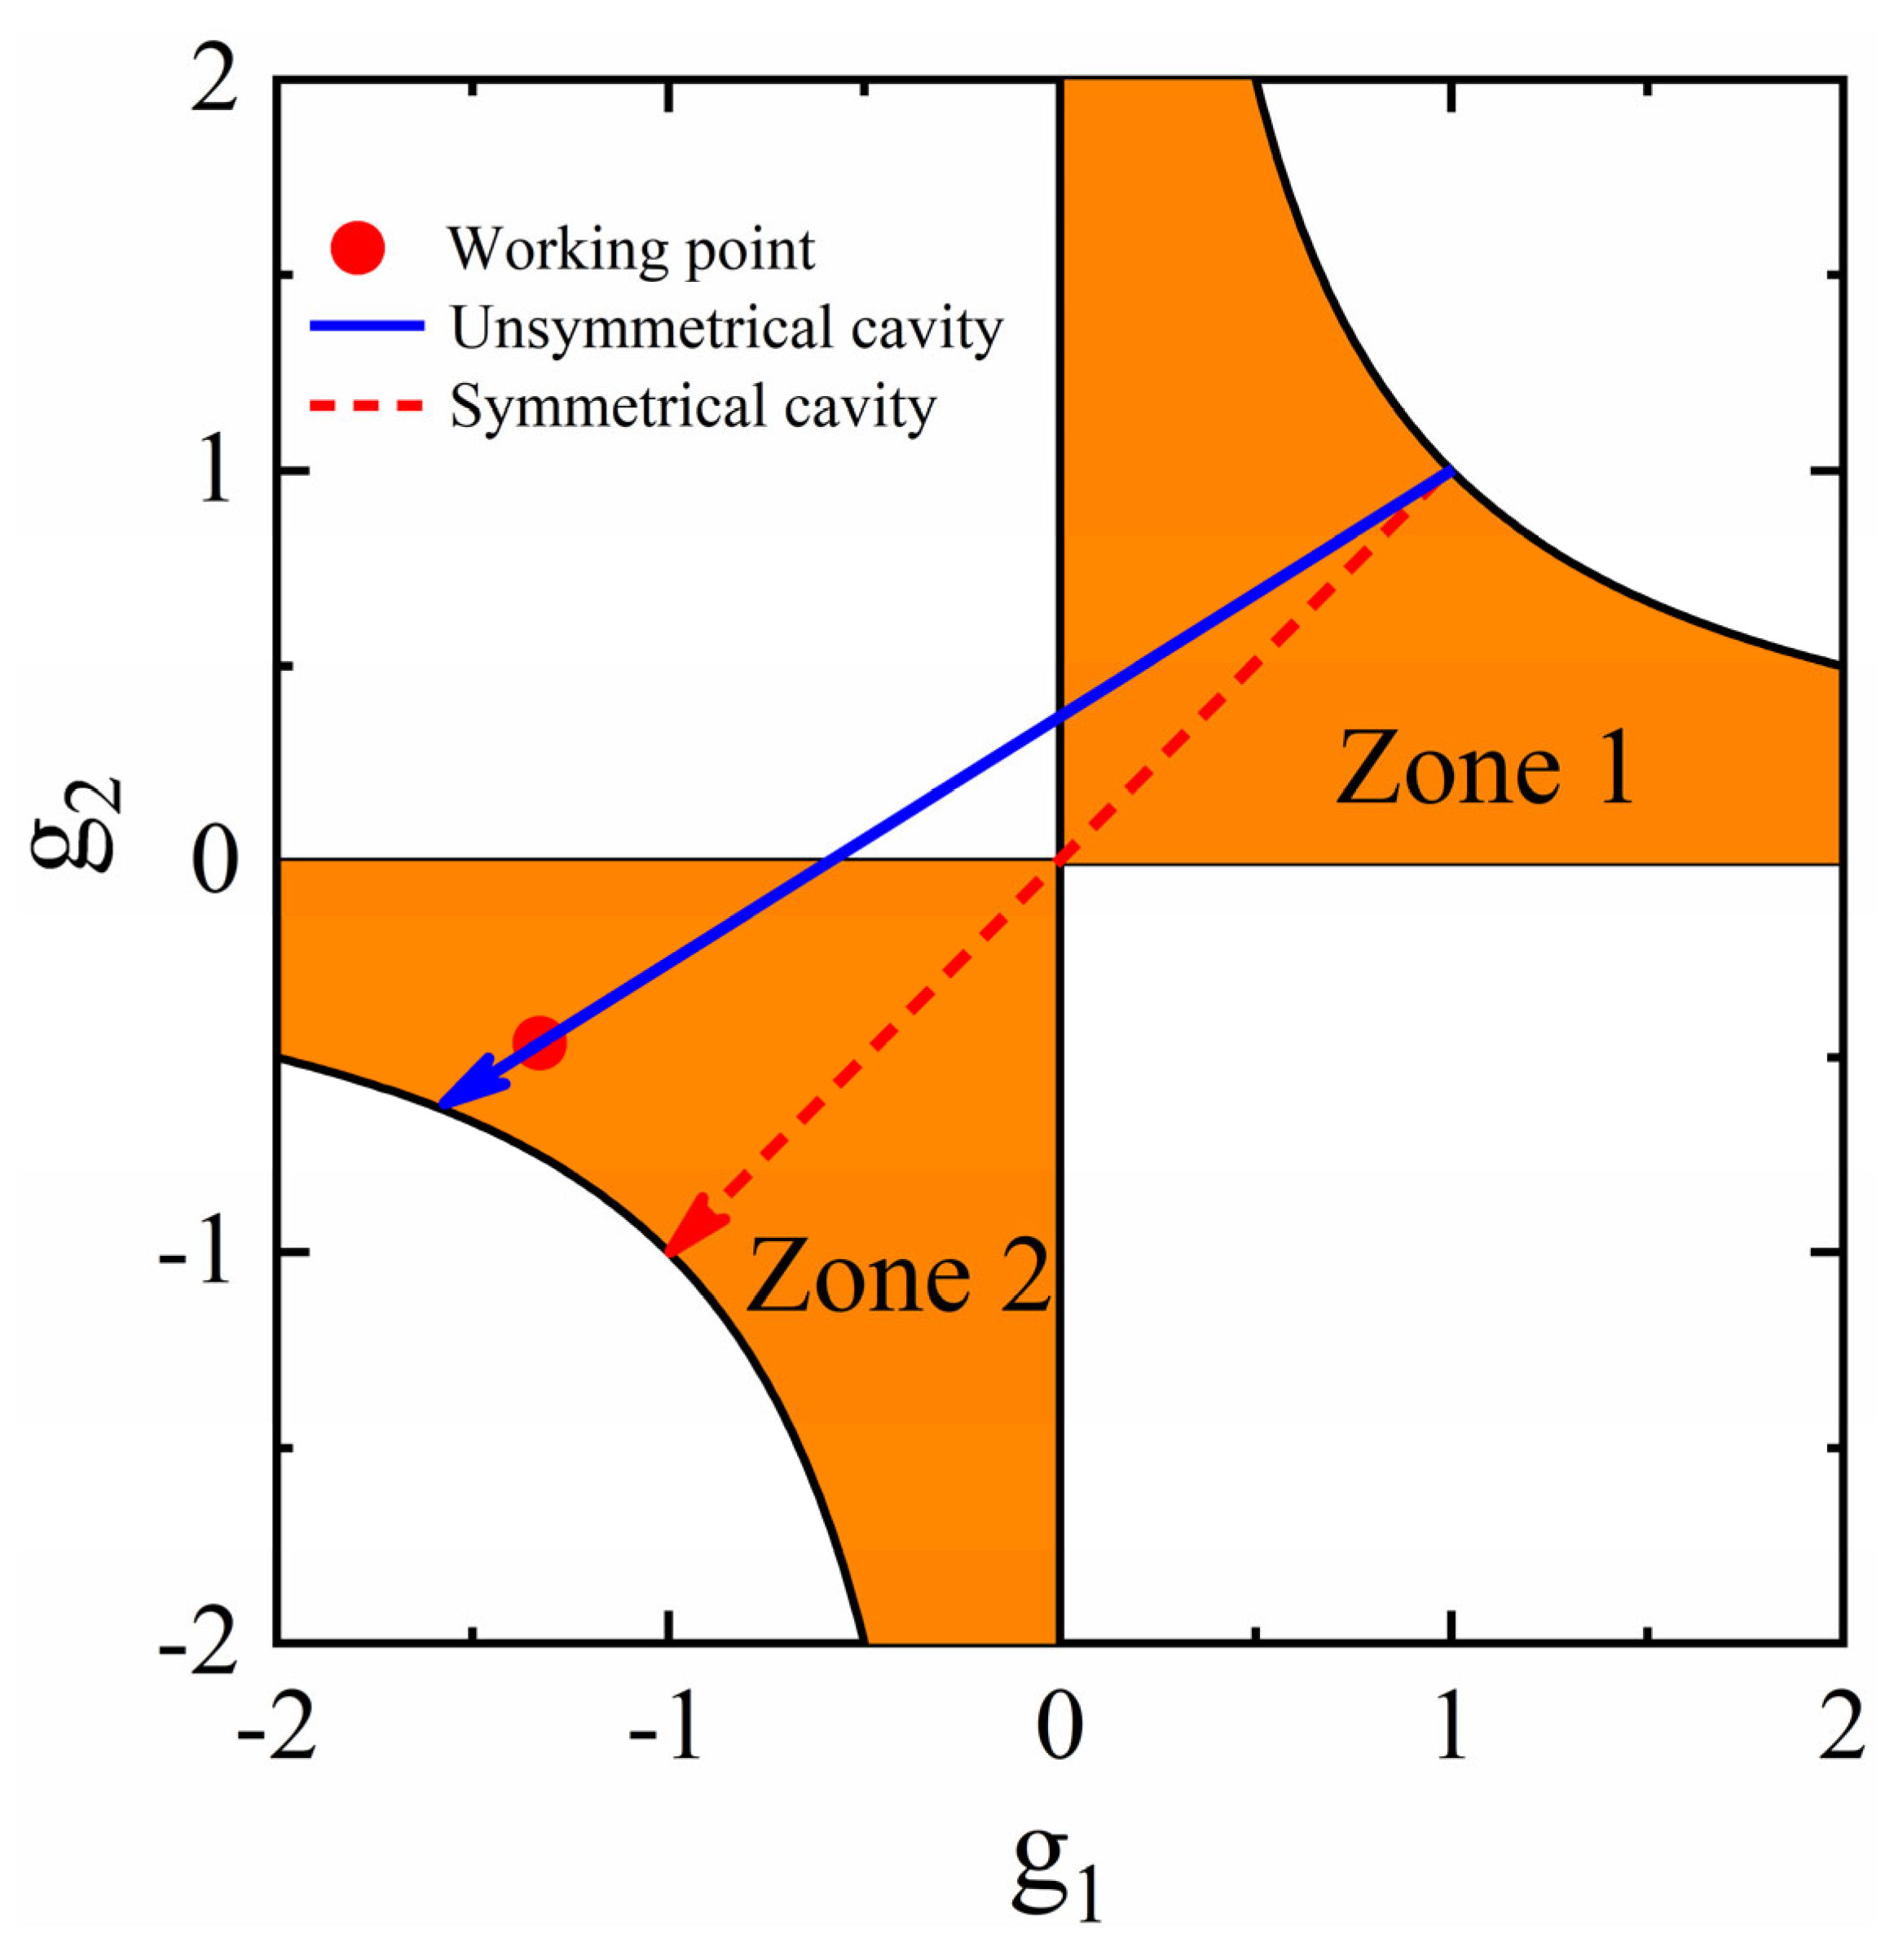
According to Figure 2, our experiment reveals that as the pump power increases, the focal length of the thermal lens in the pump module decreases monotonically, and the resonator enters the first stable region. At this point, the pump is operating at approximately 200 W. The pump power ranges from 300 W to 400 W after reaching the first stable zone. With an increase in pump power, a second stable region emerges.
Figure 2.
Laser g-parameter diagram. The yellow area in the diagram is the stable area, and the blue line is the stable state of the cavity with the increase in pump power.
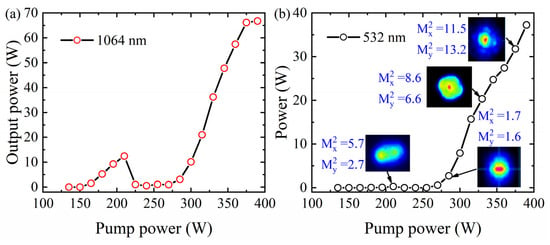
As the pump power increases, two stable regions can be clearly observed in the output 1064 nm laser (cf. Figure 3a). In this research, we design the working point of the laser as the maximum output power of the second stable region. When the pump power is 375 W, the output power of the laser reaches a maximum of 66 W, with a repetition frequency of 10 kHz, a pulse width of 56 ns, a single pulse energy of 6.6 mJ, a peak power of 118 kW, and an optical-optical efficiency of 19.5%. At this time, the average output power of the 532 nm laser is 37 W, the repetition frequency is 10 kHz, and the frequency doubling efficiency is 56% (cf. Figure 3b).
Figure 3.
Laser output power change with pump power: (a) 1064 nm laser output power change with pump power; (b) 532 nm laser output power and beam quality change with pump power.
3.2. Gas Raman Signal Detection
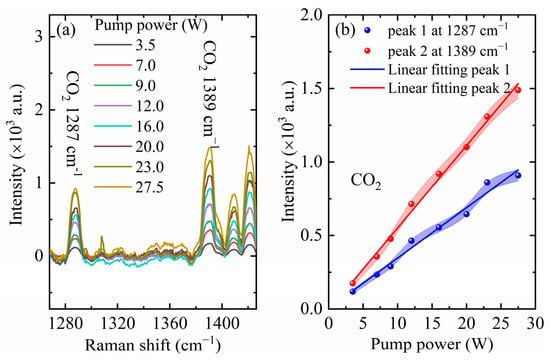
The power-dependent measurements in Figure 4b provide a direct experimental verification of the excitation-power term in Equation (2). The CO2 Raman peaks at 1287 and 1389 cm−1 exhibit strong linear correlations with the excitation power, with R2 = 0.978 and R2 = 0.994, respectively. These results confirm that the detected Raman intensity scales approximately linearly with the average excitation power under the present experimental conditions. The different slopes of the two Raman peaks indicate different mode-dependent Raman responsivities (kpeak 1 = 34.253 and kpeak 2 = 56.015, respectively), which may arise from differences in the differential Raman scattering cross sections and the local spectral response of the detection system. Therefore, Figure 4b quantitatively supports the power-dependent component of the dual-enhancement model proposed in Equation (2).
Figure 4.
Comparison of CO2 Raman signal intensity under different pump powers. (a) The Raman spectrum of CO2. (b) The linear relationship between CO2 Raman signal intensity and pump power. The data points represent the mean values with error bands indicating the standard deviation (SD) from multi-accumulation measurements (n = 9).
For each excitation power or repetition-rate setting, the measurement was repeated nine times under identical experimental conditions. The reported values are the average values of replicate measurements, and the error bands represent the standard deviation.
In the present study, the near-concentric cavity geometry was kept fixed while the excitation power was varied; therefore, the power-dependent measurements mainly quantify the excitation-power’s contribution to the total enhancement. Previous near-concentric cavity Raman studies [17] have shown that such a geometry can enhance the Raman signal intensity and signal-to-noise ratio by more than 70 times compared with a non-multipass configuration. In this work, the integration of this cavity geometry with a high-power 532 nm excitation source further increases the available excitation photon flux, thereby producing a dual-enhancement strategy based on both effective path length and excitation power.
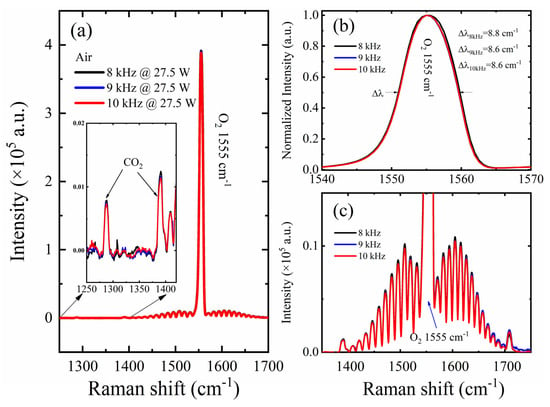
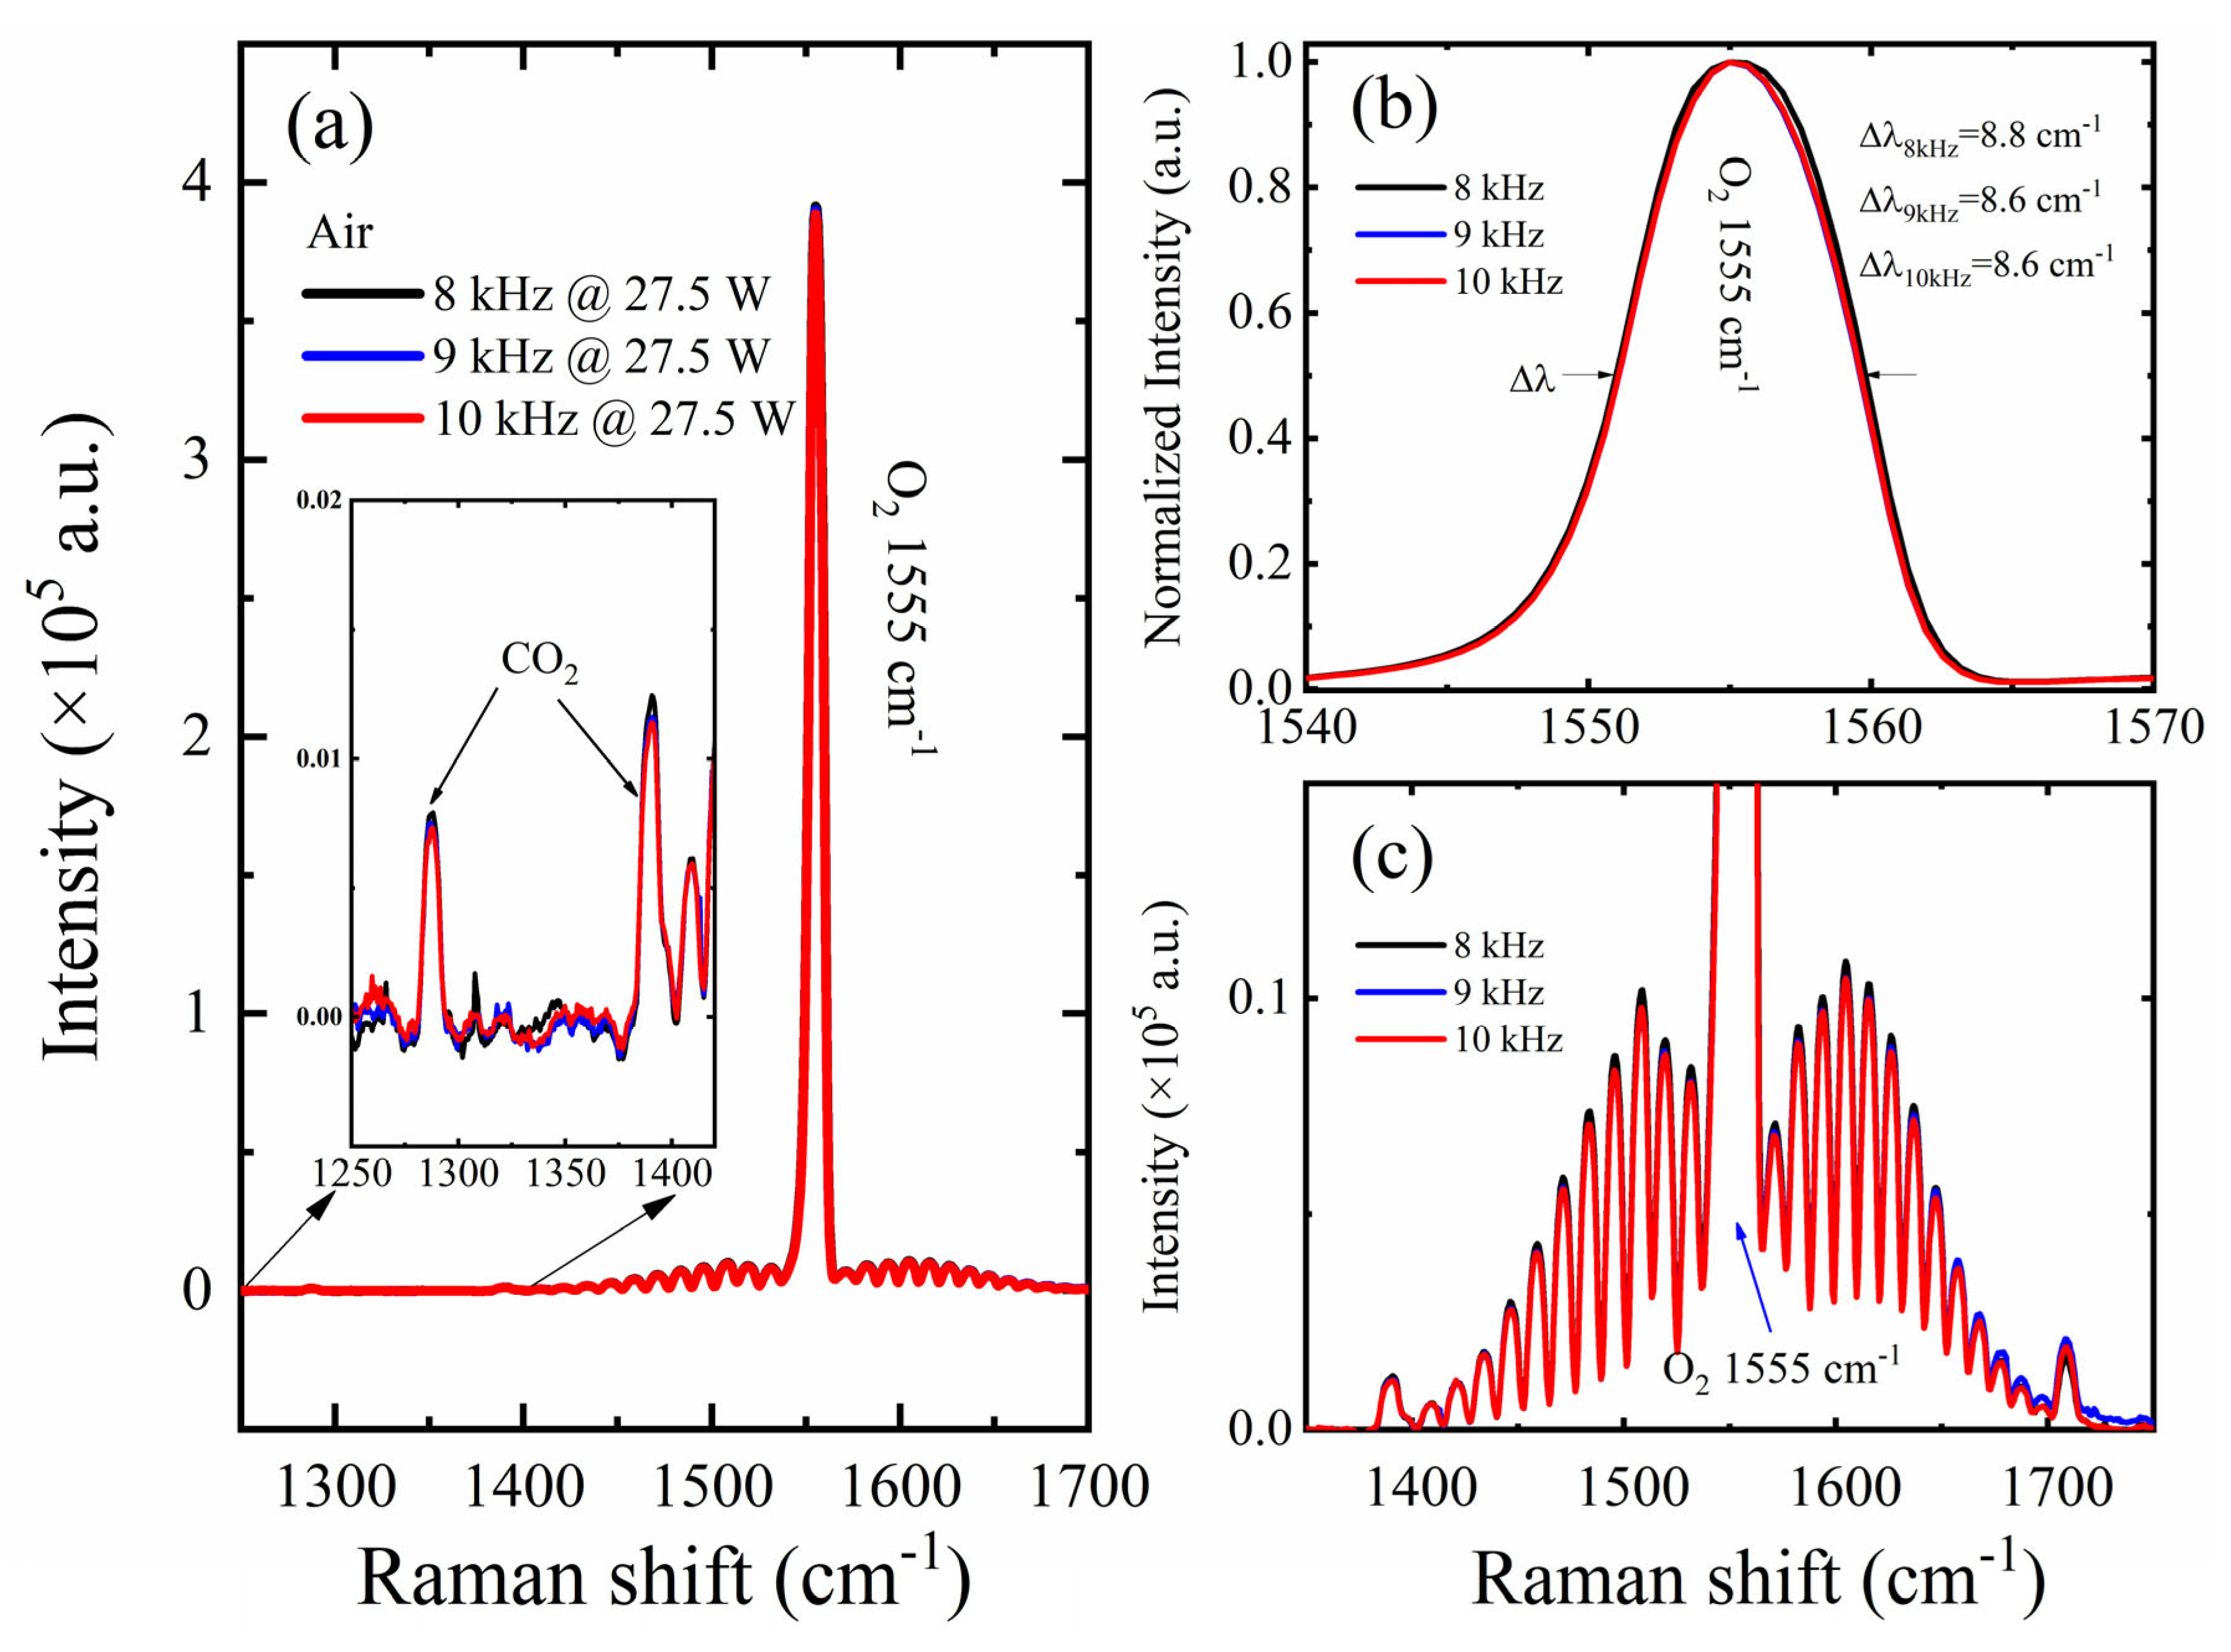
Our frequency-dependent Raman studies reveal a fundamental trade-off between signal intensity and spectral resolution under the same pump power (cf. Figure 5). As shown in Figure 5a, the Raman intensities of CO2 (1287 cm−1, 1389 cm−1) and O2 (1555 cm−1) decrease monotonically as the pulse repetition rate increases from 8 kHz to 10 kHz. Conversely, we observe an improvement in spectral resolution, characterized by a narrowing of the full width at half maximum (FWHM) with an increasing repetition rate (cf. Figure 5b). Specifically, when the repetition rate decreases from 10 kHz to 8 kHz (i.e., under constant average power, the single-pulse energy increases proportionally from 2.75 mJ to 3.44 mJ), the FWHM of the O2 Raman peak broadens from 8.6 cm−1 to 8.8 cm−1. The physical origin of this behavior lies in the peak-power dependence of the excitation. For an integrating detector such as the CCD, the accumulated signal over a fixed integration time (10 s) is primarily determined by the total number of photons reaching the detector. However, the instantaneous peak power density at the focal point of the near-concentric cavity increases dramatically with higher single-pulse energy. This intense transient field can influence the observed Raman linewidth. It may cause localized transient heating of the gas sample within the excitation volume, leading to pressure-induced broadening and an increase in FWHM. The possible influence of thermal accumulation was considered qualitatively rather than as a directly measured heat-dissipation rate. Under static gas conditions, repeated pulsed excitation may induce local heating in the focal region of the near-concentric cavity. Whether this heat fully dissipates between pulses depends on the beam radius, gas thermal diffusivity, pressure, and boundary conditions. However, because the local beam waist and transient temperature distribution were not directly measured in the present study, the thermal contribution should be regarded as a possible explanation rather than a quantitatively confirmed mechanism. Future work will combine narrower-slit spectral measurements, pulse-parameter characterization, and thermal modeling to clarify the relationship between repetition rate, local heating, and apparent linewidth. It should be noted that this 0.2 cm−1 FWHM shift is extremely small and approaches the intrinsic resolution limit of our spectrometer. Therefore, rather than assigning a definitive physical mechanism (such as thermal pressure broadening) to this subtle variation, we present it as a preliminary qualitative observation. Notably, despite the small absolute change in FWHM, the improvement in spectral resolution at higher repetition rates (lower peak power) enables the clear discrimination of rotational sidebands distributed on both sides of the O2 main vibrational peak (cf. Figure 5c). The observation of O2 rotational sidebands is not required for the CO2 LOD evaluation. It is included only as an auxiliary indication that the system can retain spectral information from atmospheric gas components. The central gas-detection result of this work remains the enhanced CO2 Raman signal and the corresponding concentration-equivalent detection limit.
Figure 5.
Comparison of Raman signal intensity of O2 and CO2 under the same pump power and different frequencies. (a) The Raman spectrum of CO2 and O2. (b) The normalized-intensity Raman spectrum of O2. (c) The rotational peaks distributed on both sides of the O2 main vibration peak. Normalized intensity using max–min normalization (Inorm = (I − Imin)/(Imax − Imin)) to compare spectral line shapes.
Therefore, the observed trade-off between signal intensity and spectral resolution is a direct consequence of the peak-power dependence of the excitation: higher single-pulse energy (lower repetition rate) enhances the raw Raman signal (beneficial for trace detection) but at the cost of degraded spectral resolution; lower single-pulse energy (higher repetition rate) preserves fine spectral features.
3.3. The LOD for CO2 of the Gas Raman Spectroscopy System Consisting of a High-Power Laser with a Near-Concentric Cavity
To evaluate the detection sensitivity of our high-power near-concentric-cavity Raman system, we first calculated the signal-to-noise ratio (SNR) for the CO2 Raman signal. The SNR was defined as the ratio of the peak intensity of the Raman signal to the root mean square (RMS) of the noise. The noise level was determined from a signal-free spectral region (1979–2009 cm−1 for CO2). At a pump power of 27.5 W, the CO2 Raman signal intensity reached its maximum, and the corresponding SNR was approximately 58. To accurately estimate the limit of detection (LOD) for CO2, we took into account the fact that the CO2 concentration in the laboratory environment is typically higher than that in the ambient atmosphere. The laboratory CO2 concentration used for the LOD estimation was independently measured using a commercial nondispersive infrared (NDIR) CO2 sensor (GSS ExplorIR-W, accuracy ± 30 ppm). The sensor was positioned close to the gas inlet of the Raman detection system to ensure that the measured CO2 concentration was representative of the gas sampled by the near-concentric cavity. The CO2 concentration was recorded for 3 days, and the average value was 916 ppm with a range of 890–940 ppm. Following the standard LOD criterion of three times the noise intensity (3σ), the LOD of our system for CO2 was calculated to be 48 ppm. This value is well below the typical atmospheric CO2 concentration of approximately 400 ppm [22], demonstrating that our system is fully capable of atmospheric monitoring. Altogether, these results collectively indicate that the combination of a high-power laser with a near-concentric cavity can significantly lower the LOD and enhance detection sensitivity, thereby offering an effective solution for trace gas detection.
It should be noted that the meaning of the CO2 detection limit depends on the gas background and the measurement scenario. Three different cases can be distinguished: detection of a small CO2 concentration change around a nonzero atmospheric background, detection of CO2 in an atmospheric-pressure carrier gas initially containing no CO2, and detection of CO2 in a fully degassed or vacuum-background environment. The 48 ppm value reported in this work corresponds to the first case. Specifically, it is an estimated concentration-equivalent LOD under laboratory-air conditions, where CO2 was already present as a background gas. The laboratory CO2 concentration was estimated to be 916 ppm, and the corresponding CO2 Raman signal had an SNR of approximately 58. Therefore, the reported 48 ppm value should be interpreted as the minimum detectable CO2 concentration-equivalent change under the present laboratory-air measurement conditions and acquisition protocol. It should not be regarded as a calibration-based zero-background LOD for CO2 in a CO2-free N2/O2 mixture or in a vacuum environment. Determining those values would require a sealed gas cell or vacuum-compatible cell, certified CO2 standard gases, blank measurements, replicate spectra, and calibration curves.
3.4. Limitations and Future Directions
While the present study successfully demonstrates the dual-enhancement strategy and its quantitative benefits, several limitations must be acknowledged to frame the work appropriately and guide future development.
On the one hand, the achieved LOD of 48 ppm for CO2, although significantly improved over conventional Raman sensors, does not reach the sub-ppm or ppb levels reported by some cavity-enhanced absorption spectroscopic techniques or mass spectrometry. This is an inherent constraint of spontaneous Raman scattering, which our system addresses through power and path length, but without utilizing resonant enhancement or photon-counting detectors. Future iterations could integrate a resonant optical cavity in a ring-down or cavity-enhanced spontaneous Raman configuration or employ higher quantum efficiency detectors to push the LOD toward the ppb regime. On the other hand, the temporal stability and vibration sensitivity of the Raman signal are important considerations for practical deployment of near-concentric cavity Raman systems. In the present experiment, the optical setup was operated on a laboratory optical table, and the alignment of the excitation beam, multipass cavity, and collection optics was carefully optimized before spectral acquisition. Because the near-concentric cavity relies on repeated beam refocusing and spatial overlap between the excitation volume and the collection optics, mechanical vibration or mirror misalignment may change the beam trajectory in the cavity and lead to fluctuations in the collected Raman signal. Systematic vibration-resistance measurements were not performed in the present study. Therefore, the reported LOD should be interpreted as the laboratory performance of the optimized optical setup rather than a guarantee of long-term field stability. To transition this technology from the laboratory to real-world applications, future work should include environmental testing, automated alignment routines, and the development of a mechanically rigid cavity mount with vibration isolation and robust optical packaging, along with active alignment monitoring to maintain long-term signal stability.
Despite these limitations, the present work provides a robust platform and a clear roadmap. By quantitatively revealing the synergistic gains of simultaneous excitation and collection enhancement and by carefully delineating the remaining challenges, we believe that high-power near-concentric cavity Raman spectroscopy can evolve into a genuinely competitive tool for trace gas analysis.
In addition to further improving spontaneous Raman detection, nonlinear Raman techniques may provide another route toward higher sensitivity. Coherent anti-Stokes Raman scattering (CARS), for example, can generate a coherent and directional anti-Stokes signal and may therefore provide a much stronger informative signal than spontaneous Raman scattering under suitable excitation and phase-matching conditions. This feature could potentially improve the SNR for trace gas detection. However, CARS generally requires at least two synchronized laser fields, precise spatial and temporal overlap, and careful phase-matching control. Moreover, a nonresonant background and more complex spectral line shapes may complicate quantitative gas analysis, especially for broadband multi-component detection. Therefore, while CARS is a promising future direction for further enhancing Raman-based gas sensing, the present work focuses on a simpler spontaneous Raman configuration based on single-wavelength 532 nm excitation and near-concentric multipass enhancement.
4. Conclusions
This study demonstrates a high-power near-concentric-cavity enhanced Raman spectroscopy system for sensitive gas detection. By integrating a high-power 532 nm pulsed laser with a near-concentric multipass cell, the system simultaneously increases the excitation photon flux and the effective interaction length, thereby providing a dual-enhancement strategy for gas Raman scattering. The experimental results show that the Raman signal intensity of CO2 increases approximately linearly with the average excitation power under fixed cavity and detection conditions. The two characteristic CO2 Raman peaks at 1287 cm−1 and 1389 cm−1 exhibit strong power-dependent responses, confirming that excitation-power scaling is an effective route for improving gas-phase Raman signal strength. The system achieves an estimated CO2 limit of detection of 48 ppm under the present experimental conditions. Beyond demonstrating signal enhancement, this work provides a useful platform for further exploring the relationship between laser parameters, cavity geometry, and gas Raman detection performance. Future studies should focus on calibration with certified standard gases, uncertainty-resolved LOD evaluation, long-term signal stability, vibration tolerance, and pressure-dependent Raman response. These investigations will help clarify the fundamental limits of high-power multipass Raman spectroscopy and support the development of compact, robust, and field-deployable instruments for environmental monitoring, industrial safety, and multi-component trace gas analysis. Overall, the present work advances the practical implementation of Raman spectroscopy for gas sensing by combining high excitation power with multipass optical enhancement. This strategy offers a promising strategy toward sensitive, reagent-free, and multi-species gas detection in both laboratory and real-world environments.
Author Contributions
Conceptualization, Y.R. and D.Y.; methodology, Y.R. and D.Y.; validation, D.Y., S.W. and Z.W.; formal analysis, Y.R.; investigation, Y.R.; resources, D.Y.; data curation, Y.R. and D.Y.; writing—original draft preparation, Y.R.; writing—review and editing, D.Y. and Y.C.; visualization, Y.R. and D.Y.; supervision, Y.C.; project administration, Y.C.; funding acquisition, Y.C. All authors have read and agreed to the published version of the manuscript.
Funding
This research was supported by Key Program of the National Natural Science Foundation of China (12332002), Hebei Province Higher Education Institutions Scientific and Technological Research Projects (CXY2024003) and Hubei Provincial Science and Technology Program Projects (2024EHA071).
Data Availability Statement
The data that support the findings of this study are available from the corresponding author upon reasonable request.
Conflicts of Interest
The authors declare no conflicts of interest.
References
- Dickinson, R.E.; Cicerone, R.J. Future global warming from atmospheric trace gases. Nature 1986, 319, 109–115. [Google Scholar] [CrossRef] [Scilit]
- Rasmussen, R.A.; Khalil, M.A.K. Atmospheric trace gases: Trends and distributions over the last decade. Science 1986, 232, 1623–1624. [Google Scholar] [CrossRef] [Scilit] [PubMed]
- Shreve, A.P.; Cherepy, N.J.; Mathies, R.A. Effective rejection of fluorescence interference in Raman spectroscopy using a shifted excitation difference technique. Appl. Spectrosc. 1992, 46, 707–711. [Google Scholar] [CrossRef] [Scilit]
- Zhang, Z.; Zhang, F.; Xu, B.; Xie, H.; Fu, B.; Lu, X.; Zhang, N.; Yu, S.; Yao, J.; Cheng, Y.; et al. High-sensitivity gas detection with air-lasing-assisted coherent Raman spectroscopy. Ultrafast Sci. 2022, 2022, 9761458. [Google Scholar] [CrossRef] [Scilit]
- Li, J.; Huang, J.; Zheng, L.; Feng, W.; Zhan, Y.; Naz, S. Real-time detection of molecular structures and metal components within airborne particles using concurrent Raman and Spark emission spectroscopy. Aerosol Sci. Technol. 2024, 58, 1267–1280. [Google Scholar] [CrossRef] [Scilit]
- Wang, M.; Wang, J.; Wang, P.; Wang, Z.; Tang, S.; Qian, G.; Liu, T.; Chen, W. Multi-pass cavity-enhanced Raman spectroscopy of complex natural gas components. Anal. Chim. Acta 2025, 1336, 343463. [Google Scholar] [CrossRef] [Scilit] [PubMed]
- Long, D.A. The Raman Effect: A Unified Treatment of the Theory of Raman Scattering by Molecules; John Wiley & Sons: Hoboken, NJ, USA, 2002. [Google Scholar]
- Liu, X.; Ma, Y. Sensitive carbon monoxide detection based on light-induced thermoelastic spectroscopy with a fiber-coupled multipass cell. Chin. Opt. Lett. 2022, 20, 031201. [Google Scholar] [CrossRef] [Scilit]
- Gomez Velez, J.; Muller, A. Trace gas sensing using diode-pumped collinearly detected spontaneous Raman scattering enhanced by a multipass cell. Opt. Lett. 2019, 45, 133–136. [Google Scholar] [CrossRef] [Scilit]
- Li, X.; Xia, Y.; Zhan, L.; Huang, J. Near-confocal cavity-enhanced Raman spectroscopy for multitrace-gas detection. Opt. Lett. 2008, 33, 2143–2145. [Google Scholar] [CrossRef] [Scilit] [PubMed]
- Waldherr, G.A.; Lin, H. Gain analysis of an optical multipass cell for spectroscopic measurements in luminous environments. Appl. Opt. 2008, 47, 901–907. [Google Scholar] [CrossRef] [Scilit] [PubMed]
- White, J.U. Long optical paths of large aperture. J. Opt. Soc. Am. 1942, 32, 285–288. [Google Scholar] [CrossRef] [Scilit]
- Herriott, D.; Kogelnik, H.; Kompfner, R. Off-axis paths in spherical mirror interferometers. Appl. Opt. 1964, 3, 523–526. [Google Scholar] [CrossRef] [Scilit]
- Hill, R.A.; Hartley, D.L. Focused, multiple-pass cell for Raman scattering. Appl. Opt. 1974, 13, 186–192. [Google Scholar] [CrossRef] [Scilit] [PubMed]
- Kc, U.; Silver, J.A.; Hovde, D.C.; Varghese, P.L. Improved multiple-pass Raman spectrometer. Appl. Opt. 2011, 50, 4805–4816. [Google Scholar] [CrossRef] [Scilit] [PubMed]
- Trutna, W.R.; Byer, R.L. Multiple-pass Raman gain cell. Appl. Opt. 1980, 19, 301–312. [Google Scholar] [CrossRef] [Scilit] [PubMed]
- Yang, D.W.; Guo, J.J.; Du, Z.F.; Wang, Z.N.; Zheng, R.E. Raman signal enhancement for gas detection using a near concentric cavity. Spectrosc. Spectr. Anal. 2015, 35, 645–648. [Google Scholar]
- Liu, Q.-S.; Yang, D.-W.; Guo, J.-J.; Yan, A.-S.; Zheng, R.-E. Raman spectroscopy for gas detection using a folded near-concentric cavity. Spectrosc. Spectr. Anal. 2020, 40, 3390–3393. [Google Scholar]
- Ren, Y.; Yang, D.; Sun, Y.; Xu, J.; Liu, S.; Chen, Y. Raman signal enhancement for gas detection using a dual near-concentric cavities group. Chin. Opt. Lett. 2024, 22, 051202. [Google Scholar] [CrossRef] [Scilit]
- Yang, D.; Guo, J.; Liu, Q.; Luo, Z.; Yan, J.; Zheng, R. Highly sensitive Raman system for dissolved gas analysis in water. Appl. Opt. 2016, 55, 7744–7748. [Google Scholar] [CrossRef] [Scilit] [PubMed]
- Sheppard, N. The historical development of experimental techniques in vibrational spectroscopy. In Handbook of Vibrational Spectroscopy; John Wiley & Sons: Hoboken, NJ, USA, 2006. [Google Scholar]
- Yuan, Y.; Zhang, S.; Hu, S.; Lin, J.; Shao, S.; Cao, K.; Huang, J.; Xu, Z.; Xu, H. Reliability analysis of Raman scattering lidar for measurement of atmospheric carbon dioxide profiles. Infrared Laser Eng. 2014, 43, 1135–1139. [Google Scholar]
Disclaimer/Publisher’s Note: The statements, opinions and data contained in all publications are solely those of the individual author(s) and contributor(s) and not of MDPI and/or the editor(s). MDPI and/or the editor(s) disclaim responsibility for any injury to people or property resulting from any ideas, methods, instructions or products referred to in the content. |
© 2026 by the authors. Licensee MDPI, Basel, Switzerland. This article is an open access article distributed under the terms and conditions of the Creative Commons Attribution (CC BY) license.