


Abstract
Cortisol monitoring is relevant for stress assessment and endocrine-related disorders, but conventional assays often require labeled reagents, multistep protocols, or laboratory instrumentation. This work numerically evaluates a black phosphorus (BP)-based surface plasmon resonance (SPR) platform for label-free optical detection of cortisol-related refractive-index changes using angular interrogation at λ = 633 nm. The proposed structure consists of a SiO2 prism, an aluminum plasmonic layer, a TiO2 dielectric layer, a BP monolayer, and the sensing medium. The optical response was calculated using the transfer matrix method under TM polarization, and the platform was assessed through resonance-angle shift, sensitivity, full width at half maximum, detection accuracy, quality factor, figure of merit, theoretical refractive-index detection limit, and combined sensitivity factor. Sequential optimization identified SiO2 as the prism material, 70 nm Al as the plasmonic layer, and 21 nm TiO2 as the dielectric layer. BP was retained as the interfacial 2D material within the intended SiO2/Al/TiO2/BP architecture and exhibited the lowest imaginary refractive-index component among the evaluated 2D materials at 633 nm. For cortisol-related refractive-index changes, the resonance angle shifted from 87.08° to 87.42° as the concentration increased from 0.72 to 4.5 ng/mL. The maximum sensitivity was 480.00/RIU at 0.72 ng/mL, whereas 1.8 ng/mL yielded the highest composite performance according to the adopted CSF definition. These results support SiO2/Al/TiO2/BP as a sensitivity-oriented SPR transduction platform, with future validation requiring fabrication, calibration, and cortisol-selective surface functionalization.
1. Introduction
Cortisol is a steroid hormone involved in the regulation of stress response, metabolism, immune activity, and circadian rhythm [1,2]. Abnormal cortisol levels have been associated with endocrine disorders such as Cushing’s syndrome and Addison’s disease, as well as sleep disturbance, mood disorders, and stress-related physiological dysregulation [3,4,5,6]. Cortisol can be measured in blood, urine, saliva, and sweat [7,8]; among these matrices, saliva is attractive for routine monitoring because sampling is non-invasive and reflects the free, biologically active fraction of cortisol [9]. This makes salivary cortisol detection relevant for repeated measurements, point-of-care analysis, and stress monitoring protocols where patient comfort and rapid response are needed [10,11].
Conventional cortisol analysis relies on immunoassays, chemiluminescent methods, chromatography-based techniques, and electrochemical platforms. Although these methods can provide sensitive quantification, they may require labeled reagents, multistep sample preparation, trained personnel, or laboratory instrumentation [12,13]. Recent sensor developments have therefore focused on portable and minimally invasive formats using antibodies, aptamers, molecularly imprinted polymers, and plasmonic interfaces. These recognition approaches have been applied to cortisol detection in saliva and sweat, with the receptor layer providing molecular selectivity and the underlying optical or electrochemical platform providing signal transduction [14,15,16,17,18].
Surface plasmons are collective oscillations of free electrons at a metal–dielectric interface that, when coupled with an electromagnetic field, form surface plasmon polaritons propagating along the interface with evanescent decay into the adjacent media [19,20]. Surface plasmon resonance (SPR) sensors exploit this behavior to monitor refractive-index changes near the sensing surface without molecular labels [21,22]. In the Kretschmann configuration, p-polarized light excites the surface plasmon mode when the in-plane component of the incident wavevector satisfies the phase-matching condition [23,24]. This coupling produces a minimum in the angular reflectance curve, and variations in the refractive index of the sensing medium shift the resonance angle, enabling real-time evaluation of biomolecular interactions using small sample volumes [25,26,27,28].
The performance of an SPR sensor is strongly affected by the optical properties, thickness, and sequence of the layers in the multilayer structure [29,30]. Aluminum is a relevant plasmonic material for SPR platforms because it is compatible with thin-film fabrication and offers a cost-effective alternative to noble metals, although surface oxidation must be considered in the sensor design [31]. Titanium dioxide (TiO2) can act as a dielectric layer that modifies optical confinement and supports the interaction between the evanescent field and the sensing medium [32]. Silicon dioxide (SiO2) is commonly used in optical multilayers due to its transparency, chemical stability, and compatibility with deposition processes [33,34]. When these materials are combined in a controlled multilayer structure, the resonance response can be tuned without assuming that the material stack alone provides biochemical selectivity.
Black phosphorus has also attracted interest in SPR-based sensing because of its anisotropic optical response, layer-dependent properties, and large interfacial area [29]. In the context of cortisol detection, its role should be interpreted as an optical contribution to the SPR response rather than as a complete recognition mechanism [35,36]. Selective cortisol detection would require an appropriate biofunctional interface, such as an antibody, aptamer, glucocorticoid receptor, or molecularly imprinted receptor [15,16,17,18,37]. Recent studies have demonstrated cortisol sensing using antibody-functionalized BP platforms, aptamer-modified plasmonic sensors, glucocorticoid-receptor interfaces, and molecularly imprinted recognition layers [15,16,17,18]. These approaches separate biochemical recognition from optical transduction: the receptor layer provides selectivity, whereas the SPR structure converts the binding-induced refractive-index change into an angular shift. For this reason, numerical studies are useful at the design stage, since they allow the influence of material selection and layer thickness on sensitivity, full width at half maximum, detection accuracy, quality factor, and refractive-index detection limit to be evaluated before experimental fabrication.
Previous numerical work has shown that aluminum-based SPR multilayers supported by borosilicate substrates can operate as refractive index sensors for aqueous media, including metal-ion mixtures [38]. Building on that optical design concept, the present work reformulates the multilayer SPR approach for a biosensing scenario focused on cortisol detection. This sensing problem differs from metal-ion monitoring because cortisol is a biological stress biomarker, and the intended application is non-invasive detection, particularly in saliva. The prism material and multilayer configuration are therefore analyzed under operating conditions aimed at cortisol-induced refractive index changes, while the performance is assessed through angular sensitivity, resonance width, detection accuracy, quality factor, and limit of detection.
In this work, a black phosphorus-based SPR platform is numerically analyzed for label-free optical detection of cortisol-related refractive-index changes using angular interrogation. The study evaluates the resonance angle shift produced by refractive index variations in the sensing medium associated with cortisol concentration. The analysis is limited to the optical performance of the proposed SPR structure and provides a theoretical basis for future experimental validation using a cortisol-selective recognition layer.
2. Materials and Methods
2.1. Performance Metrics and Optimization Protocol
To evaluate the optical response of the proposed SPR biosensor, the reflectance curve was calculated as a function of the incident angle under transverse magnetic (TM) polarization. TM-polarized light was considered because surface plasmon polaritons are excited only when the electric field has a component normal to the metal–dielectric interface. The reflectance minimum defines the resonance condition, and the corresponding angle is denoted as the SPR angle, θSPR. Variations in the refractive index of the sensing medium shift θSPR, which provides the basis for cortisol detection through angular interrogation.
The sensor performance was assessed using sensitivity, full width at half maximum (FWHM), detection accuracy (DA), quality factor (QF), figure of merit (FoM), limit of detection (LoDRI), and combined sensitivity factor (CSF). The relative sensitivity change between two sensing states was calculated using Equation (1):
where and are the refractive index sensitivities before and after the selected structural modification or sensing event, respectively.
The angular refractive index sensitivity was calculated using Equation (2):
where is the resonance angle shift and is the refractive index change of the sensing medium. A larger indicates a stronger angular response to a small refractive index variation. The FWHM was extracted from each SPR curve as the angular width at half of the reflectance dip. Narrower resonance curves are preferred because they allow smaller angular shifts to be resolved.
The detection accuracy was calculated from the resonance angle shift and , as shown in Equation (3):
The quality factor was defined using Equation (4):
Equations (3) and (4) were used together with Equation (2) to avoid selecting a configuration that produces a large angular shift but a broad or poorly defined resonance dip. The figure of merit was calculated using Equation (5):
where is the minimum normalized reflectance at resonance. The theoretical refractive-index detection limit, , was estimated using Equation (6):
where 0.005° represents the minimum resolvable angular shift considered in the numerical analysis. The resulting is expressed in RIU and represents the minimum refractive-index variation resolvable under the adopted angular-resolution criterion.
The optimization protocol was performed by varying the thickness of each active layer while keeping the remaining parameters fixed. For each tested configuration, the SPR curve was generated and the values of θSPR, Rmin, FWHM, S, DA, QF, FoM, and LoDRI were extracted using Equations (1)–(6). The optimal structure was not selected only from the highest sensitivity, since a configuration with large S can also exhibit a wide FWHM or a large Rmin. The selected design was required to provide a balanced response, combining high angular sensitivity with a distinguishable resonance minimum and a moderate FWHM.
For cortisol detection, the refractive index of the sensing medium was varied according to the cortisol concentration range considered in the numerical model. The shift in θSPR was used to quantify the angular response through Equation (1). The remaining metrics, defined in Equations (2)–(6), were used to compare resonance sharpness, detection capability, and resonance contrast among the tested configurations. This protocol follows the evaluation strategy commonly used in numerical SPR studies, where sensitivity and resonance quality are assessed from angular reflectance curves before experimental biofunctionalization and validation. The complete transfer matrix formulation is provided in the Supplementary Material.
2.2. Biosensor Setup and Performance Evaluation
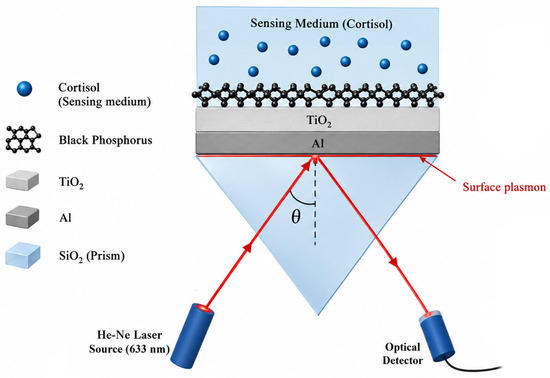
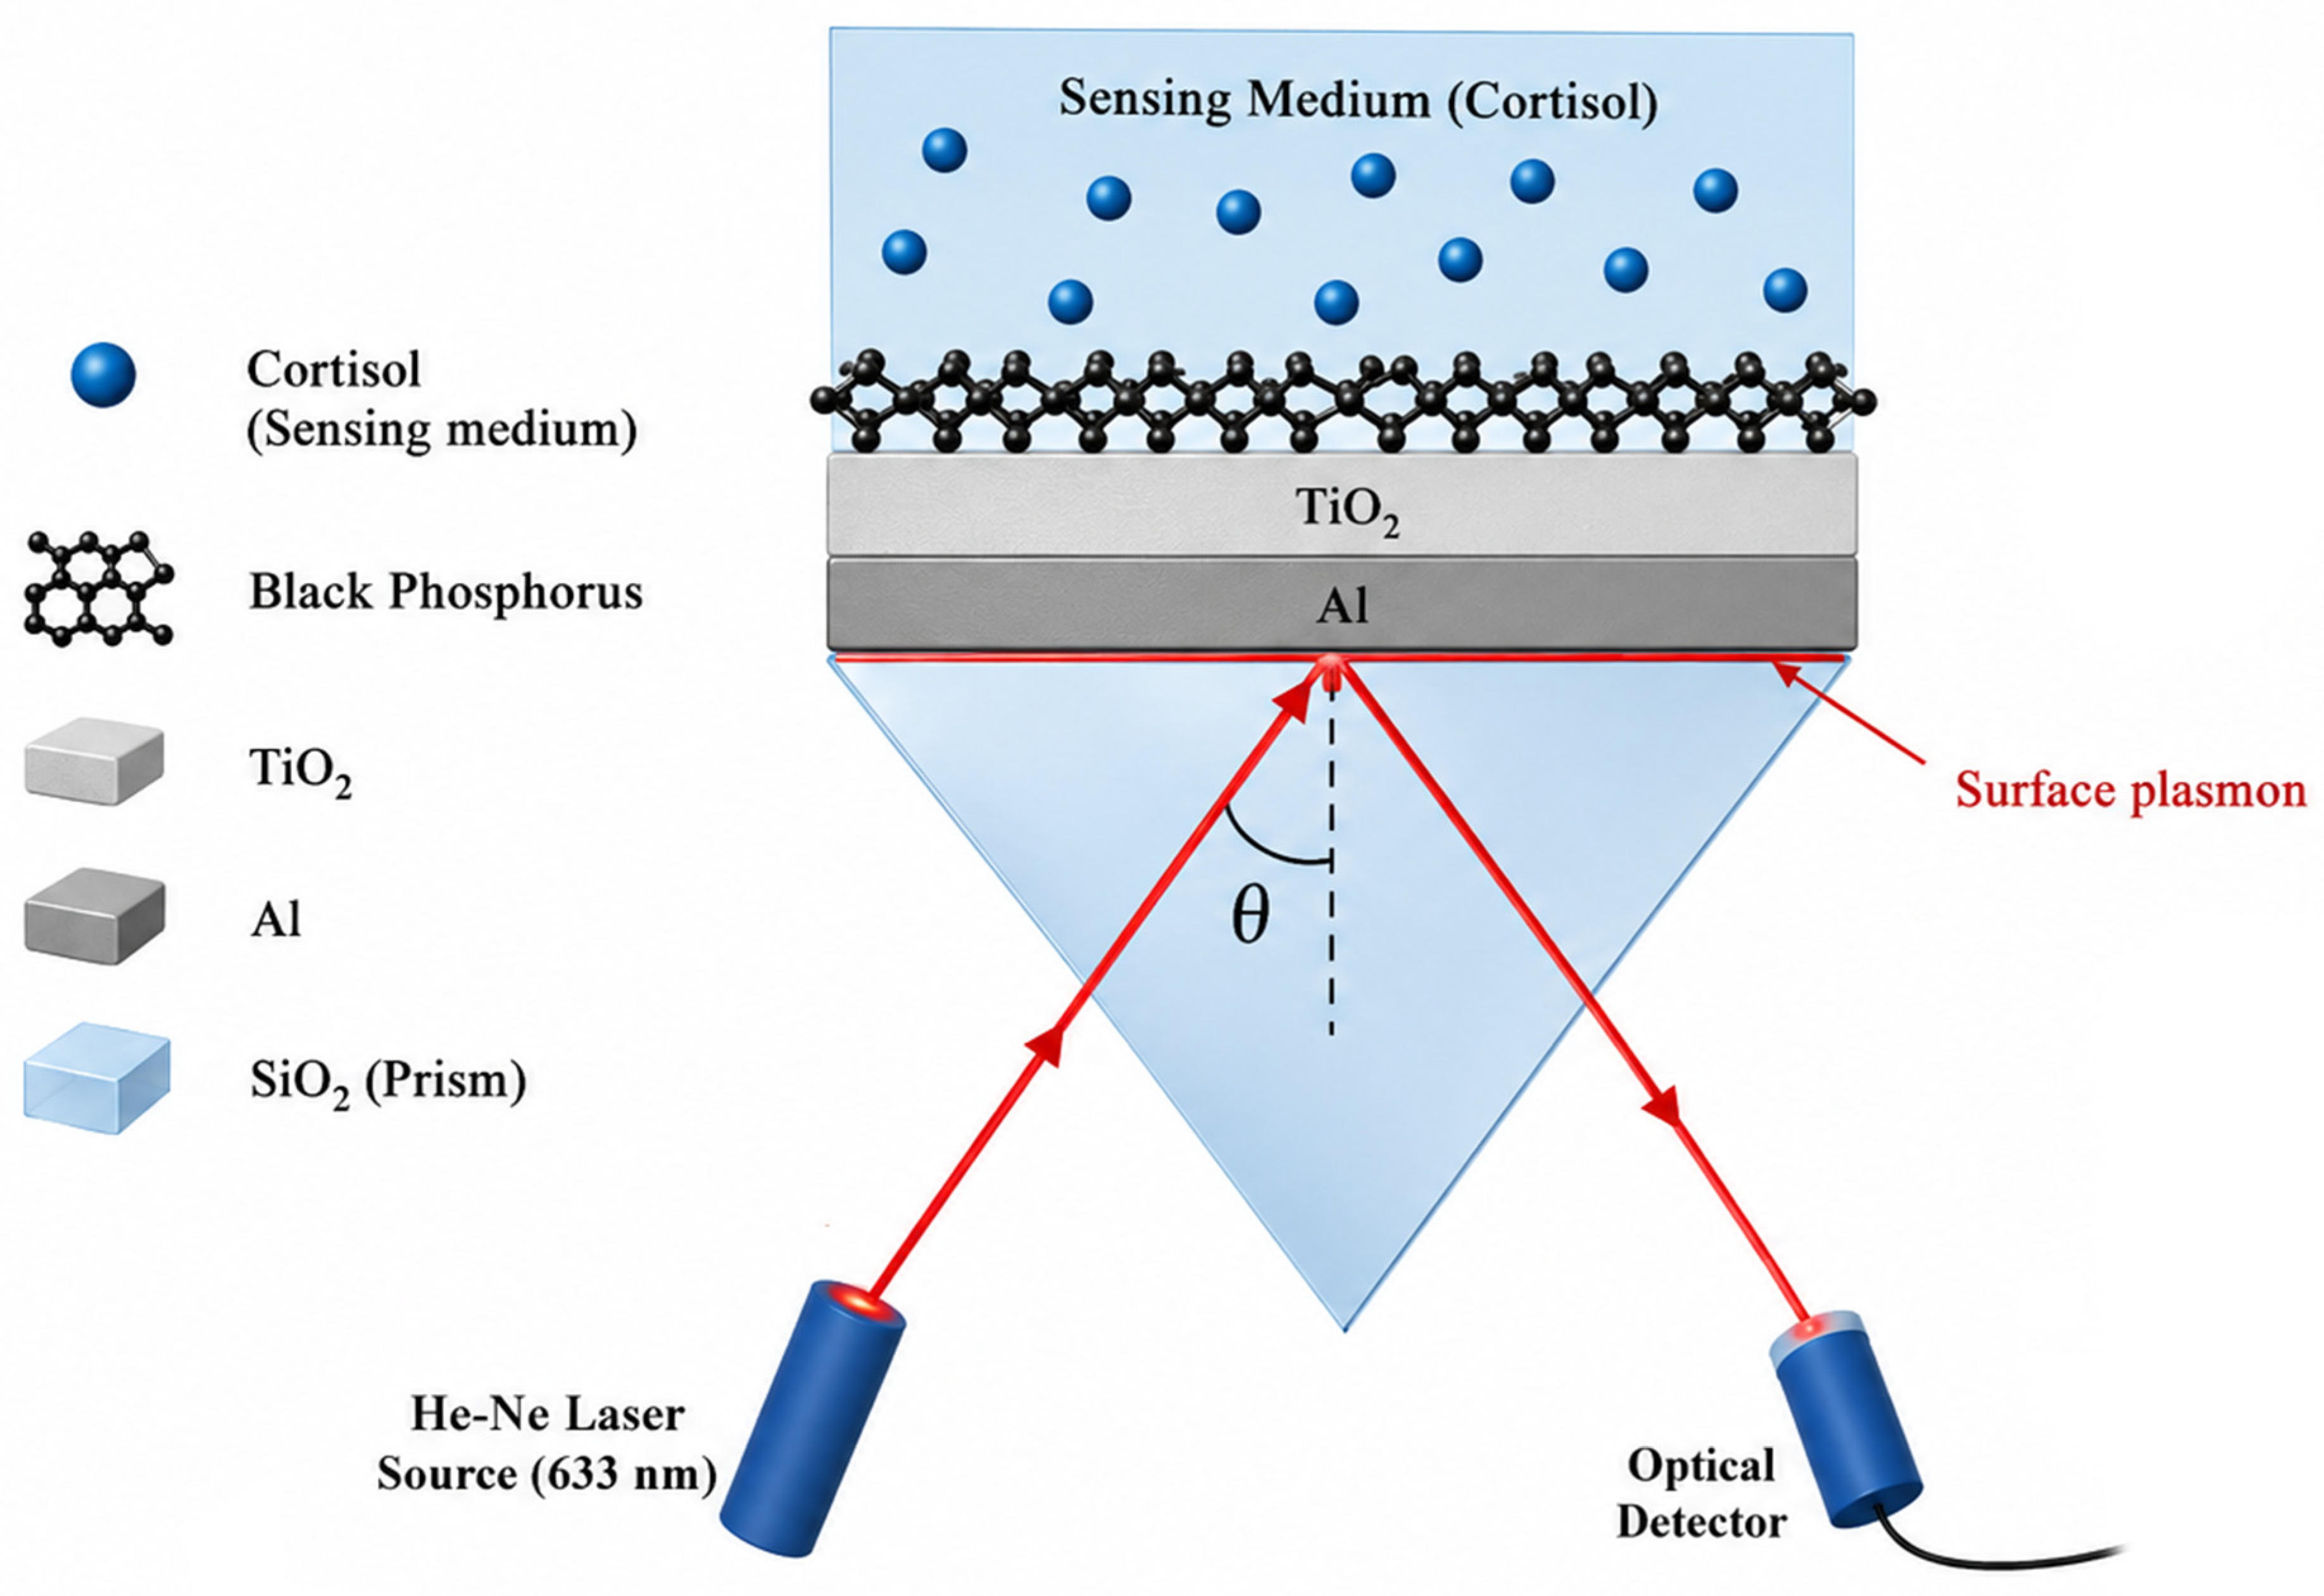
The proposed biosensor was modeled using a prism-coupled SPR configuration under angular interrogation, as shown in Scheme 1. The sensing architecture consisted of a SiO2 prism, an aluminum plasmonic layer, a TiO2 dielectric layer, a black phosphorus layer, and the sensing medium. TM-polarized light was used because this polarization condition is required to excite surface plasmon polaritons at the metal–dielectric interface. A He–Ne laser wavelength of λ = 633 nm was used throughout the simulations as the fixed operating wavelength for the structural analysis. Under angular interrogation, the incidence angle, θ, was varied over the selected angular range while the wavelength and TM polarization were kept fixed. For each angle, the reflectance was calculated using the transfer matrix method. The resulting angular reflectance curve was used to identify the resonance angle, θSPR, as the angle corresponding to the minimum reflectance.
Scheme 1.
Proposed SiO2/Al/TiO2/BP SPR biosensor for cortisol detection under TM-polarized angular interrogation.
The refractive indices and initial layer thicknesses used to define the starting SPR model are summarized in Table 1. SiO2 was used as the prism material with a refractive index of 1.4571. Aluminum was initially assigned a thickness of 45 nm as the plasmonic layer, while TiO2 was initially incorporated as a 10 nm dielectric layer to tune the resonance response near the sensing interface. Black phosphorus was included as a 0.53 nm two-dimensional layer, corresponding to a monolayer, in contact with the sensing medium. These values were used as the starting configuration for the sequential thickness analysis; the final selected Al and TiO2 thicknesses were determined from the optimization results. The aqueous medium was assigned a refractive index of ns = 1.330 [39], while the cortisol-containing reference state at 0.36 ng/mL was assigned ns = 1.3297 following Refs. [40,41,42]. The other material parameters were taken from Refs. [39,40,41,42].
Table 1.
Refractive indices and initial layer thicknesses used for the starting SiO2/Al/TiO2/BP SPR biosensor model.
The structural nomenclature used to compare the investigated SPR platforms is provided in Table S1. These system codes were used to distinguish the prism-supported configurations during the preliminary optimization stage. The influence of prism refractive index on the SPR peak position is summarized in Table S2. This comparison allowed the optical coupling condition to be evaluated before selecting the SiO2-supported configuration for the final biosensor design.
The optimization was carried out sequentially using SiO2/Al/TiO2/BP as the target architecture. The SiO2/Al/SM baseline was first selected, followed by Al- and TiO2-thickness optimization. The BP-containing sensing interface was then evaluated in the 2D-material comparison to verify that the final architecture preserved a defined SPR response for cortisol-related refractive-index detection.
For cortisol detection, the sensing medium was varied according to the refractive index range associated with the cortisol concentrations considered in the numerical model. The modeled cortisol concentration range was 0.72–4.50 ng/mL, corresponding to sensing-medium refractive indices from 1.3300 to 1.3311, as summarized in Table S9. In this configuration, changes in the refractive index of the analyte-containing region shift θSPR, allowing the biosensor response to be estimated through angular interrogation. The optical multilayer is evaluated as the transduction platform; selective cortisol recognition would require a cortisol-specific functional layer in an experimental implementation.
3. Results and Discussions
3.1. Prism Selection and Baseline SPR Response
The prism material was first evaluated to define the optical coupling condition of the baseline SPR platform before introducing the TiO2 and BP layers. The investigated systems and their structural nomenclature are summarized in Table S1. In this preliminary stage, each configuration consisted of a prism, an aluminum plasmonic layer, and the sensing medium. The comparison included BaF2/Al/SM, SF10/Al/SM, SiO2/Al/SM, and BK7/Al/SM, using the refractive indices reported in Table S2.
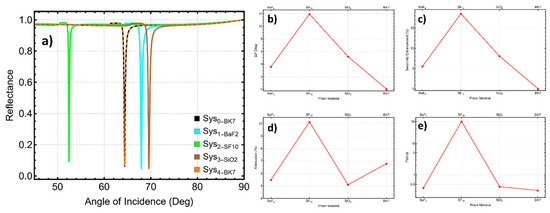
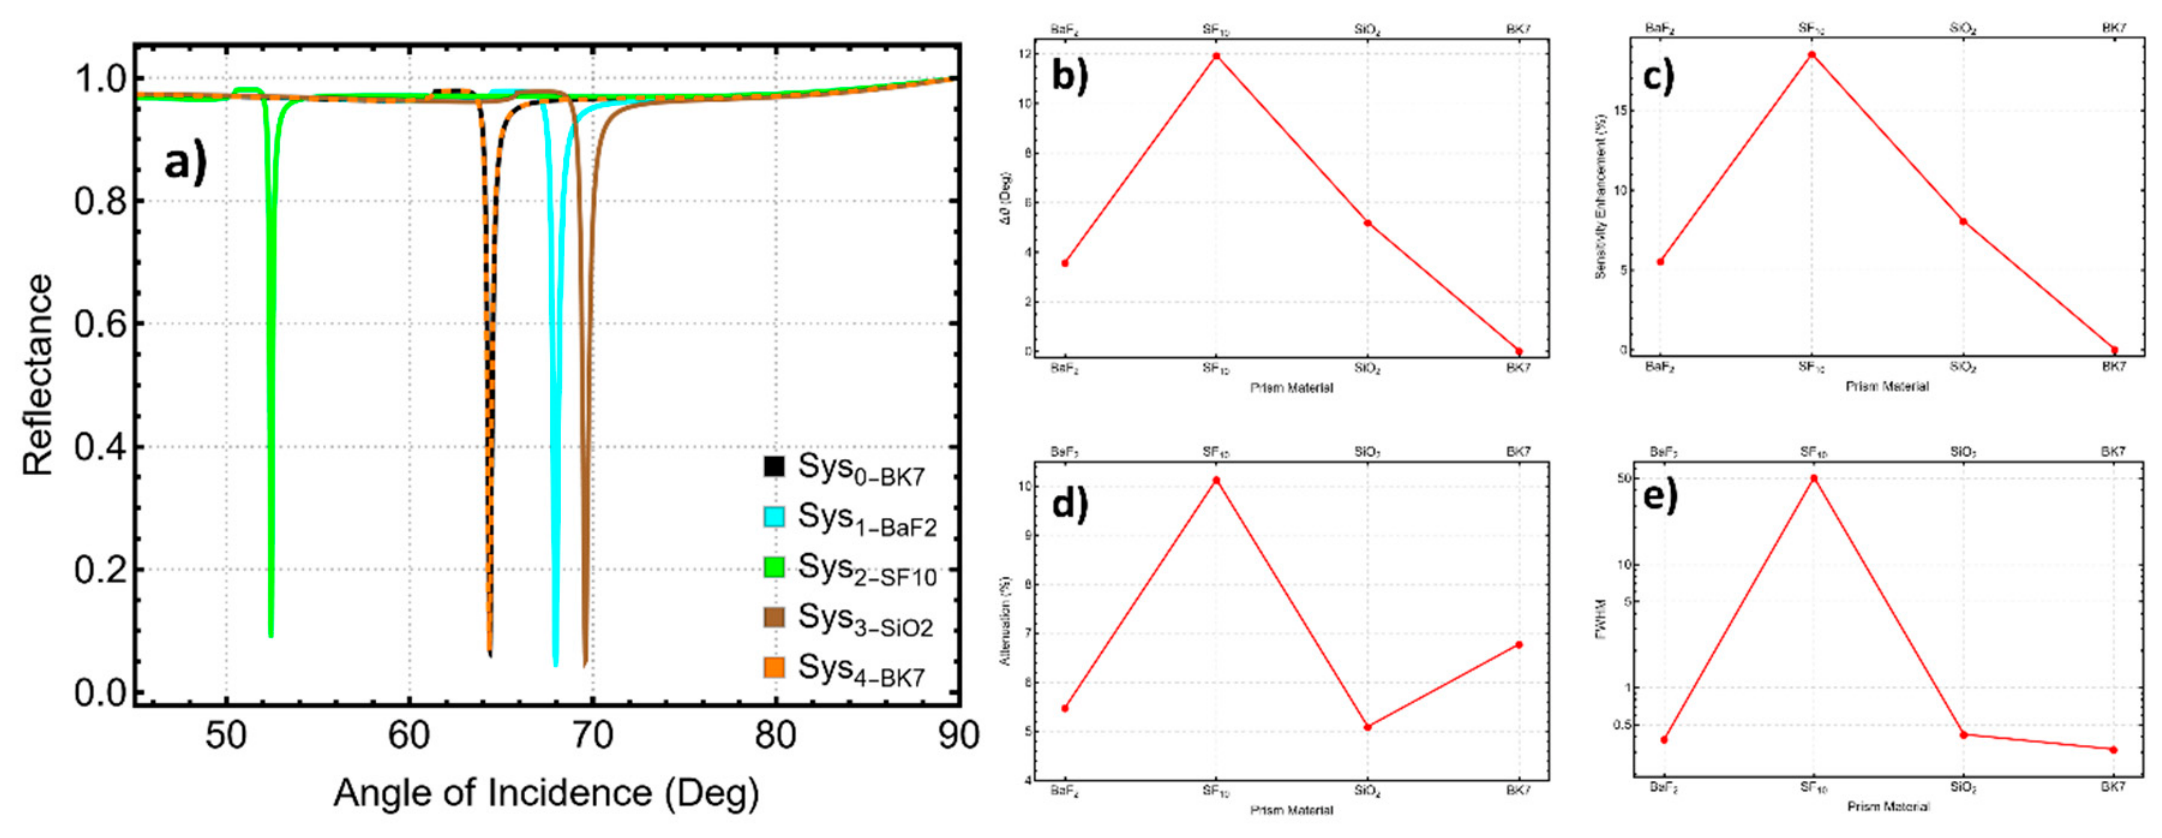
The angular reflectance curves in Figure 1a shows that the resonance position depends on the refractive index of the prism. The SF10-based structure produced the resonance dip at the lowest angle, with an SPR peak position of 52.44°, while the SiO2-based structure shifted the resonance to 69.58°, as reported in Table S2. The BaF2 and BK7 systems exhibited resonance positions of 67.96° and 64.35°, respectively. This behavior indicates that the prism refractive index modifies the momentum-matching condition required for surface plasmon excitation.
Figure 1.
Effect of prism material on SPR response and sensing performance metrics: (a) reflectance profiles, (b) ΔθSPR, (c) sensitivity, (d) DA, and (e) FOM.
The resonance-angle shift, Δθ, obtained for each prism-supported structure is shown in Figure 1b and listed in Table 2. The SF10/Al/SM system produced the largest angular shift, Δθ = 11.94°, followed by SiO2/Al/SM with Δθ = 5.20° and BaF2/Al/SM with Δθ = 3.58°. The BK7/Al/SM system showed only a small shift of 0.03°. The corresponding sensitivity enhancement values in Figure 1c and Table 2 followed the same trend, with SF10/Al/SM giving the largest enhancement of 18.54%, while SiO2/Al/SM reached 8.08%.
Table 2.
Comparison of resonance characteristics and sensing performance metrics for the investigated prism-based SPR systems.
The attenuation response in Figure 1d and Table 2 shows that the SiO2/Al/SM structure produced an attenuation value of 5.09%, close to the BaF2 case and lower than the SF10 case. The FWHM values in Figure 1e and Table 2 show a more distinct difference among the prism materials. Although SF10/Al/SM produced the largest angular shift, it also showed a broad resonance width of 50.86°, which reduces the practical sharpness of the SPR dip. By comparison, the SiO2/Al/SM configuration showed a narrow FWHM of 0.41°, close to the BaF2 and BK7 cases. A narrow resonance width is useful because it allows smaller angular changes to be identified with less ambiguity in angular interrogation.
Based on this comparison, the SiO2/Al/SM platform was selected as the baseline configuration for the final biosensor model. This choice was not based only on the highest angular shift. Instead, the SiO2-supported system provided a balanced response, combining a measurable resonance shift, moderate sensitivity enhancement, and a narrow resonance profile. The SiO2/Al/SM system was therefore used as the starting structure for the subsequent multilayer design, where TiO2 and BP were incorporated to form the final SiO2/Al/TiO2/BP/sensing-medium biosensor for cortisol detection.
3.2. Aluminum Thickness Selection for the SiO2-Supported SPR Platform
Once the SiO2-supported configuration was selected as the initial platform, the aluminum film was optimized to establish the plasmonic layer of the proposed biosensor. For this purpose, four SiO2/Al/sensing medium structures were analyzed by varying the Al thickness from 45 to 70 nm. The system identifiers and corresponding layer arrangements are presented in Table S3. The resonance angles obtained for each configuration are reported in Table S4, whereas the main sensing parameters are compiled in Table 3.
Table 3.
Comparison of SPR characteristics and sensing performance metrics for different aluminum layer thicknesses.
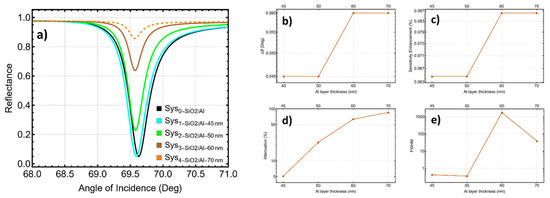
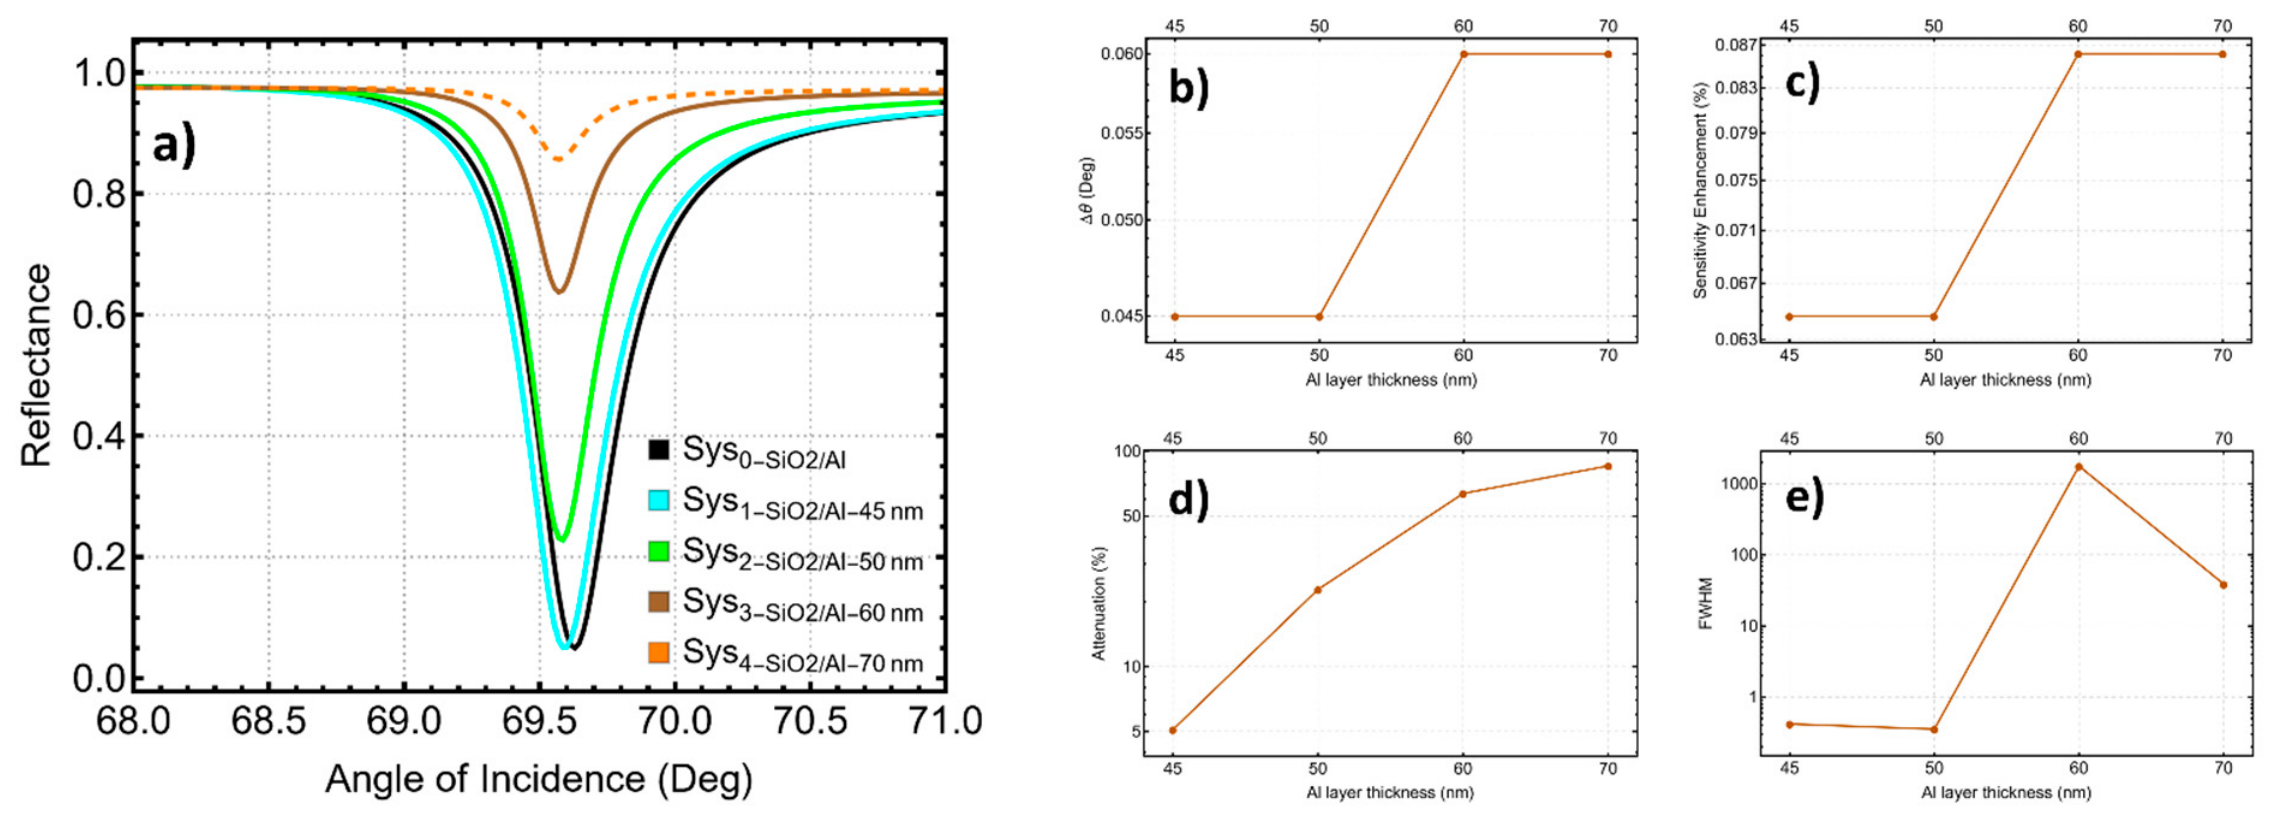
The reflectance profiles in Figure 2a show that the Al thickness modifies both the depth and width of the SPR dip. The 45 and 50 nm Al layers produced sharper resonance profiles around 69.58°, with FWHM values of 0.41° and 0.35°, respectively, as reported in Table 3. When the Al thickness increased to 60 nm, the reflectance dip became much broader, which is reflected in the FWHM value of 1772.61°. At 70 nm, the resonance profile remained broader than the thinner-film cases, although the FWHM decreased to 38.83°. These results indicate that increasing the Al thickness changes the coupling condition and increases optical attenuation in the plasmonic film.
Figure 2.
Optimization of the aluminum layer thickness in the SiO2/Al SPR structure through analysis of (a) reflectance profiles, (b) resonance angle shift, (c) sensitivity enhancement, (d) attenuation, and (e) FWHM.
The resonance-angle shift shown in Figure 2b remained small for all tested Al thicknesses. The 45 and 50 nm configurations produced Δθ = 0.04°, while the 60 and 70 nm configurations produced Δθ = 0.06°, as reported in Table 3. The same trend is observed in Figure 2c, where the sensitivity enhancement increased from 0.06% for 45 and 50 nm to 0.08% for 60 and 70 nm. This change is modest, which suggests that Al thickness alone does not produce a large angular improvement in the baseline SiO2/Al/sensing-medium structure.
Figure 2d shows that attenuation increased with Al thickness. The attenuation rose from 5.09% at 45 nm to 22.84% at 50 nm, 63.71% at 60 nm, and 85.65% at 70 nm, as listed in Table 3. This trend is consistent with stronger absorption and damping in a thicker metal layer. Although excessive attenuation can reduce the sharpness of the resonance curve, a certain increase in attenuation is useful for forming a measurable SPR response. The FWHM trend in Figure 2e confirms that the 60 nm case produces the broadest resonance, whereas the 70 nm case partially reduces the resonance width compared with 60 nm while maintaining the larger angular shift observed for the thicker-film configurations.
The 70 nm Al layer was retained for the subsequent multilayer model because it preserved the larger angular shift observed for thicker Al films while reducing the excessive FWHM obtained at 60 nm. This configuration, denoted as SiO2/Al-70 nm/sensing medium, was used as the baseline plasmonic structure for adding TiO2 and BP in the final cortisol biosensor design.
3.3. TiO2 Thickness Evaluation in the SiO2/Al SPR Platform
Following the definition of the SiO2/Al baseline system, a TiO2 dielectric layer was incorporated and its thickness was systematically adjusted to assess its influence on the SPR response prior to the inclusion of BP. The evaluated configurations, described in Table S5, consisted of SiO2/Al/TiO2/sensing medium structures with TiO2 thicknesses of 2, 7, 14, and 21 nm. The angular resonance positions derived from these simulations are listed in Table S6, and the corresponding performance indicators are summarized in Table 4.
Table 4.
Performance comparison of SiO2/Al/TiO2 configurations with varying TiO2 thicknesses for thickness optimization.
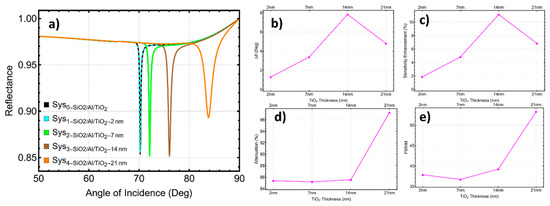
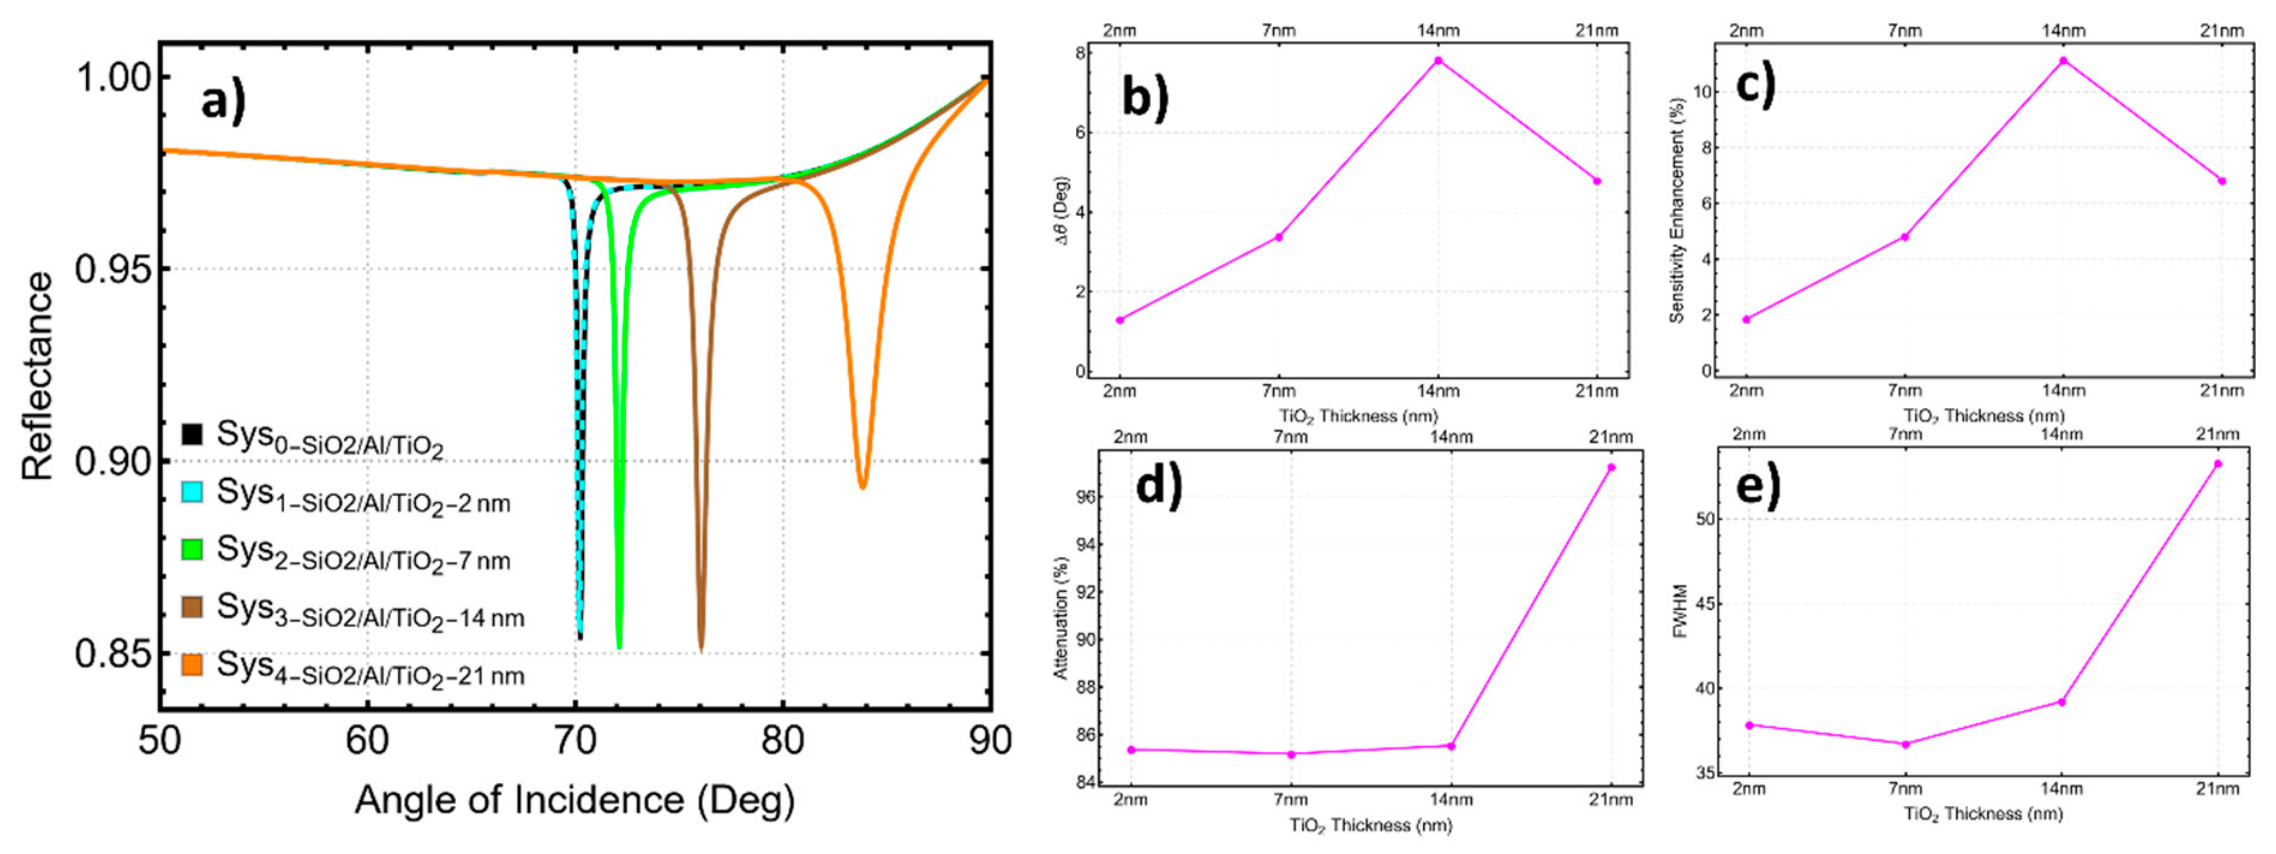
The reflectance curves in Figure 3a show a progressive shift in the SPR dip toward higher incident angles as the TiO2 thickness increased. The resonance angle moved from 70.20° for the 2 nm TiO2 layer to 72.10° for 7 nm, 76.05° for 14 nm, and 83.82° for 21 nm, as listed in Table S6. This behavior indicates that the TiO2 layer modifies the optical path and changes the coupling condition of the SiO2/Al structure. The displacement is also reflected in Figure 3b, where Δθ increased from 0.03° at 2 nm to 13.59° at 21 nm.
Figure 3.
Effect of TiO2 thickness on the SiO2/Al/TiO2 SPR structure through analysis of reflectance characteristics and sensing performance parameters: (a) reflectance curves, (b) Δθ, (c) sensitivity enhancement, (d) attenuation, and (e) FWHM.
The sensitivity enhancement follows the same general trend, as shown in Figure 3c and Table 4. The 2 nm TiO2 layer produced a small enhancement of 0.04%, while the 7 and 14 nm layers increased this value to 2.66% and 8.28%, respectively. The 21 nm layer gave the largest enhancement in this set, with 19.35%. This response suggests that increasing TiO2 thickness improves the angular displacement of the resonance condition in the present multilayer arrangement, although the effect must be evaluated together with attenuation and FWHM.
The attenuation values in Figure 3d remained close for the 2, 7, and 14 nm configurations, with values of 85.59%, 85.31%, and 85.21%, respectively, as reported in Table 4. At 21 nm, the attenuation increased to 89.31%. This increase is moderate compared with the change observed in the resonance-angle shift, but it indicates that the thicker TiO2 layer also modifies the dip contrast. The FWHM trend in Figure 3e shows that the 7 and 14 nm configurations produced narrower resonance widths of 36.39° and 36.00°, while the 21 nm layer increased the FWHM to 64.21°. This broader resonance should be considered a trade-off of using the thicker dielectric layer.
Among the TiO2 thicknesses evaluated, the 21 nm layer produced the largest angular displacement and sensitivity enhancement, although it also increased the FWHM. It was therefore selected for the subsequent BP integration, resulting in the SiO2/Al/TiO2/BP/sensing medium configuration. The selection was based on the TiO2 thickness range considered in this study, while alternative dielectric oxides were outside the scope of the present analysis.
3.4. Interfacial 2D Material Selection
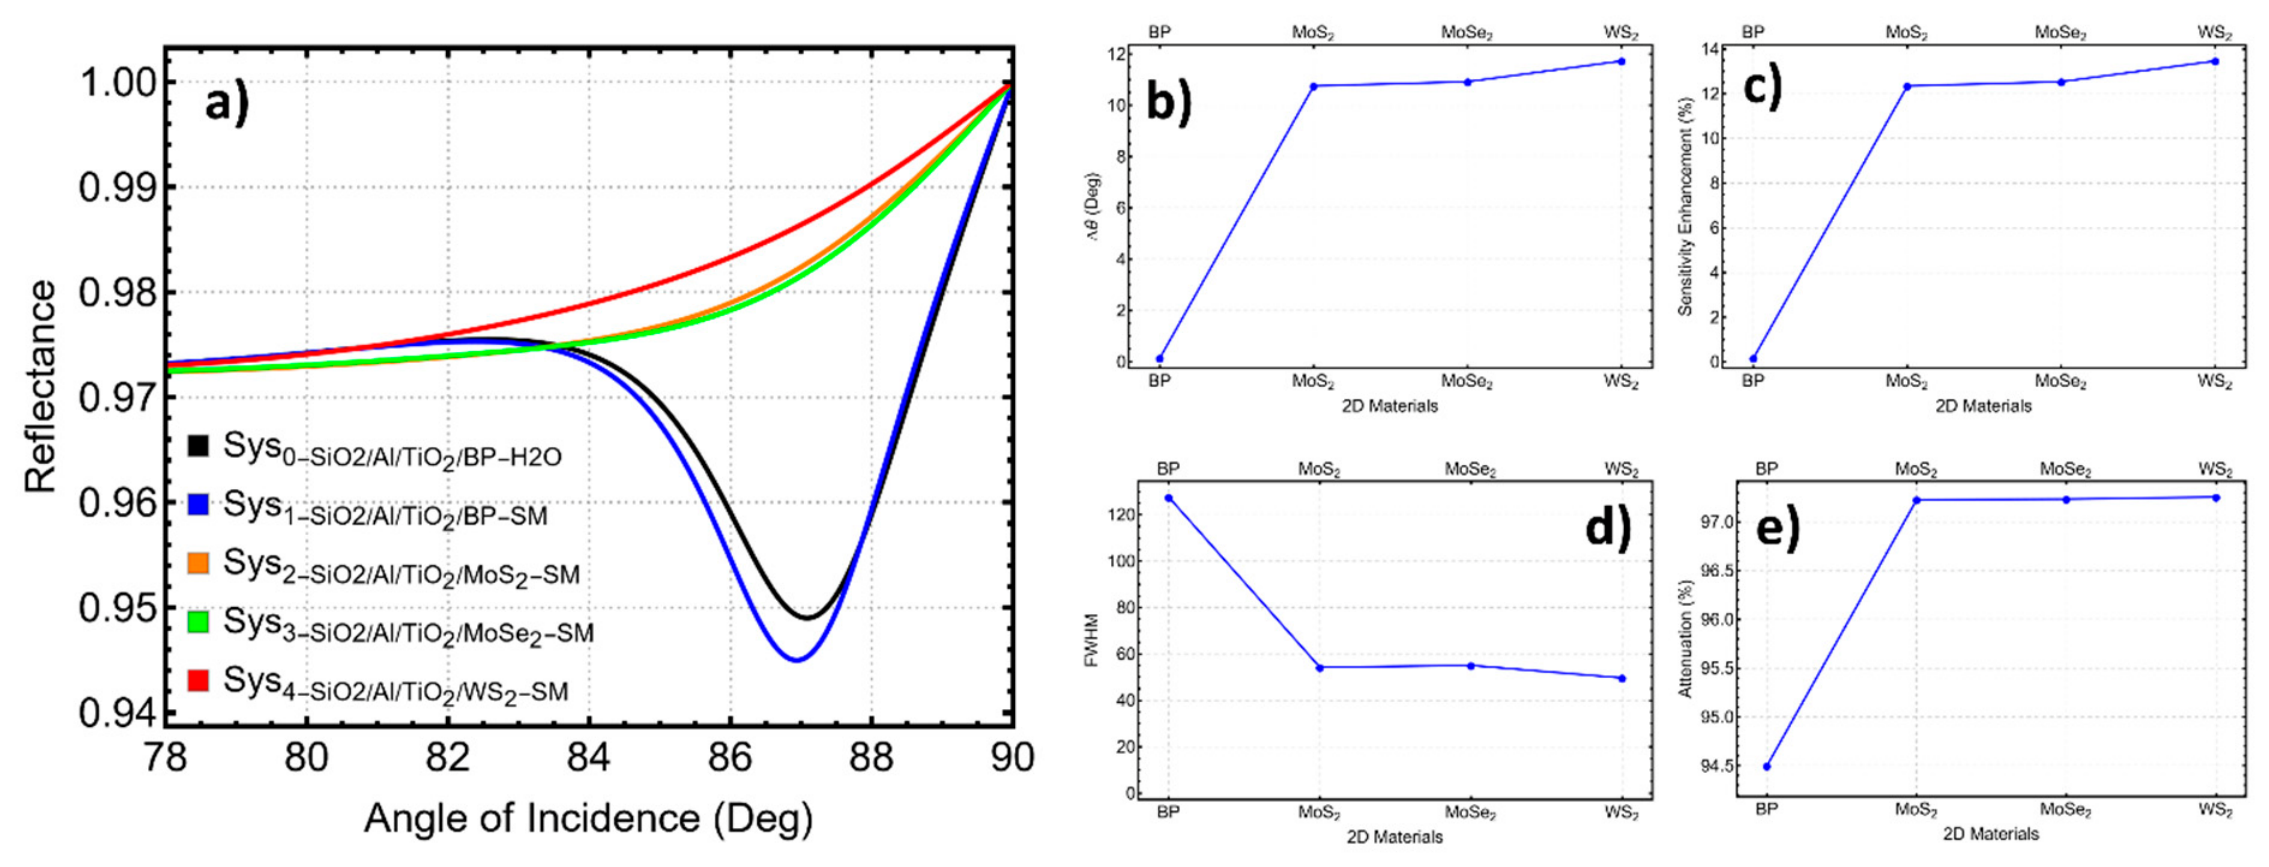
After establishing the SiO2/Al/TiO2 configuration, the effect of different interfacial 2D materials was evaluated to compare their influence on the angular SPR response and to position the BP-based design relative to alternative 2D interfaces. In this stage, BP, MoS2, MoSe2, and WS2 were individually introduced between the TiO2 layer and the sensing medium. The optical parameters and monolayer thicknesses used in the transfer matrix calculations are provided in Table S7. The BP parameters adopted from Ref. [39] were used as effective material properties in the numerical model, while the analyte-dependent response was introduced separately through the refractive index of the sensing medium. Within the present TMM formulation, the BP monolayer was represented as an effective homogeneous layer with a scalar complex refractive index and a thickness of 0.53 nm. The nomenclature assigned to each simulated architecture is detailed in Table S8. The resulting sensing characteristics, including θSPR, Δθ, sensitivity enhancement, attenuation, and FWHM, are presented in Table 5.
Table 5.
SPR response metrics obtained after incorporating each 2D material into the SiO2/Al/TiO2 platform.
The reflectance curves in Figure 4a show that the interfacial 2D material changes both the resonance position and the dip profile. The BP-containing structure produced a resonance at 86.94°, with Δθ = 0.15°, sensitivity enhancement of 0.17%, attenuation of 94.49%, and FWHM of 127.60°, as reported in Table 5. This response shows that BP preserves the high-angle resonance region generated by the optimized SiO2/Al/TiO2 platform. Although the resonance is broader than those obtained with the TMDC layers, the dip remains identifiable within the selected angular range.
Figure 4.
Effect of the interfacial 2D material on the SiO2/Al/TiO2 SPR response: (a) reflectance curves, (b) Δθ, (c) sensitivity enhancement, (d) attenuation, and (e) FWHM.
The TMDC-based configurations shifted the resonance to lower angles. The MoS2, MoSe2, and WS2 systems produced θSPR values of 76.33°, 76.17°, and 75.36°, respectively, as shown in Table 5. By comparison, the SiO2/Al/TiO2/SM structure without a 2D interfacial layer exhibited a resonance angle of 83.82° in Table 4, whereas the BP-containing structure shifted the resonance to 86.94°. These changes arise from the insertion of the 2D monolayer between TiO2 and the sensing medium, which modifies the optical admittance and phase-matching condition of the multilayer. Although the layers are sub-nanometer-thick, their complex refractive indices differ markedly from that of the sensing medium. The larger real and imaginary refractive-index components of MoS2, MoSe2, and WS2 shift the resonance toward lower angles, while BP preserves the high-angle resonance region. The corresponding Δθ values increase from 0.15° for BP to 10.75°, 10.92°, and 11.73° for MoS2, MoSe2, and WS2, respectively. The sensitivity enhancement values follow the same sequence, increasing from 0.17% for BP to 12.34%, 12.53%, and 13.46% for the TMDC-containing structures. As listed in Table S7, the refractive indices used for BP, MoS2, MoSe2, and WS2 were 3.5 + 0.01i, 5.0805 + 1.1723i, 4.62 + 1.0063i, and 4.9 + 0.3124i, respectively [39].
The FWHM values in Figure 4d and Table 5 show that BP produces the broadest resonance among the tested 2D materials. This broadening can reduce angular resolution. The TMDC-based systems exhibit narrower FWHM values, ranging from 49.67° to 55.08°, compared with 127.60° for BP. The attenuation values in Figure 4e and Table 5 are also slightly higher for the TMDC configurations, reaching 97.22–97.25%, whereas the BP-based structure gives 94.49%. These results show that the TMDC layers provide larger angular shifts and narrower resonance profiles under the optical conditions considered here.
BP was retained as the interfacial material because the aim of this work was to evaluate a BP-centered SiO2/Al/TiO2 sensing architecture. Within this design, BP preserves the high-angle resonance region of the optimized multilayer and exhibits the lowest imaginary refractive-index component among the tested 2D materials at λ = 633 nm, as listed in Table S7. The comparison with MoS2, MoSe2, and WS2 is therefore used to place the BP response in context rather than to claim that BP gives the best value for every optical metric. The broader resonance obtained with BP is recognized as a limitation of the present configuration, and the final SiO2/Al/TiO2/BP/SM structure was retained for the subsequent analysis of cortisol-related refractive-index changes.
3.5. Cortisol-Induced SPR Response of the Optimized BP-Based Sensor
The optimized SiO2/Al/TiO2/BP structure was then evaluated for cortisol-induced refractive index changes in the sensing medium. The modeled cortisol concentration range was 0.72–4.50 ng/mL, corresponding to refractive indices from 1.3300 to 1.3311, as summarized in Table S9. The refractive indices assigned to the reference medium at 0.36 ng/mL and the cortisol-containing media at 0.72, 1.8, 3.6, and 4.5 ng/mL were 1.3297, 1.3300, 1.3305, 1.3310, and 1.3311, respectively [42]. These values define the optical input used to calculate the angular SPR response of the BP-based platform.
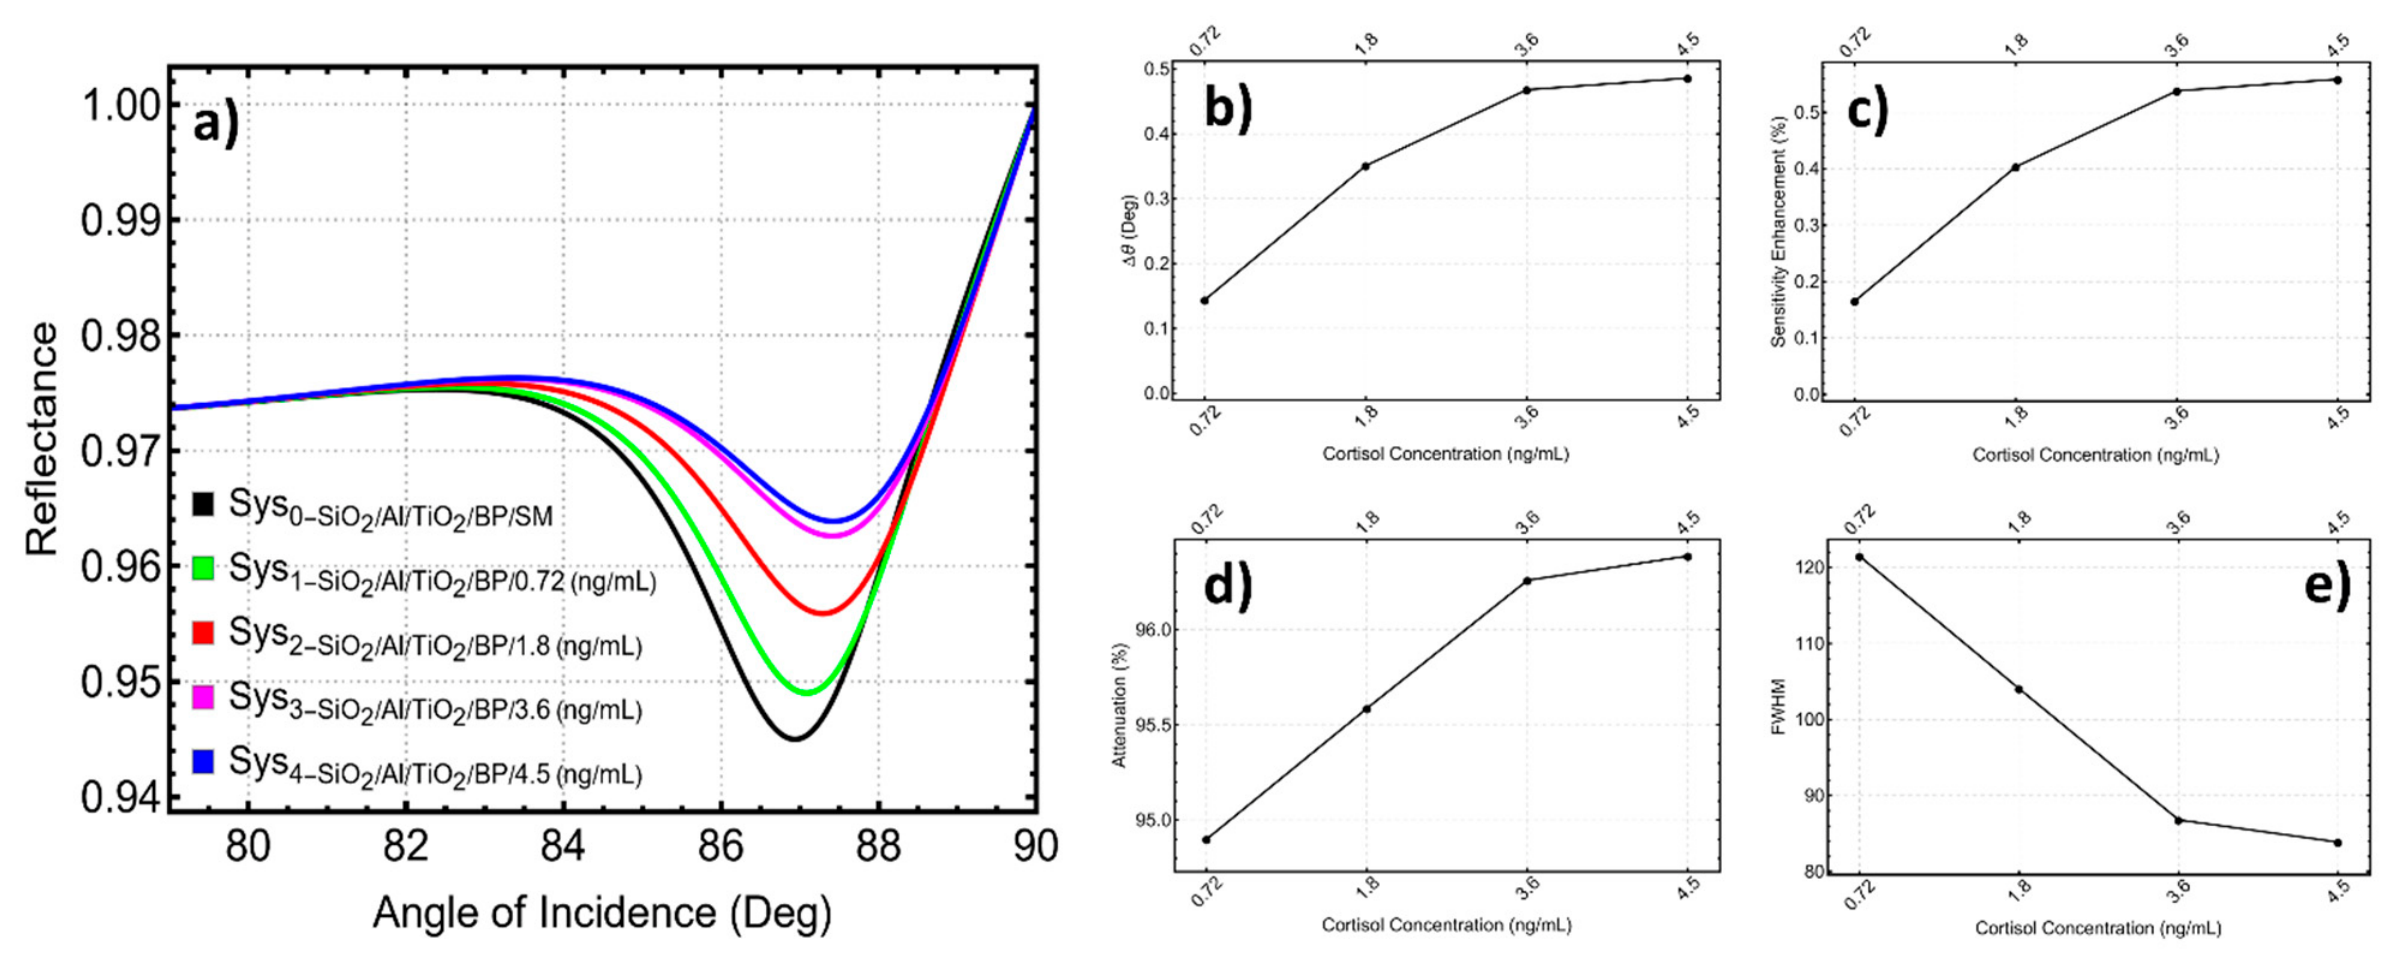
The angular reflectance curves in Figure 5a show a progressive displacement of the resonance dip as the cortisol concentration increases. The SPR peak position shifted from 87.08° at 0.72 ng/mL to 87.42° at 4.5 ng/mL, as reported in Table 6. This angular displacement confirms that the optimized SiO2/Al/TiO2/BP structure responds to small refractive index variations in the sensing medium. The shift is modest because the refractive index change associated with the modeled cortisol concentration range is small, but the trend remains monotonic across the investigated concentrations.
Figure 5.
Cortisol-induced response of the optimized SiO2/Al/TiO2/BP SPR biosensor: (a) reflectance curves, (b) Δθ, (c) sensitivity enhancement, (d) attenuation, and (e) FWHM.
Table 6.
SPR response metrics of the optimized SiO2/Al/TiO2/BP biosensor over the modeled cortisol concentration range of 0.72–4.50 ng/mL.
The resonance-angle shift in Figure 5b increases with cortisol concentration. Table 6 shows that Δθ rises from 0.14° at 0.72 ng/mL to 0.35° at 1.8 ng/mL, 0.46° at 3.6 ng/mL, and 0.48° at 4.5 ng/mL. The largest increase occurs between 0.72 and 1.8 ng/mL, while the response tends to level off at the highest concentrations. This behavior indicates that the sensor remains responsive across the modeled range, with a smaller incremental angular change between 3.6 and 4.5 ng/mL.
The sensitivity enhancement follows the same trend, as shown in Figure 5c and Table 6. The enhancement increased from 0.16% at 0.72 ng/mL to 0.55% at 4.5 ng/mL. This increase is consistent with the concentration-dependent refractive index values listed in Table S9. The result supports the use of the BP-based multilayer as an optical transduction platform for cortisol-related refractive index changes, while recognizing that biochemical selectivity would require a cortisol-specific recognition layer in an experimental device.
The attenuation response in Figure 5d also increases with concentration. The attenuation changed from 94.90% at 0.72 ng/mL to 96.38% at 4.5 ng/mL, as reported in Table 6. This gradual increase indicates that the optical interaction near the sensing interface changes with the refractive index of the cortisol-containing medium. The attenuation values remain in a narrow range, which helps preserve comparable resonance contrast across the tested concentrations.
The FWHM values in Figure 5e decrease as the cortisol concentration increases. Table 6 shows that the FWHM decreases from 121.49° at 0.72 ng/mL to 83.87° at 4.5 ng/mL. The broad response at the lower concentration reflects the gradual angular variation around the resonance minimum, whereas the progressive narrowing improves angular discrimination at higher concentrations. This behavior indicates a trade-off between angular sensitivity and resonance sharpness across the modeled concentration range. Further refinement of the platform should therefore consider the Al and TiO2 thicknesses together with FWHM, detection accuracy, and quality factor to obtain a more sharply defined resonance without substantially reducing sensitivity.
Taken together, Figure 5, Table 6 and Table S9 show that the optimized SiO2/Al/TiO2/BP sensor produces a concentration-dependent SPR response under angular interrogation. The resonance angle shifts toward higher values as the refractive index of the sensing medium increases, while the resonance width decreases across the modeled cortisol range. These results indicate that the selected BP-based architecture can detect small refractive index changes associated with cortisol concentration in the numerical model. The response should be interpreted as the optical performance of the SPR transducer; experimental cortisol selectivity would require surface functionalization with an antibody, aptamer, or molecularly imprinted receptor.
3.6. Concentration-Dependent Sensing Metrics
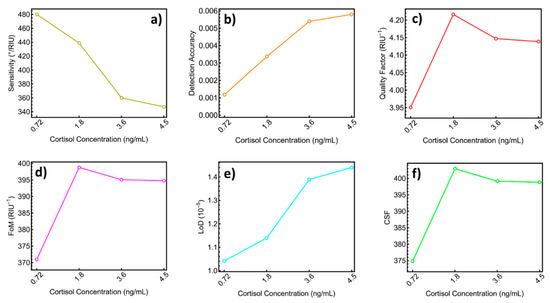
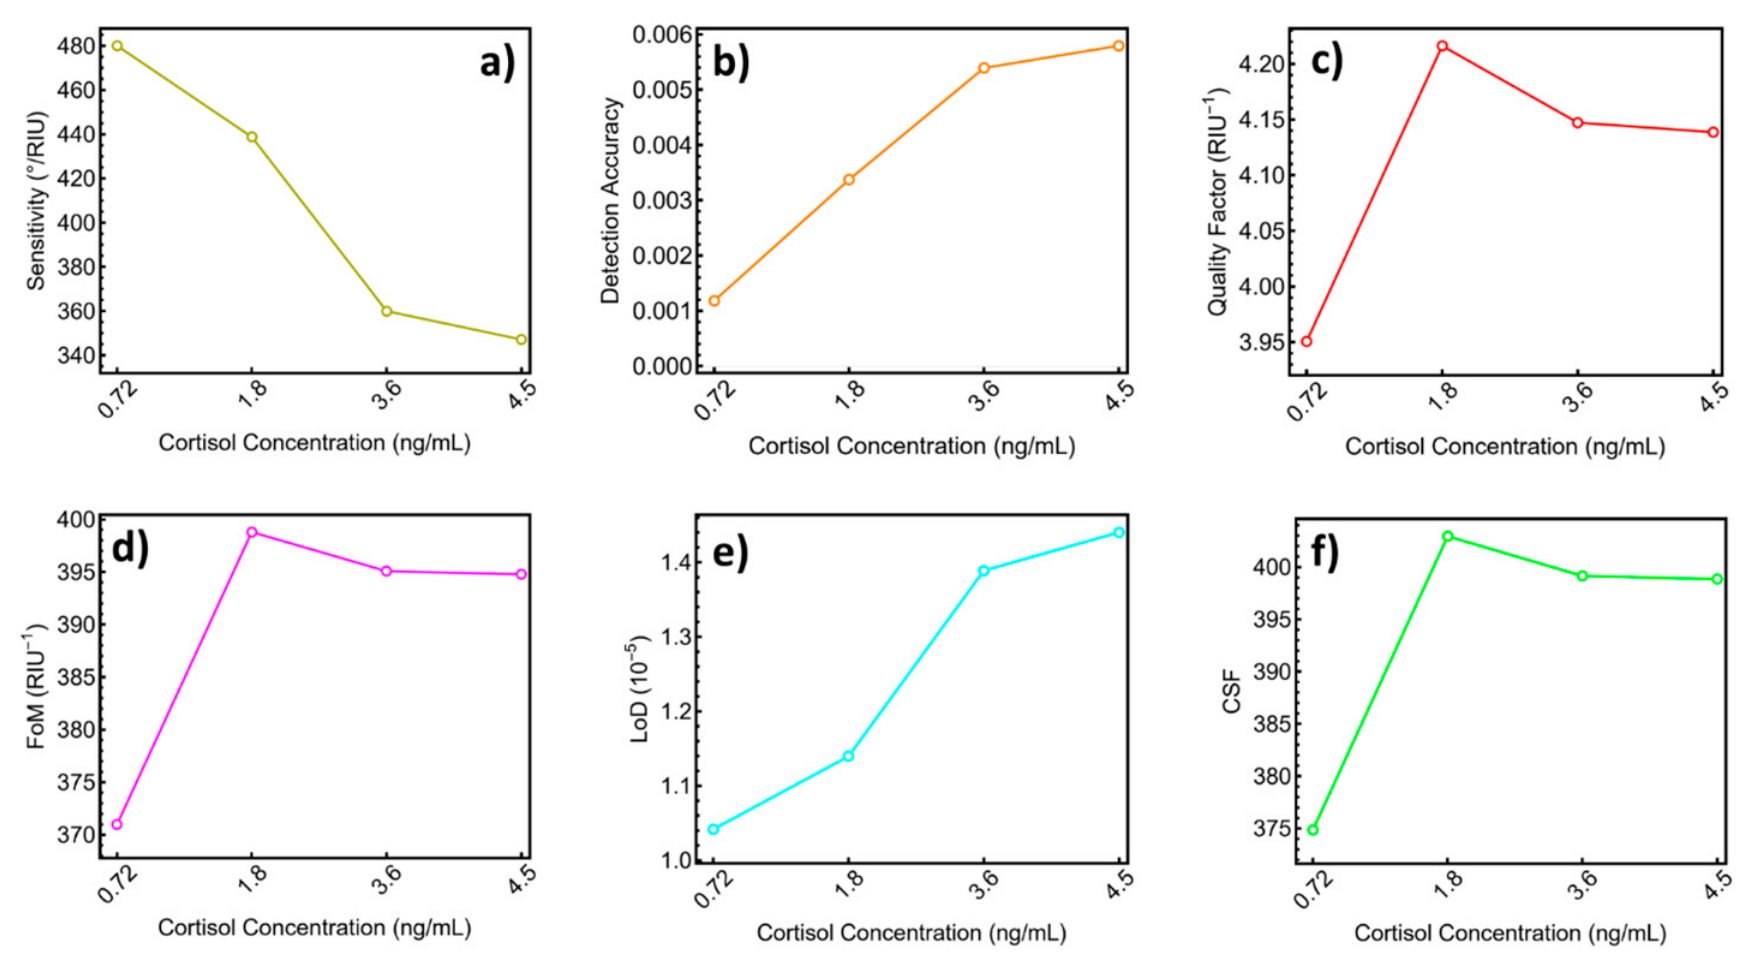
The sensing performance of the optimized SiO2/Al/TiO2/BP configuration was further evaluated using sensitivity, detection accuracy, quality factor, figure of merit, limit of detection, and combined sensitivity factor. These metrics are summarized in Table 7 and plotted in Figure 6. This analysis complements the angular reflectance response discussed in Section 3.5 by quantifying how the BP-based SPR structure behaves across the modeled cortisol concentration range.
Table 7.
Performance parameters of the optimized SPR sensor over the modeled cortisol concentration range of 0.72–4.50 ng/mL.
Figure 6.
Concentration-dependent performance metrics of the optimized SiO2/Al/TiO2/BP SPR biosensor for cortisol detection: (a) sensitivity, (b) DA, (c) QF, (d) FoM, (e) LoDRI, and (f) CSF.
The sensitivity trend in Figure 6a shows that the highest refractive index sensitivity was obtained at the lowest modeled cortisol concentration above the reference level. As listed in Table 7, the sensitivity decreased from 480.00 °/RIU at 0.72 ng/mL to 438.75 °/RIU at 1.8 ng/mL, 360.00 °/RIU at 3.6 ng/mL, and 347.14 °/RIU at 4.5 ng/mL. Although the sensitivity decreases with increasing concentration, all values remain within a useful range for angular SPR detection. This behavior indicates that the sensor is more responsive to small refractive index changes at the lower end of the modeled cortisol range, while still maintaining measurable response at higher concentrations.
The detection accuracy in Figure 6b follows the opposite trend. Table 7 shows that DA increases from 0.0011 at 0.72 ng/mL to 0.0057 at 4.5 ng/mL. This increase is consistent with the narrowing of the resonance width reported in Table 6 and indicates that the angular shift becomes easier to distinguish as the cortisol concentration increases. The improvement in DA partly compensates for the decrease in sensitivity at higher concentrations because the resonance feature becomes better defined.
The quality factor shown in Figure 6c remains relatively stable across the tested concentration range. The QF increases from 3.95 RIU−1 at 0.72 ng/mL to 4.21 RIU−1 at 1.8 ng/mL and then remains close to this value, with 4.14 RIU−1 at 3.6 ng/mL and 4.13 RIU−1 at 4.5 ng/mL, as reported in Table 7. This behavior suggests that the ratio between sensitivity and resonance width does not degrade strongly across the modeled cortisol concentrations. The maximum QF at 1.8 ng/mL indicates the most favorable ratio between angular sensitivity and resonance width among the evaluated concentrations, although the highest sensitivity occurs at 0.72 ng/mL.
The figure of merit in Figure 6d shows a similar concentration-dependent response. According to Table 7, the FoM increases from 370.96 RIU−1 at 0.72 ng/mL to 398.80 RIU−1 at 1.8 ng/mL, then remains close to this value at 3.6 and 4.5 ng/mL. This trend indicates that the sensor preserves favorable resonance contrast after the initial increase in cortisol concentration. The FoM values above 370 RIU−1 across the full range indicate that the reflectance minimum remains suitable for angular interrogation.
As shown in Figure 6e and summarized in Table 7, the estimated refractive-index detection limit, LoDRI, increased from 1.04 × 10⁻⁵ RIU at 0.72 ng/mL to 1.44 × 10⁻⁵ RIU at 4.5 ng/mL. The lowest LoDRI was obtained at 0.72 ng/mL, where the angular sensitivity reached its maximum value. The corresponding resonance shifts reported in Table 6 range from 0.14° to 0.48°, which are greater than the assumed angular resolution of 0.005°. Under the adopted numerical conditions, these shifts are therefore above the assumed angular detection threshold, although they do not represent an experimentally validated concentration LoD in biological samples.
The combined sensitivity factor in Figure 6f integrates the angular response, resonance width, and reflectance contrast into a single comparative parameter. Table 7 shows that the CSF increases from 374.84 at 0.72 ng/mL to a maximum of 402.94 at 1.8 ng/mL, followed by values of 399.14 and 398.84 at 3.6 and 4.5 ng/mL, respectively. According to the adopted CSF definition, the highest composite performance occurs at 1.8 ng/mL, while the values at higher concentrations remain close to the maximum. This condition does not simultaneously maximize all individual metrics, since the highest sensitivity and lowest LoDRI are obtained at 0.72 ng/mL.
Figure 6 and Table 7 show that the optimized SiO2/Al/TiO2/BP sensor maintains a stable metric profile across the evaluated cortisol concentration range. The highest sensitivity and lowest LoDRI occur at 0.72 ng/mL, while DA improves with concentration and QF, FoM, and CSF remain within a narrow range after 1.8 ng/mL. These results show a concentration-dependent trade-off among the evaluated metrics, with 1.8 ng/mL yielding the highest composite performance according to the adopted CSF definition.
3.7. Electric Field Distribution Analysis
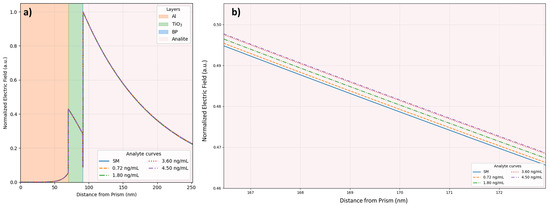
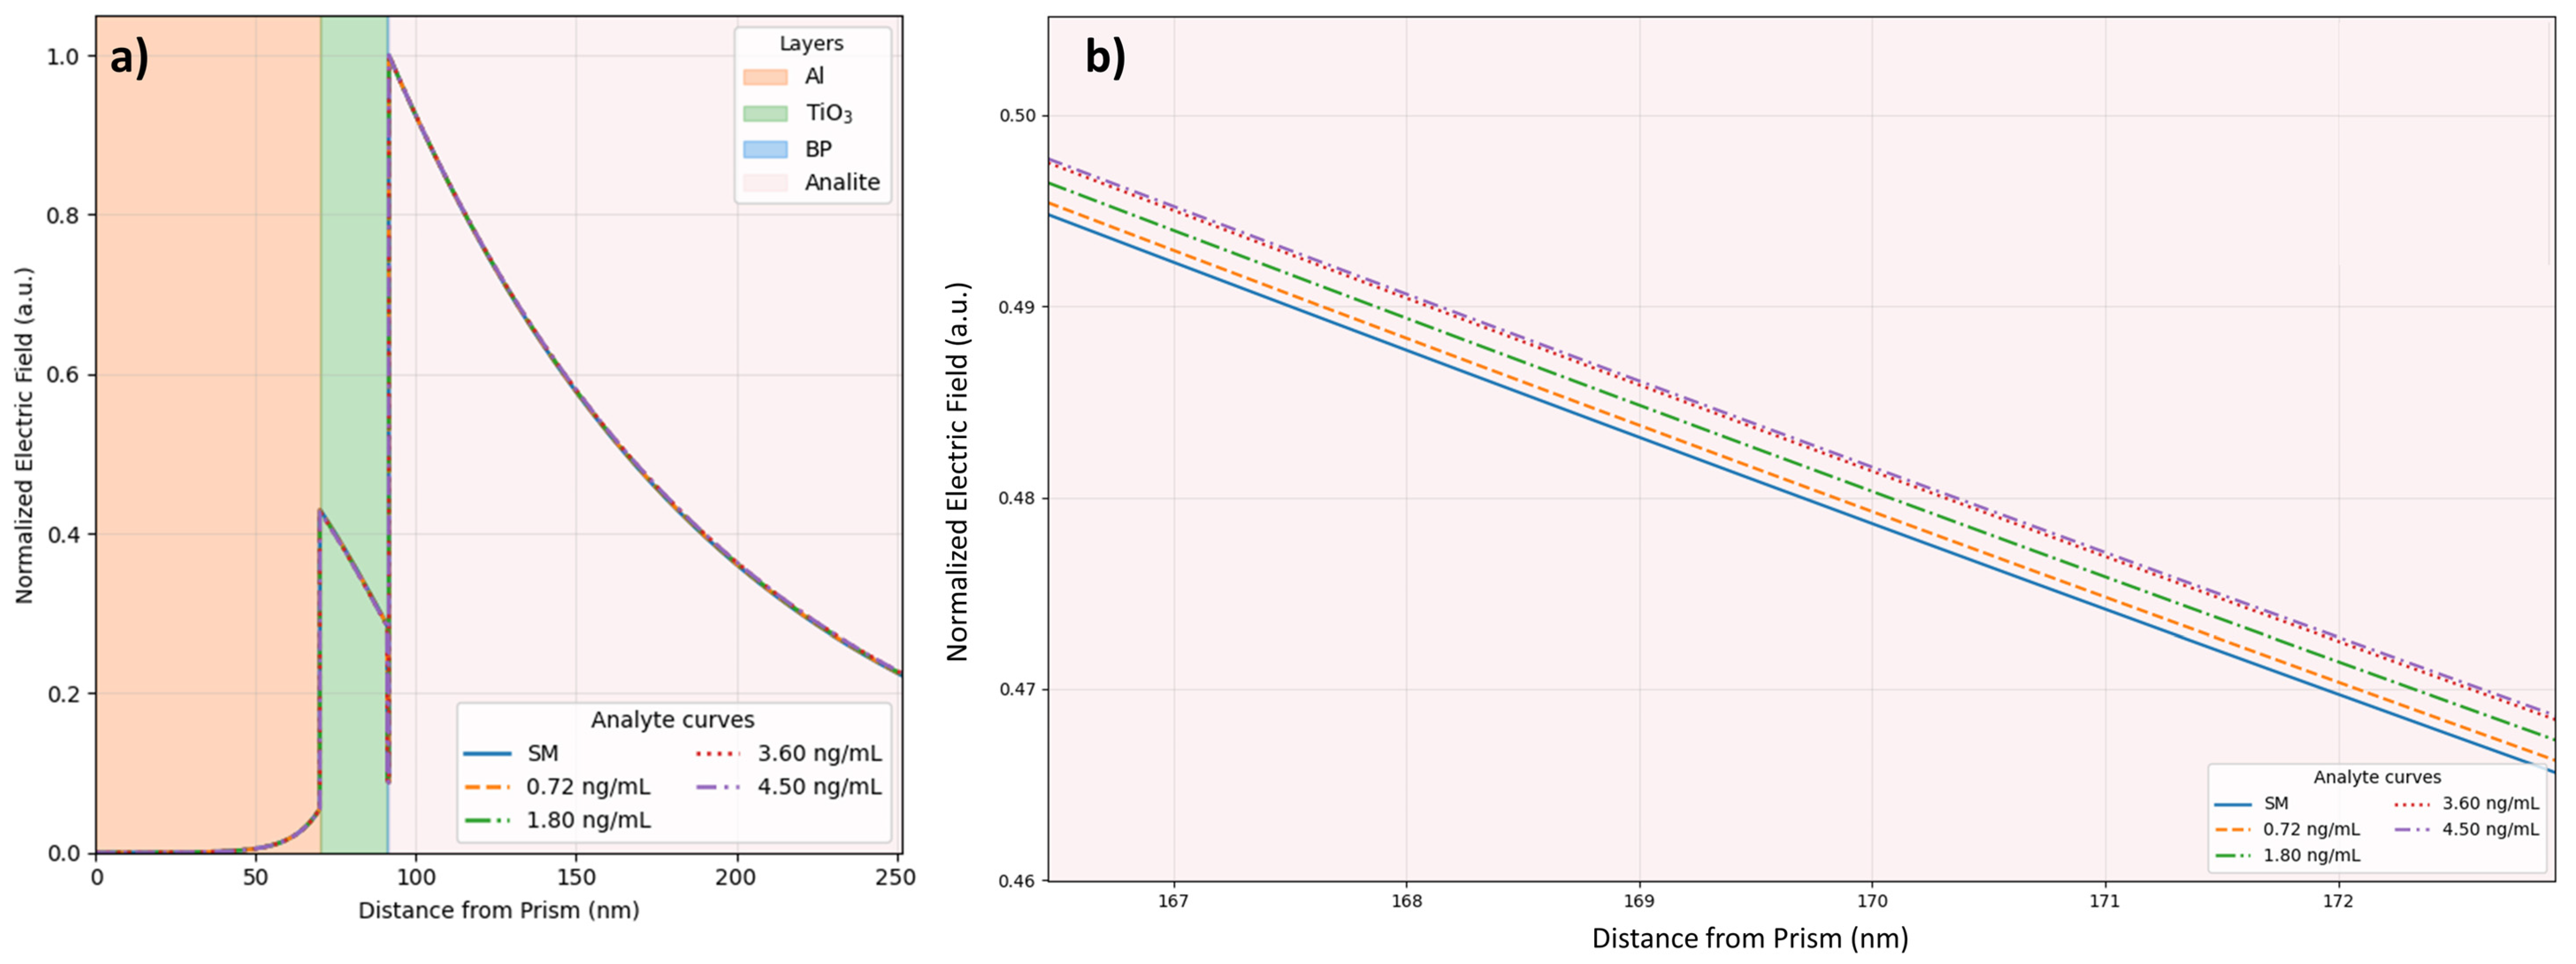
The electric-field distribution was analyzed to examine how the optimized SiO2/Al/TiO2/BP structure confines the optical field near the sensing interface. Figure 7a shows the normalized electric field across the multilayer stack, including the Al, TiO2, BP, and analyte regions. The field remains low inside the Al layer and then increases near the TiO2/BP interface, where the optical coupling condition supports the SPR response. The strongest field is located close to the BP/analyte boundary, followed by a gradual decay into the sensing medium. This behavior is consistent with an SPR transduction mechanism, where the evanescent field probes refractive-index changes close to the sensor surface.
Figure 7.
Normalized electric-field distribution of the optimized SiO2/Al/TiO2/BP SPR biosensor: (a) field profile across the multilayer stack and sensing medium for the modeled cortisol concentrations, and (b) magnified field distribution in the analyte region.
The field profile in Figure 7a also shows that the BP layer lies within the region where the evanescent field begins to extend into the analyte. This position is relevant for the proposed design because the cortisol-containing medium is modeled directly above BP. As a result, small refractive-index changes in the sensing region can perturb the local field and shift the resonance condition measured through angular interrogation. The field distribution therefore supports the use of BP as the interfacial layer in the selected SiO2/Al/TiO2/BP/SM architecture.
Figure 7b provides a magnified view of the normalized electric field in the analyte region. The curves corresponding to different cortisol concentrations show a similar decay profile, with small separations between them. These differences are expected because the refractive-index variation associated with the modeled cortisol range is limited. Even so, the concentration-dependent curves remain ordered, indicating that the local field responds to changes in the sensing-medium refractive index.
The gradual field decay shown in Figure 7b places the strongest optical interaction close to the BP/analyte interface, where a future recognition layer and bound analyte would be located. However, the penetration depth into the sensing medium was not quantified in the present analysis. The field profile should therefore be interpreted as qualitative evidence of interfacial field localization rather than as a quantitative description of the active sensing volume or of the relative contributions from surface-bound and bulk refractive-index changes.
Figure 7 confirms that the optimized SiO2/Al/TiO2/BP configuration produces field localization near the BP/analyte boundary, consistent with the angular shifts reported in Figure 5 and Figure 6. A quantitative decay-length analysis would be required to determine the sensing depth and to assess the influence of future receptor-layer thickness and bulk refractive-index fluctuations.
3.8. Conceptual Assembly and Experimental Validation Pathway
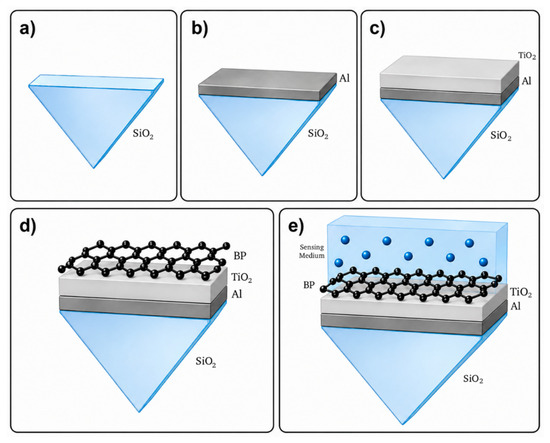
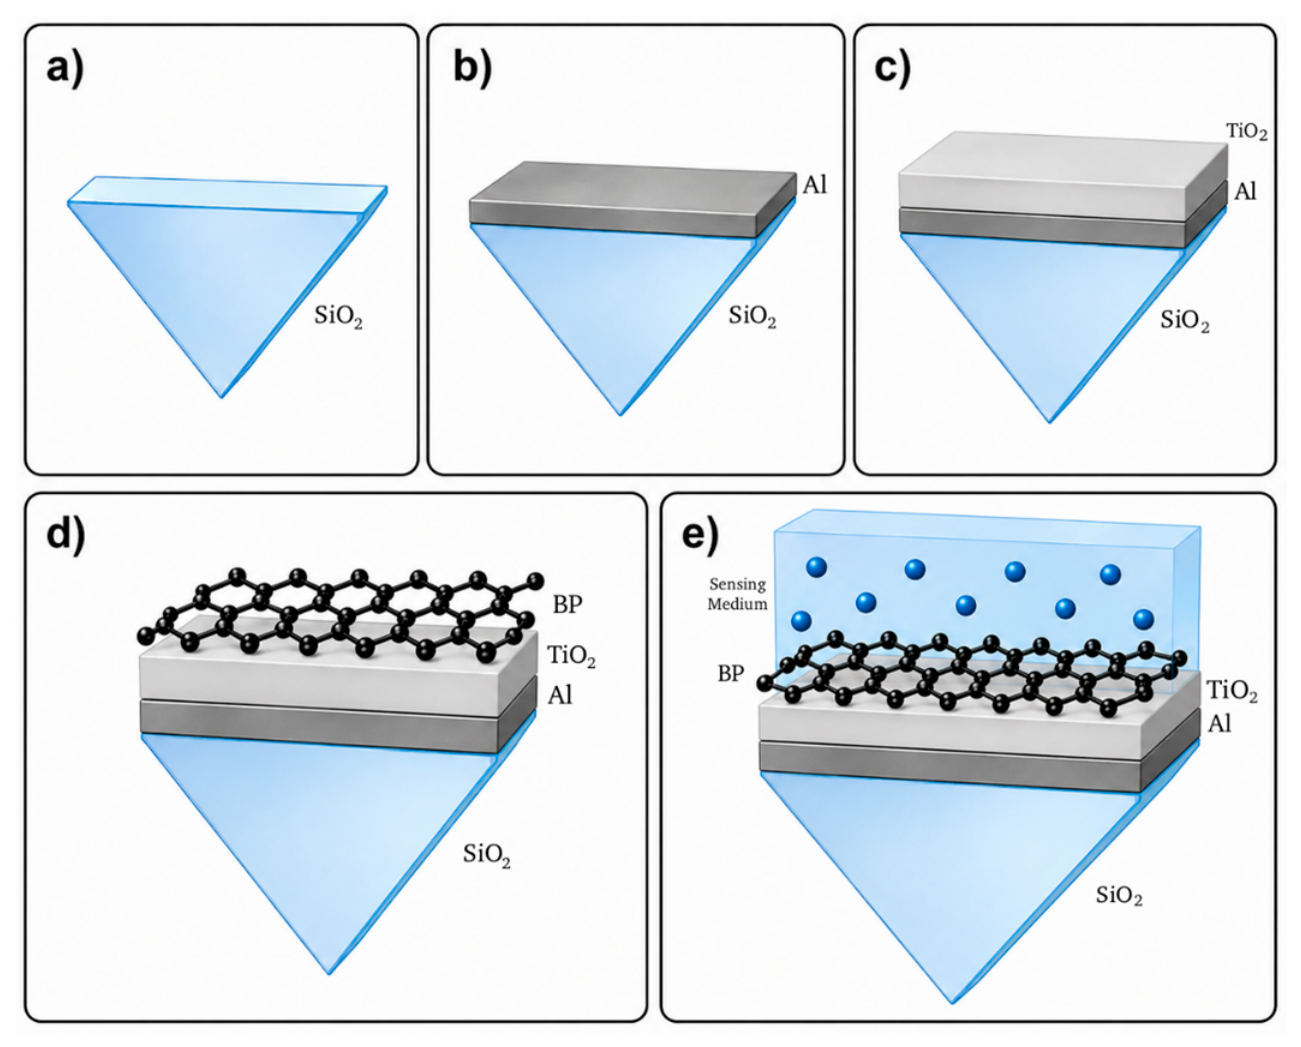
The proposed biosensor could be constructed through a sequential thin-film assembly route, as represented in Figure 8. The SiO2 prism acts as the optical coupling element in the Kretschmann-type configuration, as shown in Figure 8a. Before deposition, the prism surface would need to be cleaned to reduce organic residues and improve film adhesion. A common preparation route may include solvent cleaning, ultrasonication, drying under inert gas, and surface activation before metal deposition. Similar cleaning and surface-preparation steps have been proposed in numerical SPR biosensor studies that discuss experimental feasibility before device fabrication.
Figure 8.
Conceptual assembly of the SPR biosensor: (a) SiO2 prism, (b) Al deposition, (c) TiO2 coating, (d) BP integration, and (e) cortisol-containing sensing medium.
In Figure 8b, a thin aluminum layer is deposited onto the SiO2 prism. This layer provides the plasmonic interface required for surface plasmon excitation under TM-polarized illumination. Aluminum is useful for low-cost SPR platforms, but its surface oxidation must be controlled because oxide growth can modify the resonance condition. For this reason, the Al layer would preferably be deposited by thermal evaporation or sputtering, followed by TiO2 deposition in the same vacuum cycle, without breaking vacuum between both steps. This continuous deposition sequence would minimize uncontrolled formation of native Al2O3 at the Al/TiO2 interface. The present optical model assumes an ideal Al/TiO2 interface and does not include an explicit native Al2O3 layer. If oxidation cannot be fully suppressed during fabrication, the thickness and optical constants of the residual oxide should be incorporated into future simulations because even a thin interfacial layer may modify the resonance position and width. The initial 45 nm Al thickness was used only to define the starting SPR model for the sequential optimization. After optimization, the 70 nm Al thickness selected for the SiO2/Al/TiO2/BP configuration should be treated as a fabrication target that requires verification by profilometry, ellipsometry, or cross-sectional microscopy.
The TiO2 layer in Figure 8c is introduced above Al as a dielectric film. In the optical model, TiO2 contributes to tuning the resonance response and modifying the field distribution near the sensing interface. Experimentally, this layer could be deposited by sputtering, atomic layer deposition, or another low-temperature thin-film method compatible with Al. Its thickness control is relevant because small deviations in the dielectric layer may shift θSPR, change the full width at half maximum, or increase the minimum reflectance. The simulated TiO2 thickness should therefore be validated experimentally rather than assumed to transfer directly from the numerical model to the fabricated device.
Figure 8d shows the integration of black phosphorus onto the TiO2 surface. In the proposed structure, BP is considered as the two-dimensional interfacial material that supports the optical response of the sensing region. Its contribution should be interpreted as part of the SPR transduction mechanism, not as a complete biochemical recognition element. In a future experimental device, BP transfer or deposition would require careful handling because black phosphorus can degrade under oxygen, moisture, and aqueous exposure. Controlled-atmosphere transfer, rapid processing, ultrathin encapsulation, surface passivation, or a protective biofunctional coating could be used to reduce degradation before and during sensing measurements. Any protective layer would need to remain sufficiently thin to preserve the interaction between the evanescent field and the sensing medium. The operational lifetime of the protected BP interface would need to be determined experimentally under repeated exposure to the sensing medium.
In Figure 8e, the sensing medium containing cortisol is placed in contact with the BP surface. At this stage, the modeled SPR response is produced by refractive-index changes in the analyte region. In a future experimental device, cortisol selectivity could be introduced through a recognition layer containing an anti-cortisol antibody, a cortisol-binding aptamer, or a molecularly imprinted receptor immobilized on the outer sensing surface. This layer would act as the biochemical recognition interface, while the SiO2/Al/TiO2/BP stack would provide the optical transduction response. Formation of the recognition layer would be expected to shift the initial resonance angle because of its finite thickness and refractive index. Subsequent cortisol binding would produce an additional local refractive-index change and a corresponding shift in θSPR. The magnitude of this response would depend on the receptor-layer thickness, surface coverage, binding affinity, and optical properties. These parameters were not included in the present numerical model and should be incorporated in future simulations and experimental calibration. Without such a recognition layer, the proposed structure should be interpreted as an optical refractive-index sensor evaluated under cortisol-related conditions rather than as a fully selective cortisol biosensor.
A future validation pathway should start with optical characterization of the fabricated SiO2/Al/TiO2/BP stack using reference liquids with known refractive indices. This step would test whether the measured resonance angles, resonance widths, and minimum reflectance agree with the numerical predictions. After this baseline calibration, cortisol measurements could be performed in buffer and later in diluted artificial saliva or real saliva samples. The functionalized sensor should be characterized before and after receptor immobilization to quantify the baseline resonance shift introduced by the recognition layer. The experimental protocol should include blank samples, non-target biomolecules, repeatability tests, and stability measurements to distinguish refractive index response from selective cortisol recognition. This validation sequence would connect the numerical performance metrics with the practical requirements of non-invasive cortisol monitoring.
3.9. Comparison with Reported SPR Sensors
The proposed SiO2/Al/TiO2/BP platform was compared with reported SPR-based cortisol sensors, as shown in Table 8. The comparison includes BlueP-WSe2/Si3N4 [42], MXene [43], CdS-CNTs [44], and Ni6L-BP [45] structures. For the present work, all simulated cortisol concentrations were included to show how the proposed platform behaves across the modeled range, rather than reporting only a single operating point.
Table 8.
Comparison of the maximum angular sensitivity reported for SPR-based cortisol sensors and the proposed SiO2/Al/TiO2/BP platform.
Table 8 shows that the proposed platform reaches its highest sensitivity at 0.72 ng/mL, with 480.00 °/RIU at λ = 633 nm. This value is higher than the sensitivities reported for the BlueP-WSe2/Si3N4, MXene, CdS-CNTs, and Ni6L-BP reference sensors, which are 387.96, 437.50, 220.00, and 343.78 °/RIU, respectively [42,43,44,45]. The sensitivity remains competitive at 1.8 ng/mL, where the platform gives 438.75 °/RIU, slightly above the MXene-based sensor and above the other reported structures. At 3.6 and 4.5 ng/mL, the sensitivity decreases to 360.00 and 347.14 °/RIU, respectively, but remains higher than the CdS-CNTs sensor and comparable to the Ni6L-BP design listed in Table 8.
The QF and DA values show that the present platform is primarily sensitivity-oriented. The QF ranges from 3.95 to 4.21 RIU−1, while DA increases from 0.0011 to 0.0057 across the cortisol concentration range. These values are lower than those of several reported sensors in Table 8, especially the Ni6L-BP structure, which gives QF = 243.82 RIU−1 and DA = 0.709 [45]. This difference reflects the broader resonance profile of the proposed Al/TiO2/BP configuration. Even so, the concentration-dependent improvement in DA and the high sensitivity at low cortisol concentration show that the structure can resolve small refractive-index changes under the numerical conditions used here.
The comparison therefore identifies the main advantage of the SiO2/Al/TiO2/BP platform as its angular sensitivity. It gives the highest sensitivity among the listed designs at 0.72 ng/mL and remains strong at 1.8 ng/mL, while using a compact Al/TiO2/BP multilayer at 633 nm. The lower QF and DA define the next refinement target, especially resonance-width reduction and thickness re-optimization. Within these limits, Table 8 supports the proposed BP-based design as a promising numerical SPR platform for cortisol-related refractive-index detection.
4. Limitations
The present study is limited to a numerical evaluation of the SiO2/Al/TiO2/BP multilayer under ideal conditions. The model assumes uniform layers with fixed optical constants and does not include surface roughness, thickness variations, interfacial defects, native oxide formation, or temperature-dependent optical changes. BP was represented as a 0.53 nm homogeneous layer with a scalar complex refractive index; therefore, its armchair–zigzag anisotropy and two-dimensional surface-current response were not explicitly resolved. These assumptions may affect the predicted resonance angle, dip width, and sensitivity.
BP degradation under oxygen, moisture, and aqueous exposure may alter its optical properties and reduce device lifetime [46]. Experimental implementation would require stabilization, and the thickness and optical constants of any protective layer should be included in future simulations. The operational lifetime of the protected interface must also be established experimentally.
The model does not include a cortisol-selective recognition layer. An immobilized antibody, aptamer, or molecularly imprinted receptor would shift the baseline SPR condition and could modify the sensitivity, resonance width, and minimum reflectance. The reported LoDRI is an estimated refractive-index detection limit based on an assumed angular resolution of 0.005°, rather than an experimentally validated concentration LoD. Experimental calibration, selectivity and repeatability tests, and evaluation in biological matrices are required to determine practical analytical performance.
5. Conclusions
This work numerically evaluated a SiO2/Al/TiO2/BP SPR platform for cortisol-related refractive-index detection under TM-polarized angular interrogation at λ = 633 nm. The analysis shows that the sensor response is controlled by the combined effect of prism material, Al thickness, TiO2 thickness, and the interfacial 2D layer. SiO2/Al/SM was selected as the baseline platform because it provided a measurable angular shift with a narrow resonance profile. The final multilayer used 70 nm Al, 21 nm TiO2, and BP as the interfacial layer in the SiO2/Al/TiO2/BP/SM structure.
The BP-based configuration preserved the high-angle resonance region of the selected multilayer and exhibited the lowest imaginary refractive-index component among the evaluated 2D materials at 633 nm. MoS2, MoSe2, and WS2 produced larger angular shifts and narrower FWHM values under the same numerical conditions. BP was retained because the study specifically evaluates a BP-centered SiO2/Al/TiO2 architecture, rather than because it provided the highest value for every optical metric.
For cortisol-related refractive-index changes, the resonance angle shifted from 87.08° at 0.72 ng/mL to 87.42° at 4.5 ng/mL, while Δθ increased from 0.14° to 0.48°. The maximum sensitivity of 480.00∘/RIU and the lowest LoDRI were obtained at 0.72 ng/mL. At 1.8 ng/mL, the platform yielded the maximum QF, FoM, and CSF values of 4.21 RIU−1, 398.80 RIU−1, and 402.94, respectively, indicating the highest composite performance according to the adopted CSF definition. The electric-field profiles showed qualitative field localization near the BP/analyte boundary, consistent with the calculated angular response.
These findings indicate that SiO2/Al/TiO2/BP can act as a sensitivity-oriented SPR transduction platform for cortisol-related refractive-index changes. Comparison with the reported sensors considered in this study shows a higher maximum angular sensitivity, whereas the lower QF and DA identify resonance-width reduction as a principal target for further optimization. Future work should fabricate and calibrate the multilayer stack using reference liquids and subsequently evaluate cortisol in buffer and saliva-relevant media. A cortisol-selective recognition layer, together with thermal control, BP stabilization, and experimental calibration, will be required to translate the modeled optical response into a selective biosensing device.
Supplementary Materials
The following supporting information can be downloaded at: https://www.mdpi.com/article/10.3390/photonics13080737/s1.
Author Contributions
C.V.G. and T.T.: conceptualization, writing—original draft. N.A.M., C.E.R.A. and N.E.A.D.: methodology, investigation. E.S.: conceptualization, software, methodology, writing—original draft, H.E.D.: methodology. All authors have read and agreed to the published version of the manuscript.
Funding
This research was funded by Universidad Técnica Particular de Loja (grant number POA VIN 56) and Universidad Ecotec (grant number Nanosensor2025).
Data Availability Statement
The original contributions presented in this study are included in the Supplementary Material. Further inquiries can be directed to the corresponding author.
Acknowledgments
C.V.G. wishes to thank the INFN-Frascati for its hospitality during the completion of this work. ChatGPT 5.1 and Grammarly PRO (v1.178.0.0) have been used to improve the English. The authors are responsible for the analysis, ideas, and discussions of the current work.
Conflicts of Interest
The authors declare no conflicts of interest.
References
- Azmi, N.A.S.M.; Juliana, N.; Azmani, S.; Effendy, N.M.; Abu, I.F.; Teng, N.I.M.F.; Das, S. Cortisol on Circadian Rhythm and Its Effect on Cardiovascular System. Int. J. Environ. Res. Public Health 2021, 18, 676. [Google Scholar] [CrossRef] [PubMed]
- Kaur, J.; Gandhi, J.; Sharma, S. Physiology, Cortisol. In StatPearls [Internet]; StatPearls Publishing: Treasure Island, FL, USA, 2026. Available online: https://www.ncbi.nlm.nih.gov/sites/books/NBK538239/ (accessed on 23 May 2026).
- Kamgang, V.W.; Murkwe, M.; Wankeu-Nya, M. Biological Effects of Cortisol. In Cortisol—Between Physiology and Pathology; Paún, D.L., Ed.; IntechOpen: London, UK, 2023; Chapter 1. [Google Scholar] [CrossRef]
- Balkrishna, A.; Sharma, N.; Diwakar, S.; Parveen, R.; Kukreti, A.; Trivedi, B.; Srivastava, D.; Arya, V. Integrated Management of Cortisol: A Multidimensional Perspective. Future Integr. Med. 2026, 5, 27–49. [Google Scholar] [CrossRef]
- Fukuda, S.; Morimoto, K. Lifestyle, Stress and Cortisol Response: Review II. Environ. Health Prev. Med. 2001, 6, 15–21. [Google Scholar] [CrossRef] [PubMed]
- Lucius, K. Evidence-Based Uses of Salivary Cortisol Testing. Integr. Complement. Ther. 2025, 31, 96–108. [Google Scholar] [CrossRef]
- El-Farhan, N.; Rees, D.A.; Evans, C. Measuring Cortisol in Serum, Urine and Saliva—Are Our Assays Good Enough? Ann. Clin. Biochem. 2017, 54, 308–322. [Google Scholar] [CrossRef] [PubMed]
- Turpeinen, U.; Hämäläinen, E. Determination of Cortisol in Serum, Saliva and Urine. Best Pract. Res. Clin. Endocrinol. Metab. 2013, 27, 795–801. [Google Scholar] [CrossRef] [PubMed]
- Aguilar Cordero, M.J.; Sánchez López, A.M.; Mur Villar, N.; García García, I.; Rodríguez López, M.A.; Ortegón Piñero, A.; Cortés Castell, E. Salivary Cortisol as an Indicator of Physiological Stress in Children and Adults: A Systematic Review. Nutr. Hosp. 2014, 29, 960–968. [Google Scholar] [CrossRef] [PubMed]
- Ahmed, T.; Powner, M.B.; Qassem, M.; Kyriacou, P.A. Rapid Optical Determination of Salivary Cortisol Responses in Individuals Undergoing Physiological and Psychological Stress. Sci. Rep. 2024, 14, 31578. [Google Scholar] [CrossRef] [PubMed]
- Vignesh, V.; Castro-Dominguez, B.; James, T.D.; Gamble-Turner, J.M.; Lightman, S.; Reis, N.M. Advancements in Cortisol Detection: From Conventional Methods to Next-Generation Technologies for Enhanced Hormone Monitoring. ACS Sens. 2024, 9, 1666–1681. [Google Scholar] [CrossRef] [PubMed]
- Karachaliou, C.-E.; Koukouvinos, G.; Goustouridis, D.; Raptis, I.; Kakabakos, S.; Petrou, P.; Livaniou, E. Cortisol Immunosensors: A Literature Review. Biosensors 2023, 13, 285. [Google Scholar] [CrossRef] [PubMed]
- Zhang, Y.; Lai, Q.; Chen, W.; Zhang, C.; Mo, L.; Liu, Z. Recent Advance in Cortisol Immunosensing Technologies and Devices. Chemosensors 2023, 11, 90. [Google Scholar] [CrossRef]
- Kaushik, A.; Vasudev, A.; Arya, S.K.; Pasha, S.K.; Bhansali, S. Recent advances in cortisol sensing technologies for point-of-care application. Biosens. Bioelectron. 2014, 53, 499–512. [Google Scholar] [CrossRef] [PubMed]
- Lee, S.-E.; Choi, Y.; Oh, Y.; Lee, D.; Kim, J.; Hong, S. Black Phosphorus-Based Reusable Biosensor Platforms for the Ultrasensitive Detection of Cortisol in Saliva. ACS Appl. Mater. Interfaces 2024, 16, 11305–11314. [Google Scholar] [CrossRef] [PubMed]
- Nan, M.; Darmawan, B.A.; Go, G.; Zheng, S.; Lee, J.; Kim, S.; Lee, T.; Choi, E.; Park, J.-O.; Bang, D. Wearable Localized Surface Plasmon Resonance-Based Biosensor with Highly Sensitive and Direct Detection of Cortisol in Human Sweat. Biosensors 2023, 13, 184. [Google Scholar] [CrossRef] [PubMed]
- Arcadio, F.; Seggio, M.; Pitruzzella, R.; Zeni, L.; Bossi, A.M.; Cennamo, N. An Efficient Bio-Receptor Layer Combined with a Plasmonic Plastic Optical Fiber Probe for Cortisol Detection in Saliva. Biosensors 2024, 14, 351. [Google Scholar] [CrossRef] [PubMed]
- Karthik, P.; Shanmugandhan, S.; Subramanian, V.; Delerue-Matos, C. Selective detection of salivary cortisol using screen-printed electrode coated with molecularly imprinted polymer. Talanta 2024, 272, 125823. [Google Scholar] [CrossRef] [PubMed]
- Maleki, M.J.; Soroosh, M.; AL-Shammri, F.K.; Alkhayer, A.G.; Mondal, H. Design and Simulation of a Compact Subwavelength Graphene-Based Switch for Surface Plasmon Polariton Transmission in Integrated Optoelectronic Circuits. Plasmonics 2025, 20, 3605–3617. [Google Scholar] [CrossRef]
- Kumari, A.; Yadav, A.; Singh, O.P.; Sharan, P. A Review of Surface Plasmon Resonance (SPR) Technology in Biosensing: Innovations, Applications and Future Trends. J. Opt. 2026, 55, 1368–1376. [Google Scholar] [CrossRef]
- Hojjat Jodaylami, M.; Masson, J.-F.; Badia, A. Surface Plasmon Resonance Sensing. Nat. Rev. Methods Primers 2025, 5, 47. [Google Scholar] [CrossRef]
- Shpacovitch, V.; Hergenröder, R. Surface Plasmon Resonance (SPR)-Based Biosensors as Instruments with High Versatility and Sensitivity. Sensors 2020, 20, 3010. [Google Scholar] [CrossRef] [PubMed]
- Shukla, N.; Chetri, P.; Boruah, R.; Gogoi, A.; Ahmed, G.A. Surface Plasmon Resonance Biosensors Based on Kretschmann Configuration: Basic Instrumentation and Applications. In Recent Advances in Plasmonic Probes; Biswas, R., Mazumder, N., Eds.; Lecture Notes in Nanoscale Science and Technology; Springer: Cham, Switzerland, 2022; Volume 33, pp. 191–222. [Google Scholar] [CrossRef]
- Aftab, M.; Mansha, M.S.; Iqbal, T.; Farooq, M. Surface Plasmon Excitation: Theory, Configurations, and Applications. Plasmonics 2024, 19, 1701–1719. [Google Scholar] [CrossRef]
- Wang, H.; Wang, H.; Tian, Z.; Zhang, H.; Huang, Y.; Qiu, X.; Yu, D.; Zhang, L. Analysis of Biomolecular Interaction Process Based on SPR Imaging Method in Microfluidic Chips. Plasmonics 2022, 17, 621–631. [Google Scholar] [CrossRef]
- Sasidevi, S.; Kumarganesh, S.; Saranya, S.; Thiyaneswaran, B.; Shree, K.V.M.; Sagayam, M.K.; Pandey, B.K.; Pandey, D. Design of Surface Plasmon Resonance (SPR) Sensors for Highly Sensitive Biomolecular Detection in Cancer Diagnostics. Plasmonics 2025, 20, 677–689. [Google Scholar] [CrossRef]
- Chang, Y.-F.; Wang, Y.-C.; Huang, T.-Y.; Li, M.-C.; Chen, S.-Y.; Lin, Y.-X.; Su, L.-C.; Li, K.-J. AI Integration into Wavelength-Based SPR Biosensing: Advancements in Spectroscopic Analysis and Detection. Anal. Chim. Acta 2025, 1341, 343640. [Google Scholar] [CrossRef] [PubMed]
- Chirco, A.; Meacci, E.; Margheri, G. A Tutorial Review on Surface Plasmon Resonance Biosensors: Applications in Biomedicine. ACS Bio Med Chem Au 2025, 5, 922–946. [Google Scholar] [CrossRef] [PubMed]
- Chylek, J.; Ciprian, D.; Hubina, P. Thickness and Wavelength Optimizations of a High-Performance SPR Sensor Employing a Silver Layer and Black Phosphorus in Principal Directions. Nanomaterials 2025, 15, 790. [Google Scholar] [CrossRef] [PubMed]
- El Barghouti, M.; Akjouj, A.; Mir, A. Performance Evaluation of Multifunctional SPR Bimetallic Sensor Using Hybrid 2D-Nanomaterials Layers. Optik 2022, 269, 169857. [Google Scholar] [CrossRef]
- He, Q.; Chen, C. The Effects of Cracks on the Failure Mechanisms, Mechanical Properties, and Fatigue Behaviors of Steel/Aluminum SPR Joints. Eng. Fail. Anal. 2025, 180, 109854. [Google Scholar] [CrossRef]
- Silva, D.; Monteiro, C.S.; Silva, S.O.; Frazão, O.; Pinto, J.V.; Raposo, M.; Ribeiro, P.A.; Sério, S. Sputtering Deposition of TiO2 Thin Film Coatings for Fiber Optic Sensors. Photonics 2022, 9, 342. [Google Scholar] [CrossRef]
- Rai, H.; Singh, K.R.B.; Pandey, S.S.; Natarajan, A. Role of Si and SiO2 in Optoelectronic Device Fabrication. J. Mol. Struct. 2024, 1316, 138994. [Google Scholar] [CrossRef]
- Manikanta, R.V.; Mahesh, C.U.; Yepuri, V. Light Matters: Fabrication and Investigation of Optical and Wetting Properties of TiO2/SiO2 Multilayer Structure. J. Opt. 2025. [Google Scholar] [CrossRef]
- Santonocito, R.; Puglisi, R.; Cavallaro, A.; Pappalardo, A.; Sfrazzetto, G.T. Cortisol Sensing by Optical Sensors. Analyst 2024, 149, 989–1001. [Google Scholar] [CrossRef] [PubMed]
- Wankhade, U.A.; Thakare, Y.N.; Hardas, B.M.; Pande, R.S. Cortisol Detection Methods for Stress Monitoring: Current Insight and Future Prospect: A Review. IEEE Sens. J. 2024, 24, 23389–23400. [Google Scholar] [CrossRef]
- Pusomjit, P. Development of Electrochemical Detection for Cortisol and Hepatitis C Virus Core Antigen. Ph.D. Thesis, Chulalongkorn University, Bangkok, Thailand, 2022. [Google Scholar] [CrossRef]
- Tene, T.; Polanco, M.A.; Caputi, L.S.; Strafe, S.; Gomez, C.V. Design and Numerical Optimization of a Borosilicate-Supported Aluminum SPR Sensor for Monitoring Metal Ion Mixtures. Opt. Commun. 2026, 616, 133372. [Google Scholar] [CrossRef]
- Akib, T.B.A.; Rana, M.M.; Mehedi, I.M. Multi-layer SPR biosensor for in-situ amplified monitoring of the SARS-CoV-2 omicron (B.1.1.529) variant. Biosens. Bioelectron. X 2024, 16, 100434. [Google Scholar] [CrossRef]
- Sayed, F.A.; Elsayed, H.A.; Mehaney, A.; Aly, A.H. Enhanced angular surface plasmon resonance sensor featuring Ag nanoparticles embedded within a MoS2 hosting medium. Plasmonics 2025, 20, 8167–8183. [Google Scholar] [CrossRef]
- Ghosh, S.; Preza, C. Characterization of a three-dimensional double-helix point-spread function for fluorescence microscopy in the presence of spherical aberration. J. Biomed. Opt. 2013, 18, 036010. [Google Scholar] [CrossRef] [PubMed]
- Biswas, P.; Chowdhury, M.A.S.; Uddin, M.B. Design and Analysis of a Bimetallic SPR Biosensor with BlueP-WSe2 Heterostructure for Ultrasensitive Cortisol Detection. Talanta Open 2026, 13, 100648. [Google Scholar] [CrossRef]
- Kumar, R.; Pandey, V.K.; Singh, S.; Dhasarathan, V. Enhanced Angular Sensitivity of Surface Plasmon Resonance Sensor Based on Si-Ag-MXene Structure for Cortisol Application. Eur. Phys. J. Plus 2025, 140, 121. [Google Scholar] [CrossRef]
- Yang, X.; Singh, H.; Uniyal, A.; Xu, S.; Kumar, R.; Pal, A. Surface Plasmon Resonance-Based Cortisol Sensing: A Numerical Investigation. Plasmonics 2025, 20, 8451–8460. [Google Scholar] [CrossRef]
- Verma, V.K.; Pal, S.; Rizal, C.; Prajapati, Y.K. Tunable and Sensitive Detection of Cortisol Using Anisotropic Phosphorene with a Surface Plasmon Resonance Technique: Numerical Investigation. Magnetochemistry 2022, 8, 31. [Google Scholar] [CrossRef]
- van Druenen, M. Degradation of Black Phosphorus and Strategies to Enhance Its Ambient Lifetime. Adv. Mater. Interfaces 2020, 7, 2001102. [Google Scholar] [CrossRef]

Disclaimer/Publisher’s Note: The statements, opinions and data contained in all publications are solely those of the individual author(s) and contributor(s) and not of MDPI and/or the editor(s). MDPI and/or the editor(s) disclaim responsibility for any injury to people or property resulting from any ideas, methods, instructions or products referred to in the content. |
© 2026 by the authors. Licensee MDPI, Basel, Switzerland. This article is an open access article distributed under the terms and conditions of the Creative Commons Attribution (CC BY) license.