


Abstract
White LEDs are widely used in fields such as lighting and display. However, existing white light devices suffer from excessively broad emission spectra full width at half maximum (FWHM) and severe leakage of pump blue light. Hence, this study proposes a theoretical design for an ultra-narrow-band white LEDs based on an asymmetric Fabry-Pérot (F-P) microcavity. The microcavity employs a dual-DBR configuration with asymmetric optical responses: the bottom DBRs utilize a ZnS/MgF2 (/2--/2)5 stack, providing a low reflectance of ~20% at 457 nm for efficient blue light transmission and quantum dot excitation; conversely, the final device incorporating top DBRs with a TiO2/MgF2 (/2--/2)4-stacked structure achieved a high reflectivity of approximately 89% at 457 nm, effectively decreasing the excessive blue light in the output spectrum. The intermediate emissive layer uses polymethyl methacrylate (PMMA) as the quantum dot host. By precisely tuning the cavity thickness, the resonant modes of the F-P microcavity—specifically the fourth-order (626 nm) and fifth-order (534 nm)—are aligned with the emission peaks of the red and green quantum dots, respectively. Simulation results demonstrate that the structure leverages the cavity filtering effect to compress the FWHM of the red and green emissions from initial values of 36.5 nm and 29.8 nm down to 2.2 nm and 1.9 nm, respectively, representing an order-of-magnitude improvement in color purity. Through the co-optimization of the top-DBR’s central wavelength, cavity optical thickness, and the doping ratio of red/green quantum dots, standard white light emission with CIE coordinates of (0.32, 0.33) was achieved, accompanied by emission efficiencies of 6.3% (green) and 22.3% (red) for the QDs. However, strict manufacturing tolerances and narrow observation angles limit the applicability of the device. This work provides theoretical research for developing white light sources.
1. Introduction
White Light-Emitting Diodes (WLEDs) offer significant advantages over traditional incandescent and fluorescent lamps, including excellent stability, energy conservation, environmental friendliness, and long operational lifetimes [1,2,3,4,5,6]. Consequently, they have demonstrated broad application prospects in general lighting and display technologies [7,8,9,10]. Particularly in the display field, LED backlights have completely replaced traditional Cold Cathode Fluorescent Lamps (CCFLs) due to their wide color gamut coverage and high brightness uniformity [11,12,13]. However, with the rapid advancement of ultra-high-definition display technologies, end-users are imposing increasingly stringent requirements on color reproduction. Currently, mainstream commercial displays can only cover approximately 55–65% of the BT.2020 color gamut standard [14,15]. This bottleneck is primarily attributed to the excessively broad full width at half maximum (FWHM) of conventional white light emission spectra, which leads to insufficient color purity and limited color gamut [16,17,18,19,20]. Phosphor-converted WLEDs, which dominate the current market, typically employ a blue LED to excite yellow phosphors (e.g., YAG:Ce) or a combination of red and green phosphors to generate white light through spectral mixing with emission spectrum exhibits an FWHM of approximately 110–120 nm [21,22,23,24,25,26,27]. Such a broad, incoherent spectrum severely restricts color saturation performance, making it difficult to meet the high color gamut demands of high-end backlight displays [28,29]. Therefore, narrowing the FWHM of emission spectra has become an essential pathway to overcome existing technological barriers and achieve superior color reproduction.
Compared to traditional inorganic phosphors or organic luminescent materials, colloidal quantum dots (QDs) exhibit exceptional photoluminescent performance owing to their unique quantum confinement effect [30,31]. CdSe-based QDs, after appropriate surface passivation, can achieve near-unity photoluminescence quantum yields [32,33,34]. Moreover, by precisely controlling the size and morphology of these nanocrystals, narrow-band emission across arbitrary visible wavelengths can be realized [35]. However, despite the intrinsically narrow emission characteristics of QDs materials, their typical post-stimulated-emission FWHM remains around 30 nm [36,37,38,39,40,41]. This indicates substantial potential for linewidth compression compared to highly monochromatic sources [42,43,44]. Furthermore, QD materials generally suffer from a relatively high excitation threshold, necessitating intense blue pump sources for sufficient excitation [45,46,47,48,49]. In practical device architectures, residual blue light not absorbed by the QDs is prone to leakage at the output, disrupting the white light color temperature balance and reducing the color rendering index [50,51]. Consequently, enhancing QDs excitation efficiency while effectively reducing excess blue light has remained a core challenge in the field of QD displays.
To address the aforementioned issues of spectral broadening and pump light leakage, this study embeds the QDs emissive layer within a Fabry–Pérot (F-P) microcavity constructed by distributed Bragg reflectors (DBRs), utilizing the cavity filtering effect and mode-selective mechanism to enhance spectral color purity. Employing the finite-difference time-domain (FDTD) method, we systematically investigated the reflection spectra and electric field distributions of DBRs with various stacking configurations and material systems. Subsequently, an asymmetric F-P microcavity structure based on DBRs was proposed: the bottom DBRs were engineered for high blue light transmittance to ensure efficient QDs excitation, while the top-DBRs provided high reflectance in the blue region to reduce residual pump light. Through multidimensional parameter sweeps of the DBR central wavelength and cavity thickness, the evolution of resonant modes with structural parameters was thoroughly elucidated. Under optimal parameters, the microcavity resonances not only achieved precise alignment with the emission peaks of red and green QDs but also compressed the emission linewidths to the sub-nanometer level.
2. Results and Discussion
2.1. Realization of Narrow-Band W-QLEDs Based on Asymmetric F-P Microcavity
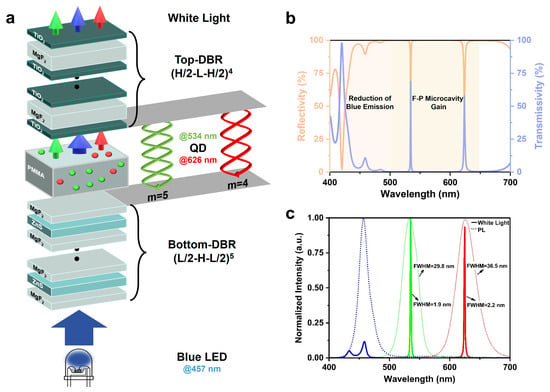
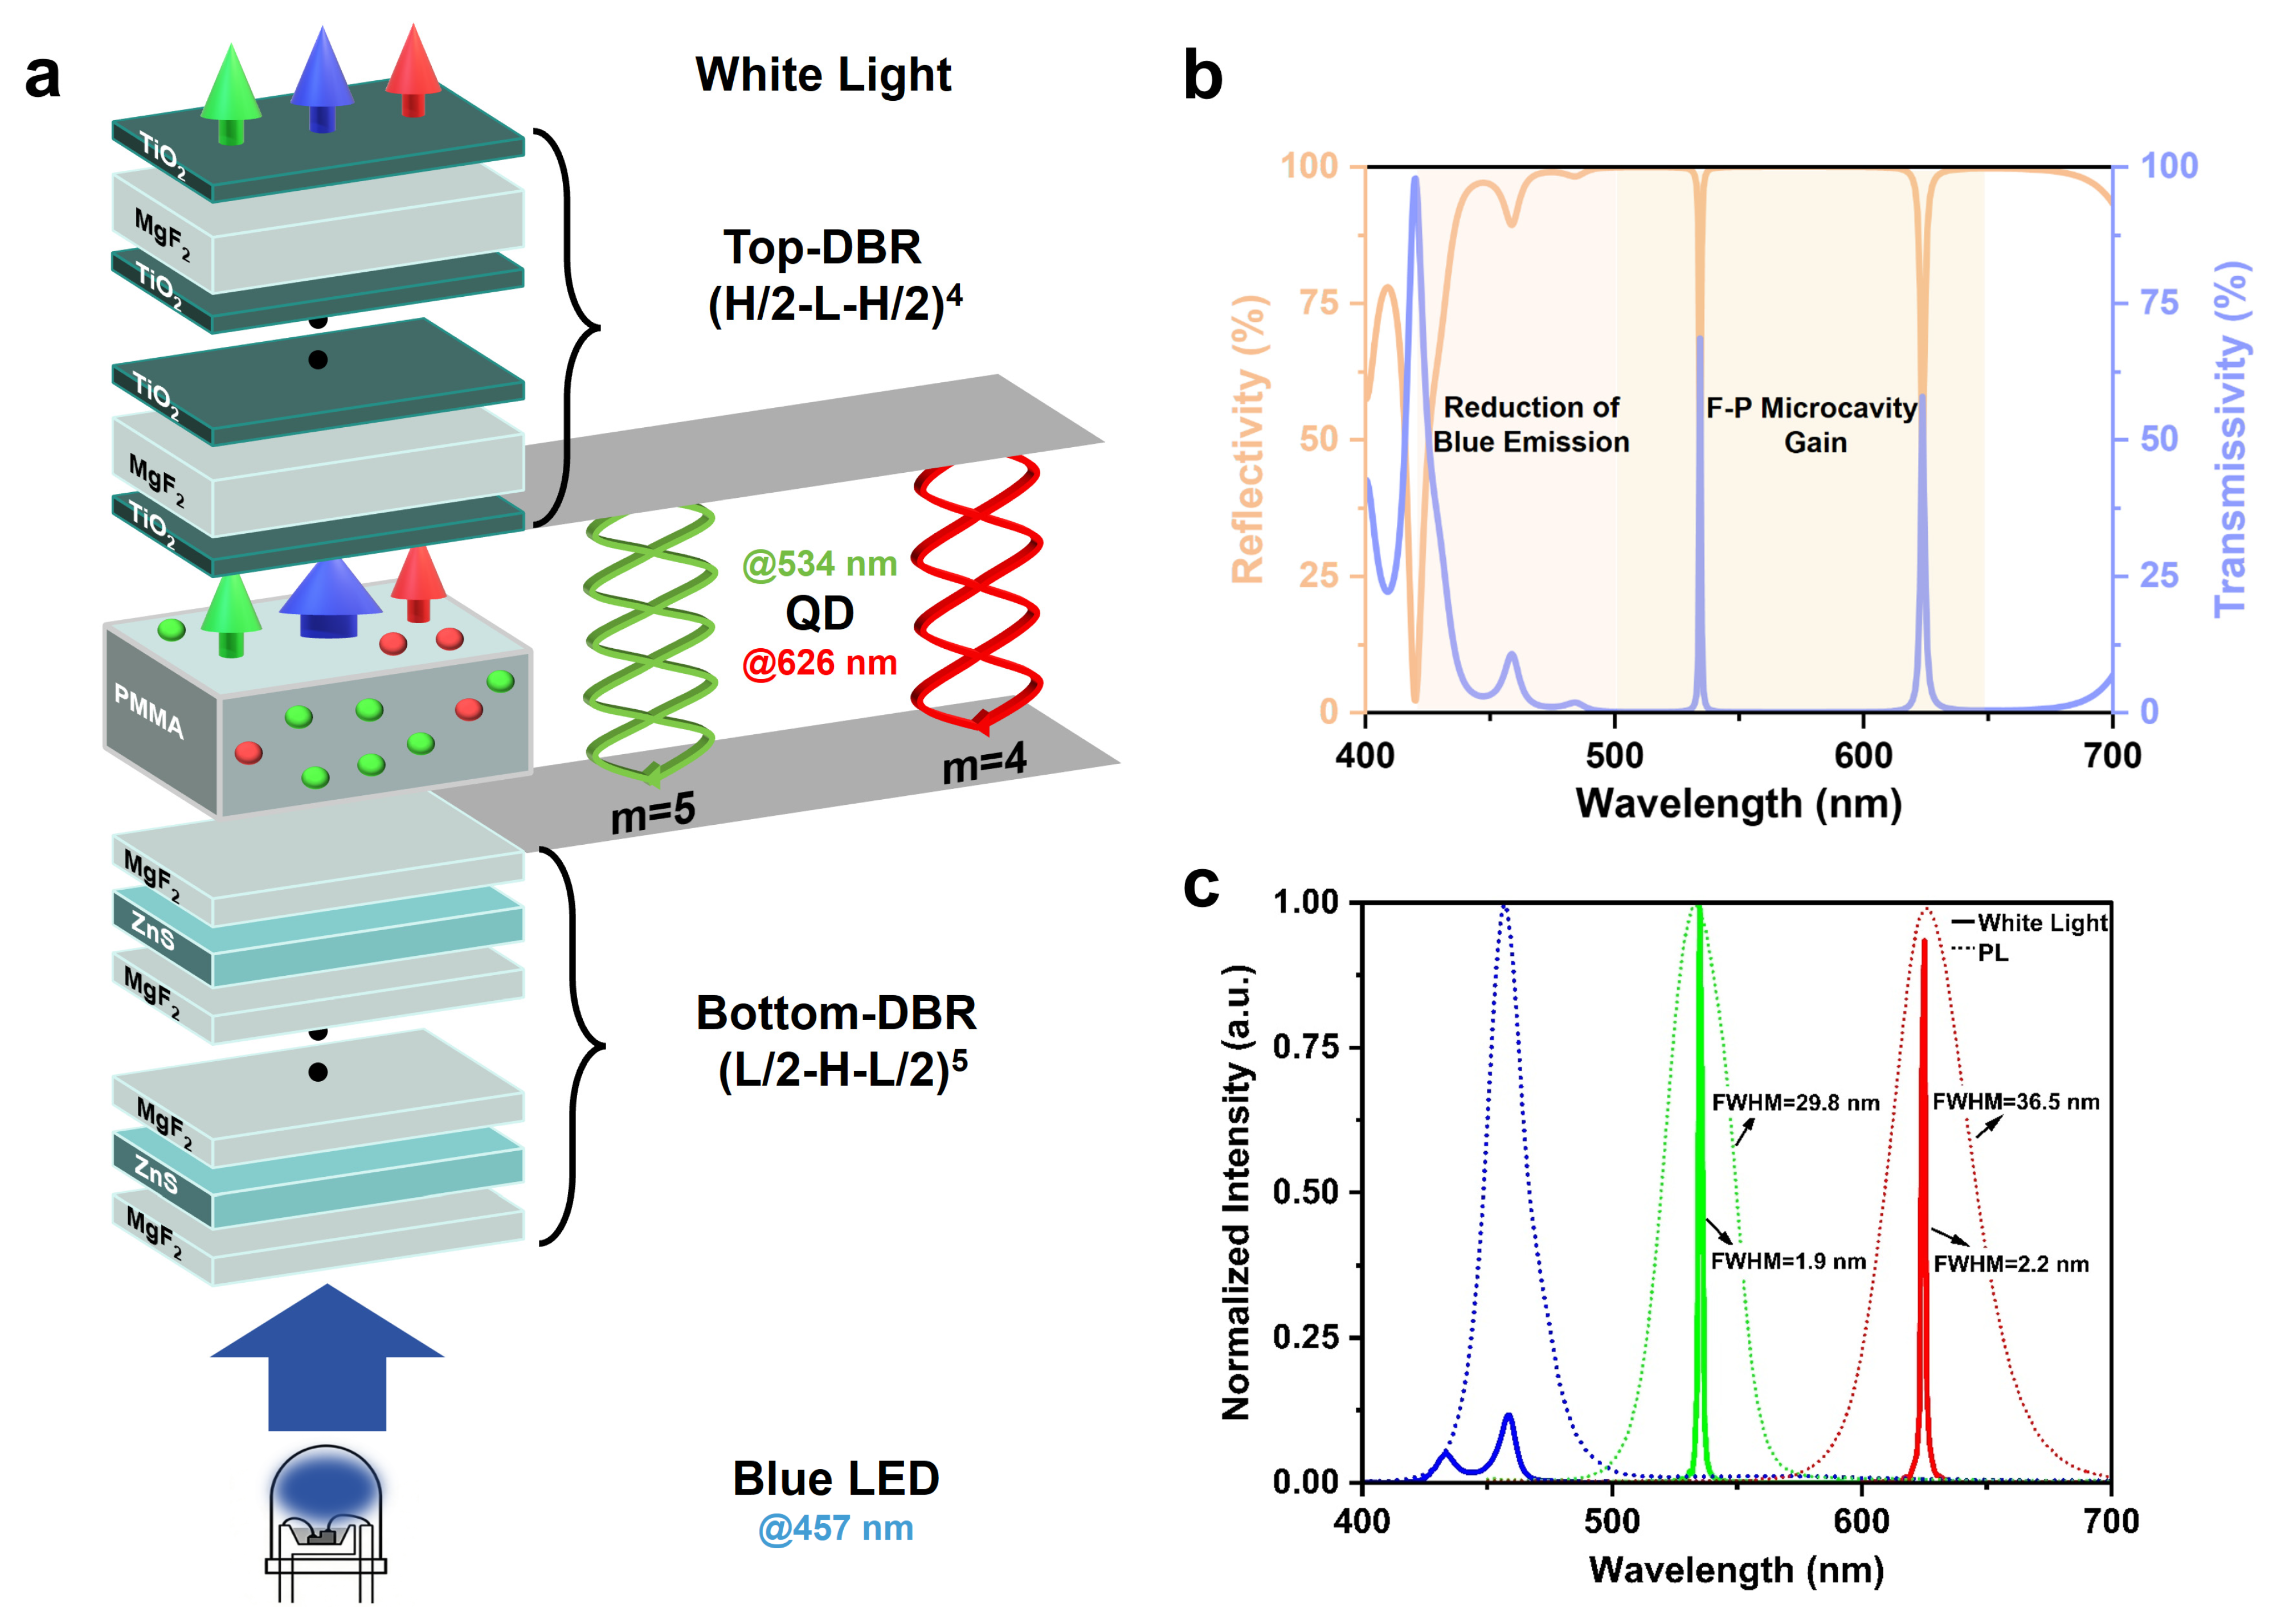
As illustrated in Figure 1a, to achieve ultra-narrow-band white light emission based on a 457 nm blue LED, we designed an asymmetric F-P microcavity (bottom DBRs: ZnS/MgF2, (/2--/2) N; top-DBRs: TiO2/MgF2, (/2--/2) N). The denotes the thickness of the low/high-refractive-index materials. This structure precisely aligns the emission peaks of red (626 nm) and green (534 nm) quantum dots with the fourth- and fifth-order resonant modes, respectively. The advantage of this asymmetric design lies in its ability to maintain a F-P cavity while minimizing blue light transmission loss through the bottom DBRs, thereby ensuring efficient excitation. Simultaneously, the enhanced blue light reflectance of the top DBRs increases the optical path length within the cavity, promoting reabsorption of blue light by the quantum dots while effectively reducing residual pump light in the output spectrum, thus providing a prerequisite for white light balance.
Figure 1.
Design of narrow-band W-QLEDs. (a) Schematic diagram of device structure. (b) Device reflection and transmission spectra. (c), Normalized emission spectrum of the device and photoluminescence spectrum of QDs.
In the design of the emissive layer, polymethyl methacrylate (PMMA; @600 nm, n = 1.49) was selected as the host matrix for quantum dots. Compared to conventional spin-coated or self-assembled QD films, the PMMA matrix exhibits extremely low optical loss and allows precise thickness control via fabrication processes. More importantly, its excellent barrier properties against moisture and oxygen significantly enhance the stability and operational lifetime of QDs under high-temperature and high-humidity environments. Simulation results indicate that the asymmetric F-P microcavity achieves a reflectance exceeding 97% in the 500–650 nm range (Figure 1b), demonstrating strong optical field confinement. By precisely tuning the thickness of the emissive layer, the resonant modes of the F-P microcavity are brought into perfect alignment with the emission peaks of the green (534 nm) and red (626 nm) QDs, compressing the mode full width at half maximum (FWHM) to below 3 nm. This provides theoretical support for realizing ultra-narrow-band spectral emission. Notably, the reflectance ~89% at 457 nm substantially reduces the contribution of the blue LED pump band in the output spectrum. Figure 1c illustrates the simulated normalized emission spectrum based on this asymmetric F-P microcavity. All original spectra (including the PL spectra of QDs and the blue LED pump light) were measured in the experiment. Furthermore, the emission from the blue LED is effectively reduced. Based on the optimization of the aforementioned optical performance, the device ultimately achieves standard white light emission with CIE coordinates of (0.32, 0.33). The following sections will discuss in detail the parameter optimization process and physical mechanisms underlying this asymmetric F-P microcavity.
2.2. Optimization and Design of Distributed Bragg Reflector Structure
To accurately determine the specific structures of the bottom and top DBRs, this study initially constructed three DBR stacking configurations based on the high-refractive-index material ZnS (@600 nm, n = 2.38) and the low-refractive-index material MgF2 (@600 nm, n = 1.38): (-) N, (/2--/2) N, and (/2--/2) N. The optical thickness of each layer satisfies the quarter-wavelength condition [52,53,54]:
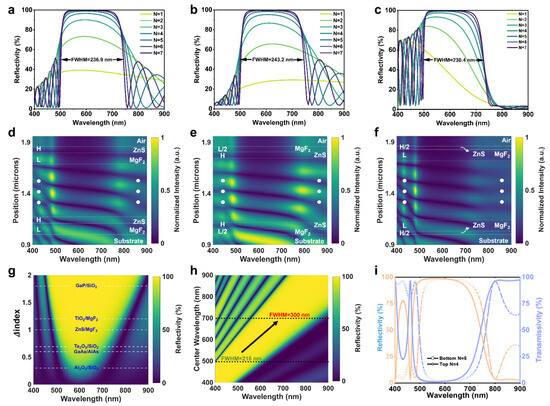
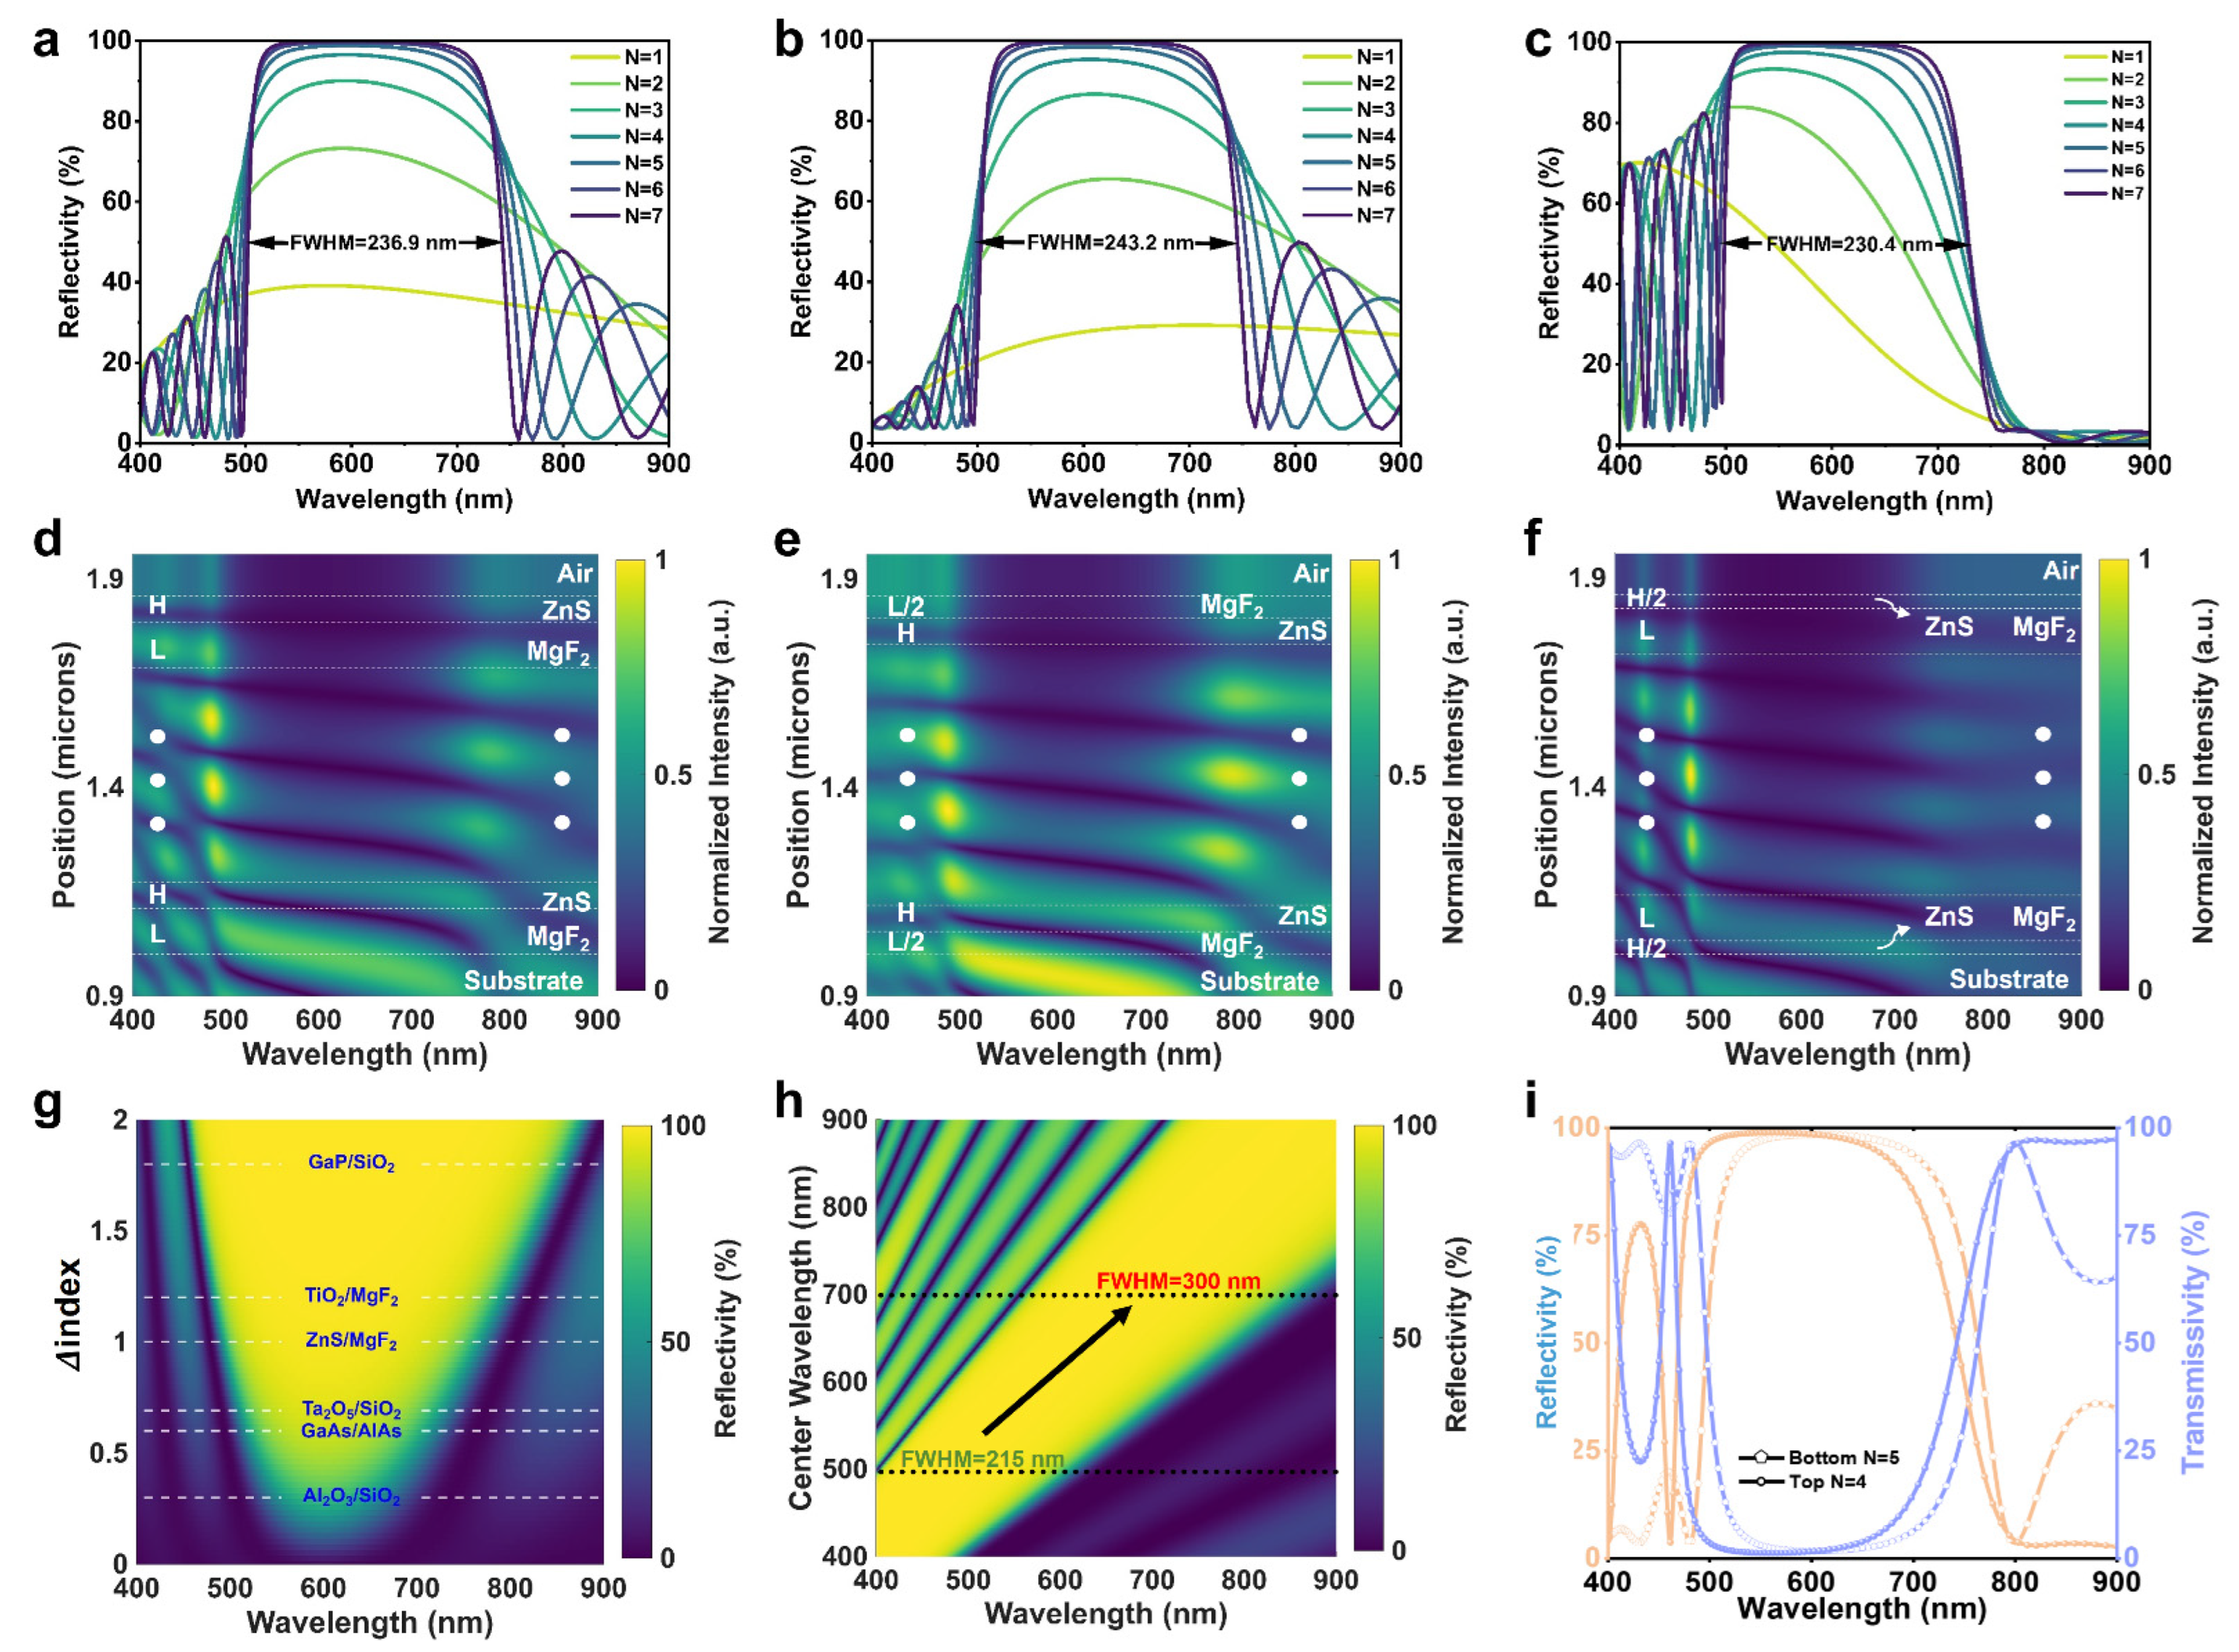
Here, is the central wavelength, and represents the corresponding refractive index. For = 600 nm, the calculated layer thicknesses are = 108.8 nm and = 63 nm. Figure 2a–c sequentially illustrate the evolution of reflection spectra for the three structures as the period number (N) increases from 1 to 7. Simulation results show that no distinct photonic stopband forms when N = 1; the DBRs reflectance rises gradually and saturates above 98% at the stopband center for all three structures when N ≥ 5. Meanwhile, the FWHM of stopband converges with increasing N, reaching 236.9 nm, 243.2 nm, and 230.4 nm at N = 7, respectively, which fully covers the 500–700 nm emission range of QDs. These results indicate that the stacking configuration has negligible impact on stopband width and peak reflectance, while notable differences emerge in spectral regions outside the stopband. To verify the reproducibility of the experiment on simulated data, we prepared a DBR sample based on a ZnS/MgF2 (/2--/2)7-stacked structure. The inset shows a photograph of the actual sample. The match between experiment and simulation is good in the stopband and long wavelength range, with deviations in the blue region (Supplementary Figure S1). This phenomenon is partly attributed to measurement errors caused by the low intensity of the test equipment’s light source in this wavelength band.
Figure 2.
Simulation of DBRs. The reflection spectra of three DBR stacking structures, namely (-) N for (a,d), (/2--/2) N for (b,e) and (/2--/2) N for (c,f), from N = 1 to N = 7, as well as the electric field at N = 5. (g) The reflection spectra for different common material systems. (h) The reflection spectra of different center wavelengths for top DBRs. (i) Reflection and transmission spectra of N = 5 bottom DBRs and N = 4 top DBRs.
To further elucidate the underlying physics, Figure 2d–f present the simulated normalized electric field intensity distributions inside and outside the stopband for the three structures at N = 5. Within the stopband, the electric field intensity decays rapidly with distance from the DBR–substrate interface due to the high reflectance of the DBRs, confirming that the optical field is efficiently confined to the incident side. In the 400–500 nm blue band, the three structures exhibit similar relative field intensity distributions. It should be noted that the simulated electric field represents relative rather than absolute intensity and the three structures share identical stopband reflectance. Therefore, the (/2--/2) N structure, which shows the highest field intensity within the stopband, actually exhibits the weakest blue band field intensity. Considering that the reflection spectrum based on N = 5 is sufficient to provide bandgap coverage and resonance strength for the PL peak, ZnS/MgF2 (/2--/2)5-stacked structure is selected for the bottom DBRs to meet the low blue light reflectance requirement, yielding only ~20% reflectance at the 457 nm LED peak. Conversely, the (/2--/2) N structure possesses the strongest blue band field intensity, which is fully consistent with the previously calculated reflectance results. Consequently, it is utilized in the top DBRs. Subsequently, the material composition for top DBRs will be ascertained.
To investigate the modulation effect of material refractive index on DBR reflectance, reflection spectra for different material systems were simulated at a central wavelength of 600 nm with N = 5, as shown in Figure 2g. Simulation results indicate that the refractive index contrast () directly determines the stopband width. For the low-contrast pair Al2O3/SiO2 ( = 0.28), the stopband width is only 147 nm with a maximum reflectance of 63%, insufficient to cover the emission bands of the red and green QDs. In contrast, the high-contrast pair TiO2/MgF2 (= 1.23) yields a significantly broader stopband of 313 nm and a near-unity reflectance of 99%. Excessively high index contrast, however, would produce an undesirably wide stopband that interferes with the 400–500 nm blue region. Additionally, the reflection spectra of three stacked DBR configurations—(-) N, (/2--/2) N, and (/2--/2) N—based on the TiO2/MgF2 material system were simulated (Supplementary Figure S2). Under identical structures, this system exhibits similar spectral trends to ZnS/MgF2 in both the stopband and blue light region, but with a wider FWHM and higher reflectivity at the same number of periods. These characteristics ensure greater flexibility for subsequent tuning of the top DBRs’ center wavelength. To identify the optimal material for the top DBRs, reflection spectra simulations were conducted on ZnS/MgF2 or TiO2/MgF2 material systems utilizing a (/2--/2)4-stacked structure, alongside the bottom DBR (ZnS/MgF2 (/2--/2)5-stacked, Supplementary Figure S3). In comparison to the four-period ZnS/MgF2, the TiO2/MgF2 demonstrates a reflectivity exceeding 95% within the forbidden bandgap, thereby offering a superior quality factor for the F-P microcavity. This characteristic is pivotal for narrowing FWHM of the green–red quantum dot emission spectrum. Furthermore, at the resonant wavelength, the marginally reduced reflectivity of the four-period TiO2/MgF2 (@626 nm, 97%) relative to the bottom DBRs (@626 nm, 98%) promotes enhanced light emission from the top side. Therefore, the TiO2/MgF2 material system is selected for the top DBRs.
Subsequent simulations based on the (/2--/2)4 structure revealed the effect of λc on reflectance characteristics (Figure 2h). As λc redshifts from 400 nm to 900 nm, the entire reflection spectrum shifts correspondingly, and the stopband broadens markedly from 215 nm (λc = 500 nm) to 300 nm (λc = 700 nm). Notably, even as λc varies, the left side of the stopband (short-wavelength side) maintains high reflectance, confirming the structural robustness for blue light reduction. Based on the above analysis, the initial DBR parameters with a center wavelength of 600 nm were established: the bottom DBRs use ZnS/MgF2 ((/2--/2)5,); the top DBRs use TiO2/MgF2 ((/2--/2)4, , ). Figure 2i presents the simulated reflection and transmission spectra for this configuration. The bottom DBRs exhibit a FWHM of 265 nm with an average reflectance of 98%, while the top DBRs show a stopband width of 273 nm with an average reflectance of 97%. The distinction resides in their respective abilities to reduce blue light emission within the 400–500 nm range (with a maximum reflectivity of 20% vs. 76%), thereby substantiating the rationality of the asymmetric design.
2.3. Resonant Mode Tuning of Asymmetric F-P Microcavity
Based on the completion of DBRs design, a complete asymmetric F-P microcavity structure was constructed by introducing a PMMA light-emitting layer (EML) doped with red and green QDs between DBRs. The resonance condition of the F-P microcavity is determined by the following phase formula:
where , , and represent the refractive index, thickness, and incident angle of EML in sequence, and m denotes the order of the longitudinal mode. , signify the transmission phase shifts in the single-layer top and bottom DBRs adjacent to the EML, respectively. The specific formula is as follows:
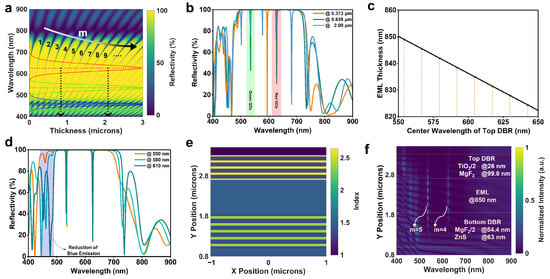
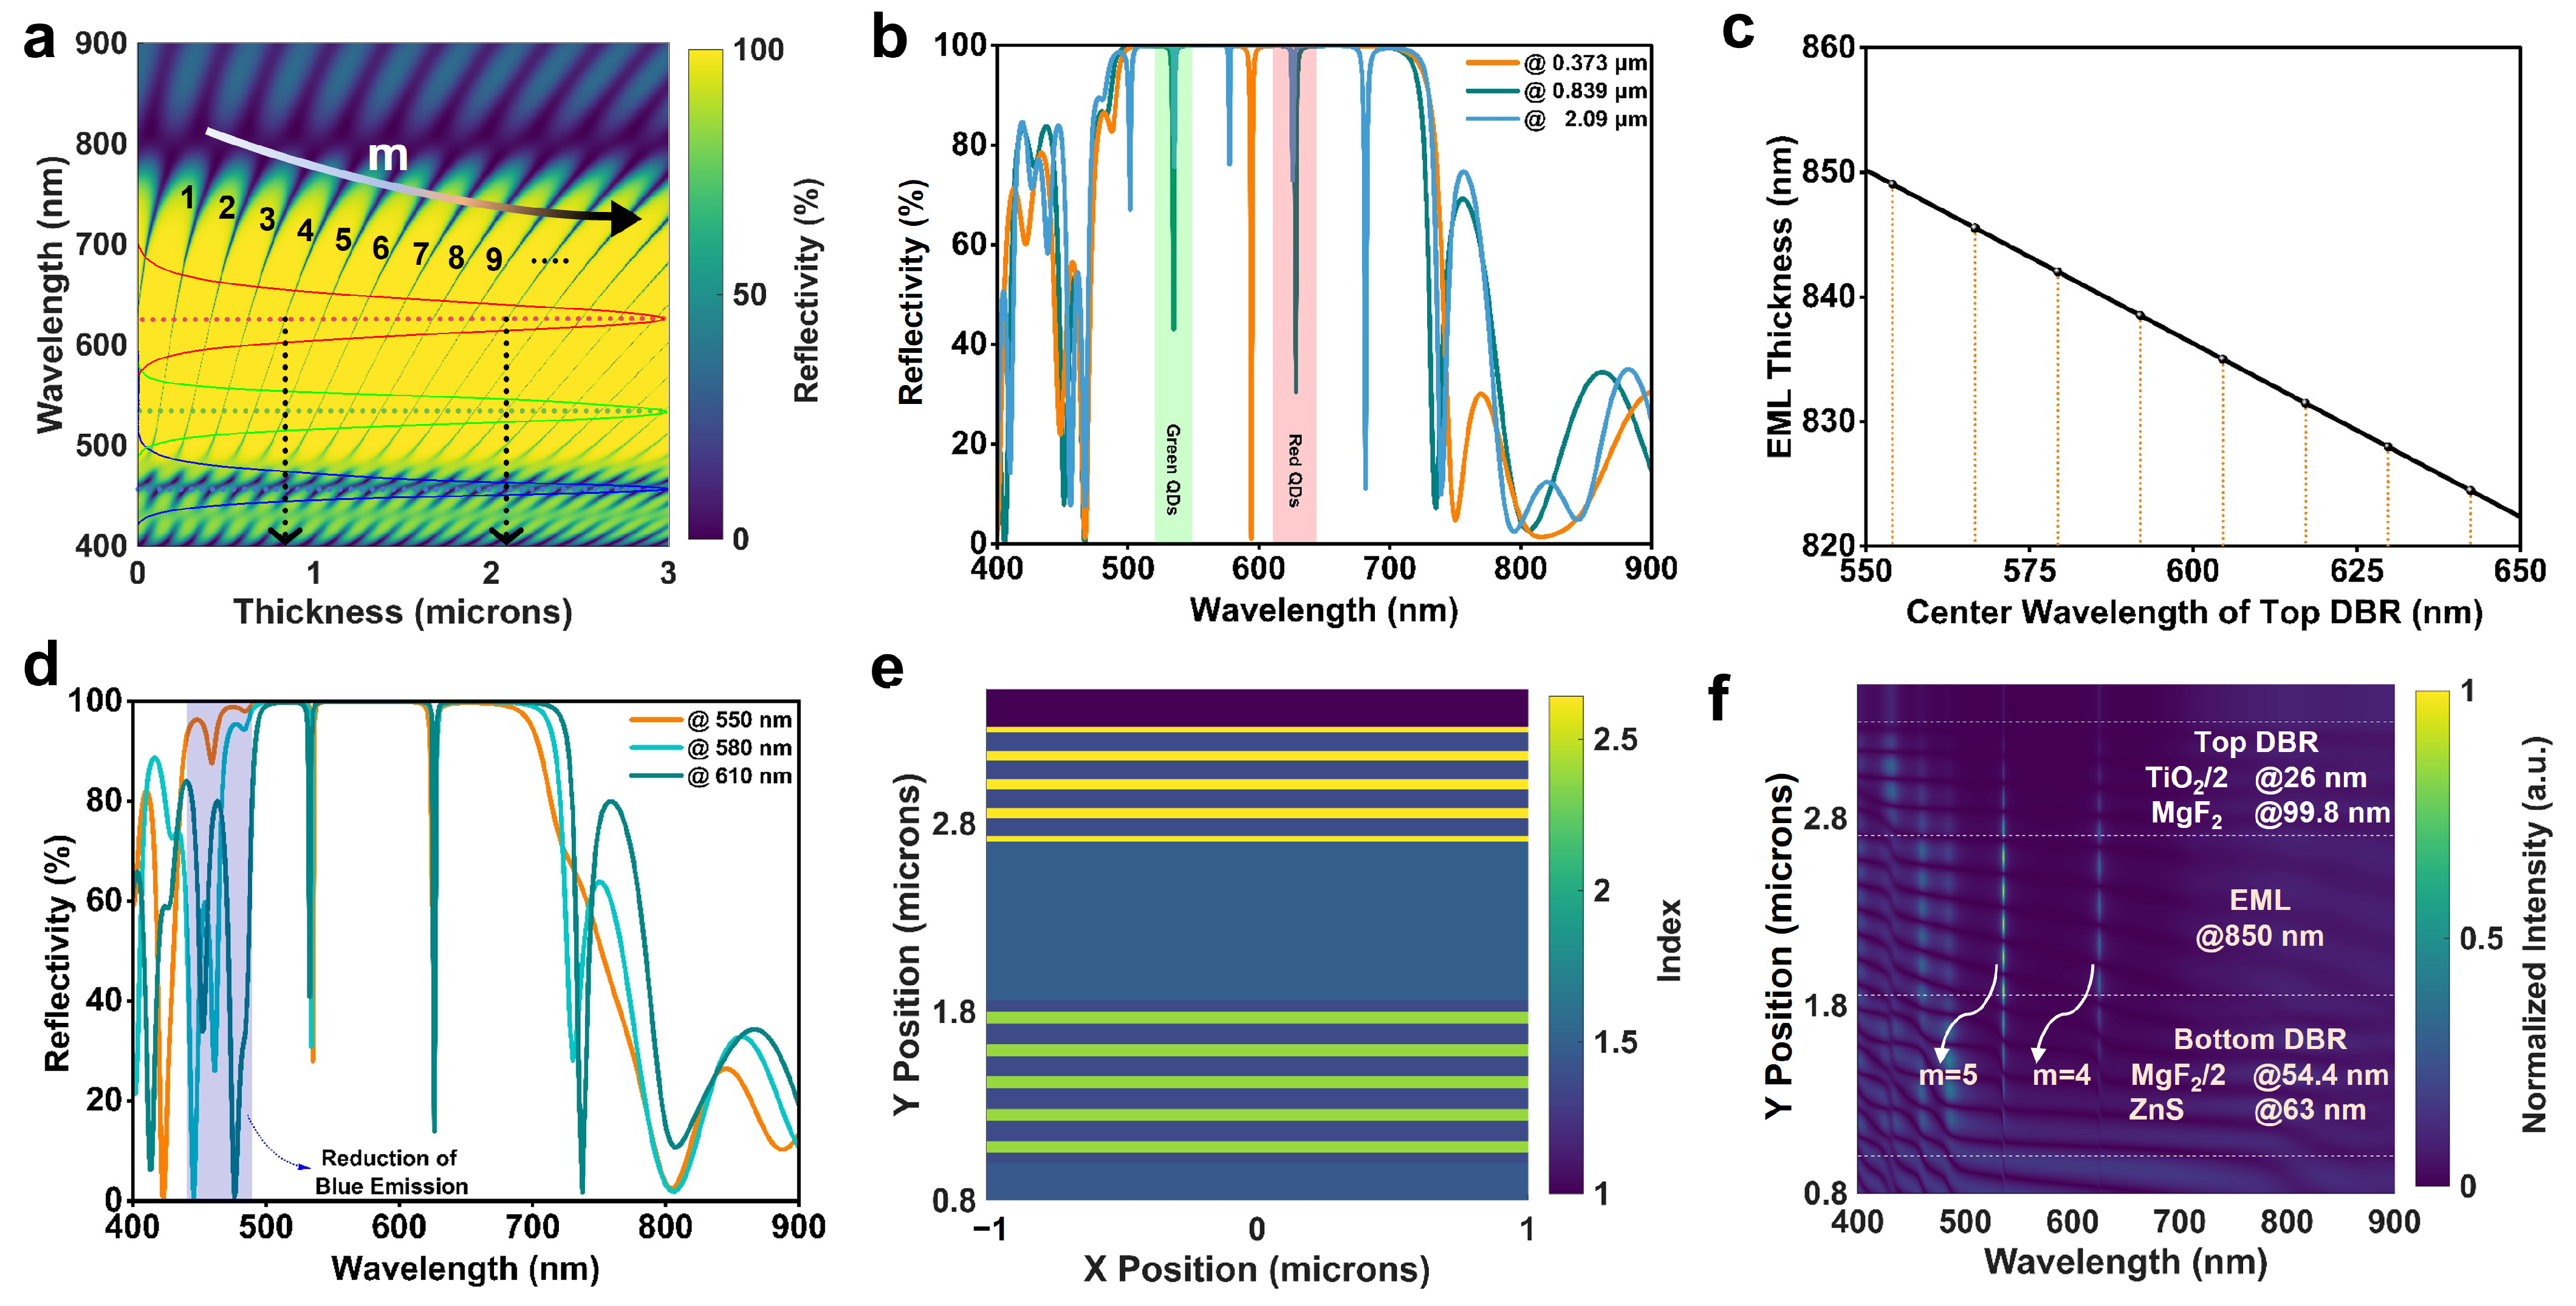
Here, and correspond to the incident angle/thicknesses of the high and low refractive index materials in the single-layer DBR, respectively. Figure 3a illustrates the evolution of the F-P microcavity reflection spectrum with varying emissive layer thickness. Within the DBRs stopband, sharp reflection dips satisfying the resonance condition exhibit extremely narrow FWHM. As the EML thickness increases, the resonant modes redshift regularly due to optical path accumulation, while the free spectral range (FSR) gradually decreases. When the thickness exceeds 270 nm, multiple cavity modes begin to coexist within the stopband. Three critical thickness points were selected for analysis: 0.373 μm, 0.839 μm, and 2.09 μm (Figure 3b). At 0.373 μm, only a single second-order mode at 593 nm appears within the stopband, which mismatches the red/green QDs emission range. Increasing the thickness to 0.839 μm eliminates lower-order modes and introduces coexisting fourth-order (628 nm) and fifth-order (535 nm) modes, perfectly aligning with the QD emission peaks. Further increasing the thickness to 2.09 μm generates up to five modes (m = 9 to 13) within the stopband. Although m = 10 and m = 12 remain in the gain region, modes m = 9, 11, and 13 fall outside it, posing a high risk of color crosstalk. Thus, 0.839 μm was preliminarily selected as the reference thickness for subsequent tuning. However, simulations revealed that the overall microcavity reflectance at 457 nm was only 44% at this thickness, insufficient for decreasing blue emission. Therefore, tuning of the top-DBRs central wavelength was attempted. Equations (2) and (3) indicates that F-P longitudinal modes depend on both the EML and DBRs thicknesses. To maintain mode alignment within the gain region, the EML thickness was simultaneously adjusted during top-DBRs wavelength tuning to preserve phase matching, as shown in Figure 3c. The optimal EML thickness exhibits a linear dependence on the top DBRs’ central wavelength: it decreases linearly from 0.85 μm to 0.825 μm as the central wavelength increases from 550 nm to 650 nm. Simulations at three nodes (550 nm, 580 nm, and 610 nm) demonstrated that although all structures could lock cavity modes near 535 nm and 625 nm (Figure 3d), only the 550 nm central wavelength can significantly reduce blue light emission (89% reflectance at 457 nm). Blue light reflection weakened as the central wavelength redshifted. Consequently, the λc of top DBRs was finalized at 550 nm, corresponding to an EML of 0.85 μm.
Figure 3.
Simulation of asymmetric F-P microcavity parameter tuning. (a) Reflectance spectrum varies with the thickness of the luminescent layer. The red, green, and blue solid lines in the inset correspond to the PL spectra of red and green QDs, as well as the emission spectrum of a blue LED. (b) Reflectance spectrum of the luminescent layer with thicknesses of 0.373 μm, 0.839 μm, and 2.09 μm. (c) The mapping relationship between the thickness of the EML and the central wavelength of the top DBRs. (d) Simulated reflectance spectrum of the top-DBRs center wavelengths at 550 nm, 580 nm, and 610 nm. (e) F-P model section refractive index. (f) Final microcavity structure cross-sectional electric field mode distribution.
Based on the above analysis, the asymmetric F-P microcavity structure was fully determined: bottom DBRs for 600 nm center wavelength: ZnS/MgF2 ((/2--/2)5,); the top DBRs for 550 nm center wavelength: TiO2/MgF2 ((/2--/2)4, , ); EML thickness: 0.85 μm, as depicted in Figure 3e,f shows the electric field distribution along the cross-section of this profiled F-P structure. The photonic stopband effectively spans 440 nm to 700 nm. Clear standing wave patterns emerge at 534 nm and 626 nm, identified as the fifth-order and fourth-order longitudinal modes by counting antinodes, respectively. This highly localized field distribution robustly confirms strong photon confinement within the microcavity, establishing the physical foundation for narrow-band emission. The F-P modes at multiple angles were further simulated and compared with results computed based on Equations (2) and (3), (Supplementary Figure S4). Excellent agreement was observed, accompanied by an angular dependence—the wavelength blueshifted as the angle increased, forming an effective gain range from −15° to 15°. Having completed the parametric simulation of the asymmetric F-P microcavity, we next simulate the complete physical process of white light generation from this structure under blue LED excitation.
2.4. Constructing Narrow-Band W-QLEDs
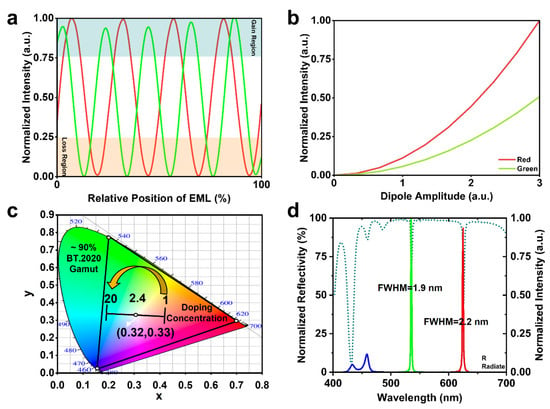
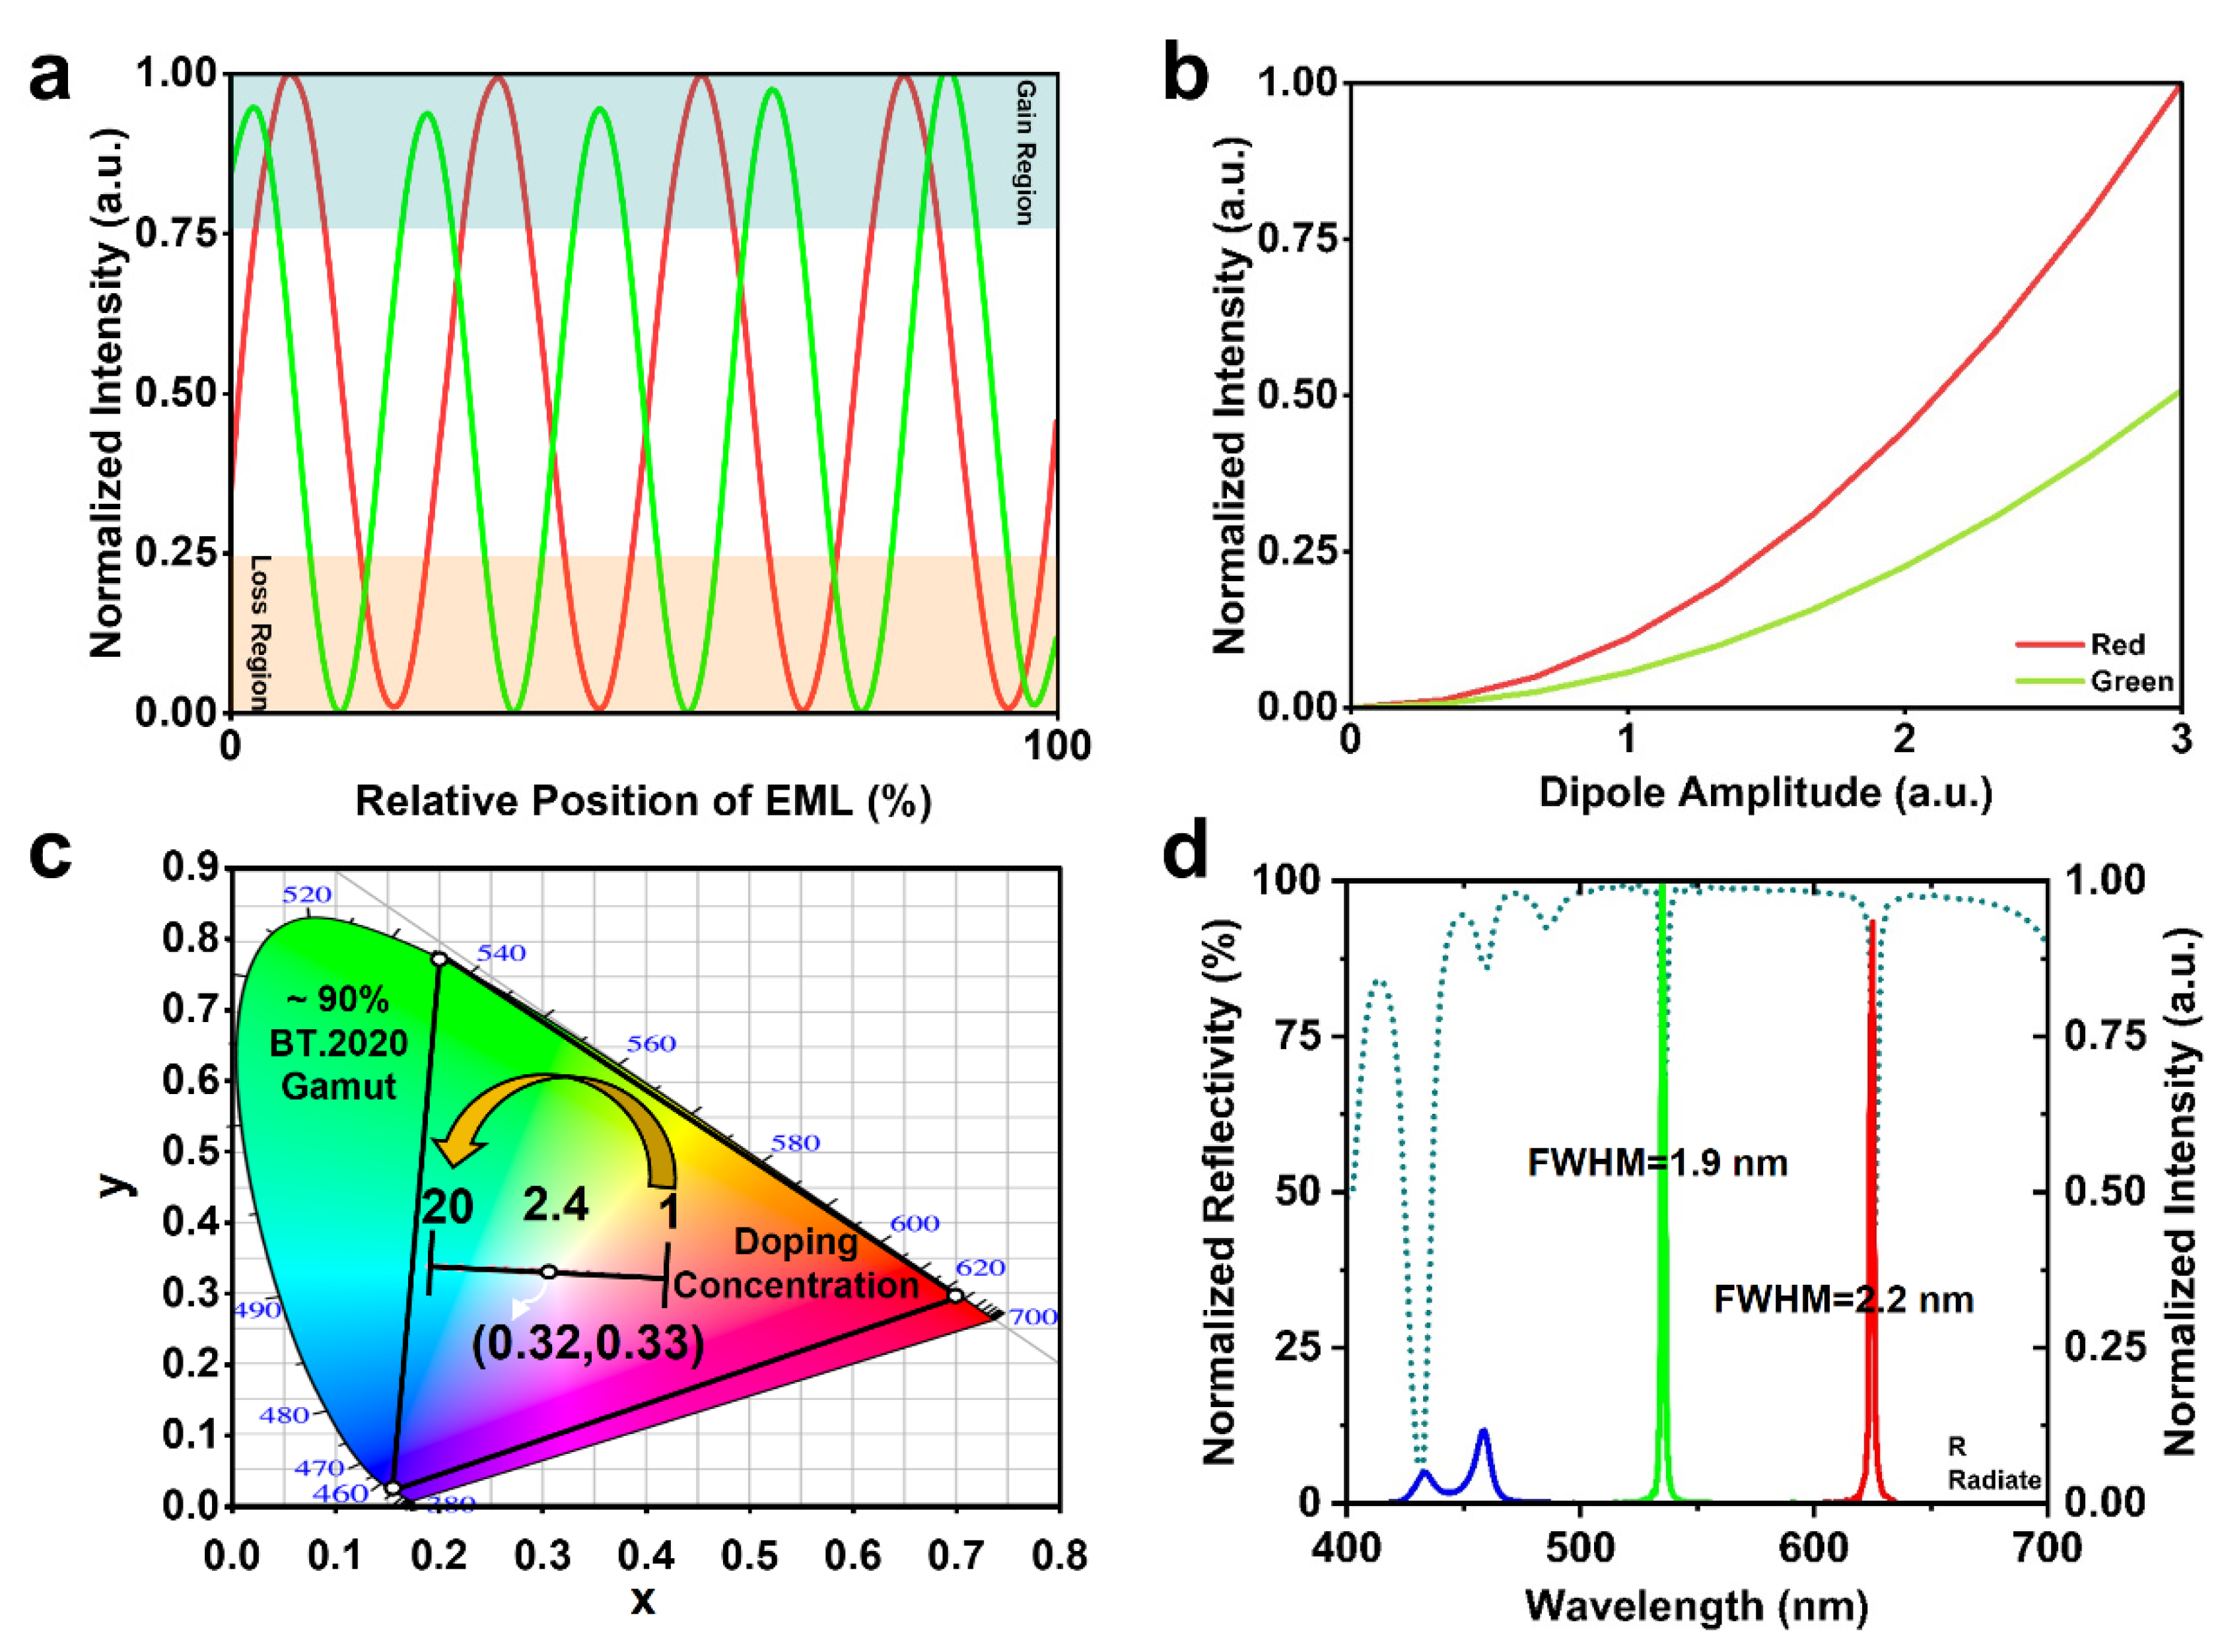
The photoluminescence process within the microcavity is fundamentally determined by the stimulated emission of QD dipoles within the localized electric field. Consequently, the longitudinal position of QDs within the EML and their doping ratio are crucial for the final device performance. Figure 4a simulates the emission intensity response of red and green QD dipoles at different relative positions within the EML (0%: bottom; 100%: top). The results indicate that the emission intensity exhibits high sensitivity to position, showing periodic oscillation behavior. The red dipoles present four radiative peaks at relative positions of 7.1%, 32.3%, 56.5%, and 81.7%. The green dipoles show five peaks at 3.5%, 24.1%, 44.8%, 65.4%, and 86.1%. These optimal emission positions coincide spatially with the antinodes of the standing wave electric field corresponding to the target wavelengths. This implies that to achieve optimal emission performance, a uniform longitudinal dispersion of red and green QDs within the PMMA layer should be pursued to maximize the utilization of the cavity filtering effect.
Figure 4.
Simulated tuning of W-QLEDs. (a) The influence of the relative position of dipoles in the EML on emission intensity. The red and green solid lines correspond to the PL spectra of red and green quantum dots, respectively. (b) Normalized emission intensity of red and green dipoles with different amplitudes. (c) Changes in CIE coordinates with different doping concentrations of quantum dots. (d) Normalized radiate spectrum and reflection spectrum of the final device.
Furthermore, the resonant enhancement effect for red light (626 nm) is significantly stronger than that for green light (534 nm). As shown in Figure 4b, under the same dipole amplitude (i.e., identical QD doping concentration), the radiative intensity of the red emission peak is approximately twice that of the green. This inherent spectral imbalance implies that to achieve white light balance, the doping concentration of green QDs must be increased to compensate for the excessive enhancement of red light. By splitting the spectrum into three primary color spectra—400 nm–500 nm, 500 nm–600 nm, and 600 nm–700 nm—and calculating the corresponding CIE coordinates for each, Figure 4c illustrates the coverage of ~ 90% of BT.2020 and the effect of adjusting the green-to-red QD doping ratio (from 1 to 20) on the device’s emission chromaticity coordinates. The trajectory of the chromaticity coordinates is non-linear; when the doping ratio is approximately 2.4, the device’s emission spectrum most closely approaches standard white light, corresponding to CIE coordinates of (0.32, 0.33). All data for DBRs and F-P microcavities, including reflectivity and CIE coordinates, are summarized in the Supplementary Table S1. The final normalized emission and reflection spectra of the device are presented in Figure 4d. Under the filtering action of the microcavity, the FWHM of the emission peaks at 534 nm and 626 nm are compressed to 1.9 nm and 2.2 nm, respectively, validating the effectiveness of linewidth compression. Simultaneously, due to the ~89% reflectance in the 457 nm, the blue component in the final spectrum is effectively reduced, forming a spectral dip at 446 nm. The relative emission intensity peaks of blue light appear at 432 nm (0.05) and 458 nm (0.10), which originate from the residual pump transmission in the microcavity. The overall contribution of each color is shown in the Supplementary Figure S5. The proportions of red, green, and blue are 36.2%, 35%, and 28.8%, respectively, indicating that residual blue pump light remains a significant component of the white light. The Purcell factor and emission energy ratio of the microcavity were simulated (Supplementary Figure S6). Evidently, the Purcell factor (estimated value without 3D quantification) was significantly enhanced at the resonant wavelengths (4.56 @ 534 nm, 4.66 @ 626 nm), indicating the occurrence of the Purcell effect. However, since the Q-factor (~285) had not yet reached the regime of strong Purcell effect, the modulation of the emitter’s radiative dynamics by the microcavity remained limited. Therefore, the significant narrowing of the PL spectrum observed in the final emission spectra was primarily attributed to the filtering effect. Additionally, the emission proportion of red (maximum 22.3%) was notably higher than that of green (maximum 6.3%), which explains why the doping concentration of green quantum dots in the final device was higher than that of red. The low emission efficiency also indicates that the device still falls short of practical application. The angle-dependent emission wavelength is modulated by the F-P microcavity, exhibiting clear angular dependence. Unfortunately, as the reflection of blue light gradually diminishes at larger angles, the white point appears only within observation angles of ±5° (Supplementary Figure S7). Varying the simulation domain resulted in a numerical fluctuation of only 0.02%. Meanwhile, when the mesh accuracy is ≥4 (grid λ/18), the data has stabilized, further demonstrating the convergence of the model (Supplementary Figure S8).
Furthermore, sensitivity analysis was performed. The Supplementary Figure S9 show the variations in device reflectance and CIE coordinates as functions of changes in refractive index (), absorption coefficient (), interface roughness layer thickness (dEMA), and EML thickness. For and , the resonant wavelength remains nearly unchanged within the set range, while the reflectance intensity varies. Combined with the corresponding CIE coordinates, the tolerance range for achieving white point is determined as ≤ 0.005 and ≤ 0.002. Additionally, we embedded an EMA (effective medium approximation) layer at the MgF2/ZnS and MgF2/TiO2 interfaces to simulate interfacial roughness in practice, where the refractive index of the EMA layer () follows the effective medium approximation [55]:
Here, f represents the volume fraction of the raw material in the equivalent dielectric model layer (taken as 0.5 here). The calculated values are 1.91 (@600 nm) for the ZnS/MgF2 interface and 2.08 (@600 nm) for the TiO2/MgF2 interface. Clearly, as the interface roughness increases, the reflectance spectrum exhibits a slight redshift, and the resulting intensity variation shifts the final emission spectrum toward cyan. Based on the CIE coordinates, the roughness layer thickness must be within 2 nm to maintain white point. As the EML thickness increases from 846 nm to 856 nm, the resonant wavelengths shift from 532/623 nm to 537/628 nm (a redshift of approximately 5 nm). The white point allows an EML thickness range of 850–854 nm, corresponding to a tolerance of ~0.5%. Taking into account the tolerance range of the EML thickness, the original CIE coordinates were corrected to (0.32, 0.33). In summary, through the design of an asymmetric F-P microcavity, this study successfully achieves compression of QD emission linewidth and spectral regulation. However, the high sensitivity to refractive index, interface roughness, and EML thickness, together with the limited viewing angle, still leaves the device far from practical application.
3. Conclusions
This study validates the feasibility of ultra-narrow-band W-QLEDs via asymmetric F-P microcavities. Comparative analysis reveals that the ZnS/MgF2 (/2--/2)5-stacked structure offers low blue reflectance (~20%) suitable for the bottom DBRs. Simultaneously, the top DBRs adopt the TiO2/MgF2 (/2--/2)4-stacked structure to endow the final device with a higher blue reflectivity (~89%). The optimized DBRs deliver >97% reflectance across 500–650 nm. Mode tuning is central to linewidth compression. Optimizing PMMA thickness (0.85 μm) and top DBRs’ center wavelength locked the fourth- and fifth-order modes to the red (626 nm) and green (534 nm) QDs, compressing FWHM to 2.2 nm and 1.9 nm, respectively. White balance is achieved by tuning the green/red QDs doping ratio to 2.4, compensating for stronger cavity enhancement in the red band and yielding standard white coordinates (0.32, 0.33). Unfortunately, the low QDs emission efficiencies (~6.3% for green, ~22.3% for red), high sensitivity to refractive index ( ≤ 0.005, ≤ 0.002) and film thickness (~0.5%), and a white light viewing angle below 5° still limit its practical applicability. Future work will focus on fabrication process optimization and electroluminescence validation.
Supplementary Materials
The following supporting information can be downloaded at: https://www.mdpi.com/article/10.3390/photonics13080706/s1.
Author Contributions
Conceptualization, R.C. and S.X.; methodology, R.C. and S.X.; software, H.W. and J.R.; validation, H.W. and J.R.; formal analysis, Z.Z.; data curation, Z.Z.; writing—original draft preparation, H.W. and J.R.; writing—review and editing, R.C.; supervision, C.G.; project administration, S.X. All authors have read and agreed to the published version of the manuscript.
Funding
This research was funded by Foundation of Hebei Province grant number [E2025202154 and F2026202043].
Data Availability Statement
The data that support the findings of this study are available from the corresponding author upon reasonable request.
Conflicts of Interest
The authors declare no conflicts of interest.
References
- Dai, P.-P.; Li, C.; Zhang, X.-T.; Xu, J.; Chen, X.; Wang, X.-L.; Jia, Y.; Wang, X.-J.; Liu, Y.-C. A single Eu2+-activated high-color-rendering oxychloride white-light phosphor for white-light-emitting diodes. Light Sci. Appl. 2016, 5, e16024. [Google Scholar] [CrossRef] [Scilit] [PubMed]
- Deng, M.; Shang, M.-M.; Sun, Y.-X.; Wang, Y.-N.; Xing, X.-L. Thermally Stable Red-Emitting Ca18K3Sc(PO4)14:Mn2+ Phosphor and Enhanced Luminescence by Energy Transfer Between Ce3+-Eu2+-Mn2+. Inorg. Chem. 2024, 63, 3901–3912. [Google Scholar] [CrossRef] [Scilit] [PubMed]
- Fang, M.-H.; Bao, Z.; Huang, W.-T.; Liu, R.-S. Evolutionary Generation of Phosphor Materials and Their Progress in Future Applications for Light-Emitting Diodes. Chem. Rev. 2022, 122, 11474–11513. [Google Scholar] [CrossRef] [Scilit] [PubMed]
- Wang, F.; Chen, H.; Zhang, S.; Jin, H. Novel narrowband emitting red phosphor Sr3La2W2O12:Eu3+ with excellent thermal stability for WLEDs. J. Am. Ceram. Soc. 2025, 108, e20200. [Google Scholar]
- Wu, H.; Xiao, H.; Pan, G.-H.; Hao, Z.-D.; Zhang, L.-L.; Wu, H.; Zhang, J.-H. Ca3Sc2Si3O12:Ce3+, Mn2+ phosphor ceramic: A promising color converter for full-color laser lighting. J. Am. Ceram. Soc. 2024, 107, 8216–8223. [Google Scholar] [CrossRef] [Scilit]
- Xia, Z.; Liu, Q. Progress in discovery and structural design of color conversion phosphors for LEDs. Prog. Mater. Sci. 2016, 84, 59–117. [Google Scholar] [CrossRef] [Scilit]
- Huang, Y.; Hsiang, E.; Deng, M.; Wu, S. Mini-LED, Micro-LED and OLED displays: Present status and future perspectives. Light-Sci. Appl. 2020, 9, 105. [Google Scholar] [PubMed]
- Liu, W.; Qiao, Y.-K.; Deng, Y.-Y.; Zhang, Y.; Liu, C.-Y.; Guo, W.-B. Advancements and Challenges of Highly Efficient and Stable Perovskite Light-Emitting Diodes. Laser Photonics Rev. 2026, 20, e01787. [Google Scholar]
- Wang, D.; Wu, P.-Y.; Yao, Q.; Xu, W.-Q.; Zhao, Z.-H.; Chen, S.-F.; Ye, S.-Q.; Wang, Z.-Y.; Zhang, Y.-H.; Wang, N.-Q. Energy consumption assessment of LED displays based on mapping method. Sustain. Energy Technol. Assess. 2025, 74, 104204. [Google Scholar] [CrossRef] [Scilit]
- Zhao, Z.; Yao, Q.; Chen, S.-F.; Wu, P.-Y.; Zhang, Y.-H.; Xu, W.-Q.; Sun, B.-Y.; Wang, D.; Wang, Z.-Y.; Feng, J.-W. Performance enhancement of LED displays through optimized light distribution. Displays 2025, 88, 103039. [Google Scholar] [CrossRef] [Scilit]
- Chen, C.; Chen, R.-Z.; Gao, R.-B.; Zheng, J.-M.; Xiang, J.-M.; Guo, C.-F. Highly Efficient and Stable Narrow Band Green Emitting Phosphor of Sb3+/Ce3+ Sensitized Cs2NaTbCl6 for WLED. Laser Photonics Rev. 2025, 19, 2401158. [Google Scholar] [CrossRef] [Scilit]
- Lei, J.; Zhu, H.-L.; Huang, X.; Lin, J.-J.; Zheng, Y.-F.; Lu, Y.-J.; Chen, Z.; Guo, W.-J. Mini-LED Backlight: Advances and Future Perspectives. Crystals 2024, 14, 922. [Google Scholar] [CrossRef] [Scilit]
- Tan, G.; Huang, Y.-G.; Li, M.-C.; Lee, S.-L.; Wu, S.-T. High dynamic range liquid crystal displays with a mini-LED backlight. Opt. Express 2018, 26, 16572–16584. [Google Scholar]
- Masaoka, K.; Nishida, Y. Metric of color-space coverage for wide-gamut displays. Opt. Express 2015, 23, 7802–7808. [Google Scholar] [CrossRef] [Scilit] [PubMed]
- Takeuchi, M.; Sakamoto, Y.; Yokoyama, R.; Sun, H.-M.; Matsu, Y.; Katto, J. Gamut-Extension Methods Considering Color Information Restoration. IEEE Access 2019, 7, 80146–80158. [Google Scholar] [CrossRef] [Scilit]
- Chen, H.-W.; Zhu, R.-D.; He, J.; Duan, W.; Hu, W.; Lu, Y.-Q.; Li, M.-C.; Lee, S.-L.; Dong, Y.-J.; Wu, S.-T. Going beyond the limit of an LCD’s color gamut. Light Sci. Appl. 2017, 6, e17043. [Google Scholar] [CrossRef] [Scilit] [PubMed]
- Huang, B.; Guo, T.-L.; Xu, S.; Ye, Y.; Chen, E.-G.; Lin, Z.-X. Color Converting Film With Quantum-Dots for the Liquid Crystal Displays Based on Inkjet Printing. IEEE Photonics J. 2019, 11, 1–9. [Google Scholar] [CrossRef] [Scilit]
- Naveen, K.; Oh, J.; Lee, H.; Kwon, J. Tailoring Extremely Narrow FWHM in Hypsochromic and Bathochromic Shift of Polycyclo-Heteraborin MR-TADF Materials for High-Performance OLEDs. Angew. Chem.-Int. Ed. 2023, 62, e202306768. [Google Scholar] [CrossRef] [Scilit]
- Wu, X.; Ni, S.-Q.; Wang, C.-H.; Zhu, W.-G.; Chou, P.-T. Comprehensive Review on the Structural Diversity and Versatility of Multi-Resonance Fluorescence Emitters: Advance, Challenges, and Prospects toward OLEDs. Chem. Rev. 2025, 125, 6685–6752. [Google Scholar] [CrossRef] [Scilit]
- Li, Z.; Qiu, J.; Li, X.; Li, J. Improving color uniformity and the ambient contrast ratio of LEDs through the scattering-enhanced magnetic manipulation bilayered structure. Opt. Express 2024, 32, 29817–29829. [Google Scholar] [CrossRef] [Scilit] [PubMed]
- Leng, Z.; Bai, H.; Qing, Q.; He, H.-B.; Hou, J.-Y.; Li, B.-Y.; Tang, Z.-B.; Song, F.; Wu, H.-Y. A Zero-Thermal-Quenching Blue Phosphor for Sustainable and Human-Centric WLED Lighting. ACS Sustain. Chem. Eng. 2022, 10, 10966–10977. [Google Scholar] [CrossRef] [Scilit]
- Liao, J.; Chen, B.-W.; Wang, H.; Zong, X.; Tu, B.-T.; Wang, W.-M.; Fu, Z.-Y. A novel green-emitting Mg0.75Al2.16O4:Mn2+ transparent ceramic phosphor for white light-emitting device. Ceram. Int. 2025, 51, 9224–9230. [Google Scholar] [CrossRef] [Scilit]
- Nair, G.B.; Swart, H.C.; Dhoble, S.J. A review on the advancements in phosphor-converted light emitting diodes (pc-LEDs): Phosphor synthesis, device fabrication and characterization. Prog. Mater. Sci. 2020, 109, 100622. [Google Scholar] [CrossRef] [Scilit]
- Wang, Q.; Li, H.-B.; Tong, H.; Zhu, J.-L.; Fan, J.-L.; Pan, S.-F.; Zhou, Z.-N.; Liu, W.; Ouyang, G.-F. Copper Mixed-halide Hybrids with Intrinsic Broadband White-Light Emission for WLED Application with Ultrahigh Color Rendering Index. Small 2025, 21, 2500660. [Google Scholar] [CrossRef] [Scilit]
- Weng, Z.; Yi, X.-Z.; Tang, Y.-R.; Tian, Y.-N.; Chen, J.; Zhao, D.; Zhou, S.-M.; Lin, Y.-D. Color tunable white LEDs based on low sintering temperature Phosphor−in−Glass. Opt. Mater. 2021, 115, 111043. [Google Scholar] [CrossRef] [Scilit]
- Berends, A.C.; van de Haar, M.A.; Krames, M.R. YAG:Ce3+ Phosphor: From Micron-Sized Workhorse for General Lighting to a Bright Future on the Nanoscale. Chem. Rev. 2020, 120, 13461–13479. [Google Scholar] [CrossRef] [Scilit] [PubMed]
- Zhang, Y.; Chen, W.-B.; Kuang, Y.-H.; Hu, T.; Zhao, M.; Xia, Z.-G.; Zhang, X.-P. Narrow-Band Green-Emitting RbSr4(BO3)3:Eu2+ Phosphor Glass Composite for Wide-Color-Gamut Laser Displays. Laser Photonics Rev. 2026, e71317. [Google Scholar] [CrossRef] [Scilit]
- Bispo, A.G., Jr.; Saraiva, L.-F.; Lima, S.A.M.; Pires, A.-M.; Davolos, M.-R. Recent prospects on phosphor-converted LEDs for lighting, displays, phototherapy, and indoor farming. J. Lumin. 2021, 237, 118167. [Google Scholar] [CrossRef] [Scilit]
- Zhao, M.; Zhang, Q.; Xia, Z. Narrow-band emitters in LED backlights for liquid-crystal displays. Mater. Today 2020, 40, 246–265. [Google Scholar] [CrossRef] [Scilit]
- Hasanzadeh Azar, M.; Jahanzamin, J.; Ji, Z.; Kitai, A.; Beke, D.; Gali, A. Recent Advances in the Synthesis, Optical Properties, and Applications of Fluorescent Silicon Carbide Quantum Dots. Small Sci. 2025, 5, 2500013. [Google Scholar] [CrossRef] [Scilit] [PubMed]
- Zhang, L.; Yang, X.; Yin, Z.; Sun, L. A review on carbon quantum dots: Synthesis, photoluminescence mechanisms and applications. Luminescence 2022, 37, 1612–1638. [Google Scholar] [CrossRef] [Scilit] [PubMed]
- Eagle, F.W.; Park, N.; Cash, M.; Cossairt, B.M. Surface Chemistry and Quantum Dot Luminescence: Shell Growth, Atomistic Modification, and Beyond. ACS Energy Lett. 2021, 6, 977–984. [Google Scholar] [CrossRef] [Scilit]
- Liu, H.; Wang, P.-N.; Duan, R.; Ren, Z.-Y.; Sun, H.-D.; He, T.-C.; Chen, R. Complete Lateral Surface Passivation and Photostability Investigation of CdSe/CdSeS Core/Crown Nanoplatelets. J. Phys. Chem. Lett. 2026, 17, 230–236. [Google Scholar]
- Wang, R.; Ma, W.; Feng, Q.; Yuan, Y.-Q.; Geng, C.; Xu, S. Toward Ultra-stable Barrier-free Quantum Dots-Color Conversion Film via Zinc Phenylbutyrate Modification. ACS Appl. Mater. Interfaces 2025, 17, 18790–18799. [Google Scholar] [CrossRef] [Scilit] [PubMed]
- Chen, G.-H.; Yang, S.-H.; Yeh, C.-W.; Ho, S.-J.; Liu, M.-C.; Chen, H.-S. Polycarbonate light guide plates with embedded quantum dots fabricated by large-scale injection moulding for wide colour gamut displays. Mater. Des. 2021, 201, 109504. [Google Scholar] [CrossRef] [Scilit]
- Chen, H.; He, J.; Wu, S. Recent Advances on Quantum-Dot-Enhanced Liquid-Crystal Displays. IEEE J. Sel. Top. Quantum Electron. 2017, 23, 1–11. [Google Scholar] [CrossRef] [Scilit]
- Xiao, X.; Tang, H.-D.; Zhang, T.-Q.; Chen, W.; Chen, W.-L.; Wu, D.; Wang, R.; Wang, K. Improving the modulation bandwidth of LED by CdSe/ZnS quantum dots for visible light communication. Opt. Express 2016, 24, 21577–21586. [Google Scholar] [CrossRef] [Scilit] [PubMed]
- Zhang, L.; Jin, Y.; Xu, T. Wide color gamut white light-emitting diodes based on two-dimensional semiconductor nanoplatelets. Opt. Express 2022, 30, 3719–3728. [Google Scholar] [CrossRef] [Scilit] [PubMed]
- Zhang, W.; Yang, W.; Zhong, P.; Mei, S.-L.; Zhang, G.-L.; Chen, G.-P.; He, G.-X.; Guo, R.-Q. Spectral optimization of color temperature tunable white LEDs based on perovskite quantum dots for ultrahigh color rendition. Opt. Mater. Express 2017, 7, 3065–3076. [Google Scholar] [CrossRef] [Scilit]
- Zhu, Y.; Yang, J.-Q.; Shi, W.; Xie, J.-X.; Zhou, B.-S.; Wang, J.-G.; Zheng, S.-H.; Li, S.-G.; Chen, W.-J. Bright tunable multicolor carbon dots for white light-emitting diodes and fingerprint detection. J. Lumin. 2025, 278, 121007. [Google Scholar] [CrossRef] [Scilit]
- Li, J.; Ding, X.; Shi, Y.; Li, J.; Deng, Z.; Qiu, J.; Zhang, J.; Luo, W.; Liang, G.; Zhao, L.; et al. Bioinspired ultrathin photonic color convertors for highly efficient micro-light-emitting diodes. FlexMat 2024, 1, 258–268. [Google Scholar] [CrossRef] [Scilit]
- Cheong, I.T.; Morrish, W.; Sheard, W.; Yu, H.-Y.; Luppi, B.-T.; Milburn, L.; Meldrum, A.; Veinot, J.G.C. Silicon Quantum Dot–Polymer Fabry–Pérot Resonators with Narrowed and Tunable Emissions. ACS Appl. Mater. Interfaces 2021, 13, 27149–27158. [Google Scholar] [CrossRef] [Scilit] [PubMed]
- Yang, J.; Chen, Y.; Rao, Z.-X.; Zheng, Z.-Y.; Song, C.-K.; Chen, Y.-J.; Xiong, K.-L.; Chen, P.-X.; Zhang, C.-F.; Wu, W.; et al. Tunable quantum dots in monolithic Fabry-Perot microcavities for high-performance single-photon sources. Light-Sci. Appl. 2024, 13, 33. [Google Scholar] [CrossRef] [Scilit] [PubMed]
- Surrow, J.; Thomsen, S.-T.; Kumar, R.-R.; Brusatori, M.-F.; Montes, M.-P.; Palsole, A.-S.; Hoede, C.; Klein, H.-N.; Volet, N. Ultra-narrow linewidth laser across the C-band using polarization-controlled dual-cavity feedback. Opt. Express 2025, 33, 11863–11875. [Google Scholar] [CrossRef] [Scilit] [PubMed]
- Gao, Y.; Yu, G.-N.; Wang, Y.; Dang, C.; Sum, T.-C.; Sun, H.-D.; Demir, H.-V. Green Stimulated Emission Boosted by Nonradiative Resonant Energy Transfer from Blue Quantum Dots. J. Phys. Chem. Lett. 2016, 7, 2772–2778. [Google Scholar]
- Tan, Y.; Fu, W.-Y.; Lin, H.-M.; Wu, D.; Sun, X.-W.; Choi, H.-W.; Wang, K. Low-threshold anisotropic polychromatic emission from monodisperse quantum dots. Natl. Sci. Rev. 2025, 12, 311. [Google Scholar]
- Hahm, D.; Kim, C.; Dang, T.-H.; Pinchetti, V.; Livache, C.; Klimov, V.-I. Low-threshold lasing from colloidal quantum dots under quasi-continuous-wave excitation. Nat. Photonics 2026, 20, 208–215. [Google Scholar]
- Dang, C.; Lee, J.; Breen, C.; Steckel, J.-S.; Coe-Sullivan, S.; Nurmikko, A. Red, green and blue lasing enabled by single-exciton gain in colloidal quantum dot films. Nat. Nanotechnol. 2012, 7, 335–339. [Google Scholar] [CrossRef] [Scilit] [PubMed]
- Ye, L.; Cheng, Z.; Zhang, Z.; Hong, S.; Zhao, Q. Coherent random fiber laser emission from CdSe/ZnS quantum dots. Nanotechnology 2024, 35, 505707. [Google Scholar] [CrossRef] [Scilit]
- Hyun, B.R.; Sher, C.-W.; Chang, Y.-W.; Lin, Y.-H.; Liu, Z.-J.; Kuo, H.-C. Dual Role of Quantum Dots as Color Conversion Layer and Suppression of Input Light for Full-Color Micro-LED Displays. J. Phys. Chem. Lett. 2021, 12, 6946–6954. [Google Scholar] [CrossRef] [Scilit] [PubMed]
- Ye, J.; Que, S.-H.; Lin, Y.-B.; Wei, L.-M.; Zhou, X.-T.; Guo, T.-L.; Sun, J.; Yan, Q.; Zhang, Y.-A.; Wu, C.-X. Color-tunable quantum-dot light emitting diode and its integration with GaN-based blue LED for smart white-light emission. Opt. Mater. 2022, 133, 113058. [Google Scholar] [CrossRef] [Scilit]
- Zheng, Y.; Chen, J.-C.; Li, W.-G.; Wang, C.; Peng, J.-B.; Wei, B.; Li, X.-F. Improved green thermal activated delayed fluorescence OLEDs based on thermally evaporated distributed Bragg reflector (DBR) of MgF2/ZnS. Nanotechnology 2021, 32, 455203. [Google Scholar] [CrossRef] [Scilit]
- Kedawat, G.; Srivastava, S.; Jain, V.-K.; Kumar, P.; Kataria, V.; Agrawal, Y.; Gupta, B.-K.; Vijay, Y.-K. Fabrication of Artificially Stacked Ultrathin ZnS/MgF2 Multilayer Dielectric Optical Filters. ACS Appl. Mater. Interfaces 2013, 5, 4872−4877. [Google Scholar] [CrossRef] [Scilit]
- Yang, H.; Liang, N.-N.; Wang, J.-Q.; Chen, R.-X.; Tian, R.-Q.; Xin, X.; Zhai, T.-R.; Hou, J.-H. Transfer-printing a surface-truncated photonic crystal for multi-function integrated photovoltaic window. Nano Energy 2023, 112, 108472. [Google Scholar] [CrossRef] [Scilit]
- Yu, W.; Cui, C.-C.; Li, H.-H.; Bian, S.-B.; Chen, X. FDTD-Based Study on Equivalent Medium Approximation Model of Surface Roughness for Thin Films Characterization Using Spectroscopic Ellipsometry. Photonics 2022, 9, 621. [Google Scholar] [CrossRef] [Scilit]
Disclaimer/Publisher’s Note: The statements, opinions and data contained in all publications are solely those of the individual author(s) and contributor(s) and not of MDPI and/or the editor(s). MDPI and/or the editor(s) disclaim responsibility for any injury to people or property resulting from any ideas, methods, instructions or products referred to in the content. |
© 2026 by the authors. Licensee MDPI, Basel, Switzerland. This article is an open access article distributed under the terms and conditions of the Creative Commons Attribution (CC BY) license.