


Abstract
Ptychography implemented with coherent high-harmonic (HHG) sources enables high-resolution, high-fidelity imaging of nanostructures and biosystems. However, when driven by mid-infrared lasers to generate light at higher photon energies, HHG inherently produces a broadband quasi-continuum, which is less suited for coherent imaging compared with a single harmonic order. Consequently, experiments typically select a narrow bandwidth of ≈1%, leaving most of the HHG photons unused, increasing exposure times. In this work, we demonstrate broadband ptychography utilizing an extreme UV (EUV) continuum centered at 92 eV, with a bandwidth of up to 7.9 eV (a relative bandwidth of ~9%). By focusing the HHG beam to a sub-micrometer spot size to relax the temporal coherence constraints, and utilizing a multi-wavelength ptychographic reconstruction algorithm, we achieve a spatial resolution of 42 nm, which is near the diffraction limit of ~30 nm for our setup. To the best of our knowledge, this represents the broadest spectral bandwidth successfully employed to date for EUV ptychography, with the potential to increase the usable photon flux by up to an order of magnitude relative to previous approaches. In the future, broadband soft X-ray ptychography can be used to image hydrated samples around the carbon K-edge and magnetic textures at the L-edges of transition metals.
1. Introduction
Advances in ultrafast laser technology catalyzed the development of high-coherence, high-brightness, high-harmonic generation (HHG) sources [1], spanning the extreme ultraviolet (EUV) [2] and soft X-ray spectral ranges [3,4,5]. The exceptional spatial coherence of HHG radiation [1] enables multiple high-fidelity coherent lensless imaging modalities using tabletop-scale setups. In particular, coherent diffractive imaging (CDI) has developed rapidly in recent years [6]. In a typical CDI experiment, an object is illuminated with coherent radiation, and the resulting diffraction pattern is recorded. The complex phase and amplitude of light scattered from the object are subsequently reconstructed using iterative phase retrieval algorithms [7,8,9].
Ptychography is a powerful, scanning-based variant of CDI that enables the study of extended samples [10,11,12,13,14]. In ptychography, a localized beam, commonly referred to as the probe, scans the object, recording diffraction patterns at overlapping positions. Each position mixes the scattered phase and amplitude differently, allowing for robust and reliable reconstruction of both the object’s complex-valued transmission function and the probe’s complex field. Combining compact HHG sources with ptychography thus enables high-resolution, lab-scale imaging in both reflection and transmission in the EUV and soft X-ray regimes [15,16]. Recent demonstrations of sub-wavelength imaging at 13.5 nm [17] and sub-20 nm half-pitch resolution [18] highlight the potential of this technique for a wide array of applications, including the study of microbiological specimens [19,20] and high-resolution imaging with ultrafast temporal resolution [21]. Furthermore, EUV ptychography in a reflection geometry [22,23] provides access to key sample properties such as surface topography, roughness, and material composition [15,24], making it a promising approach for the characterization of critical lithography components [25,26,27,28] and surfaces [29].
Despite this progress, to date, HHG CDI has been restricted to the EUV range, as soft X-ray HHG sources are not as bright as in the EUV, due primarily to the lower level of performance and maturity of the ultrafast mid-infrared lasers required to generate soft X-ray HHG. Nevertheless, this spectral region is promising for applications such as imaging biological samples in aqueous environments (below or within the water window, which spans from 280 eV to 530 eV) [30,31] and investigating magnetic materials at the L-edges of transition metals (e.g., iron at 700 eV) [32,33,34]. HHG radiation is inherently broadband, typically manifesting either as a series of discrete odd harmonics of the driving laser (a comb-like spectrum) or as a broad supercontinuum. Phase-matched, optimally bright soft X-ray HHG requires the use of few-cycle duration mid-infrared (IR) lasers, with the resulting HHG spectra exhibiting a continuous spectral distribution [35,36] for two reasons. First, the long driving wavelengths required to reach these photon energies result in narrower spacing between adjacent harmonics. Second, the short phase-matching temporal window reduces the bright emission to a small number of (or a single) broadband attosecond-duration bursts, merging the individual harmonic peaks into a continuum that can span multiple octaves [4]. This inherent bandwidth poses a significant challenge to the temporal coherence (i.e., bandwidth) requirements of ptychography [37].
Specifically, broadband radiation induces radial blurring of the diffraction patterns, as the optical path difference between two interfering rays at the detector must not exceed the temporal coherence length of the source. Consequently, high spatial frequencies, corresponding to larger diffraction angles, experience more pronounced blurring than low spatial frequencies. To account for this effect, a theoretical limit for the achievable spatial resolution, Δr, can be formulated as a function of the spectral bandwidth and the beam size [37]:
where Δλ/λ denotes the relative bandwidth, and D represents the beam diameter. The parameter α is not present in the original equation [37]: we have included it here to relax this equation, as previous observations suggest the original formulation is overly restrictive [38]. The parameter α characterizes the proportional relationship between the relative bandwidth and the ratio of spatial resolution to beam size. Higher values of α signify that high-resolution ptychographic reconstructions remain viable even in the presence of significant spectral bandwidth. Notably, α is not a universal constant; it is sensitive to specific experimental conditions, most notably the wavefront of the probe [39]. Defining the beam diameter D is challenging for aberrated or intentionally structured EUV beams. Consequently, we employ the D4σ value, as it accounts for the majority of the beam’s energy and provides a standardized metric that avoids the use of arbitrary intensity thresholds. Further details regarding the calculation of the D4σ value are provided in the Supplementary Materials.
Due to the stringent temporal coherence requirements of ptychography, standard HHG-based setups typically employ multilayer (ML) mirrors to isolate a single harmonic or a narrow bandwidth. With a bandwidth of approximately 1%, this leaves the majority of the HHG photon flux unused. Consequently, developing strategies to utilize a larger portion of the HHG spectrum is highly desirable to increase the usable photon flux. This is particularly critical for the soft X-ray region, where HHG sources generally exhibit lower brightness compared to their EUV counterparts due to energy and/or repetition rate limitations of available mid-infrared drive lasers. Promising solutions include the implementation of advanced reconstruction algorithms that incorporate broadband spectra [40,41,42,43], numerical monochromatization of the diffraction patterns [44,45], or advanced experimental realizations [46,47,48]. While previous broadband ptychography experiments have successfully utilized comb-like HHG spectra to achieve quantitative reconstructions of both the probe and the object [49,50], these studies have primarily focused on recovering the spectrum of the illuminating beam [51,52,53]. In contrast to coherent diffractive imaging modalities that demand narrow bandwidths, EUV and soft X-ray coherence tomography thrives on broadband HHG radiation [54,55,56], enabling nanometer-scale axial resolution. To date, however, its lateral resolution remains largely limited to the micrometer scale.
Here, we demonstrate broadband ptychography using an EUV continuum with a bandwidth of up to 9%, achieving a half-pitch resolution of 42 nm, which is near the diffraction limit of ~30 nm for our setup. To the best of our knowledge, this represents the broadest EUV continuum used in ptychography to date. Furthermore, the spatial resolution shows no significant degradation compared to measurements taken at 3% bandwidth.
This advancement was facilitated by strongly focusing the EUV beam to a sub-micrometer spot (820 nm × 760 nm, FWHM) using an ellipsoidal mirror. The use of a 9% relative bandwidth significantly increases the usable flux compared to state-of-the-art HHG-based ptychography systems, which typically operate with bandwidths of approximately 1% [17,18]. Ultimately, our findings can help enable high-resolution imaging in the soft X-ray range, where HHG sources naturally emerge as a broadband continuum.
2. Broadband Ptychography Setup
2.1. Experimental Setup
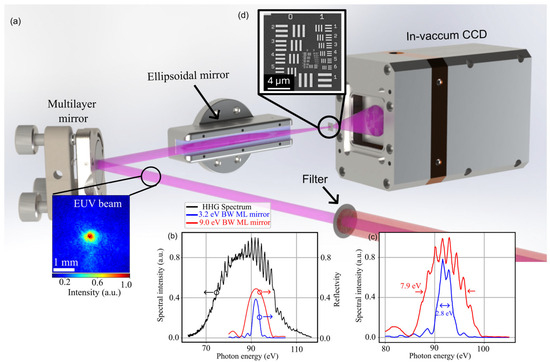
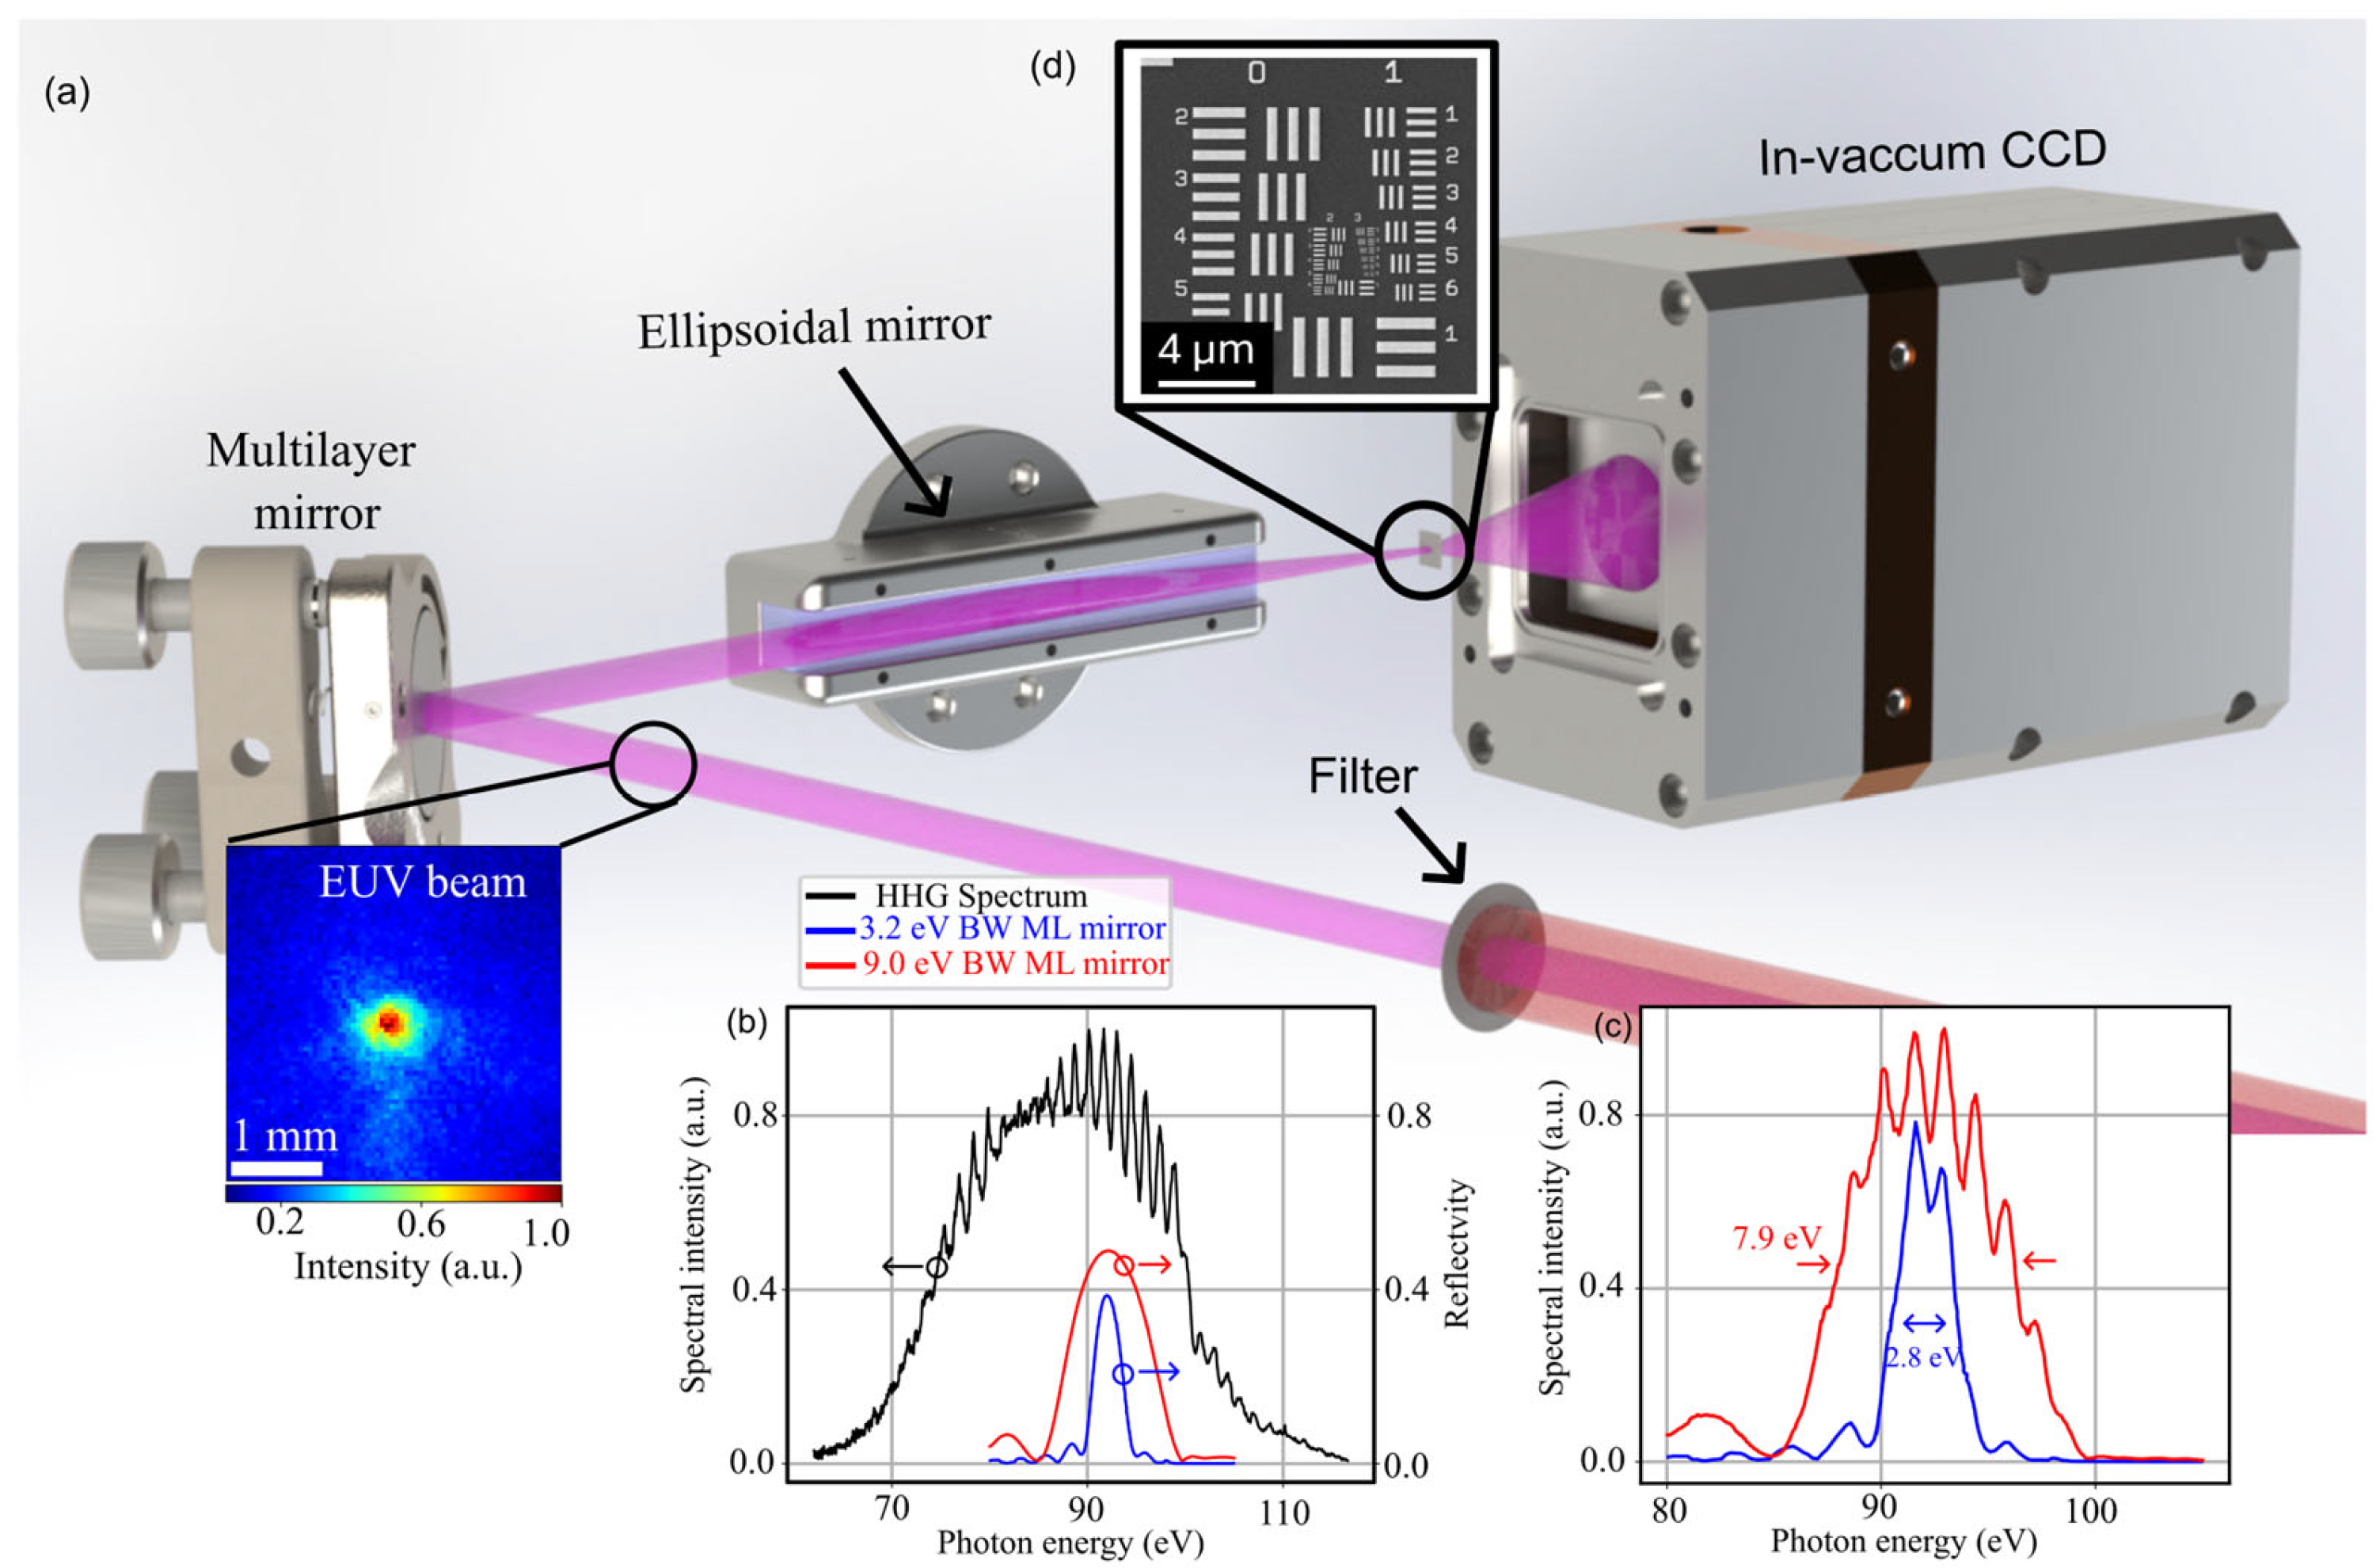
The HHG source employed in this work follows a configuration previously described in [35] and is illustrated in Figure 1a. Briefly, an Optical Parametric Chirped-Pulse Amplifier (OPCPA) delivers <100 fs pulses at a central wavelength of 1.58 μm, with a pulse energy >2 mJ at a 1 kHz repetition rate. For this study, an infrared pulse energy of 1.6 mJ is coupled into a simple capillary waveguide with a 150 μm inner diameter and a length of 21 mm, filled with 0.8 bar of argon from a single inlet hole 4 mm from the back side. Downstream from the waveguide, an in-vacuum iris is used to eliminate unwanted scattered EUV light, which is present due to the non-ideal phase matching that occurs in a pressure gradient. We note that this is not present for 13.5 nm HHG driven in a full phase-matched geometry, using shorter ~30 fs driving laser pulses [17,57]. The residual IR laser beam is blocked using two 100 nm thick zirconium filters and a single 200 nm zirconium filter. The resulting spectrum, shown in Figure 1b, consists of a broad EUV continuum spanning from approximately 70 eV to 110 eV.
Figure 1.
(a) Schematic layout of the EUV ptychography setup. An EUV beam (purple) is generated by high-order harmonic generation in a gas-filled waveguide. Subsequently, the EUV radiation is isolated from the driving IR beam using Zr filters. An ML mirror selects either a narrowband or broadband window from the EUV continuum. An ellipsoidal mirror images the source plane onto the sample. The resulting diffraction patterns are captured by an in-vacuum CCD positioned 60 mm downstream of the sample. (b) Measured HHG continuum spectrum plotted alongside the reflectivity curves of the two available ML reflectivities with 3.2 eV FWHM and 9.0 eV FWHM bandwidth. As indicated by the arrows, the reflectivity of the ML mirrors is plotted on the right y-axis, while the spectral intensity of the HHG spectrum is shown on the left y-axis. (c) Resultant spectra incident on the sample, calculated by the product of the raw HHG spectrum and the respective ML mirror reflectivities. (d) SEM (scanning electron microscopy) of the sample, which consists of a miniaturized USAF1951 target.
To select specific energy windows from the continuum, two different EUV ML mirrors (NTT-AT) were used: a narrowband (3.2 eV FWHM, ~40% peak reflectivity, MoSi2/Si ML coating, Figure 1b) and a broadband (9.0 eV FWHM, ~50% peak reflectivity, Mo/Si ML coating, Figure 1c). Both mirrors are designed for a 45° incidence angle at a central wavelength of 13.5 nm (92 eV). The beam is reflected at this angle toward an ellipsoidal mirror. The multiplication of the HHG spectrum and the ML-mirror reflectivity results in effective FWHM bandwidths of 2.8 eV and 7.9 eV on the sample for the narrowband and broadband mirrors, respectively, corresponding to relative bandwidths of 3% and 9%. It is worth noting that both bandwidths of 3% and 9% exceed those typically employed in EUV ptychography. Consequently, spectral bandwidth effects are expected to manifest in the reconstructions for both cases.
The ellipsoidal mirror images the source plane, located at the waveguide exit, onto the sample (USAF1951 resolution test chart, Figure 1d) and is positioned 1.5 m behind the waveguide (object arm) and 67.5 mm in front of the sample (image arm). This configuration yields a demagnification factor of 22×, enabling a sub-micrometer focal spot size on the sample. This small spot size is a critical component of the experiment, as indicated by Equation (1), because it mitigates the effects of temporal incoherence, allowing for increased bandwidth without compromising spatial resolution. Furthermore, the high-illumination NA is beneficial for ptychographic reconstructions [58]. Minor misalignments, which are often unavoidable, as well as surface imperfections of the ellipsoidal mirror, introduce aberrations that result in a structured illumination probe; such a structure, in combination with the high illumination NA, is known to improve the convergence of reconstruction algorithms [59,60,61,62].
The sample used in this study is a USAF1951 target (Applied Nanotools, Edmonton, AB, Canada) with a minimum nominal half-pitch feature size of 35 nm. Diffraction patterns are collected by an in-vacuum CCD (Princeton Instruments MTE2, Waterloo, ON, Canada) camera positioned 60 mm behind the sample, providing a detector NA of 0.22 and a theoretical diffraction-limited half-pitch resolution of 30 nm.
2.2. Ptychography Reconstructions
To reconstruct both the narrowband and broadband diffraction patterns, we employ a single-wavelength (SW) and a multi-wavelength (MW) approach. The SW reconstructions are performed using the mPIE algorithm [63] with six mixed-state modes [64]. The use of multiple modes is necessitated by the excitation of several EUV modes within the waveguide resulting from HHG within a pressure gradient, as is the case here. Further details on the reconstructed mixed-state modes can be found in the Supplementary Materials. In addition, a multi-wavelength (MW) algorithm is utilized [41]. This approach assumes the object to be non-dispersive over the investigated bandwidth, a valid assumption in the EUV regime for the spectral ranges considered here, provided they remain sufficiently far from absorption edges. For the MW reconstructions using the 3% bandwidth spectrum, the spectrum is numerically sampled at five discrete wavelengths ranging from 13.2 nm to 13.8 nm. Similarly, the 9% bandwidth reconstructions utilize five sampling wavelengths ranging from 12.6 nm to 14.4 nm. Analogous to the SW reconstructions, six mixed-state modes are assigned to each wavelength.
While the results presented here were obtained using the Python implementation of the PtyLab framework [65], comparative reconstructions were also performed using Ms. Pacman [42], a multispectral algorithm based on the difference map [66] and maximum-likelihood [67] algorithms. Both frameworks yield comparable results, confirming the robustness of the reconstruction.
3. Broadband EUV Ptychography
3.1. Reconstructions with 3% Bandwidth
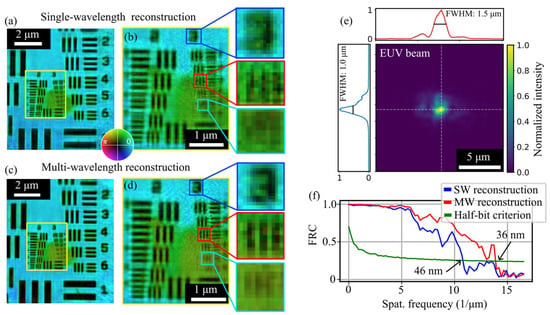
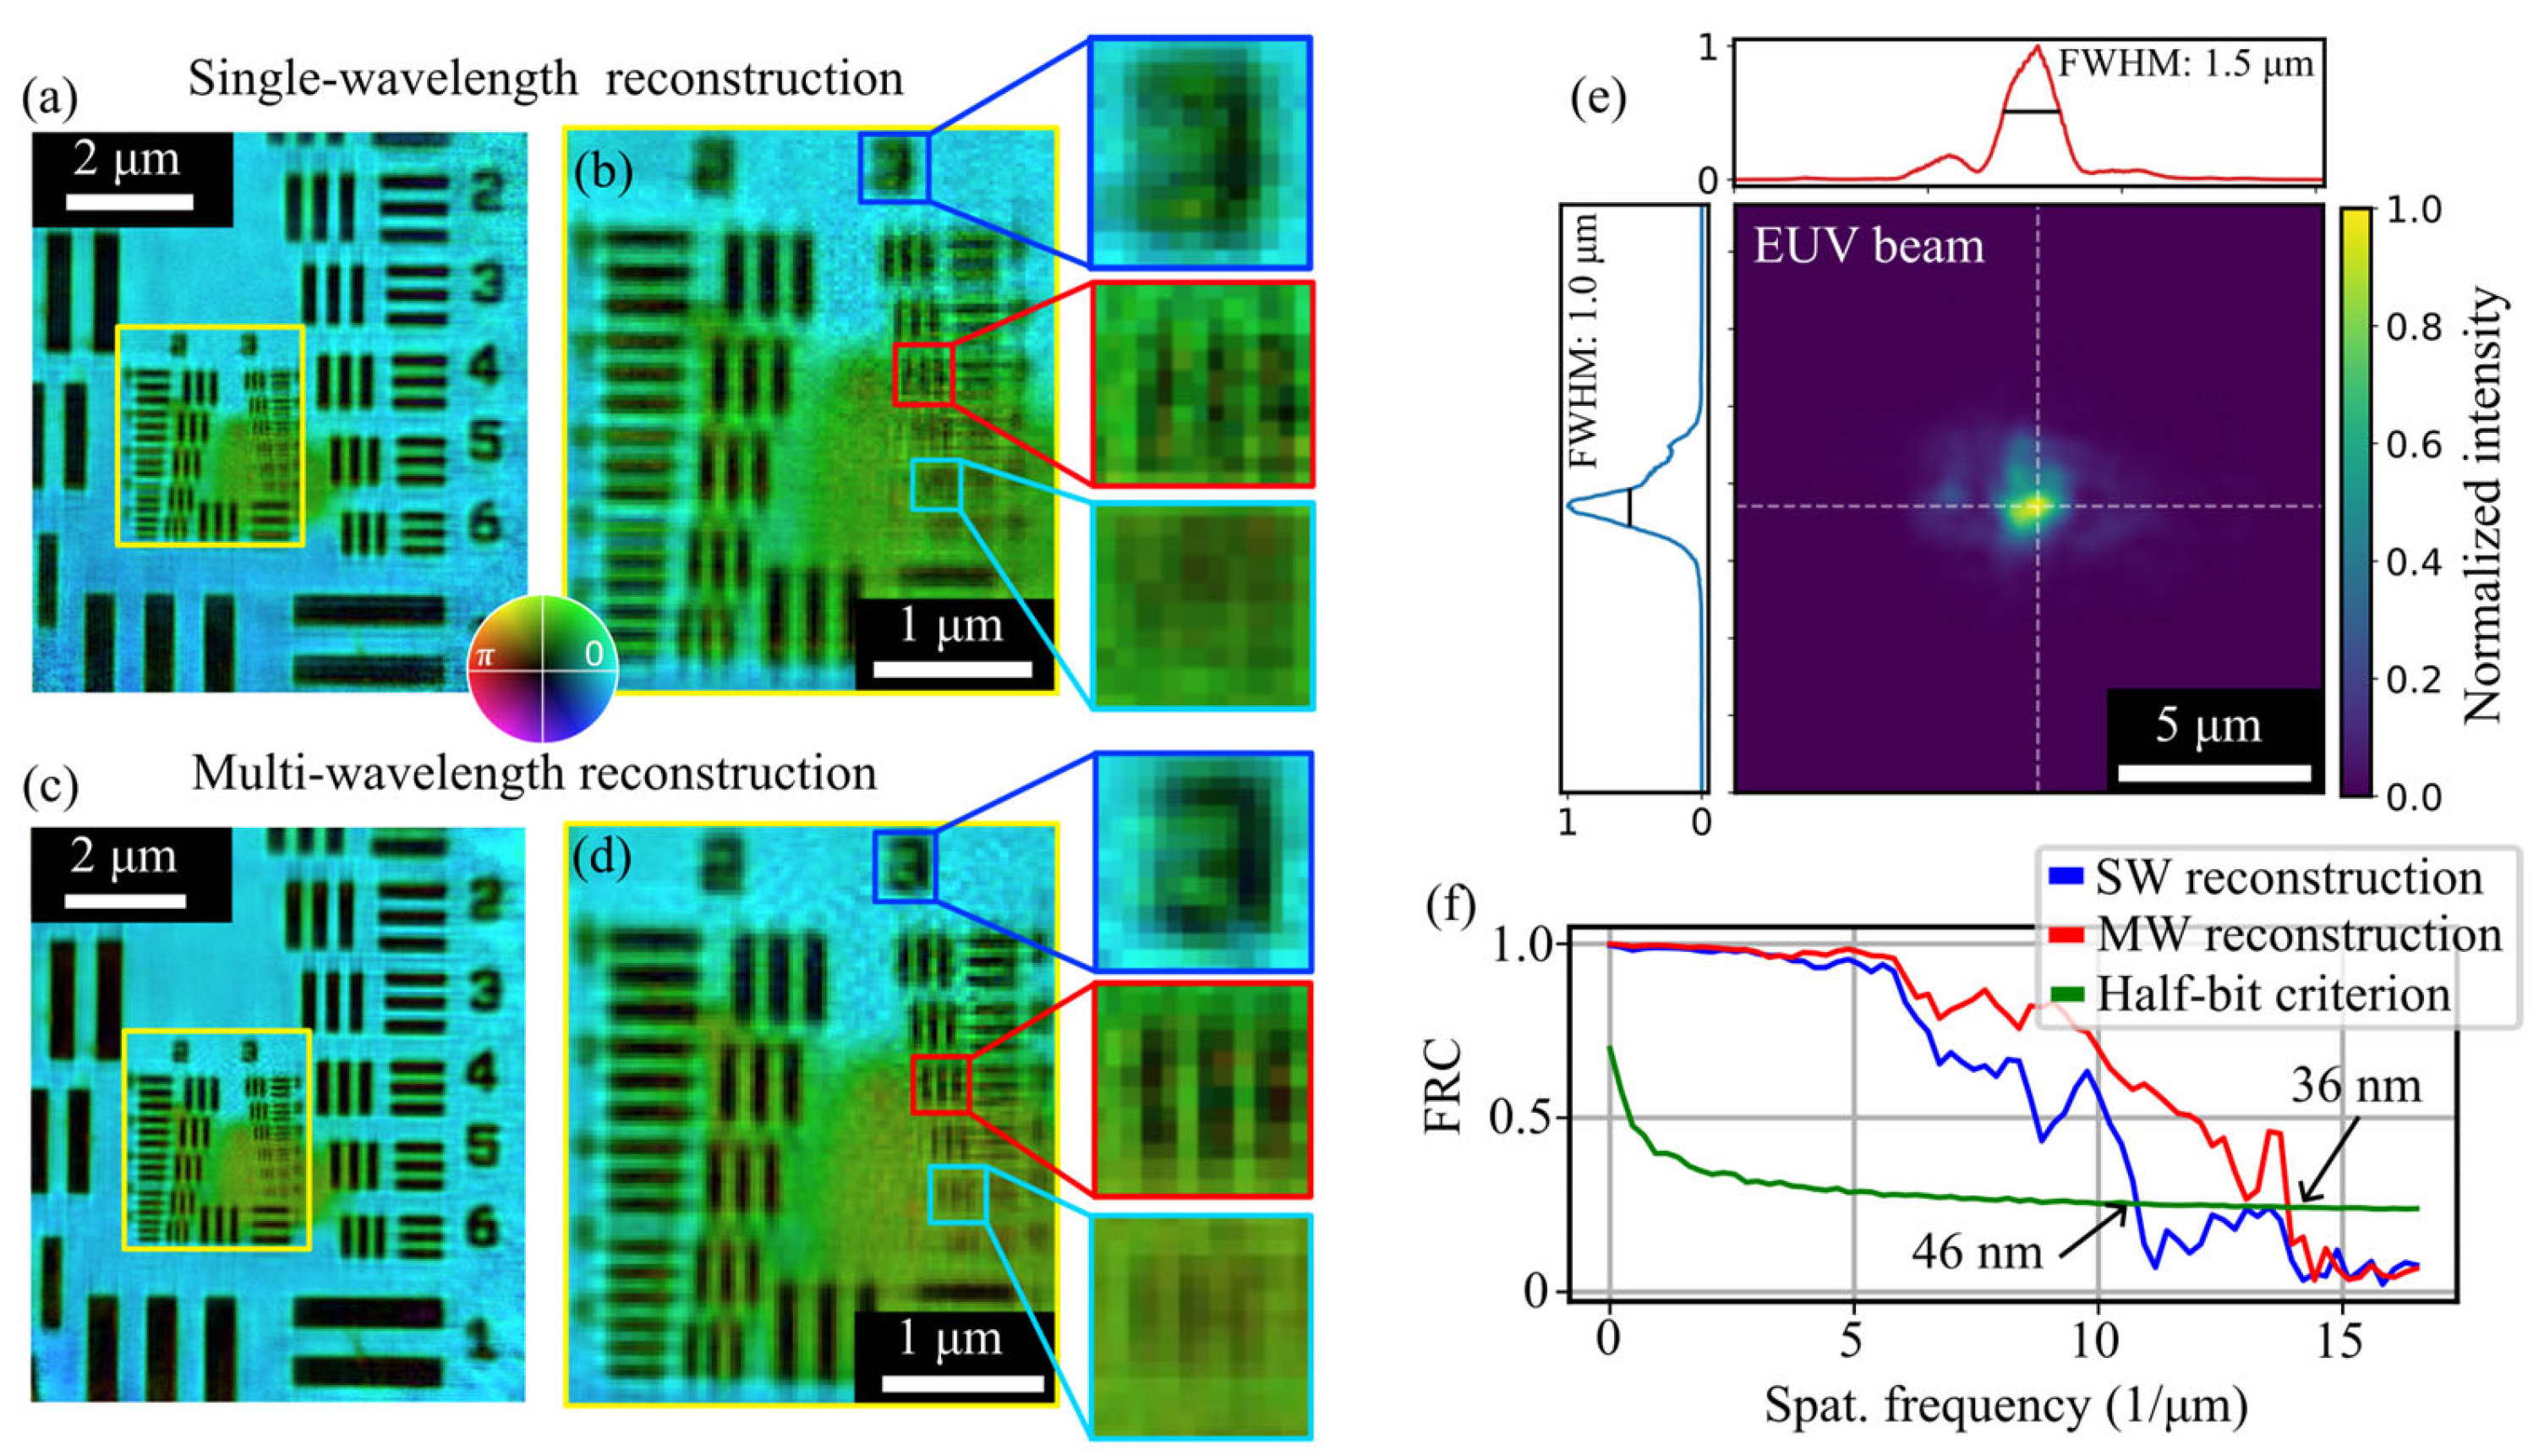
To investigate the influence of spectral bandwidth on ptychography, high-resolution measurements are conducted for both the narrow-band (3% bandwidth) and broadband (9% bandwidth) spectra. Figure 2 summarizes the reconstructions obtained using a narrow-band mirror (2.8 eV FWHM bandwidth at the sample). The sample is positioned in the focal plane of the ellipsoidal mirror; the resulting SW reconstructions are shown in Figure 2a,b. Details on the measurement settings are given in Table S1 of the Supplementary Materials. Features with a 50 nm half-pitch (Group 3, Element 3; Figure 2b) are clearly resolved. The resolution is estimated using the Fourier ring correction (FRC) [68]. For this purpose, a second ptychography measurement with identical settings is carried out. The resulting FRC suggests a half-pitch resolution of 46 nm (Figure 2f). However, some features, such as the digit “3,” appear smeared.
Figure 2.
Ptychography reconstructions of the USAF1951 target using 3% bandwidth spectrum at 92 eV. (a) Reconstruction obtained using the SW algorithm. (b) Magnified view of the region indicated in (a). (c) Reconstruction utilizing the MW algorithm. (d) Magnified view of the region indicated in (c), highlighting the improvement in image contrast and detail. (e) Incoherent sum of the reconstructed mixed-state modes for the central wavelength probe, corresponding to the MW reconstruction in (c). (f) Fourier Ring Correlation (FRC) curves for the SW and MW reconstructions; the half-bit criterion indicates a half-pitch resolution of 46 nm for the SW approach and an improved resolution of 36 nm for the MW algorithm. The brightness and hue of (a–d) encode modulus and phase, respectively.
In contrast, the MW reconstruction, shown in Figure 2c,d, demonstrates significantly improved image quality. It resolves features down to a 40 nm half-pitch (Group 3, Element 5; Figure 2d), consistent with the FRC-calculated resolution of 36 nm, which is near the diffraction limit of 30 nm. The reconstructed probe intensity is shown in Figure 2e, representing the incoherent sum of the mixed-state modes at the central wavelength (13.5 nm). The probe measures 1.5 μm × 1.0 μm (FWHM) and exhibits slight aberrations, resulting in various fine structures. In both reconstructions (Figure 2b,d), a distinct phase shift is observed at the center of the USAF target. This is attributed to carbon contamination resulting from a high-resolution scanning electron microscopy (SEM) measurement performed prior to the EUV experiments and is consistently observed in all reconstructed images.
3.2. Reconstructions with 9% Bandwidth
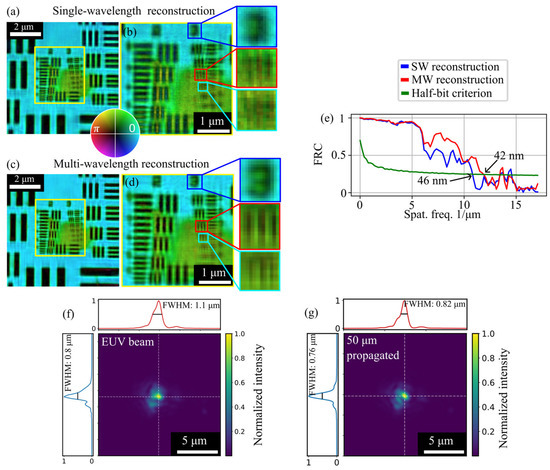
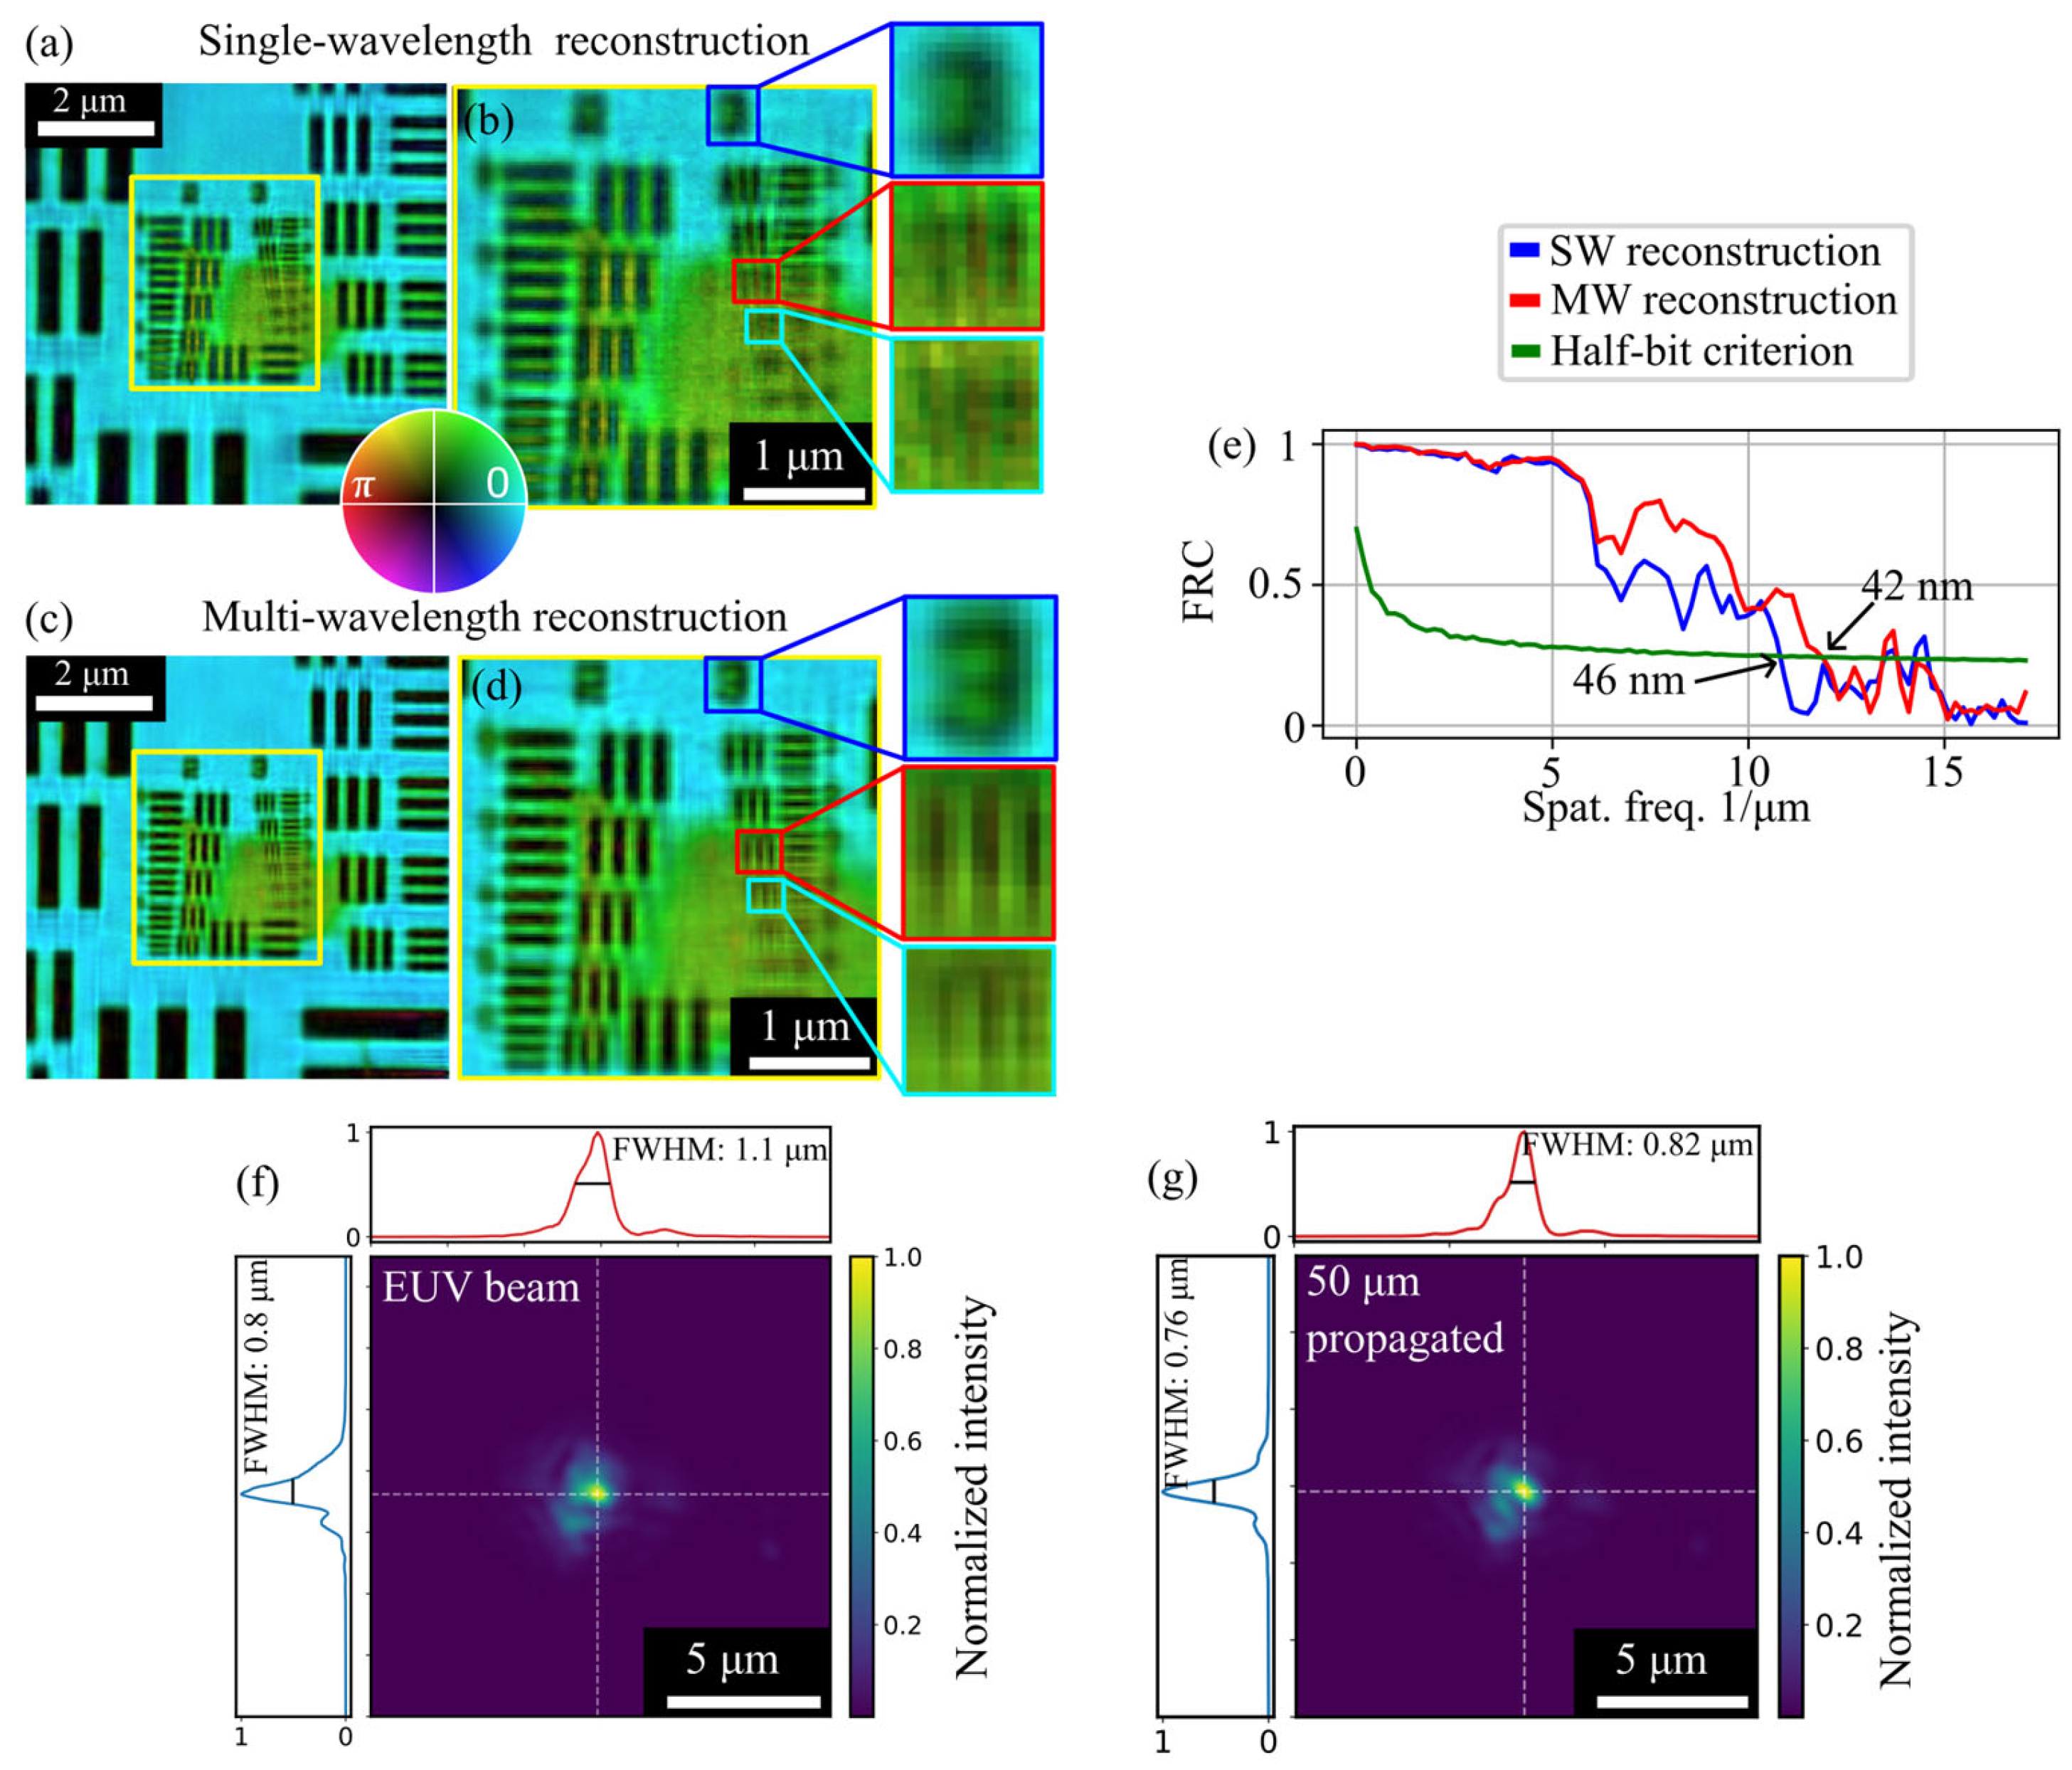
Figure 3 presents the reconstructions obtained using the broadband spectrum (7.9 eV FWHM bandwidth on the sample). Despite the 2.8-fold increase in spectral bandwidth, the SW reconstruction achieves a half-pitch resolution of 46 nm (determined via FRC), which agrees well with the visually resolved 50 nm features (Group 3, Element 3; Figure 3b). Moreover, by employing the MW algorithm, the resolution improves to 42 nm. The resulting reconstructions (Figure 3b,d) exhibit significantly enhanced image quality, as evidenced by the clearly resolved digit ‘3’. Furthermore, structures with a 44 nm half-pitch (Group 3, Element 4; Figure 3d) are successfully resolved, which is consistent with the FRC-based resolution estimate. The reconstructed probe intensity, representing the incoherent sum of the mixed-state modes at the central wavelength (13.5 nm) of the MW reconstruction, is shown in Figure 3f. Notably, in contrast to the narrowband measurements of Figure 2, here the sample was placed slightly out of focus, resulting in a beam diameter of 1.1 μm × 0.8 μm (FWHM). Numerically propagating the probe 50 μm to the focal plane reveals a focal spot of 760 nm × 820 nm (FWHM), demonstrating the excellent focusing and alignment of the ellipsoidal mirror and HHG source. We note that the focal spot achieved with the narrowband mirror is substantially larger than for the broadband mirror, due to better alignment of the ellipsoidal mirror in the latter case.
Figure 3.
Ptychography reconstructions of the USAF1951 target using the broadband spectrum. (a) Reconstruction obtained using the SW algorithm. (b) Magnified view of the region indicated in (a). (c) Reconstruction utilizing the MW algorithm. (d) Magnified view of the region indicated in (c). (e) Fourier ring correlation for the SW and MW reconstructions; the half-bit criterion indicates a half-pitch resolution of 46 nm for the SW reconstruction and 42 nm for the MW reconstruction. (f) Incoherent sum of the reconstructed mixed-state modes for the central wavelength probe, corresponding to the MW reconstruction in (c). (g) EUV beam from f propagated 50 µm towards the detector, yielding 820 nm × 760 nm spot size.
4. Influence of Beam Size
4.1. Beam Size Scan Using the 3% BW Spectrum
According to Equation (1), the achievable spatial resolution for a given bandwidth depends directly on the illuminating beam size. To investigate this relationship, we conduct systematic measurements evaluating the influence of beam size on resolution. These results confirm that a small beam is essential for maintaining high resolution in ptychography when using broadband radiation.
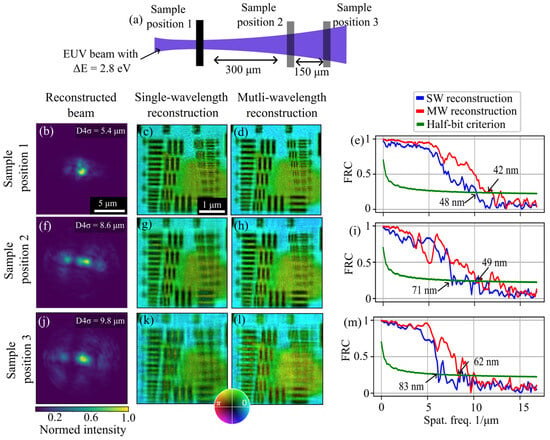
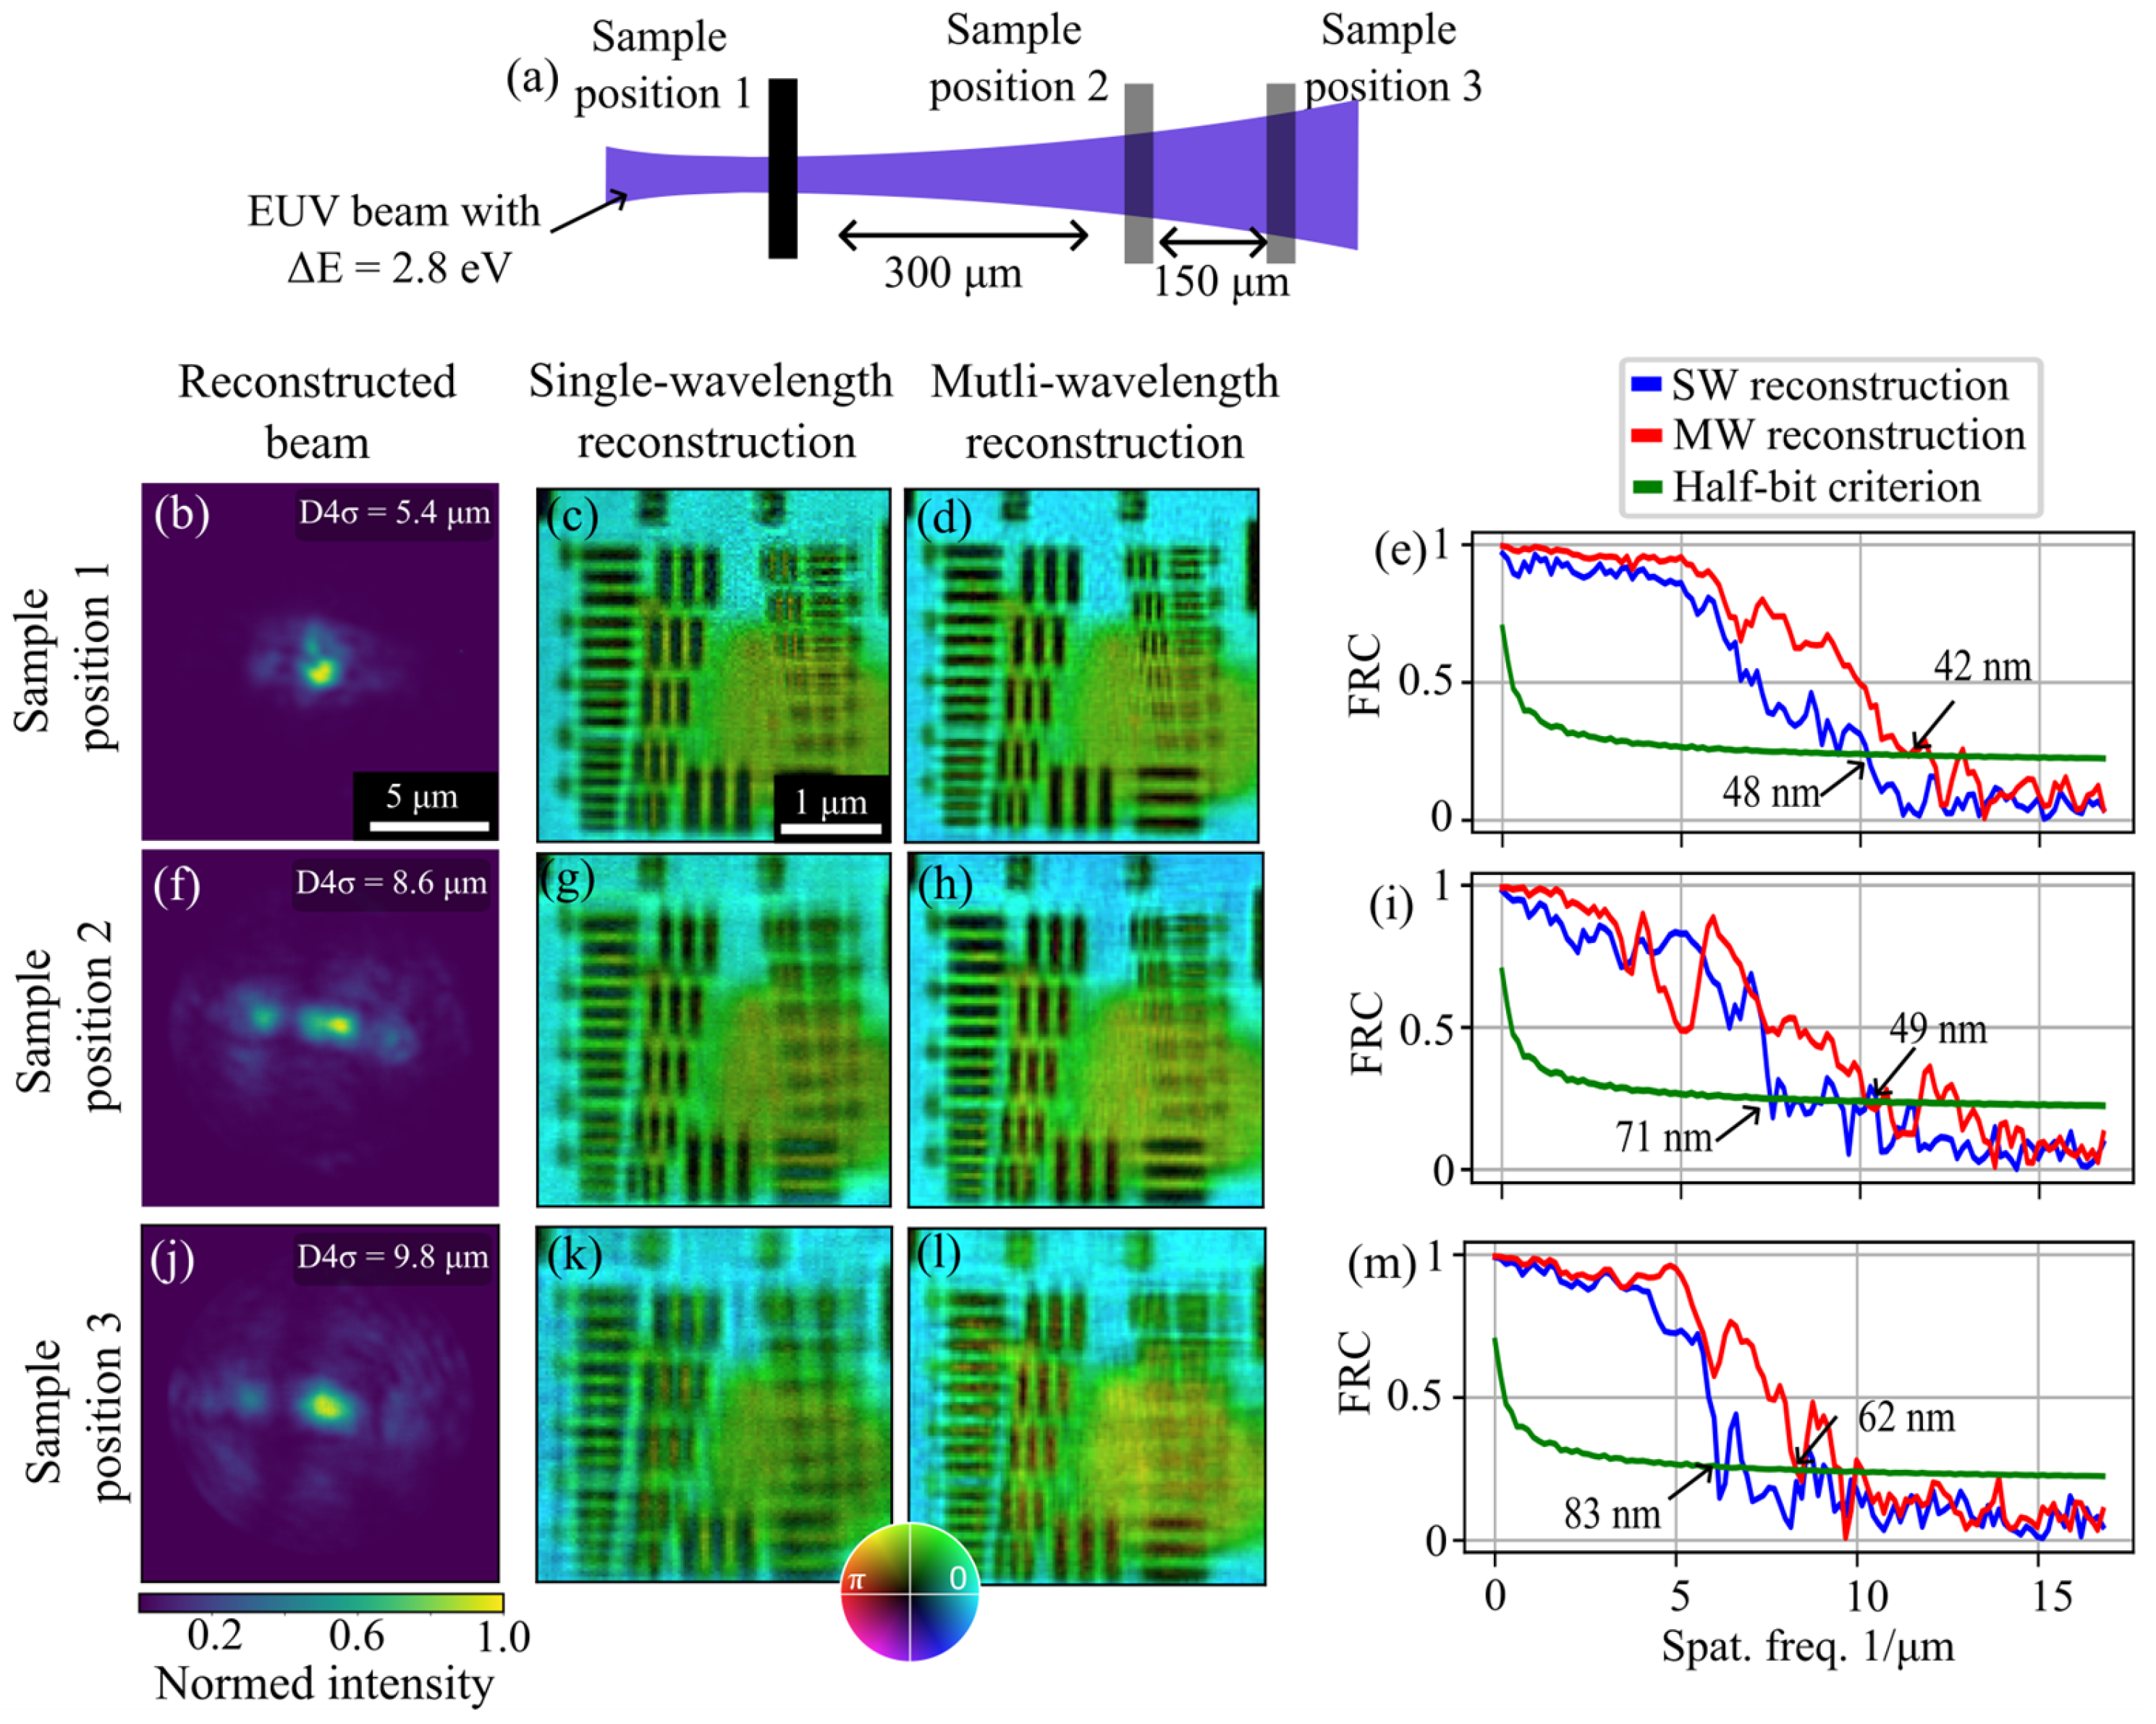
Measurements are performed for both available bandwidths by positioning the sample at various z-positions along the EUV beam path: at the focal plane and at distances of 300 µm and 450 µm downstream (see Figure 4a). Detailed measurement parameters are provided in Supplementary Materials. To characterize the beam size at these positions, we utilize the D4σ (second-moment) diameter. This metric was chosen because the FWHM proved unsuitable due to the significant aberrations present in the defocused beam profiles. Further details on the D4σ calculation are available in the Supplementary Materials.
Figure 4.
Beam size scan using a 2.8 eV bandwidth EUV beam. (a) Schematic of the beam size scan, illustrating sample placement at various defocused positions. (b–e) EUV beam profile, SW reconstruction, MW reconstruction, and FRC at the focal plane (z = 0). (f–i) Corresponding data for the sample placed 300 µm behind the focal plane. (j–m) Corresponding data for the sample placed 450 µm behind the focal plane.
The results obtained with the narrowband mirror are shown in Figure 4. At each position, diffraction patterns were reconstructed using both the SW and MW algorithms. The D4σ value, averaged over both transverse axes, was 5.4 µm at the focal plane (Figure 4b), increasing to 9.8 µm at a defocus of 450 µm (Figure 4j).
As predicted by Equation (1), increasing the beam size degrades the resolutions to 83 nm and 62 nm for the SW and MW reconstructions, respectively. To quantify this degradation, we determine the half-pitch resolution for all positions using the FRC. For the SW algorithm, the resolution worsened from 48 nm at the focus (Figure 4c) to 83 nm at the 450 µm defocus position (Figure 4k). While the MW algorithm provides a superior overall resolution, it exhibits a similar performance decay with increasing beam size, reaching 62 nm resolution at the furthest position (Figure 4l). These findings indicate that while the MW algorithm mitigates broadband effects, it cannot fully compensate for them as the beam size increases. This is consistent with previous observations [41].
4.2. Beamsize Scan Using the 9% BW Spectrum
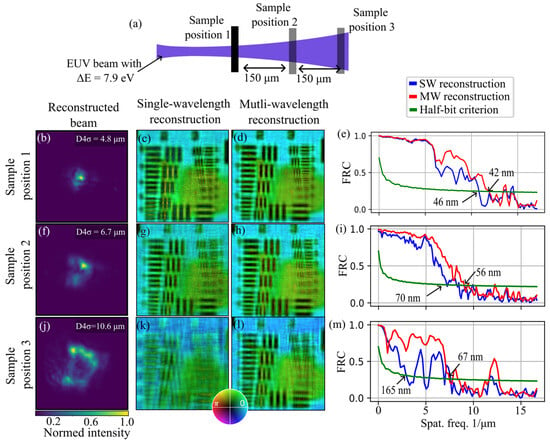
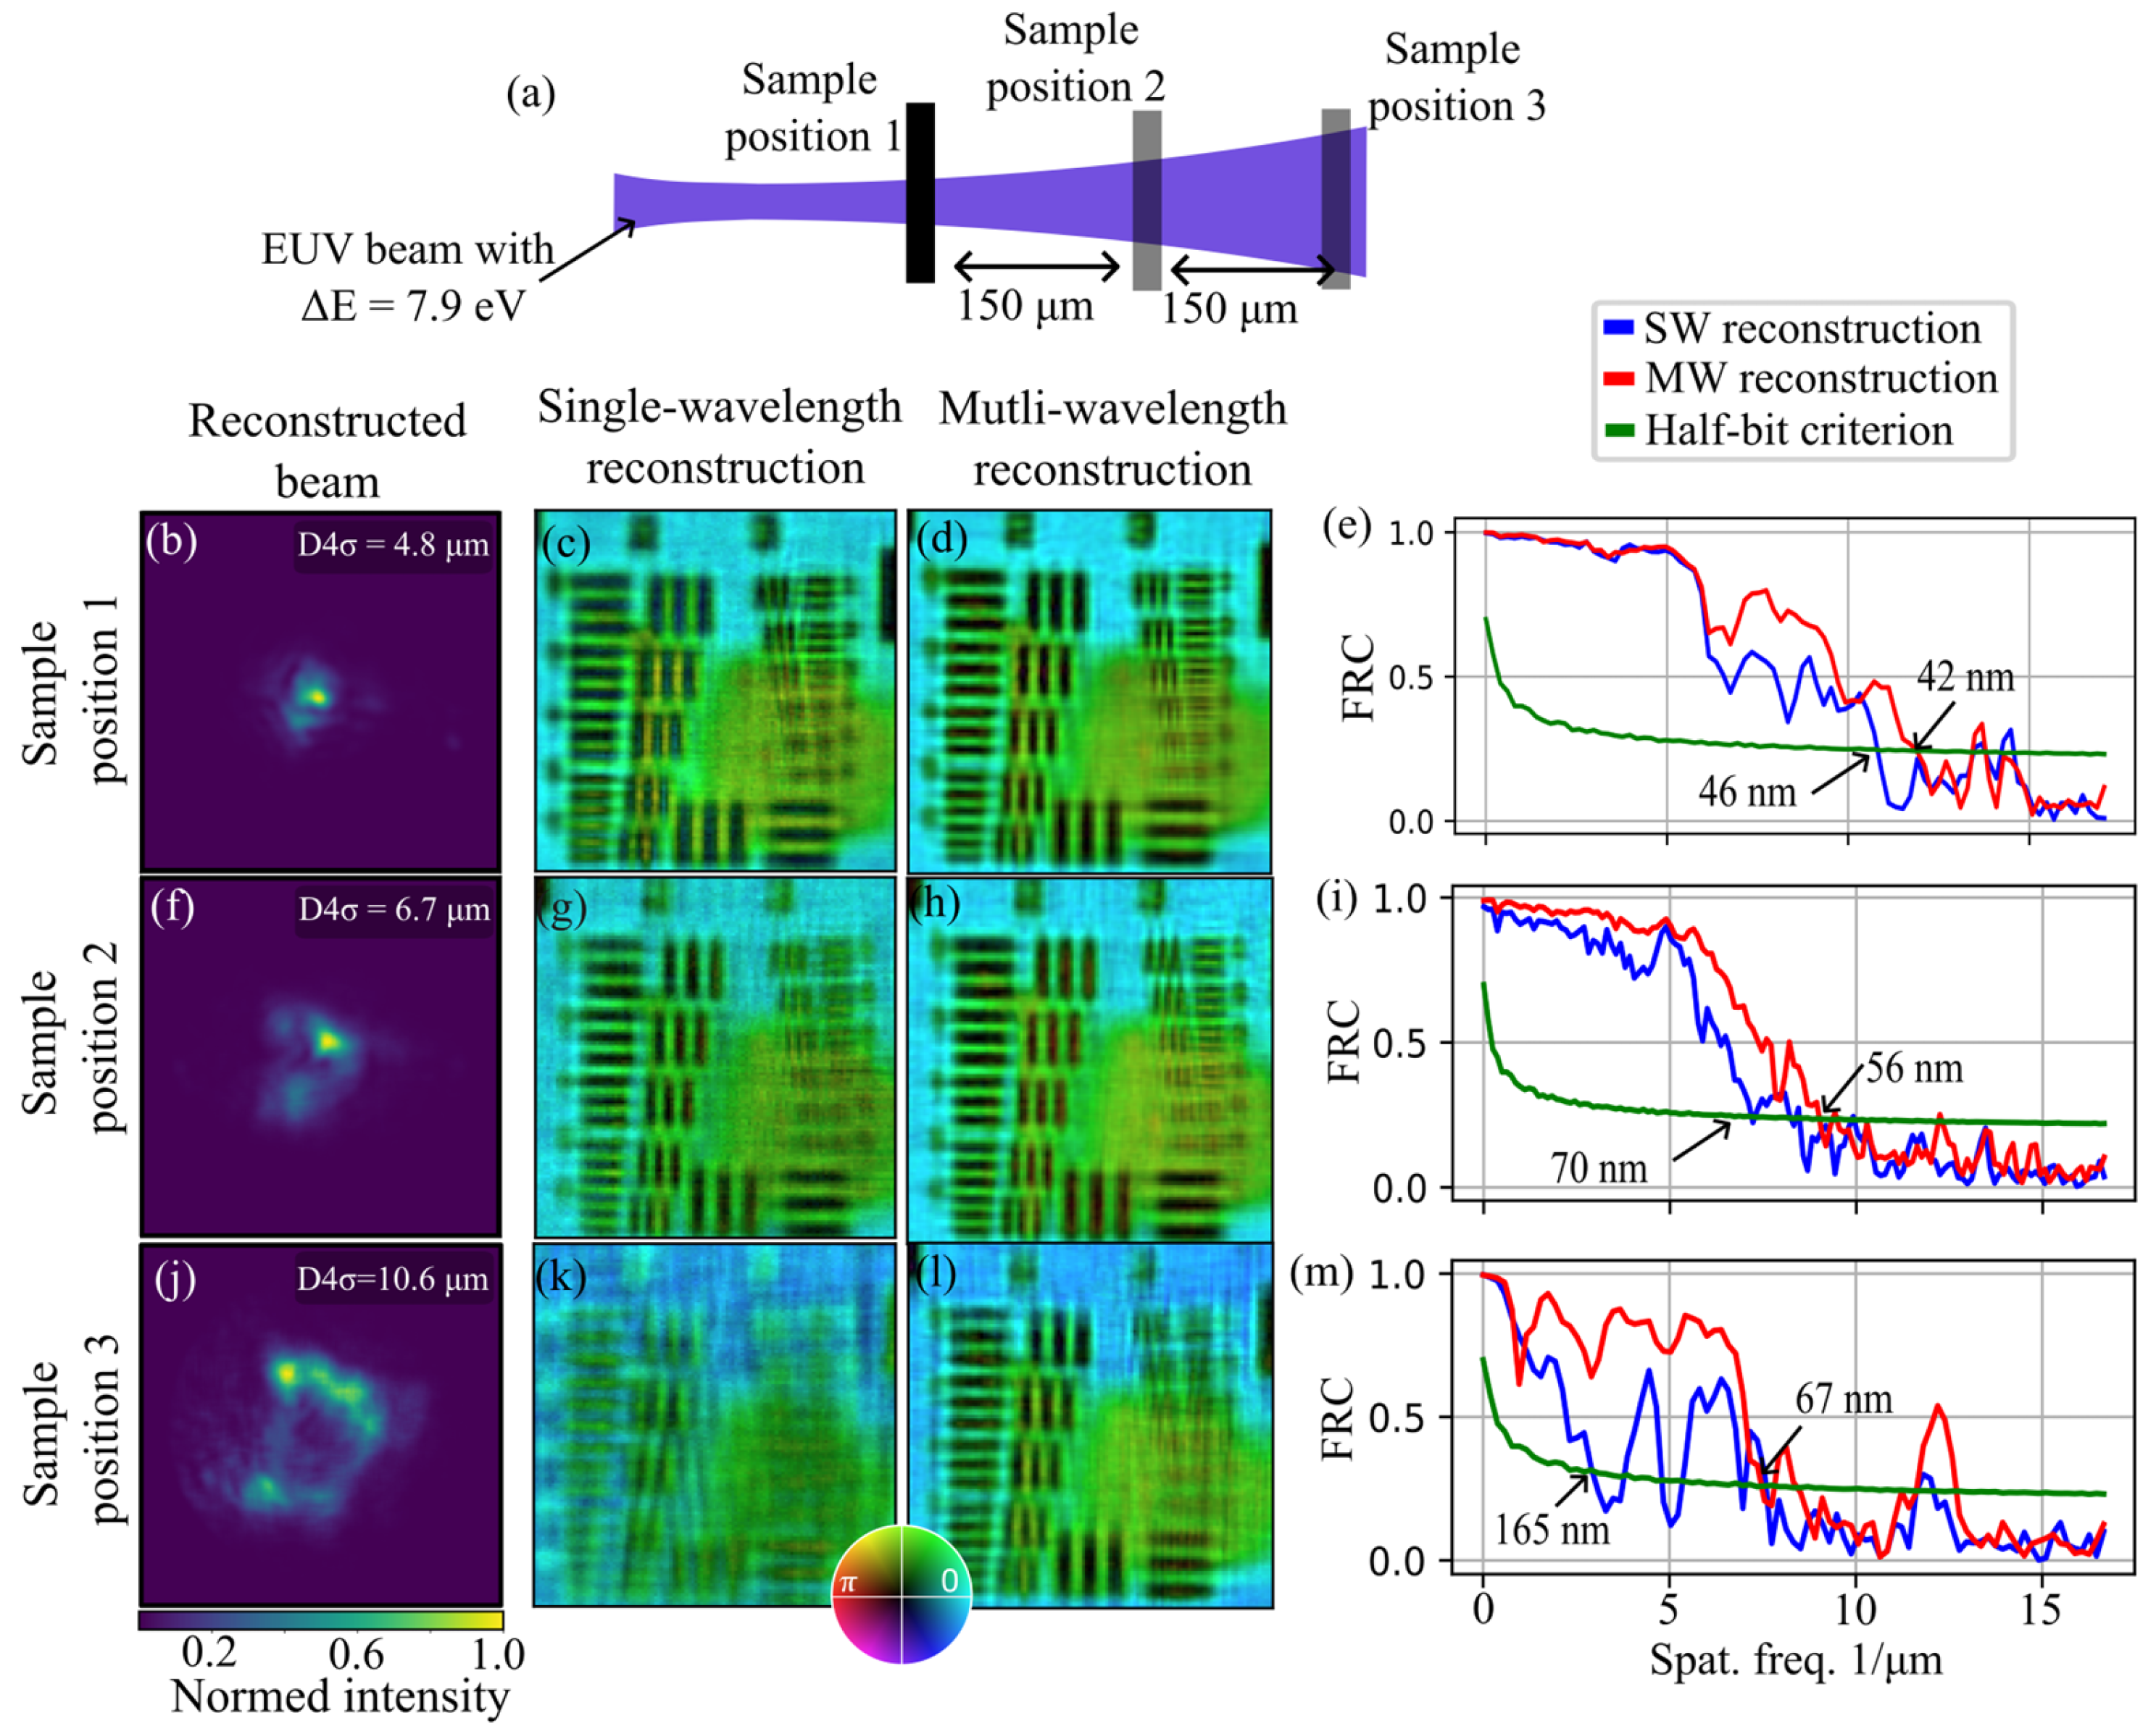
Similar trends are observed in the measurements conducted with the broadband mirror, and the resulting reconstructions and FRC curves are presented in Figure 5. Due to the necessary readjustment of the ellipsoidal mirror during the exchange of the ML mirrors, a superior alignment was achieved, resulting in a reduced focal D4σ spot size of 4.8 µm. Three measurements are taken at slightly different positions within the caustic. Due to the adjusted alignment of the ellipsoidal mirror, ptychography measurements are recorded roughly in the focal plane and at distances of 150 µm (Figure 5f–i) and 300 µm (Figure 5j–m) behind the focus, which result in significantly larger EUV beams. These profiles exhibit distinct aberrations compared to the narrowband beam, resulting in different intensity distributions. As observed previously, the spatial resolution for the defocused beams degrades, ranging from 46 nm to 165 nm for the SW algorithm and from 42 nm to 67 nm for the MW algorithm.
Figure 5.
Beam size scan using a 7.9 eV bandwidth EUV beam. (a) Schematic of the beam size scan, illustrating sample placement at various defocused positions. (b–e) EUV beam profile, SW reconstruction, MW reconstruction, and FRC at the focal plane (z = 0). (f–i) Corresponding data for the sample placed 150 µm behind the focal plane. (j–m) Corresponding data for the sample placed 300 µm behind the focal plane.
Notably, when the sample is positioned 300 µm behind the focal plane, the D4σ spot size increases to 10.6 µm. In this case, the resolution of the SW reconstruction drops below 150 nm, suggesting convergence instabilities within the algorithm under these high-bandwidth conditions. In contrast, the MW algorithm remains robust, maintaining a resolution of 67 nm and showing an overall better image quality compared to the SW reconstruction.
4.3. Systematic Evaluation of the Beam Size Scans
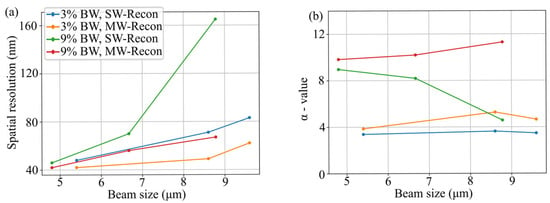
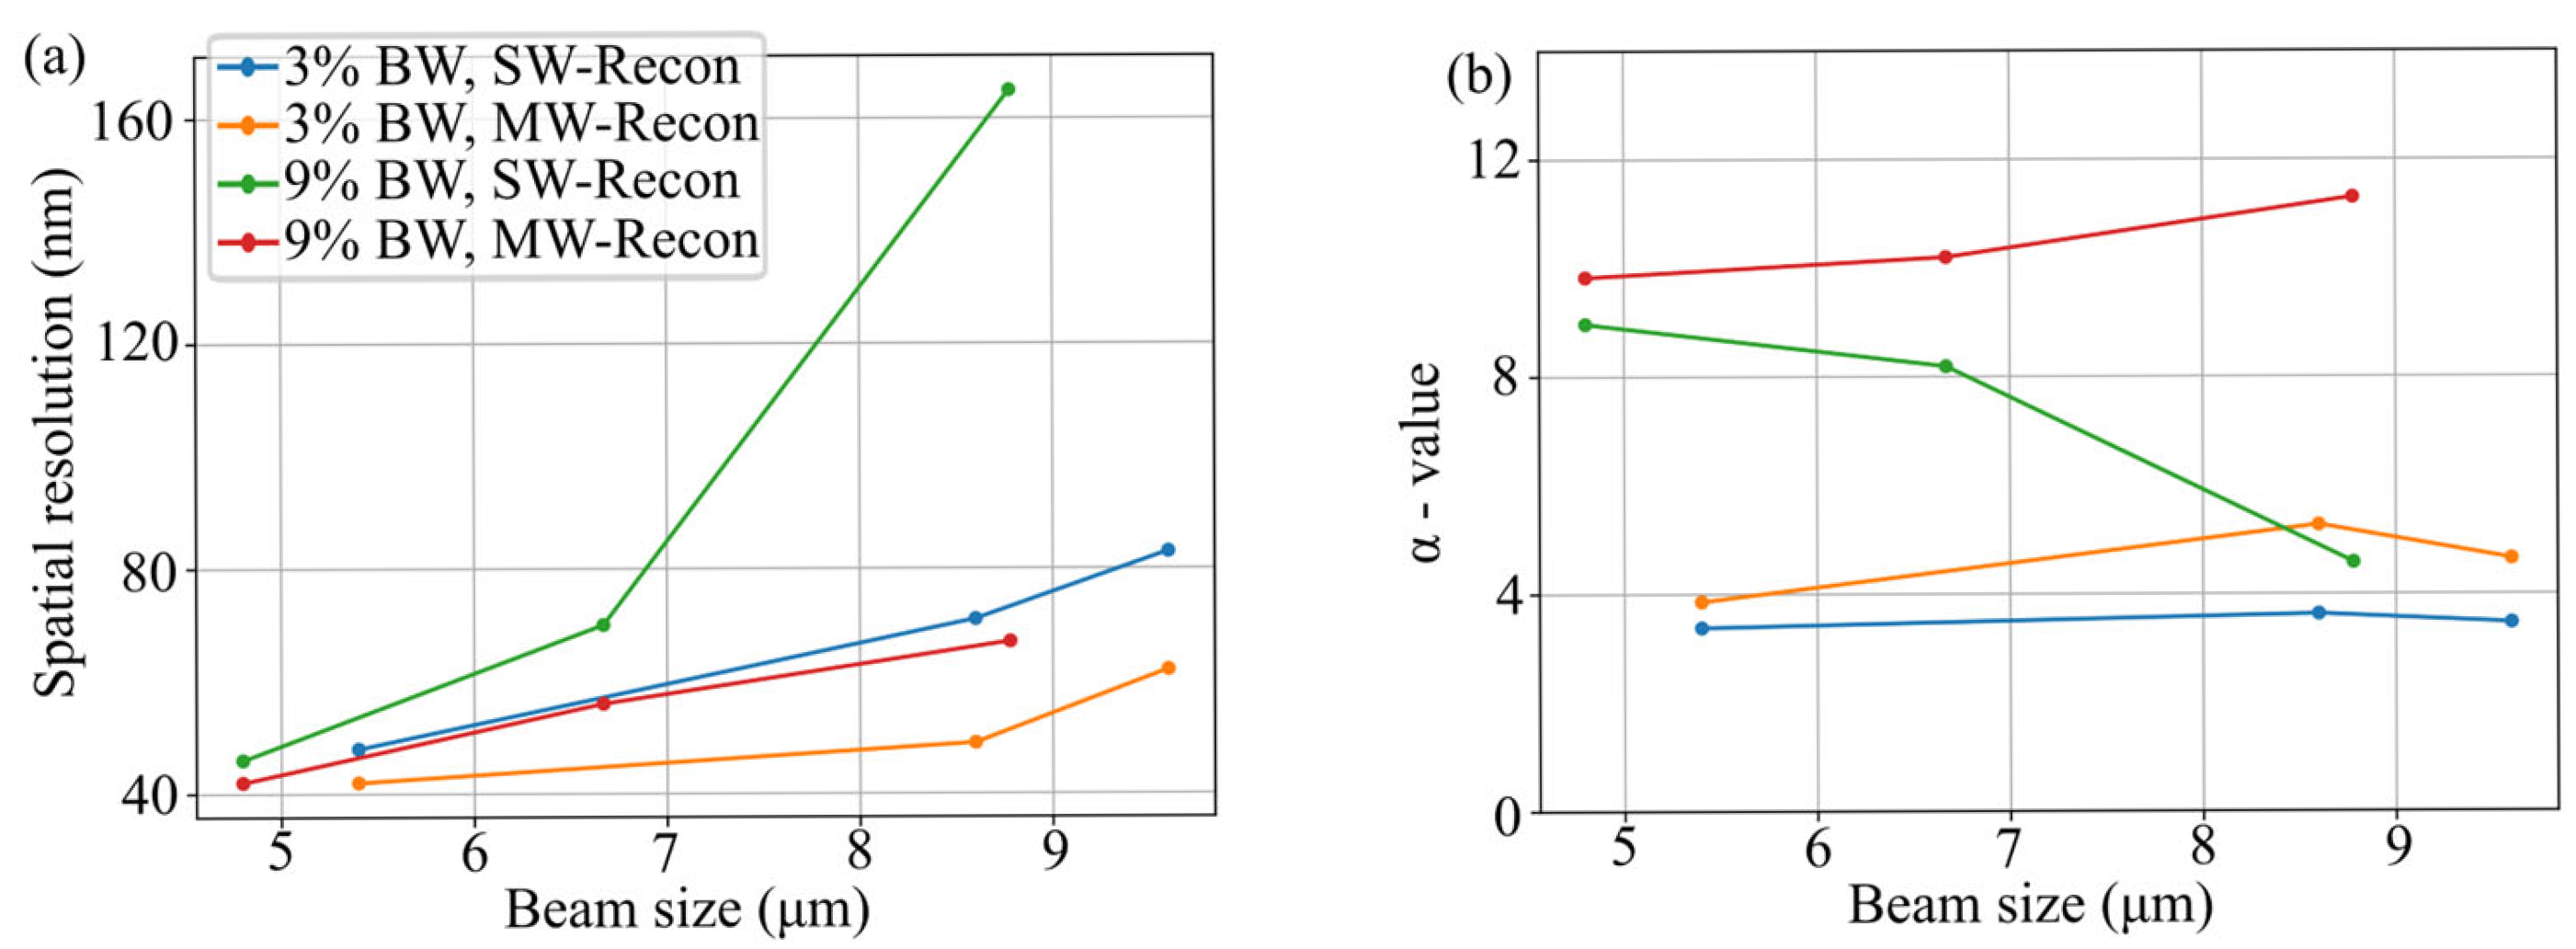
The measurement results for both the narrowband and broadband scenarios are summarized in Figure 6a,b. In Figure 6a, the spatial resolution is plotted against the beam size, revealing a clear trend: the spatial resolution degrades as the beam size increases. To further quantify these effects, Figure 6b displays the α-parameter as a function of beam size. Introduced in Equation (1), this parameter serves as the proportionality factor between the relative bandwidth and the ratio of spatial resolution to beam size. It can be expressed by rearranging the original expression as follows:
In this context, high α values indicate that high-resolution ptychographic reconstructions can be achieved even when using a spectrum with a large bandwidth. Conversely, low α values suggest that even narrow bandwidths lead to a substantial loss in spatial resolution. Given that the relative bandwidths (3% and 9%), beam sizes, and achieved resolutions are known for all measurements in Figure 4 and Figure 5, the corresponding α values are calculated. These values, based on the spatial resolution and reconstructed beam diameters, are plotted for various experimental scenarios in Figure 6b. This analysis yields several key insights into the behavior of the reconstruction process.
First, the α value can be improved for every scenario investigated by employing the MW algorithm.
Second, for a given bandwidth, the α value remains approximately independent of the beam size. This implies that the resolution scales linearly with the beam size, such that increasing the latter by a specific factor results in a proportional degradation of the former. For instance, reconstructions using the narrowband spectrum in conjunction with the SW algorithm yield an α value of approximately 4. An exception to this trend is observed in the SW reconstructions of diffraction patterns using the broadband spectrum, as shown in Figure 5k), where the excessive bandwidth causes issues with algorithmic convergence.
Third, the data indicates that the α value is inherently dependent on the bandwidth. While the resolution degrades when using the broadband spectrum compared to the narrowband reconstructions, as seen in Figure 5a, this degradation does not occur in the same proportion as the increase in spectral bandwidth. Consequently, it can be concluded that the proportionality factor in ptychography is not a fixed constant but is instead dependent on the specific bandwidth employed, i.e., α = α(Δλ). These results suggest that ptychography is significantly more robust against temporal incoherence than previous theoretical predictions [37] have suggested, an observation that stands in good agreement with recent experimental findings [38,39].
5. Discussion
In this work, we demonstrate EUV ptychography using relative bandwidths of 3% and 9%, achieving spatial resolutions of 36 nm and 42 nm, respectively. Notably, the broadband ML mirror increases the usable photon flux by a factor of approximately 2.5. This allows for a corresponding 2.5-fold reduction in exposure time while maintaining nearly identical image quality. These high-resolution results are facilitated by the precise alignment of the ellipsoidal mirror, which minimizes the focal spot size. Utilizing ptychography as a diagnostic tool, we characterized the EUV focus and demonstrated a sub-micrometer spot size down to 760 nm × 820 nm (FWHM). Furthermore, the implementation of a multi-wavelength (MW) algorithm significantly enhanced image quality by effectively accounting for temporal decoherence effects.
Subsequently, we present a systematic study of spatial resolution as a function of beam size. Our findings indicate that ptychography is considerably more robust against temporal incoherence than predicted by the classical coherence limit [37], which is in good agreement with previous observations [38,39]. To account for this behavior, we introduce a new parameter, the α-value, into Equation (1). Our investigations reveal that while this parameter is independent of the beam size, it exhibits a distinct dependence on the spectral bandwidth.
We anticipate that these results will directly influence the design of future ptychographic experiments. While traditional setups typically restrict the relative bandwidth to approximately 1% [17,18], we demonstrate the feasibility of operating with bandwidths up to 9%. This allows for a far more efficient utilization of the broad spectra provided by HHG sources. This approach is particularly promising for the soft X-ray regime, where HHG spectra usually exhibit a continuum rather than discrete harmonics. It should be noted that EUV and soft X-ray ML mirrors inherently face a trade-off between peak reflectivity and bandwidth. Typically, broadening a mirror’s bandwidth reduces its peak reflectivity, yielding no significant net gain in usable photon flux. Nevertheless, operating at more grazing incidence angles can circumvent this restriction, as ML mirrors at these angles naturally exhibit both higher peak reflectivity and broader bandwidth compared to normal incidence ML mirrors.
Finally, we demonstrate high-resolution ptychography with a bandwidth of 7.9 eV, which, to the best of our knowledge, represents the largest bandwidth ever employed in EUV ptychography. The bandwidth employed in this study corresponds to a Fourier-limited pulse duration of 230 as, highlighting the potential of this technique for future attosecond imaging experiments [69,70]. Other prospective applications include combining ptychography with depth-resolved techniques, which benefit from broadband radiation, such as optical coherence tomography [56,71].
Supplementary Materials
The following supporting information can be downloaded at: https://www.mdpi.com/article/10.3390/photonics13060593/s1, Supplementary S1: Table S1: Summary of measurement parameters; Figure S1. Reconstructed illumination for 7.9 eV BW scan with sample placed 150 μm behind focus. (a) Six partial coherent mixed state modes for each wavelength used in the reconstruction. Each mode is zoomed by a factor of two. (b) Propagated intensity of each mode to the far field, using the Two-Step Fresnel method to fix detector-plane sampling based on the central wavelength. Each far field spot is normalized to the same total power; and Figure S2. (a) PIE-based reconstruction of the 9% BW data (from Figure 3) using PtyLab. (b) Equivalent reconstruction using the difference map-based Ms. PaCMAN algorithm for comparison.
Author Contributions
Conceptualization, N.W.J., W.H., M.H., H.K. and M.M.; methodology, W.E., W.H. and N.W.J.; software, W.E., N.W.J., J.G. and B.S.; formal analysis, W.E., N.W.J., C.K. and Y.S.; data curation, W.E., W.H., G.S., G.G. and D.M.; writing—original draft preparation, W.E. and J.G.; supervision M.H., H.K. and M.M.; funding acquisition, M.H., H.K. and M.M. All authors have read and agreed to the published version of the manuscript.
Funding
The authors gratefully acknowledge support from the Gordon and Betty Moore Foundation Grant No. 10784 for the soft X-ray beamline and microscope, from an U.S. Air Force Office Multidisciplinary University Research Initiative (MURI) program under award FA9550-23-1-0281 for the low-dose imaging, and from an AFOSR Award No. FA9550-25-1-0334 for the broadband CDI measurements.
Data Availability Statement
Data underlying the results presented in this paper are not publicly available at this time but may be obtained from the authors upon reasonable request.
Conflicts of Interest
The authors declare no conflicts of interest.
References
- Bartels, R.A.; Paul, A.; Green, H.; Kapteyn, H.C.; Murnane, M.M.; Backus, S.; Christov, I.P.; Liu, Y.; Attwood, D.; Jacobsen, C. Generation of Spatially Coherent Light at Extreme Ultraviolet Wavelengths. Science 2002, 297, 376–378. [Google Scholar] [CrossRef] [Scilit]
- Rundquist, A.; Durfee, C.G.; Chang, Z.; Herne, C.; Backus, S.; Murnane, M.M.; Kapteyn, H.C. Phase-Matched Generation of Coherent Soft X-Rays. Science 1998, 280, 1412–1415. [Google Scholar] [CrossRef] [Scilit] [PubMed]
- Popmintchev, T.; Chen, M.C.; Bahabad, A.; Gerrity, M.; Sidorenko, P.; Cohen, O.; Christov, I.P.; Murnane, M.M.; Kapteyn, H.C. Phase Matching of High Harmonic Generation in the Soft and Hard X-Ray Regions of the Spectrum. Proc. Natl. Acad. Sci. USA 2009, 106, 10516–10521. [Google Scholar] [CrossRef] [Scilit] [PubMed]
- Popmintchev, T.; Chen, M.C.; Popmintchev, D.; Arpin, P.; Brown, S.; Ališauskas, S.; Andriukaitis, G.; Balčiunas, T.; Mücke, O.D.; Pugzlys, A.; et al. Bright Coherent Ultrahigh Harmonics in the Kev X-Ray Regime from Mid-Infrared Femtosecond Lasers. Science 2012, 336, 1287–1291. [Google Scholar] [CrossRef] [Scilit] [PubMed]
- Spielmann, C.; Burnett, N.H.; Sartania, S.; Koppitsch, R.; Schnürer, M.; Kan, C.; Lenzner, M.; Wobrauschek, P.; Krausz, F. Generation of Coherent X-Rays in the Water Window Using 5-Femtosecond Laser Pulses. Science 1997, 278, 661–664. [Google Scholar] [CrossRef] [Scilit]
- Sandberg, R.L.; Paul, A.; Raymondson, D.A.; Hädrich, S.; Gaudiosi, D.M.; Holtsnider, J.; Tobey, R.I.; Cohen, O.; Murnane, M.M.; Kapteyn, H.C.; et al. Lensless Diffractive Imaging Using Tabletop Coherent High-Harmonic Soft-X-Ray Beams. Phys. Rev. Lett. 2007, 99, 098103. [Google Scholar] [CrossRef] [Scilit] [PubMed]
- Fienup, J.R. Phase Retrieval Algorithms: A Comparison. Appl. Opt. 1982, 21, 2758. [Google Scholar] [CrossRef] [Scilit] [PubMed]
- Miao, J.; Charalambous, P.; Kirz, J.; Sayre, D. Extending the Methodology of X-Ray Crystallography to Allow Imaging of Micrometre-Sized Non-Crystalline Specimens. Nature 1999, 400, 342–344. [Google Scholar] [CrossRef] [Scilit]
- Miao, J. Computational Microscopy with Coherent Diffractive Imaging and Ptychography. Nature 2025, 637, 281–295. [Google Scholar] [CrossRef] [Scilit] [PubMed]
- Thibault, P.; Dierolf, M.; Menzel, A.; Bunk, O.; David, C.; Pfeiffer, F. High-Resolution Scanning x-Ray Diffraction Microscopy. Science 2008, 321, 379–382. [Google Scholar] [CrossRef] [Scilit] [PubMed]
- Maiden, A.M.; Rodenburg, J.M. An Improved Ptychographical Phase Retrieval Algorithm for Diffractive Imaging. Ultramicroscopy 2009, 109, 1256–1262. [Google Scholar] [CrossRef] [Scilit] [PubMed]
- Guizar-Sicairos, M.; Fienup, J.R. Phase Retrieval with Transverse Translation Diversity: A Nonlinear Optimization Approach. Opt. Express 2008, 16, 7264–7278. [Google Scholar] [CrossRef] [Scilit] [PubMed]
- Pfeiffer, F. X-Ray Ptychography. Nat. Photonics 2018, 12, 9–17. [Google Scholar] [CrossRef] [Scilit]
- Wang, R.; Zhao, Q.; Loetgering, L.; Allars, F.; Hong, Z.; Pennycook, T.J.; Horstmeyer, R.; Rodenburg, J.; Maiden, A.; Zheng, G. Ptychography at All Wavelengths. Nat. Rev. Methods Primers 2025, 5, 68. [Google Scholar] [CrossRef] [Scilit] [PubMed]
- Tanksalvala, M.; Porter, C.L.; Esashi, Y.; Wang, B.; Jenkins, N.W.; Zhang, Z.; Miley, G.P.; Knobloch, J.L.; McBennett, B.; Horiguchi, N.; et al. Nondestructive, High-Resolution, Chemically Specific 3D Nanostructure Characterization Using Phase-Sensitive EUV Imaging Reflectometry. Sci. Adv. 2021, 7, 9667–9694. [Google Scholar] [CrossRef] [Scilit] [PubMed]
- Eschen, W.; Klas, R.; Molina, D.S.P.; Fuchs, S.; Paulus, G.G.; Limpert, J.; Rothhardt, J. Coherent Nanoscale Imaging and Chemical Mapping with Compact Extreme Ultraviolet and Soft X-Ray Sources: Review and Perspective. APL Photonics 2025, 10, 050901. [Google Scholar] [CrossRef] [Scilit]
- Gardner, D.F.; Tanksalvala, M.; Shanblatt, E.R.; Zhang, X.; Galloway, B.R.; Porter, C.L.; Karl, R.; Bevis, C.; Adams, D.E.; Kapteyn, H.C.; et al. Subwavelength Coherent Imaging of Periodic Samples Using a 13.5 Nm Tabletop High-Harmonic Light Source. Nat. Photonics 2017, 11, 259–263. [Google Scholar] [CrossRef] [Scilit]
- Eschen, W.; Loetgering, L.; Schuster, V.; Klas, R.; Kirsche, A.; Berthold, L.; Steinert, M.; Pertsch, T.; Gross, H.; Krause, M.; et al. Material-Specific High-Resolution Table-Top Extreme Ultraviolet Microscopy. Light Sci. Appl. 2022, 11, 117. [Google Scholar] [CrossRef] [Scilit] [PubMed]
- Baksh, P.D.; Ostrčil, M.; Miszczak, M.; Pooley, C.; Chapman, R.T.; Wyatt, A.S.; Springate, E.; Chad, J.E.; Deinhardt, K.; Frey, J.G.; et al. Quantitative and Correlative Extreme Ultraviolet Coherent Imaging of Mouse Hippocampal Neurons at High Resolution. Sci. Adv. 2020, 6, eaaz3025. [Google Scholar] [CrossRef] [Scilit] [PubMed]
- Liu, C.; Eschen, W.; Loetgering, L.; Molina, D.S.P.; Klas, R.; Iliou, A.; Steinert, M.; Herkersdorf, S.; Kirsche, A.; Pertsch, T.; et al. Visualizing the Ultra-Structure of Microorganisms Using Table-Top Extreme Ultraviolet Imaging. PhotoniX 2023, 4, 6. [Google Scholar] [CrossRef] [Scilit]
- Karl, R.M.; Mancini, G.F.; Knobloch, J.L.; Frazer, T.D.; Hernandez-Charpak, J.N.; Abad, B.; Gardner, D.F.; Shanblatt, E.R.; Tanksalvala, M.; Porter, C.L.; et al. Full-Field Imaging of Thermal and Acoustic Dynamics in an Individual Nanostructure Using Tabletop High Harmonic Beams. Sci. Adv. 2018, 4, eaau4295. [Google Scholar] [CrossRef] [Scilit] [PubMed]
- Seaberg, M.D.; Zhang, B.; Gardner, D.F.; Shanblatt, E.R.; Murnane, M.M.; Kapteyn, H.C.; Adams, D.E. Tabletop Nanometer Extreme Ultraviolet Imaging in an Extended Reflection Mode Using Coherent Fresnel Ptychography. Optica 2014, 1, 39. [Google Scholar] [CrossRef] [Scilit]
- Zhang, B.; Gardner, D.F.; Seaberg, M.D.; Shanblatt, E.R.; Kapteyn, H.C.; Murnane, M.M.; Adams, D.E. High Contrast 3D Imaging of Surfaces near the Wavelength Limit Using Tabletop EUV Ptychography. Ultramicroscopy 2015, 158, 98–104. [Google Scholar] [CrossRef] [Scilit] [PubMed]
- Shanblatt, E.R.; Porter, C.L.; Gardner, D.F.; Mancini, G.F.; Karl, R.M.; Tanksalvala, M.D.; Bevis, C.S.; Vartanian, V.H.; Kapteyn, H.C.; Adams, D.E.; et al. Quantitative Chemically Specific Coherent Diffractive Imaging of Reactions at Buried Interfaces with Few Nanometer Precision. Nano Lett. 2016, 16, 5444–5450. [Google Scholar] [CrossRef] [Scilit] [PubMed]
- Lee, D.G.; Kim, Y.W.; Moon, S.; Ahn, J. Effect of Wrinkles on Extreme Ultraviolet Pellicle Reflectivity and Local Critical Dimension. Appl. Opt. 2022, 61, 5965. [Google Scholar] [CrossRef] [Scilit] [PubMed]
- Lu, H.; Odstrčil, M.; Pooley, C.; Biller, J.; Mebonia, M.; He, G.; Praeger, M.; Juschkin, L.; Frey, J.; Brocklesby, W. Characterisation of Engineered Defects in Extreme Ultraviolet Mirror Substrates Using Lab-Scale Extreme Ultraviolet Reflection Ptychography. Ultramicroscopy 2023, 249, 113720. [Google Scholar] [CrossRef] [Scilit] [PubMed]
- Moon, S.; Hong, J.; Lee, T.; Ahn, J. Resolution Enhancement in Extreme Ultraviolet Ptychography Using a Refined Illumination Probe and Small-Etendue Source. Photonics 2025, 12, 831. [Google Scholar] [CrossRef] [Scilit]
- Nagata, Y.; Harada, T.; Watanabe, T.; Kinoshita, H.; Midorikawa, K. At Wavelength Coherent Scatterometry Microscope Using High-Order Harmonics for EUV Mask Inspection. Int. J. Extrem. Manuf. 2019, 1, 032001. [Google Scholar] [CrossRef] [Scilit]
- McBennett, B.; Esashi, Y.; Jenkins, N.W.; Beardo, A.; Shao, Y.; Nelson, E.E.; Culman, T.H.; Abad, B.; Tanksalvala, M.; Frazer, T.D.; et al. Low-Density Diamondlike Amorphous Carbon at Nanostructured Metal-Diamond Interfaces. Phys. Rev. Mater. 2024, 8, 096001. [Google Scholar] [CrossRef] [Scilit]
- Schneider, G.; Guttmann, P.; Heim, S.; Rehbein, S.; Mueller, F.; Nagashima, K.; Heymann, J.B.; Müller, W.G.; McNally, J.G. Three-Dimensional Cellular Ultrastructure Resolved by X-Ray Microscopy. Nat. Methods 2010, 7, 985–987. [Google Scholar] [CrossRef] [Scilit] [PubMed]
- Larabell, C.A.; Nugent, K.A. Imaging Cellular Architecture with X-Rays. Curr. Opin. Struct. Biol. 2010, 20, 623–631. [Google Scholar] [CrossRef] [Scilit] [PubMed]
- Rana, A.; Liao, C.-T.; Iacocca, E.; Zou, J.; Pham, M.; Lu, X.; Subramanian, E.-E.C.; Lo, Y.H.; Ryan, S.A.; Bevis, C.S.; et al. Three-Dimensional Topological Magnetic Monopoles and Their Interactions in a Ferromagnetic Meta-Lattice. Nat. Nanotechnol. 2023, 18, 227–232. [Google Scholar] [CrossRef] [Scilit] [PubMed]
- Butcher, T.A.; Phillips, N.W.; Levitan, A.L.; Weigand, M.; Wintz, S.; Raabe, J.; Finizio, S. Nanoscale Domain-Wall Dynamics in Micromagnetic Structures with Weak Perpendicular Anisotropy. Phys. Rev. B 2025, 111, L220409. [Google Scholar] [CrossRef] [Scilit]
- Neethirajan, J.; Daurer, B.J.; Martínez, M.D.P.; Hrabec, A.; Turnbull, L.; Yamamoto, R.; Ferreira, M.R.; Štefančič, A.; Mayoh, D.A.; Balakrishnan, G.; et al. Soft X-Ray Phase Nanomicroscopy of Micrometer-Thick Magnets. Phys. Rev. X 2024, 14, 031028. [Google Scholar] [CrossRef] [Scilit]
- Morrill, D.; Hettel, W.; Carlson, D.; Shearer, B.; Klein, C.; Thurston, J.; Golba, G.; Larsen, R.; Seifert, G.; Uhrich, J.; et al. Soft X-Ray High-Harmonic Generation in an Anti-Resonant Hollow Core Fiber Driven by a 3 Μm Ultrafast Laser. APL Photonics 2025, 10, 116101. [Google Scholar] [CrossRef] [Scilit]
- Popmintchev, D.; Galloway, B.R.; Chen, M.C.; Dollar, F.; Mancuso, C.A.; Hankla, A.; Miaja-Avila, L.; O’Neil, G.; Shaw, J.M.; Fan, G.; et al. Near- and Extended-Edge X-Ray-Absorption Fine-Structure Spectroscopy Using Ultrafast Coherent High-Order Harmonic Supercontinua. Phys. Rev. Lett. 2018, 120, 093002. [Google Scholar] [CrossRef] [Scilit] [PubMed]
- van der Veen, F.; Pfeiffer, F. Coherent X-Ray Scattering. J. Phys. Condens. Matter 2004, 16, 5003–5030. [Google Scholar] [CrossRef] [Scilit]
- Enders, B.; Dierolf, M.; Cloetens, P.; Stockmar, M.; Pfeiffer, F.; Thibault, P. Ptychography with Broad-Bandwidth Radiation. Appl. Phys. Lett. 2014, 104, 171104. [Google Scholar] [CrossRef] [Scilit]
- Molina, D.S.P.; Loetgering, L.; Eschen, W.; Limpert, J.; Rothhardt, J. Broadband Ptychography Using Curved Wavefront Illumination. Opt. Express 2023, 31, 26958. [Google Scholar] [CrossRef] [Scilit] [PubMed]
- Batey, D.J.; Claus, D.; Rodenburg, J.M. Information Multiplexing in Ptychography. Ultramicroscopy 2014, 138, 13–21. [Google Scholar] [CrossRef] [Scilit] [PubMed]
- Yao, Y.; Jiang, Y.; Klug, J.; Nashed, Y.; Roehrig, C.; Preissner, C.; Marin, F.; Wojcik, M.; Cossairt, O.; Cai, Z.; et al. Broadband X-Ray Ptychography Using Multi-Wavelength Algorithm. J. Synchrotron Radiat. 2021, 28, 309–317. [Google Scholar] [CrossRef] [Scilit] [PubMed]
- Shearer, B.; Kapteyn, H.; Binnie, I.; Jenkins, N.W.; Murnane, M. Robust Broadband Ptychography Algorithms for High-Harmonic Soft X-Ray Supercontinua. Opt. Express 2025, 33, 717. [Google Scholar] [CrossRef] [Scilit] [PubMed]
- Lin, H.; Lin, A.; Jin, X.; Li, K.; Niu, J.; Li, J.; Zhang, X.; Liu, T.; Xu, W.; Zhang, F. Ultra-Broadband Ptychography for Dispersive Samples. Nat. Commun. 2025, 16, 5714. [Google Scholar] [CrossRef] [Scilit] [PubMed]
- Huijts, J.; Fernandez, S.; Gauthier, D.; Kholodtsova, M.; Maghraoui, A.; Medjoubi, K.; Somogyi, A.; Boutu, W.; Merdji, H. Broadband Coherent Diffractive Imaging. Nat. Photonics 2020, 14, 618–622. [Google Scholar] [CrossRef] [Scilit]
- Chen, C.; Gu, H.; Liu, S. Ultra-Broadband Diffractive Imaging with Unknown Probe Spectrum. Light Sci. Appl. 2024, 13, 213. [Google Scholar] [CrossRef] [Scilit] [PubMed]
- Witte, S.; Tenner, V.T.; Noom, D.W.; Eikema, K.S. Lensless Diffractive Imaging with Ultra-Broadband Table-Top Sources: From Infrared to Extreme-Ultraviolet Wavelengths. Light Sci. Appl. 2014, 3, 163. [Google Scholar] [CrossRef] [Scilit]
- Strauch, H.C.; Zhang, F.; Mathias, S.; Hohage, T.; Witte, S.; Jansen, G.S.M. Fast Spectroscopic Imaging Using Extreme Ultraviolet Interferometry. Opt. Express 2024, 32, 28644–28654. [Google Scholar] [CrossRef] [Scilit] [PubMed]
- Stolp, W.; van Assche, F.; Tang, R.; Desplenter, K.; Castelblanco, C.O.; Ziesche, R.; Cipiccia, S.; Batey, D.; Boone, M.N. Broadband Ptychotomography with a Hyperspectral Detector. Phys. Rev. Lett. 2025, 134, 257001. [Google Scholar] [CrossRef] [Scilit] [PubMed]
- Zhang, B.; Gardner, D.F.; Seaberg, M.H.; Shanblatt, E.R.; Porter, C.L.; Karl, R.; Mancuso, C.A.; Kapteyn, H.C.; Murnane, M.M.; Adams, D.E. Ptychographic Hyperspectral Spectromicroscopy with an Extreme Ultraviolet High Harmonic Comb. Opt. Express 2016, 24, 18745. [Google Scholar] [CrossRef] [Scilit] [PubMed]
- Brooks, N.J.; Wang, B.; Binnie, I.; Tanksalvala, M.; Esashi, Y.; Knobloch, J.L.; Nguyen, Q.L.D.; McBennett, B.; Jenkins, N.W.; Gui, G.; et al. Temporal and Spectral Multiplexing for EUV Multibeam Ptychography with a High Harmonic Light Source. Opt. Express 2022, 30, 30331. [Google Scholar] [CrossRef] [Scilit] [PubMed]
- Loetgering, L.; Liu, X.; Beurs, A.C.C.D.; Du, M.; Kuijper, G.; Eikema, K.S.E.; Witte, S. Tailoring Spatial Entropy in Extreme Ultraviolet Focused Beams for Multispectral Ptychography. Optica 2021, 8, 130. [Google Scholar] [CrossRef] [Scilit]
- Goldberger, D.; Schmidt, D.; Barolak, J.; Ivanic, B.; Durfee, C.G.; Adams, D.E. Spatiospectral Characterization of Ultrafast Pulse-Beams by Multiplexed Broadband Ptychography. Opt. Express 2021, 29, 32474. [Google Scholar] [CrossRef] [Scilit] [PubMed]
- Pelekanidis, A.; Zhang, F.; Eikema, K.S.E.; Witte, S. Generation Dynamics of Broadband Extreme Ultraviolet Vortex Beams. ACS Photonics 2025, 12, 1638–1649. [Google Scholar] [CrossRef] [Scilit] [PubMed]
- Fuchs, S.; Wünsche, M.; Nathanael, J.; Abel, J.J.; Rödel, C.; Biedermann, J.; Reinhard, J.; Hübner, U.; Paulus, G.G. Optical Coherence Tomography with Nanoscale Axial Resolution Using a Laser-Driven High-Harmonic Source. Optica 2017, 4, 903. [Google Scholar] [CrossRef] [Scilit]
- Wiesner, F.; Wünsche, M.; Reinhard, J.; Abel, J.J.; Nathanael, J.; Skruszewicz, S.; Rödel, C.; Yulin, S.; Gawlik, A.; Schmidl, G.; et al. Material-Specific Imaging of Nanolayers Using Extreme Ultraviolet Coherence Tomography. Optica 2021, 8, 230. [Google Scholar] [CrossRef] [Scilit]
- Reinhard, J.; Wiesner, F.; Hennecke, M.; Sidiropoulos, T.; Kaleta, S.; Späthe, J.; Abel, J.J.; Wünsche, M.; Schmidl, G.; Plentz, J.; et al. Soft X-Ray Imaging with Coherence Tomography in the Water Window Spectral Range Using High-Harmonic Generation. Light Sci. Appl. 2026, 15, 79. [Google Scholar] [CrossRef] [Scilit] [PubMed]
- Kapteyn, H.C.; Murnane, M.M.; Esashi, Y.; Tanksalvala, M.; Knobloch, J.L.; Liao, C.-T.; Hickstein, D.; Bargsten, C.; Dorney, K.; Petersen, J.S. Coherent EUV Light Sources Based on High-Order Harmonic Generation: Principles and Applications in Nanotechnology. In Photon Sources for Lithography and Metrology; SPIE: Bellingham, WA, USA, 2023; Volume PM351, pp. 847–910. [Google Scholar] [CrossRef] [Scilit]
- Guizar-Sicairos, M.; Holler, M.; Diaz, A.; Vila-Comamala, J.; Bunk, O.; Menzel, A. Role of the Illumination Spatial-Frequency Spectrum for Ptychography. Phys. Rev. B 2012, 86, 100103. [Google Scholar] [CrossRef] [Scilit]
- Eschen, W.; Liu, C.; Steinert, M.; Molina, D.S.P.; Siefke, T.; Zeitner, U.D.; Kasper, J.; Pertsch, T.; Limpert, J.; Rothhardt, J. Structured Illumination Ptychography and At-Wavelength Characterization with an EUV Diffuser at 13.5 Nm Wavelength. Opt. Express 2024, 32, 3480. [Google Scholar] [CrossRef] [Scilit] [PubMed]
- Wang, B.; Brooks, N.J.; Johnsen, P.; Jenkins, N.W.; Esashi, Y.; Binnie, I.; Tanksalvala, M.; Kapteyn, H.C.; Murnane, M.M. High-Fidelity Ptychographic Imaging of Highly Periodic Structures Enabled by Vortex High Harmonic Beams. Optica 2023, 10, 1245. [Google Scholar] [CrossRef] [Scilit]
- Odstrčil, M.; Lebugle, M.; Guizar-Sicairos, M.; David, C.; Holler, M. Towards Optimized Illumination for High-Resolution Ptychography. Opt. Express 2019, 27, 14981–14997. [Google Scholar] [CrossRef] [Scilit] [PubMed]
- Pelekanidis, A.; Zhang, F.; Gouder, M.; Seifert, J.; Du, M.; Eikema, K.S.E.; Witte, S. Illumination Diversity in Multiwavelength Extreme Ultraviolet Ptychography. Photon. Res. 2024, 12, 2757–2771. [Google Scholar] [CrossRef] [Scilit]
- Maiden, A.; Johnson, D.; Li, P. Further Improvements to the Ptychographical Iterative Engine. Optica 2017, 4, 736. [Google Scholar] [CrossRef] [Scilit]
- Thibault, P.; Menzel, A. Reconstructing State Mixtures from Diffraction Measurements. Nature 2013, 494, 68–71. [Google Scholar] [CrossRef] [Scilit] [PubMed]
- Loetgering, L.; Du, M.; Flaes, D.B.; Aidukas, T.; Wechsler, F.; Molina, D.S.P.; Rose, M.; Pelekanidis, A.; Eschen, W.; Hess, J.; et al. PtyLab.m/Py/Jl: A Cross-Platform, Open-Source Inverse Modeling Toolbox for Conventional and Fourier Ptychography. Opt. Express 2023, 31, 13763. [Google Scholar] [CrossRef] [Scilit] [PubMed]
- Thibault, P.; Dierolf, M.; Bunk, O.; Menzel, A.; Pfeiffer, F. Probe Retrieval in Ptychographic Coherent Diffractive Imaging. Ultramicroscopy 2009, 109, 338–343. [Google Scholar] [CrossRef] [Scilit] [PubMed]
- Thibault, P.; Guizar-Sicairos, M. Maximum-Likelihood Refinement for Coherent Diffractive Imaging. New J. Phys. 2012, 14, 063004. [Google Scholar] [CrossRef] [Scilit]
- van Heel, M.; Schatz, M. Fourier Shell Correlation Threshold Criteria. J. Struct. Biol. 2005, 151, 250–262. [Google Scholar] [CrossRef] [Scilit] [PubMed]
- Rana, A.; Zhang, J.; Pham, M.; Yuan, A.; Lo, Y.H.; Jiang, H.; Osher, S.J.; Miao, J. Potential of Attosecond Coherent Diffractive Imaging. Phys. Rev. Lett. 2020, 125, 086101. [Google Scholar] [CrossRef] [Scilit] [PubMed]
- Eschen, W.; Wang, S.; Liu, C.; Klas, R.; Steinert, M.; Yulin, S.; Meißner, H.; Bussmann, M.; Pertsch, T.; Limpert, J.; et al. Towards Attosecond Imaging at the Nanoscale Using Broadband Holography-Assisted Coherent Imaging in the Extreme Ultraviolet. Commun. Phys. 2021, 4, 154. [Google Scholar] [CrossRef] [Scilit]
- Du, M.; Loetgering, L.; Eikema, K.S.E.; Witte, S. Ptychographic Optical Coherence Tomography. Opt. Lett. 2021, 46, 1337–1340. [Google Scholar] [CrossRef] [Scilit] [PubMed]
Disclaimer/Publisher’s Note: The statements, opinions and data contained in all publications are solely those of the individual author(s) and contributor(s) and not of MDPI and/or the editor(s). MDPI and/or the editor(s) disclaim responsibility for any injury to people or property resulting from any ideas, methods, instructions or products referred to in the content. |
© 2026 by the authors. Licensee MDPI, Basel, Switzerland. This article is an open access article distributed under the terms and conditions of the Creative Commons Attribution (CC BY) license.