


Abstract
Introduction: Transcranial photobiomodulation (t-PBM) is a non-invasive metabolic neuromodulation technique intended to enhance cerebral bioenergetics by stimulating mitochondrial activity. To characterize both baseline metabolic vulnerability and real-time metabolic engagement during stimulation, this preliminary study integrated phosphorus magnetic resonance spectroscopy (31P-MRS) with resting-state fMRI. Methods: Eleven individuals with mild cognitive impairment (MCI) or early Alzheimer’s disease underwent 31P-MRS to quantify baseline cerebral metabolism (PCr/Pi, pH), followed by MRI sessions during which t-PBM was applied over bilateral frontal sites. Fractional amplitude of low-frequency fluctuations (fALFF), a resting-state index strongly associated with cerebral glucose metabolism, was used as a real-time proxy of metabolic change during stimulation. Results: Linear regression analyses indicated that lower baseline PCr/Pi and lower pH, markers of impaired oxidative metabolism, predicted greater increases in fALFF during t-PBM, most prominently in the right frontal pole (FP2) and, to a lesser extent, right dorsolateral prefrontal cortex (F4). While greater dementia severity also predicted larger fALFF responses in select regions, our findings suggest that t-PBM can boost metabolism in some brain regions where it is compromised, but that this may be independent of cognitive function in early AD/MCI. These findings suggest that t-PBM may preferentially engage brain regions with reduced metabolic capacity to exhibit stronger acute responses. Discussion: Overall, these hypothesis-generating results support the combined use of 31P-MRS and fALFF as complementary biomarkers to quantify baseline metabolic status and real-time target engagement. A single session of t-PBM produced neural activity changes consistent with partial metabolic normalization in vulnerable cortical regions. As these results are preliminary, ongoing longitudinal work with a larger cohort will determine whether baseline metabolic profiles and acute fALFF responses predict clinical outcomes after repeated t-PBM treatment.
1. Introduction
Transcranial photobiomodulation (t-PBM) is an emerging neuromodulation strategy that influences cerebral metabolism through photons exciting the mitochondrial electron transport chain. This method can be applied to individuals with compromised cerebral metabolism, including those with Alzheimer’s disease (AD) dementia [1], to potentially enhance cerebral metabolism and cognition and influence behavior [2]. Since the current study used a technique to enhance cerebral metabolism, we employed neuroimaging measures to characterize baseline metabolism and real-time target engagement brain activity. Baseline metabolism was measured using phosphorous MRS (31P-MRS) [3]. Target engagement was measured using resting-state functional MRI (rs-fMRI). From the rs-fMRI, we calculated fractional amplitude of low-frequency fluctuations, fALFF [4], that is a measure of intrinsic brain activity highly correlated with cerebral glucose metabolism [5,6]. fALFF is not a direct measure of metabolism (such as FDG-PET); however, this measure may serve as a non-invasive proxy of metabolism, with several limitations described by Gaggi and Liebers [6]. Recently, we [5] observed immediate effects of t-PBM on local intrinsic brain activity (fALFF) in individuals with mild cognitive impairment (MCI) and early AD using magnetic resonance imaging (MRI). Here, we explore baseline cerebral metabolism measured with 31P-MRS as a predictor of change in fALFF and in cognitive status.
2. Materials and Methods
Nineteen individuals diagnosed with MCI/AD through cognitive testing and clinical interviews underwent baseline 31P-MRS (see Parasoglou et al. [7] for details on the MRS scan parameters). Specifically, we measured PCr/Pi and pH, which are indicators of metabolic state and oxidative stress [3,8]. Out of the nineteen individuals, eleven were included in this preliminary analysis if they had both high-quality rs-fMRI and 31P-MRS scans. Participants then underwent a separate session of t-PBM in the MRI scanner. t-PBM was administered over the forehead bilaterally via laser probes (pulsed dose; 808 nm, peak irradiance = 833 mW/cm2, average irradiance = 277.8 mW/cm2, fluence = 185.3 J/ cm2, total energy per session = 4.4 kJ) for approximately 12 min. Scans acquired consisted of a T1 structural scan, a baseline rs-fMRI scan, a rs-fMRI scan during t-PBM irradiation over the left and right forehead (at standard EEG electrode positions F3, F4, FP2, FP1), and a final rs-fMRI scan immediately after t-PBM application (see Gaggi et al. [5] for details on study design, t-PBM configuration, and MRI acquisition parameters). 31P-MRS measurements were obtained using a 3T Siemens MRI system equipped with a dual-tuned 31P/1H 8-channel transmit/receive phase array coil. MRS data were acquired using a conventional chemical shift imaging pulse sequence with parameters: TR/TE 2000/2.3 ms, FOV 24 × 24 × 24 cm3, Volume of Interest (VOI) 24 × 24 × 20 cm3, vector size 1024, matrix size 8 × 8 × 8, averages 18, voxel size 3 × 3 × 3 cm3, weighted phase encoding and receiver bandwidth 2000 Hz. The high-resolution structural image was utilized to aid in placement of the spectral grid. Multichannel coil array data were combined using the sum-of-squares method to improve spectral signal-to-noise ratio [9]. Data were interpolated to a 16 × 16 × 16 matrix yielding a voxel size of 15 × 15 × 15 mm3. Afterward, a 75% Hamming filter was applied to mitigate signal leakage during Fast Fourier Transform (FFT) of the combined data.
Due to inter-individual variation in head size and shape, spectral signal extraction from nominally identical voxel locations within the spectroscopic grid may be misaligned across subjects. This misalignment can result in metabolite concentration estimates derived from different brain tissues, thereby reducing statistical power. To examine metabolite concentration from the desired ROI automatically, the ROI in MNI-space was transformed back into subject space. The subject space ROI was then mapped onto the spectroscopic grid. A weighted average spectral method was used to compute the representative spectrum for the desired ROI. The weighting factors were determined based on the distance between the ROI center of mass and the voxel center. The representative spectrum for the specific ROI is computed using the equation: SROI = ∑wi × Sii = Ni = 1. SROI represents the specific ROI spectrum and Si is the spectrum from the i-th voxel that is enclosed inside the ROI. The i-th voxel weighting factor is calculated using the equation: wi = (1di)α∑(1di)αi = Ni = 1. di denotes the distance between the center of the i-th voxel and the ROI center of mass, and α is an integer constant (≥1) that controls the relative contribution of boundary voxel spectra to the overall ROI spectrum. In the present study, α was set to 2. As α increases, the contribution of voxels farther from the center of mass decreases, such that in the limit of large α, the ROI spectrum is dominated by the voxel spectrum located in the center of mass.
The weighted time-domain dataset then underwent apodization with a 5 Hz Lorentzian line broadening. The dataset for the desired ROI was then fitted using the MATLAB-based (MathWorks, Inc., Natick, MA, USA) AMARES program [10]. In our time-domain data fitting template, we modeled phosphocreatine (PCr), inorganic phosphate (Pi), nicotinamide adenine dinucleotide, an anabolic precursor (phosphomonoester [PME]) of membrane phospholipid, a catabolic metabolite (phosphodiester [PDE]) of membrane phospholipid, and the α-, β-, γ-nucleotide triphosphates as exponentially damped sinusoids. Brain tissue pH was computed using the modified Henderson–Hasselbalch equation [11].
Participants met criteria for early-stage cognitive decline, defined as Clinical Dementia Rating (CDR) scores of 0.5–1.0 [12]. Neurocognitive performance was further assessed using the Repeatable Battery for the Assessment of Neuropsychological Status (RBANS) [13]. The RBANS Total Scale Score was derived from age-, sex-, and education-adjusted index scores (Immediate Memory, Visuospatial/Constructional, Language, Attention, and Delayed Memory). Linear regression analyses of pre–during changes in fALFF included baseline clinical measures (CDR and the RBANS Delayed Memory subscale (RBANS_DM)) and baseline 31P-MRS metabolites (PCr/Pi, pH) as predictors. All statistical analyses were conducted in R Studio (R version 4.5.1). For linear regression models, 95% confidence intervals for regression coefficients were calculated using standard parametric methods.
3. Results
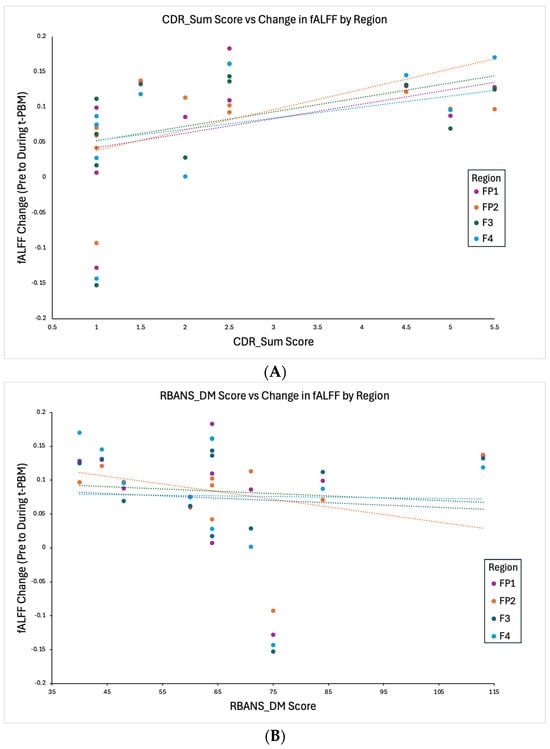
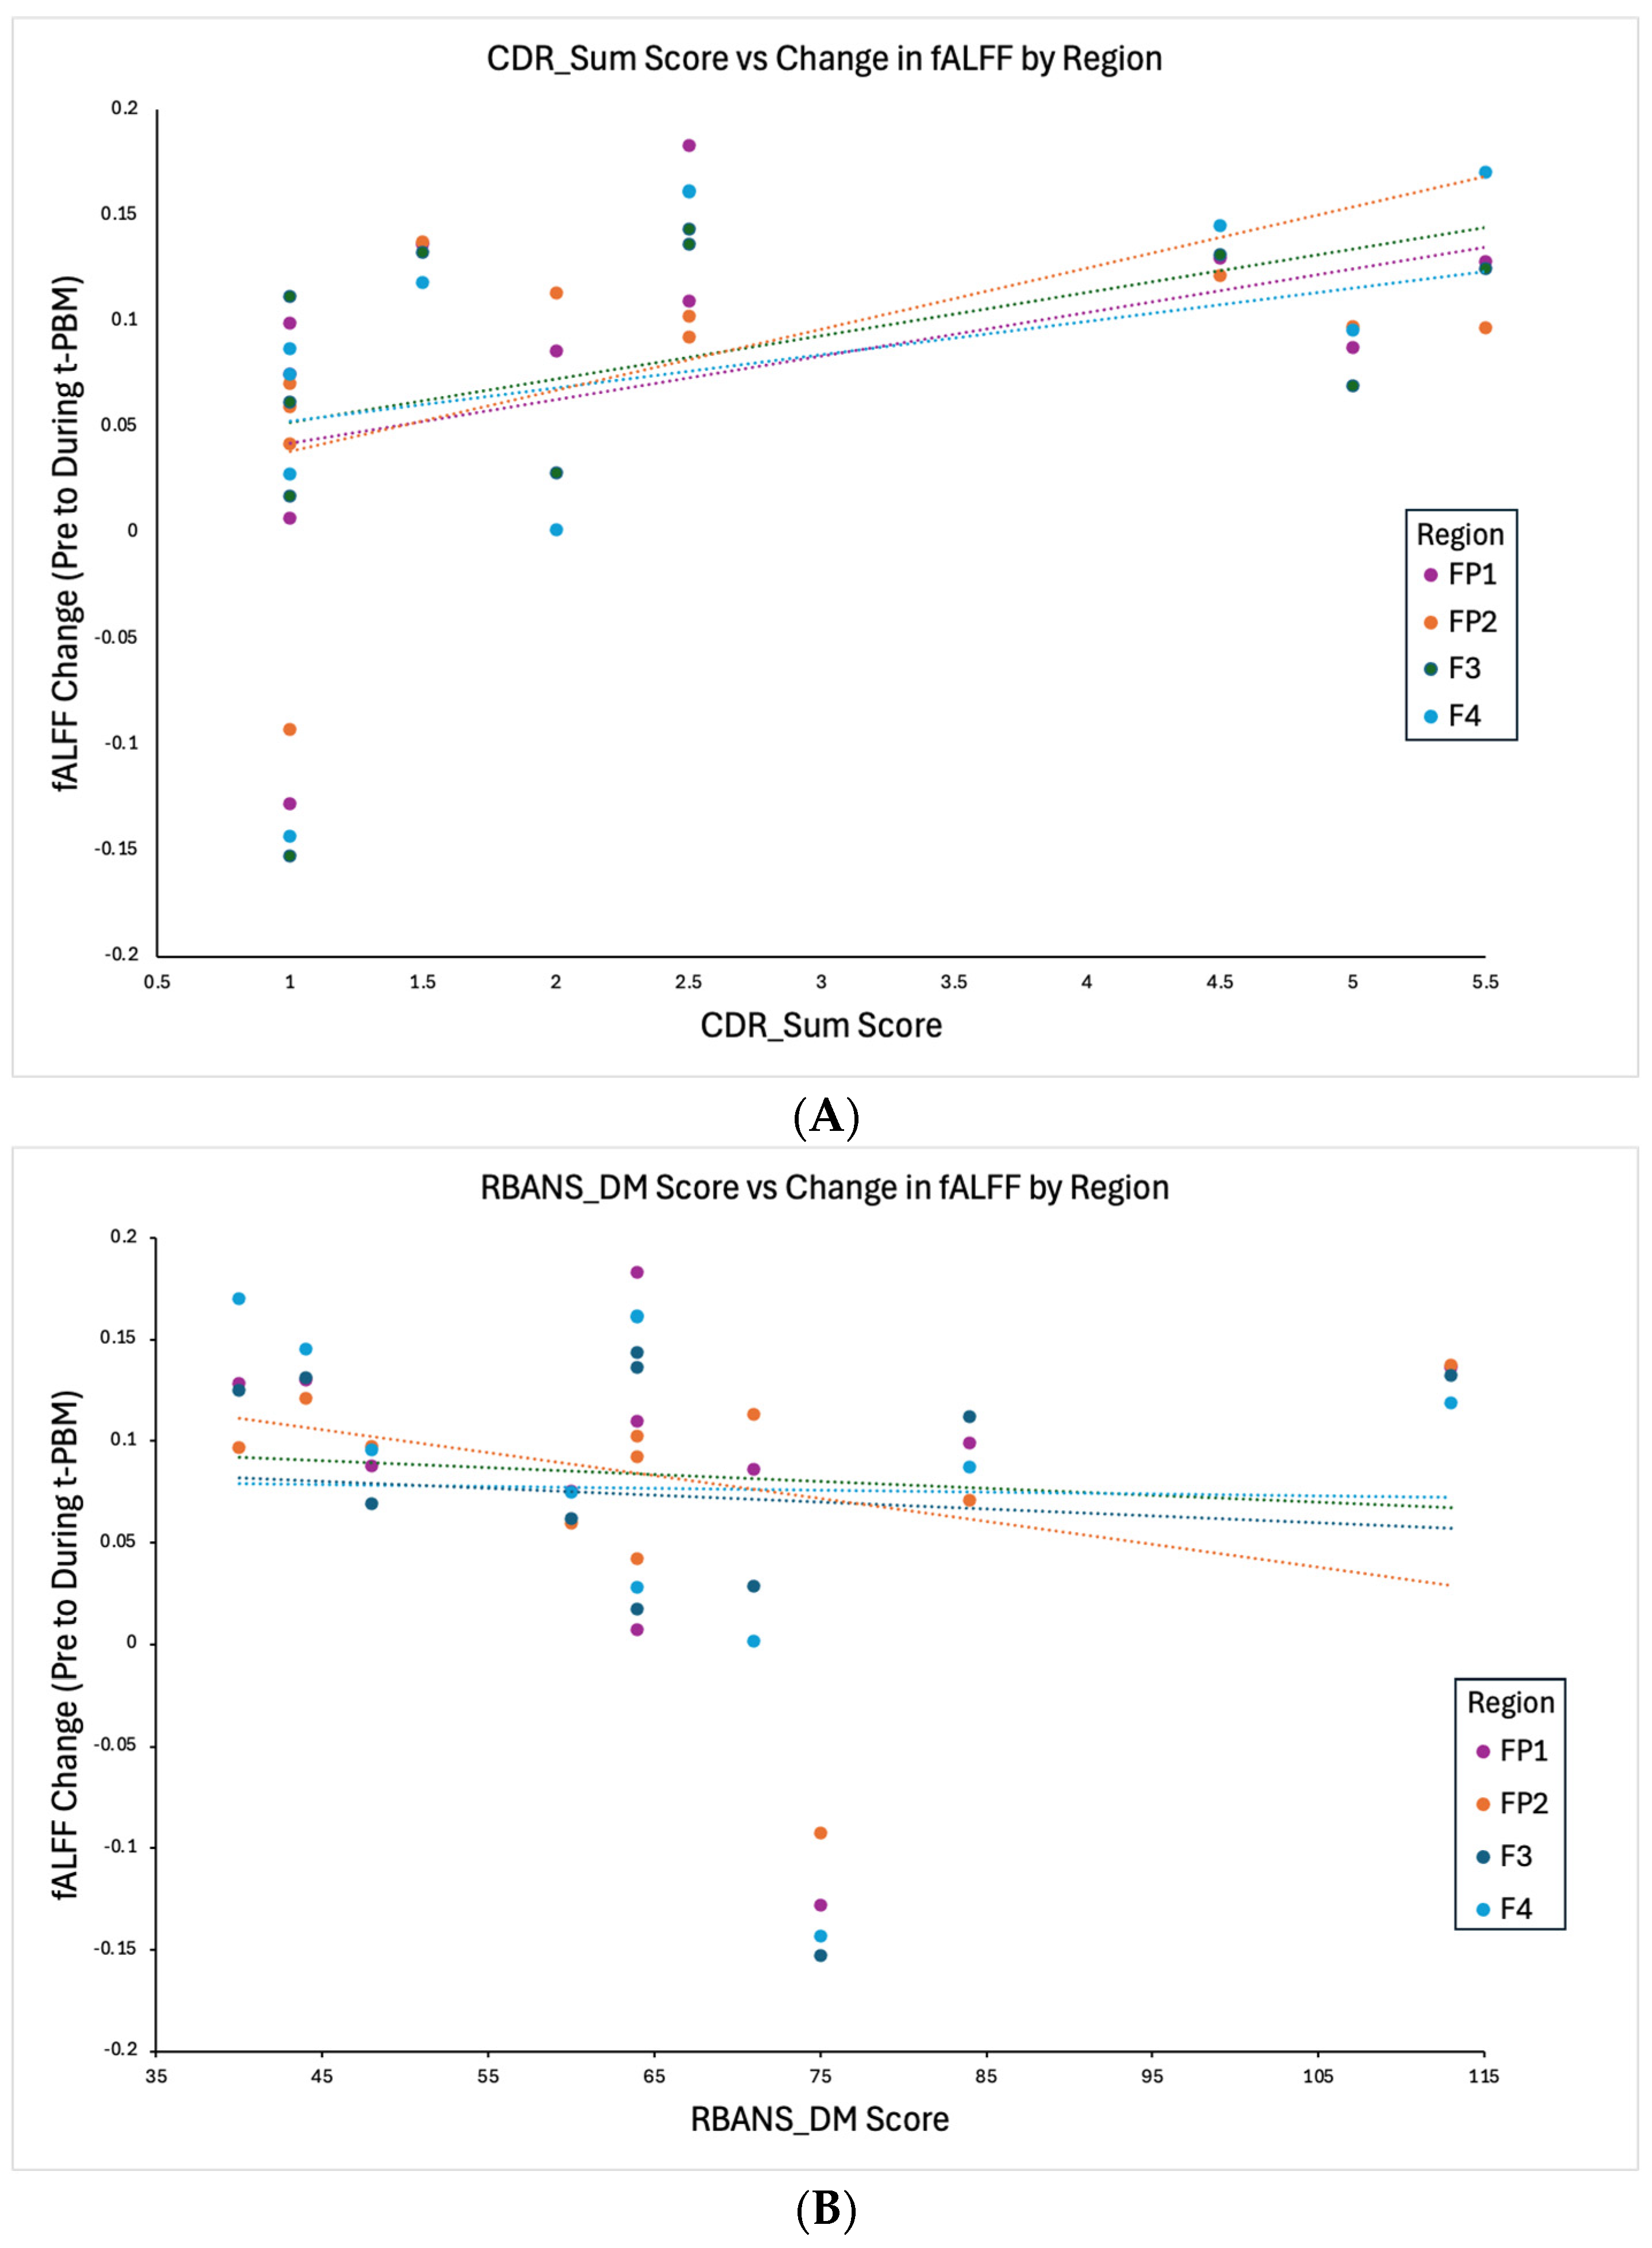
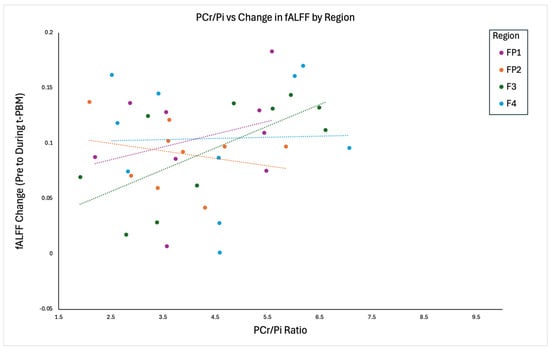
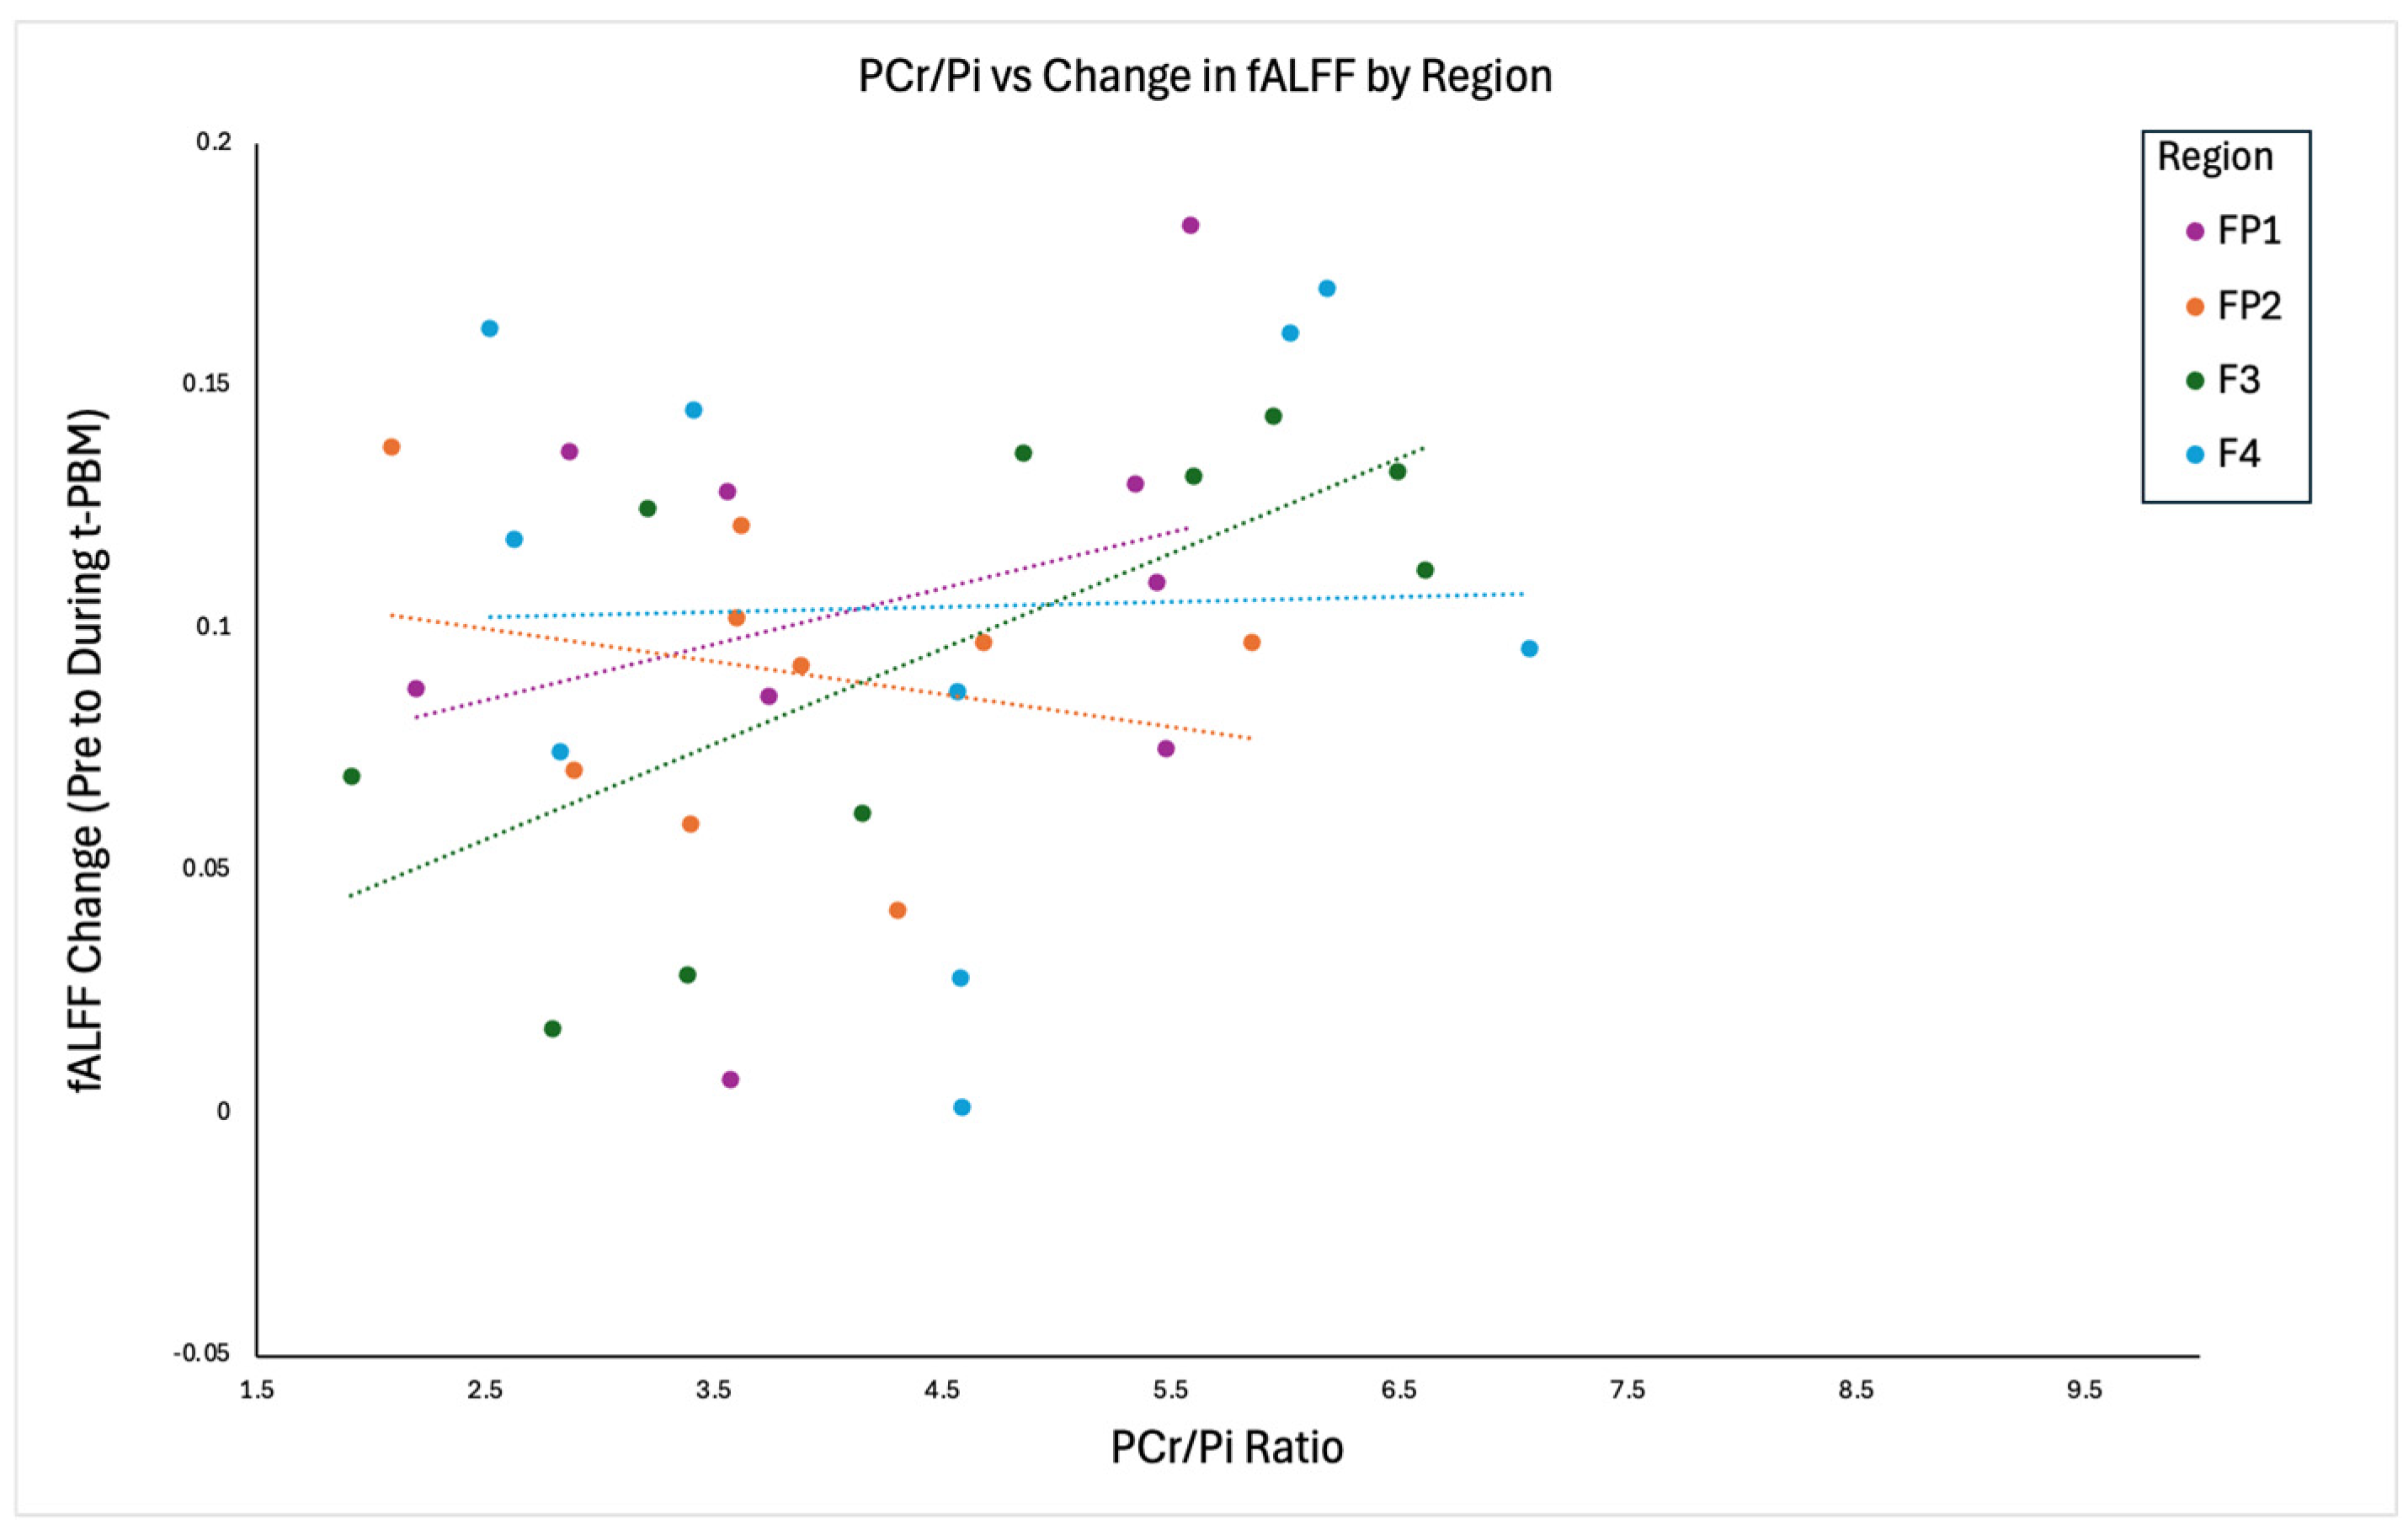
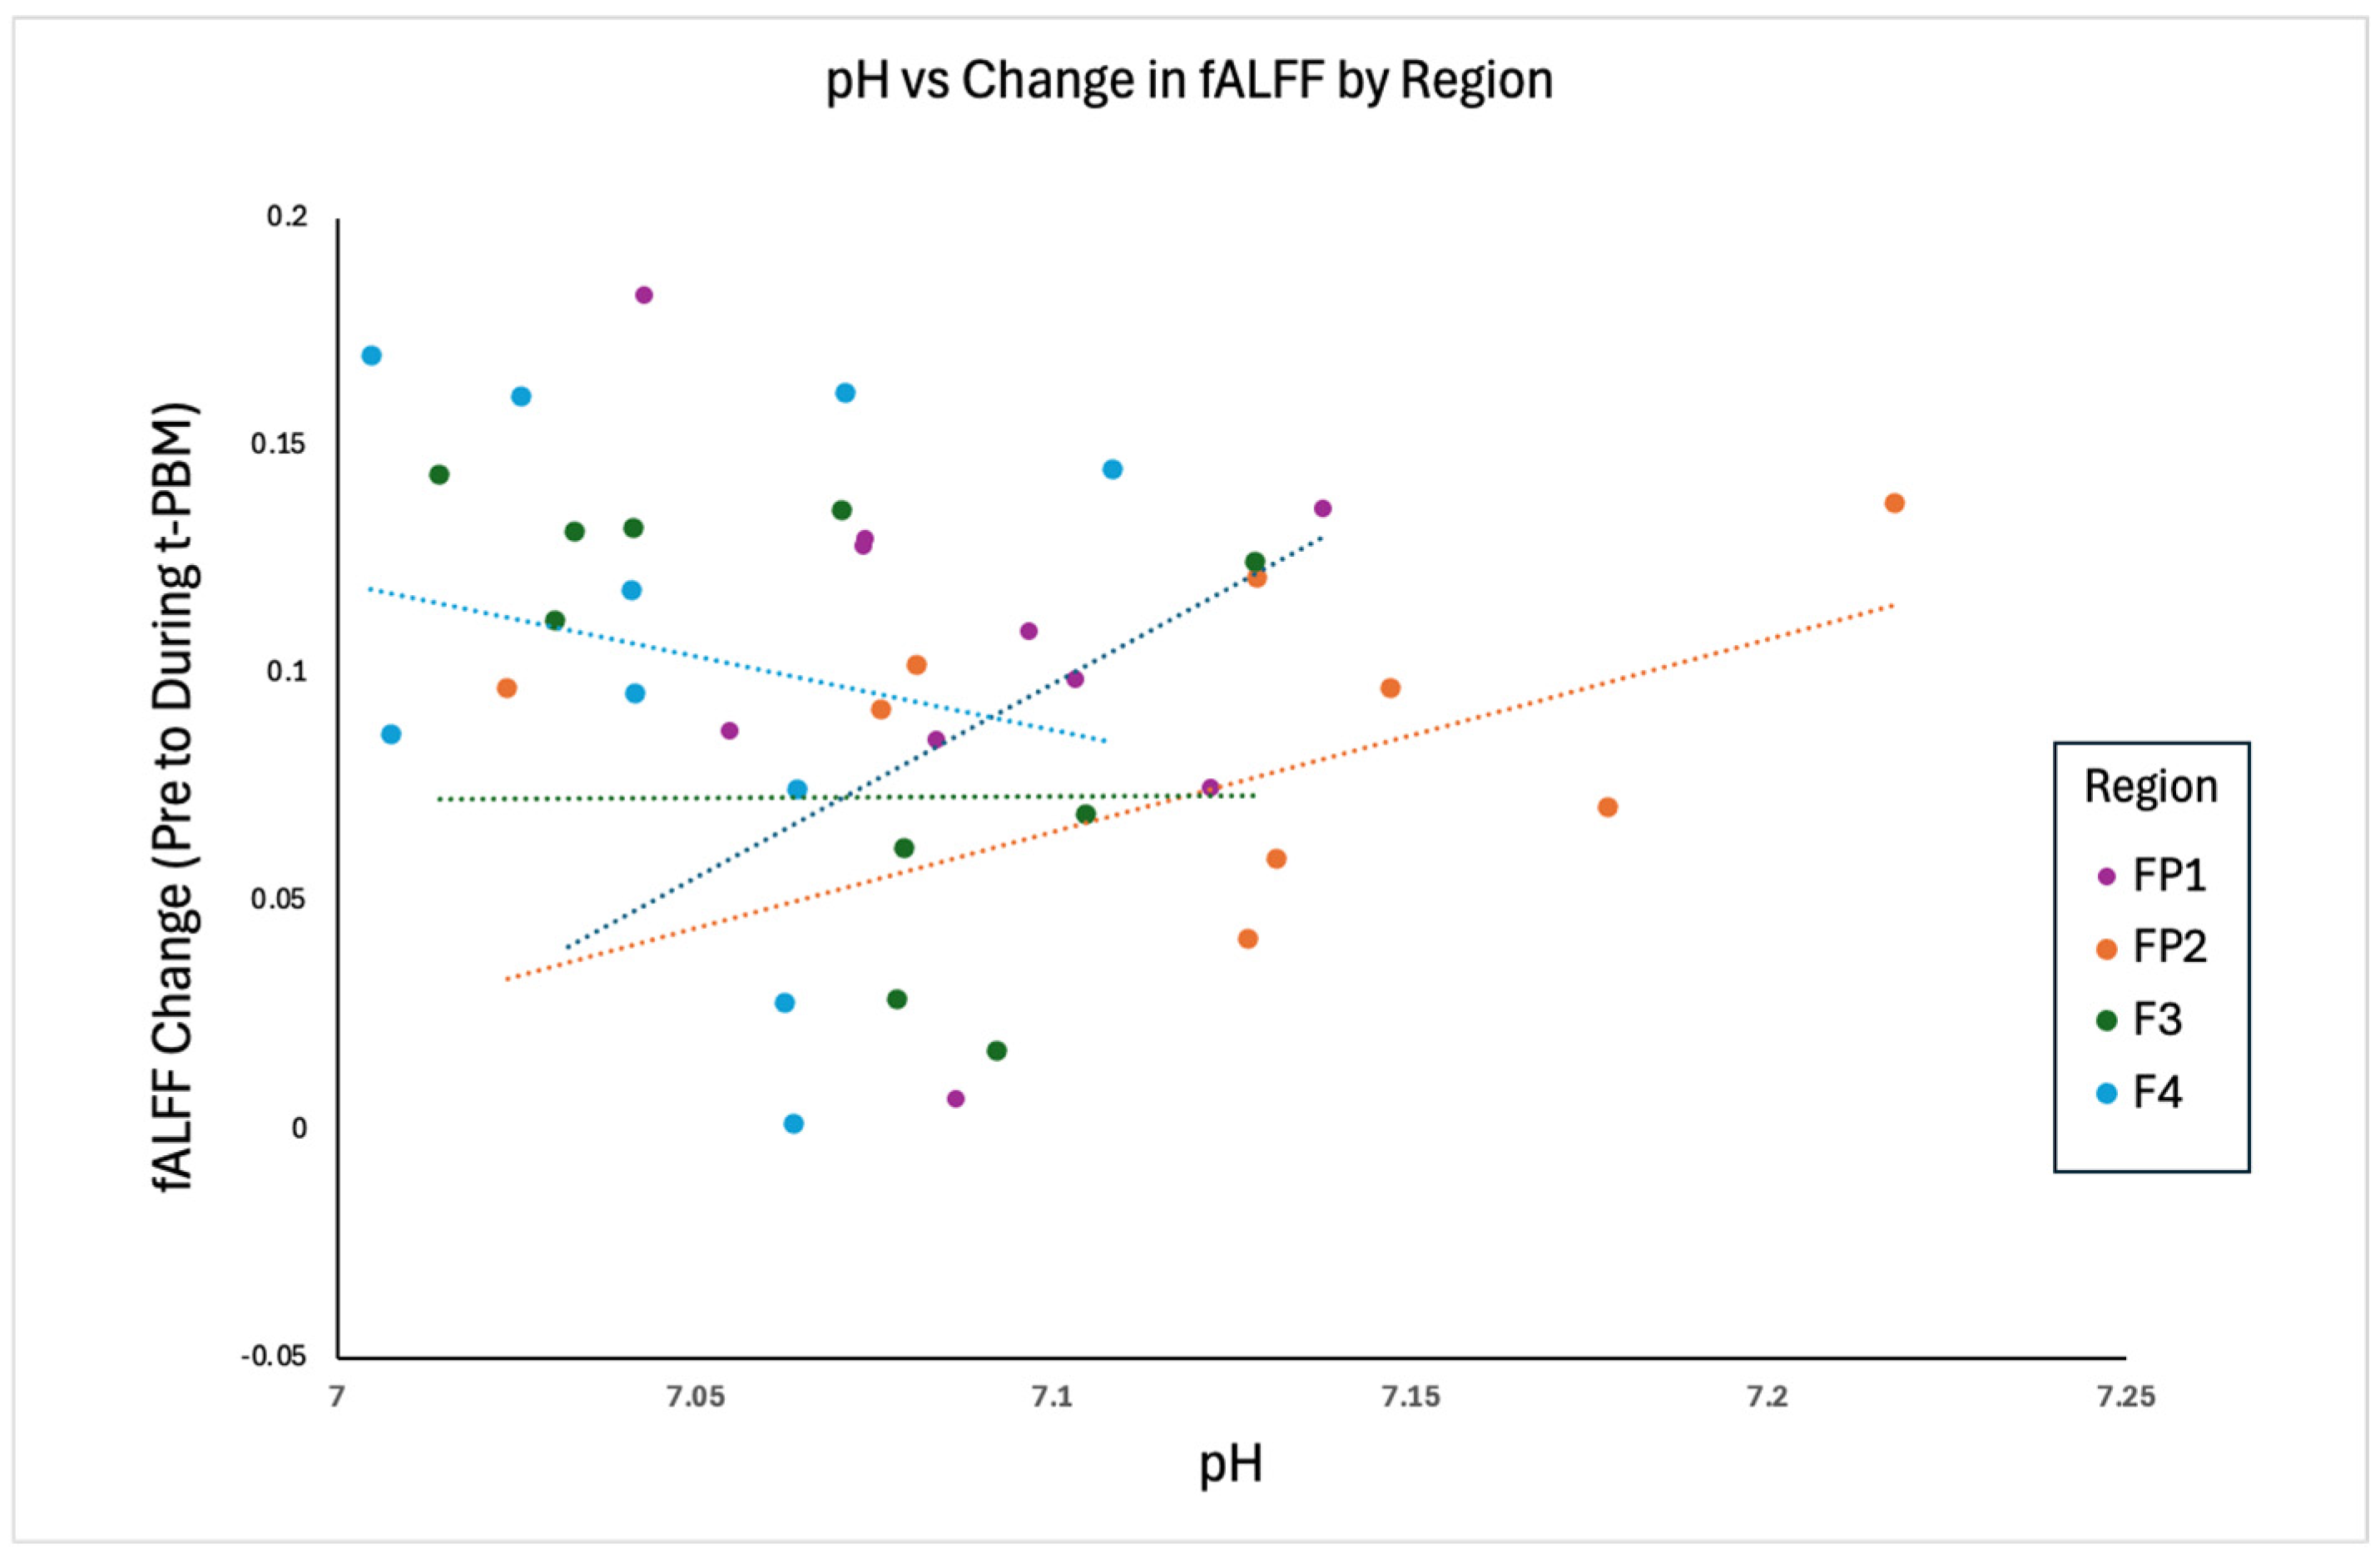
Linear regression analyses examined the relationship between fALFF change from pre- to during t-PBM and clinical (Figure 1A,B) and metabolic (Figure 2 and Figure 3) predictors across four frontal regions. In FP2, the model explained 99.2% of the variance (R2 = 0.992, p < 0.001). Lower baseline PCr/Pi (Estimate = −0.0226, 95% CI [−0.0260, −0.01921] p < 0.001) and lower pH (Estimate = −0.1933, 95% CI [−0.3825, −0.00405], p = 0.047) significantly predicted greater increases in fALFF, as did greater dementia severity (CDR; Estimate = 0.0219, 95% CI [0.0168, 0.02706] p < 0.001) and higher delayed memory scores (RBANS_DM; Estimate = 0.000981, 95% CI [0.000461, 0.00150], p = 0.005). In F4, the model accounted for 59.9% of the variance (R2 = 0.599). PCr/Pi showed a marginal negative association with fALFF change (Estimate = −0.0393, 95% CI [−0.08664, 0.00799], p = 0.088), while CDR approached significance (Estimate = 0.0448, 95% CI [−0.000949, 0.09778], p = 0.053); pH (Estimate = −1.13940, 95% CI [−3.42825, 1.14945], p = 0.269) and RBANS_DM (Estimate = 0.00112, 95% CI [−0.00306, 0.00531], p = 0.536) were not significant. In FP1, the model explained 45.3% of the variance (R2 = 0.453), and none of the predictors reached significance: PCr/Pi (Estimate = 0, 95% CI [−0.01387, 0.01546], p = 0.899), pH (Estimate = 0, 95% CI [−0.94439, 3.53582], p = 0.207), CDR (Estimate = 0, 95% CI [−0.01777, 0.08860], p = 0.154), or RBANS_DM (Estimate = 0, 95% CI [−0.00385, 0.00520], p = 0.367). Finally, in F3, the model explained 73.1% of the variance (R2 = 0.731). PCr/Pi was positively associated with fALFF change (Estimate = 0.0730, 95% CI [0.01788, 0.12812], p = 0.018), while pH trended toward significance (Estimate = 2.0217, 95% CI [−0.29442, 4.33775], p = 0.077) and both CDR (Estimate = 0.0179, 95% CI [−0.02188, 0.05774], p = 0.313) and RBANS_DM (Estimate = 0.000650, 95% CI [−0.0425, 0.00296, p = 0.675) were non-significant.
Figure 1.
(A) Scatterplot showing the relationship between Clinical Dementia Rating Sum of Boxes (CDR_SUM) scores and fALFF change by ROI. (B) Scatterplot showing the relationship between RBANS Delayed Memory (DM) scores and fALFF change by ROI. Dotted line represents slope for each change of respective variables within each ROI.
Figure 2.
Scatterplot showing the relationship between baseline PCr/Pi ratio and change in fALFF (pre-to during t-PBM) across each ROI. Two observations with baseline PCr/Pi values exceeding ±2.5 standard deviations from the regional mean (FP1 and FP2) were excluded. Dotted line represents slope for each change of respective variables within each ROI.
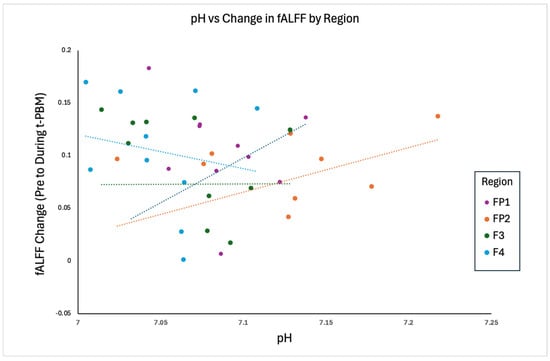
Figure 3.
Scatterplot showing the relationship between baseline pH and change in fALFF (pre-to during t-PBM) across each ROI. Six observations exceeding ±2.5 standard deviations from the regional mean were excluded. Dotted line represents slope for each change of respective variables within each ROI.
To evaluate whether baseline metabolic measures were associated with cognitive status, exploratory linear regression analyses were conducted between regional PCr/Pi, pH, and CDR. Across regions, lower pH showed a consistent, though non-significant, association with greater dementia severity in FP2 (Estimate = −10.6, p = 0.334), FP1 (Estimate = −18.6, p = 0.297), and F4 (Estimate = −14.2, p = 0.447), but not in F3 (Estimate = 21.4, p = 0.165). Similarly, lower PCr/Pi demonstrated a non-significant trend toward higher CDR in FP1 (Estimate = −0.157, p = 0.185) and F3 (Estimate = −0.358, p = 0.325), while no relationship was observed in FP2 (Estimate = −0.013, p = 0.959) and an opposite, non-significant association was seen in F4 (Estimate = 0.474, p = 0.184).
Exploratory analyses were also conducted to assess relationships between baseline metabolic measures and RBANS_DM. Higher pH demonstrated a consistent positive association with RBANS_DM in FP2 (Estimate = 230, p = 0.055), FP1 (Estimate = 316, p = 0.120), and F4 (Estimate = 245, p = 0.260), indicating that improved metabolic status may be associated with better memory performance, with the strongest trend observed in FP2. In contrast, F3 showed an opposite, non-significant relationship (Estimate = −280, p = 0.121). Similarly, PCr/Pi demonstrated a positive association with RBANS_DM in F3 (Estimate = 7.24, p = 0.075), suggesting improved energy metabolism may relate to better memory performance in this region, while weaker or inconsistent relationships were observed in FP1 (Estimate = 1.19, p = 0.413), FP2 (Estimate = −1.48, p = 0.622), and F4 (Estimate = −5.34, p = 0.211).
4. Discussion
These results demonstrate that areas with decreased oxidative metabolism at baseline, indicated by decreased pH and low PCr/Pi, showed the largest increases in fALFF after t-PBM. Interestingly, all participants had decreased pH (below 7.4), indicating mitochondrial dysfunction. Those with a pH closer to 7.4 in FP2 demonstrated greater change in fALFF post t-PBM in regions where neurodegeneration begins to occur [14], which includes frontal regions [15]. pH levels eventually decrease as AD progresses and individuals continue to deteriorate [16], although these relationships may be less apparent in earlier-stage cohorts such as the present sample. It is noteworthy that following a single t-PBM session, less impaired but still dysfunctional pH regions showed greater fALFF responses. This may reflect a window of responsiveness, and future research should explore this. To understand if baseline pH varied across regions, we conducted exploratory linear mixed-effects models, which demonstrated that FP2 pH values were significantly higher than F3 ((beta = 0.054), 95% CI [0.023, 0.085], (p = 0.001)). No significant differences were observed for F4 ((beta = −0.013), 95% CI [−0.045, 0.019], (p = 0.420)) or FP1 ((beta = 0.018), 95% CI [−0.013, 0.049], (p = 0.245)) relative to F3.
We also explored if PCr/Pi ratio difference across regions may explain these results. However, no significant regional differences were observed. Compared with F3, neither F4 (beta = 0.10, 95% CI [−2.21, 2.41], p = 0.930), FP1 (beta = 1.62, 95% CI [−0.73, 3.97], p = 0.173) nor FP2 (beta = 0.10, 95% CI [−2.44, 2.64], p = 0.938) differed significantly. However, exploratory analyses of 31P-MRS and cognition, while not statistically significant, suggest a general trend whereby reduced metabolic function is associated with greater dementia severity, particularly in select frontal regions, though variability across hemispheres was observed. These preliminary results support (1) the efficacy of both 31P-MRS and (2) MRI measures as biomarkers of t-PBM engagement and that changes in intrinsic brain activity after t-PBM application may be related to baseline cerebral metabolism.
These results suggest that a single administration of t-PBM appeared most efficacious (in increasing brain metabolism measured with fALFF) in individuals with greater baseline metabolic dysfunction and in brain areas with more impaired bioenergetic metabolism. Associations with cognitive measures were less consistent across metrics, which may reflect the relatively early disease stage of the present MCI/early AD cohort. The descriptive discrepancies between CDR and RBANS_DM and their relationship with change in fALFF (Figure 1A,B) likely reflect that these measures assess different aspects of cognitive functioning and disease severity. CDR captures global clinical impairment and functional decline, whereas RBANS delayed memory reflects a more specific cognitive domain. Additionally, the unadjusted bivariate relationship depicted in Figure 1B suggests a negative relationship between change in fALFF and RBANS_DM; however, the adjusted relationship in the model reported in the results suggests a weak, positive relationship. This discrepancy likely reflects the influence of covariate adjustment and shared variance among predictors. This is also seen in the relationship between baseline metabolism and memory performance. Given the small sample size and exploratory nature of the analyses, these results should be interpreted with caution. In contrast, associations between baseline metabolic measures and fALFF response were more regionally consistent. This was primarily true in the right hemisphere, particularly in FP2 (right frontal pole, area directly irradiated by t-PBM) and, to a lesser degree, F4. These consistent right-hemisphere signals suggest that t-PBM may preferentially engage right frontal networks in individuals with greater severity of dementia, particularly those with more advanced cognitive decline and metabolic dysfunction. This supports the presumed mechanism of t-PBM (restoring abnormal brain mitochondrial function) and highlights potential targets for future therapeutic trials.
Overall, these results support the potential for even short-term t-PBM to briefly normalize decreased metabolic states in affected brain areas in patients experiencing early stages of cognitive decline (i.e., CDR 0.5–1.0) and neurodegeneration. Sensitivity analyses excluding outliers indicated that most findings were robust, although in F4, FP1, and F3, model fit improved markedly following outlier removal, and in FP1, the RBANS Delayed Memory subscale approached statistical significance only in the outlier-excluded model.
Several limitations warrant consideration. First, the small sample size and single-session design limit generalizability and preclude assessment of sustained therapeutic effects. Second, statistical analyses were uncorrected for multiple comparisons due to the exploratory nature of this analysis. So, findings should be considered hypothesis-generating. However, after FDR correction, all significant findings remain significant. Third, the absence of a sham-control group prevents definitive attribution of fALFF changes solely to t-PBM rather than placebo or other effects, such as switching of attentional or arousal states. Our ongoing clinical trials will address this upon completion. This consideration may be particularly relevant for frontal regions, which are sensitive to attentional engagement and cognitive state. Lastly, although the FP2 model demonstrated a high degree of explained variance (R2 = 0.992; adjusted R2 = 0.986), this should be interpreted with caution given the small sample size and number of predictors included. While multicollinearity was not evident (all VIFs < 3), the model may still reflect overfitting, capturing sample-specific variance rather than generalizable effects. These findings should therefore be considered preliminary and require replication in larger cohorts.
While these results are preliminary and hypothesis-generating, our methods were designed to minimize MRS signal variability arising from misalignment of brain tissue locations across subjects. During MRS acquisition, the spectral grid is positioned on a high-resolution structural image. Conventionally, grid placement relies on predefined anatomical landmarks; for example, aligning a specific voxel within the three-dimensional spectral grid to a reference region such as the pre-genu area. Although this landmark-based strategy can achieve satisfactory tissue alignment near the reference location, inter-subject anatomical variability becomes increasingly problematic when metabolite concentrations are evaluated across multiple brain regions. In such cases, signals from nominally identical voxels may originate from different brain tissues across subjects. In contrast, the approach used in the present study maps the same ROI onto each subject’s brain, ensuring that MRS signals are consistently extracted from the targeted brain region across subjects. Consequently, variability in MRS measurements more likely reflects intrinsic metabolite alterations associated with disease rather than differences arising from tissue misalignment.
Future research should consider (1) baseline metabolism at the sites of t-PBM activity, (2) that fALFF changes correlate with direct metabolic improvements measured by FDG-PET or repeat 31P-MRS, and (3) the potential lateralized response pattern. This pilot analysis is part of an ongoing RCT study; follow-up analyses are examining the predictive power of change in intrinsic brain activity and baseline metabolism to clinical outcome following multiple treatment sessions. Nevertheless, these preliminary results suggest both the importance of baseline metabolism, as quantified with 31P-MRS, as a predictor of t-PBM response and the utility of fALFF as an easily obtained index of cerebral metabolism. Finally, these results advocate that t-PBM may represent a promising treatment for neurodegenerative and cognitive disorders.
Author Contributions
All authors were involved in writing—review and editing. D.V.I. and R.S.O. were involved in funding acquisition and project administration. N.L.G. was involved in writing—original draft preparation, conceptualization, and formal analysis. X.S. was involved in formal analysis. All authors have read and agreed to the published version of the manuscript.
Funding
This research was funded in part by the Alzheimer’s Association (PhESAD): PTCG-20-706555 (PI: Iosifescu) and the NIA R01AG068248 (PI: Iosifescu, Cassano, Osorio).
Institutional Review Board Statement
The study was conducted in accordance with the Declaration of Helsinki, and approved by the Institutional Review Board of New York University Grossman School of Medicine (protocol code i20-00865 on 24 July 2020).
Informed Consent Statement
All human subjects provided informed consent.
Data Availability Statement
Data available upon request.
Conflicts of Interest
K.A.C. has consulted for MedAvante-ProPhase, and A. Stein- Regulatory Affairs Consulting, Ltd. in the past, and currently serves as a consultant to Cronos Clinical Consulting Services, Inc. and Relmada Therapeutics, Inc. In the last 10 years, D.V.I. has served as a consultant for Alkermes, Allergan, Angelini, Autobahn, Axsome, Biogen, Boehringer Ingelheim, Centers for Psychiatric Excellence, Clexio, Delix, Jazz, Lundbeck, Neumora, Otsuka, Precision Neuroscience, Relmada, Sage and Sunovion. He has received grant support (paid to his institutions) from Alkermes, AstraZeneca, BrainsWay, LiteCure, NeoSync, Otsuka, Roche, and Shire. Over the past 10 years, R.S.O. has served as a consultant for the Alliance for Sleep (Idorsia), with his salary supported by NIH grants R01AG056031 and R01AG056531. P.R. has no conflicts of interest to disclose at the present time. However, he expects to enter into a consultancy with Autobahn. N.L.G. and X.S. have no conflicts to disclose.
References
- Salmon, E.; Collette, F.; Bastin, C. Cerebral glucose metabolism in Alzheimer’s disease. Cortex 2024, 179, 50–61. [Google Scholar] [CrossRef] [Scilit] [PubMed]
- Hamblin, M.R. Shining light on the head: Photobiomodulation for brain disorders. BBA Clin. 2016, 6, 113–124. [Google Scholar] [CrossRef] [Scilit] [PubMed]
- Rietzler, A.; Steiger, R.; Mangesius, S.; Walchhofer, L.-M.; Gothe, R.M.; Schocke, M.; Gizewski, E.R.; Grams, A.E. Energy metabolism measured by 31P magnetic resonance spectroscopy in the healthy human brain. J. Neuroradiol. 2022, 49, 370–379. [Google Scholar] [CrossRef] [Scilit] [PubMed]
- Zou, Q.H.; Zhu, C.Z.; Yang, Y.; Zuo, X.N.; Long, X.Y.; Cao, Q.J.; Wang, Y.F.; Zang, Y.F. An improved approach to detection of amplitude of low-frequency fluctuation (ALFF) for resting-state fMRI: Fractional ALFF. J. Neurosci. Methods 2008, 172, 137–141. [Google Scholar] [CrossRef] [Scilit] [PubMed] [PubMed Central]
- Gaggi, N.L.; Collins, K.A.; Gonzalez-Castillo, J.; Hurtado, A.M.; Castellanos, F.X.; Osorio, R.; Cassano, P.; Iosifescu, D.V. Transcranial photobiomodulation increases intrinsic brain activity within irradiated areas in early Alzheimer’s disease: Potential link with cerebral metabolism. Brain Stimul. 2024, 17, 208–210. [Google Scholar] [CrossRef] [Scilit] [PubMed]
- Gaggi, N.L.; Liebers, D.T. Imaging brain energetics to advance metabolic psychiatry. Neuropsychopharmacology 2025. Epub ahead of print. [Google Scholar] [CrossRef] [Scilit] [PubMed]
- Parasoglou, P.; Osorio, R.S.; Khegai, O.; Kovbasyuk, Z.; Miller, M.; Ho, A.; Dehkharghani, S.; Wisniewski, T.; Convit, A.; Mosconi, L.; et al. Phosphorus metabolism in the brain of cognitively normal midlife individuals at risk for Alzheimer’s disease. Neuroimage Rep. 2022, 2, 100121. [Google Scholar] [CrossRef] [Scilit] [PubMed]
- Song, T.; Song, X.; Zhu, C.; Patrick, R.; Skurla, M.; Santangelo, I.; Green, M.; Harper, D.; Ren, B.; Forester, B.P.; et al. Mitochondrial dysfunction, oxidative stress, neuroinflammation, and metabolic alterations in the progression of Alzheimer’s disease: A meta-analysis of in vivo magnetic resonance spectroscopy studies. Ageing Res. Rev. 2021, 72, 101503. [Google Scholar] [CrossRef] [Scilit] [PubMed]
- Larsson, E.G.; Erdogmus, D.; Yan, R.; Principe, J.C.; Fitzsimmons, J.R. SNR-optimality of sum-of-squares reconstruction for phased-array magnetic resonance imaging. J. Magn. Reson. 2003, 163, 121–123. [Google Scholar] [CrossRef] [Scilit] [PubMed]
- Vanhamme, L.; van den Boogaart, A.; Van Huffel, S. Improved method for accurate and efficient quantification of MRS data with use of prior knowledge. J. Magn. Reson. 1997, 129, 35–43. [Google Scholar] [CrossRef] [Scilit] [PubMed]
- Iotti, S.; Frassineti, C.; Alderighi, L.; Sabatini, A.; Vacca, A.; Barbiroli, B. In vivo (31)P-MRS assessment of cytosolic [Mg(2þ)] in the human skeletal muscle in different metabolic conditions. Magn. Reson. Imaging 2000, 18, 607–614. [Google Scholar] [CrossRef] [Scilit] [PubMed]
- Morris, J.C. The Clinical Dementia Rating (CDR): Current version and scoring rules. Neurology 1993, 43, 2412–2414. [Google Scholar] [CrossRef] [Scilit] [PubMed]
- Gontkovsky, S.T.; Mold, J.W.; Beatty, W.W. Age and educational influences on RBANS index scores in a nondemented geriatric sample. Clin. Neuropsychol. 2002, 16, 258–263. [Google Scholar] [CrossRef] [Scilit] [PubMed]
- Chaumeil, M.M.; Valette, J.; Baligand, C.; Brouillet, E.; Hantraye, P.; Bloch, G.; Gaura, V.; Rialland, A.; Krystkowiak, P.; Verny, C.; et al. pH as a biomarker of neurodegeneration in Huntington’s disease: A translational rodent-human MRS study. J. Cereb. Blood Flow Metab. 2012, 32, 771–779. [Google Scholar] [CrossRef] [Scilit] [PubMed]
- Hirono, N.; Mori, E.; Ishii, K.; Ikejiri, Y.; Imamura, T.; Shimomura, T.; Hashimoto, M.; Yamashita, H.; Sasaki, M. Frontal lobe hypometabolism and depression in Alzheimer’s disease. Neurology 1998, 50, 380–383. [Google Scholar] [CrossRef] [Scilit] [PubMed]
- Decker, Y.; Németh, E.; Schomburg, R.; Chemla, A.; Fülöp, L.; Menger, M.D.; Liu, Y.; Fassbender, K. Decreased pH in the aging brain and Alzheimer’s disease. Neurobiol. Aging 2021, 101, 40–49. [Google Scholar] [CrossRef] [Scilit] [PubMed]
Disclaimer/Publisher’s Note: The statements, opinions and data contained in all publications are solely those of the individual author(s) and contributor(s) and not of MDPI and/or the editor(s). MDPI and/or the editor(s) disclaim responsibility for any injury to people or property resulting from any ideas, methods, instructions or products referred to in the content. |
© 2026 by the authors. Licensee MDPI, Basel, Switzerland. This article is an open access article distributed under the terms and conditions of the Creative Commons Attribution (CC BY) license.