


Abstract
Dust deposition on photovoltaic (PV) surfaces reduces the light reaching the cells. This article establishes a scattering and transmission model of dust accumulation on photovoltaic panels based on the Bidirectional Reflectance Distribution Function (BRDF) model. It analyzes the influence of the dust particle composition, size, quantity, and other parameters on the light-transmission characteristics of photovoltaic panels, constructs an electromagnetic model of dust-accumulated photovoltaic panels, and studies the effect of different amounts of dust accumulation on the scattering and reflection characteristics of the panels. By setting up a scattering measurement platform and using modulated active light sources for illumination, it explores the scattering and transmittance rates of photovoltaic panels under different levels of dust accumulation. A comparison of the mean experimental results from five different positions with the theoretical predictions yields mean absolute errors of 4.23 percentage points for transmittance and 21.28 ppm for the scattering rate. Modulated illumination and lock-in detection were used to suppress ambient-light interference during the laboratory measurements. The combined transmittance and scattering measurements characterize changes in surface soiling at 635 nm and provide a basis for developing site-calibrated optical indicators to support photovoltaic inspection and cleaning decisions.
1. Introduction
At present, the world’s energy supply is still dominated by non-renewable energy sources, which account for approximately 93% of the total energy consumption [1,2,3]. Solar photovoltaic cells are devices that convert solar radiation directly into electrical energy through the photovoltaic effect, similar to semiconductor photodiodes. The light energy from the sun is converted into electrical energy, generating a current [4,5,6,7]. Photovoltaic power generation, as an important clean and renewable energy source, has achieved rapid development [8,9,10,11]. To ensure sufficient power generation from solar photovoltaic modules, monocrystalline silicon solar cells are used inside the modules, and externally, tempered matte glass (also known as white glass), with a transparency of over 91% within the wavelength range of the solar cell spectrum response (320–1100 nm), is utilized for encapsulation. Outdoor solar photovoltaic power generation systems generate electricity by converting solar radiation into electrical energy through photovoltaic conversion [12,13]. The intensity of the received solar radiation is a key factor affecting its power generation. The solar radiation intensity received by the internal solar cells is also related to the transparency of the encapsulating glass of the solar cells [14,15,16,17,18]. Exposure to air for long periods can cause dust accumulation on photovoltaic panels. Dust accumulation on the panels can increase diffuse reflection and affect the transmittance [19,20,21]. At the same time, the shading effect and temperature effect generated by dust accumulation have a significant impact on the output characteristics of photovoltaic panels [22,23,24,25]. Currently, the industry has developed relatively mature power-output prediction models for photovoltaic power generation systems. However, the detection of dust accumulation on photovoltaic panels still relies mainly on subjective human inspection or indirectly characterizing the dust accumulation level of the photovoltaic power generation system through dust-detection devices placed next to the photovoltaic modules. Minakshi Katoch et al. [26] studied the impact of dust particles on the transmittance of solar photovoltaic systems at different installation angles. Nimmo et al. [27] discovered that the photovoltaic panel efficiency decreased by 40 percent over a period of about six months. The work of Asbayou A [28] is based on the use of experimental current–voltage (I–V) characteristics with simulated data using MATLAB R2024b/Simulink. To assess the optical transmittance of accumulated dust on the surface of PV glass, Semaoui [29] conducted experiments on the impact of dust particle accumulation on the output performance of photovoltaic panels under natural conditions using an irradiance model. The experimental results of the above studies consistently show that dust accumulation significantly reduces the transmittance of the photovoltaic panel glass and the output power of the modules; for example, the efficiency of a photovoltaic panel can decrease by about 40% after six months of outdoor operation without cleaning [27], and the attenuation becomes more severe as the dust density increases. These observations motivate a quantitative optical indicator of surface soiling rather than a universal cleaning interval based only on elapsed time.
Optical monitoring is already an established approach for PV soiling assessments. Smestad et al. [30] related naturally soiled glass transmission spectra to particle coverage and size distributions, and Micheli et al. [31] examined relationships between waveband or single-wavelength transmittance and technology-dependent PV soiling losses. Alkharusi et al. [32] investigated nonuniform natural soiling and demonstrated the importance of spatially resolved characterization. The model of Sengupta et al. [33], concerning water-cleaning effects on antisoiling coatings, addresses deposition and removal under environmental forcing. That work describes how the dust load evolves, whereas the present optical model describes the response of an existing deposited layer. These studies establish the relevant optical and environmental background and prevent treating a local monochromatic measurement as a universal indicator of module energy loss.
To solve the above problems, this paper carries out the research in three steps. First, a theoretical scattering-transmission model of the dust layer is established based on the Mie scattering theory, in which the particle size distribution of the dust is described by the Rosin–Rammler distribution and the theoretical relationships between the dust-accumulation density and the transmittance and scattering rate. Second, an electromagnetic model of the dust-accumulated photovoltaic panel, including the tempered glass, the EVA layer, the silicon cell, and a perfectly matched layer, is used to simulate the spatial redistribution of the light field caused by dust particles. Third, a scattering measurement device is set up, in which a modulated semiconductor laser combined with a lock-in amplifier is used to suppress environmental light interference, and the transmittance and scattering rate of panels with different dust accumulation densities are measured. The statistical results of multipoint detection are used to characterize the dust-accumulation status of the tested panel, providing laboratory evidence for the development of calibrated optical indicators for surface-soiling assessment. The intended users are PV plant operators and maintenance teams, who could use calibrated optical indicators to identify modules or surface zones requiring inspection and cleaning.
2. The Theoretical Model for Dust Accumulation on Photovoltaic Panels
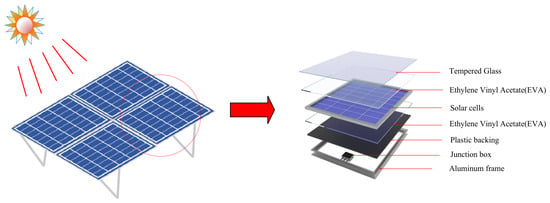
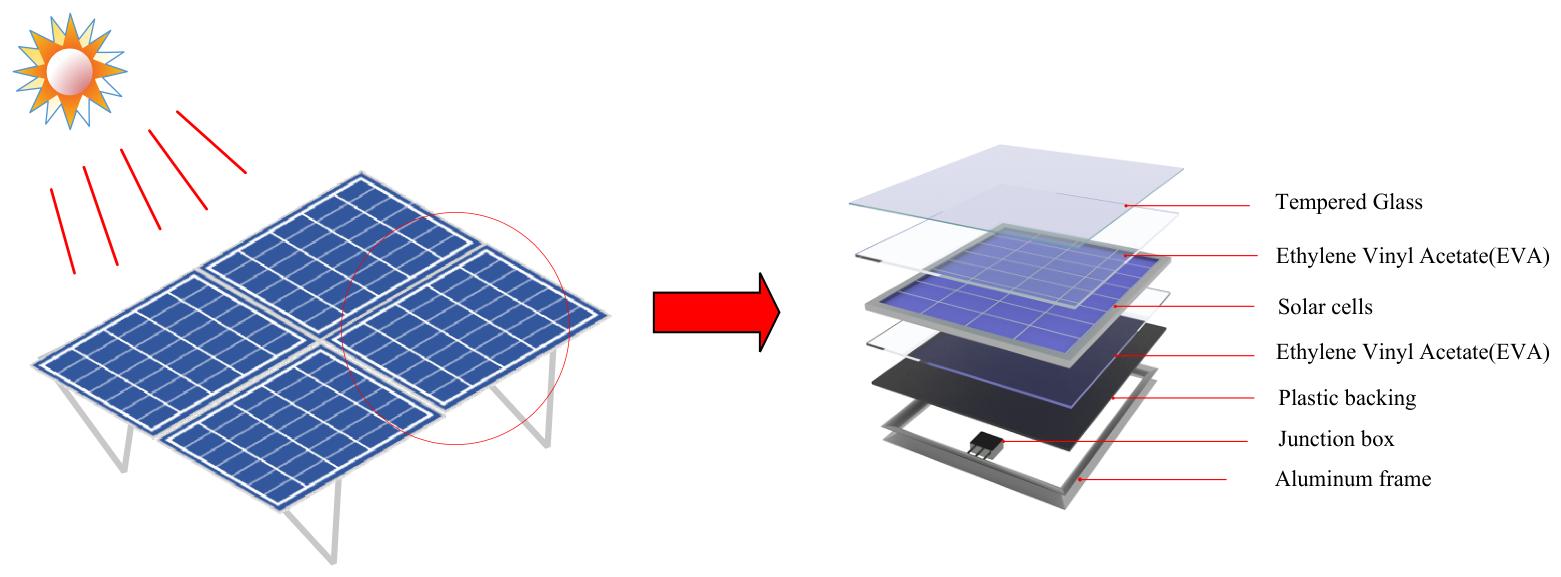
A photovoltaic panel is a semiconductor device that converts light energy into electrical energy. As shown in Figure 1, it mainly consists of tempered glass, ethylene vinyl acetate (EVA) encapsulation layers, solar cells, a plastic backing, a junction box, and an aluminum frame. The tempered glass on the top protects the internal cells, while transmitting sunlight; the solar cells are encapsulated between the upper and lower EVA layers; the plastic backing insulates and protects the rear side of the panel; and the junction box and the aluminum frame provide the electrical connection and mechanical support, respectively.
Figure 1.
Schematic diagram of photovoltaic panel composition.
The deposition of dust on solar panels obstructs the penetration of light, directly affecting the transmittance of the solar panel glass. The composition of dust particles on the dust layer generally includes SiO2, CaO, Al2O3, MgO, and Fe2O3, with particle size distributions ranging from the submicron to micrometer scale. The Mie scattering theory is commonly used to describe the scattering of particles whose size is comparable to the incident wavelength, such as dust particles suspended in the air. Therefore, the Mie scattering theory is adopted in this work to model the dust layer.
This article considers the dust layer deposited on the surface of the photovoltaic panel as a particle system composed of spherical particles of different sizes. It establishes the relationship between the scattering light intensity and the dust-accumulation status of the photovoltaic panel using the Mie scattering theory. The dust layer is a particle system composed of multiple types of particles. When the dust-accumulation density is low, the total scattering light intensity of the dust layer deposited on the surface of the photovoltaic panel can be considered the collective action of multiple particles of different sizes. The particle size of the dust particles deposited on the surface of the photovoltaic panel is not completely uniform. Therefore, it is assumed that the particle size distribution of the dust particles follows the Rosin–Rammler distribution [34], with the distribution function shown in Equation (1):
In Equation (1), d is particle diameter, D is the characteristic diameter, N is the dimensionless distribution shape index, and Rᵥ(d) is the fraction of the particle volume associated with diameters greater than d. Both d and D have the same length unit. At d = D, Rᵥ = exp(−1) ≈ 0.368; thus, 63.2% of the particle volume lies below D. A larger N denotes a narrower distribution.
By taking the derivative of Equation (1), we can obtain the percentage of particles with a diameter of d in the dust particles, as shown in Equation (2):
Assuming the spatial volume for detecting the dust layer is Vspace and the dust density is A mg/cm2, with the total volume corresponding to dust particles as Vdust, the number of particles with a diameter dk, denoted as Mk, can be represented as shown in Equation (3):
In Equation (3), the volume of a single spherical particle with diameter dk is πdk3/6; Vdust is the total volume of the dust particles in the detection space Vspace; A is the dust accumulation density; ρ is the mass density of the particles; and ∆dk is the volume fraction of the particles with diameter dk in the dust particle system, which is calculated from Equation (2).The approximation uses a common material density ρ; a multicomponent calculation requires a separate density and volume fraction for each component. A detection area is required in Equation (3), because A is an areal mass density; a spatial volume multiplied by A would be dimensionally inconsistent. Values reported in mg cm−2 must be converted consistently before calculation: 1 mg cm−2 = 0.01 kg m−2.
Light passing through a dust medium is absorbed [35], causing a decrease in light intensity. With the incident light intensity as q, passing through a dust thickness of δ, the transmitted light intensity is represented by q’, and the absorption coefficient of the medium is μext, it can be expressed as in Equation (4):
q′ = q exp(−μextΔ)
The extinction coefficient is μext = μabs + μsca, where μabs and μsca are the absorption and scattering coefficients. Thus direct-light attenuation is not a measurement of absorption alone. Transmission measured through dust-covered glass also depends on the substrate and on whether the detector accepts diffusely transmitted light. These measurement definitions must be matched to the theoretical quantity before a numerical comparison is made.
This article characterizes the absorption effect of dust particles on light through transmittance, while the total intensity of scattered light by the dust layer from incident light is represented as shown in Equation (5):
In Equation (5), I0 is incident irradiance on a plane normal to the incident beam, I_s is scattered irradiance at distance r, θ is the angle between the incident and observed propagation directions, and dC_sca,k/dΩ is the differential scattering cross-section of a particle in bin k, in area per steradian. For unpolarized illumination of an isolated sphere, this cross-section is (|S1,k|2 + |S2,k|2)/(2 km2), where S1,k and S2,k are dimensionless Mie amplitude functions and km = 2πnm/λ0 is the host-medium wave number. Here, nm is the real refractive index of a nonabsorbing host medium and λ0 is the vacuum wavelength. Therefore, when setting up a measurement system, ensuring that the wavelength λ, incident light intensity I0, scattering angle θ, and detection distance r are determined, a simulated dust-accumulation test can be conducted on known dust compositions. For a given dust accumulation density, the number of particles of each size is calculated from the Rosin–Rammler distribution, and the total scattered light intensity and the transmittance are then obtained via superposition, which gives the theoretical transmittance-density and scattering-density curves used as the reference for the subsequent simulation and experiment.
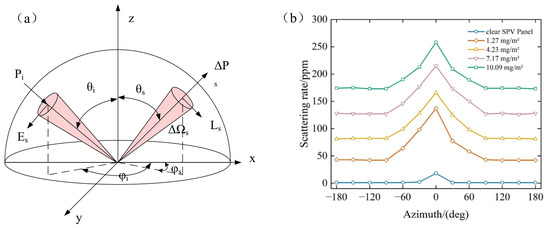
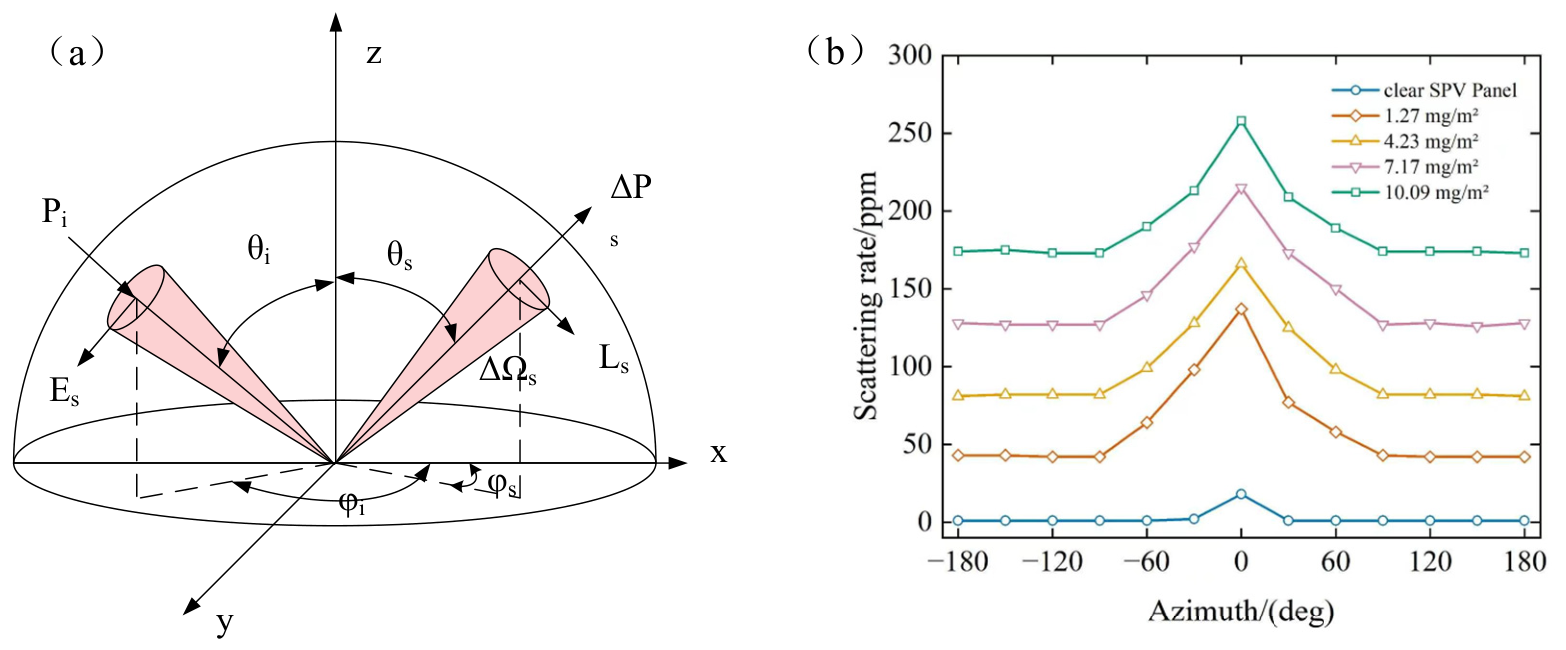
In Figure 2a, the Bidirectional Reflectance Distribution Function (BRDF) can conveniently describe the scattering process of dust accumulation on photovoltaic panels [36], where Pi is the incident light power, Ps is the scattered light power, θi and θs are the incident and scattering angles, respectively, φs is the scattering azimuth angle, and ΔΩs is the infinitesimal solid angle in the scattering direction. As shown in Figure 2b, the clean photovoltaic panel and the panels with dust densities of 1.27 mg/cm2, 4.23 mg/cm2, 7.17 mg/cm2, and 10.09 mg/cm2 are sequentially placed on a translation stage. The rotation stage drives the detector and its optical components to rotate continuously from an azimuth angle φs = −180° to φs = 180°. The output signal of the detector is collected, processed through correlation detection, and then transmitted to a computer to complete the data acquisition. The measured scattering rate curves are also shown in Figure 2b: the scattering rate of the clean panel is close to 0 over the whole azimuth range, while for the dust-accumulated panels, the scattering rate increases with the dust density at every azimuth angle, and each curve reaches its maximum near the specular reflection direction (φs = 0°, θs = 50°). When the detector is placed at this position, the received light consists of the specular reflection from the clean area of the panel and the forward scattering of the dust layer; the signal is strong, but it rises and falls sharply with the azimuth angle, and the intervals between the curves of adjacent dust densities are non-uniform, resulting in poor linearity and a small effective measurement range. In contrast, near the backscattering direction (φs = 180°, θs = 50°), the scattering rate is much lower (about 45–175 ppm for the four tested densities), but the curves are nearly flat and evenly spaced, which indicates better linearity and a larger dynamic range. In addition, placing the detector at φs = 180°, θs = 50° allows the system to detect weak signals with a high signal-to-noise ratio. Therefore, the detector is placed at this position in the following experiments.
Figure 2.
BRDF model. (a) Spatial distribution of scattering. (b) Scatter light intensity change diagram of accumulated dust photovoltaic panel.
The Bidirectional Reflectance Distribution Function fr, abbreviated BRDF and expressed in sr−1, relates reflected radiance to incident irradiance. Its power form is Equation (6), assuming a uniformly illuminated footprint and a receiver that views that entire footprint. Pi is the total incident power on the same viewed surface area; a smaller receiver field of view requires the corresponding illuminated-area correction. This definition replaces a rough-surface power-spectral-density expression, whose perturbation assumptions do not describe an arbitrary deposited particle layer.
In Equation (6), Ωs is the collection solid angle, and all power and angular quantities are defined above. For a sufficiently small acceptance ΔΩs, fr is approximately ΔPs/(Pi cosθs ΔΩs). The bidirectional scattering distribution function (BSDF) is the general angular scattering description; BRDF describes the reflected hemisphere, while the bidirectional transmittance distribution function (BTDF) describes the transmitted hemisphere. The measured reflected/scattered fraction over a finite acceptance Ω_det is defined in Equation (7). The fraction RΩ is reported in parts per million (ppm), equal to 106 RΩ; it is hemispherical total scattering only if Ωdet covers the specified full hemisphere with a calibrated collection response.
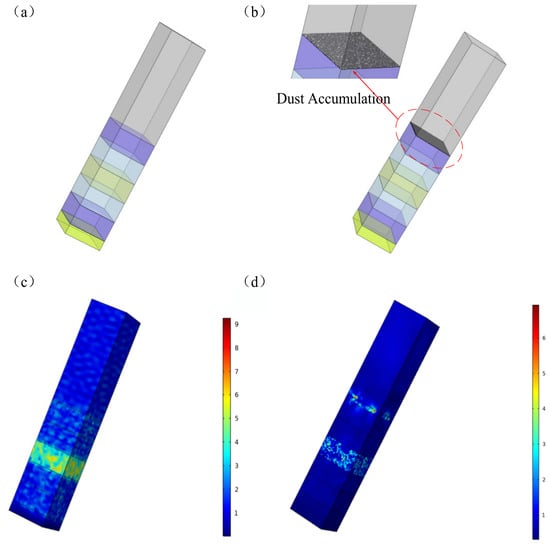
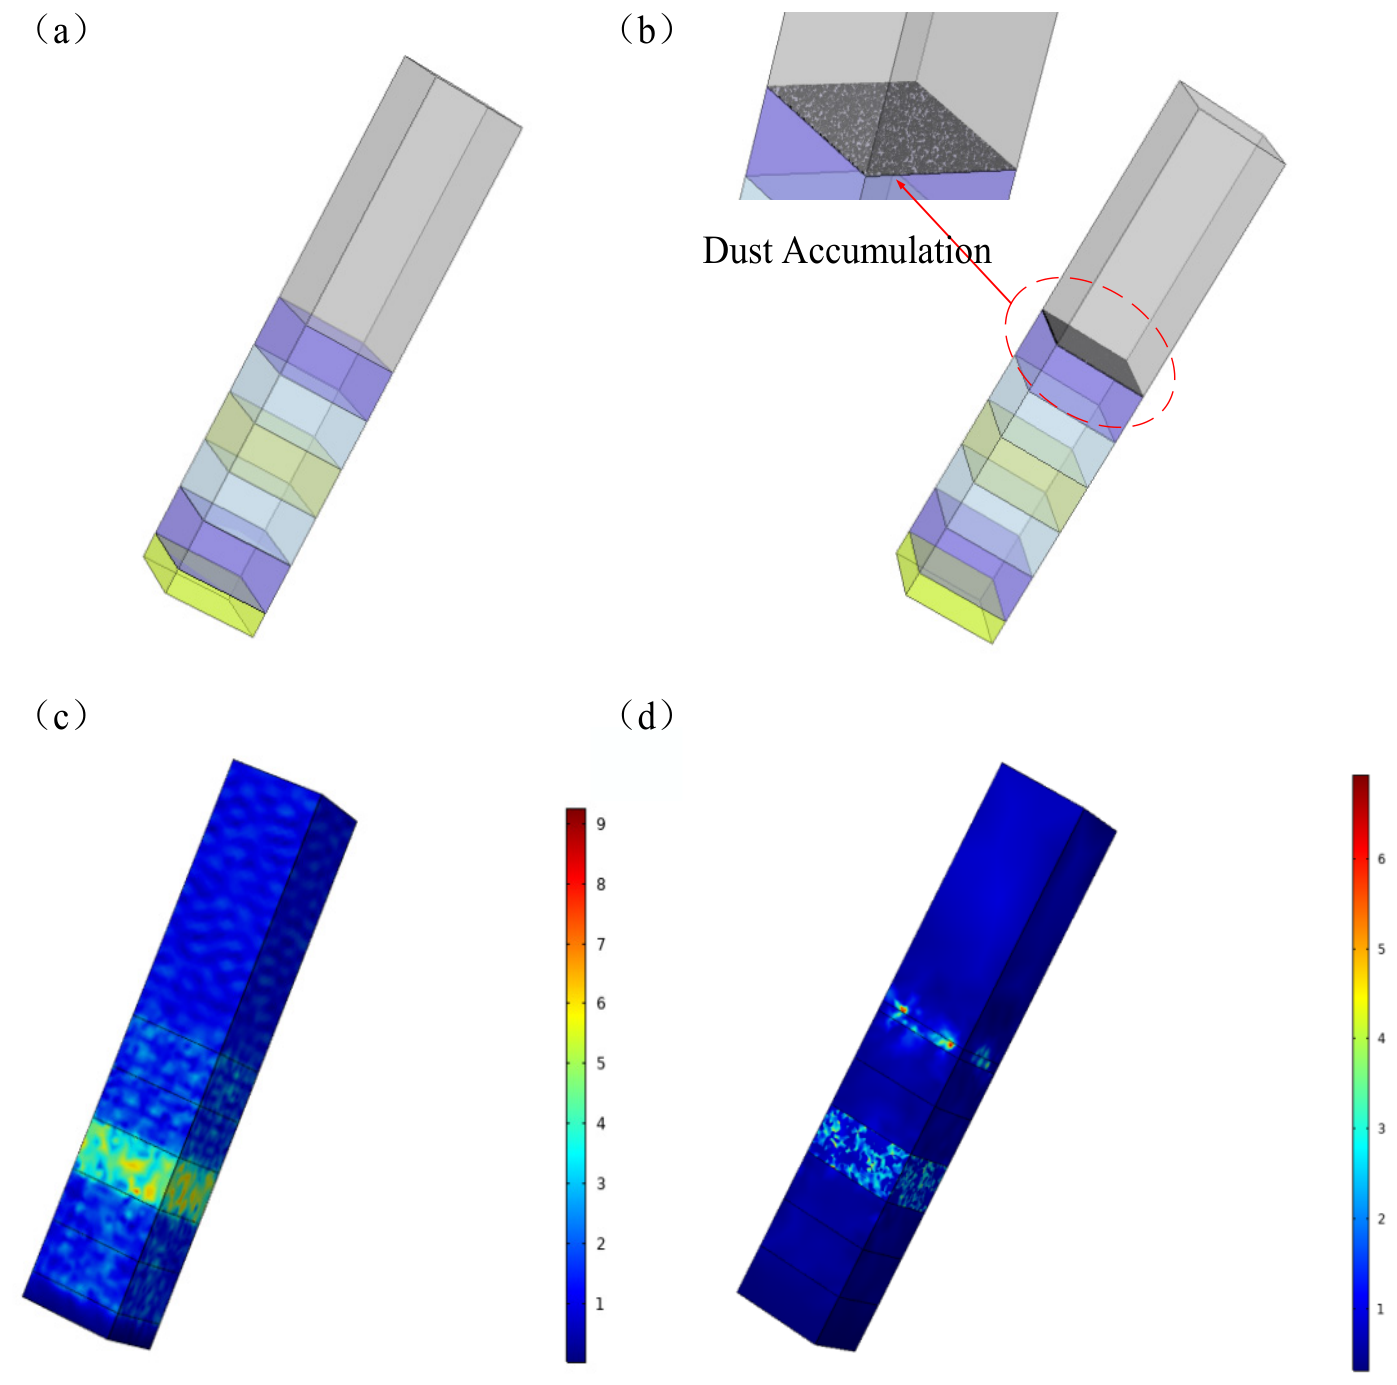
The scattering and transmission light changes on the surface of a photovoltaic panel with accumulated dust are then simulated. The figures show the simulation models of the photovoltaic panel without accumulated dust and with accumulated dust. Figure 3a shows the photovoltaic panel model without accumulated dust. The deep blue module represents tempered glass, which has a high transmittance. The light blue module is made of EVA material. The yellow module represents the solar cell, mainly composed of monocrystalline silicon. The light green module represents the perfect matching layer, which can effectively absorb incident waves and avoid echo interference.
Figure 3.
Photovoltaic panel dust accumulation model. (a) Model without accumulated dust. (b) Model with dust particles. (c) Electromagnetic model without accumulated dust. (d) Electromagnetic model with dust particles.
The electromagnetic field distributions obtained from the simulation are shown in Figure 3c,d. For the panel without dust accumulation (Figure 3c), the electromagnetic energy propagates through the tempered glass and the EVA layer and reaches the solar cell continuously, and the field intensity in the cell region is relatively high, which indicates that the incident light is effectively transmitted to and absorbed by the cell. For the dust-accumulated panel (Figure 3d), a strong local field enhancement appears at the position of the dust particles, which indicates that the dust particles strongly scatter and absorb the incident light; meanwhile, the field intensity in the glass and cell regions below the dust layer is significantly weakened, which means that the light energy transmitted to the cell is reduced. The greater the density of the accumulated dust, the more energy is scattered and absorbed by the dust layer and the less energy reaches the surface of the solar cell.
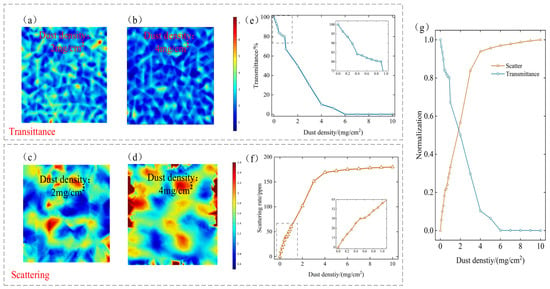
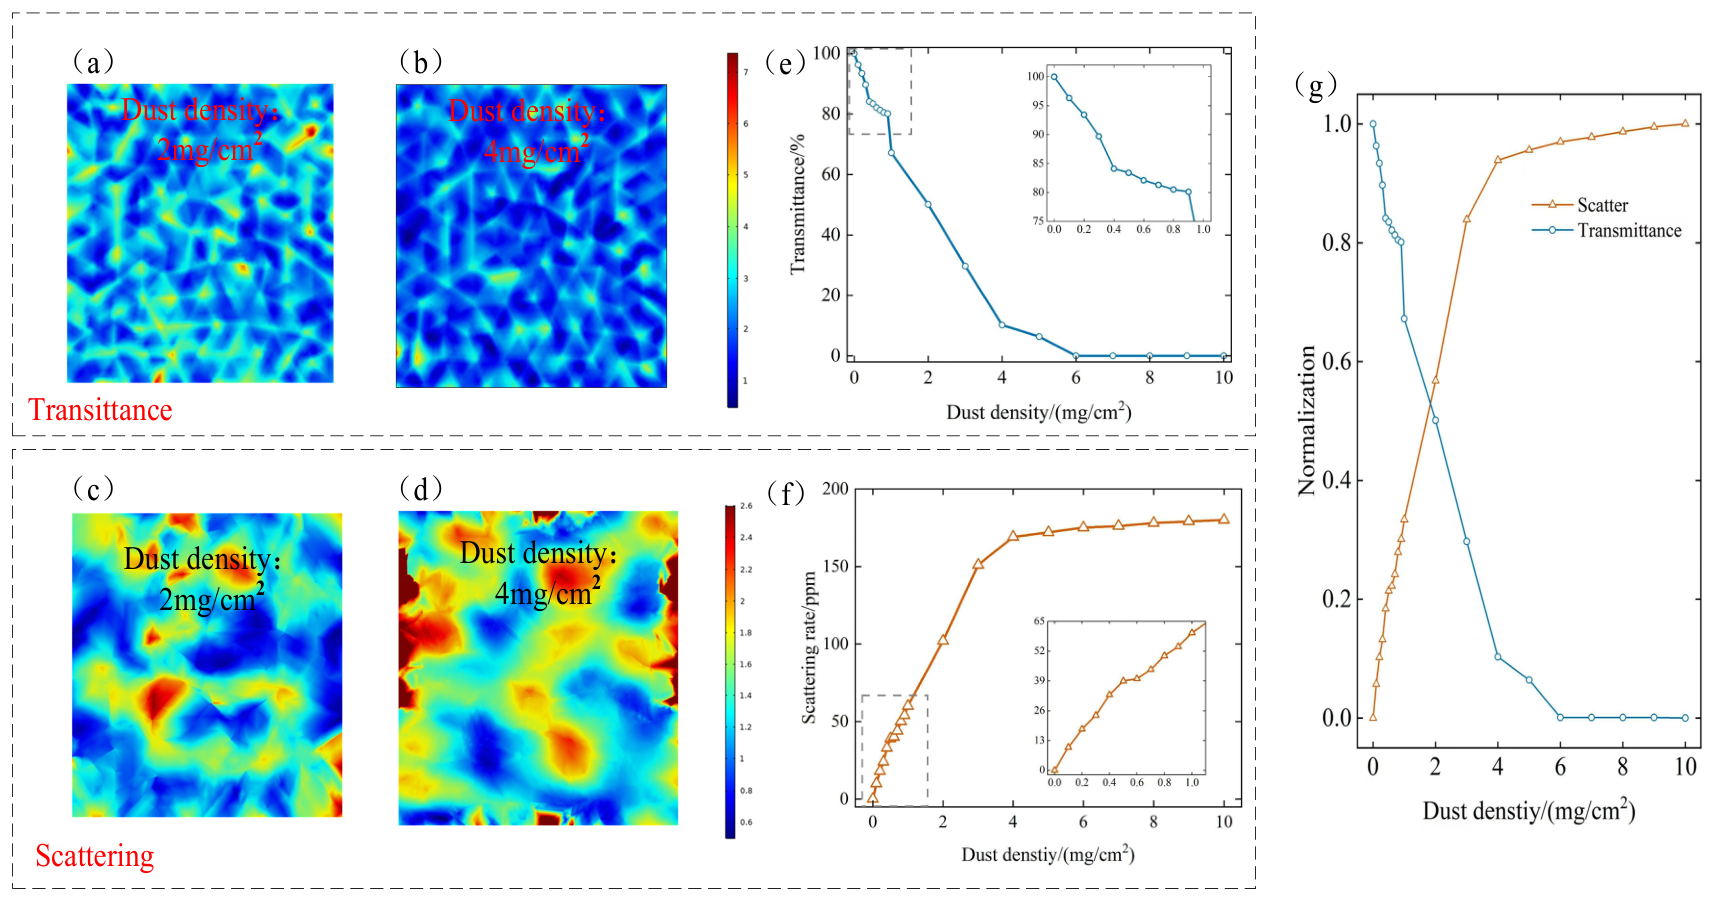
When dust accumulates on the surface of the photovoltaic panel, it not only blocks the absorption of solar radiation by the photovoltaic cells, which effectively reduces the received irradiance and the power generation of the panel, but also causes part of the incident sunlight to be scattered and reflected by the dust particles instead of reaching the cells, further reducing the utilizable light energy. Because of the irregular shape of the dust particles, this scattering and reflection occur to varying degrees over the panel surface. By analyzing the changes in the transmission and scattering of the incident light caused by the accumulated dust, the influence of dust accumulation on the transmittance and the scattering rate can be determined. Figure 4 shows the simulated distributions of the transmitted and scattered light intensity on the photovoltaic panel with different amounts of accumulated dust. Comparing Figure 4a,b, under the same incident illuminance, the transmitted light intensity of the panel with 4 mg/cm2 of dust is significantly lower than that with 2 mg/cm2. From Figure 4c,d, it can be seen that with the increase in dust accumulation, the diffuse reflection of light is intensified and the scattering around the panel, especially at the edges, becomes more noticeable.
Figure 4.
Photovoltaic panel dust-accumulation transmission and scattering model; (a) 2 mg/cm2 (transmission), (b) 4 mg/cm2 (transmission), (c) 2 mg/cm2 (scattering), and (d) 4 mg/cm2 (scattering). (e) Transmittance versus dust-accumulation density. (f) Scattering rate versus dust-accumulation density. (g) Normalized transmittance and scattering rate versus dust-accumulation density.
In addition to the two groups of field distributions at 2 mg/cm2 and 4 mg/cm2 shown in Figure 4a–d, multiple groups of dust-accumulation densities from 0 to 10 mg/cm2 were simulated, and the resulting transmittance and scattering rate curves are shown in Figure 4e–g. As shown in Figure 4e, the transmittance decreases monotonically with the dust-accumulation density: it decreases slowly in the low-density range of 0–2 mg/cm2 (see the inset), then drops almost linearly between 2 and 6 mg/cm2, and gradually approaches 0 when the density reaches about 6 mg/cm2, meaning that the light can hardly penetrate the dust layer. Figure 4f shows that the scattering rate increases rapidly and almost linearly when the density is below 4 mg/cm2 (the inset confirms the linear growth in the 0–2 mg/cm2 range); as the density further increases, the growth slows down and the scattering rate gradually saturates, because the dust layer transitions from a sparse particle system to a dense one. Figure 4g compares the normalized transmittance and scattering rate on the same graph: the two curves are nearly complementary and intersect at a density of about 2–3 mg/cm2, which confirms that the attenuated transmitted light is mainly converted into scattered light and that the scattering rate is more sensitive than the transmittance in the low-density range.
3. Experimental and Analysis of Experimental Results
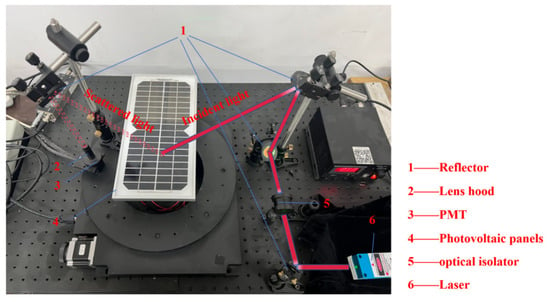
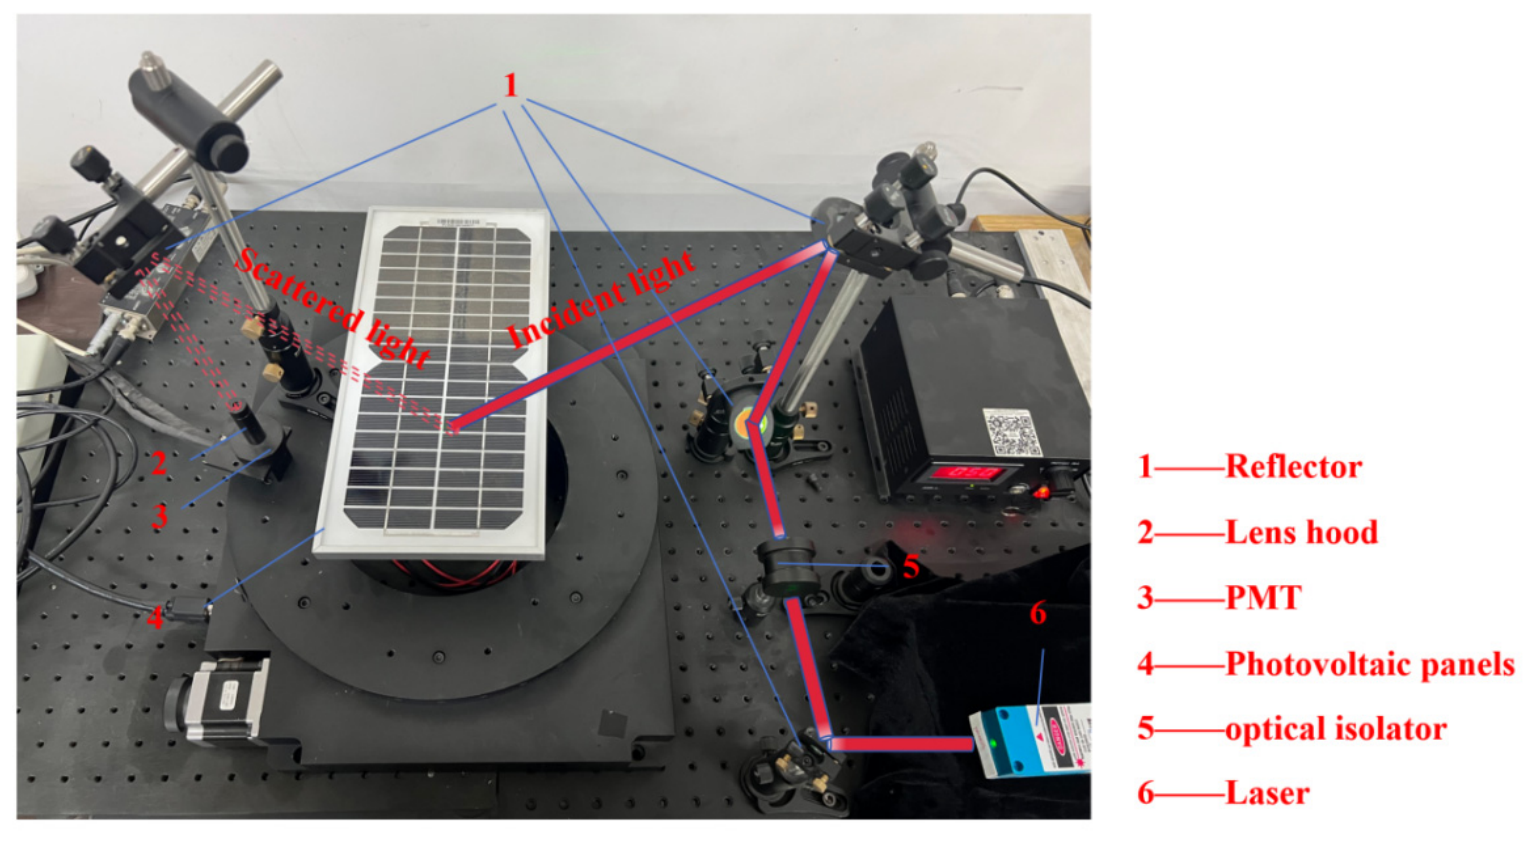
In Figure 5, a scattering measurement device is constructed using a semiconductor laser as the measurement light source. The laser has a wavelength of 635 nm, an output power of 20 mW, and a power stability of ±2%. The laser is driven by a control signal output from an industrial computer to modulate the light signal output with stable power. The modulated optical signal is incident to the dust-covered surface of the photovoltaic panel, with the light beam characterized by φi = 180° and θi = 45°. The modulated light signal is irradiated on the surface of the dusty photovoltaic panel, and the scattered light within a specific angular range is reflected by a mirror and passed through a light stop to reduce stray light interference before reaching the detector target surface.
Figure 5.
Photovoltaic panel dust scattering measurement system.
All experimental transmittance and scattering-rate values reported in this study were measured at 635 nm under the specified illumination and collection conditions. These measurements characterize the wavelength-specific optical response of the tested dust-covered surfaces. Extending the assessment to broadband photovoltaic performance requires consideration of the incident solar spectrum and the wavelength-dependent response of the photovoltaic material [30,31].
The detector completes the photoelectric conversion, and after amplification by an amplification circuit, the voltage signal is inputted into a lock-in amplifier as the target signal to eliminate the influence of noise on the measured signal. The output voltage of the lock-in amplifier is collected through a data acquisition card and stored in the industrial computer.
To minimize the impact of external environmental factors, the experiment was conducted under a cleanroom environment, and the baseline scattering values and the dust-induced scattering values on the photovoltaic panel surface were measured within a relatively short timeframe. The article conducts experiments on the same photovoltaic panel with different dust-accumulation densities. The device introduced in the article uses the ratio measurement method to eliminate system errors, processes the measurement signal for noise reduction, and improves measurement accuracy by averaging multiple measurements. During the system stability check, the observed output-voltage fluctuations were approximately 0.01 V. The conversion of these voltage fluctuations into scattering-rate variations depends on the reference attenuator transmittance, reference voltage, and gain settings used in the ratio measurement.
Determination of the experimental parameters. The dust used in the experiment was collected from the surfaces of photovoltaic panels that had been operating outdoors. Composition analysis shows that the dust is mainly composed of SiO2, CaO, Al2O3, MgO, and Fe2O3; accordingly, the refractive index of SiO2-dominated dust is adopted in the theoretical model and the simulation. The morphology of the particles was observed via scanning electron microscopy (SEM): most particles are approximately spherical or ellipsoidal, which justifies the spherical-particle assumption of the Mie model, while the remaining shape irregularity is one source of the deviation between the theory and experiment. The particle size was measured with a laser particle size analyzer, and the measured size distribution was fitted based on the Rosin–Rammler function in Equation (1) to determine the characteristic parameters D and N used in the model. Samples with different dust-accumulation densities were prepared by weighing the dust with a precision balance and depositing it uniformly on the panel surface. The measured dust-density ranges were 0.10–5.51 mg/cm2 for transmittance and 0.10–9.53 mg/cm2 for the scattering rate.
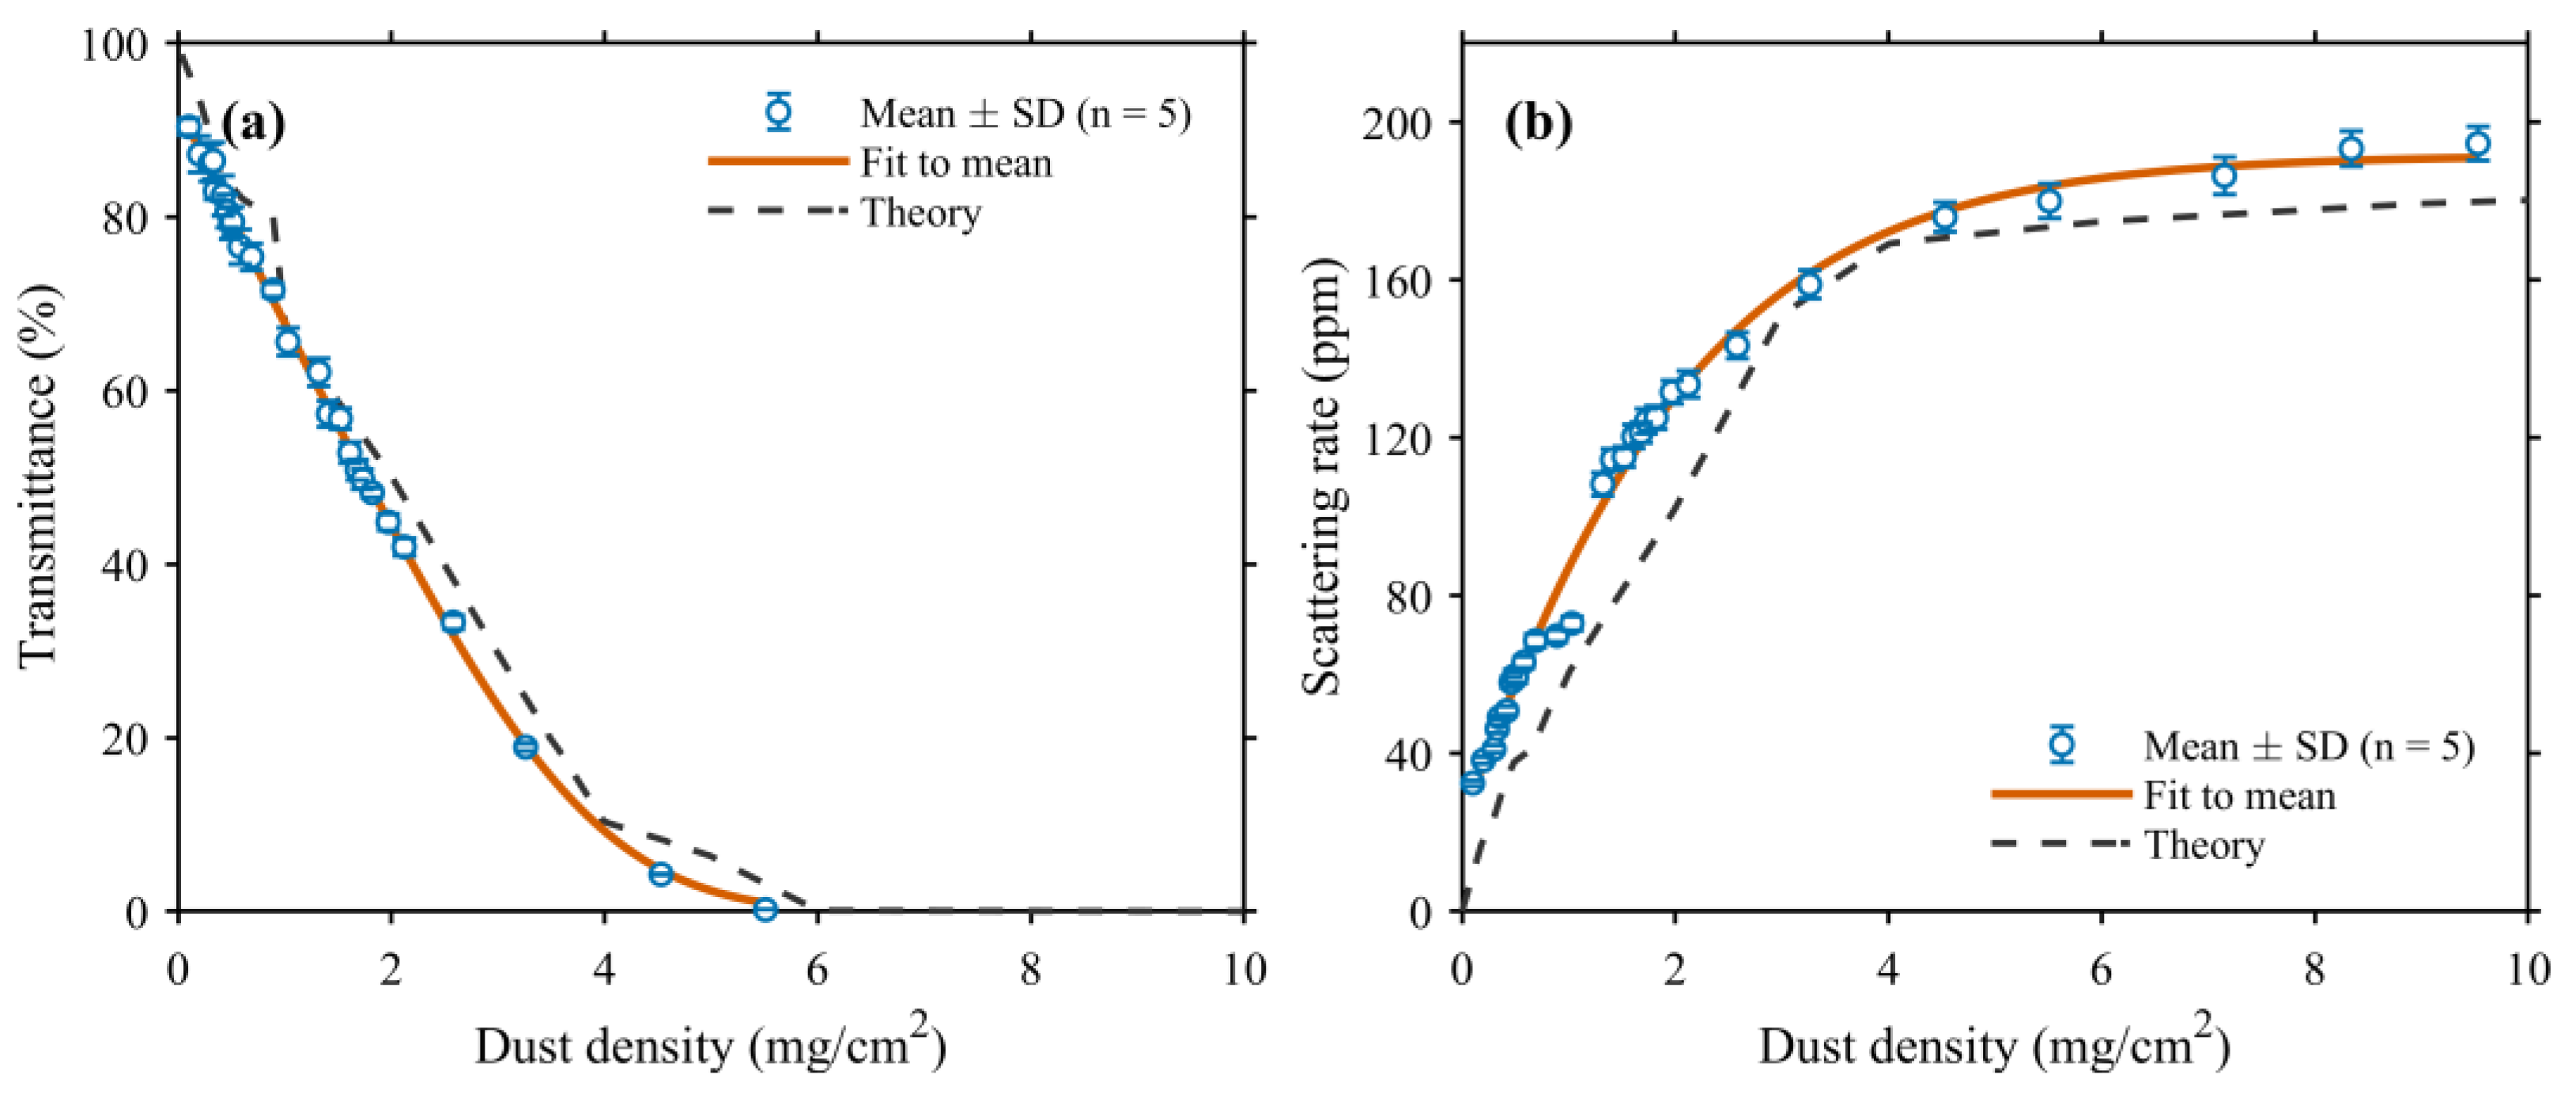
Reference stability and spatial variation. Table 1 contains ten reference-light readings (n = 10), with a mean of 1.925 V, a sample standard deviation of 0.0118 V, a standard error of 0.00373 V, and a range of 1.91–1.95 V. At each dust density, measurements were obtained at five different surface positions. The mean and sample standard deviation across these positions were calculated to characterize the average optical response and its spatial variation, respectively. The resulting means and ±1 SD error bars are presented in Figure 6.
Table 1.
Standard attenuator measurement data.
Figure 6.
Transmittance and scattering rate versus dust density. (a) Transmittance versus dust density; (b) scattering rate versus dust density.
Correspondence between laboratory deposition and outdoor soiling. The dust used in the laboratory tests was collected from operating photovoltaic panels, providing a material basis relevant to outdoor soiling. Collection and redeposition can nevertheless change the arrangement, overlap, and aggregation of particles. Natural deposition is also affected by wind, rainfall, and module inclination, producing spatial variations in surface coverage. Consequently, the same average dust mass per unit area can correspond to different particle coverage and optical responses, consistent with the relationship between particle coverage and transmittance reported in the literature [30].
These differences introduce potential deviations into the model. The Mie-based calculation represents the dust as spherical particles with a Rosin–Rammler size distribution, while the adopted optical constants provide a simplified representation of the mixed dust composition. Irregular particle shapes and variations in composition can change the extinction efficiency and angular distribution of scattered light. In addition, humidity and dew can promote particle adhesion and cementation [37], changing the structure of the deposited layer. Particle overlap and aggregation can therefore affect both transmittance and the scattering signal collected within the detector’s angular range. The magnitude and direction of these deviations depend on the particle properties and deposition conditions.
The laboratory results establish the relationship between dust loading and the optical response for the tested samples under controlled conditions. For practical applications, calibration incorporating representative local dust properties and deposition conditions can improve the correspondence between the measured optical indicators and outdoor dust accumulation. This provides a basis for adapting the proposed method to the specific operating environment.
By using a 0.1% attenuator to attenuate the light signal as the reference light signal, adjusting the sensitivity of the lock-in amplifier for multiple measurements, analyzing the stability of the reference light, controlling the light signal acquisition and processing with software using the photodetector, and calculating the measurement baseline value, which is the voltage value of the transmitted light intensity through the standard attenuator, as shown in Table 1, after repetitive experiments, the baseline voltage is found to be 1.93 V.
The incident laser beam had a diameter of 1.2 mm perpendicular to its propagation direction. At the incidence angle of 45°, its projected footprint on the sample surface was approximately elliptical, with minor and major axes of 1.2 and 1.70 mm, respectively, corresponding to an illuminated area of approximately 1.60 mm2. At each dust density, five positions were randomly selected on the tested surface. Repeated measurements at each position were averaged to obtain a position-specific mean. The five position-specific means were then used to calculate the overall mean and sample standard deviation presented in Figure 6, with error bars indicating ±1 sample standard deviation across positions.
When the laser irradiates the surface of the photovoltaic panel, the specularly reflected light is absorbed by the light trap outside the integrating sphere, while the scattered light enters the integrating sphere and is uniformly distributed over its inner wall after multiple diffuse reflections. The photomultiplier tube mounted on the sphere wall converts the homogenized scattered light into an electrical signal whose magnitude is proportional to the total scattered light intensity of the dust layer.
The scattering rate and transmittance rate are calculated based on a comparative method. By comparing the voltage values of the photovoltaic panel scattering and tempered glass transmission with the voltage value of the reference light, the scattering rate and transmittance rate can be determined.
U = SGP0τref
U′ = SGP0RΩ
Here, U is the output voltage measured using the standard attenuator, U′ is the output voltage of the scattering measurement, S is the detector voltage responsivity before amplification, G is the common effective amplification gain, and P0 is the incident optical power. The reference attenuator transmittance is denoted by τref, equal to 0.001 for the 0.1% attenuator used here. RΩ denotes the scattered-power fraction collected within the optical acceptance defined in Equation (7). For identical gain settings and a common calibrated detector response, the ratio expression is given by Equation (10). The scattering rate in ppm is obtained by multiplying RΩ by 106.
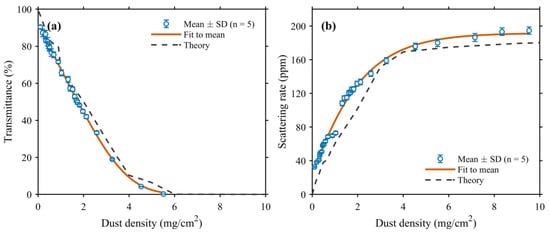
At each dust density, the measurements obtained at five different positions were averaged, and the sample standard deviation (SD) was calculated to quantify spatial variation. Figure 6a,b present the transmittance and scattering rate, respectively. The blue symbols represent the experimental means, with error bars indicating ±1 SD; the orange solid curves represent empirical fits to the means obtained via unweighted nonlinear least-squares regression, and the gray dashed curves represent the theoretical results. Across the tested densities, the spatial SD ranged from 0.00 to 2.27 percentage points for transmittance and from 0.51 to 4.70 ppm for the scattering rate.
For a quantitative comparison, the theoretical values were linearly interpolated to the experimental dust densities. The mean absolute error (MAE) and root-mean-square error (RMSE) were then calculated between the experimental means and the corresponding theoretical values at 26 density points for transmittance and 29 density points for the scattering rate. The transmittance MAE and RMSE were 4.23 and 4.62 percentage points, respectively, whereas the scattering-rate MAE and RMSE were 21.28 and 23.21 ppm, respectively. The mean signed differences, defined as experimental minus theoretical values, were −4.19 percentage points for transmittance and +21.28 ppm for the scattering rate.
The scattering-rate MAE of 21.28 ppm represents the average absolute difference between the five-position experimental means and the theoretical predictions across the 29 tested dust densities. This difference may reflect particle-shape and deposited-layer approximations, spatial sampling, and optical collection conditions. The standard deviations in Figure 6 quantify variation among the five position-specific means, whereas the output-voltage fluctuations characterize signal stability during the system check.
The mean transmittance decreased from 90.36% at 0.10 mg/cm2 to 0.20% at 5.51 mg/cm2, while the mean scattering rate increased from 32.50 ppm at 0.10 mg/cm2 to 194.56 ppm at 9.53 mg/cm2 and tended toward saturation at higher dust densities. Both the experimental and theoretical results exhibit decreasing transmittance and an increasing scattering rate with an increasing dust density. The comparison also shows that the measured transmittance was lower than the theoretical prediction, on average, whereas the measured scattering rate was higher.
4. Conclusions
This paper establishes the relationship between scattered light intensity and the dust-accumulation status on the photovoltaic panel based on the Mie scattering theory, while considering the dust particles’ absorption effect on light. Furthermore, an electromagnetic model of scattering–reflection for dust accumulation on the photovoltaic panel is established based on the effective medium theory. The scattering and transmittance characteristics of the photovoltaic panel under different dust densities are analyzed. A scattering measurement device was set up to obtain the scattering ratio and transmittance ratio on the surface of the photovoltaic panel. In the experiment, a ratio measurement method was introduced to eliminate system errors. The scattering rate of the photovoltaic panel increases continuously with the increase in the dust-accumulation density, eventually reaching a stable value. The transmittance decreases as the dust density increases, and when the dust density is approximately 5.5 mg/cm2, the transmittance is almost 0. The five-position mean measurements follow the theoretically predicted trends of decreasing transmittance and an increasing scattering rate with an increasing dust density. A comparison with the theoretical predictions gives mean absolute errors of 4.23 percentage points for transmittance and 21.28 ppm for the scattering rate, with corresponding root-mean-square errors of 4.62 percentage points and 23.21 ppm. This study directly measures the scattering effect of the dust layer on the photovoltaic panel surface, in addition to measuring the transmittance. Analyzing both transmittance and scattering rates can better reflect the dust-accumulation status on the photovoltaic panel itself. The laboratory measurements demonstrate the combined use of transmittance and scattering signals to characterize the optical response of dust-covered surfaces at 635 nm. Calibration using representative local dust and deposition conditions could support the application of these optical indicators to photovoltaic inspection and cleaning decisions.
Author Contributions
Conceptualization, C.H.; methodology, C.H. and J.H.; software, C.H., X.W. and W.W.; validation, C.H., W.W. and N.K.; formal analysis, J.H. and X.W.; investigation, J.H. and Z.T.; resources, S.Z.; data curation, N.K.; writing—original draft preparation, C.H.; writing—review and editing, C.H.; visualization, X.W. and Z.T.; supervision, S.Z.; project administration, S.Z.; funding acquisition, S.Z. All authors have read and agreed to the published version of the manuscript.
Funding
The Scientific Research Program of Shaanxi Provincial Education Department (No. 21JY017).
Data Availability Statement
Data are contained within the article.
Conflicts of Interest
Jingyao Hou is employed by Xi’an North Electro-optic Science & Technology Defense Co., Ltd. The remaining authors declare that the research was conducted in the absence of any commercial or financial relationships that could be construed as a potential conflict of interest.
References
- Sulaiman, S.A.; Singh, A.K.; Mokhtar, M.M.M.; Bou-Rabee, M.A. Influence of Dirt Accumulation on Performance of PV Panels. Energy Procedia 2014, 50, 50–56. [Google Scholar] [CrossRef] [Scilit]
- Oh, T.H.; Pang, S.Y.; Chua, S.C. Energy policy and alternative energy in Malaysia: Issues and challenges for sustainable growth. Renew. Sustain. Energy Rev. 2010, 14, 1241–1252. [Google Scholar] [CrossRef] [Scilit]
- Guan, Y.; Zhang, H.; Xiao, B.; Zhou, Z.; Yan, X. In-situ investigation of the effect of dust deposition on the performance of polycrystalline silicon photovoltaic modules. Renew. Energy 2017, 101, 1273–1284. [Google Scholar] [CrossRef] [Scilit]
- Yu, J.; Lin, L. A Study of dust accumulating process on solar photovoltaic modules with different surface temperatures. Energy Procedia 2015, 75, 337–342. [Google Scholar] [CrossRef] [Scilit]
- Darwish, Z.A.; Kazem, H.A.; Sopian, K.; Al-Goul, M.; Alawadhi, H. Effect of dust pollutant type on photovoltaic performance. Renew. Sustain. Energy Rev. 2015, 41, 735–744. [Google Scholar] [CrossRef] [Scilit]
- John, J.J.; Warade, S.; Tamizhmani, G.; Kottantharayil, A. Study of soiling loss on photovoltaic modules with artificially deposited dust of different gravimetric densities and compositions collected from different locations in India. IEEE J. Photovolt. 2015, 6, 236–243. [Google Scholar] [CrossRef] [Scilit]
- Burton, P.D.; King, B.H. Spectral sensitivity of simulated photovoltaic module soiling for a variety of synthesized soil types. IEEE J. Photovolt. 2014, 4, 890–898. [Google Scholar] [CrossRef] [Scilit]
- Ramli, M.A.M.; Prasetyono, E.; Wicaksana, R.W.; Windarko, N.A.; Sedraoui, K.; Al-Turki, Y.A. On the investigation of photovoltaic output power reduction due to dust accumulation and weather conditions. Renew. Energy 2016, 99, 836–844. [Google Scholar] [CrossRef] [Scilit]
- Kaldellis, J.K.; Kokala, A. Quantifying the decrease of the photovoltaic panels’energy yield due to phenomena of natural air pollution disposal. Energy 2010, 35, 4862–4869. [Google Scholar] [CrossRef] [Scilit]
- Saidan, M.; Albaali, A.G.; Alasis, E.; Kaldellis, J.K. Experimental study on the effect of dust deposition on solar photovoltaic panels in desert environment. Renew. Energy 2016, 92, 499–505. [Google Scholar] [CrossRef] [Scilit]
- Said, S.A.M.; Walwil, H.M. Fundamental studies on dust fouling effects on PV module performance. Sol. Energy 2014, 107, 328–337. [Google Scholar] [CrossRef] [Scilit]
- Jaszczur, M.; Koshti, A.; Nawrot, W.; Sędor, P. An investigation of the dust accumulation on photovoltaic panels. Environ. Sci. Pollut. Res. 2019, 27, 2001–2014. [Google Scholar] [CrossRef] [Scilit]
- Lu, J.; Hajimirza, S. Optimizing sun-tracking angle for higher irradiance collection of PV panels using a particle-based dust accumulation model with gravity effect. Sol. Energy 2017, 158, 71–82. [Google Scholar] [CrossRef] [Scilit]
- Li, X.C.; Niu, K. Effectively predict the solar radiation transmittance of dusty photovoltaic panels through Lambert-Beer law. Renew. Energy 2018, 123, 634–638. [Google Scholar] [CrossRef] [Scilit]
- Oh, S. Analytic and Monte-Carlo studies of the effect of dust accumulation on photovoltaics. Sol. Energy 2019, 188, 1243–1247. [Google Scholar] [CrossRef] [Scilit]
- Tanesab, J.; Parlevliet, D.; Whale, J.; Urmee, T.; Pryor, T. The contribution of dust to performance degradation of PV modules in a temperate climate zone. Sol. Energy 2015, 120, 147–157. [Google Scholar] [CrossRef] [Scilit]
- Lock, J.A.; Gouesbet, G. Generalized Lorenz-Mie theory and applications. J. Quant. Spectrosc. Radiat. Transf. 2009, 110, 800–807. [Google Scholar] [CrossRef] [Scilit]
- Abderrezek, M.; Fathi, M. Experimental study of the dust effect on Photovoltaic panels’energy yield. Sol. Energy 2017, 142, 308–320. [Google Scholar] [CrossRef] [Scilit]
- Guo, B.; Javed, W.; Figgis, B.W.; Mirza, T. Effect of dust and weather conditions on photovoltaic performance in Doha, Qatar. In Proceedings of the 2015 First Workshop on Smart Grid and Renewable Energy (SGRE), Doha, Qatar, 22–23 March 2015; pp. 1–6. [Google Scholar]
- Andrews, R.W.; Pollard, A.; Pearce, J.M. The effects of snowfall on solar photovoltaic performance. Sol. Energy 2013, 92, 84–97. [Google Scholar] [CrossRef] [Scilit]
- Kaldellis, J.; Zafirakis, D. Experimental investigation of the optimum photovoltaic panels’ tilt angle during the summer period. Energy 2012, 38, 305–314. [Google Scholar] [CrossRef] [Scilit]
- Pan, A.J.; Lu, H.; Zhang, L.Z. Experimental investigation of dust deposition reduction on solar cell covering glass by different self-cleaning coatings. Energy 2019, 181, 645–653. [Google Scholar] [CrossRef] [Scilit]
- Fountoukis, C.; Figgis, B.; Ackermann, L.; Ayoub, M.A. Effects of atmospheric dust deposition on solar PV energy production in a desert environment. Sol. Energy 2018, 164, 94–100. [Google Scholar] [CrossRef] [Scilit]
- Zang, J.; Wang, Y.; Wang, X. Computation model and experiment of dust deposition affecting transmittance of photovoltaic module. Acta Energiae Solaris Sin. 2014, 35, 624–629. [Google Scholar]
- Rao, A.; Pillai, R.; Mani, M.; Ramamurthy, P. Influence of dust deposition on photovoltaic panel performance. Energy Procedia 2014, 54, 690–700. [Google Scholar] [CrossRef] [Scilit]
- Katoch, M.; Kumar, K.; Dahiya, V. Dust accumulation and reduction in electrical performance of solar PV panels. Mater. Today Proc. 2021, 46, 6608–6612. [Google Scholar] [CrossRef] [Scilit]
- Nimmo, B.; Said, S.A.M. Effects of Dust on the Performance of Thermal and Photovoltaic Flat Plate Collectors in Saudi Arabia: Preliminary Results. Altern. Energy Sources 1981, 1, 145. [Google Scholar]
- Asbayou, A.; Smestad, G.P.; Ismail, I.; Soussi, A.; Elfanaoui, A.; Bouhouch, L.; Ihlal, A. Electro-Optical Model of Soiling Effects on Photovoltaic Panels and Performance Implications. Energy Eng. 2024, 121, 243–258. [Google Scholar] [CrossRef] [Scilit]
- Semaoui, S.; Arab, A.; Boudjelthia, E.; Bacha, S.; Zeraia, H. Dust Effect on optical Transmittance of Photovoltaic Module Glazing in a Desert Region. Energy Procedia 2015, 74, 1347–1357. [Google Scholar] [CrossRef] [Scilit]
- Smestad, G.P.; Germer, T.A.; Alrashidi, H.; Fernández, E.F.; Dey, S.; Brahma, H.; Sarmah, N.; Ghosh, A.; Sellami, N.; Hassan, I.A.I.; et al. Modelling photovoltaic soiling losses through optical characterization. Sci. Rep. 2020, 10, 58. [Google Scholar] [CrossRef] [Scilit]
- Micheli, L.; Caballero, J.A.; Fernández, E.F.; Smestad, G.P.; Nofuentes, G.; Mallick, T.K.; Almonacid, F. Correlating photovoltaic soiling losses to waveband and single-value transmittance measurements. Energy 2019, 180, 376–386. [Google Scholar] [CrossRef] [Scilit]
- Alkharusi, T.; Alzahrani, M.M.; Pandey, C.; Yildizhan, H.; Markides, C.N. Experimental investigation of nonuniform PV soiling. Sol. Energy 2024, 272, 112493. [Google Scholar] [CrossRef] [Scilit]
- Sengupta, S.; Adak, D.; Maiti, P.S.; Ghosh, A.; Bhattacharyya, R. Model for analysis of water-cleaning impact on polysilane-based antisoiling coating in PV system. Sci. Rep. 2026, 16, 18163. [Google Scholar] [CrossRef] [Scilit]
- Rosin, P.; Rammler, E. The Laws Governing the Fineness of Powdered Coal. J. Inst. Fuel 1933, 7, 29–36. [Google Scholar]
- Van de Hulst, H.C.; Twersky, V. Light Scattering by Small Particles. Phys. Today 1957, 10, 28–30. [Google Scholar] [CrossRef] [Scilit]
- Sterligov, V.A. Angle-Resolved Light Scattering from Semiconductors. Phys. Status Solidi (a) 1998, 170, 443–450. [Google Scholar] [CrossRef]
- Ilse, K.K.; Figgis, B.W.; Werner, M.; Naumann, V.; Hagendorf, C.; Pöllmann, H.; Bagdahn, J. Comprehensive analysis of soiling and cementation processes on PV modules in Qatar. Sol. Energy Mater. Sol. Cells 2018, 186, 309–323. [Google Scholar] [CrossRef] [Scilit]

Disclaimer/Publisher’s Note: The statements, opinions and data contained in all publications are solely those of the individual author(s) and contributor(s) and not of MDPI and/or the editor(s). MDPI and/or the editor(s) disclaim responsibility for any injury to people or property resulting from any ideas, methods, instructions or products referred to in the content. |
© 2026 by the authors. Licensee MDPI, Basel, Switzerland. This article is an open access article distributed under the terms and conditions of the Creative Commons Attribution (CC BY) license.