


Abstract
In this paper, we present an integrative framework based on Evolutionary Stackelberg Game Theory to model the strategic interaction between a physician, acting as a rational leader, and a heterogeneous population of treatment-sensitive and treatment-resistant breast cancer cells. The model incorporates ecological competition, evolutionary adaptation, and spatial heterogeneity, enabling prediction of tumor progression under clinically relevant treatment protocols. Using tumor volume data obtained from breast cancer-bearing mice treated with Capecitabine and Gemcitabine, we estimated treatment and subject-specific parameters via the GEKKO optimization package in Python. Benchmarking against classical tumor growth models (Exponential, Logistic, and Gompertz) showed that while classical models capture monotonic growth, they fail to reproduce complex, non-monotonic behaviors such as treatment-induced regression, rebound, and phenotypic switching. The game-theoretic approach achieved superior alignment with experimental data across Maximum Tolerated Dose, Dose-Modulation Adaptive Therapy, and Intermittent Adaptive Therapy protocols. To enhance adaptability, we integrated reinforcement learning (RL) for both single-agent and combination chemotherapy. The RL agent learned dosing policies that maximized tumor regression while minimizing cumulative drug exposure and resistance, with combination therapy exploiting dose diversification to improve control without exceeding total dose budgets. Incorporating reaction diffusion equations allowed the model to capture spatial dispersal of sensitive (cooperative) and resistant (defector) phenotypes, revealing that spatially aware adaptive strategies more effectively suppress resistant clones than non-spatial approaches. These results demonstrate that evolutionarily informed, spatially explicit, and computationally optimized strategies can outperform conventional fixed-dose regimens in reducing resistance, lowering toxicity, and improving efficacy. This framework offers a biologically interpretable tool for guiding evolution-aware, patient-tailored cancer therapies toward improved long-term outcomes.
1. Introduction
Breast cancer is a biologically complex and heterogeneous disease, often leading to drug resistance and treatment failure. Traditional approaches such as the maximum tolerated dose (MTD) aim for aggressive tumor eradication but frequently accelerate the emergence of resistant clones [1,2]. Adaptive therapy offers a promising alternative by dynamically adjusting drug dosage to maintain a manageable tumor burden and suppress resistance through intratumoral competition [3,4].
To design such evolution-informed strategies, computational modeling plays a crucial role. Frameworks including cellular automata, differential equations, agent-based simulations, and especially game-theoretic models [5,6,7,8] enable researchers to simulate tumor dynamics and optimize treatment protocols. Among these, evolutionary game theory provides biologically realistic insights into strategic interactions among cancer cells [9,10]. Recent models based on Stackelberg evolutionary games conceptualize the physician as a rational leader who anticipates the adaptive responses of cancer cells [11,12].
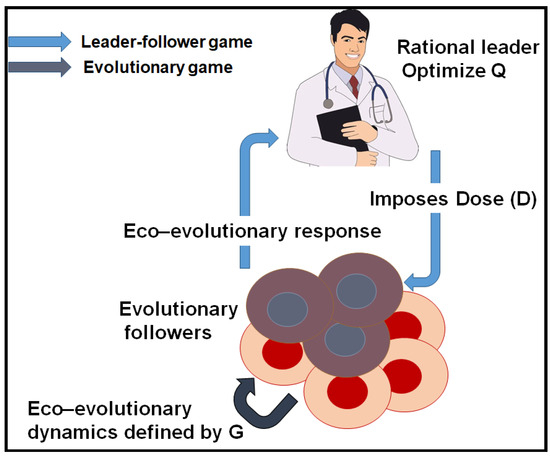
Building on this foundation, our study introduces the Breast Cancer Stackelberg game model to analyze the strategic interactions between a physician and a heterogeneous tumor cell population. The schematic representation of this hierarchical leader–follower interaction framework is presented in Figure 1, highlighting the physician’s role as a rational leader who anticipates and influences the evolutionary responses of cancer cells.
Figure 1.
The structure of evolutionary Stackelberg game in cancer.
To complement our theoretical framework, we utilized experimental data from xenograft mice treated with Capecitabine and Gemcitabine, as reported in [13]. Moving beyond purely theoretical approaches, we incorporate patient-specific tumor measurements to estimate key biological parameters through the Python-based GEKKO optimization package (version 1.3.0), enhancing model realism and predictive accuracy. The resulting model closely reproduces observed tumor behavior under three therapeutic protocols: dose-modulated adaptive therapy, intermittent adaptive therapy, and MTD regimens.
To capture the strategic interplay between treatment-sensitive and -resistant cancer cell populations, we formulate their interactions as a Stackelberg evolutionary game. In this hierarchical framework, the physician acting as a rational leader selects treatment doses to optimize a predefined objective function linked to patient quality of life. We evaluate three therapeutic strategies: MTD, ecologically enlightened therapy (EET), and evolutionarily enlightened therapy (EVT), following the conceptual framework introduced by Stein et al. [14]. Our analysis, applied to our own dataset, demonstrates that EVT consistently achieves the best outcomes: minimizing drug usage, reducing resistance emergence, and maximizing the objective function. In contrast, the MTD strategy accelerates resistance and compromises treatment durability.
In EET, the physician dynamically adjusts dosing based on observed resistance levels, leading to a static Nash equilibrium, where both the cancer cells’ resistance and the physician’s dosage mutually stabilize in response to one another. However, in EVT, the physician anticipates the future adaptive responses of cancer cells, achieving a Stackelberg equilibrium in which resistant populations settle into a stable eco-evolutionary state. This foresight allows the physician to proactively steer tumor evolution toward more manageable trajectories.
Further, to address spatial heterogeneity in the tumor microenvironment, we integrate reaction-diffusion equations into the model. This extension captures phenotypic diffusion and spatial expansion of resistant clones, underscoring the critical role of spatial dynamics in shaping treatment outcomes and resistance patterns.
Building on this calibrated framework, we integrate reinforcement learning (RL) to design adaptive treatment strategies for both single-agent and dual-drug settings. In the single-agent case, the RL agent learns dosing policies that balance tumor regression against cumulative drug exposure and resistance suppression. For combination therapy, the agent dynamically allocates doses between Capecitabine and Gemcitabine within pharmaco dynamic and toxicity constraints, exploiting dose diversification to improve tumor control without exceeding total dose budgets. In both scenarios, the RL-driven policies adapt to evolving tumor states, offering a flexible and data-informed approach to therapy optimization.
By leveraging limited early-stage tumor data, our approach enables reliable forecasts of tumor evolution and facilitates comparative evaluation of alternative treatment strategies, including their long-term efficacy and resistance outcomes. This predictive capability suggests that the framework may serve as a useful decision-support tool for designing personalized, evolution-aware cancer therapies that combine biologically grounded modeling with adaptive, AI-driven treatment planning.
The remainder of this paper is organized as follows. Section 2 presents a Stackelberg-based evolutionary modeling framework that strategically captures tumor progression by explicitly representing the interactions among heterogeneous breast cancer cell populations. Section 3 presents the main findings, including parameter estimation from experimental data, analysis of sensitive and resistant cell dynamics, spatial modeling of phenotype dispersal within the tumor microenvironment, and reinforcement learning-based optimization of adaptive therapy (single-drug and dual-drug). Finally, Section 4 discusses the broader implications of our findings, highlighting how the integration of game theory, reinforcement learning, and spatial ecology can inform the design of evolutionarily informed, resistance-aware treatment protocols in precision oncology.
2. Stackelberg Game Framework for Breast Cancer Therapy
The Stackelberg-Based Evolutionary Model provides a strategic framework for analyzing tumor progression by incorporating hierarchical interactions between breast cancer cells. By leveraging game theory principles, this model optimizes treatment strategies, balancing the competition between sensitive and resistant cell populations to enhance therapeutic efficacy.
This model enables physicians to make informed treatment decisions by dynamically adjusting drug dosages based on tumor response. Through its predictive capabilities, it offers personalized approaches that mitigate resistance development, ultimately improving patient outcomes in breast cancer therapy.
In this study, we propose an evolutionary Stackelberg game theory model to describe interactions among breast cancer cells. To evaluate the model’s applicability to physician–tumor dynamics, we analyzed experimental data from mice treated with two distinct therapeutic agents: Capecitabine and Gemcitabine. Model parameters were estimated based on observed data for each protocol, enabling a comparative evaluation of drug dosage effects and tumor burden variations.
The model was subsequently extended to incorporate two cancer cell populations, treatment-sensitive and treatment-resistant cells, allowing for a more comprehensive analysis of their spatial diffusion dynamics within a two-dimensional framework. This extension provides deeper insights into tumor evolution and treatment optimization, enhancing the predictive capabilities of the proposed model in guiding therapeutic decision-making.
Evolutionary Stackelberg game theory offers a promising framework for optimizing cancer treatment strategies. Within this approach, breast cancer therapy is modeled as an interaction between the physician and a heterogeneous population of cancer cells To capture the evolutionary dynamics of tumor growth and phenotypic adaptations leading to resistance over time, a fitness generating function (G-function) is employed. This function accounts for logistic tumor growth, which is effectively suppressed by multiple anticancer drugs. The generating function is defined as
r indicates intrinsic growth rate and x is normalized tumor burden. The expression represents the drug-induced death rate, where D denotes the administered drug dose, k represents the intrinsic resistance of cancer cells, and b quantifies the impact of resistance traits on diminishing drug efficacy. In this framework, D takes values between 0 and 1, with corresponding to MTD. The carrying capacity, denoted as , is modeled as a function of the resistance level u, reflecting the trade-off between resistance and ecological fitness. This formulation follows previous work by Pressley et al. [15], where similar relationships were used to capture treatment-induced evolutionary dynamics:
Here, represents the maximum possible carrying capacity, and g determines the magnitude of the resistance-associated cost. This formulation accounts for the impact of resistance on population growth, ensuring that as resistance levels increase, the effective carrying capacity is reduced. The ecological dynamics governing the system are defined as follows:
The evolution of cancer cell resistance in response to the physician’s treatment choices is governed by specific biological and ecological dynamics. These dynamics define how resistance levels change over time. The formal mathematical representation of these resistance dynamics is defined as follows:
The parameter determines the evolutionary speed of resistance adaptation. The following functions describe the calculation of the D value, adjusted for different treatment protocols.
- Standard Treatment Protocol: The standard treatment protocol involves the continuous administration of the drug at MTD, ensuring a consistent therapeutic effect. This approach maintains a high level of drug exposure to maximize tumor suppression, although it may lead to increased side effects and potential resistance over time.
- Dose Modulation Adaptive Therapy: In this adaptive therapy protocol, drug dosage is dynamically adjusted based on tumor burden fluctuations. If the tumor burden decreases by more than compared to the previous measurement, the dose is reduced by , preventing unnecessary drug exposure. Conversely, if the tumor burden increases by more than , the dose is increased by , ensuring sufficient drug pressure to counteract tumor progression.
Additionally, treatment is suspended when the tumor burden falls below a predefined threshold, allowing for drug holidays to minimize toxicity and prevent unnecessary intervention. Therapy is resumed once tumor growth surpasses the threshold again, ensuring effective control of disease progression. The parameters governing this adaptive strategy include and , which regulate the degree of dose modulation. The dose adjustment function for this protocol is defined as
Here, represents the initial dose at the start of treatment, is the drug dose in phase , and i indicates the current stage. The variable denotes the tumor burden at time step i, while corresponds to the burden measured in the previous interval. The time steps i and represent consecutive measurement intervals, each corresponding to one unit of time based on the experimental sampling schedule.
- Intermittent Adaptive Therapy Protocol: This protocol initiates treatment by administering the drug at MTD. If the tumor burden decreases to less than of its initial value, treatment is temporarily discontinued to minimize unnecessary drug exposure and reduce toxicity. However, if the tumor burden exceeds its original load, therapy is resumed at the MTD for each drug. The function D for this protocol is defined asHere, denotes the maximum tolerated dose. This innovative approach provides a comprehensive depiction of tumor population dynamics and the evolutionary trajectories of cellular resistance mechanisms in response to therapeutic interventions. By employing this modeling technique, evolutionary game theory offers critical insights into the complex interactions between therapeutic strategies and tumor evolution. These findings contribute to the development of personalized treatment protocols, enabling the optimization of therapeutic outcomes and improving long-term cancer management.
3. Results
This section is organized into six interconnected parts, each addressing a key component of the study. First, in Estimation of Model Parameters (Section 3.1), we present the methodology for deriving both treatment-specific and patient-specific parameters from experimental tumor volume data, ensuring accurate calibration of the model to individual and regimen-level characteristics. Second, in Sensitive and Resistant Cell Interactions (Section 3.2), we investigate the ecological and evolutionary dynamics between treatment-sensitive and treatment-resistant phenotypes, highlighting their competitive interplay under different therapeutic protocols. Third, in Integration of Experimental Data into the Simulation Framework (Section 3.4), we explain how real-world data is incorporated into the simulation environment and how it informs model behavior and predictions. Fourth, in Diffusion in Sensitive and Resistant Cells (Section 3.3), we incorporate spatial heterogeneity through reaction-diffusion modeling to capture the dispersal patterns of both phenotypes and assess their impact on tumor progression and treatment response Fifth, in Application of Reinforcement Learning for Adaptive Cancer Therapy (Section 3.5), we evaluate the performance of an RL-based framework in learning dosing strategies that balance tumor regression, cumulative drug exposure, and resistance suppression. Finally, in Extension from Single-Agent to Combination Therapy Modeling (Section 3.6), we expand the RL approach to dual-drug regimens, analyzing dose allocation under pharmacodynamic and toxicity constraints. This structured presentation enables a comprehensive evaluation of the model’s predictive capabilities and its potential to inform the design of evolutionarily informed, resistance-aware cancer therapies.
3.1. Estimation of Model Parameters
To evaluate the proposed model for cancer cell interactions with the physician, experimental data from treated mice were analyzed. Initially, the dataset underwent MinMax scaling normalization to standardize values, ensuring uniformity and consistency in the analytical process. This preprocessing step allowed for a more accurate comparison of treatment effects and model predictions. Tumors were classified into two distinct categories increasing (Up) and decreasing (Down) based on their initial response to treatment. This classification criterion is based on the tumor’s early trend upon treatment initiation, distinguishing between cases where the tumor shows immediate growth versus regression. Clinically, patients are categorized as non-responders if their tumor burden increases initially, while those showing early tumor shrinkage are labeled as responders. Notably, this initial reaction to treatment may provide valuable predictive insights into future tumor progression, making it a meaningful clustering approach.
Parameter estimation was conducted using the Python package GEKKO, a specialized tool for machine learning and optimization tasks. The model incorporates both treatment-specific and patient-specific parameters to enhance predictive accuracy. The treatment-specific parameters define therapeutic response mechanisms.These parameters are estimated independently for each therapy. while the patient-specific parameters account for individual variations in disease progression and treatment sensitivity.
The distinction between treatment-specific and patient-specific parameters is grounded in both biological reasoning and modeling precedent. In our framework, parameters such as which denotes the effective carrying capacity of the tumor under therapy are modeled as treatment-specific because they reflect the pharmacodynamic impact of the administered drug on tumor growth constraints. Prior studies have shown that therapeutic agents can modulate the tumor microenvironment, vascularization, and immune infiltration, all of which influence the maximum sustainable tumor burden under treatment [3,16]. In contrast, parameters like intrinsic growth rate (r) or resistance kinetics (, ) are considered patient-specific, as they are more tightly linked to host biology, genetic background, and tumor phenotype [17,18].
The variables and parameters of the model are summarized in Table 1. The optimal parameters for each group were selected based on their ability to achieve the best fit with observed data. A summary of their values is provided in Table 2, highlighting key parameter estimates.
Table 1.
Variables and parameters of the model. Parameter ranges were informed by prior literature, particularly the study by Benzekry et al. on resistance modeling in non-small cell lung cancer [19], which provides biologically plausible bounds for resistance-related dynamics.
Table 2.
The model parameters have been estimated.
The parameters and g were estimated under the assumption that they are treatment-specific but remain constant across all patients receiving the same therapeutic regimen. In contrast, the parameters and the initial value of u were considered patient-specific, as summarized in Table 1. These subject-specific parameters were estimated independently for each tumor, with the primary objective of minimizing the discrepancy between observed experimental data and the predictions generated by the model.
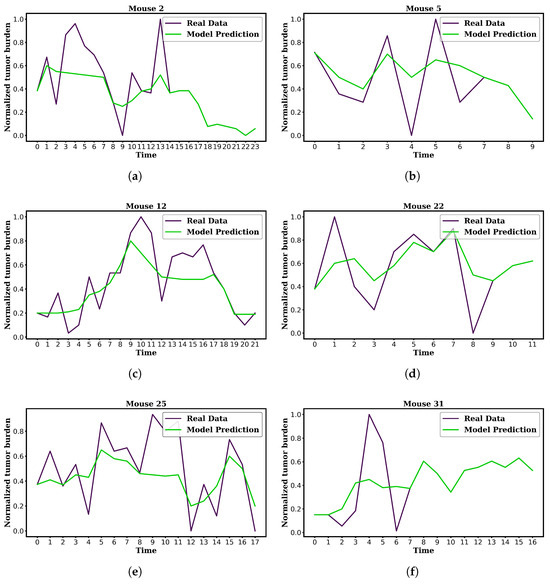
Figure 2 illustrate actual tumor growth data and corresponding model-generated graphs based on the estimated parameters for a subset of mice, providing a visual representation of the model’s predictive accuracy and its ability to capture tumor dynamics. As illustrated in the figure, the graph representing the actual data for Mice 2, 5, 12, 22, 25, and 31 closely aligns with the graph generated using the estimated parameters. This similarity indicates the accuracy and reliability of the parameter estimation process. The specific parameters associated with each mouse () are detailed in the figure caption, providing insights into individual variations in tumor progression and response to treatment. Such consistency validates the effectiveness of the modeling approach in capturing key biological dynamics.
Figure 2.
Comparison between experimental data and simulated population dynamics for Mice 2, 5, 12, 22, 25, and 31 using subject-specific estimated parameters. (a) Mouse 2: , , ; (b) Mouse 5: , , ; (c) Mouse 12: , , ; (d) Mouse 22: , , ; (e) Mouse 25: , , ; (f) Mouse 31: , , .
Since we have assumed that a specific set of parameters namely and k are treatment-specific, we can utilize them to simulate potential outcomes for patients who received different therapeutic protocols. This simulation enables comparative analysis of treatment efficacy, providing insights into how variations in drug administration strategies may have influenced tumor progression and patient responses.
While the model generally captures the overall trends in tumor growth and treatment response, its predictions do not fully align with experimental data in certain cases—particularly for subjects exhibiting oscillatory or non-monotonic behavior. These discrepancies likely stem from the simplified structure of the model, which does not explicitly incorporate key biological mechanisms such as immune system interactions, microenvironmental influences, and stochastic variability. Moreover, the parameter estimation process was intentionally constrained to biologically plausible ranges to prevent overfitting and ensure interpretability, which may have further limited the model’s flexibility in reproducing complex dynamics. Despite these limitations, the framework remains effective in capturing key features of tumor ecology and provides a foundation for evaluating adaptive treatment strategies.
In order to demonstrate the advantages of our game-theoretic modeling framework, we first compared its performance against well-established classical tumor growth models that have long served as the foundation of mathematical oncology. Classical models such as the Exponential, Logistic, and Gompertz formulations provide simplified yet analytically tractable descriptions of tumor expansion, each grounded in distinct biological assumptions. The Exponential model presumes unrestricted proliferation, making it suitable for early-stage growth but unrealistic for long-term dynamics due to the absence of resource limitations. The Logistic model introduces a fixed carrying capacity, thereby capturing saturation effects as tumor burden approaches physiological constraints. The Gompertz model, in turn, characterizes a gradual deceleration in growth rate, consistent with empirical observations of reduced proliferation in larger tumors. These paradigms have been extensively studied and benchmarked in both preclinical and clinical contexts, with recent systematic analyses confirming their utility and limitations [20,21].
Following the methodology outlined by Ghaffari Laleh et al. [20], we performed a comparative analysis using a dataset derived from murine tumor volume measurements across various tumor growth models. Tumor burden trajectories were fitted to each of the three classical models, and predictive accuracy was quantified using the Mean Squared Error (MSE) between model-predicted and experimentally measured tumor data. This benchmarking step provided a rigorous reference point for evaluating our game-theoretic framework, which explicitly incorporates ecological and evolutionary interactions between phenotypically distinct subpopulations within the tumor microenvironment. Unlike classical models that treat tumor growth as a homogeneous process, the game-theoretic approach accounts for competition, cooperation, and treatment feedback, thereby enabling the modeling of adaptive responses and evolutionary dynamics. Model parameters were estimated using the GEKKO optimization suite [22], which supports dynamic systems and differential-algebraic equations.
The comparative results revealed that while classical models can adequately reproduce monotonic growth patterns, they consistently fail to capture non-monotonic behaviors such as treatment-induced regressions, rebounds, and phenotypic switching phenomena increasingly recognized in both experimental and clinical datasets. In contrast, the game-theoretic model achieved superior alignment with these complex dynamics, underscoring its potential for more biologically grounded and clinically informative predictions. A summary of MSE values across different therapy strategies is presented in Table 3, highlighting the enhanced predictive accuracy of the game-theoretic framework, particularly in scenarios involving adaptive treatment.
Table 3.
Mean Squared Error (MSE) comparison across classical tumor growth models and game theory.
An important advantage of the proposed modeling framework is its ability to incorporate patient- or therapy-specific parameter estimates, enabling the simulation and comparison of multiple therapeutic protocols for the same individual. By calibrating the model to experimental data, it becomes possible to explore how alternative treatment strategies would influence both tumor dynamics and cumulative drug exposure, thereby providing a quantitative basis for personalized therapy design.
3.2. Sensitive and Resistant Cell Interactions
The analytical framework presented in this section builds upon the Stackelberg evolutionary game theory approach, which has been developed and extended over time in prior work [11,23,24,25]. In particular, Stein et al. [14] applied and further extended this framework in the context of cancer treatment, and we build on their formulation to explore treatment-induced evolutionary responses under varying therapeutic strategies, including EET and EVT. While the structure follows their established model, our simulations use modified parameters tailored to the current study, resulting in distinct graphical outcomes.
Tumors consist of heterogeneous populations of cancer cells with varying degrees of therapeutic resistance, all competing for limited resources. Adaptive therapy is a dose modulation strategy guided by treatment response, which leverages the intrinsic competition between sensitive and resistant cancer cells to optimize therapeutic efficacy. Treatment response depends on the adaptive capacity of cancer cells; therefore, adaptive therapy can incorporate evolutionary principles to better account for these adaptive dynamics.
By maintaining a substantial population of treatment-sensitive cells through controlled drug dosing or periodic treatment interruptions, adaptive therapy creates an environment in which sensitive cells suppress the proliferation of treatment-resistant subpopulations via competitive interactions. This strategic approach not only delays the emergence of drug resistance but also enhances long-term tumor control, offering a promising alternative to traditional high-dose regimens.
Evolutionary Stackelberg game theory provides a framework for refining cancer treatment strategies. In this context, breast cancer therapy is conceptualized as a dynamic interaction between a physician and a polymorphic population of cancer cells, encompassing both treatment-sensitive and treatment-resistant phenotypes. To model tumor growth dynamics and the evolutionary adaptations of resistance-related traits over time, a fitness-generating function (G-function) is employed. This function simulates the competitive interplay between subpopulations, offering insights into optimal therapeutic interventions that leverage evolutionary principles to suppress resistance and enhance treatment effectiveness.
The dynamics of two tumor subpopulations are described by the following system of equations. The variable represents cells sensitive to treatment, while denotes cells resistant to treatment. Both equations incorporate ecological competition and pharmacodynamic effects. The growth of the sensitive subpopulation is governed by its intrinsic proliferation rate . The term represents the total competitive pressure experienced by sensitive cells, where denotes intra-type competition among sensitive cells, and captures inter-type competition exerted by resistant cells. The cytotoxic effect of therapy is modeled by the term . Here, D denotes the administered drug dose, and represents the treatment resistance in the sensitive cell population. In this scenario :
The dynamics of the resistant subpopulation are similarly governed by its intrinsic growth rate . represents intra-type competition among resistant cells, and accounts for inter-type competition from sensitive cells. The treatment effect on resistant cells is captured by the term , where denotes the treatment resistance in the resistant subpopulation:
In our study, the experimental data correspond to tumor burden, which were normalized to the unit interval using min–max scaling. Accordingly, denotes the normalized total tumor burden. To optimize treatment decisions, we define the physician’s objective function Q as
In Equation (9), represents the maximum attainable value of the objective function. The term corresponds to the ecological equilibrium, while denotes the resistance strategy adopted by treatment-resistant cells and D is treatment dose. The parameters , , and reflect the relative importance of tumor burden, resistance, and toxicity.
Progression time is defined as the moment when tumor burden exceeds a fraction of the carrying capacity. In this study, we set , and therefore the threshold is given by . The goal is to identify treatment doses and resistance levels that keep the tumor below this threshold, enabling sustained control. Tumor behavior is classified into elimination, stabilization, and progression regions.
We adopt the classification of therapeutic strategies proposed by Stein et al. [14], which distinguishes between ecologically and evolutionarily enlightened approaches. These are formalized through Nash and Stackelberg optimization frameworks. The Nash strategy assumes a fixed resistance level and optimizes dose accordingly:
This strategy aligns with the intersection of the cancer cells’evolutionary response curve (ESS strategy ) and the physician’s best response curve . The Stackelberg strategy anticipates the cancer cells’ evolutionary response:
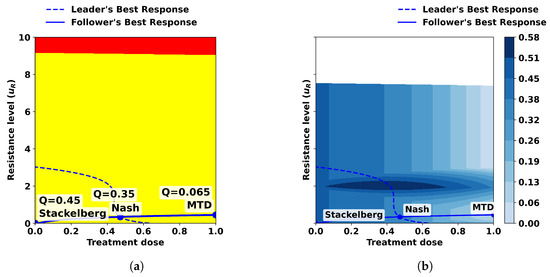
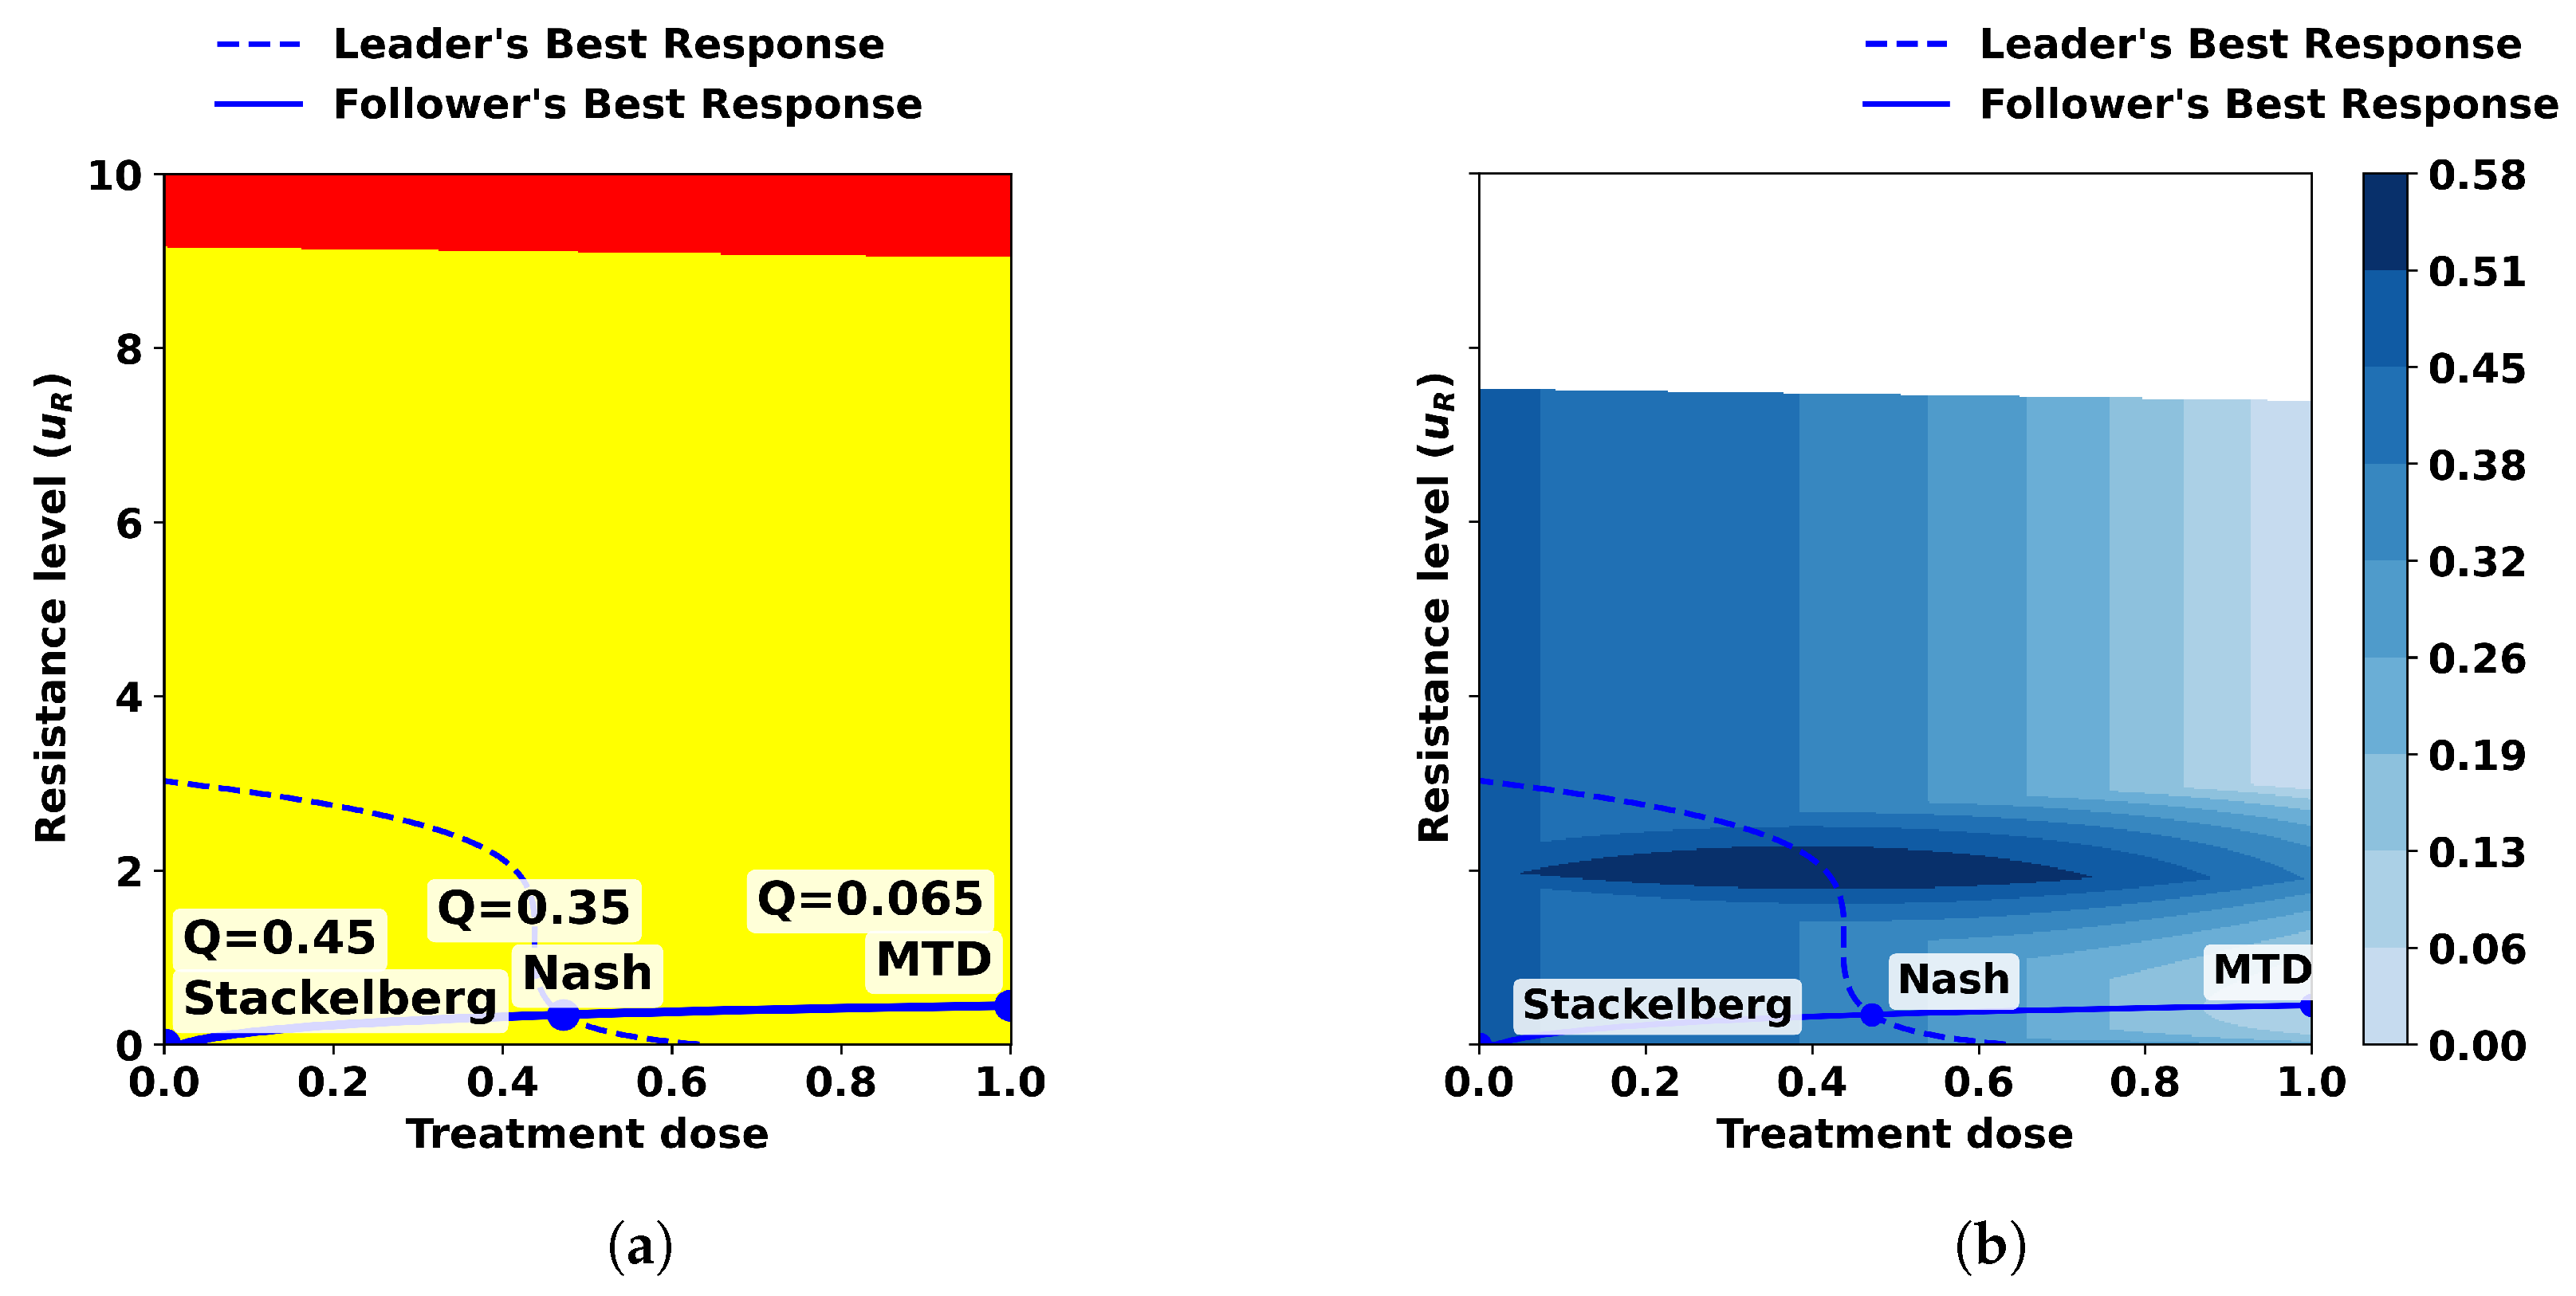
In order to illustrate the comparative outcomes of different therapeutic strategies, we analyzed Mouse 7 under three distinct approaches: MTD, the ecologically enlightened strategy (Nash equilibrium), and the evolutionarily enlightened strategy (Stackelberg equilibrium). The parametrization was based on the framework introduced by Stein et al. [14], adapted to our experimental data (Figure 3). The model was parameterized with , , , and , reflecting the relative weighting of tumor burden, treatment-induced resistance, and therapy toxicity in the physician’s objective function. Transition rates between phenotypes were set as , , and .
Figure 3.
Outcomes of three therapeutic strategies for Mouse 7: MTD, Nash equilibrium, and Stackelberg equilibrium. (a) Regions of tumor stabilization (yellow) versus progression (red). (b) Physician’s objective function under the chosen parametrization.
Under this parametrization, all three strategies fell within the stabilization region, where tumor burden remains nonzero but manageable. Among them, the Stackelberg equilibrium achieved the highest objective function value, followed by the Nash equilibrium, while MTD resulted in the lowest value. It should be noted that the near-zero dosing outcome observed under the Stackelberg strategy is influenced by the toxicity weight , which strongly penalizes drug administration. This reflects the sensitivity of the framework to parameter selection and highlights the importance of careful calibration and biological validation.
Furthermore, the Stackelberg strategy not only leads to a lower treatment dose and toxicity compared to both the Nash strategy and MTD but also reduces treatment-induced resistance, demonstrating its potential for optimizing therapeutic outcomes while minimizing adverse effects.
3.3. Diffusion in Sensitive and Resistant Cells
In this study, we adopt a conceptual framework based on evolutionary game theory, in which drug-sensitive cancer cells are represented as cooperative players and drug-resistant cells as opportunistic defectors. This abstraction has been widely used in the literature to model the ecological and evolutionary dynamics of tumor cell populations competing for limited resources within the tumor microenvironment [26,27,28].
Understanding spatial processes is essential, as tumor growth and treatment response are fundamentally shaped by the interplay between cellular motility, resource availability, and local interactions [27,29]. Although this classification offers a useful lens for analyzing treatment-induced selection pressures and spatial dynamics, we recognize that it simplifies the biological complexity of tumor behavior. For instance, under certain conditions, resistant cells may contribute to tumor-wide benefits—such as VEGF-mediated angiogenesis in hypoxic environments—which improve resource availability for both sensitive and resistant populations. This perspective aligns with recent work that integrates evolutionary game theory and control approaches to cancer therapy optimization [16,30]. These examples challenge the strict cooperator-defector dichotomy and underscore the context-dependent nature of cellular behavior.
To account for this nuance, our model focuses on the ecological consequences of differential diffusion and competition, rather than assigning fixed behavioral roles. By examining the conditions under which cooperative-like traits can suppress or coexist with defector-like strategies.
In spatially structured tumor environments, cells disperse to colonize new territories through migration and diffusion. The rate and pattern of this diffusion strongly influence population distribution and competitive dynamics. Slow diffusion of cooperative cells tends to channel their migration along high-benefit pathways, optimizing resource utilization and reinforcing mutualistic interactions. Conversely, rapid diffusion of defector cells enables them to quickly locate and exploit favorable niches, often undermining cooperative expansion and destabilizing spatial organization [31,32].
These opposing forces cooperative resource optimization versus opportunistic exploitation can drive the coexistence of both phenotypes, producing a spectrum of spatial patterns ranging from stable segregation to dynamic spatial chaos. The local microenvironment is further shaped by the production and consumption of shared resources, which modulate population stability and competitive balance over time. Self-organization arising from these diffusion processes not only strengthens cooperative interactions but also generates habitat diversity, a fundamental driver of ecological complexity in biological systems [27].
Building on the evolutionary dynamics presented in previous sections, we now introduce a two-dimensional migration diffusion model to explicitly capture the role of spatial heterogeneity in shaping interactions between cancer subpopulations. This spatially explicit framework provides deeper insight into the mechanisms governing tumor progression and therapeutic response, offering a quantitative basis for the development of spatially informed, evolution-aware treatment protocols. The model is defined as
The functions and represent the densities of cooperative and defector cells at time t, respectively. The diffusion constants and determine the migration rates for cooperative and defector cells, while denotes the diffusion operator. This continuous spatial expansion reveals a complex landscape of dynamic pattern formation within tumor microenvironments.
When defector cells exhibit a higher dispersal rate than cooperative cells (), the resulting spatial dynamics do not support the dominance of cooperators. Instead, defectors engage in persistent exploration of resource-rich pathways. Slow migration fosters cooperator aggregation, stabilizing their presence in favorable regions, whereas rapid migration allows defectors to quickly identify cooperative pathways. However, excessive mobility also undermines their ability to fully exploit any specific pathway efficiently, leading to transient rather than sustained advantage.
Existing models for various cancers frequently evaluate cell fitness based solely on the relative abundance of phenotypes within the population. However, these models often overlook the spatial structure of cells beyond one dimension or fail to incorporate cell diffusion dynamics, which are critical for accurately capturing tumor behavior. In complex biological systems, such as the human body, cells, hormones, and growth factors exhibit mobility, influencing intercellular interactions and overall population dynamics [33,34,35]. The dispersal of these components plays a fundamental role in tumor progression and response to treatment. The rate at which these elements disperse is governed by the diffusion coefficient in the reaction-diffusion equation, which may vary across different spatial coordinates, further influencing population dynamics.
Since the equations presented in this section are second-order partial differential equations, their solutions require numerical methods for accurate computation. To approximate function values at each point in the spatial domain and across generations, numerical techniques such as the five-point stencil method are employed to solve all replicator equations, ensuring precision and practical applicability in modeling tumor evolution.
As proposed, the breast cancer game model is implemented within a two-dimensional spatial environment, represented as an computational grid, where n denotes the number of cells along each coordinate direction. Each grid cell contains a type i cancer cell with a probability of , while remaining vacant with a probability of , allowing for a probabilistic representation of tumor heterogeneity and spatial distribution.
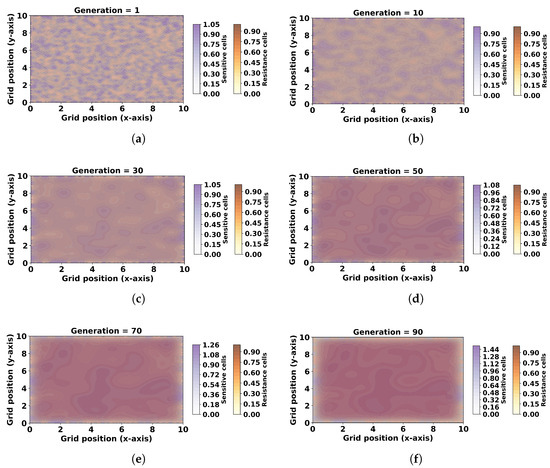
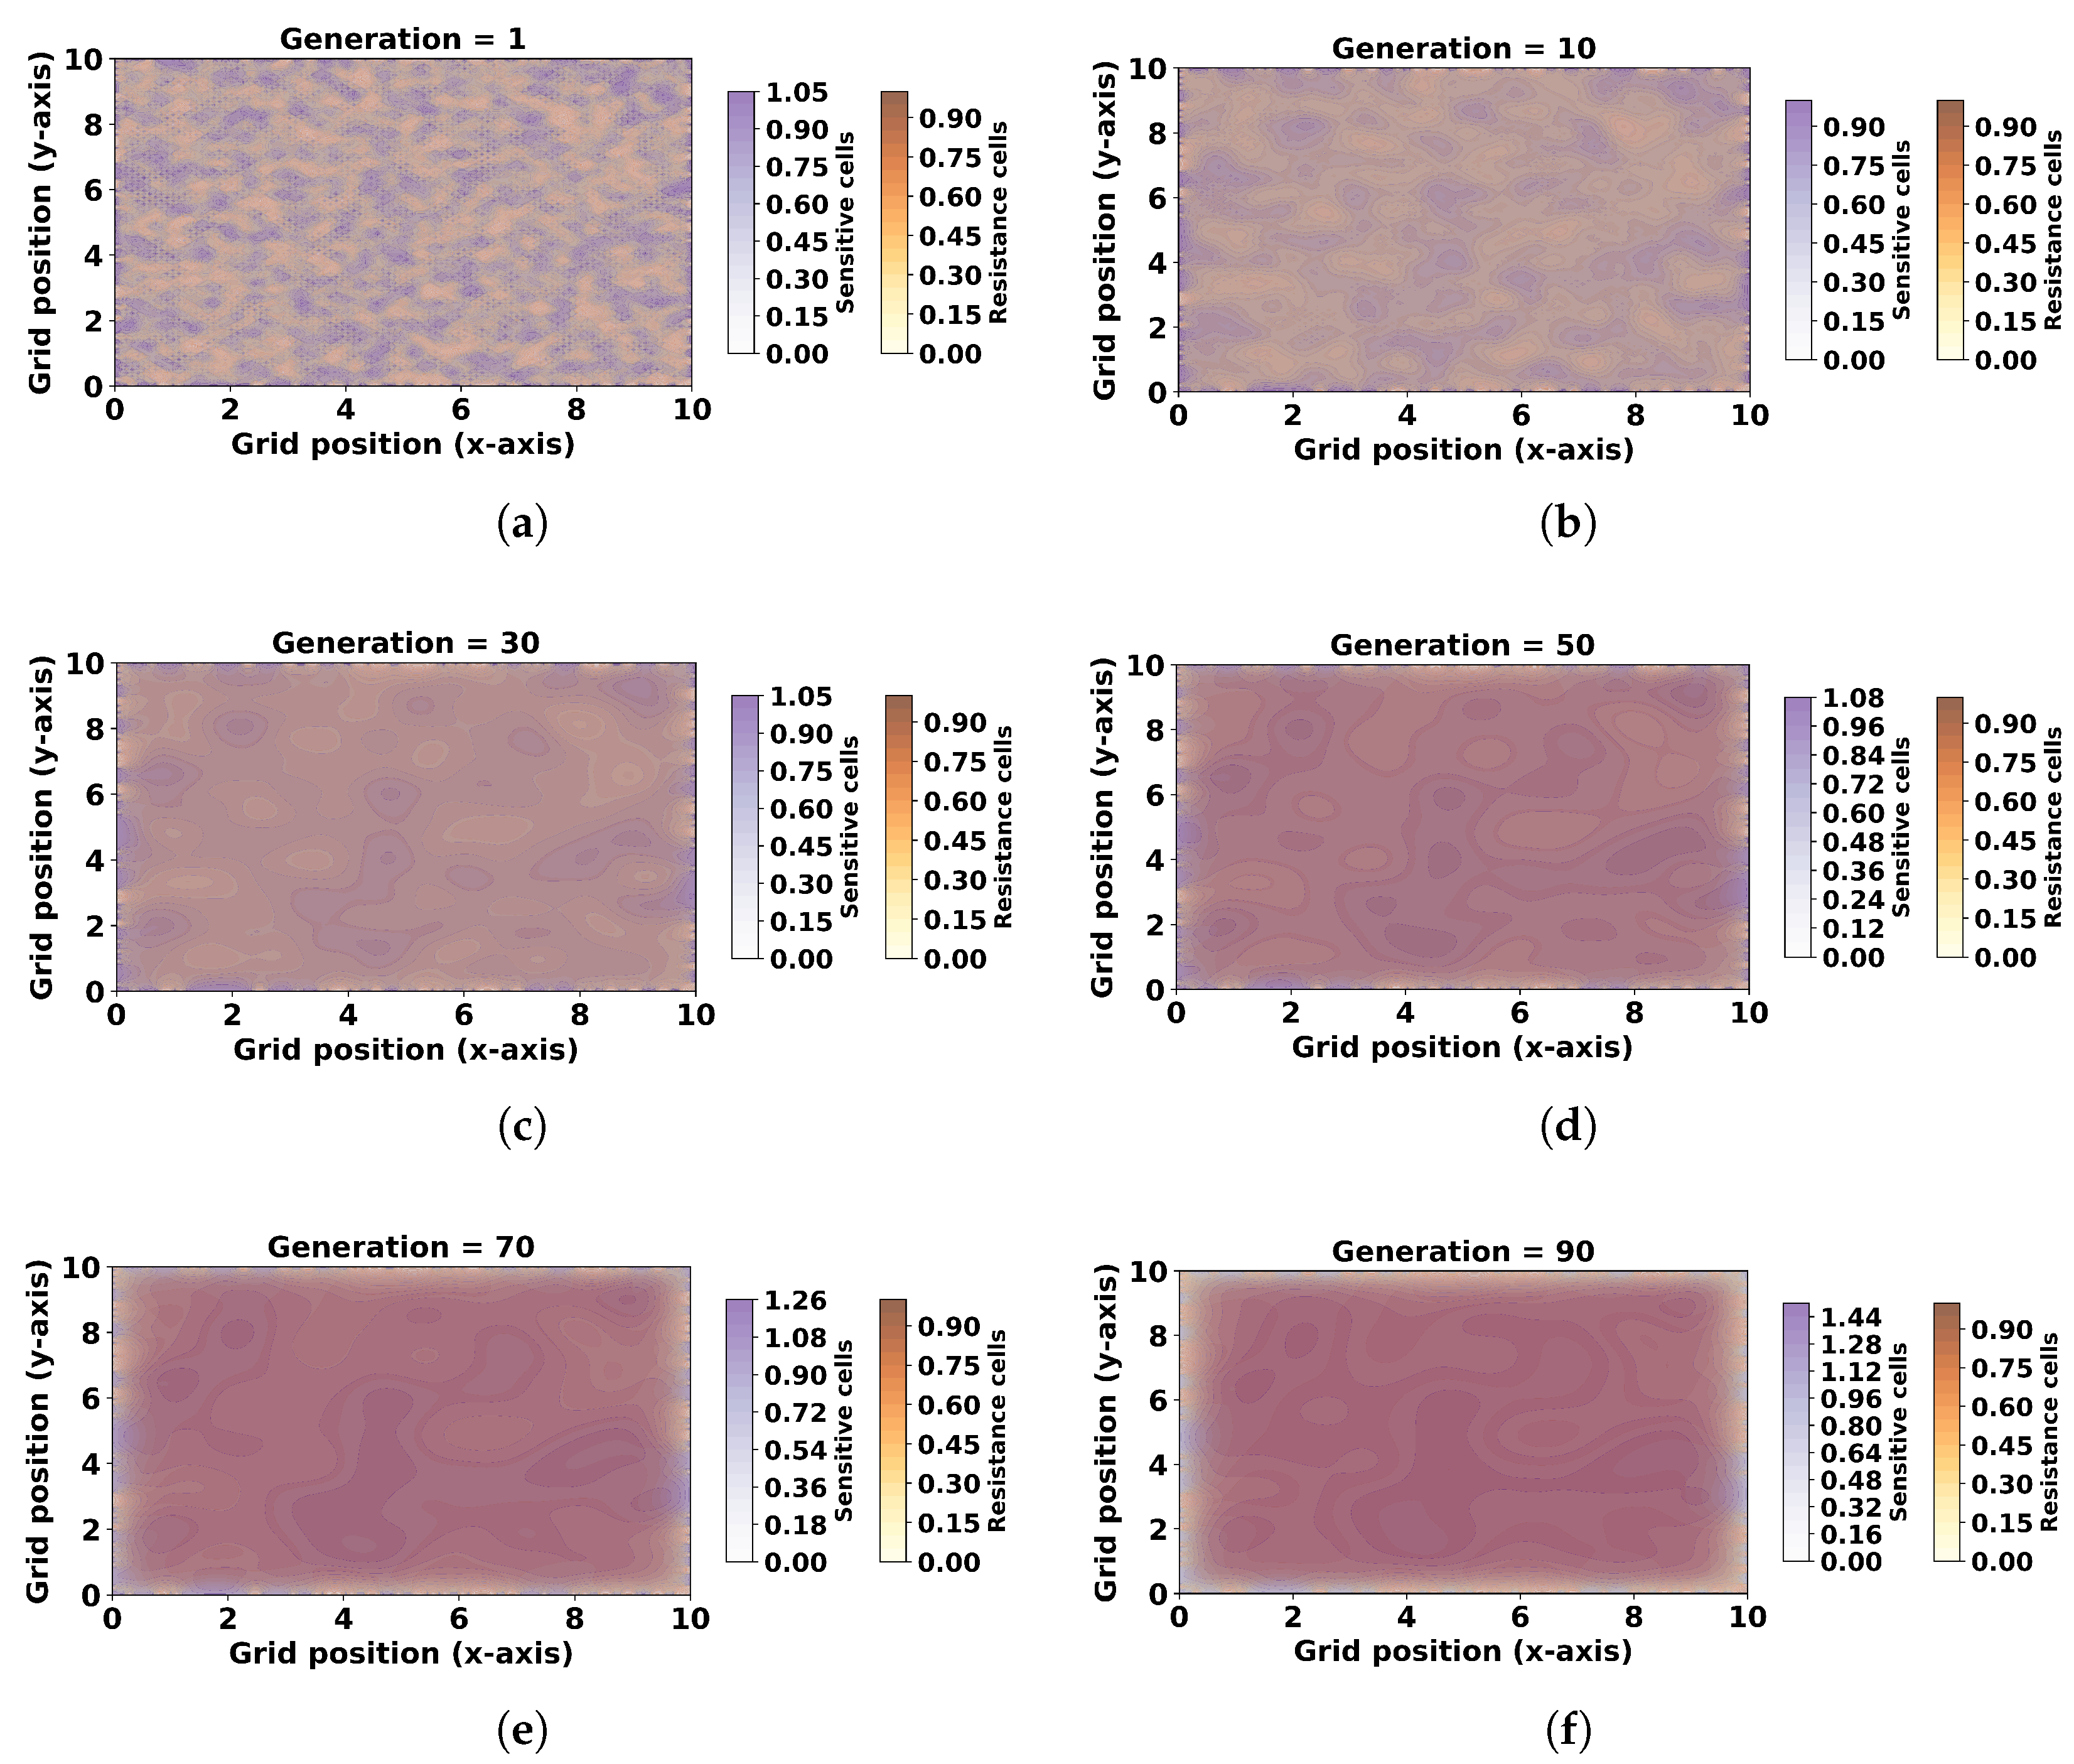
Figure 4, depicting the diffusion dynamics of Mouse 22 across multiple generations, illustrates tumor progression trends. Specifically, at generation 90, the density of treatment-resistant cells surpasses that of treatment-sensitive cells, highlighting the selective pressures that drive resistance evolution over time.
Figure 4.
Two-dimensional representation of population dynamics and evolutionary progression under the condition on a grid for Mouse 22, with initial values set to and of the initial population. (a) Population dynamics in generation 1; (b) Population dynamics in generation 10; (c) Population dynamics in generation 30; (d) Population dynamics in generation 50; (e) Population dynamics in generation 70; (f) Population dynamics in generation 90.
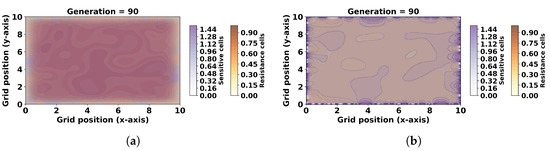
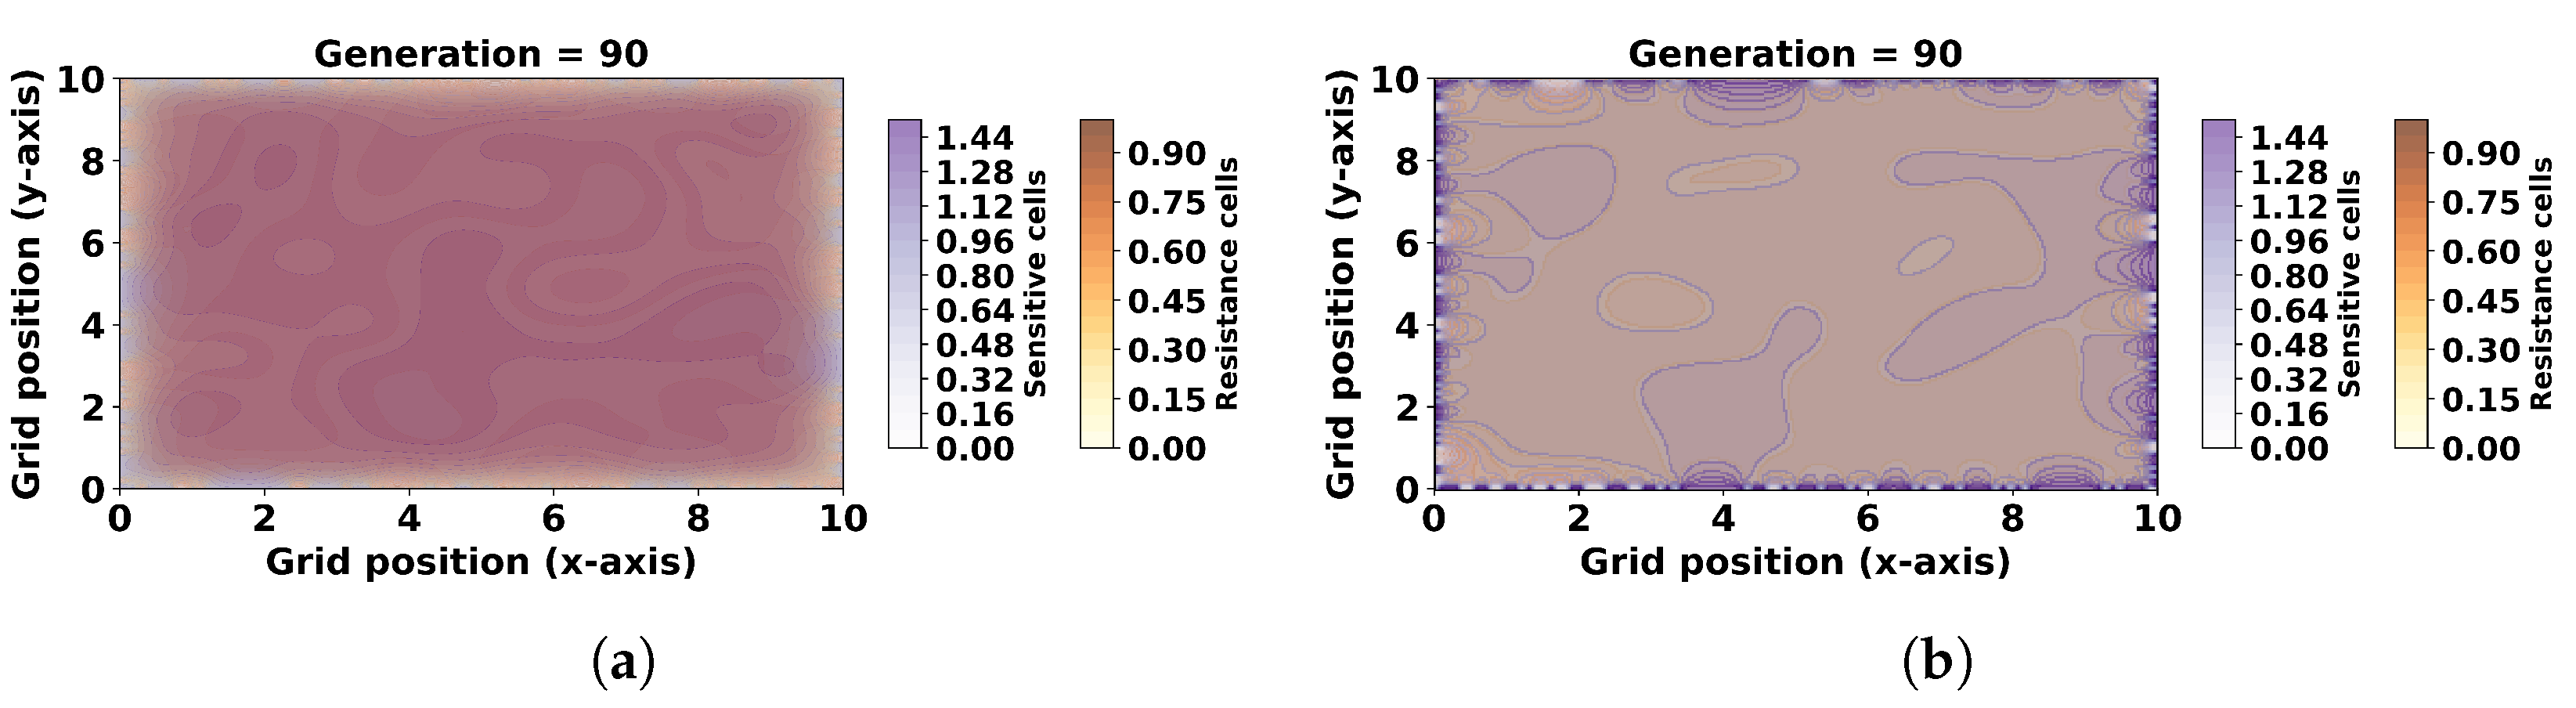
As illustrated in Figure 5, the population dynamics for Mouse 22 exhibit distinct shifts depending on the applied treatment protocol. When the Dose Modulation Adaptive Therapy protocol is implemented, the population predominantly transitions toward treatment-resistant phenotypes. Conversely, under the Intermittent Adaptive Therapy protocol, the population dynamics favor an increase in treatment-sensitive phenotypes, highlighting the differential impact of these therapeutic strategies on cellular evolution.
Figure 5.
Two-dimensional representation of population dynamics and evolutionary progression under the condition on a grid for Mouse 22: (a) Population state and evolutionary trajectory under the Dose Modulation Adaptive Therapy protocol. (b) Population state and evolutionary trajectory under the Intermittent Adaptive Therapy protocol.
3.4. Integration of Experimental Data into the Simulation Framework
To ensure biological relevance and model fidelity, we integrated real-world experimental data into the simulation environment. Specifically, tumor volume measurements obtained from murine xenograft models treated with Gemcitabine and Capecitabine under distinct therapeutic protocols were used as reference datasets. These data served as the foundation for estimating key pharmacodynamic parameters through nonlinear least-squares optimization using the Python-based GEKKO package, a specialized tool for dynamic modeling and parameter fitting.
The estimated parameters informed the construction of a biologically grounded simulation framework capable of capturing tumor dynamics under both single-agent and combination therapies. This calibration process enabled the model to reproduce observed treatment responses and provided a reliable basis for evaluating alternative therapeutic strategies, including reinforcement learning (RL)-based schedules. In our framework, we distinguish between two categories of parameters:
- Therapy-specific parameters (g, k, b, ): These define the pharmacodynamic characteristics of each drug and are estimated independently for each treatment protocol. They remain constant across patients receiving the same therapy.
- Subject-specific parameters (, r, ): These capture individual tumor growth behavior, initial tumor burden, and biological variability. They are uniquely estimated for each subject based on their experimental data.
By combining these parameter sets, we simulate multiple treatment protocols for a given patient and assess their relative effectiveness. This enables personalized therapy planning by comparing outcomes such as tumor volume reduction and cumulative drug exposure across different regimens. The simulation framework thus supports the identification of optimal strategies tailored to individual patient profiles, balancing therapeutic efficacy with toxicity constraints.
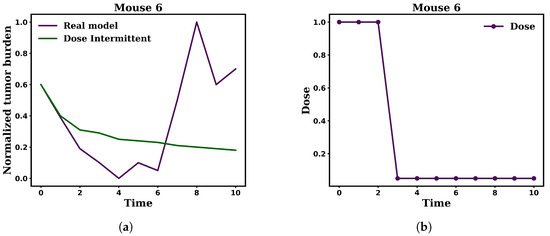
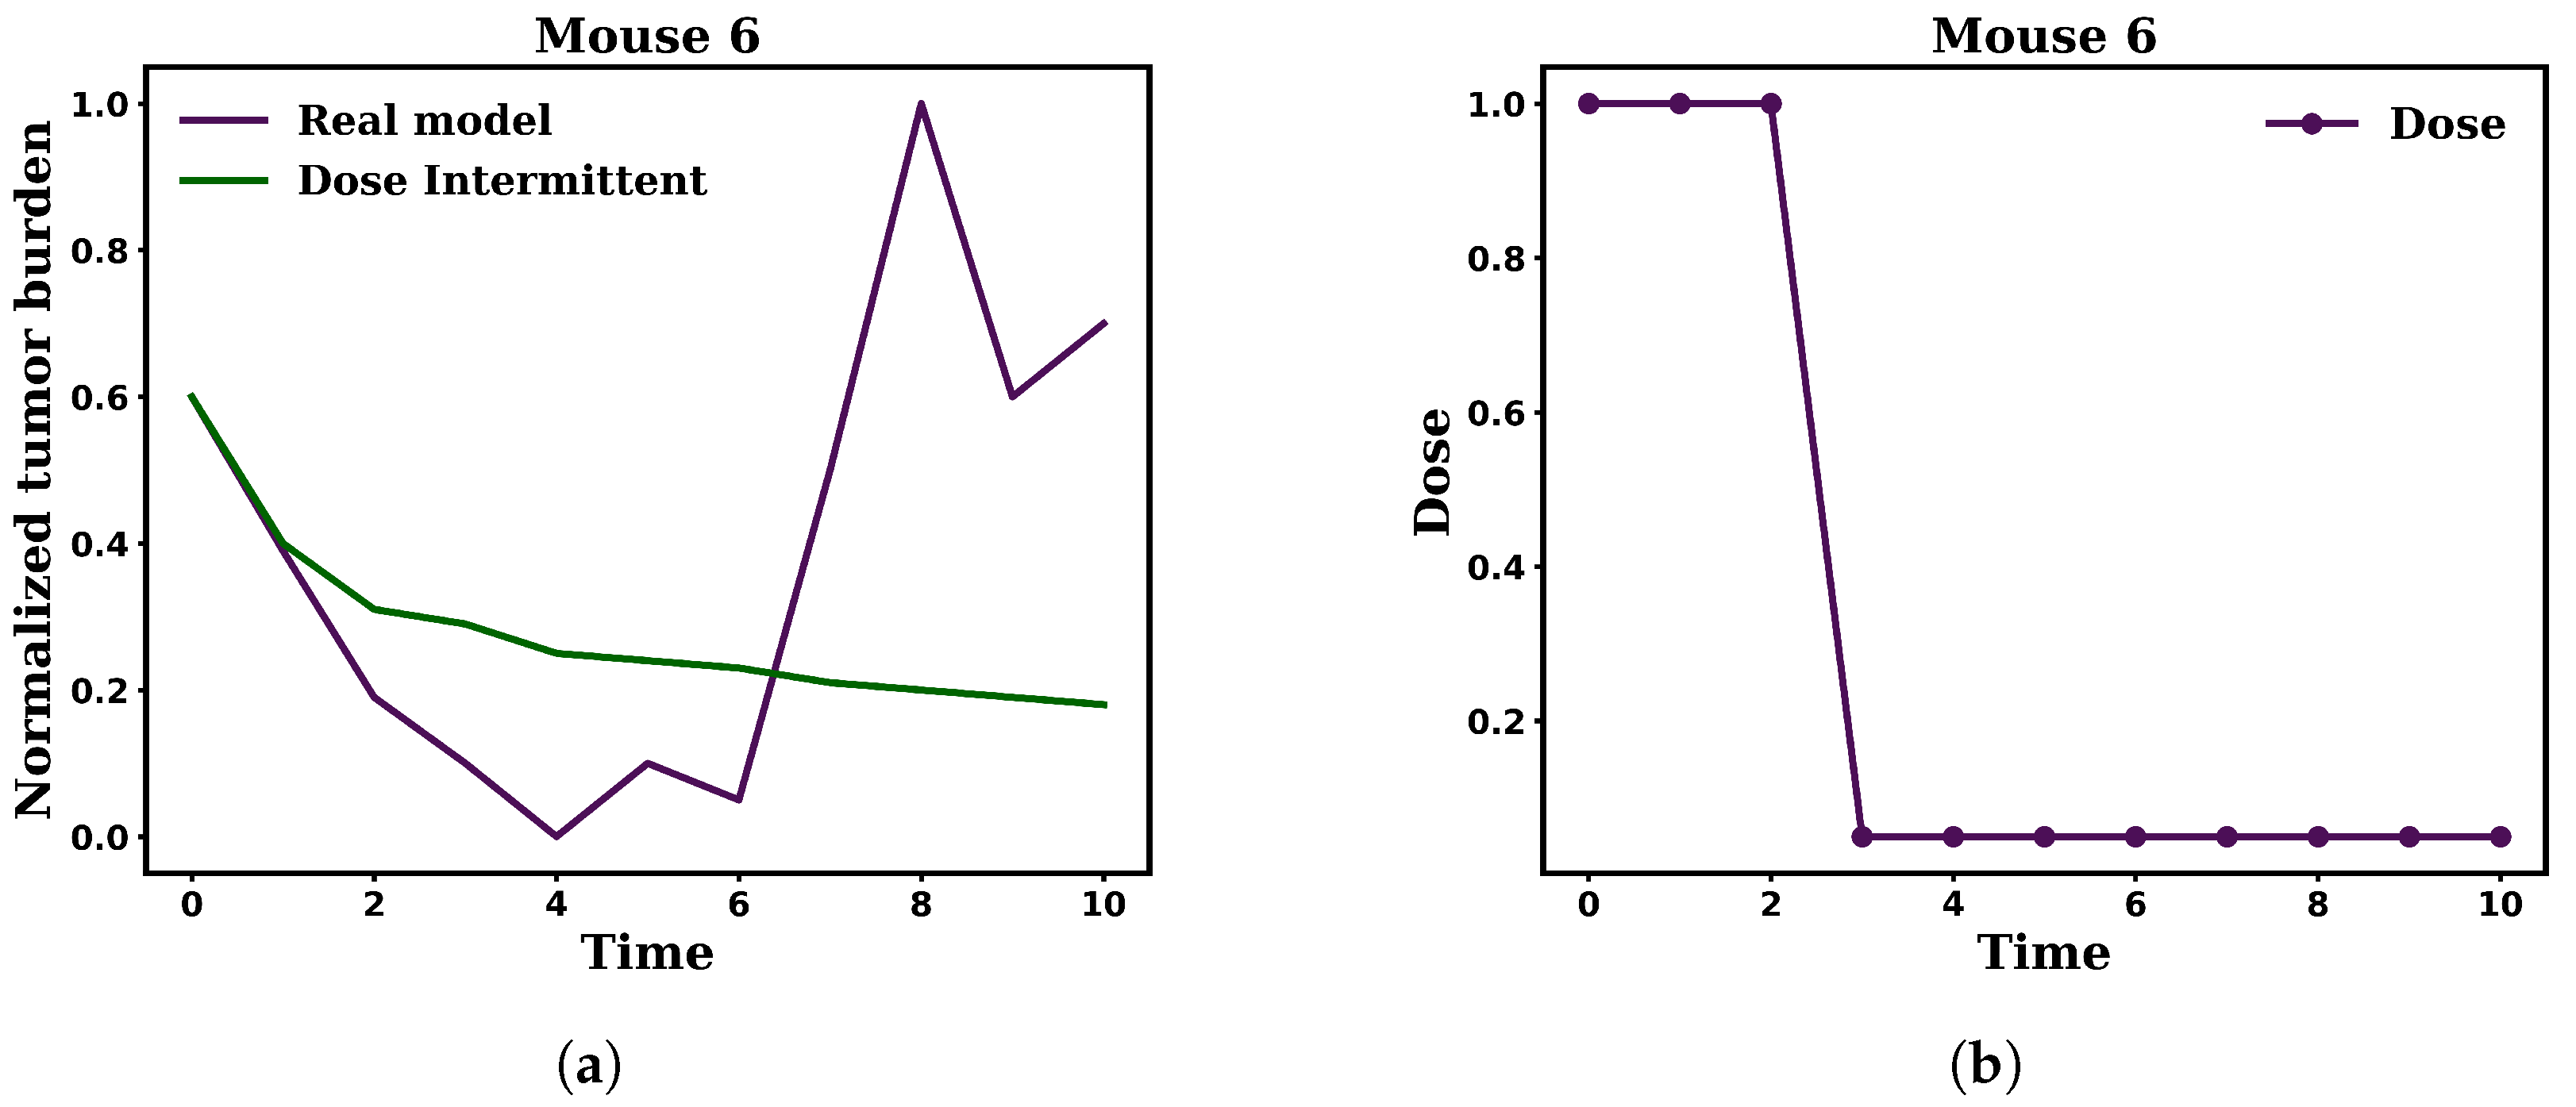
As illustrated in Figure 6, Mouse 6 was treated experimentally under the Gemcitabine MTD protocol. Model based comparative analysis, however, indicates that if an intermittent adaptive therapy protocol had been applied, a more pronounced reduction in tumor burden could have been achieved, accompanied by a lower cumulative drug dose. These results suggest that intermittent scheduling may improve treatment effectiveness by better controlling the tumor while reducing the overall drug burden for Mouse 6.
Figure 6.
Model-based comparison of (a) population dynamics and (b) treatment dose rates for mouse 6. While the experimental protocol involved MTD administration of Gemcitabine, simulation results suggest that an intermittent adaptive therapy schedule could have achieved greater tumor suppression with reduced cumulative drug exposure.
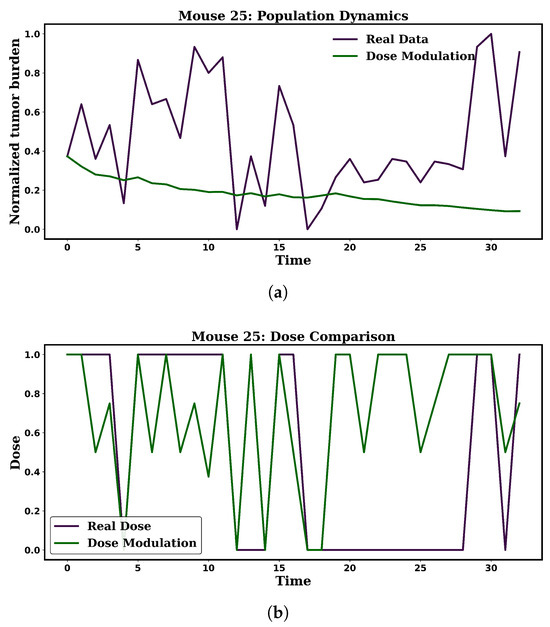
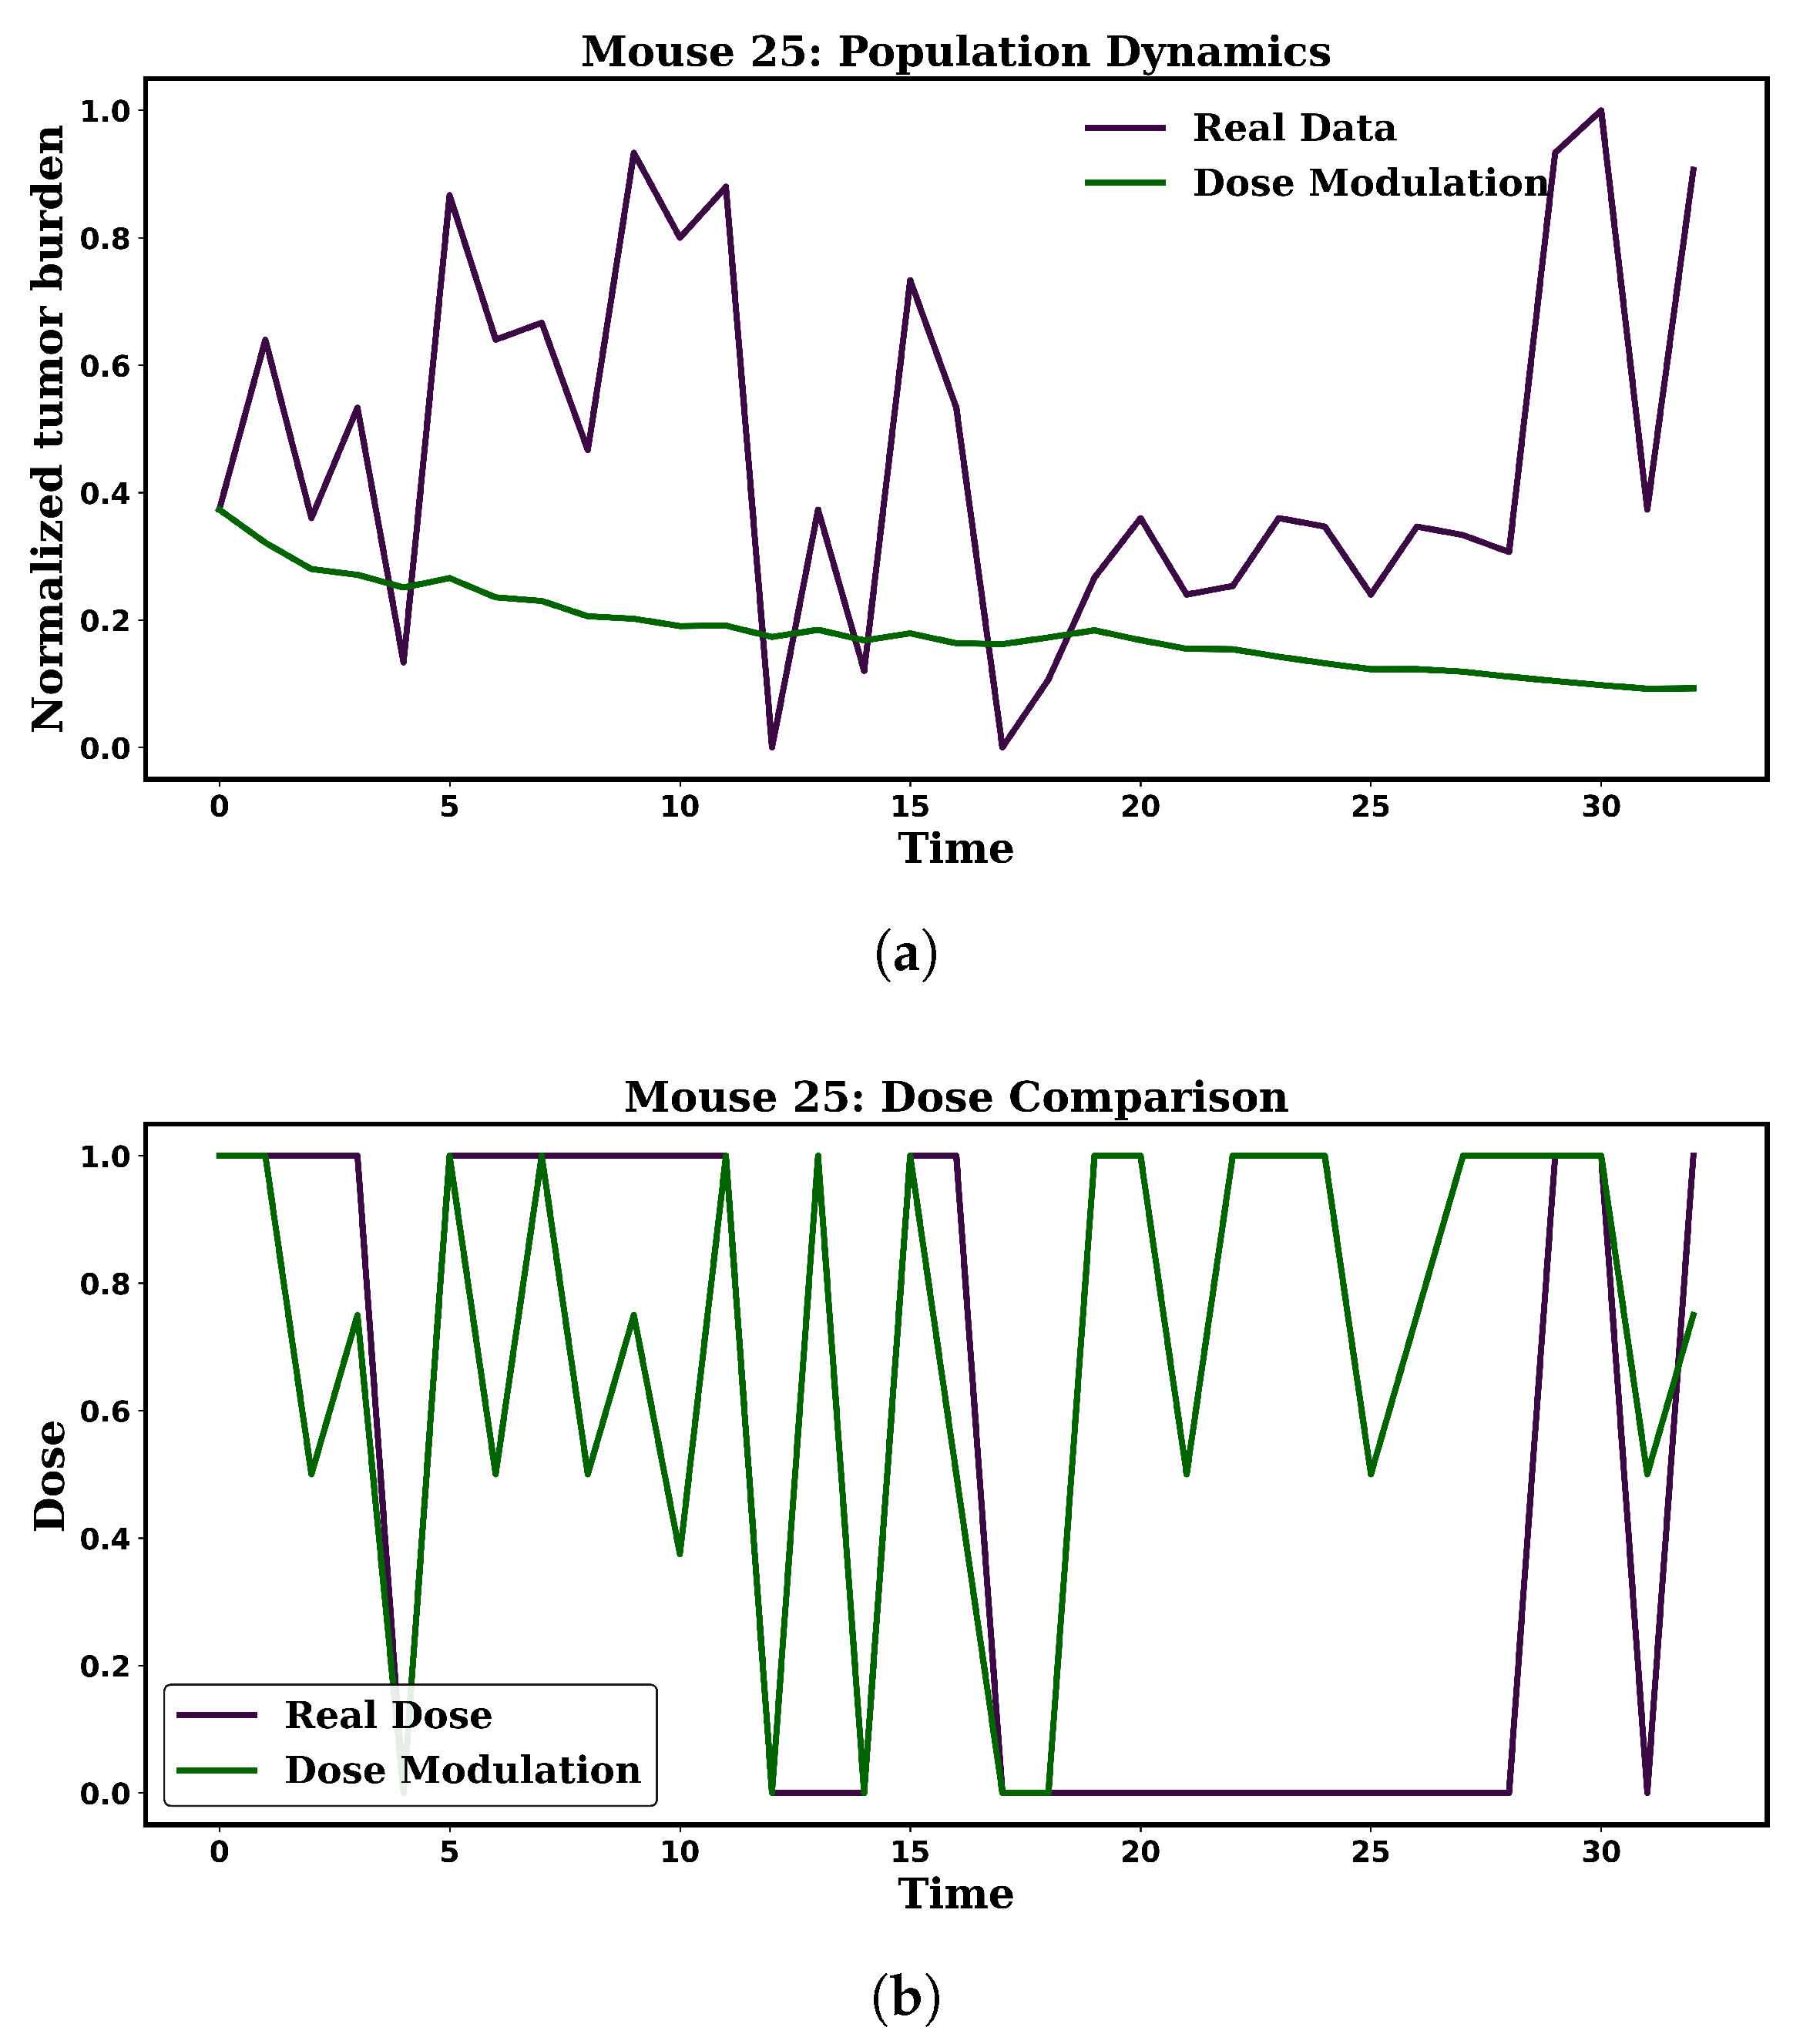
Similarly, Figure 7 presents results for Mouse 25, comparing the real-data intermittent adaptive therapy protocol with a model simulated Dose Modulation adaptive therapy. In this case, the Dose Modulation approach produced a greater reduction in tumor burden, but at the expense of increased drug administration. Specifically, while the total dose delivered in the real data protocol was 16 units, the model required 22 units to achieve the observed tumor suppression. Such analyses underscore the capacity of the modeling framework to quantify trade-offs between tumor control and drug exposure, thereby informing the selection of treatment strategies that balance efficacy with toxicity considerations.
Figure 7.
Comparison of (a) population dynamics and (b) treatment dose rates for mouse 25 under intermittent adaptive therapy (real data) and Dose Modulation adaptive therapy.
3.5. Application of Reinforcement Learning for Adaptive Cancer Therapy
Recent advances in artificial intelligence have facilitated the emergence of reinforcement learning (RL) frameworks capable of optimizing therapeutic strategies in complex and dynamic biological systems. In the context of oncology, RL offers a principled approach to designing adaptive treatment schedules that respond to the evolving state of the tumor and its microenvironment. In this study, we developed a biologically informed RL model to generate personalized chemotherapy protocols for tumor-bearing mice, with the overarching goal of minimizing tumor burden, delaying or preventing the emergence of drug resistance, and avoiding overtreatment, key objectives in precision oncology [17,36].
The RL agent was trained on tumor burden and dosing data, enabling it to learn from the temporal interplay between treatment intensity, tumor regression, and resistance dynamics. The environment was modeled as a discrete-time system, where at each time step the agent observed the current state , with X representing the tumor burden and u denoting the level of resistance. Based on this state, the agent selected an action corresponding to no dose, low dose, medium dose, or high dose administration, respectively.
A central component of the RL framework is the reward function, which encodes the therapeutic objectives and guides policy optimization. In our formulation, the reward at each time step was defined as
where quantifies the reduction in tumor burden relative to the previous time step, D is the administered drug dose, and u is the resistance level. The coefficients , , and are tunable parameters that determine the relative importance of tumor shrinkage, dose minimization, and resistance suppression, respectively. Increasing prioritizes aggressive tumor reduction, while larger values penalize excessive drug usage to mitigate toxicity. Similarly, higher values place greater emphasis on controlling resistance evolution, potentially favoring strategies that maintain a stable, treatment-sensitive tumor subpopulation. By adjusting these weights, the framework can be tailored to different clinical priorities, such as maximizing tumor control in aggressive disease or minimizing toxicity in frail patients.
The agent was trained using tabular Q-learning, a RL algorithm, with learning rate , discount factor , and exploration rate . The Q-table was updated iteratively according to the Bellman equation:
where is the reward obtained at time t. The discount factor controls the trade-off between immediate and long-term gains, with higher values encouraging the agent to adopt strategies that yield sustained tumor control rather than short-lived regressions.
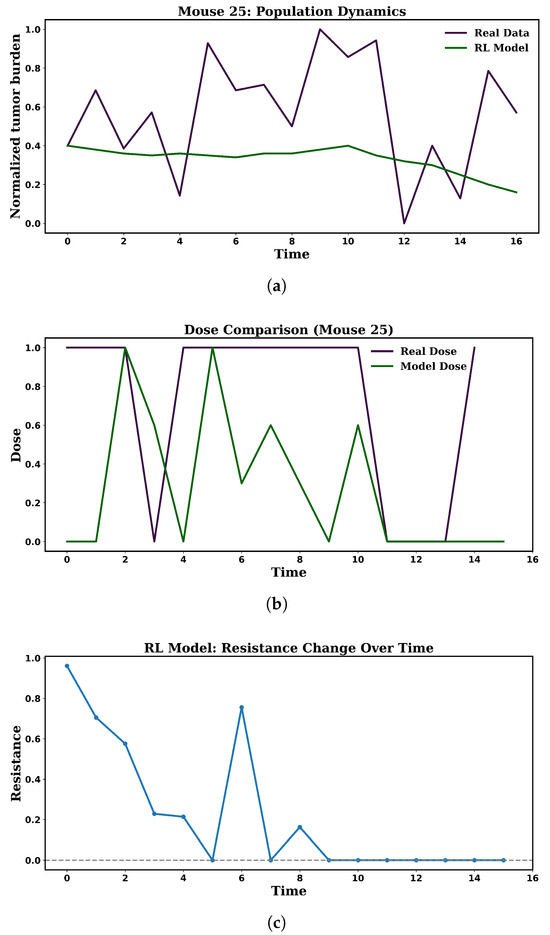
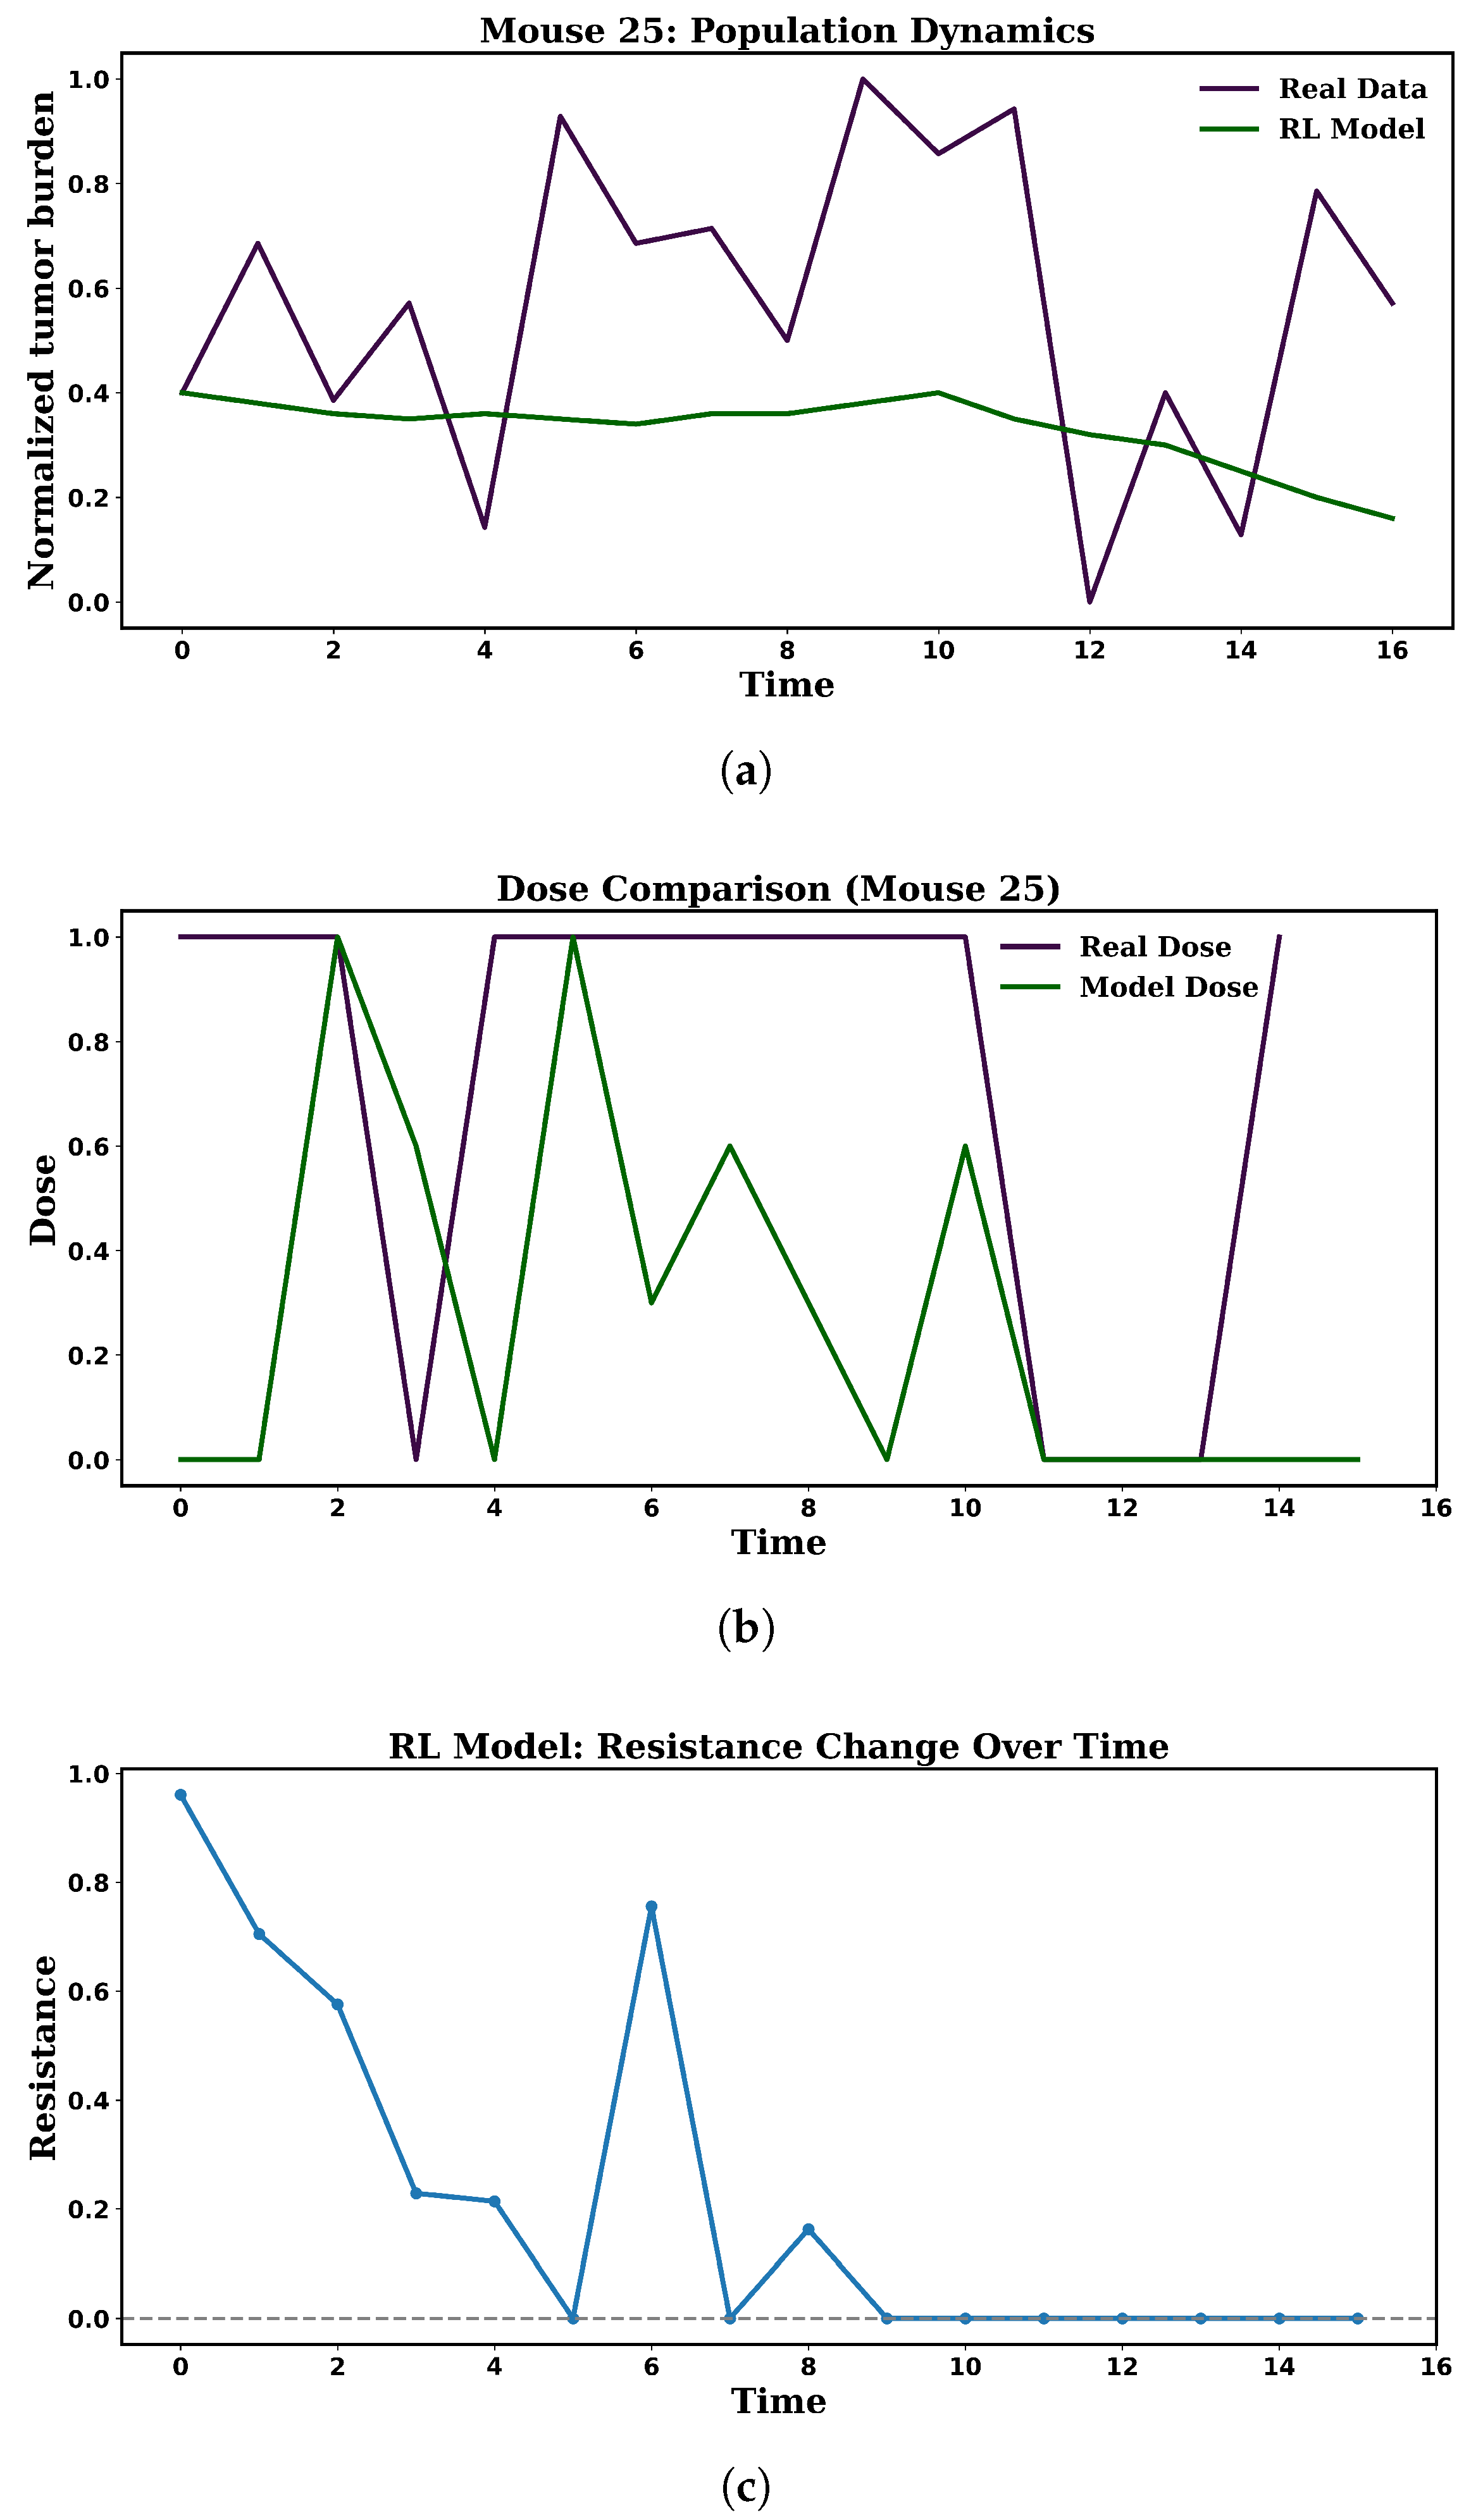
Once trained, the reinforcement learning (RL) agent was applied to an unseen test subject (Mouse 25) within a simulated environment. The simulation was constructed using subject-specific parameters estimated from experimental tumor volume data. To evaluate the agent’s performance, its dosing schedule was compared against the actual intermittent adaptive therapy protocol recorded for Mouse 25 in the experimental dataset (Figure 8). The RL-derived schedule achieved a reduction in tumor burden while lowering cumulative drug exposure, demonstrating its ability to balance efficacy with toxicity constraints. Notably, the agent exhibited adaptive dosing behavior—intensifying treatment in response to rising tumor burden and reducing it when resistance levels were low. This behavior, which aligns with clinical intuition, emerges directly from the structure of the reward function used during training. Its performance should be interpreted within the context of the simulation framework and the subject-specific parameter estimates embedded in the model.
Figure 8.
Illustration of (a) population dynamics, (b) treatment dose rates for mouse 25 under experimental intermittent adaptive therapy and simulated RL-based schedule (, , ), and (c) resistance level trajectories generated by the simulation.
A key strength of our approach lies in the integration of tumor growth and resistance models within the RL framework. By embedding differential equation-based dynamics into the environment, the agent learns policies that are not only data-driven but also biologically interpretable and generalizable across individuals and treatment contexts [37]. This hybrid modeling paradigm enhances clinical relevance, offering a pathway toward evolution-aware, patient-specific cancer therapies that adapt in real time to the shifting landscape of tumor ecology.
After estimating subject-specific parameters for each mouse, it becomes feasible to simulate and assess the effectiveness of various therapeutic strategies in a case-specific manner. Table 4 provides a quantitative comparison of three treatment approaches applied to Mouse 25 over 16 time units. The RL-derived schedule demonstrates more effective performance, achieving the lowest final tumor burden and resistance level while requiring the least cumulative drug exposure. In contrast, the dose modulation strategy effectively reduces tumor burden but entails a higher overall drug consumption.
Table 4.
Quantitative comparison of treatment strategies for Mouse 25 over 16 time units. Metrics include Final Tumor Burden (normalized), Total Cumulative Dose, and Final Resistance Level.
3.6. Extension from Single-Agent to Combination Therapy Modeling
Combination chemotherapy, in which two or more cytotoxic or cytostatic agents are administered in a coordinated regimen, is a cornerstone of modern oncology. Such protocols aim to exploit complementary mechanisms of action, reduce the likelihood of cross-resistance, and achieve synergistic tumor suppression while maintaining acceptable toxicity profiles [38]. By targeting distinct molecular pathways or cell cycle phases, combination regimens can enhance therapeutic efficacy compared to single-agent protocols, particularly in heterogeneous tumors where subpopulations may exhibit differential drug sensitivities [38,39]. Clinically, combinations such as Gemcitabine with Capecitabine have been investigated in several malignancies, including pancreatic and breast cancers, with evidence of improved progression-free survival in selected patient cohorts [40,41].
Building on this rationale, we extended our reinforcement learning based tumor dynamics framework originally developed for single agent treatment protocols to capture the dynamics of dual drug interactions. The baseline datasets for the murine experiments comprised tumor volume measurements obtained under regimens of Gemcitabine and Capecitabine. Using these data as a reference, we developed a biologically informed simulation environment that integrates the pharmacodynamic effects of both Gemcitabine () and Capecitabine (), while enforcing clinically relevant constraints, including an upper bound on the total normalized dose administered at each time step (). This formulation enables the model to explore adaptive dosing strategies that balance efficacy and toxicity within a realistic therapeutic window.
The reinforcement learning agent was trained using the Q-learning algorithm to adaptively allocate doses between the two therapeutic agents, with the overarching objective of maximizing tumor regression while simultaneously minimizing cumulative toxicity and the emergence of drug resistance. The reward function guiding the agent learning process was formulated as:
where quantifies the reduction in tumor burden between consecutive time steps, denotes the total normalized dose of Gemcitabine and Capecitabine administered at that step, and u represents the current level of treatment resistance within the tumor population. The coefficient penalizes excessive drug administration to limit cumulative toxicity, while penalizes high resistance levels to encourage strategies that maintain treatment sensitivity. In this study, we set and , parameter values selected to balance the competing clinical priorities of maximizing therapeutic efficacy and minimizing adverse effects.
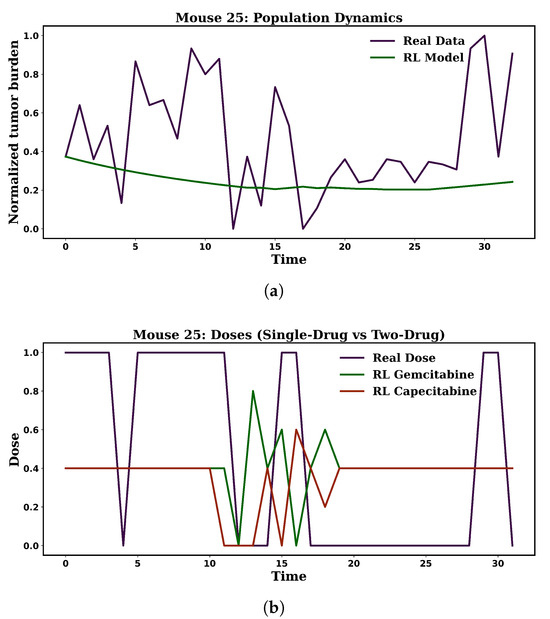
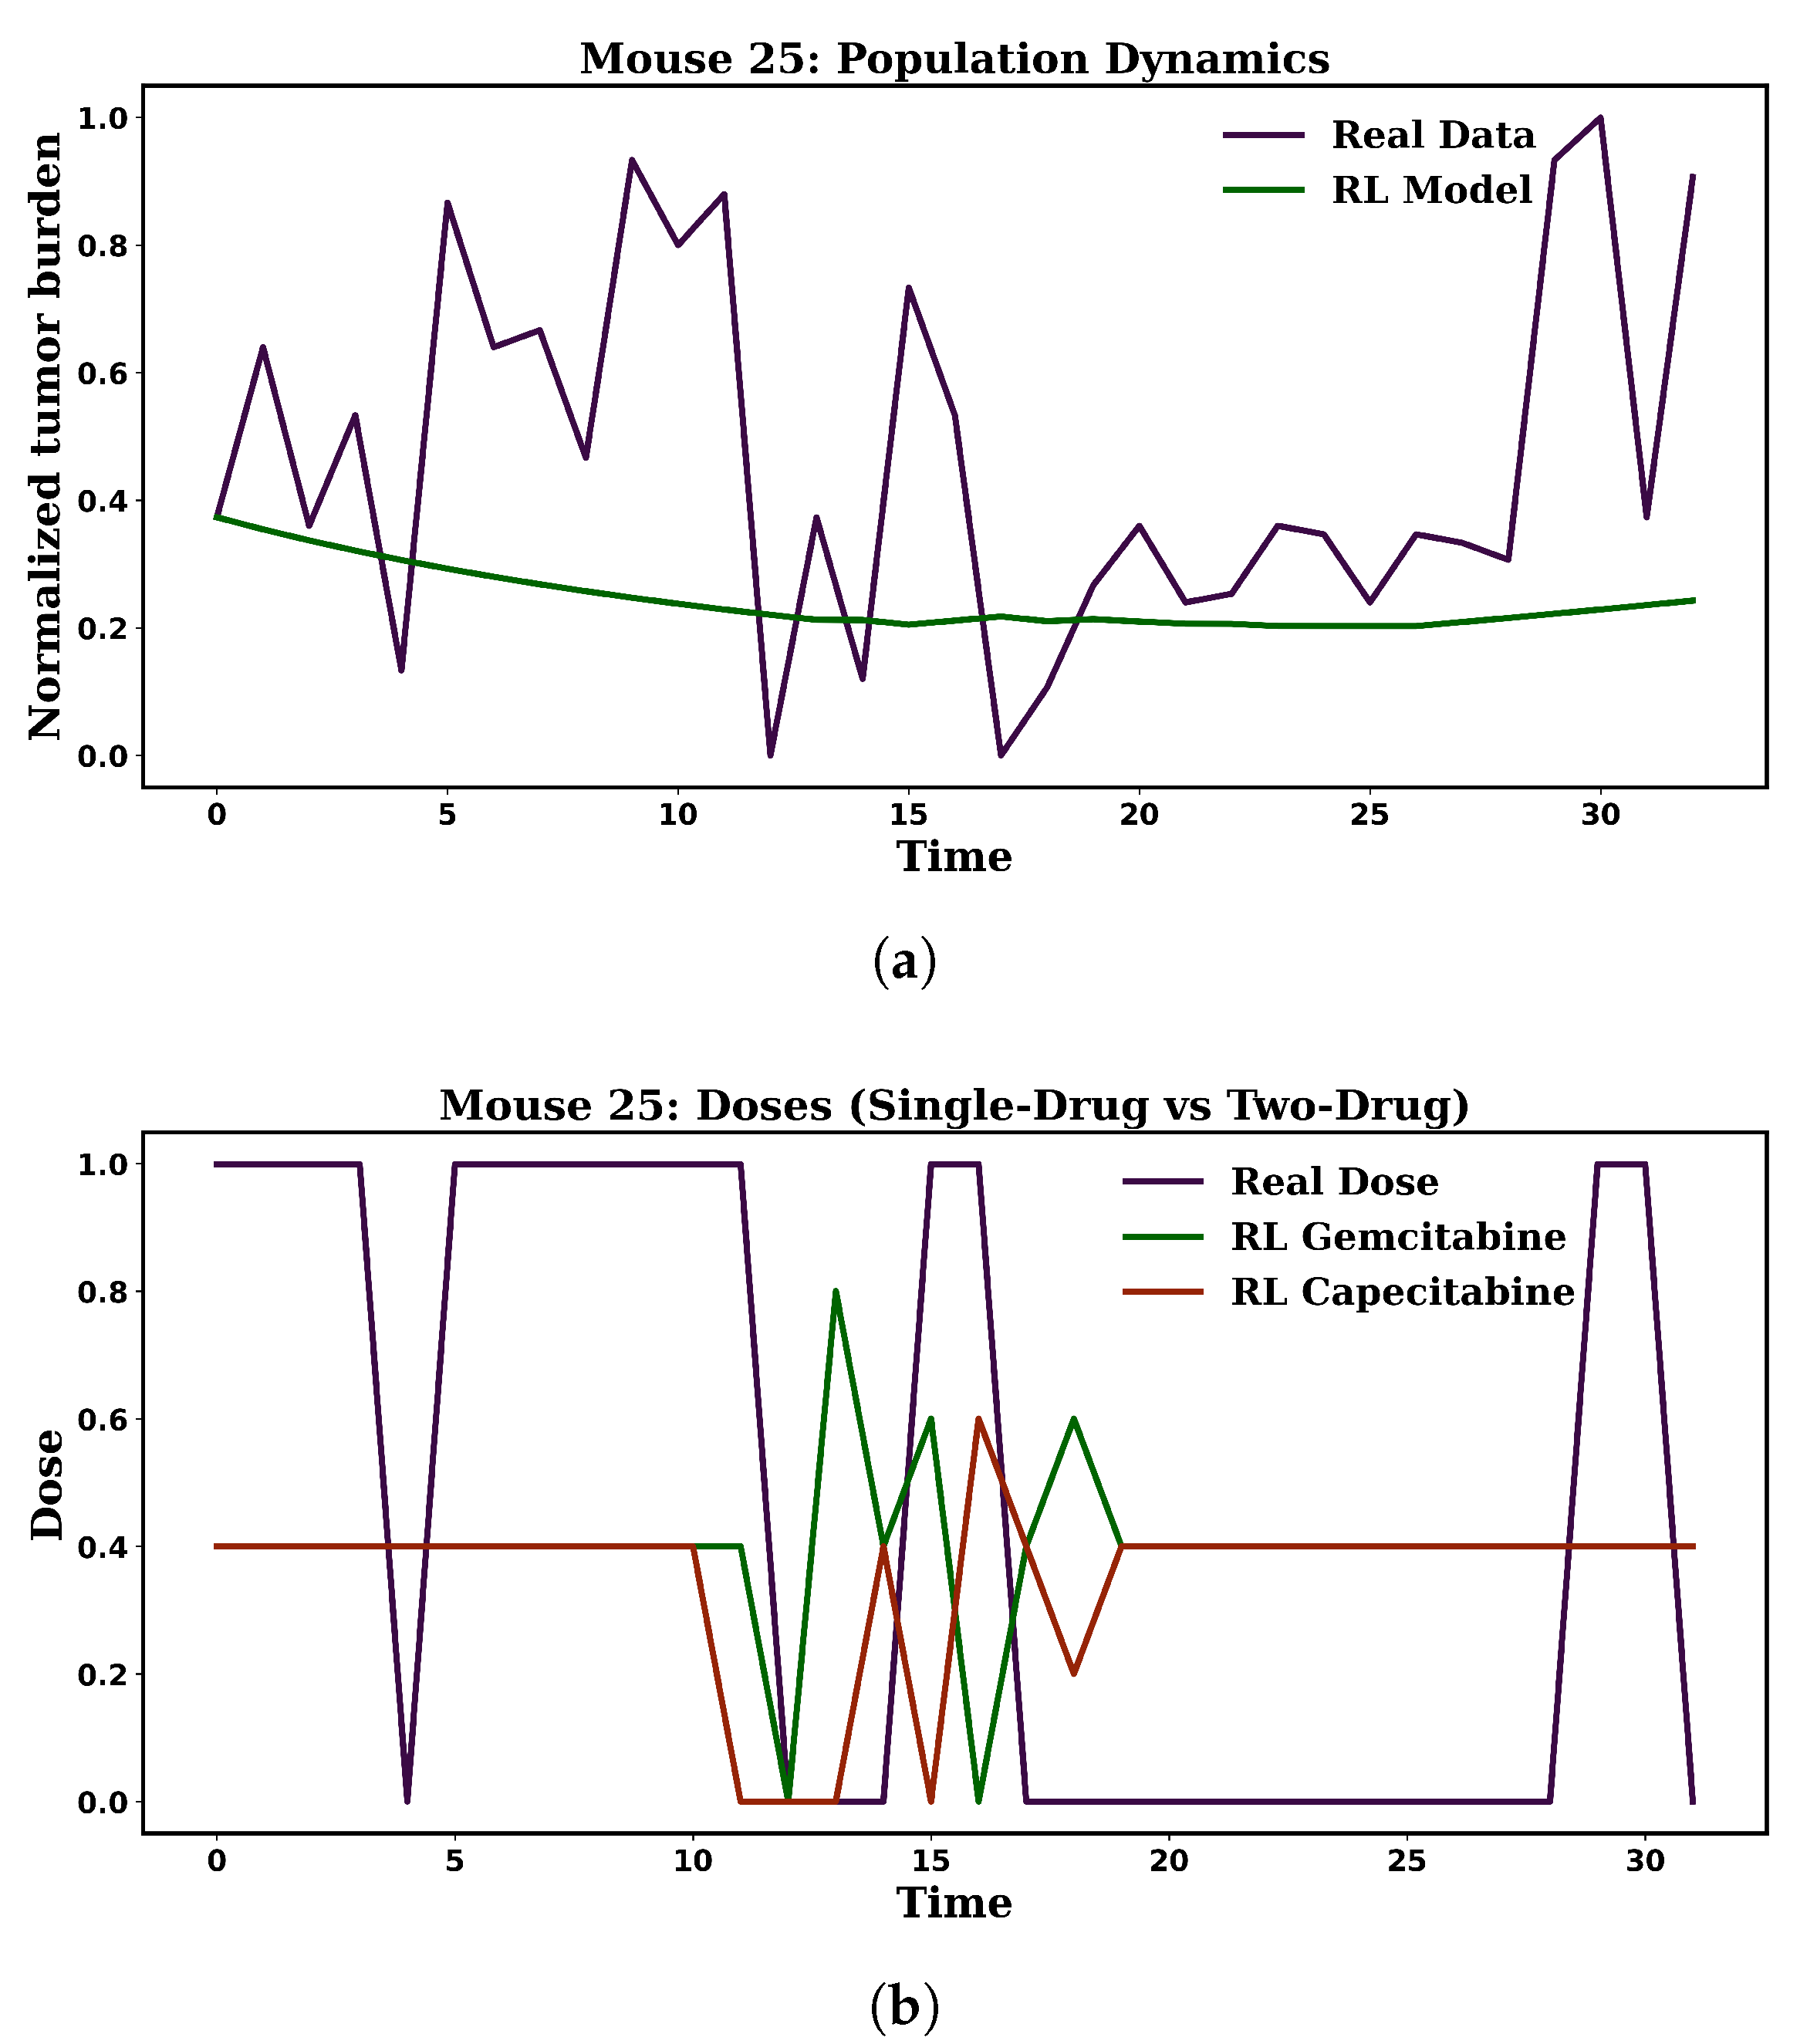
When applied to Mouse 25, the learned combination policy achieved a consistently lower tumor burden compared to the single-agent trajectory, while maintaining a smoother dosing profile and reducing reliance on high-dose pulses (Figure 9). Importantly, the total normalized dose budget was identical to that of the single-agent protocol, indicating that the observed improvement was due to dose diversification rather than escalation. This aligns with prior computational and experimental studies showing that alternating or mixing agents with distinct mechanisms can suppress resistant clones more effectively than monotherapy [42,43].
Figure 9.
Comparison of (a) population dynamics and (b) treatment dose rates for mouse 25 under intermittent adaptive therapy protocol and RL (two drugs).
These results illustrate how reinforcement learning can generalize empirical single-agent data into optimized multi-agent treatment strategies, offering a pathway toward personalized, evolution-aware cancer therapy. By explicitly modeling pharmacodynamic constraints and tumor heterogeneity, the framework can identify dosing schedules that exploit drug complementarity, potentially improving long-term disease control without increasing cumulative toxicity.
4. Discussion and Conclusions
In this study, we developed and systematically evaluated an integrative modeling framework for personalized cancer therapy that combines evolutionary game theory, tumor growth modeling, and reinforcement learning (RL). The central objective was to capture the ecological and evolutionary dynamics of heterogeneous tumor cell populations—comprising both treatment-sensitive and treatment-resistant phenotypes—and to leverage these insights for the design of adaptive, evolution-aware treatment strategies.
At the core of our approach lies an Evolutionary Stackelberg Game formulation, in which the physician is modeled as a rational leader and the tumor cell population as a responsive follower. This leader–follower structure enables the anticipation of tumor evolutionary responses to treatment, allowing the physician’s strategy to be optimized in a forward-looking manner. The tumor’s ecological dynamics were described using a fitness-generating function (G-function) that incorporates logistic growth, treatment-induced mortality, and resistance-associated fitness costs.
A key strength of this framework is the incorporation of both treatment-specific and subject-specific parameters, estimated directly from experimental data using the Python-based GEKKO optimization package. This calibration step ensures that the model reflects individual variability in tumor growth kinetics and drug response, thereby enhancing predictive accuracy. Using tumor volume data from 70 breast cancer-bearing mice treated with Capecitabine or Gemcitabine, we parameterized the model to simulate three clinically relevant protocols: MTD, Dose Modulation Adaptive Therapy, and Intermittent Adaptive Therapy.
Comparative analysis against classical tumor growth models—Exponential, Logistic, and Gompertz—highlighted the limitations of these traditional approaches. While classical models have been widely used in oncology modeling [44,45], they often fail to capture non-monotonic behaviors such as treatment-induced regressions, rebounds, and phenotypic switching, which are increasingly recognized in both preclinical and clinical settings [3,46]. In contrast, our game-theoretic model aligned more closely with experimental observations, particularly in scenarios involving adaptive or intermittent dosing, underscoring the value of explicitly modeling ecological and evolutionary feedbacks.
Our use of reinforcement learning builds on recent efforts to apply AI-driven optimization to cancer therapy [37,47]. For single-agent therapy, an RL agent trained via Q-learning learned to balance tumor regression against cumulative drug exposure and resistance suppression, as encoded in a multi-term reward function. This approach was then extended to combination therapy by incorporating two drugs—Gemcitabine and Capecitabine—into a pharmacodynamically constrained environment. The RL agent dynamically allocated doses between the two agents, achieving superior tumor control compared to single-agent protocols without exceeding the total dose budget. These results support the hypothesis proposed by Gatenby et al. [3] and further explored by West et al. [48] that dose diversification, rather than escalation, can yield more effective and biologically efficient treatment schedules.
We also examined the spatial dimension of tumor ecology by incorporating reaction-diffusion equations to model the dispersal of sensitive and resistant cells. This builds on prior work demonstrating the role of spatial heterogeneity in resistance evolution [16,29]. In our spatially explicit framework, drug-sensitive cells were conceptualized as cooperators, often exhibiting slower migration and reliance on shared resources, while resistant cells acted as defectors, characterized by higher motility and opportunistic exploitation of spatial niches.
Overall, our findings demonstrate that integrating evolutionary game theory, subject-specific parameter estimation, reinforcement learning, and spatial ecology yields a powerful framework for optimizing cancer therapy. The Evolutionary Stackelberg Game model consistently outperformed classical growth models in reproducing complex tumor dynamics and provided a principled basis for comparing treatment protocols. RL-based adaptive scheduling proved effective for both single- and multi-drug regimens, while spatial modeling illuminated the critical role of phenotypic diffusion in resistance evolution.
This work underscores the importance of explicitly accounting for ecological and evolutionary processes in treatment design. By anticipating tumor adaptation, exploiting competitive interactions between sensitive and resistant cells, and tailoring strategies to individual patient and treatment parameters, such integrative models have the potential to improve long-term tumor control, reduce cumulative toxicity, and ultimately enhance patient outcomes. Future research should focus on validating these approaches in larger, clinically diverse datasets and extending the framework to incorporate immune–tumor interactions, multi-scale modeling, and real-time treatment adaptation.
Author Contributions
F.T. conducted the theoretical modeling and drafted the manuscript. J.S.S. contributed to the mathematical analysis. D.M. and M.H.M. reviewed and edited the final version of the manuscript. All authors have read and agreed to the published version of the manuscript.
Funding
This research received no external funding.
Data Availability Statement
The data used in this study are publicly available and were obtained from the article “Testing Adaptive Therapy Protocols Using Gemcitabine and Capecitabine in a Preclinical Model of Endocrine-Resistant Breast Cancer” (Cancers 2024, 16, 257) [13]. All relevant information and datasets can be accessed through the original publication.
Conflicts of Interest
The authors declare no conflicts of interest.
References
- Crawford, S. Is it time for a new paradigm for systemic cancer treatment? Lessons from a century of cancer chemotherapy. Front. Pharmacol. 2013, 4, 68. [Google Scholar] [CrossRef] [Scilit]
- Gatenby, R.A.; Frieden, B.R. Inducing catastrophe in malignant growth. Math. Med. Biol. J. IMA 2008, 25, 267–283. [Google Scholar] [CrossRef] [Scilit]
- Gatenby, R.A.; Silva, A.S.; Gillies, R.J.; Frieden, B.R. Adaptive therapy. Cancer Res. 2009, 69, 4894–4903. [Google Scholar] [CrossRef] [Scilit]
- Belkhir, S.; Thomas, F.; Roche, B. Darwinian approaches for cancer treatment: Benefits of mathematical modeling. Cancers 2021, 13, 4448. [Google Scholar] [CrossRef] [Scilit]
- Deris, A.; Sohrabi-Haghighat, M. Analysis of cancerous tumor growth by the competitive model based on the evolutionary game theory. Int. J. Nonlinear Anal. Appl. 2023, 14, 1903–1910. [Google Scholar]
- Hajdowska, K.; Swierniak, A.; Borys, D. Modelling Changes in Genetic Heterogeneity Using Games with Resources. Comput. Methods Programs Biomed. 2025, 270, 108916. [Google Scholar] [CrossRef] [Scilit] [PubMed]
- Bayer, P.; Gatenby, R.A.; McDonald, P.H.; Duckett, D.R.; Staňková, K.; Brown, J.S. Coordination games in cancer. PLoS ONE 2022, 17, e0261578. [Google Scholar] [CrossRef] [Scilit] [PubMed]
- Tavakoli, F.; Sartakhti, J.S.; Manshaei, M.H.; Basanta, D. Cancer immunoediting: A game theoretical approach. In Silico Biol. 2020, 14, 1–12. [Google Scholar] [CrossRef] [Scilit]
- Maynard Smith, J. The theory of games and the evolution of animal conflicts. J. Theor. Biol. 1974, 47, 209–221. [Google Scholar] [CrossRef] [Scilit]
- Romano, C.; Borri, A.; Di Benedetto, M.D. Stackelberg evolutionary games for cancer modeling and treatment. In Proceedings of the 2024 IEEE 63rd Conference on Decision and Control (CDC), Milan, Italy, 16–19 December 2024; IEEE: Piscataway, NJ, USA, 2024; pp. 7044–7049. [Google Scholar]
- Salvioli, M.; Garjani, H.; Satouri, M.; Broom, M.; Viossat, Y.; Brown, J.S.; Dubbeldam, J.; Staňková, K. Stackelberg Evolutionary Games of Cancer Treatment: What Treatment Strategy to Choose if Cancer Can be Stabilized? Dyn. Games Appl. 2024, 15, 1750–1769. [Google Scholar] [CrossRef] [Scilit]
- Reed, D.R.; Metts, J.; Pressley, M.; Fridley, B.L.; Hayashi, M.; Isakoff, M.S.; Loeb, D.M.; Makanji, R.; Roberts, R.D.; Trucco, M.; et al. An evolutionary framework for treating pediatric sarcomas. Cancer 2020, 126, 2577. [Google Scholar] [CrossRef] [Scilit]
- Seyedi, S.; Teo, R.; Foster, L.; Saha, D.; Mina, L.; Northfelt, D.; Anderson, K.S.; Shibata, D.; Gatenby, R.; Cisneros, L.H.; et al. Testing adaptive therapy protocols using gemcitabine and capecitabine in a preclinical model of endocrine-resistant breast cancer. Cancers 2024, 16, 257. [Google Scholar] [CrossRef] [Scilit]
- Stein, J.; Salvioli, M.; Garjani, H.; Dubbeldam, J.; Viossat, Y.; Brown, J.S.; Staňková, K. Stackelberg evolutionary game theory: How to manage evolving systems. Philos. Trans. R. Soc. B 2023, 378, 20210495. [Google Scholar] [CrossRef] [Scilit]
- Pressley, M.; Salvioli, M.; Lewis, D.B.; Richards, C.L.; Brown, J.S.; Staňková, K. Evolutionary dynamics of treatment-induced resistance in cancer informs understanding of rapid evolution in natural systems. Front. Ecol. Evol. 2021, 9, 681121. [Google Scholar] [CrossRef] [Scilit]
- Gluzman, M.; Scott, J.G.; Vladimirsky, A. Optimizing adaptive cancer therapy: Dynamic programming and evolutionary game theory. Proc. R. Soc. B 2020, 287, 20192454. [Google Scholar] [CrossRef] [Scilit]
- Zhang, J.; Cunningham, J.J.; Brown, J.S.; Gatenby, R.A. Integrating evolutionary dynamics into treatment of metastatic castrate-resistant prostate cancer. Nat. Commun. 2017, 8, 1816. [Google Scholar] [CrossRef] [Scilit]
- Fu, F.; Nowak, M.A.; Bonhoeffer, S. Spatial heterogeneity in drug concentrations can facilitate the emergence of resistance to cancer therapy. PLoS Comput. Biol. 2015, 11, e1004142. [Google Scholar] [CrossRef] [Scilit]
- Martinez, V.A.; Laleh, N.; Salvioli, M.; Thuijsman, F.; Brown, J.; Cavill, R.; Kather, J.; Staňková, K. Improving mathematical models of cancer by including resistance to therapy: A study in non-small cell lung cancer. bioRxiv 2021. [Google Scholar] [CrossRef] [Scilit]
- Ghaffari Laleh, N.; Lo, W.; Tran, H.; Frieboes, H.B.; Cristini, V.; Lowengrub, J.S.; Enderling, H.; Scott, J.G. Classical mathematical models for prediction of response to chemotherapy and immunotherapy. PLoS Comput. Biol. 2022, 18, e1009822. [Google Scholar] [CrossRef] [Scilit]
- Benzekry, S.; Lamont, C.; Beheshti, A.; Tracz, A.; Ebos, J.M.L.; Hlatky, L.; Hahnfeldt, P. Classical mathematical models for description and prediction of experimental tumor growth. PLoS Comput. Biol. 2014, 10, e1003800. [Google Scholar] [CrossRef] [Scilit]
- Beal, L.D.; Hill, D.J.; Martin, R.; Hedengren, J.D. GEKKO optimization suite. Processes 2018, 6, 106. [Google Scholar] [CrossRef] [Scilit]
- Tian, H.; Guo, Y.; Wang, X. Algorithm of Stackelberg game with multiple leaders followers based on evolutionary game theory. J. Syst. Eng. 2005, 20, 303. [Google Scholar]
- Salvioli, M.; Dubbeldam, J.; Staňková, K.; Brown, J.S. Fisheries management as a Stackelberg Evolutionary Game: Finding an evolutionarily enlightened strategy. PLoS ONE 2021, 16, e0245255. [Google Scholar] [CrossRef] [Scilit]
- Romano, C.; Di Benedetto, M.D.; Borri, A. Stackelberg Evolutionary Games With Modulated Leadership: A Three-Agent Framework for Tumor Immune Dynamics. IEEE Control. Syst. Lett. 2025, 9, 468–473. [Google Scholar] [CrossRef] [Scilit]
- Gatenby, R.A.; Vincent, T.L. An evolutionary model of carcinogenesis. Cancer Res. 2003, 63, 6212–6220. [Google Scholar]
- Basanta, D.; Hatzikirou, H.; Deutsch, A. Studying the emergence of invasiveness in tumours using game theory. Eur. Phys. J. B 2008, 63, 393–397. [Google Scholar] [CrossRef] [Scilit]
- Archetti, M. Evolutionary dynamics of the Warburg effect: Glycolysis as a collective action problem among cancer cells. J. Theor. Biol. 2014, 341, 1–8. [Google Scholar] [CrossRef] [Scilit]
- Kaznatcheev, A.; Peacock, J.; Basanta, D.; Marusyk, A.; Scott, J.G. Fibroblasts and alectinib switch the evolutionary games played by non-small cell lung cancer. Nat. Ecol. Evol. 2019, 3, 450–456. [Google Scholar] [CrossRef] [Scilit]
- Romano, C.; Di Benedetto, M.D.; Borri, A. Evolution-Informed Modeling and Control of Tumor Growth. IEEE Trans. Autom. Sci. Eng. 2025, early access. [Google Scholar] [CrossRef] [Scilit]
- Marusyk, A.; Almendro, V.; Polyak, K. Intratumor heterogeneity: A looking glass for cancer. Nat. Rev. Cancer 2012, 12, 323–334. [Google Scholar] [CrossRef] [Scilit]
- Gatenby, R.A.; Gillies, R.J. A microenvironmental model of carcinogenesis. Nat. Rev. Cancer 2008, 8, 56–61. [Google Scholar] [CrossRef] [Scilit]
- Sartakhti, J.S.; Manshaei, M.H.; Sadeghi, M. MMP–TIMP interactions in cancer invasion: An evolutionary game-theoretical framework. J. Theor. Biol. 2017, 412, 17–26. [Google Scholar] [CrossRef] [Scilit]
- Zeltz, C.; Primac, I.; Erusappan, P.; Alam, J.; Noel, A.; Gullberg, D. Cancer-associated fibroblasts in desmoplastic tumors: Emerging role of integrins. In Seminars in Cancer Biology; Elsevier: Amsterdam, The Netherlands, 2020; Volume 62, pp. 166–181. [Google Scholar]
- Sartakhti, J.S.; Manshaei, M.H.; Archetti, M. Game theory of tumor–stroma interactions in multiple myeloma: Effect of nonlinear benefits. Games 2018, 9, 32. [Google Scholar] [CrossRef] [Scilit]
- Gatenby, R.A.; Brown, J.S.; Vincent, T.L. The evolution and ecology of resistance in cancer therapy. Cold Spring Harb. Perspect. Med. 2020, 10, a040972. [Google Scholar] [CrossRef] [Scilit]
- Yang, C.-Y.; Shiranthika, C.; Wang, C.-Y.; Chen, K.-W.; Sumathipala, S. Reinforcement learning strategies in cancer chemotherapy treatments: A review. Comput. Methods Programs Biomed. 2023, 229, 107280. [Google Scholar] [CrossRef] [Scilit] [PubMed]
- Al-Lazikani, B.; Banerji, U.; Workman, P. Combination cancer therapy: A road map toward the next generation. Nat. Rev. Cancer 2017, 17, 293–299. [Google Scholar]
- Greco, F.; Vicent, M.J. Combination strategies for cancer therapy: The next generation. Ther. Deliv. 2015, 6, 165–181. [Google Scholar]
- Herrmann, R.; Bodoky, G.; Ruhstaller, T.; Glimelius, B.; Bajetta, E.; Schüller, J.; Saletti, P.; Bauer, J.; Figer, A.; Pestalozzi, B.; et al. Gemcitabine plus capecitabine compared with gemcitabine alone in advanced pancreatic cancer: A randomized, multicenter, phase III trial of the Swiss Group for Clinical Cancer Research (SAKK) and the Central European Cooperative Oncology Group (CECOG). J. Clin. Oncol. 2007, 25, 2212–2217. [Google Scholar] [CrossRef] [Scilit]
- Scheithauer, W.; Schüller, J.; Ulrich-Pur, H.; Schmid, K.; Raderer, M.; Haider, K.; Kwasny, W.; Depisch, D.; Schneeweiss, B.; Lang, F.; et al. Randomised multicentre phase II trial of two different schedules of capecitabine plus gemcitabine in advanced pancreatic cancer. Br. J. Cancer 2003, 89, 597–602. [Google Scholar]
- Geng, Z.; Wang, Y.; Wang, Z.; Wang, Y. Adaptive chemotherapy scheduling via reinforcement learning. IEEE Trans. Biomed. Eng. 2020, 67, 1430–1441. [Google Scholar]
- Komorowski, M.; Celi, L.A.; Badawi, O.; Gordon, A.C.; Faisal, A.A. Reinforcement learning for optimal control of cancer treatment. PLoS Comput. Biol. 2018, 14, e1005964. [Google Scholar]
- Simeoni, M.; Magni, P.; Cammia, C.; De Nicolao, G.; Croci, V.; Pesenti, E.; Germani, M.; Poggesi, I. Predictive pharmacokinetic-pharmacodynamic modeling of tumor growth kinetics in xenograft models after administration of anticancer agents. Cancer Res. 2004, 64, 1094–1101. [Google Scholar] [CrossRef] [Scilit]
- Gerlowski, L.E.; Jain, R.K. Microvascular permeability of normal and neoplastic tissues. Microvasc. Res. 1986, 31, 288–305. [Google Scholar] [CrossRef] [Scilit]
- Enriquez-Navas, P.M.; Kam, Y.; Das, S.; Hassan, S.; Silva, A.S.; Foroutan, P.; Ruiz, E.; Martinez, G.; Minton, S.; Gillies, R.J.; et al. Exploiting evolutionary principles to prolong tumor control in preclinical models of breast cancer. Sci. Transl. Med. 2016, 8, 327ra24. [Google Scholar] [CrossRef] [Scilit] [PubMed]
- Zhao, Y.; Wang, Z.; Li, Y.; Zhang, J. Reinforcement learning for personalized cancer treatment. PLoS Comput. Biol. 2020, 16, e1008322. [Google Scholar] [CrossRef] [Scilit]
- West, J.; You, L.; Zhang, J.; Gatenby, R.A.; Brown, J.S.; Newton, P.K. Towards multidrug adaptive therapy. Cancer Res. 2020, 80, 1578–1589. [Google Scholar] [CrossRef] [Scilit]

Disclaimer/Publisher’s Note: The statements, opinions and data contained in all publications are solely those of the individual author(s) and contributor(s) and not of MDPI and/or the editor(s). MDPI and/or the editor(s) disclaim responsibility for any injury to people or property resulting from any ideas, methods, instructions or products referred to in the content. |
© 2025 by the authors. Licensee MDPI, Basel, Switzerland. This article is an open access article distributed under the terms and conditions of the Creative Commons Attribution (CC BY) license (https://creativecommons.org/licenses/by/4.0/).