


Abstract
Xueshan Jinluohan Pain-Relief Liniment (XJPL) is a Tibetan topical compound preparation composed of 11 medicinal materials. Its current quality standard relies mainly on thin-layer chromatographic identification, which is insufficient to comprehensively characterize its complex chemical composition, marker constituents from key medicinal materials, and batch-to-batch quality consistency. In this study, 17 batches of XJPL were analyzed by ultra-performance liquid chromatography coupled with quadrupole-Exactive Orbitrap high-resolution mass spectrometry (UPLC-Q-Exactive Orbitrap MS) for systematic chemical profiling. An integrated quality evaluation method was further developed by combining high-performance liquid chromatography (HPLC) fingerprinting, similarity evaluation, chemometric analysis, and multicomponent quantification. A total of 139 chemical constituents were confirmed by reference standards or putatively characterized, including alkaloids, flavonoids, phenolics, terpenoids, organic acids, lactones, and other compounds, indicating the coexistence of multiple medicinal-material-derived and structurally diverse constituents in XJPL. The HPLC fingerprint established for the 17 batches contained 23 common peaks, among which 10 representative constituents were assigned, and similarity evaluation indicated a high degree of overall chemical consistency among batches. Hierarchical cluster analysis (HCA), principal component analysis (PCA), and orthogonal partial least squares-discriminant analysis (OPLS-DA) further revealed batch-related differences and suggested that common peaks corresponding to gentiopicroside, loganic acid, and related constituents contributed substantially to sample differentiation. On this basis, quantitative methods were established for representative constituents covering phenolic acids, iridoid glycosides, carotenoid glycosides, and Corydalis-derived alkaloids. Overall, this study improves the quality evaluation framework for XJPL by integrating chemical profiling, holistic fingerprint assessment, batch-difference characterization, and multicomponent quantitative control, providing experimental support for quality standard improvement and manufacturing quality control.
1. Introduction
Tibetan compound preparations are complex systems formulated from multiple medicinal materials under the guidance of Tibetan medical theory. Their chemical basis typically consists of constituents with diverse polarities, structural classes, and botanical or zoological origins. Unlike single-component chemical drugs, the quality attributes of compound preparations are not determined by one marker compound alone, but by the integrated profile of multiple constituent classes, their relative abundance, and batch-to-batch stability [1,2]. This is particularly relevant for topical compound preparations, in which the botanical origin, production region, harvest season, processing procedure, extraction conditions, and manufacturing process may all alter the final chemical profile. Therefore, establishing a quality evaluation system that integrates holistic chemical characterization, identification of marker constituents from key medicinal materials, batch consistency assessment, and quantitative control of representative constituents is essential for modernizing the quality standards of Tibetan compound preparations [3,4,5,6].
Xueshan Jinluohan Pain-Relief Liniment (XJPL) is a widely used Tibetan topical compound preparation composed of 11 medicinal materials, including Aconitum pendulum Busch, Corydalis yanhusuo W.T. Wang, Saussurea involucrata (Kar. et Kir.) Sch. Bip., Trogopterorum faeces, Ligusticum chuanxiong Hort., Rhodiola crenulata (Hook. f. et Thomson) H. Ohba, Gentiana macrophylla Pall., Prunus persica (L.) Batsch, Crocus sativus L., artificial musk, and borneol. It is traditionally used to promote blood circulation, remove blood stasis, reduce swelling, and relieve pain. XJPL was included in the 1995 edition of the Drug Standards of the Ministry of Public Health of the People’s Republic of China: Tibetan Medicines (Volume I). However, the current standard mainly relies on thin-layer chromatographic identification of borneol, L. chuanxiong, R. crenulata, and several other medicinal materials, and lacks systematic fingerprint evaluation and multicomponent quantitative assays [7]. Although previous studies have reported HPLC methods for determining a small number of constituents in XJPL, such as gentiopicroside, crocin I, or tetrahydropalmatine, these single-marker or limited-marker methods cannot comprehensively reflect the overall chemical composition of this 11-component formula and are insufficient for elucidating the chemical sources of quality variation among production batches [8,9].
From the perspective of prescription composition, A. pendulum and C. yanhusuo may contribute diterpenoid alkaloids and benzylisoquinoline alkaloids, respectively; G. macrophylla provides iridoid glycosides; R. crenulata, S. involucrata, and Trogopterorum faeces contain phenolic and flavonoid constituents; C. sativus is characterized by crocin-type carotenoid glycosides; and phthalides from L. chuanxiong are also useful for medicinal-material recognition. Because these constituents differ markedly in structural type and physicochemical properties, they cannot be adequately characterized using a single detection wavelength, a single marker compound, or conventional thin-layer identification alone. It is therefore necessary to first clarify the overall chemical composition of XJPL using high-resolution mass spectrometry, then establish a chromatographic fingerprinting method for batch consistency evaluation, apply chemometric tools to screen the main variables responsible for batch differences, and finally develop multicomponent quantitative assays to generate practical quality control parameters [10,11].
Ultra-performance liquid chromatography coupled with quadrupole-Exactive Orbitrap high-resolution mass spectrometry (UPLC-Q-Exactive Orbitrap MS) offers high resolution, high mass accuracy, and strong MS/MS-based structural elucidation capability, making it suitable for the rapid identification and tentative characterization of diverse constituents in complex compound preparations [10]. HPLC fingerprinting can reflect the overall chemical profile of a preparation through a system of common peaks [3,4]. Chemometric methods, including hierarchical cluster analysis (HCA), principal component analysis (PCA), and orthogonal partial least squares-discriminant analysis (OPLS-DA), can further identify batch-related differences and potential quality marker peaks [2,11]. Multicomponent quantification provides quantitative support for quality standard improvement and manufacturing process control [12]. Accordingly, this study used 17 batches of XJPL to establish an integrated quality evaluation method combining UPLC-Q-Exactive Orbitrap MS-based chemical profiling, HPLC fingerprinting, chemometric analysis, and multicomponent quantification. The aim was to improve the quality evaluation framework for XJPL from the perspectives of holistic chemical characterization, batch consistency assessment, and quantitative control of key constituents, and to provide a reference for upgrading the quality standards of Tibetan topical compound preparations.
2. Results and Discussion
2.1. UPLC-Q-Exactive Orbitrap MS-Based Chemical Profiling of XJPL
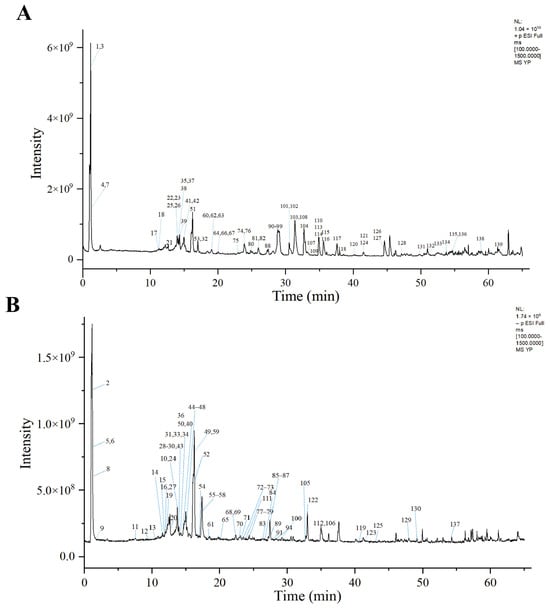
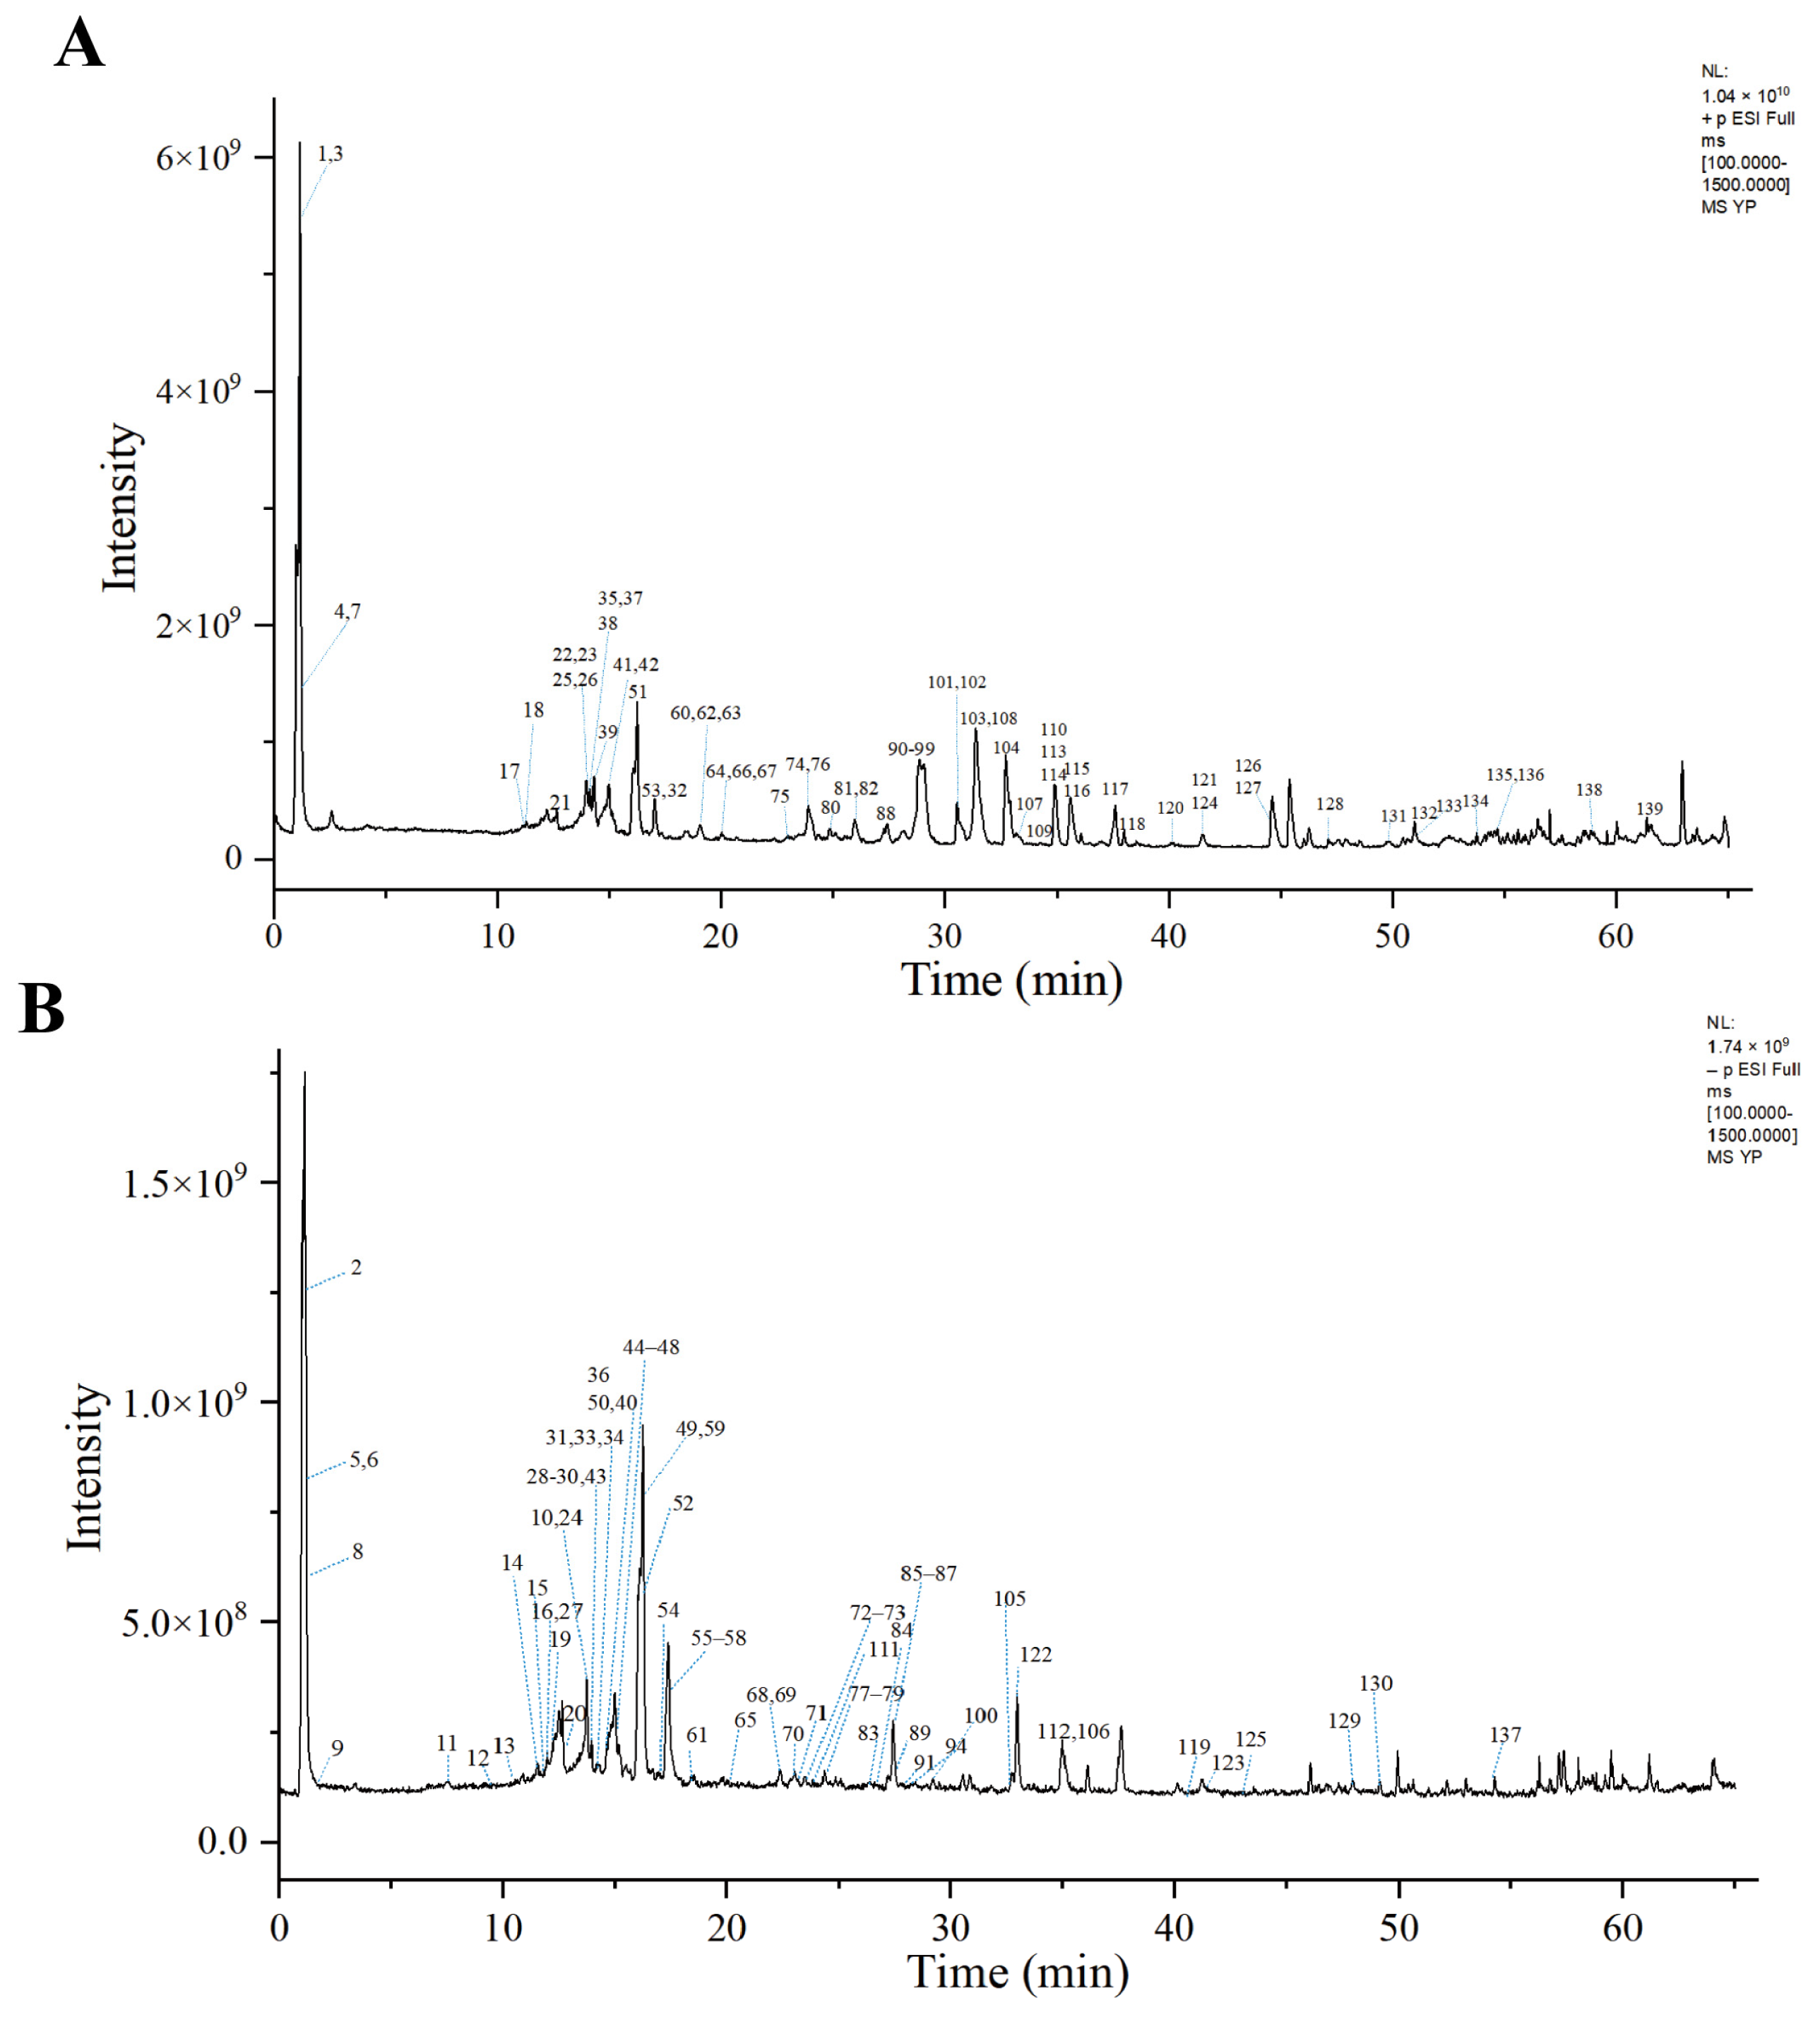
To systematically characterize the overall chemical composition of XJPL, its 70% ethanol extract was analyzed by UPLC-Q-Exactive Orbitrap MS. Data were acquired in both positive and negative ion modes, and base peak ion chromatograms (BPIs) were obtained (Figure 1). By integrating accurate mass measurements, isotopic patterns, MS/MS fragmentation, comparison with reference standards, an in-house database of constituents reported from the prescribed medicinal materials, and relevant literature, a total of 139 chemical constituents were confirmed by reference standards or putatively characterized (Table 1) [13].
Figure 1.
BPIs of the 70% ethanol extract of XJPL obtained by UPLC-Q-Exactive Orbitrap MS. (A) Positive ion mode; (B) negative ion mode. Peak numbers correspond to the compounds listed in Table 1.
Table 1.
Chemical constituents identified or tentatively identified in XJPL by UPLC-Q-Exactive Orbitrap MS.
According to structural classification, the 139 constituents were grouped into eight categories, including 50 alkaloids, 32 flavonoids, 31 phenolics, 12 terpenoids, 6 organic acids, 5 lactones, 2 cyanogenic glycosides, and 1 other compound (Table 1 and Figures S1–S4). Among them, alkaloids represented the largest group and were mainly derived from A. pendulum and C. yanhusuo. Flavonoids and phenolics were primarily associated with R. crenulata, S. involucrata, Trogopterorum faeces, P. persica, and C. sativus. The terpenoids included characteristic constituents related to G. macrophylla and C. sativus, such as loganic acid, gentiopicroside, crocin I, and crocin II. The lactones were mainly associated with L. chuanxiong (Figures S5–S12). These results demonstrate the complex chemical features of XJPL, characterized by the coexistence of multiple medicinal-material-derived and structurally diverse constituents, and indicate that a single marker compound is insufficient to comprehensively represent its intrinsic quality.
In positive ion mode, alkaloids showed strong ion responses. Aconitine, for example, produced a protonated molecular ion at m/z 646.3204 [M+H]+, and its MS/MS spectrum displayed fragment ions at m/z 586.2994, 554.2730, 526.2792, and 494.2518, suggesting sequential losses of acetic acid, methanol, and additional neutral fragments. This fragmentation pattern is consistent with the typical behavior of diterpenoid alkaloids (Figure S5) [14]. Tetrahydropalmatine and corydaline generated [M+H]+ ions at m/z 356.1850 and 370.2012, respectively, and both produced characteristic fragment ions at m/z 192, 177, and 165 in their MS/MS spectra, consistent with the fragmentation pattern of benzylisoquinoline alkaloid skeletons (Figure S6) [15]. In addition, senkyunolide A showed a fragment ion at m/z 175.1115 in the MS/MS spectrum, which was assigned to the loss of one H2O molecule from the precursor ion. Subsequent losses of CO and C3H6 generated fragment ions at m/z 147.1166 and 105.0701, respectively (Figure S7) [16].
In negative ion mode, phenolic acids, flavonoids, and iridoid glycosides exhibited favorable ion responses. Chlorogenic acid produced a deprotonated ion at m/z 353.0870 [M−H]− and further generated fragment ions at m/z 179.0347 and 191.0559 (Figure S8) [17]. Salidroside yielded an ion at m/z 299.1142 [M−H]−, and its MS/MS spectrum contained a fragment ion at m/z 137.0602, corresponding to the loss of one glucose moiety from the precursor ion; subsequent losses of one and two H2O molecules generated fragment ions at m/z 119.0494 and 101.0236, respectively (Figure S9) [18]. Loganic acid produced an ion at m/z 375.1302 [M−H]−, with fragment ions at m/z 213.0768, 169.0867, and 151.0760, indicating cleavage of the glycosidic bond and fragmentation of the iridoid skeleton (Figure S10) [19]. Catechin was detected as the deprotonated ion at m/z 289.0723 [M−H]− and generated characteristic fragment ions at m/z 205.0505, 179.0349, and 125.0236 (Figure S11) [20]. Crocin I and crocin II produced [M−H]− ions at m/z 975.3739 and 813.3206, respectively, and both showed diagnostic fragment ions at m/z 651 and 327 associated with the crocetin skeleton, consistent with the fragmentation behavior of crocin-type constituents (Figure S12) [21].
Overall, UPLC-Q-Exactive Orbitrap MS analysis clarified the compositional features of multiple classes of chemical constituents in XJPL and provided a basis for subsequent common-peak assignment in HPLC fingerprinting and multicomponent quantification. In particular, gallic acid, loganic acid, chlorogenic acid, gentiopicroside, ferulic acid, crocin I, crocin II, tetrahydropalmatine, and corydaline have defined medicinal-material origins and cover different structural classes, making them suitable representative marker constituents for the subsequent quality evaluation system.
2.2. Methodological Validation of the HPLC Fingerprint Method
To obtain a stable HPLC fingerprint with satisfactory chromatographic resolution, sample preparation conditions were optimized using the peak responses of seven representative constituents, including gallic acid, loganic acid, chlorogenic acid, gentiopicroside, ferulic acid, crocin I, and crocin II, together with the overall chromatographic separation, as evaluation criteria. The effects of extraction solvent, solvent volume, and extraction time on the responses of the target constituents were compared. The results showed that extraction with 10 mL of 70% ethanol by ultrasonication for 30 min produced relatively high responses for the seven representative constituents and good peak shapes; therefore, these conditions were selected for preparing sample solutions for HPLC fingerprint analysis (Tables S1–S3). To ensure the reliability of the HPLC fingerprint for batch-to-batch quality evaluation of XJPL, the method was further evaluated for specificity, precision, stability, and repeatability after the sample preparation and chromatographic conditions had been established.
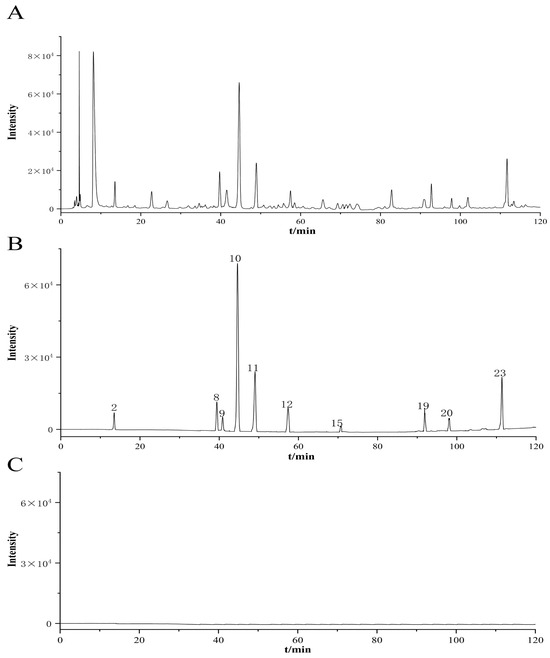
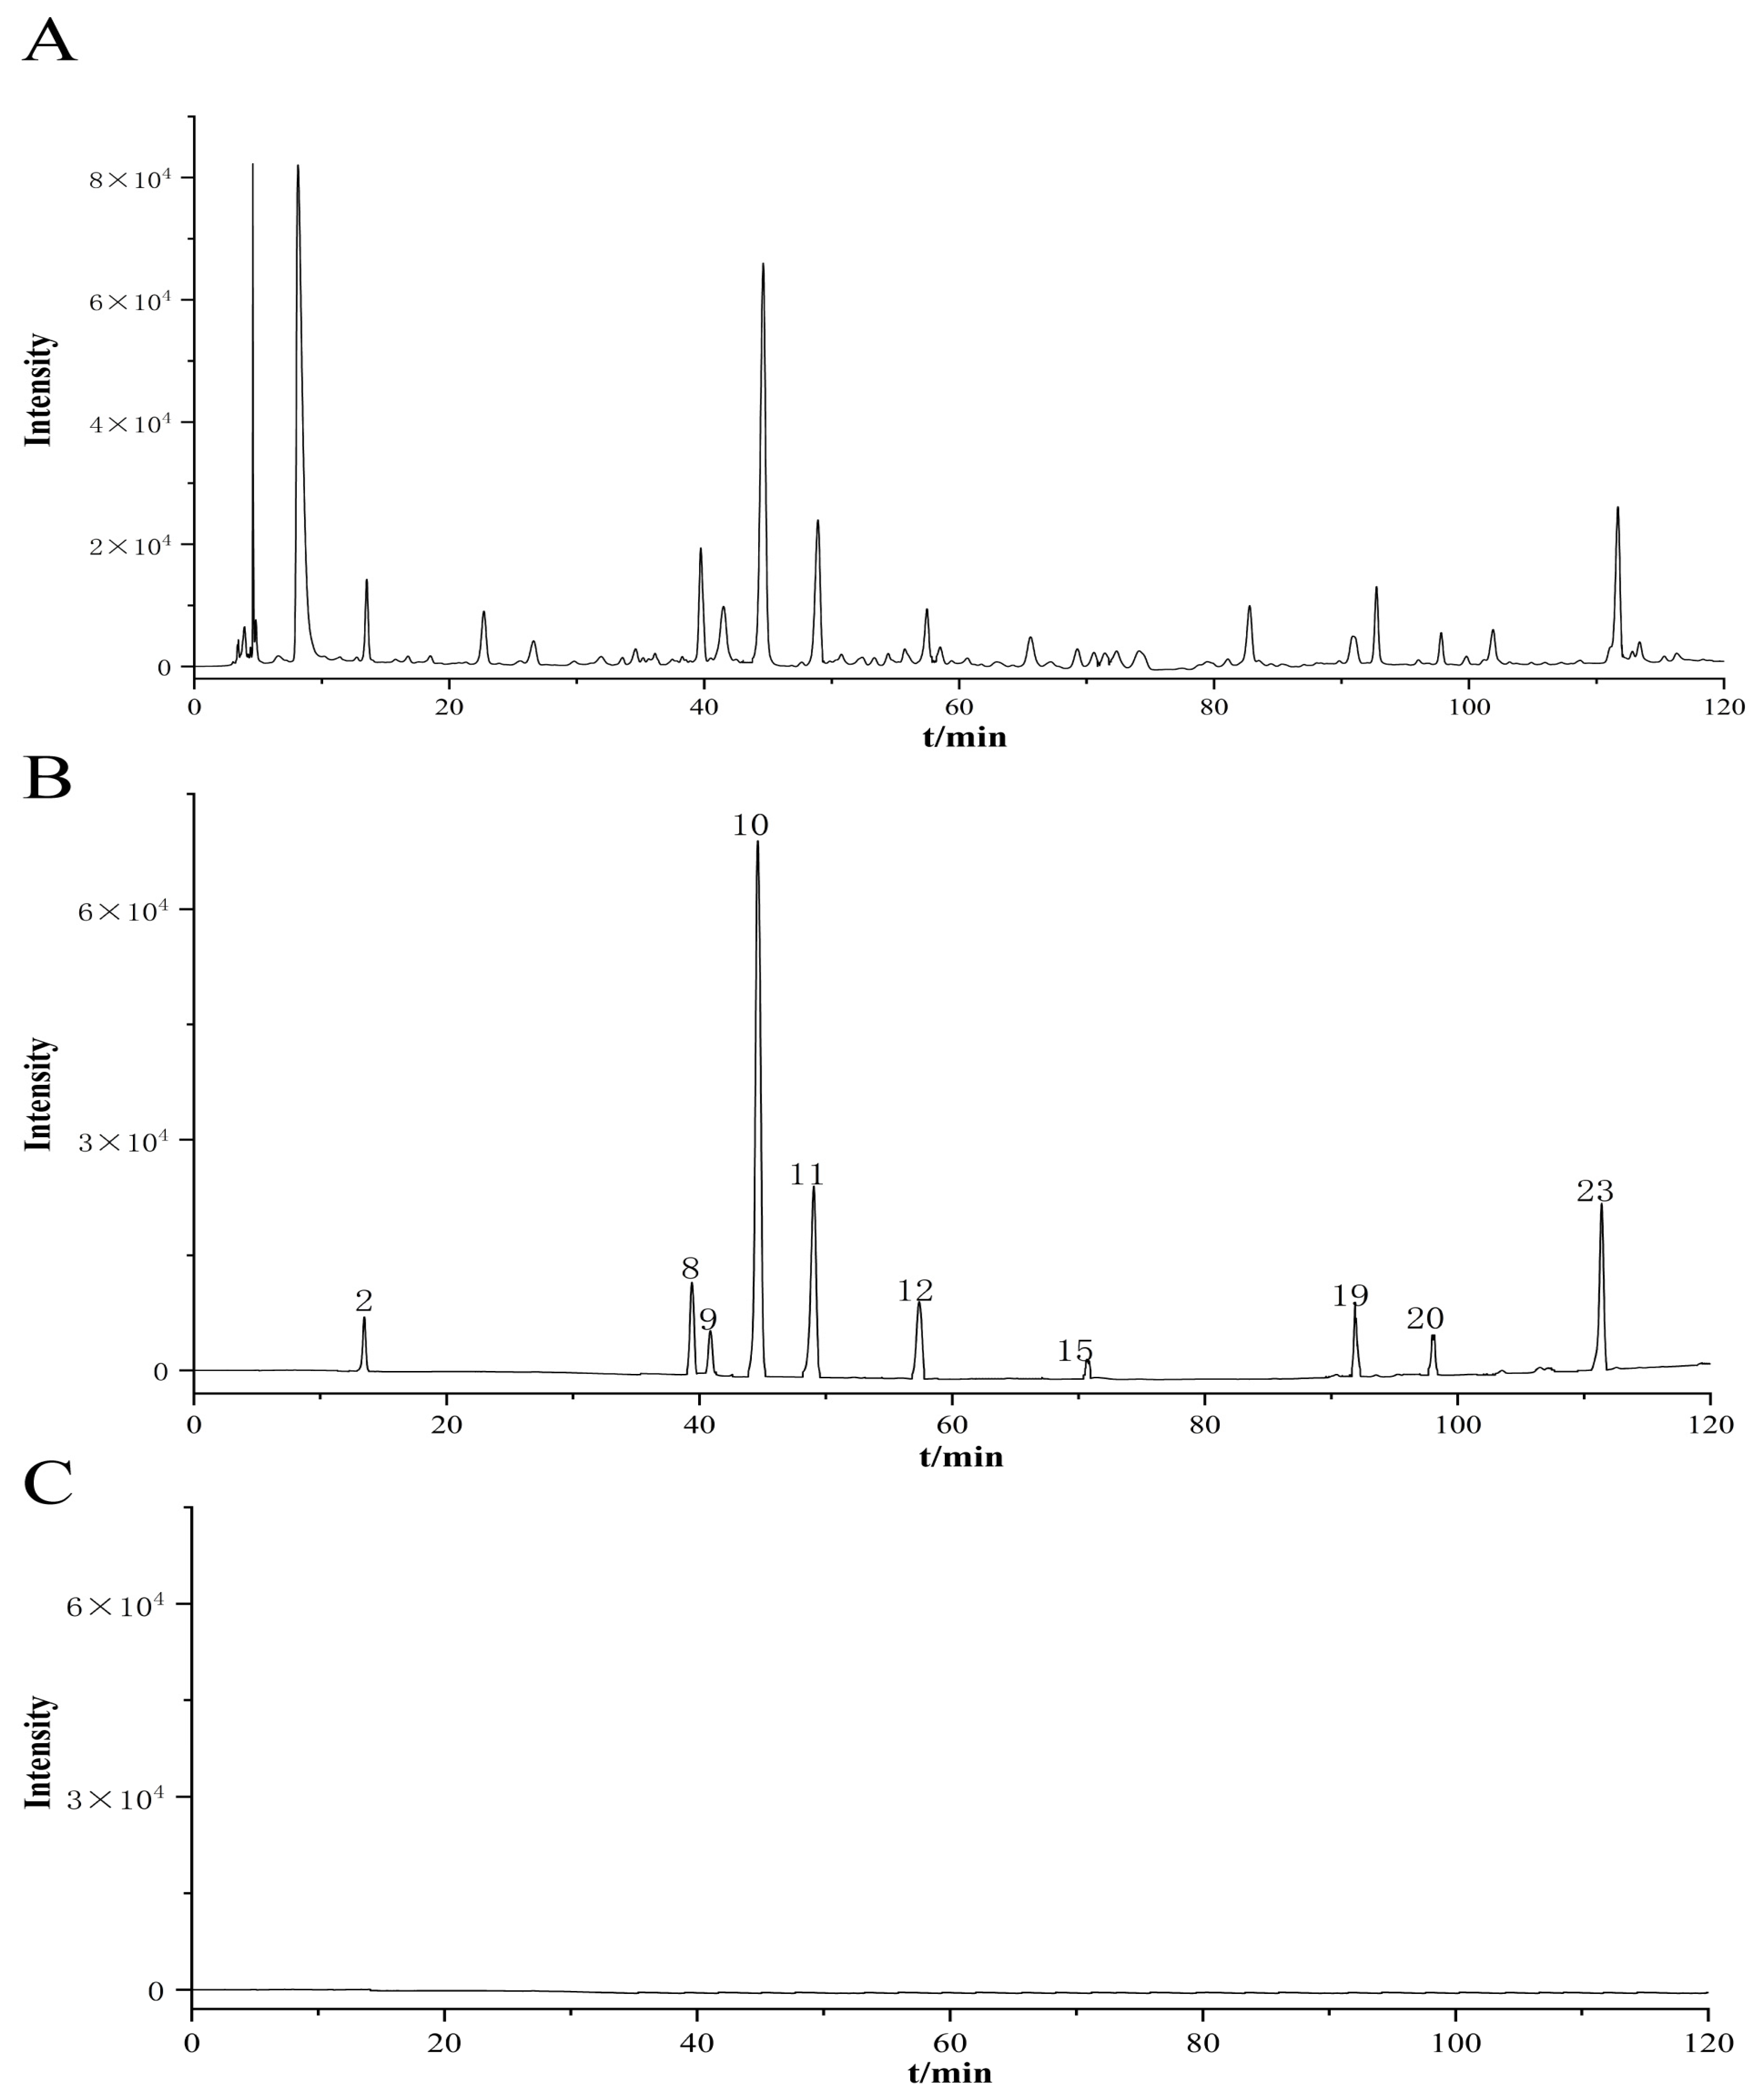
In the specificity test, blank solvent, mixed reference standard solution, and an XJPL sample solution (S12) were injected separately. The results showed no obvious interference from the blank solvent at the retention times of the target peaks. The major chromatographic peaks in the sample solution were consistent with the corresponding peaks in the mixed reference standard solution in terms of retention time, and the peaks showed good shape and resolution. Based on comparison with reference standards, 10 constituents were assigned in the sample chromatogram, namely gallic acid (2), loganic acid (8), chlorogenic acid (9), gentiopicroside (10), picrocrocin (11), ferulic acid (12), luteolin (15), crocin I (19), crocin II (20), and ligustilide (23). Because peak 10, corresponding to gentiopicroside, had a relatively large peak area, good resolution, and an intermediate retention time, it was selected as the reference peak for calculating the relative retention times and relative peak areas of the common peaks (Figure 2A–C).
Figure 2.
HPLC fingerprint establishment and similarity evaluation of XJPL. (A) Chromatogram of the XJPL sample solution; (B) chromatogram of the mixed reference standard solution; (C) chromatogram of the blank solvent. Peak assignments: 2, gallic acid; 8, loganic acid; 9, chlorogenic acid; 10, gentiopicroside; 11, picrocrocin; 12, ferulic acid; 15, luteolin; 19, crocin I; 20, crocin II; 23, ligustilide.
In the precision test, the sample solution prepared from one batch of XJPL (S17) was injected six consecutive times. Using the gentiopicroside peak as the reference peak, the relative retention times and relative peak areas of the 23 common peaks were calculated. The relative standard deviations (RSDs) of the relative retention times and relative peak areas were 0.0000–0.8319% and 0.0000–2.9400%, respectively, both below 3.00%, indicating good injection precision and chromatographic system precision (Table S4). In the stability test, the same XJPL sample solution (S17) was analyzed after storage at room temperature for 0, 2, 4, 8, 12, and 24 h. The RSDs of the relative retention times and relative peak areas of the common peaks were 0.0000–1.6139% and 0.0000–2.9191%, respectively, both below 3.00%. These results indicate that the sample solution remained stable within 24 h and was suitable for fingerprint analysis (Table S5). In the repeatability test, six sample solutions were prepared in parallel from the same batch of XJPL (S17) and analyzed separately. The RSDs of the relative retention times and relative peak areas of the common peaks were 0.0000–0.9355% and 0.0000–2.9766%, respectively, both below 3.00%, demonstrating good repeatability of sample preparation and chromatographic determination (Table S6).
Overall, the validation results showed that the established HPLC fingerprint method had good specificity, precision, stability, and repeatability, and could consistently reflect the overall chromatographic characteristics of the major mediuM− and high-polarity constituents in XJPL. Therefore, this method was suitable for subsequent fingerprint establishment, common peak matching, and batch-to-batch consistency evaluation of the 17 batches of XJPL.
2.3. Establishment of the HPLC Fingerprint and Similarity Evaluation of 17 Batches of XJPL
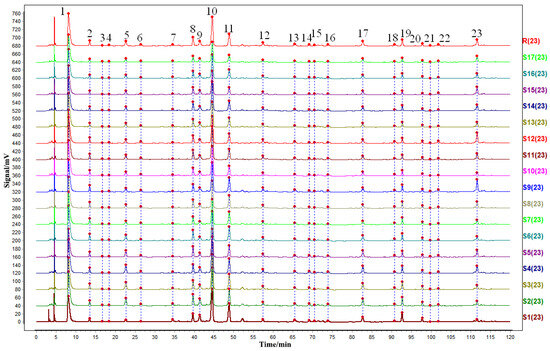
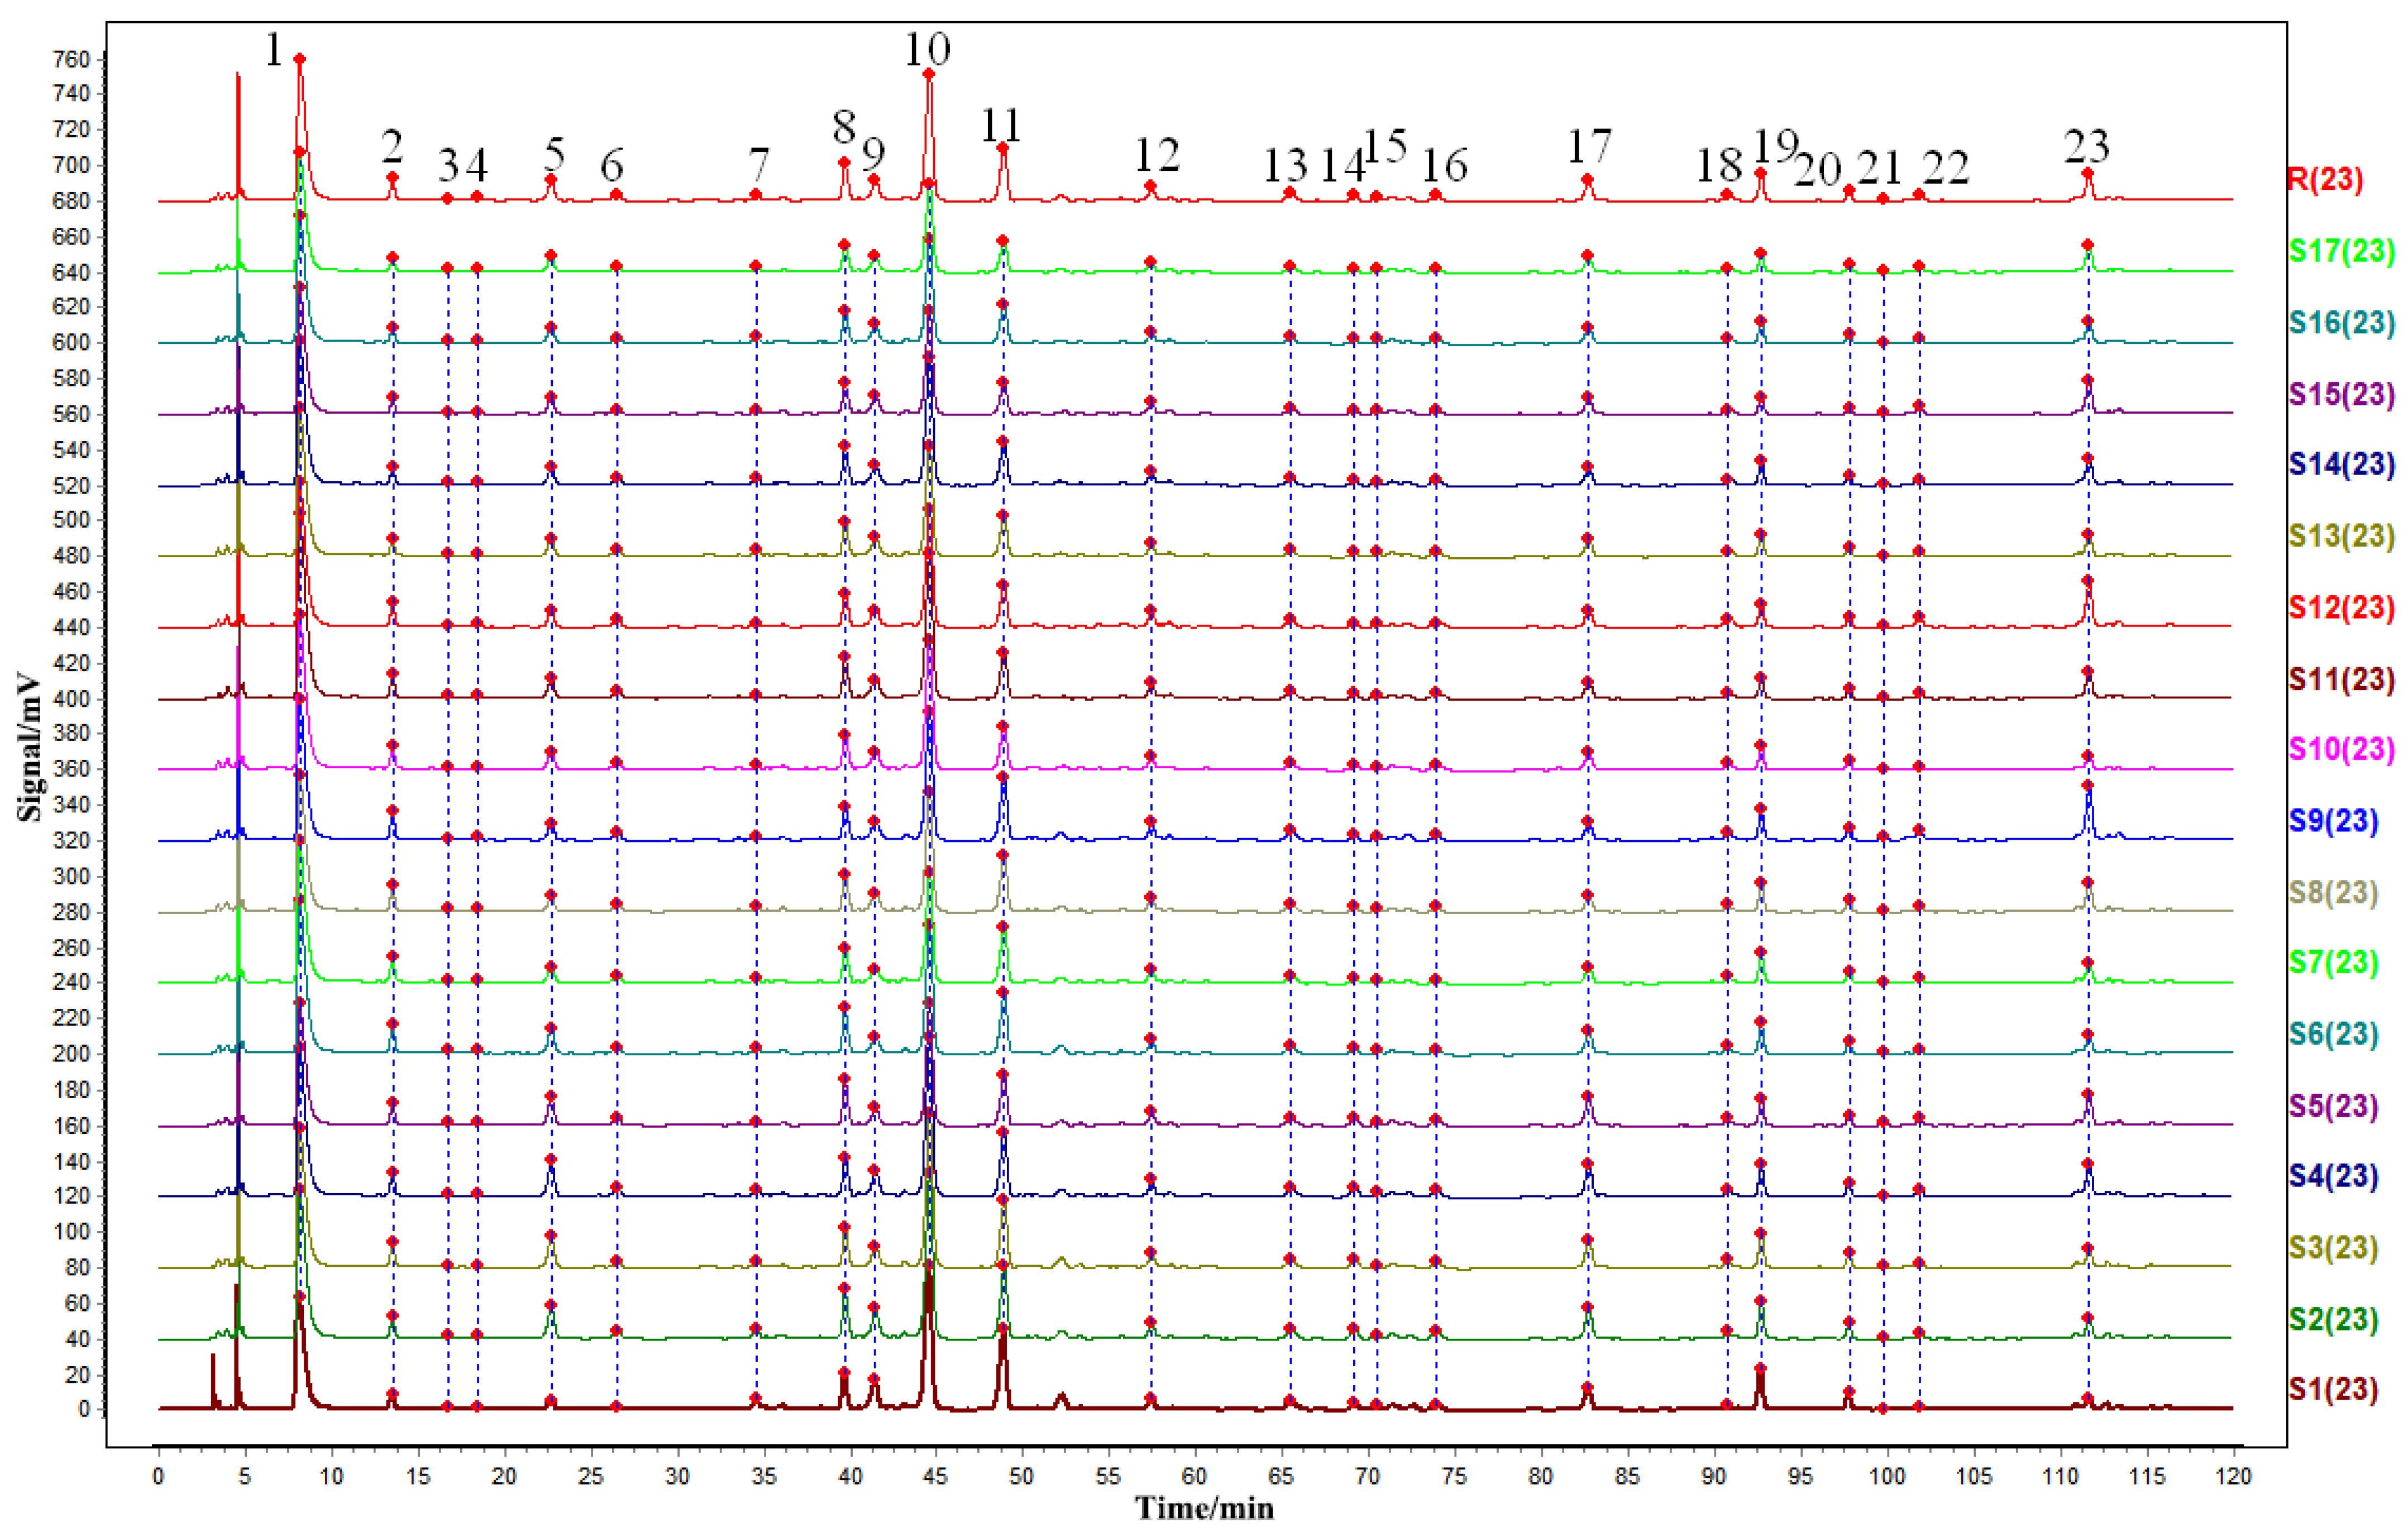
The established method was applied to the analysis of 17 batches of XJPL samples. After data conversion, the chromatograms of all batches were imported into the Similarity Evaluation System for Chromatographic Fingerprints of Traditional Chinese Medicine (version 2012). The time window was set to 0.1 min, the median method was used to generate the reference fingerprint, and full-spectrum peak matching was performed by multipoint correction. The results showed that the chromatographic profiles of the 17 batches were generally consistent, and the major chromatographic peaks were stably detected across all batches. A total of 23 common peaks were assigned after common peak matching (Figure 3), indicating that the method could comprehensively reflect the overall chromatographic characteristics of the major mediuM− and high-polarity constituents in XJPL.
Figure 3.
HPLC fingerprints of 17 batches of XJPL and the generated reference fingerprint. Peak assignments: 2, gallic acid; 8, loganic acid; 9, chlorogenic acid; 10, gentiopicroside; 11, picrocrocin; 12, ferulic acid; 15, luteolin; 19, crocin I; 20, crocin II; 23, ligustilide.
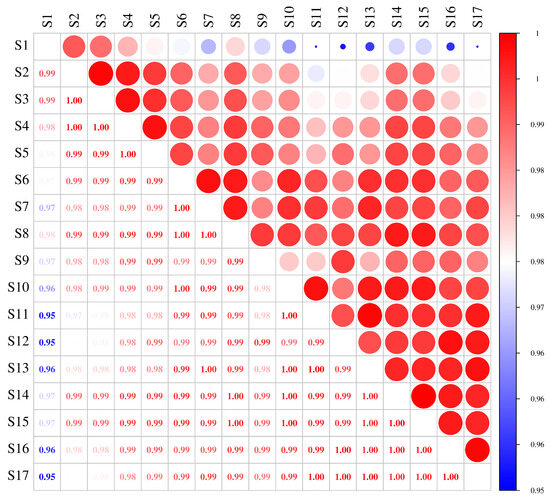
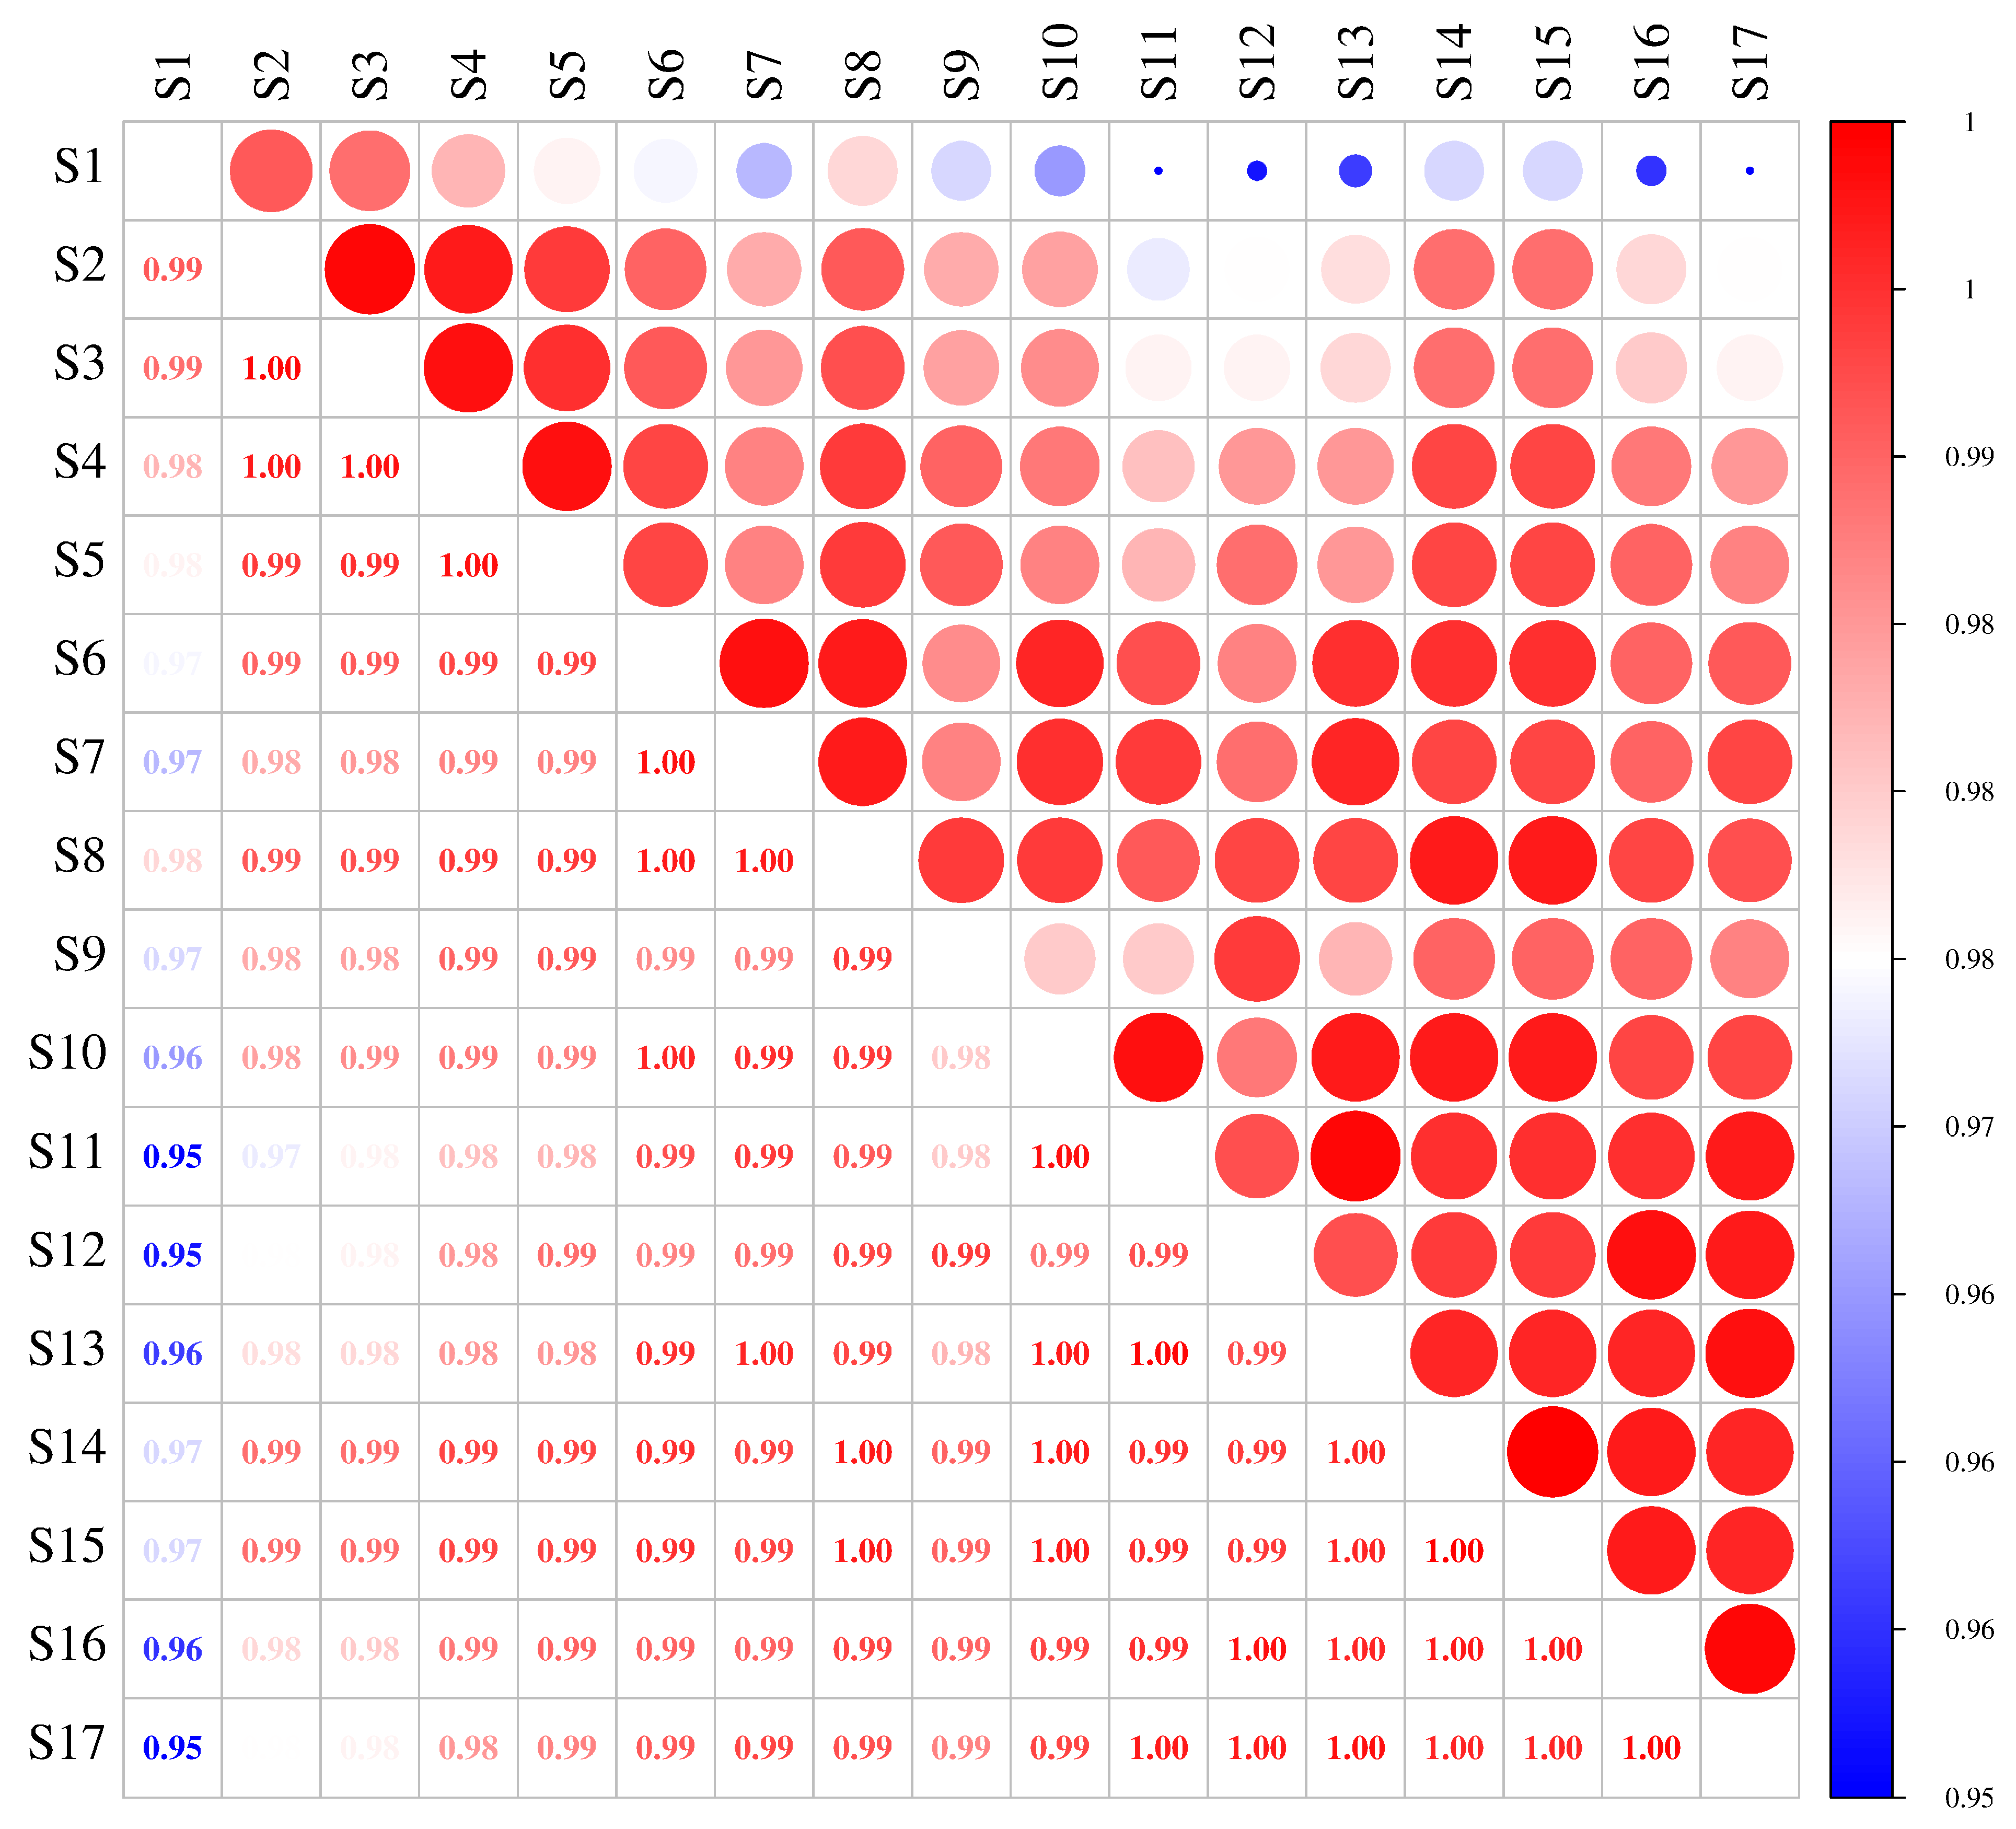
To further evaluate batch-to-batch consistency among the 17 batches of XJPL, similarity analysis was performed using the peak areas of the 23 common peaks as variables. The correlation coefficients among the 17 batches were all above 0.95, with some approaching 1.00, suggesting a high degree of consistency in the overall chemical profiles of different batches (Figure 4). These results indicate that, under the current manufacturing conditions, the major mediuM− and high-polarity constituents in XJPL were relatively stable, and the HPLC fingerprint can serve as an effective tool for batch consistency evaluation. It should be noted, however, that similarity evaluation mainly reflects the resemblance of overall chromatographic profiles among batches and does not fully reveal differences in the absolute contents of individual marker constituents. Therefore, although the 17 batches showed high fingerprint similarity, chemometric analysis was still needed to identify the main variables responsible for batch-to-batch differences, and multicomponent quantification was required for quantitative evaluation of key constituents. This strategy helps overcome the limitations of assessing quality consistency based solely on overall similarity and enables a more comprehensive quality evaluation of XJPL.
Figure 4.
Similarity correlation heatmap of the 17 batches of XJPL based on the 23 common peaks.
2.4. Chemometric Analysis of HPLC Fingerprint Data
Chromatographic fingerprinting combined with chemometric analysis has been widely used for evaluating quality consistency in traditional Chinese medicines and compound preparations. HCA and PCA are unsupervised pattern recognition methods that can be used to observe natural clustering trends among samples and identify major variables contributing to variation, whereas OPLS-DA is a supervised discriminant method that can further identify variables contributing to group separation based on variable importance in projection (VIP) values. The combined use of similarity evaluation, unsupervised analysis, and supervised analysis helps interpret batch-to-batch quality differences in XJPL from the perspectives of both overall consistency and differential variable identification [22,23,24]. Accordingly, in this study, the peak areas of the 23 common peaks in the HPLC fingerprints were used as variables, and HCA, PCA, and OPLS-DA were applied to explore the batch-related differences embedded in the fingerprint data of the 17 batches of XJPL.
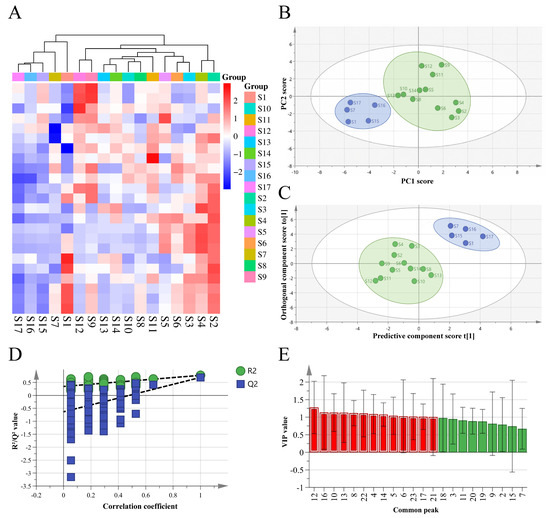
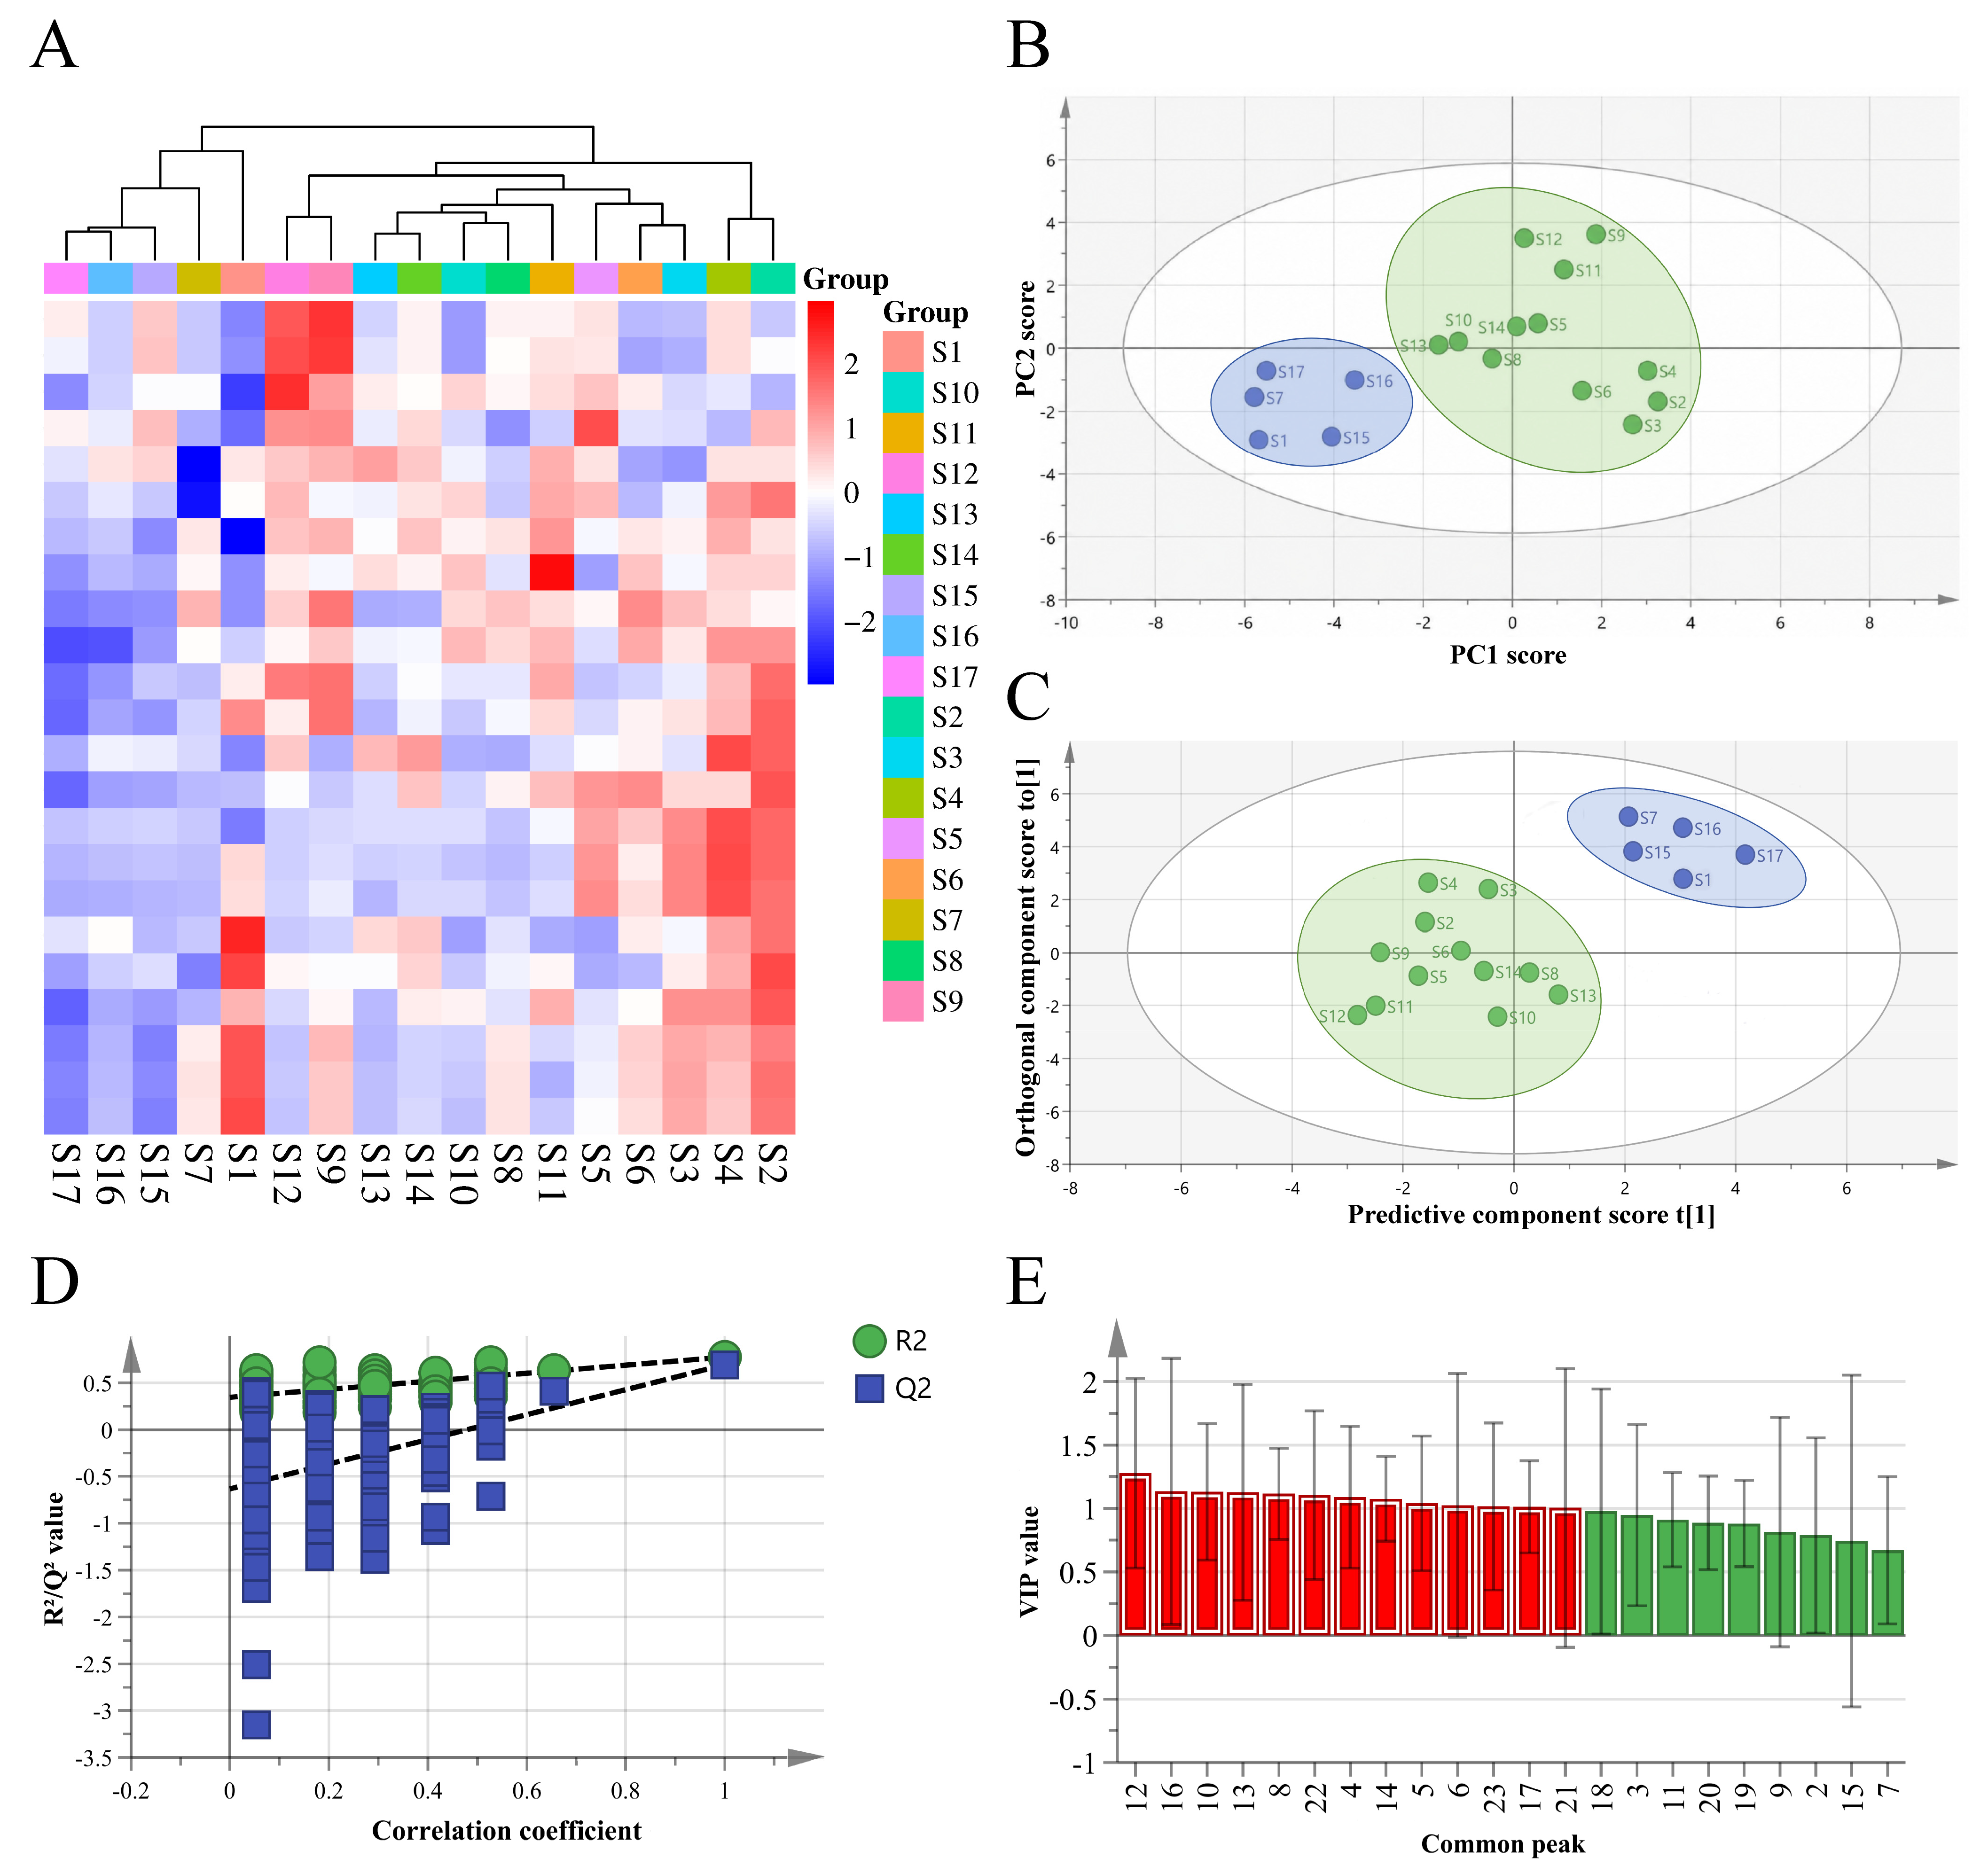
HCA was first performed as an unsupervised clustering analysis of the 17 batches of XJPL. Using the peak areas of the 23 common peaks as variables, the data were standardized, and a clustering heatmap was generated using Euclidean distance and the complete linkage method (Figure 5A) [22,23]. The results showed that the 17 batches could be roughly divided into two clusters: S1, S7, S15, S16, and S17 formed one cluster, whereas the remaining batches formed another. This result suggests that although the 17 batches showed high overall fingerprint similarity, the relative peak areas of certain common peaks still differed among batches.
Figure 5.
Chemometric analysis of the HPLC fingerprint data from 17 batches of XJPL. (A) HCA heatmap based on the peak areas of 23 common peaks; (B) PCA score plot; (C) OPLS-DA score plot; (D) 200-permutation test of the OPLS-DA model; (E) VIP plot of the 23 common peaks. Red bars in the VIP plot indicate variables with VIP values greater than 1.
PCA was then performed to reduce the dimensionality of the peak area matrix of the 23 common peaks [12,22]. Using an eigenvalue greater than 1 as the extraction criterion, five principal components were obtained, with a cumulative variance contribution rate of 91.241%, indicating that the first five principal components explained most of the information contained in the original fingerprint variables. Specifically, PC1 had an eigenvalue of 9.037 and accounted for 39.291% of the variance, whereas PC2 had an eigenvalue of 5.282 and accounted for 22.965%. PC3, PC4, and PC5 contributed 12.430%, 9.438%, and 7.118% of the variance, respectively (Table 2). The PCA score plot showed a degree of separation between S1, S7, S15, S16, and S17 and the remaining batches in the principal component space (Figure 5B), which was generally consistent with the HCA results and further indicated identifiable relative chemical differences among the 17 batches.
Table 2.
Eigenvalues and cumulative variance contribution rates of the principal components for the 17 batches of XJPL.
The PCA loading matrix further showed that the contributions of individual common peaks to each principal component differed (Table 3). Peak 10 had the highest loading on PC1 (0.945), and peaks 13 (0.889), 14 (0.853), 11 (0.840), 17 (0.821), 20 (0.818), and 19 (0.810) also showed high positive loadings on PC1. Peaks 18 (0.891), 22 (0.789), 6 (0.779), and 23 (0.769) contributed substantially to PC2, whereas peaks 15 (0.800), 16 (0.551), and 9 (0.516) contributed mainly to PC3. Based on the assigned common peaks, peak 10 corresponded to gentiopicroside, peak 11 to picrocrocin, peaks 19 and 20 to crocin I and crocin II, respectively, and peak 23 to ligustilide. These results suggest that iridoid glycosides, carotenoid glycosides, and L. chuanxiong-related constituents may all contribute to the batch-to-batch differences observed in XJPL.
Table 3.
PCA loading matrix of the 23 common peaks.
To further screen potential marker peaks responsible for batch-to-batch differences, OPLS-DA was performed as a supervised discriminant analysis using the peak area data of the 23 common peaks. The model parameters were R2X = 0.630, R2Y = 0.775, and Q2 = 0.694, indicating acceptable fitting and predictive ability. The 200-permutation test showed a Q2 regression intercept of −0.698, suggesting no obvious overfitting (Figure 5C,D). The OPLS-DA results were generally consistent with those of HCA and PCA, further supporting that the 17 batches of XJPL showed a certain grouping tendency based on differences in common peak areas.
According to the variable contribution results of OPLS-DA (Figure 5E), common peaks such as gentiopicroside and loganic acid contributed substantially to batch-to-batch differences, with VIP values greater than 1. Gentiopicroside is a representative iridoid glycoside from G. macrophylla and was also used as the reference peak in the HPLC fingerprint established in this study. Loganic acid is likewise associated with G. macrophylla and showed a degree of batch-to-batch variation in the subsequent quantitative analysis. Therefore, these constituents not only help explain differences among XJPL fingerprints from different batches but may also serve as potential quality markers requiring particular attention in subsequent quality evaluation. In addition, the assigned peaks corresponding to crocin I, crocin II, and ligustilide are associated with C. sativus and L. chuanxiong, respectively, and may provide Supplementary Information for evaluating the quality stability of key medicinal materials in the formula.
2.5. Method Validation for Simultaneous Quantification of Seven Representative Constituents
Based on the assignment of common peaks in the HPLC fingerprint, gallic acid, loganic acid, chlorogenic acid, gentiopicroside, ferulic acid, crocin I, and crocin II were selected as markers for simultaneous quantification. These seven constituents represent different structural classes, including phenolic acids, iridoid glycosides, and crocin-type glycosides, and are associated with key medicinal materials in the XJPL formula, such as Gentiana macrophylla, Crocus sativus, Ligusticum chuanxiong, and Rhodiola crenulata. In addition, loganic acid and gentiopicroside contributed substantially to batch-to-batch differences in the chemometric analysis described above. Including them in the quantitative evaluation system therefore helps further explain interbatch quality variation at the level of constituent contents.
Calibration curves were established using the concentrations of each reference standard as the x-axis and the corresponding peak areas as the y-axis. The seven constituents showed good linearity within their respective concentration ranges, with correlation coefficients (R2) between 0.9995 and 0.9999. The linear ranges of the constituents are shown in Table 4. The limits of detection (LODs) and quantification (LOQs) were calculated at signal-to-noise ratios of 3 and 10, respectively. The LODs ranged from 0.1143 to 11.6615 μg/mL, and the LOQs ranged from 0.3463 to 35.3379 μg/mL, indicating good detection sensitivity of the method (Table 4 and Figure S13).
Table 4.
Calibration curves, linear ranges, LODs and LOQs of seven representative constituents.
In the precision test, the sample solution prepared from one batch of XJPL was injected six consecutive times, and the RSDs of the peak areas of the seven constituents ranged from 0.14% to 2.52%, indicating good instrumental precision (Table S7). In the stability test, the sample solution was stored at room temperature and analyzed at 0, 2, 4, 6, 8, 10, 12, and 24 h. The RSDs of the peak areas of the seven constituents ranged from 0.25% to 2.94%, indicating that the sample solution remained stable within 24 h (Table S8). In the repeatability test, six sample solutions were prepared in parallel from the same batch and analyzed separately. The RSDs of the contents of the seven constituents ranged from 0.82% to 2.58%, demonstrating good repeatability of sample preparation and determination (Table S9).
For the recovery test, an XJPL sample with known contents was used as the matrix, and each reference standard solution was added at an approximately 1:1 ratio before analysis. The average recoveries of gallic acid, loganic acid, chlorogenic acid, gentiopicroside, ferulic acid, crocin I, and crocin II were 98.24%, 99.10%, 97.49%, 99.92%, 96.32%, 101.42%, and 100.08%, respectively, with RSDs of 0.36%, 1.30%, 0.54%, 0.49%, 0.41%, 0.71%, and 1.60%, respectively, indicating good accuracy of the method (Table S10). Robustness was further evaluated by slightly changing the flow rate, column temperature, and injection volume. When the flow rate varied from 0.8 to 1.2 mL/min, the column temperature from 28 to 32 °C, and the injection volume from 8 to 12 μL, the RSDs of the measured results for all seven constituents were no higher than 1.98%, indicating that the method was robust against small variations in routine chromatographic conditions (Table S11).
Overall, the established HPLC method showed good linearity, sensitivity, precision, stability, repeatability, accuracy, and robustness, and was suitable for simultaneous quantification of the seven representative constituents in XJPL. Because this method used the same chromatographic system as the HPLC fingerprint method described above, it enabled effective integration of qualitative assignment of common fingerprint peaks with quantitative control of representative constituents, providing a reliable methodological basis for subsequent content comparison and quality consistency evaluation of the 17 batches of XJPL.
2.6. Quantitative Analysis of Seven Representative Constituents in 17 Batches of XJPL
The validated HPLC method was applied to the simultaneous determination of gallic acid, loganic acid, chlorogenic acid, gentiopicroside, ferulic acid, crocin I, and crocin II in 17 batches of XJPL. Each batch was analyzed in triplicate, and the results are expressed as mg/g. The quantitative results are shown in Table 5.
Table 5.
Contents of seven representative constituents in 17 batches of XJPL (n = 3, mg/g).
Overall, all seven representative constituents were detected in the 17 batches of XJPL, although their content levels and degrees of batch-to-batch variation differed. Gentiopicroside was the most abundant of the seven constituents, with contents ranging from 0.7250 to 1.3354 mg/g and a mean content of 1.0236 mg/g. Loganic acid ranged from 0.2486 to 0.3988 mg/g, with a mean content of 0.3198 mg/g, whereas chlorogenic acid ranged from 0.1712 to 0.2773 mg/g, with a mean content of 0.2068 mg/g. These results indicate that G. macrophylla-related iridoid glycosides and phenolic acids are major quantifiable mediuM− and high-polarity constituents in XJPL.
Crocin I and crocin II are characteristic constituents of C. sativus. Their contents in the 17 batches ranged from 0.1602 to 0.3653 mg/g and from 0.0436 to 0.1210 mg/g, respectively, with mean contents of 0.2451 and 0.0759 mg/g. Considerable batch-to-batch variation was observed for these two constituents. In particular, S1, S2, and S3 contained relatively high levels of crocin I and crocin II, whereas S15 and S17 showed lower levels. Because C. sativus is a valuable medicinal material in the formula, variation in its characteristic constituents may serve as an important reference for evaluating the quality stability of the corresponding medicinal material.
Among the phenolic acids, gallic acid and ferulic acid were present at relatively low levels. Gallic acid ranged from 0.0322 to 0.0678 mg/g, with a mean content of 0.0497 mg/g, whereas ferulic acid ranged from 0.0495 to 0.0721 mg/g, with a mean content of 0.0608 mg/g. Although their absolute contents were lower than those of gentiopicroside, loganic acid, and crocin I, these constituents are associated with multiple medicinal materials and can supplement the evaluation of XJPL quality from the perspective of phenolic acids.
Together with the chemometric results described above, gentiopicroside and loganic acid were not only relatively abundant in the 17 batches but also contributed substantially to batch-to-batch differences, making them key marker constituents for evaluating XJPL quality consistency. Although the contents of crocin I and crocin II were lower than that of gentiopicroside, their clear association with C. sativus makes them useful for assessing saffron-related quality attributes. Gallic acid, chlorogenic acid, and ferulic acid further complement the overall quality assessment from the perspective of phenolic constituents. Therefore, simultaneous determination of these seven representative constituents enables comprehensive quality evaluation of XJPL across different medicinal materials and structural classes.
2.7. Method Validation and Quantification of Corydalis-Derived Alkaloids
C. yanhusuo is an important medicinal material in the XJPL formula, and its major active constituents include benzylisoquinoline alkaloids such as tetrahydropalmatine and corydaline. The HPLC fingerprint and the quantitative method for the seven representative constituents described above mainly covered mediuM− and high-polarity constituents, including phenolic acids, iridoid glycosides, and crocin-type glycosides, but provided insufficient quantitative characterization of Corydalis-derived alkaloids. Therefore, a dedicated HPLC method was further developed for the determination of tetrahydropalmatine and corydaline to strengthen quantitative control of the characteristic constituents of C. yanhusuo within the XJPL quality evaluation system.
2.7.1. Optimization of Sample Preparation for Corydalis-Derived Alkaloids
To optimize the extraction conditions for Corydalis-derived alkaloids, the peak area-to-sample weight ratios of tetrahydropalmatine and corydaline were used as evaluation indices, and the effects of 1% hydrochloric acid volume and ultrasonic extraction time were investigated (Tables S12 and S13). The results showed that extraction with 50 mL of 1% hydrochloric acid produced the highest responses for both constituents. Extending the ultrasonic extraction time from 30 to 60 min did not markedly increase the peak areas. Therefore, the sample preparation conditions were set as extraction with 50 mL of 1% hydrochloric acid by ultrasonication for 30 min.
2.7.2. Method Validation for Corydalis-Derived Alkaloids
The established HPLC method was validated for the determination of tetrahydropalmatine and corydaline. The calibration results showed good linearity for both analytes within their respective concentration ranges. The LOQ and LOD were 1.6212 and 0.5350 μg/mL for tetrahydropalmatine, and 1.3021 and 0.4297 μg/mL for corydaline, respectively, indicating good detection sensitivity (Table S14 and Figure S14). In the precision test, the sample solution prepared from one batch of XJPL was injected six consecutive times, and the RSDs of the peak areas of tetrahydropalmatine and corydaline were 0.36% and 0.41%, respectively, indicating good instrumental precision (Table S15). In the stability test, the sample solution was stored at room temperature and analyzed at 0, 2, 4, 8, 12, and 24 h. The RSDs of the peak areas of the two constituents were 0.62% and 0.56%, respectively, indicating that the sample solution remained stable within 24 h (Table S16). In the repeatability test, six sample solutions were prepared in parallel from the same batch and analyzed separately. The RSDs of the contents of tetrahydropalmatine and corydaline were 0.47% and 0.53%, respectively, demonstrating good repeatability (Table S17). In the recovery test, an XJPL sample with known contents was used as the matrix, and tetrahydropalmatine and corydaline reference standards were added at an approximately 1:1 ratio before analysis. The average recoveries of tetrahydropalmatine and corydaline were 98.19% and 101.63%, respectively, with RSDs of 0.57% and 1.39%, indicating good accuracy (Table S18). Robustness was further evaluated by slightly varying the flow rate, column temperature, and injection volume. When the flow rate ranged from 0.8 to 1.2 mL/min, the column temperature from 28 to 32 °C, and the injection volume from 8 to 12 μL, the RSDs of the measured results for both constituents were no higher than 2.05%, indicating good method robustness (Table S19).
2.7.3. Quantification of Corydalis-Derived Alkaloids in 17 Batches of XJPL
The established method was applied to determine tetrahydropalmatine and corydaline in 17 batches of XJPL, and the results are shown in Table 6. Both constituents were detected in all batches, although their contents were relatively low. The content of tetrahydropalmatine ranged from 0.0080 to 0.0169 mg/g, with a mean value of 0.0118 mg/g, whereas the content of corydaline ranged from 0.0118 to 0.0274 mg/g, with a mean value of 0.0192 mg/g. Overall, corydaline was present at higher levels than tetrahydropalmatine. Both tetrahydropalmatine and corydaline are representative alkaloids of C. yanhusuo. Including these two constituents in the multicomponent quality evaluation system of XJPL compensates for the limited coverage of Corydalis-derived alkaloids by the HPLC fingerprint and the quantitative method for the seven representative constituents.
Table 6.
Contents of tetrahydropalmatine and corydaline in 17 batches of XJPL (n = 3, mg/g).
3. Materials and Methods
3.1. Materials, Reagents, and Reference Standards
A total of 17 batches of XJPL samples, designated S1-S17, were collected in this study. All samples were provided by Tibet Rhodiola Pharmaceutical Co., Ltd. (Lhasa, China), with batch numbers of 230,501, 240,704, 240,705, 240,706, 240,801, 240,802, 240,803, 240,804, 240,805, 241,004, 241,102, 241,103, 241,202, 241,203, 241,204, 241,205, and 241,206. All samples were stored at room temperature and protected from light before analysis.
Reference standards of gallic acid, gentiopicroside, loganic acid, tetrahydropalmatine, corydaline, salidroside, swertiamarin, ellagic acid, caffeic acid, 3-deoxyaconitine, and aconitine were purchased from Chengdu DeSiTe Biological Technology Co., Ltd. (Chengdu, China). Ferulic acid, crocin I, and crocin II were purchased from Chengdu Herbpurify Co., Ltd. (Chengdu, China). Chlorogenic acid, levistolide A, amygdalin, amentoflavone, luteolin, isoquercitrin, catechin, kaempferol, rutin, hyperoside, isorhamnetin, and quercetin were purchased from Chengdu Pushbio Technology Co., Ltd. (Chengdu, China). These standards were used for compound confirmation in UPLC-Q-Exactive Orbitrap MS analysis, common peak assignment in HPLC fingerprinting, and method validation for quantitative assays. The purity of all reference standards was ≥98%.
Methanol, acetonitrile, formic acid, and phosphoric acid were of chromatographic grade. Hydrochloric acid, triethylamine, ethanol, and other reagents were of analytical grade. Ultrapure water was used throughout the study. All solutions were filtered through a 0.22 μm membrane before injection.
3.2. UPLC-Q-Exactive Orbitrap MS Analysis
3.2.1. Sample Preparation for UPLC-Q-Exactive Orbitrap MS
An accurately weighed XJPL sample (6.0 g) was placed in a stoppered conical flask, and 90 mL of 70% ethanol was added. After the flask was weighed, the sample was extracted by ultrasonication for 30 min. The extract was cooled to room temperature, and the weight loss was replenished with 70% ethanol. The solution was mixed thoroughly, and the subsequent filtrate was passed through a 0.22 μm membrane to obtain the XJPL sample solution for UPLC-Q-Exactive Orbitrap MS analysis.
3.2.2. UPLC and Mass Spectrometry Conditions
UPLC-Q-Exactive Orbitrap MS analysis was performed using a Thermo Fisher Scientific UPLC-Q-Exactive Orbitrap MS system. Chromatographic separation was carried out on an Accucore C18 column (3 mm × 100 mm, 2.6 μm) at 30 °C. The injection volume was 4 μL, and the flow rate was 0.4 mL/min. The mobile phase consisted of 0.1% formic acid in water (A) and acetonitrile (B), with the following gradient elution program: 0–5 min, 0% B; 5–15 min, 0–11% B; 15–18 min, 11% B; 18–28 min, 11–18% B; 28–43 min, 18–27% B; and 43–65 min, 27–75% B.
Mass spectrometric detection was performed using an electrospray ionization (ESI) source in both positive and negative ion modes. Data were acquired in Full MS/dd-MS2 mode [25,26]. The spray voltage was set at +3.5 kV in positive ion mode and −3.0 kV in negative ion mode. The resolution was 35,000 for full MS and 17,500 for MS/MS. The scan range was m/z 100–1500, and the collision energies were 20, 40, and 60 eV. The ion transfer tube temperature was 300 °C, the auxiliary gas heater temperature was 350 °C, the sheath gas flow rate was 40 arb, and the auxiliary gas flow rate was 15 arb.
3.3. HPLC Fingerprint Analysis
3.3.1. Sample Preparation for HPLC
An accurately weighed XJPL sample (2.0 g) was placed in a stoppered conical flask, and 10 mL of 70% ethanol was added. After the flask was weighed, the sample was extracted by ultrasonication for 30 min. The extract was cooled to room temperature, and the weight loss was replenished with 70% ethanol. The solution was mixed thoroughly and filtered, and the subsequent filtrate was used as the sample solution for HPLC fingerprint analysis.
Appropriate amounts of reference standards, including gallic acid, loganic acid, chlorogenic acid, gentiopicroside, picrocrocin, ferulic acid, luteolin, crocin I, crocin II, and ligustilide, were dissolved in 70% ethanol to prepare a mixed reference standard solution for common peak assignment. All sample solutions and mixed reference standard solutions were filtered through a 0.22 μm membrane before injection.
3.3.2. Chromatographic Conditions
HPLC fingerprint analysis was performed using a Shimadzu LC-20A HPLC system equipped with a diode array detector (DAD). Chromatographic separation was carried out on a ShimNex CS C18 column (250 mm × 4.6 mm, 5 μm) at 30 °C. The flow rate was 1.0 mL/min, the injection volume was 10 μL, and the detection wavelength was 235 nm. The mobile phase consisted of 0.2% phosphoric acid in water (A) and methanol (B), with the following gradient elution program: 0–5 min, 5% B; 5–10 min, 5–10% B; 10–25 min, 10–12% B; 25–35 min, 12–25% B; 35–42 min, 25% B; 42–47 min, 25–30% B; 47–54 min, 30–37% B; 54–64 min, 37% B; 64–67 min, 37–39% B; 67–73 min, 39% B; 73–77 min, 39–44% B; 77–83 min, 44–47% B; 83–85 min, 47–50% B; 85–115 min, 50–70% B; and 115–120 min, 70% B.
3.3.3. Methodological Validation and Similarity Evaluation
The HPLC fingerprint method was validated mainly in terms of precision, stability, and repeatability. For the precision test, the sample solution prepared from one batch of XJPL was injected six consecutive times under the chromatographic conditions described above, and the retention times and peak areas of the common peaks were recorded. For the stability test, the same sample solution was stored at room temperature and analyzed at 0, 2, 4, 8, 12, and 24 h. For the repeatability test, six sample solutions were prepared in parallel from the same batch of XJPL and analyzed separately. The gentiopicroside peak was selected as the reference peak, and the relative retention times and relative peak areas of the common peaks were calculated. Method performance was evaluated using the relative standard deviation (RSD).
The 17 batches of XJPL were prepared using the same sample preparation procedure and analyzed by HPLC. The resulting chromatograms were imported into the Similarity Evaluation System for Chromatographic Fingerprints of Traditional Chinese Medicine (version 2012) [12,27,28]. The time window was set to 0.1 min, the median method was used to generate the reference fingerprint, and common peak matching was performed by multipoint correction. Common peaks were assigned based on retention times, peak areas, and comparison with reference standards. The similarities among the fingerprints of different batches were then calculated to evaluate the overall batch-to-batch chemical consistency of XJPL.
3.4. Chemometric Analysis
A data matrix for chemometric analysis was constructed using the peak areas of the 23 common peaks in the HPLC fingerprints of the 17 batches of XJPL as the original variables. To reduce the influence of differences in response intensity among peaks on model construction, the peak area data were normalized or standardized before analysis. HCA (https://bioinformatics.com.cn/, accessed on 26 June 2026) and PCA (SIMCA 14.1) were used as unsupervised methods to evaluate the overall chemical differences among the 17 batches and to observe clustering relationships and major differential variables [29]. OPLS-DA (SIMCA 14.1) was further performed as a supervised discriminant analysis of different batches, and common peaks contributing substantially to batch-to-batch differences were screened based on VIP values. The reliability of the OPLS-DA model was evaluated using the model parameters R2X, R2Y, and Q2, together with a 200-permutation test. For OPLS-DA, samples were assigned to two groups according to the clustering pattern observed in HCA and PCA.
3.5. Simultaneous Quantification of Seven Representative Constituents
3.5.1. Preparation of Standard and Sample Solutions
Appropriate amounts of gallic acid, loganic acid, chlorogenic acid, gentiopicroside, ferulic acid, crocin I, and crocin II reference standards were accurately weighed and dissolved separately in 70% ethanol to prepare individual standard stock solutions. Appropriate volumes of each stock solution were then accurately transferred, mixed, and serially diluted with 70% ethanol to obtain mixed working standard solutions at different concentrations for linearity, LOD, LOQ, and sample content determination.
The sample solutions were prepared using the same procedure as that used for HPLC fingerprint analysis. Briefly, an accurately weighed XJPL sample (2.0 g) was extracted with 10 mL of 70% ethanol by ultrasonication for 30 min after weighing. The extract was cooled to room temperature, and the weight loss was replenished with 70% ethanol. The solution was mixed thoroughly and filtered, and the subsequent filtrate was passed through a 0.22 μm membrane before injection. Each batch was prepared and analyzed in triplicate, and the results are expressed as mg/g.
3.5.2. Chromatographic Conditions
The simultaneous determination of the seven representative constituents was performed under the same chromatographic conditions as those used for HPLC fingerprint analysis. The content of each constituent was calculated using the external standard method based on the corresponding calibration curve.
3.5.3. Method Validation
For linearity evaluation of the simultaneous quantification method, mixed working standard solutions at different concentrations were accurately injected and analyzed under the chromatographic conditions described in Section 3.3.2. Calibration curves were constructed by plotting the concentration of each constituent against the corresponding peak area, and the regression equations and correlation coefficients were calculated. The LOD and LOQ were determined at signal-to-noise ratios of approximately 3 and 10, respectively [30]. Precision was evaluated by injecting the same mixed standard solution six consecutive times, recording the peak areas of each constituent, and calculating the RSD. Stability was assessed by analyzing the same sample solution after storage at room temperature for 0, 2, 4, 6, 8, 10, 12, and 24 h to evaluate changes in peak areas. Repeatability was evaluated by preparing six sample solutions in parallel from the same batch of XJPL, followed by separate analysis and calculation of the RSDs of the measured contents. Recovery was assessed by adding known amounts of the seven reference standards to an XJPL sample with known contents, processing the spiked samples according to the sample preparation procedure, and calculating the average recovery and RSD for each constituent. Robustness was evaluated by slightly changing the flow rate, column temperature, and injection volume to examine the influence of minor variations in chromatographic conditions on the analytical results.
3.6. Quantification of Corydalis-Derived Alkaloids
3.6.1. Preparation of Standard and Sample Solutions
Appropriate amounts of tetrahydropalmatine and corydaline reference standards were accurately weighed and dissolved separately in methanol to prepare individual standard stock solutions. Appropriate volumes of the two stock solutions were then accurately transferred, mixed, and serially diluted to obtain mixed working standard solutions at different concentrations for linearity, LOD, LOQ, and sample content determination.
The sample solution was prepared as follows. An appropriate amount of XJPL sample was accurately weighed and placed in a stoppered conical flask. Then, 50 mL of 1% hydrochloric acid solution was added, and the flask was weighed before ultrasonication for 30 min. After extraction, the solution was cooled to room temperature, and the weight loss was replenished with 1% hydrochloric acid solution. The solution was mixed thoroughly and filtered, and the subsequent filtrate was passed through a 0.22 μm membrane before injection. Each batch was prepared and analyzed in triplicate, and the contents of tetrahydropalmatine and corydaline are expressed as mg/g.
3.6.2. Chromatographic Conditions
Tetrahydropalmatine and corydaline were determined using a dedicated HPLC method. The chromatographic system was a Shimadzu LC-20A HPLC instrument equipped with a DAD. Separation was performed on a ShimNex CS C18 column (250 mm × 4.6 mm, 5 μm). The mobile phase consisted of 0.1% phosphoric acid solution adjusted to pH 6.5 with triethylamine (A) and acetonitrile (B). The detection wavelength was 280 nm, the column temperature was 30 °C, the flow rate was 1.0 mL/min, and the injection volume was 10 μL. The gradient elution program was as follows: 0–8 min, 45% B; 8–25 min, 45–85% B; 25–30 min, 85–86% B; and 30–35 min, 86% B. The content of each constituent was calculated using the external standard method based on the corresponding calibration curve.
3.6.3. Method Validation
For linearity evaluation of the tetrahydropalmatine and corydaline quantification method, mixed working standard solutions at different concentrations were injected and analyzed. Calibration curves were constructed by plotting the concentration of each analyte against the corresponding peak area, and the regression equations and correlation coefficients were calculated. The LOD and LOQ were determined at signal-to-noise ratios of approximately 3 and 10, respectively.
Precision was evaluated by injecting the same mixed standard solution six consecutive times, recording the peak areas of tetrahydropalmatine and corydaline, and calculating the RSD. Stability was assessed by analyzing the same sample solution after storage at room temperature for different time intervals to evaluate changes in the peak areas of the two analytes. Repeatability was evaluated by preparing six sample solutions in parallel from the same batch of XJPL, followed by separate analysis and calculation of the RSDs of the measured contents. Recovery was assessed by adding known amounts of tetrahydropalmatine and corydaline reference standards to an XJPL sample with known contents, processing the spiked samples according to the sample preparation procedure, and calculating the average recovery and RSD. Robustness was evaluated by slightly changing the flow rate, column temperature, and injection volume to assess method stability under minor variations in chromatographic conditions.
4. Conclusions
This study established an integrated quality evaluation method for XJPL based on UPLC-Q-Exactive Orbitrap MS, HPLC fingerprinting, chemometric analysis, and multicomponent quantification. A total of 139 chemical constituents were confirmed by reference standards or putatively characterized by UPLC-Q-Exactive Orbitrap MS. The HPLC fingerprint established for 17 batches contained 23 common peaks, of which 10 representative constituents were assigned. Method validation confirmed the reliability of the fingerprinting method, and similarity evaluation indicated a high degree of consistency in the overall chemical profiles among batches. HCA, PCA, and OPLS-DA further revealed batch-to-batch differences and provided a basis for screening potential quality marker peaks.
On this basis, quantitative methods were developed for seven representative constituents as well as tetrahydropalmatine and corydaline, and the validation results met the requirements for quality analysis of compound preparations. By integrating high-resolution MS-based chemical profiling, holistic fingerprint evaluation, batch-difference characterization, and multicomponent quantitative control, this strategy better reflects the overall quality characteristics of XJPL than the current quality control approach, which relies mainly on thin-layer chromatographic identification. These findings provide experimental support for improving the quality standard and manufacturing quality control of XJPL.
Supplementary Materials
The following supporting information can be downloaded at: https://www.mdpi.com/article/10.3390/separations13090243/s1, Figure S1: Chemical structures of compounds 1–39 identified or tentatively identified in XJPL by UPLC-Q-Exactive Orbitrap MS; Figure S2: Chemical structures of compounds 40–69 identified or tentatively identified in XJPL by UPLC-Q-Exactive Orbitrap MS; Figure S3: Chemical structures of compounds 70–105 identified or tentatively identified in XJPL by UPLC-Q-Exactive Orbitrap MS; Figure S4: Chemical structures of compounds 106–139 identified or tentatively identified in XJPL by UPLC-Q-Exactive Orbitrap MS; Figure S5: MS/MS spectrum and proposed fragmentation pathway of aconitine; Figure S6: MS/MS spectrum and proposed fragmentation pathway of tetrahydropalmatine; Figure S7: MS/MS spectrum and proposed fragmentation pathway of senkyunolide A; Figure S8: MS/MS spectrum and proposed fragmentation pathway of chlorogenic acid; Figure S9: MS/MS spectrum and proposed fragmentation pathway of salidroside; Figure S10: MS/MS spectrum and proposed fragmentation pathway of loganic acid; Figure S11: MS/MS spectrum and proposed fragmentation pathway of catechin; Figure S12: MS/MS spectrum and proposed fragmentation pathway of crocin I; Figure S13: Calibration curves of the seven representative constituents; Figure S14: Calibration curves of tetrahydropalmatine and corydaline; Table S1: Optimization of extraction solvent for HPLC fingerprint sample preparation (n = 3); Table S2: Optimization of extraction solvent volume for HPLC fingerprint sample preparation (n = 3); Table S3: Optimization of extraction time for HPLC fingerprint sample preparation (n = 3); Table S4: Precision results of the HPLC fingerprint method (n = 6); Table S5: Stability results of the HPLC fingerprint method (n = 6); Table S6: Repeatability results of the HPLC fingerprint method (n = 6); Table S7: Precision results for simultaneous quantification of the seven representative constituents (n = 6); Table S8: Stability results for simultaneous quantification of the seven representative constituents (n = 6); Table S9: Repeatability results for simultaneous quantification of the seven representative constituents (n = 6, mg); Table S10: Recovery results for simultaneous quantification of the seven representative constituents (n = 6); Table S11: Robustness results for simultaneous quantification of the seven representative constituents (n = 3, mg/g); Table S12: Optimization of extraction solvent volume for Corydalis-derived alkaloids (n = 3); Table S13: Optimization of extraction time for Corydalis-derived alkaloids (n = 3); Table S14: Linearity, LOD, and LOQ of tetrahydropalmatine and corydaline; Table S15: Precision results for quantification of tetrahydropalmatine and corydaline (n = 6); Table S16: Stability results for quantification of tetrahydropalmatine and corydaline (n = 6); Table S17: Repeatability results for quantification of tetrahydropalmatine and corydaline (n = 6, mg); Table S18: Recovery results for quantification of tetrahydropalmatine and corydaline (n = 6); Table S19: Robustness results for quantification of tetrahydropalmatine and corydaline (n = 3, mg/g).
Author Contributions
Conceptualization, J.W. and W.L.; methodology, J.W. and W.L.; software, J.W. and W.L.; validation, Y.C., Z.G. and T.K.; formal analysis, Y.C., J.Z. and T.K.; investigation, D.R., Z.G., J.Z. and T.K.; data curation, J.W., W.L., Z.G. and J.Z.; writing-original draft preparation, J.W.; writing-review and editing, Y.L. and Y.Z.; visualization, C.T.; supervision, C.T. and Y.L.; project administration, T.K., C.T., D.R., Y.L. and Y.Z.; funding acquisition, Y.Z. All authors have read and agreed to the published version of the manuscript.
Funding
This work was supported by the National Key Research and Development Program of China (Grant No. 2023YFC3504402).
Institutional Review Board Statement
Not applicable.
Informed Consent Statement
Not applicable.
Data Availability Statement
Data are available from the authors.
Conflicts of Interest
Author Dongsheng Ren was employed by the company Tibet Rhodiola Pharmaceutical Holding Co., Ltd. The XJPL sample used in this article came from Tibet Rhodiola Pharmaceutical Holding Co., Ltd. The remaining authors declare that the research was conducted in the absence of any commercial or financial relationships that could be construed as a potential conflict of interest.
References
- Jiang, W.Y. Therapeutic wisdom in traditional Chinese medicine: A perspective from modern science. Trends Pharmacol. Sci. 2005, 26, 558–563. [Google Scholar] [CrossRef] [Scilit]
- Zhang, A.; Sun, H.; Wang, X. Mass spectrometry-driven drug discovery for development of herbal medicine. Mass Spectrom. Rev. 2018, 37, 307–320. [Google Scholar] [CrossRef] [Scilit]
- Liang, Y.; Xie, P.; Chau, F. Chromatographic fingerprinting and related chemometric techniques for quality control of traditional Chinese medicines. J. Sep. Sci. 2010, 33, 410–421. [Google Scholar] [CrossRef] [Scilit]
- Fan, X.H.; Cheng, Y.Y.; Ye, Z.L.; Lin, R.C.; Qian, Z.Z. Multiple chromatographic fingerprinting and its application to the quality control of herbal medicines. Anal. Chim. Acta 2006, 555, 217–224. [Google Scholar] [CrossRef] [Scilit]
- Yao, Y.; Li, M.; Zhang, L.; Meng, J.; Liu, L.; Li, W.; Zhang, J. Fingerprinting combined with chemometrics: New strategies and advances in quality evaluation of traditional Chinese medicine. Anal. Methods 2026, 18, 774–785. [Google Scholar] [CrossRef] [Scilit]
- Cai, M.; Wang, S.; Jiang, J.; Gao, K.; Sun, G. Comprehensive analysis strategy of quality for traditional Chinese medicine compound based on fingerprint technology and quantitative prediction of spectra. Talanta 2025, 287, 127661. [Google Scholar] [CrossRef] [Scilit]
- Ministry of Health of the People’s Republic of China. Drug Standards of the Ministry of Public Health of the People’s Republic of China: Tibetan Medicines; Ministry of Health of the People’s Republic of China: Beijing, China, 1995; Volume 1.
- Li, L.L.; Wang, L.X.; Ni, L.; Yang, X. Determination of crocin I and gentiopicroside in Xueshan Jinluohan Pain-Relief Liniment by HPLC. Chin. Tradit. Pat. Med. 2012, 34, 499–502. [Google Scholar]
- Ni, L.; Yang, J. Determination of tetrahydropalmatine in Xueshan Jinluohan Pain-Relief Liniment by HPLC. Chin. J. Exp. Tradit. Med. Formulae 2012, 18, 106–108. [Google Scholar]
- Ma, J.; Li, K.; Shi, S.; Li, J.; Tang, S.; Liu, L. The application of UHPLC-HRMS for quality control of traditional Chinese medicine. Front. Pharmacol. 2022, 13, 922488. [Google Scholar] [CrossRef] [Scilit]
- Liu, Y.; Wu, Z.; Yang, K.; Ding, H.; Wu, Y. A useful strategy to evaluate the quality consistency of traditional Chinese medicines based on liquid chromatography and chemometrics. J. Anal. Methods Chem. 2015, 2015, 589654. [Google Scholar] [CrossRef] [Scilit]
- Qiu, J.; Li, J.; Shang, S.Y.; Zhou, P.; Leng, J. HPLC fingerprint combined with chemometrics and multicomponent content determination for quality evaluation and control of Huangma tincture. Phytochem. Anal. 2025, 36, 1002–1016. [Google Scholar] [CrossRef] [Scilit]
- Chen, B.; Liu, S.S.; Li, X.C.; Cai, R.X.; Li, C.H.; Hu, Y.C.; Su, J.T.; Lei, T.X. Database-aided ultrahigh-performance liquid chromatography Q-Exactive-Orbitrap tandem mass spectrometry putatively identifies 16 unexpected compounds and three anticounterfeiting pharmacopoeia quality markers for Perillae Fructus. Rapid Commun. Mass Spectrom. 2024, 38, e9762. [Google Scholar] [CrossRef] [Scilit]
- Wang, Y.; Miao, C.; Wu, J.; Hua, Y.; Li, X.; Kang, L.; Qiu, Z. Targeted enrichment and characterization of diester diterpenoid alkaloids in Aconitum herbs using gas-liquid microextraction coupled with high-resolution mass spectrometry. Molecules 2025, 30, 4029. [Google Scholar] [CrossRef] [Scilit]
- Sun, M.; Liu, J.; Lin, C.; Miao, L.; Lin, L. Alkaloid profiling of the traditional Chinese medicine Rhizoma Corydalis using high performance liquid chromatography-tandem quadrupole time-of-flight mass spectrometry. Acta Pharm. Sin. B 2014, 4, 208–216. [Google Scholar] [CrossRef] [Scilit]
- Cheng, T.; Ye, J.; Li, H.; Dong, H.; Xie, N.; Mi, N.; Zhang, Z.; Zou, J.; Jin, H.; Zhang, W. Hybrid multidimensional data acquisition and data processing strategy for comprehensive characterization of known, unknown and isomeric compounds from the compound Dan Zhi Tablet by UPLC-TWIMS-QTOFMS. RSC Adv. 2019, 9, 8714–8727. [Google Scholar] [CrossRef] [Scilit]
- Ncube, E.N.; Mhlongo, M.I.; Piater, L.A.; Steenkamp, P.A.; Dubery, I.A.; Madala, N.E. Analyses of chlorogenic acids and related cinnamic acid derivatives from Nicotiana tabacum tissues with the aid of UPLC-QTOF-MS/MS based on the in-source collision-induced dissociation method. Chem. Cent. J. 2014, 8, 66. [Google Scholar] [CrossRef] [Scilit]
- Luo, Z.; Ma, X.; Liu, Y.; Lu, L.; Yang, R.; Yu, G.; Sun, M.; Xin, S.; Tian, S.; Chen, X.; et al. An approach to characterizing the complicated sequential metabolism of salidroside in rats. Molecules 2016, 21, 706. [Google Scholar] [CrossRef] [Scilit]
- Kucharska, A.Z.; Sokół-Łętowska, A.; Fecka, I. Identification of iridoids in edible honeysuckle berries (Lonicera caerulea L. var. kamtschatica Sevast.) by UPLC-ESI-qTOF-MS/MS. Molecules 2015, 21, 1157. [Google Scholar] [CrossRef] [Scilit]
- Bai, J.; Zou, Q.; Su, H.; Liao, B.; Wang, P.; Huang, J.; Zhang, D.; Gong, L.; Xu, W.; Zhang, J.; et al. Processing of Reynoutria multiflora: Transformation of catechin and gallic acid derivatives and their identification. Front. Pharmacol. 2024, 15, 1356876. [Google Scholar] [CrossRef] [Scilit]
- Mykhailenko, O.; Kovalyov, V.; Goryacha, O.; Ivanauskas, L.; Georgiyants, V. Effective isolation of picrocrocin and crocins from saffron: From HPTLC to working standard obtaining. Molecules 2022, 27, 4286. [Google Scholar] [CrossRef] [Scilit]
- Li, Y.; Shen, Y.; Yao, C.L.; Guo, D.A. Quality assessment of herbal medicines based on chemical fingerprints combined with chemometrics approach: A review. J. Pharm. Biomed. Anal. 2020, 185, 113215. [Google Scholar] [CrossRef] [Scilit]
- Liu, X.; Jiang, W.; Su, M.; Sun, Y.; Liu, H.; Nie, L.; Zang, H. Quality evaluation of traditional Chinese medicines based on fingerprinting. J. Sep. Sci. 2020, 43, 6–17. [Google Scholar] [CrossRef] [Scilit]
- Ma, Q.; Chen, X.; Zhang, K.; Yao, D.; Yang, L.; Wang, H.; Bulemasi, S.; Huang, J.; Wang, J. Chemical fingerprint analysis for discovering markers and identifying Saussurea involucrata by HPLC coupled with OPLS-DA. J. Anal. Methods Chem. 2020, 2020, 7560710. [Google Scholar] [CrossRef] [Scilit]
- Wu, M.; Xiong, Y.; Zhu, L.; Zeweng, Y.; Li, R.; Zhang, J.; Wan, L. A comprehensive method for quality evaluation of Tibetan medicine Synotis solidaginea by integrating UHPLC-Q-Orbitrap MS chemical profiling and UHPLC-DAD multi-components quantification. J. Pharm. Biomed. Anal. 2024, 241, 115983. [Google Scholar] [CrossRef] [Scilit]
- Xiong, Y.; Chen, C.; Deng, X.; Hu, Y.; Liu, H.; Wan, L.; Du, L. Study on quality markers of Tibetan medicine Wuwei Shaji San based on UHPLC-Q-Exactive Orbitrap-MS and network pharmacology multicomponent quantification. Biomed. Chromatogr. 2025, 39, e70036. [Google Scholar] [CrossRef] [Scilit]
- Li, Y.; Yu, B.; Zhao, W.; Pu, X.; Zhong, X.; Tao, X.; Wang, Y.; Cao, W.; Zhang, D. UPLC fingerprinting combined with quantitative analysis of multicomponents by a single marker for quality evaluation of YiQing granules. Front. Chem. 2025, 13, 1632033. [Google Scholar] [CrossRef] [Scilit]
- Zhang, Z.; Chen, L.; Li, X.; Cai, M.; Yan, H.; Sun, G. A quality control system of Chinese medicine preparation based on fingerprint identification technology, chemometrics and network pharmacology, using the Yixinshu capsule as an example. Talanta 2025, 292, 128015. [Google Scholar] [CrossRef] [Scilit]
- Li, Y.; Yang, P.; Qing, H.; Xie, Z.; Zhou, K.; Sun, L.; Chen, M.; Wang, M.; Ren, X. A multimodal strategy for quality control and botanical origin traceability of Codonopsis Radix based on HPLC fingerprints with chemometric analysis. Biomed. Chromatogr. 2025, 39, e70185. [Google Scholar] [CrossRef] [Scilit]
- Wu, J.; Wang, L.; Cui, Y.; Liu, C.; Ding, W.; Ren, S.; Dong, R.; Zhang, J. Development of a quality evaluation method for Allii Macrostemonis Bulbus based on solid-phase extraction-high-performance liquid chromatography-evaporative light scattering detection chromatographic fingerprinting, chemometrics, and quantitative analysis of multi-components via a single-marker method. Molecules 2024, 29, 4600. [Google Scholar] [CrossRef] [Scilit]

Disclaimer/Publisher’s Note: The statements, opinions and data contained in all publications are solely those of the individual author(s) and contributor(s) and not of MDPI and/or the editor(s). MDPI and/or the editor(s) disclaim responsibility for any injury to people or property resulting from any ideas, methods, instructions or products referred to in the content. |
© 2026 by the authors. Licensee MDPI, Basel, Switzerland. This article is an open access article distributed under the terms and conditions of the Creative Commons Attribution (CC BY) license.