


Abstract
Polyethylene wax (PEW) often carries a broad carbon-number distribution (CND) that limits its use in grades with controlled melting point, viscosity, and hardness. This study examines how multistage molecular distillation reshapes PEW composition and how the resulting compositional change is transmitted to fraction properties. An industrial PEW was processed through a wiped-film light-removal step and three short-path distillation stages, yielding five fractions whose normalized yields were 4.03% (PEW-40), 12.16% (PEW-70), 22.26% (PEW-80), 30.33% (PEW-90) and 30.71% (PEW-105). The peak carbon number migrated stepwise from C42 in the feedstock to C21, C37, C42, C50 and C68 in the fractions, and basic wax properties, DSC transition temperatures and TGA mass-loss temperatures moved consistently with the compositional shift. Weighted mean carbon number correlated with drop melting point (R2 = 0.938), kinematic viscosity at 100 °C (R2 = 0.951), penetration (R2 = 0.780) and oil content (R2 = 0.798), and the second-heating melting peak correlated with the 50% mass-loss temperature (R2 = 0.992). These results support a three-level correspondence connecting distillation operation, CND reshaping and fraction properties, and position molecular distillation as a grade-oriented physical process for by-product PEW.
1. Introduction
Polyethylene wax (PEW) is a low-molecular-weight wax-like polyethylene material used as a lubricant in plastics processing, a dispersant for pigments, a modifier in hot-melt adhesives, and an additive in inks and coatings. It reaches the market through several routes. Catalytic ethylene polymerization delivers the majority of commercial PEW, with recent progress in metallocene and non-metallocene systems permitting closer control over molecular weight and branching [1]. Ziegler–Natta processes still underpin much of the industrial production, and the interplay between catalyst design, hydrogen dosage and chain-transfer chemistry sets the chain-length envelope of the resulting material [2]. PEW is also generated as a by-product stream from polyethylene plants, and, increasingly, as a wax cut recovered from the pyrolytic upcycling of waste polyolefins [3]. Whatever its origin, the compositional signature of PEW is dominated by chain-length dispersity, and this dispersity, together with drop melting point, penetration, viscosity, oil content and colour, sets the grade a given batch can be assigned to.
The sensitivity of wax-based products to compositional detail has grown as new applications enter the market. Mid-temperature phase-change materials require a narrow melting window and reproducible latent heat, and their performance is directly limited by the width of the underlying CND [4]. Pyrolytic-wax-modified bitumen relies on a controlled softening profile to balance rutting resistance against low-temperature cracking [5], and life-cycle considerations have added an environmental dimension to material selection [6]. Functionalized PEW acting as a processing additive in filled polyolefins depends on a narrow molecular-weight envelope to deliver consistent rheological modification [7]. A wax that stretches from C20 to beyond C100 cannot satisfy these needs simultaneously, and the practical question is how compositional heterogeneity can be redistributed into product families whose properties are predictable.
Several routes have been explored for converting a broad-distribution wax into narrower fractions. Solvent-based deoiling and crystallization are mature at industrial scale but carry solvent circulation, washing and recovery burdens [8]. Supercritical-fluid fractionation can produce sharp compositional boundaries in some systems yet involves high-pressure hardware that limits uptake [9]. Adsorption on porous materials offers selectivity for petroleum hydrocarbons but is better suited to analytical-scale separations than to grade production [10]. Conventional vacuum distillation, though engineeringly mature, exposes waxy feedstocks with high-boiling points to prolonged thermal load, and heavy-end tailing intensifies as the operating temperature is pushed. Molecular distillation avoids solvents and severe thermal stress. Under high vacuum, the mean free path of vapourizing molecules approaches the evaporator-to-condenser gap, so molecules reach the condenser without appreciable back-collision, and the process does not rely on the multi-stage vapor-to-liquid equilibrium of conventional rectification [11]. The theoretical basis for that regime has been carefully developed [12], and design principles have been consolidated in recent reviews [13]. Short residence time and low operating temperature make the technique particularly suited to high-boiling and thermally sensitive materials, which has been demonstrated across petroleum residues [14], biodiesel purification [15], essential-oil refining [16], cannabinoid extraction [17] and process-scale hemp extract distillation [18].
The applicability of molecular distillation to PEW has been established in principle. Earlier pilot-scale work split a broad-distribution PEW into a light paraffin wax and a super-microcrystalline wax with narrower CND, and mapped the influence of evaporation temperature, condenser temperature and feed rate on distillate yield and product composition [19]. That work produced two product streams from a single fractionation event and left several questions open. Whether a single feedstock can be resolved into more than two grades on the same platform, and how compositional shift is transmitted to physical properties in a way that supports grade-level decisions, have not been systematically explored. Current PEW studies tend to report either yield and CND data or thermal and rheological data, but rarely both on the same feedstock under a shared operating protocol, so whether CND can serve as a quantitative predictor of fraction properties across an entire multigrade series has not been directly tested. Heavy-end retention in single-stage molecular distillation is also imperfect, and the usable properties of a residue depend on how the tail behaves and not only on where the peak sits. This point is reinforced by observations in wax crystallization studies, where alkyl chain length has emerged as the dominant variable in packing and rotator-phase behaviour [20]. Adjacent fractions in any multistage layout should therefore be characterized in terms of both distribution overlap and property continuity, aspects that the current PEW literature only touches on indirectly.
The present work fractionates an industrial PEW into five graded products through a combined wiped-film and three-stage molecular distillation, and examines the correspondence between distillation operation, CND reshaping and fraction properties. Three hypotheses are addressed.
The multistage layout is expected to convert a broad-distribution industrial PEW into five distinguishable carbon-number grades, each with a characteristic peak carbon number and main window.
The compositional reshaping is expected to transmit consistently to basic wax properties, including freezing point, drop melting point, kinematic viscosity, penetration and oil content.
The same reshaping is expected to transmit to differential scanning calorimetry (DSC) melting and crystallization behaviour and to thermogravimetric mass-loss temperatures, so that CND can serve as a quantitative intermediate linking distillation operation to fraction properties.
The evaluation combines high-temperature gas chromatography for CND determination, standard wax testing for basic properties, and DSC and thermogravimetric analysis (TGA) for thermal behaviour. This study is intended to add empirical structure to the composition–property linkage in a multigrade PEW system, and to provide correlation-based indicators that can inform grade-oriented process design. The observations are expected to be useful for process design in wax-grade classification and for property-based grade selection in downstream applications, and to help broaden the scope of molecular distillation from analytical-scale enrichment toward industrial-scale grade formation.
2. Materials and Methods
2.1. Feedstock and Multistage Molecular Distillation
The feedstock used in this work was an industrial by-product PEW collected from the bottom stream of a distillation column in a polyethylene production plant. It covered a carbon-number range from C19 to C111, peaked at C42, and had an apparent weight-average molecular weight of about 726 and a drop melting point of 102.0 °C. These features identify it as a broad-distribution industrial wax rather than a narrow commercial grade.
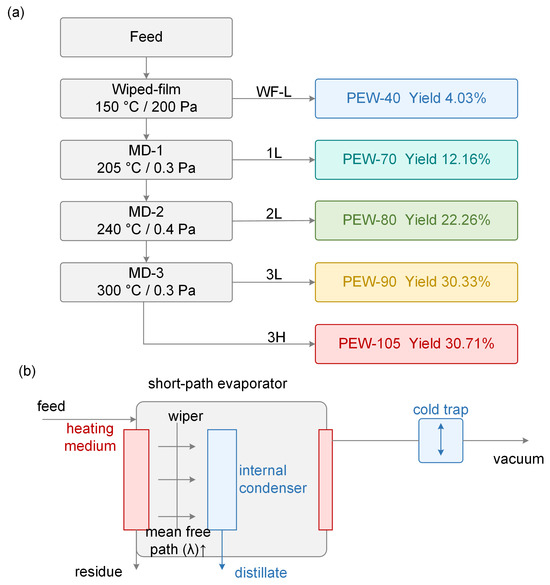
Fractionation was carried out on an SJ100 molecular-distillation system comprising a wiped-film light-removal evaporator followed by three short-path molecular-distillation evaporators arranged in series. Each short-path unit had an evaporation area of 0.1 m2 and an evaporator-to-condenser gap of 8 cm, with a rotating wiper operating at 200 r/min to maintain a thin liquid film on the heated wall. The vacuum system consisted of a dual rotary-vane pump coupled with a diffusion pump, providing an ultimate vacuum of 0.01 Pa and an operating vacuum of 1 to 5 Pa. The short evaporator-to-condenser gap ensures that vaporized molecules reach the condenser surface without appreciable back-collision [11]. The molten feedstock was buffered, pressurized, heat-exchanged and filtered before entering the wiped-film unit through a gear pump. The volumetric feed rate was not independently metered during the campaign, and residence time and film thickness were not directly measured under the operating conditions used; the thermodynamic boundary conditions available for disclosure, namely evaporation temperature, condenser temperature and system pressure, are listed in Table 1. The light phase from that step was collected as PEW-40. The heavy phase was fed sequentially to the three short-path evaporators; the light phases from the first, second and third stages were collected as PEW-70, PEW-80 and PEW-90, and the third-stage heavy phase was collected as PEW-105. Heat was supplied by thermal oil, distillates were captured by internal and external condensers operating at different coolant temperatures, and the system pressure was maintained by a multistage vacuum train. Process parameters and product yields are summarized in Table 1, and the process configuration is shown in Figure 1.
Table 1.
Process parameters and product yields for multistage molecular distillation of by-product PEW.
Figure 1.
Multistage molecular-distillation fractionation of by-product PEW: (a) process flow diagram, where WF denotes the wiped-film unit, MD-1 to MD-3 denote the three short-path stages, L and H denote light and heavy phases, and percentages indicate normalized yields; (b) cross-section of the short-path evaporator, where horizontal arrows indicate the direction of molecular vapour transport from the heated wall to the internal condenser.
Single-stage yield is the mass of each product divided by the mass of the feed entering that stage, and normalized yield is the mass of each product divided by the total feedstock mass entering the wiped-film unit. For PEW-40, these two values are identical. For PEW-70, the single-stage yield of 12.67% was multiplied by the mass fraction of material entering the three-stage section after wiped-film light removal (95.97%), giving a normalized yield of 12.16%; the same correction was applied to all downstream products. The five normalized yields sum to 99.49%; the small residual reflects rounding and the mass-balance basis of the original data. Among the operating variables, evaporation temperature governs the volatilization rate of light components and the depth of cut; vacuum controls the mean free path and the apparent boiling-point depression; and condenser temperature affects distillate capture. Feed rate and wiper speed jointly determine film thickness, residence time and heat and mass transfer. For a high-boiling waxy feedstock such as PEW, stable film renewal, short-path mass transfer and short residence time help to limit local overheating, heavy-component entrainment and thermal degradation [19].
2.2. Carbon-Number Distribution Analysis
CND was measured by high-temperature gas chromatography on an Agilent 7890 system (Agilent Technologies, Santa Clara, CA, USA) equipped with a flame ionization detector. Separation was carried out on an Agilent DB-1HT high-temperature capillary column (5 m by 0.53 mm by 0.15 μm) with an upper operating limit of 430 °C. Nitrogen served as the carrier and make-up gas at 5 and 25 mL/min, and the detector combustion gases were hydrogen at 40 mL/min and air at 400 mL/min. The oven programme held at 40 °C for 5 min and ramped to 400 °C at 10 °C per minute, with a 5 min hold at the upper limit; the detector was maintained at 420 °C. Peak assignment used n-paraffin reference standards, and the discrimination between normal and iso-paraffins followed the Chinese national standard SH/T 0653-1998 [21] for carbon-number distribution analysis of petroleum waxes. High-temperature gas chromatography has become an established tool for the compositional characterization of high-boiling waxy hydrocarbon streams [22].
For each fraction, the detected abundance at each carbon number was normalized to as expressed by
The weighted mean carbon number and weighted standard deviation were calculated as
The 10–90% cumulative width of each distribution was also recorded. To evaluate the sharpness of the boundary between adjacent fractions, an overlap coefficient was defined as
where and are the normalized abundances of samples A and B at carbon number ; a smaller overlap coefficient indicates a sharper CND boundary. Main-window statistics were computed for C at most 29, C30 to C44, C45 to C59, C at least 60, and C at least 70 to identify the dominant compositional segment of each grade [12].
2.3. Basic Wax Property Analysis
Freezing point, drop melting point, penetration, kinematic viscosity at 100 °C, oil content and Saybolt colour were measured following standard petroleum-wax protocols (ASTM D938 [23], ASTM D127 [24]/GB 8026 [25], ASTM D1321 [26]/GB 4985 [27], ASTM D445 [28]/GB 265 [29], ASTM D721 [30]/GB 3554 [31] and ASTM D156 [32], respectively). These indicators have been used consistently in wax-grade characterization to reflect melting range, hardness and low-molecular-weight-fraction content [8]. Apparent number-average molecular weight was estimated from the CND-based chain-length distribution.
2.4. DSC and TGA
Thermal transitions were measured on a TA Instruments DSC 25 calorimeter (TA Instruments, New Castle, DE, USA) under 50.0 mL/min of nitrogen. The feedstock and fractions PEW-70 through PEW-105 were subjected to a first heating from 25 to 130 °C at 10 K per minute, cooling from 130 to 25 °C at −10 K/min, and a second heating from 25 to 130 °C at 10 K per minute; sample masses ranged from 5.35 to 5.73 mg. PEW-40 required a lower temperature window from −30 to 60 °C because of its low melting range and was therefore not grouped with the others. Peak positions were read at the maxima of the endothermic melting or exothermic crystallization events, and enthalpies were obtained by instrumental integration. The two-heating-and-one-cooling protocol is a standard approach for wax systems to isolate the effect of thermal history and identify composition-controlled transitions [33].
TGA was performed on a TA Instruments Discovery TGA 55 analyser (TA Instruments, New Castle, DE, USA) for PEW-70 through PEW-105. Approximately 9.4 to 9.6 mg of sample was heated from 30 to 800 °C at 10 °C per minute under 50.0 mL/min of nitrogen. The temperatures at 1, 5, 10, 50 and 90% mass loss were obtained by linear interpolation of the TG curve, and the peak temperature of the maximum mass-loss rate was read from the derivative thermogravimetric (DTG) curve. Residual mass at 600 °C was recorded for auxiliary comparison. This set of characteristic temperatures, together with the maximum mass-loss rate, has been widely used to characterize the thermal-stability profile of paraffinic systems [34]. All DSC and TGA measurements were performed as single determinations (n = 1). The manufacturer-specified temperature accuracy of the DSC 25 after standard calibration is ±0.1 °C with an enthalpy precision within ±1%, and the Discovery TGA 55 has a temperature accuracy of ±1 °C with a mass accuracy of ±0.01%. The property differences observed among fractions in this study, such as the 26.8 °C span in the second-heating melting peak from PEW-70 to PEW-105 and the 110.8 °C span in 50% mass-loss temperature, exceed the instrument uncertainty by one to two orders of magnitude. The R2 values are therefore treated as exploratory indicators of trend direction rather than as statistically validated model parameters, given that the small number of data points precludes formal confidence-interval estimation.
2.5. Data Processing and Correlation Analysis
Mass-balance closure between the yield-weighted CND of the recovered fractions and the CND of the feedstock was used as an internal-consistency check. Linear regressions were performed between weighted mean carbon number and drop melting point, kinematic viscosity, penetration and oil content across the graded series; the coefficient of determination R-square is reported as an exploratory indicator of monotonic transmission from composition to property rather than as a predictive model. The same regression was also carried out between the second-heating melting peak and the 50% mass-loss temperature to assess the coupling between the melting-temperature region and the main mass-loss region across the graded series [20].
3. Results and Discussion
3.1. Product Distribution of Multistage Molecular Distillation
The multistage layout produced five fractions whose yields increased at higher grades. PEW-90 and PEW-105 together accounted for about 61.04% of the total feed, whereas PEW-40 and PEW-70 contributed only 16.19%. This distribution mirrors the compositional profile of the feedstock, in which mid- to heavy-chain lengths dominate, and low-carbon-number components form a smaller share.
Evaporation temperature increased stepwise from 150 °C in the wiped-film stage to 300 °C in the third short-path stage, while condenser temperature rose from 40 to 100 °C. This gradient tracks the drop in volatility with rising chain length. Under the operating pressures used, the ratio between mean free path and geometric gap remains in the regime where evaporated molecules reach the condenser with limited back-collision, which is the mechanistic feature that allows high-boiling and viscous waxy materials to be resolved within a short residence time [11]. The theoretical treatment of this regime, together with the practical implications for evaporator design, has been discussed for petroleum and waxy systems in earlier work on hydrodynamic parameters [14].
An internal-consistency check based on yield-weighted CND supports the reliability of the fractionation. The yield-weighted mean carbon number, 53.75, differs from the feedstock value of 51.71 by only 3.95%, and the yield-weighted apparent molecular weight of 754.79 differs from the feedstock value of 726 by 3.97%. The yield-weighted drop melting point, however, is 92.4 °C against the feedstock value of 102.0 °C, a discrepancy that reveals the non-additive nature of macroscopic transitions in wax mixtures. Co-crystallization between chain-length populations, heavy-end tail contributions and mixing effects influence the observable melting point in ways that a simple linear-weighting scheme cannot capture, an issue that has also been discussed in studies of long-chain n-alkane wax microstructure [35]. Yield-weighted quantities are therefore treated here as tools for balance verification, while the physical evaluation of the process is placed on CND-derived indicators and directly measured properties.
The methodological positioning of this study relative to earlier PEW molecular-distillation work is worth stating. Pilot-scale fractionation into two product streams has been shown feasible, with response-surface exploration of operating variables providing an optimization framework [19]. The present work does not attempt a multifactor optimization on the same feedstock. Operating conditions are fixed, and the focus is placed on how a multigrade fractionation redistributes the CND and how that redistribution transmits to fraction properties. This orientation is aligned with the broader observation that grading, rather than single-cut separation, is the practical requirement for wax utilization in downstream applications where product families must span a range of melting points and viscosities. Similar reasoning has motivated the analytical study of waxy products recovered from plastic-waste pyrolysis, which showed that the intended use of the wax should be considered when characterization protocols are selected [22].
3.2. Carbon-Number Distribution Reconstruction of Fractions
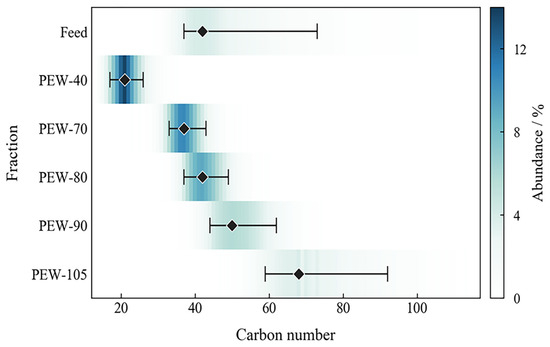
The CND profiles of the feedstock and the five fractions are illustrated in Figure 2, and the distribution parameters are compiled in Table 2.
Figure 2.
Carbon-number distribution (CND) heat map of the feedstock and the five fractions.
Table 2.
Carbon-number distribution parameters of the feedstock and fractions.
As shown in Figure 2, the peak carbon number migrated stepwise from C42 in the feedstock to C21, C37, C42, C50 and C68 in PEW-40 through PEW-105, and the weighted mean carbon number rose monotonically from 21.60 to 73.55. The distribution parameters and concentration indicators are compiled in Table 2.
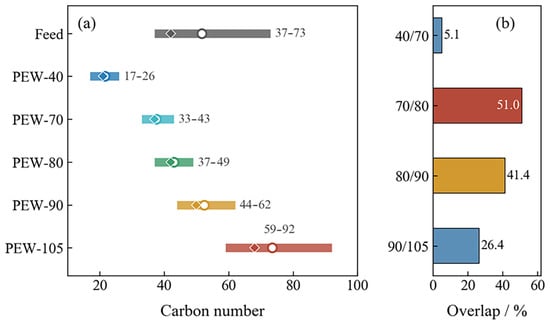
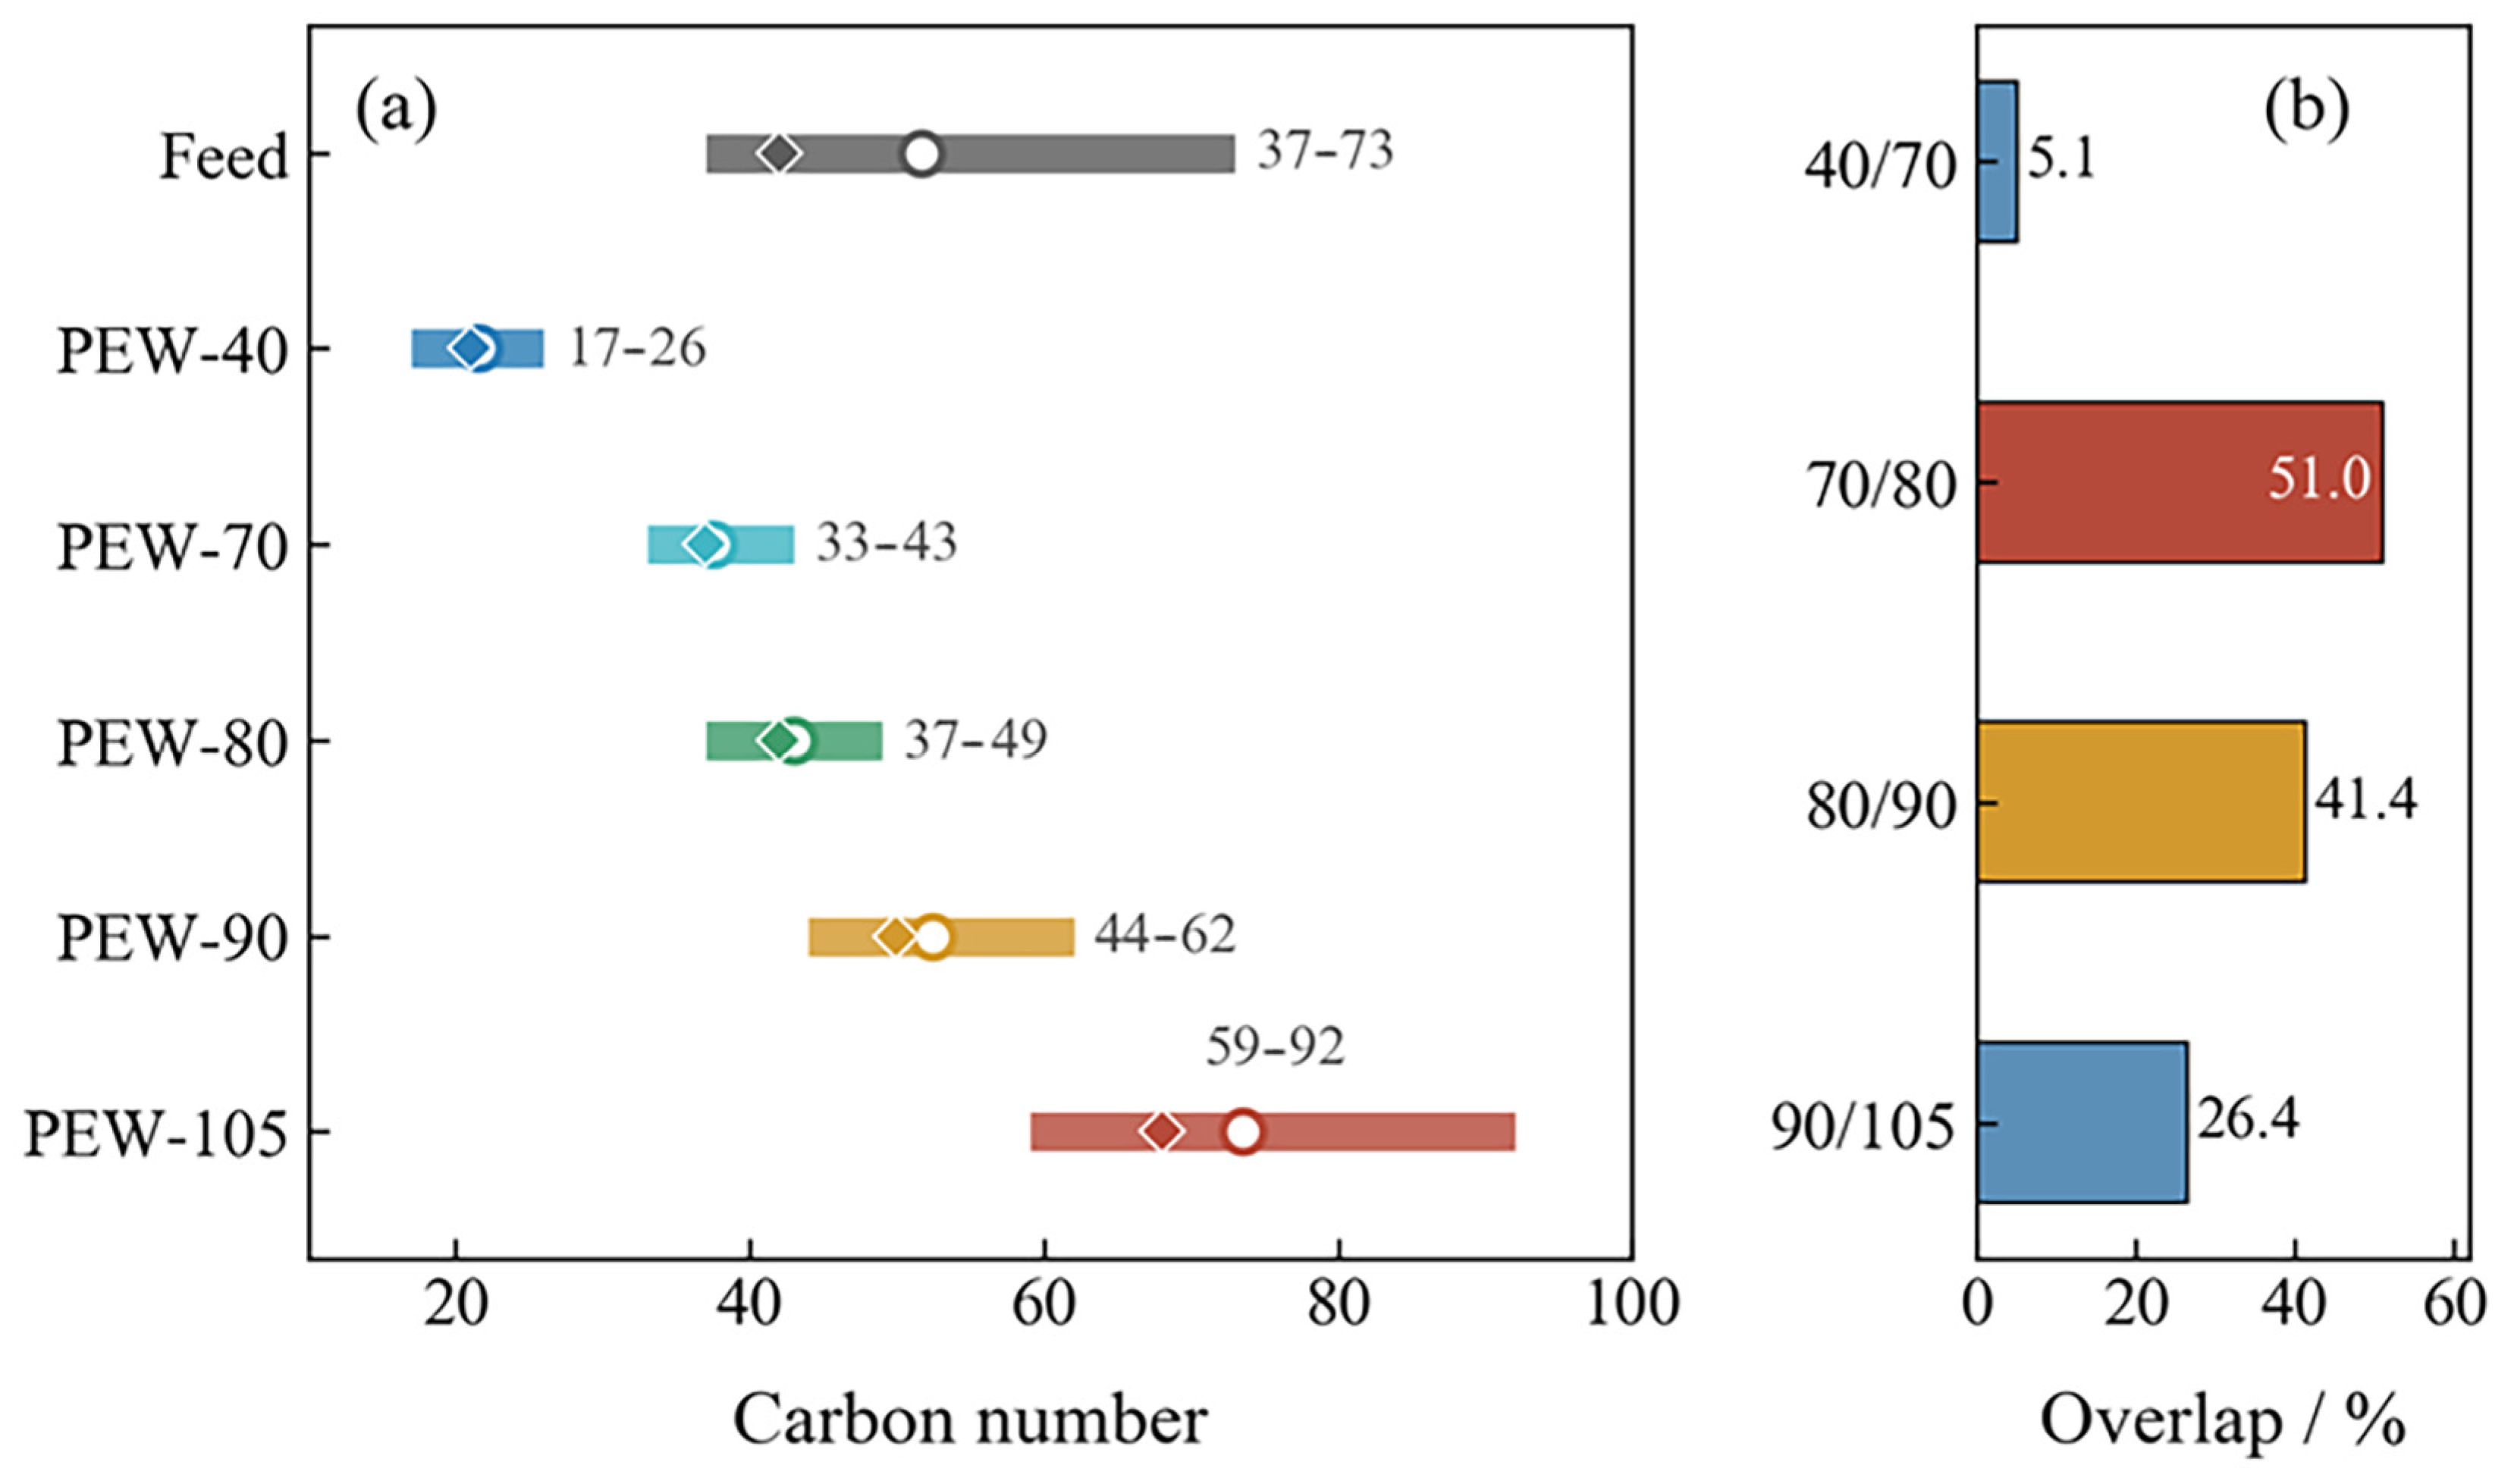
PEW-40 through PEW-90 showed a 10 to 90% cumulative width of 9 to 18, corresponding to a 50.0 to 75.0% reduction relative to the feedstock. Peak abundances reached 5.77 to 13.63%, several times the value observed in the feedstock, indicating that the light and intermediate fractions had been concentrated within tighter carbon-number windows. PEW-105 retained a comparatively broad distribution with a 10 to 90% width of 33 and a maximum detectable carbon number of C117, consistent with its identity as a third-stage heavy fraction that inherits the residual high-carbon tail of the feedstock. The concentration parameters and the migration of peak carbon numbers are further visualized in Figure 3. As shown in Figure 3a, the shift in peak carbon number and the narrowing of main windows can be tracked simultaneously across the five fractions. The overlap coefficients presented in Figure 3b provide a further indicator of separation clarity between adjacent grades.
Figure 3.
Characteristic parameters of carbon-number distributions: (a) 10 to 90% main windows (horizontal bars), weighted mean carbon numbers (open circles) and peak carbon numbers (filled diamonds); (b) adjacent-fraction overlap coefficients.
Main-window statistics reveal that PEW-40 was dominated by components with C at most 29, accounting for 96.95%, corresponding to the low-carbon wax fraction removed in the wiped-film step. PEW-70 contained 92.34% of components in the C30 to C44 window. PEW-80, although sharing a peak carbon number of C42 with the feedstock, already carried 33.49% of components in the C45 to C59 window, and therefore differed substantially from the feedstock in main-window terms. PEW-90 shifted its dominant window from C45 to C59 with 72.63%, while PEW-105 concentrated 88.99% of its material in the ≥C 60 range and 56.73% in the ≥C 70 range. This progression suggests that grade classification cannot be reduced to peak carbon number alone. The main compositional window and the extent of high-carbon tail retention together define the identity of each grade, which is consistent with the perspective in earlier paraffin-wax fractionation studies that distribution boundaries carry as much information as peak positions [9]. Related observations on wax crystal microstructure have shown that even a small variation in chain-length distribution can shift the packing motif significantly [36], reinforcing the argument that distribution features beyond the peak deserve attention.
Adjacent-fraction overlap coefficients provide a further indicator of separation clarity. The overlap between PEW-40 and PEW-70 was 5.10%, and their 10-90% windows did not intersect, indicating that the wiped-film step effectively isolated the lightest cut. In contrast, the overlap between PEW-70 and PEW-80 reached 51.01%, and that between PEW-80 and PEW-90 reached 41.36%, with intersecting main-window ranges from C37 to C43 and C44 to C49. These figures do not indicate inefficient separation, but rather that the intermediate fractions are members of a continuous carbon-number series with progressively shifting windows. Each grade is distinguishable through its peak and main window even where tails overlap. Between PEW-90 and PEW-105, the overlap dropped to 26.39%, reopening a compositional boundary at the heavy-end grade. The mixed pattern, with sharp light-end and heavy-end boundaries and continuous transitions in the middle, is consistent with the general behaviour of multistage volatility-driven separations. Adjacent long-chain hydrocarbons possess only small differences in vapour pressure, so any physical separation must accommodate a certain degree of tail overlap while still producing distinguishable main windows.
From a mechanistic viewpoint, the observed CND reshaping is compatible with chain-length-dependent vaporization. Shorter chains carry higher vapour pressures and preferentially enter the light phase at each stage. As evaporation temperature is raised in successive stages, progressively longer chains reach the volatility threshold and migrate into the corresponding light stream, while the longest components remain in the final heavy fraction because their vapour pressures are too low for the operating window. This picture is consistent with observations in petroleum-residue molecular distillation, where sequential stages have been used to generate fraction families with progressively shifted average molecular weights [37]. It also explains why the highest-grade fraction retains a broad tail even after upstream light removal, a phenomenon that has been reported for waxy products in general [22].
The normal-to-iso composition of the fractions further constrains the mechanistic interpretation. The feedstock contained 90.72% normal paraffins, and the fractions ranged from 89.36 to 94.94%, with PEW-40 exhibiting the highest normal content. This narrow variation of 5.58 percentage points indicates that molecular distillation was not selective toward chain architecture and that separation proceeded through volatility differences rather than preferential elimination of branched species. The near-constant normal-paraffin fraction across grades rules out a progressive enrichment or depletion of branched chains as the driver of property trends. The monotonic evolution of drop melting point, kinematic viscosity, penetration and oil content with weighted mean carbon number is consistent with chain length as the governing variable, because structural rearrangement would be expected to produce discontinuities in at least some indicators. The single-region DTG profiles observed for all fractions, together with residual masses below 1.3% at 600 °C, confirm that the fractions differ primarily in carbon-number envelope rather than in backbone chemistry. These observations place the source of property variation in chain-length redistribution, although minor contributions from iso-paraffin content cannot be fully excluded.
3.3. Relationship Between CND and Basic Wax Properties
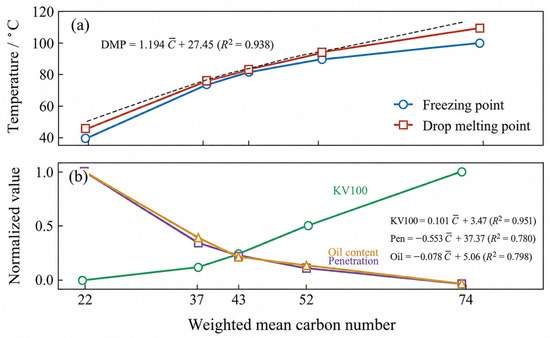
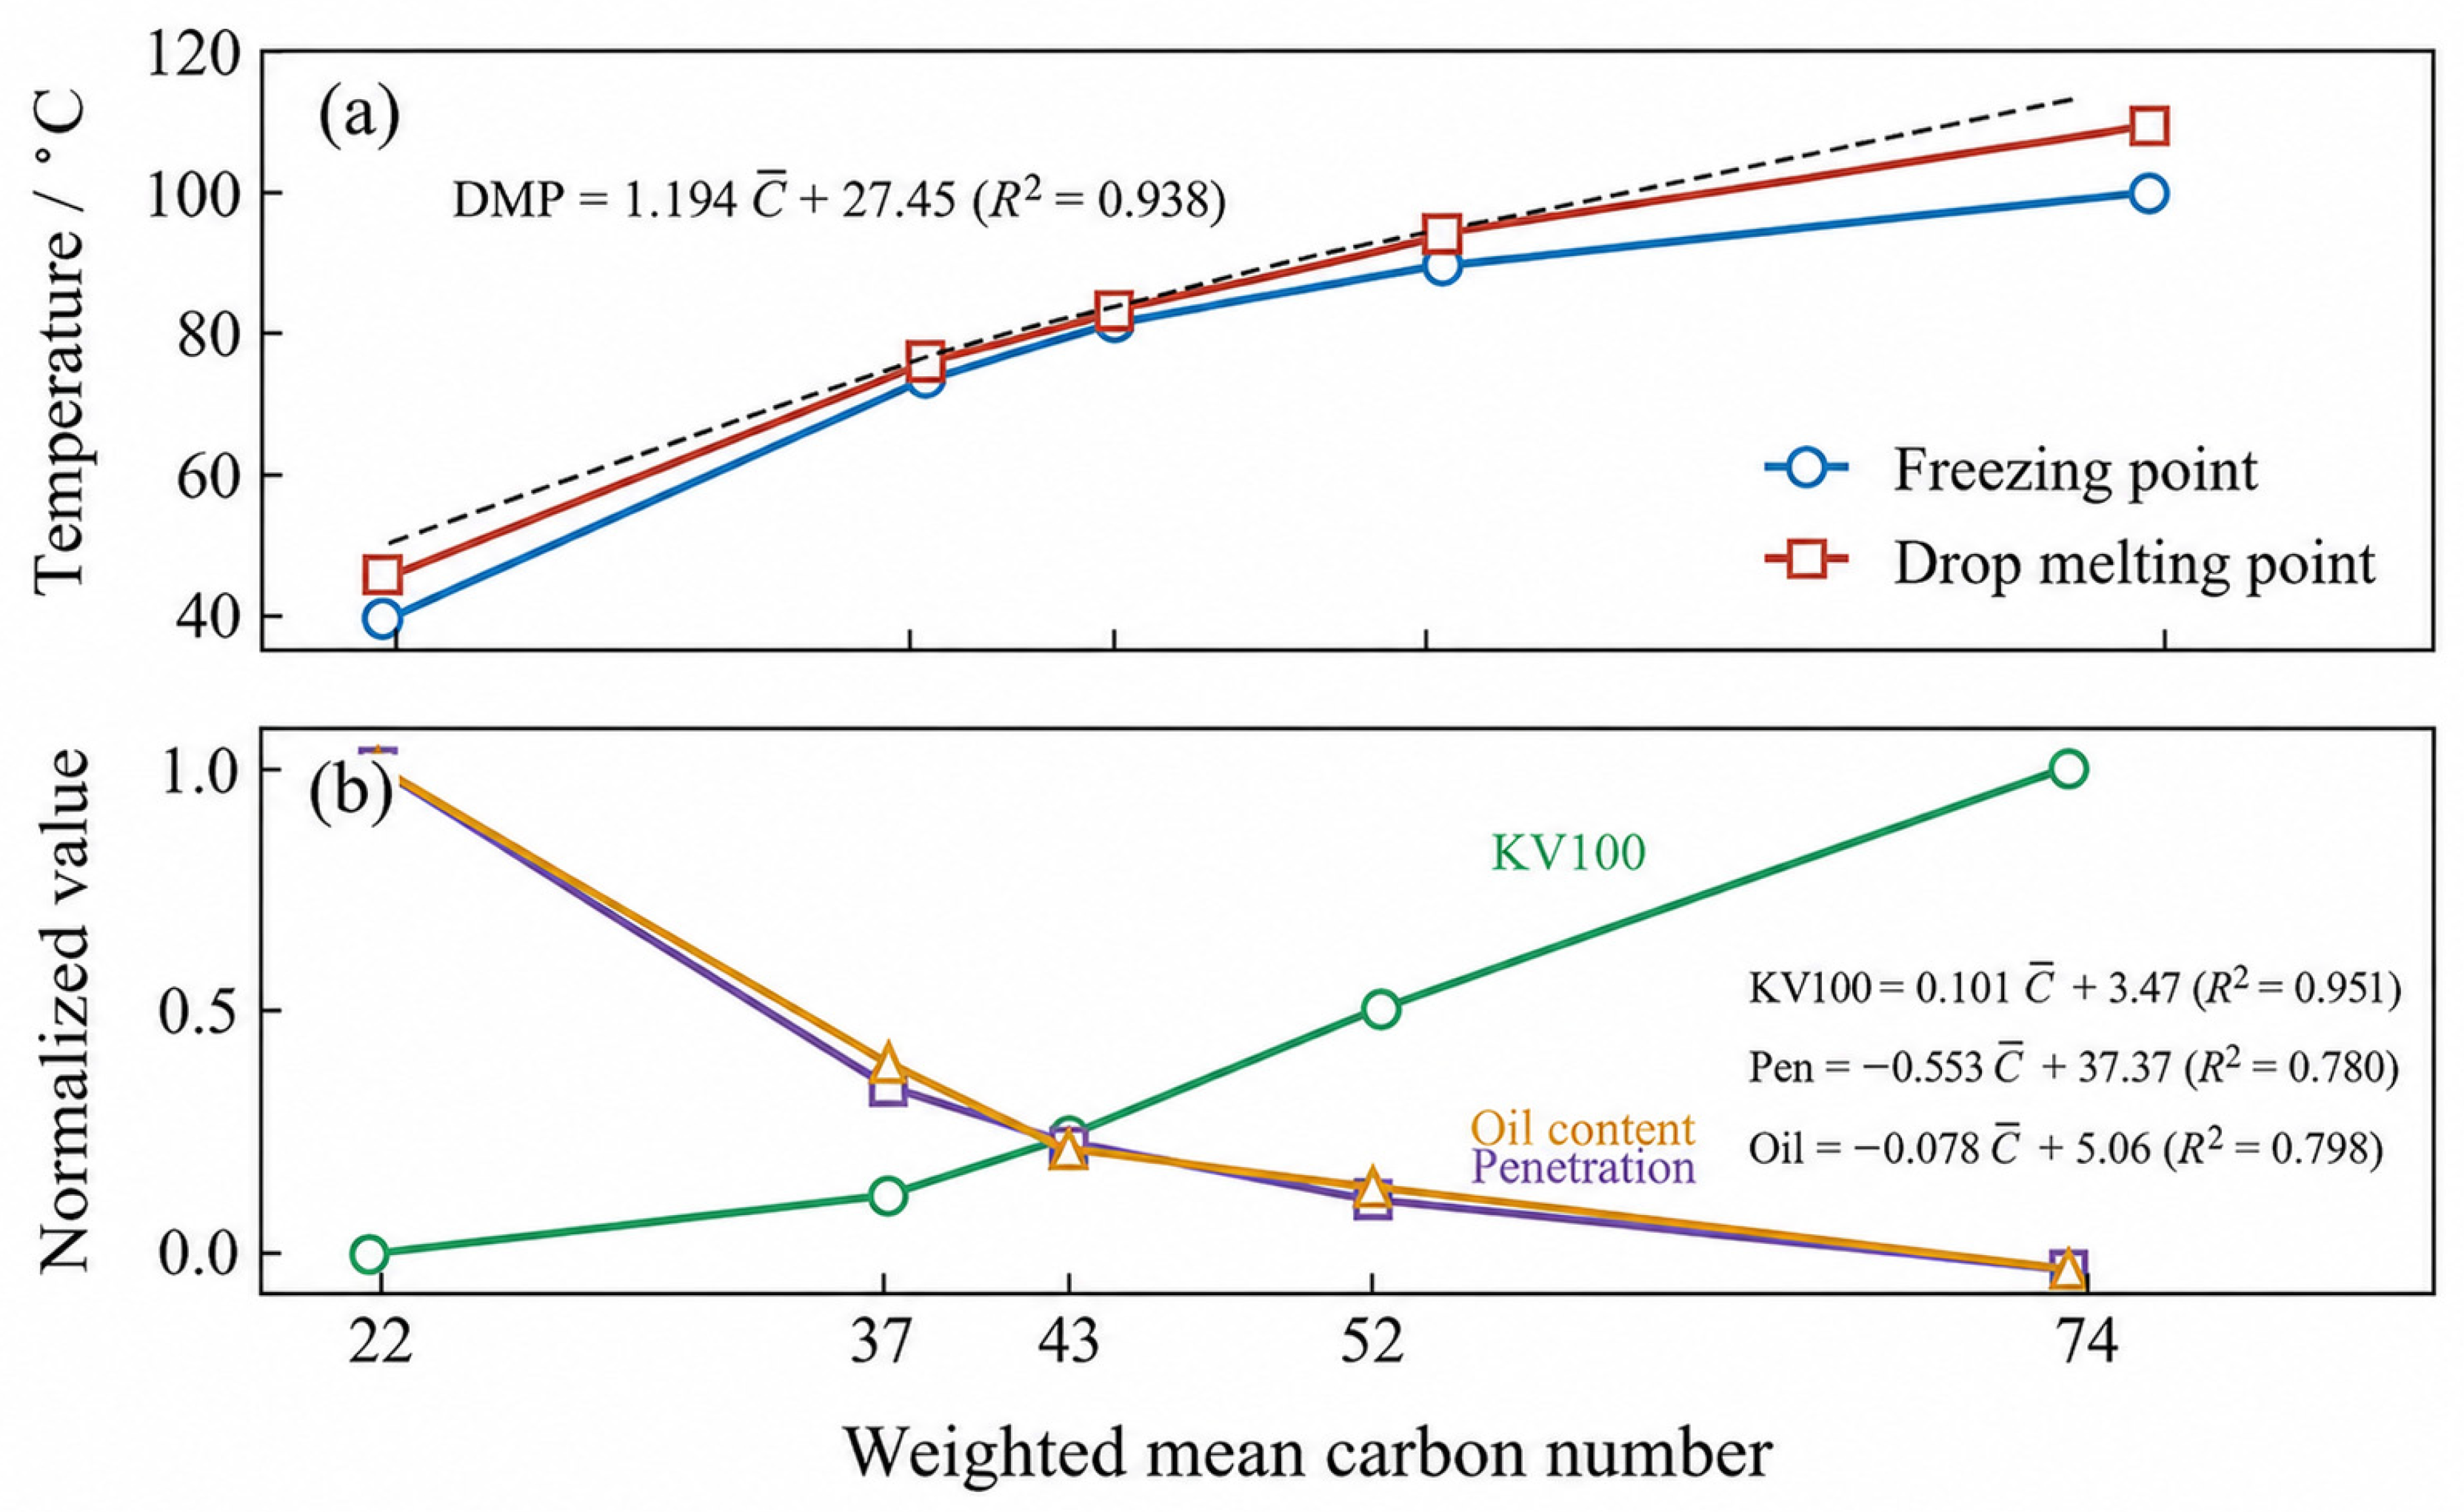
The basic properties of the feedstock and the fractions are summarized in Table 3, and the variation in these properties from PEW-40 to PEW-105 is shown in Figure 4. As shown in Figure 4a, the freezing point increased from 40 °C in PEW-40 to 100 °C in PEW-105, and the drop melting point rose from 46.0 to 109.6 °C. Figure 4b indicates that kinematic viscosity at 100 °C climbed from 6.20 to 11.20 mm2/s along the same series, while penetration decreased from 32.5 to 1.8 and oil content fell from 4.30% to essentially zero. Saybolt colour also improved from PEW-40 to PEW-105, dropping from 26 to 12.
Table 3.
Basic wax properties of the feedstock and fractions.
Figure 4.
Basic wax properties from PEW-40 to PEW-105: (a) freezing point (open circles) and drop melting point (open squares), with the dashed line indicating the linear regression fit for drop melting point; (b) normalized changes in kinematic viscosity at 100 °C (KV100, open circles), penetration (open triangles) and oil content (open squares), with regression equations annotated. Each property in (b) is normalized to its PEW-40 value.
The magnitude of the property change is not evenly distributed. PEW-40, although accounting for only 4.03% of the feedstock by mass, exhibited the highest penetration, the highest oil content and the lowest melting point. This indicates that the small population of low-carbon components exerts a disproportionately strong effect on softness, oil-carrying capacity and low-temperature melting. From PEW-70 to PEW-105, properties evolved continuously, with the transition between PEW-90 and PEW-105 showing the sharpest gain in melting point and viscosity. This step corresponds to the entry of the C at least 60 population into the dominant window, consistent with the notion that heavy-end enrichment governs melt-flow resistance more strongly than a further rise in the peak position of the mid-range fractions. Related work on wax solutions has provided complementary evidence that phase-dependent transport becomes increasingly sensitive to the heavy-end population once its share in the mixture rises above a threshold [38].
Exploratory linear regressions between weighted mean carbon number () and the four principal wax indicators across the five fractions yielded drop melting point = 1.194 + 27.45 (R2 = 0.938), kinematic viscosity at 100 °C = 0.101 + 3.47 (R2 = 0.951), penetration = −0.553 + 37.37 (R2 = 0.780) and oil content = −0.078 + 5.06 (R2 = 0.798). Drop melting point and viscosity moved in the same direction as chain length, while penetration and oil content moved in the opposite direction. The regressions are exploratory rather than predictive, but they establish that composition-to-property transmission is directional and monotonic across the entire multigrade series. This matters because a broad-distribution feedstock does not automatically transmit compositional change into consistent property change. The fact that all five grades follow the same relationship suggests that molecular distillation has redistributed the CND without introducing structural artefacts that would decouple composition from property.
Mechanistically, the observed property trends can be linked to chain-length-dependent packing and dispersive interactions. Longer paraffinic chains carry more methylene units capable of forming ordered lamellar stacks in the solid state, which raises the energy required for melting and shifts the transition to higher temperatures. In the molten state, longer chains present greater hydrodynamic resistance, resulting in higher kinematic viscosity. At room temperature, the reduced flexibility and stronger packing of long-chain crystals resist needle indentation, so penetration falls. Oil content, defined operationally as the low-melting fraction that resists precipitation, drops because the low-carbon components have been physically removed. This chain-length picture is consistent with the mechanistic framework built up in wax-crystallization studies, where alkyl chain length has been identified as the dominant variable in crystal packing and interaction with wax-modifying additives [20]. The present observations extend that reasoning from single-additive systems to a multigrade PEW series and support the view that a graded CND produces a graded property response along a common mechanistic axis.
These correlations are based on five fractions from a single feedstock under one set of operating conditions and should be read as descriptive trends rather than predictive models. The R2 values of 0.780 to 0.951 indicate that weighted mean carbon number accounts for a substantial share of property variance within this multigrade series, yet they do not constitute a validated tool for arbitrary PEW feedstocks. Feedstocks with different branching contents, molecular-weight distributions or oxidation histories may introduce property contributions not captured by a carbon-number metric alone, and generalizability remains to be tested.
3.4. Relationship Between CND and DSC Melting and Crystallization Behaviour
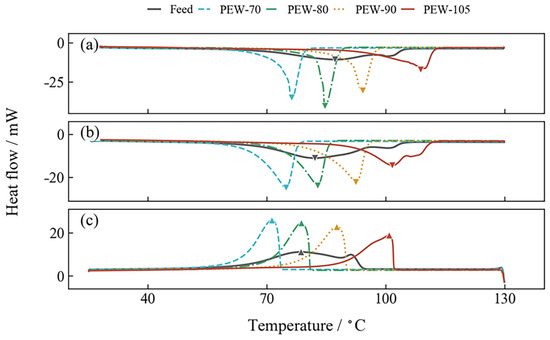
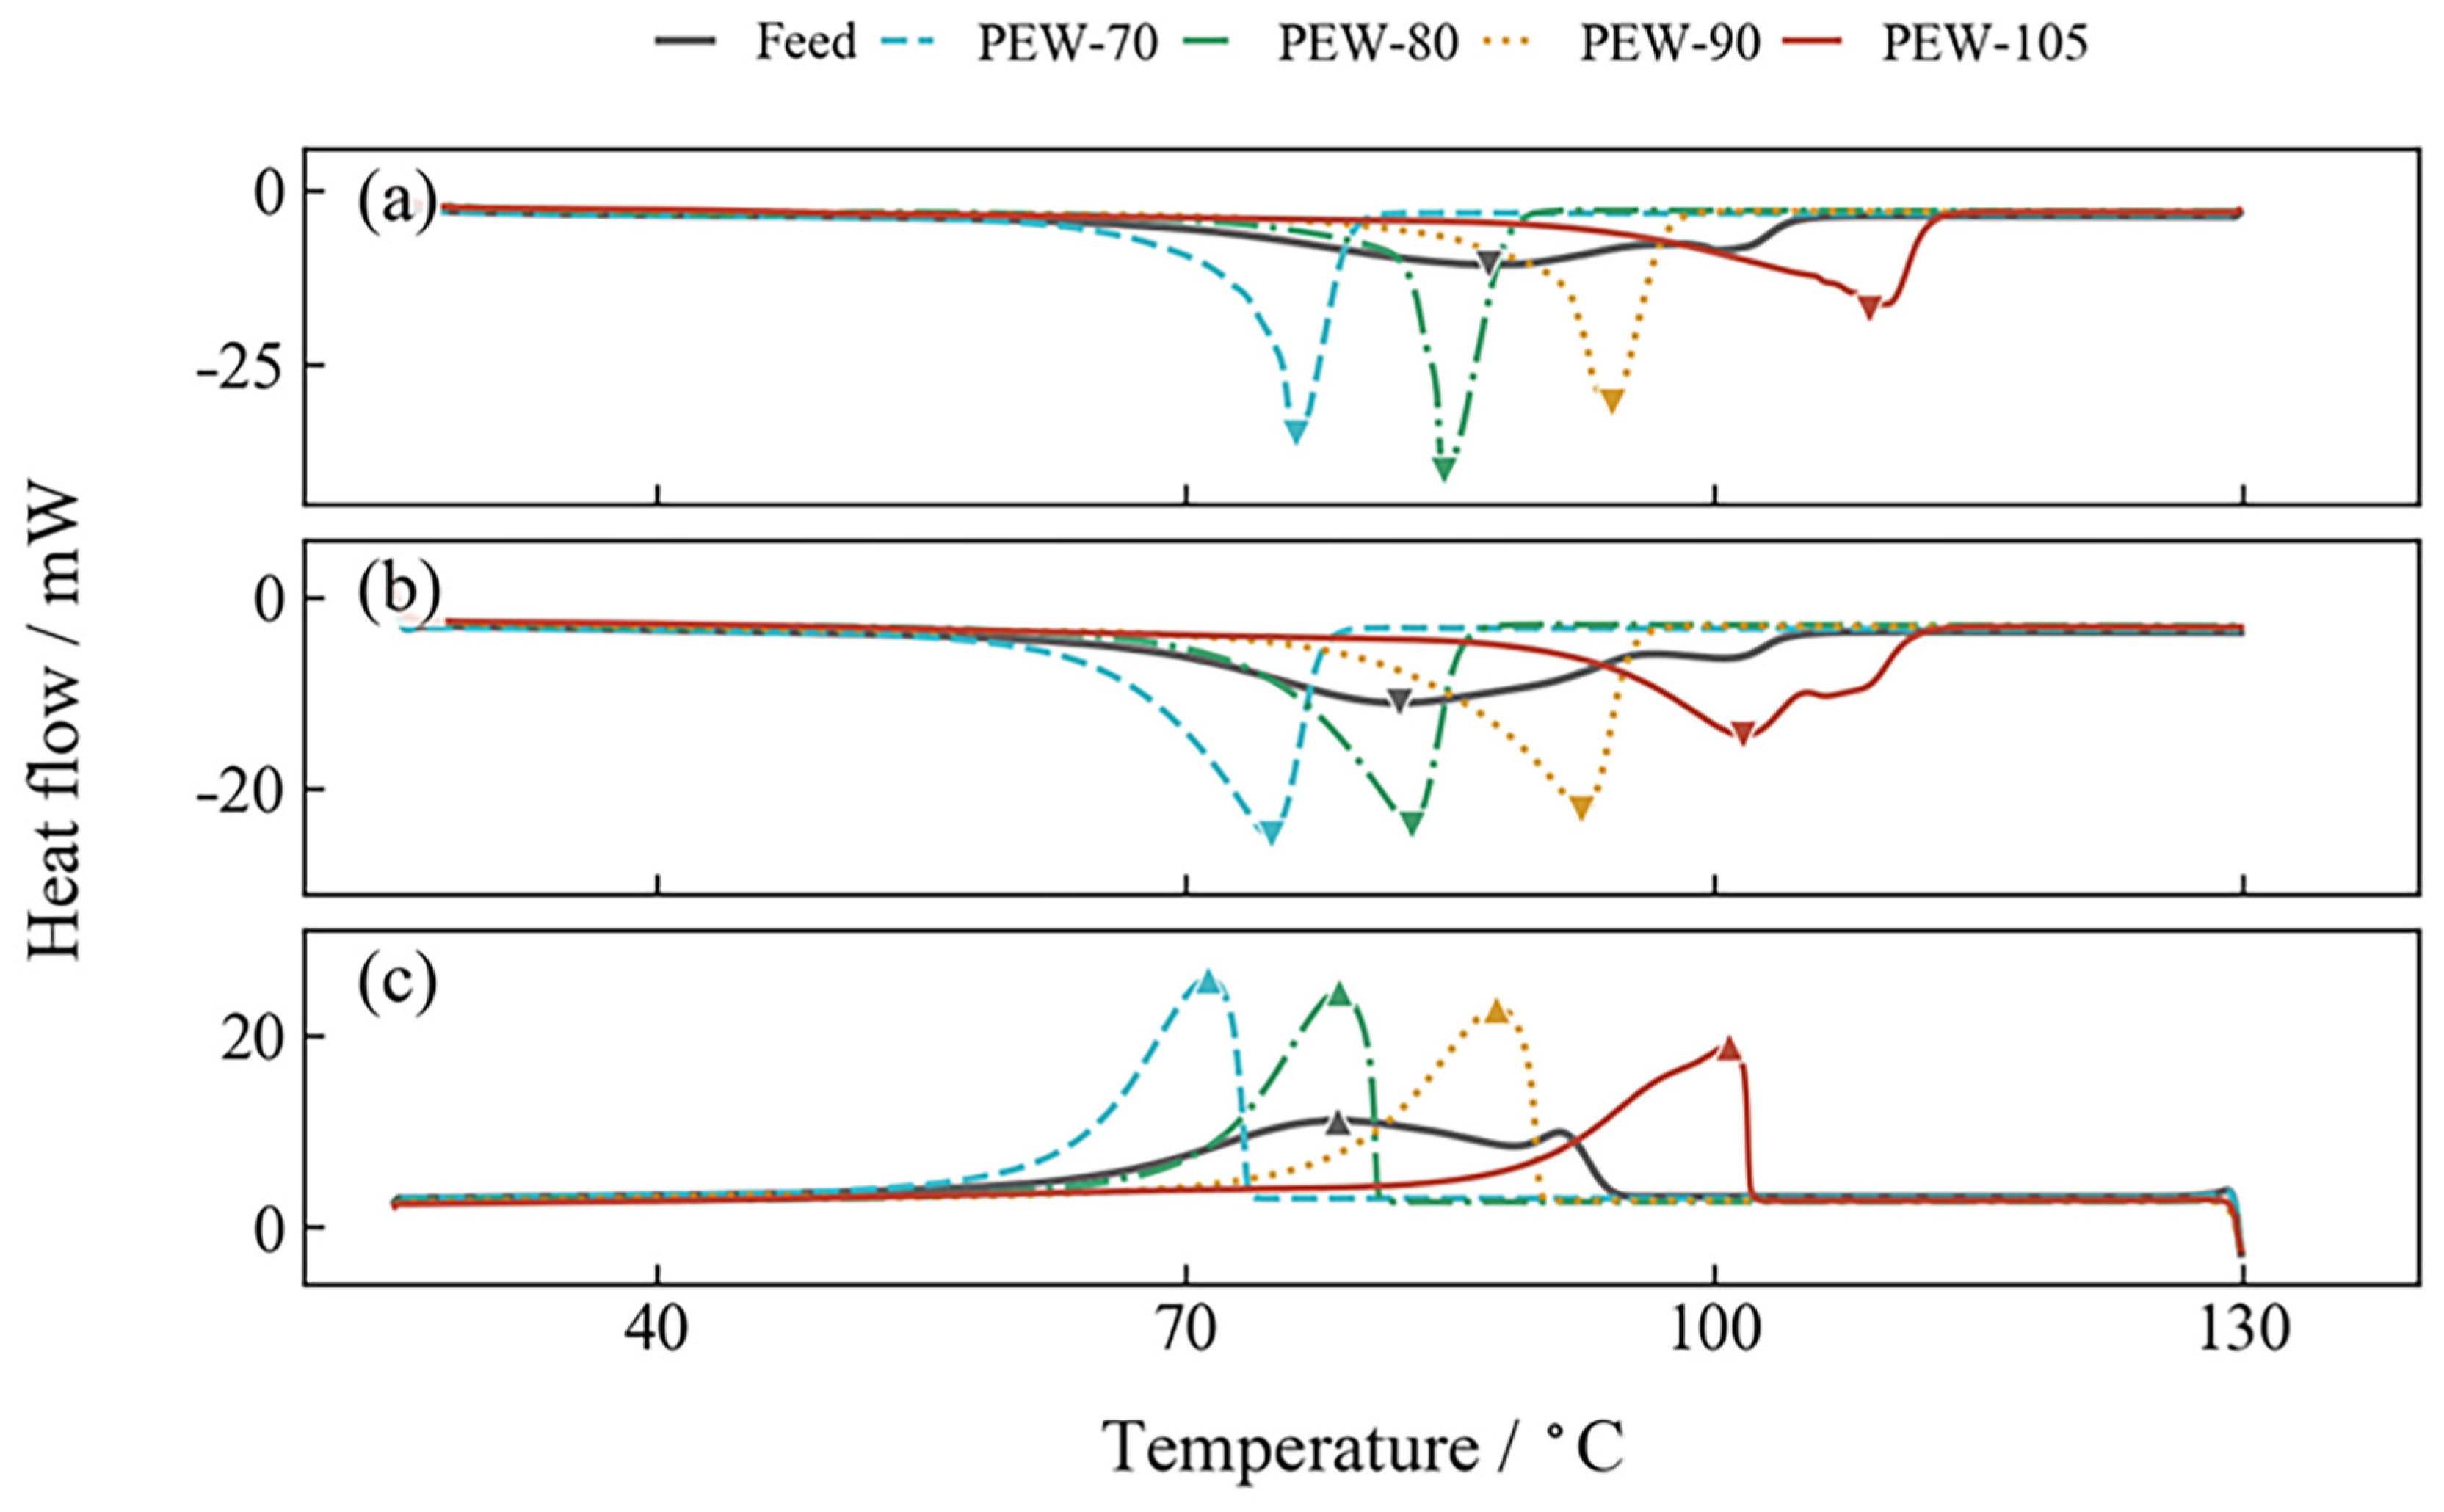
DSC peak temperatures and enthalpies for the feedstock and fractions PEW-70 through PEW-105 are summarized in Table 4, and the corresponding thermograms are shown in Figure 5.
Table 4.
DSC peak temperatures and enthalpies of the feedstock and selected fractions.
Figure 5.
DSC thermograms of the feedstock and fractions: (a) first heating; (b) second heating; (c) cooling. Downward arrows mark the peak positions, with colors corresponding to each sample as identified in the legend.
As shown in Figure 5b, the second-heating melting peak (Tm,2) was chosen as the primary comparison indicator because it reflects melting behaviour under a standardized thermal history. From PEW-70 to PEW-105, Tm,2 increased from 74.9 to 101.7 °C, and the cooling crystallization peak Tc increased from 71.3 to 100.9 °C. These shifts tracked the migration of the peak carbon number and the rise in drop melting point closely. The regression between weighted mean carbon number and Tm,2 yielded an R-square of 0.927; between weighted mean carbon number and Tc, the R-square was 0.974; and between Tm,2 and drop melting point, the R-square was 0.981. The consistency across these indicators supports the interpretation that CND redistribution has been transmitted into the crystalline behaviour of the graded products.
By contrast, the second-heating enthalpy varied only between 198.18 and 206.15 J per g. Normalized to PEW-70, the enthalpy gains for PEW-80, PEW-90 and PEW-105 were 1.9, 3.3 and 4.0%, respectively, values considerably smaller than the accompanying rise in melting temperature. This decoupling between peak temperature and integrated enthalpy suggests that fractionation primarily reshapes the temperature region of melting and crystallization rather than the total crystallizable fraction. From a chain-length standpoint, longer chains produce thicker lamellae with higher melting points but do not necessarily produce more crystalline material per unit mass, especially in a system where the majority of chains are already sufficiently long to crystallize efficiently. This behaviour is consistent with earlier observations on PEW thermal analysis, in which composition-related shifts in melting temperature outweighed corresponding shifts in enthalpy [33].
The difference between first-heating and second-heating peak temperatures is instructive. For PEW-70 through PEW-90, Tm,1 exceeded Tm,2 by only 1.5 to 1.8 °C, whereas for PEW-105 the difference reached 7.2 °C. This asymmetry suggests that the crystalline state of the heavy fraction is more sensitive to its thermal history and to the pre-existing morphology developed during recovery. Long-chain paraffinic components can form thicker lamellae under slow cooling, and once such structures exist, they melt at higher temperatures than the reformed lamellae produced after standardized cooling. This effect has been probed in polyolefin systems through successive self-nucleation and annealing protocols, which resolve populations of lamellae according to their thermal stability [39]. Fast implementations of the same protocol have made the approach practical for routine characterization of recycled polyolefin blends [40]. Temperature-modulated DSC has also proved useful in resolving overlapping transitions in blend systems that resemble the mixed compositions encountered here [41]. The present data do not resolve individual lamellar populations, but the observed sensitivity of the heavy fraction to thermal history is consistent with the presence of a broader distribution of lamellar thicknesses inherited from the wider carbon-number range.
The DSC behaviour adds an independent line of evidence that CND redistribution translates into measurable thermal response, complementing the drop-melting-point data collected under standard petroleum-wax methods. Where drop melting point is an aggregate indicator of the temperature at which a wax loses shape, DSC melting resolves the transition thermodynamically and permits the additional observation that the transition width and enthalpy remain in a narrow range across grades. Together, these two indicators show that grading has produced products differing in the temperature location of melting more than in its total heat content, an outcome that is directly relevant to phase-change-material applications where the operating window is defined by transition temperature and enthalpy jointly [42]. Similar coupling has been documented for wax-based systems recovered from plastic pyrolysis [43].
3.5. Relationship Between CND and TGA/DTG Thermal Mass-Loss Behaviour
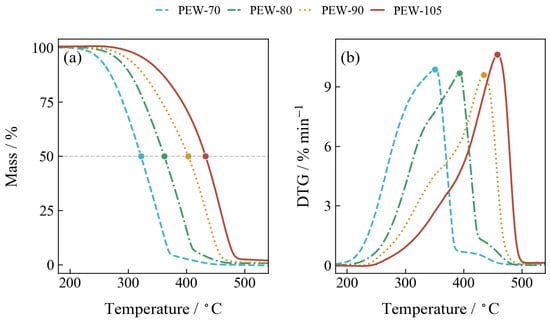
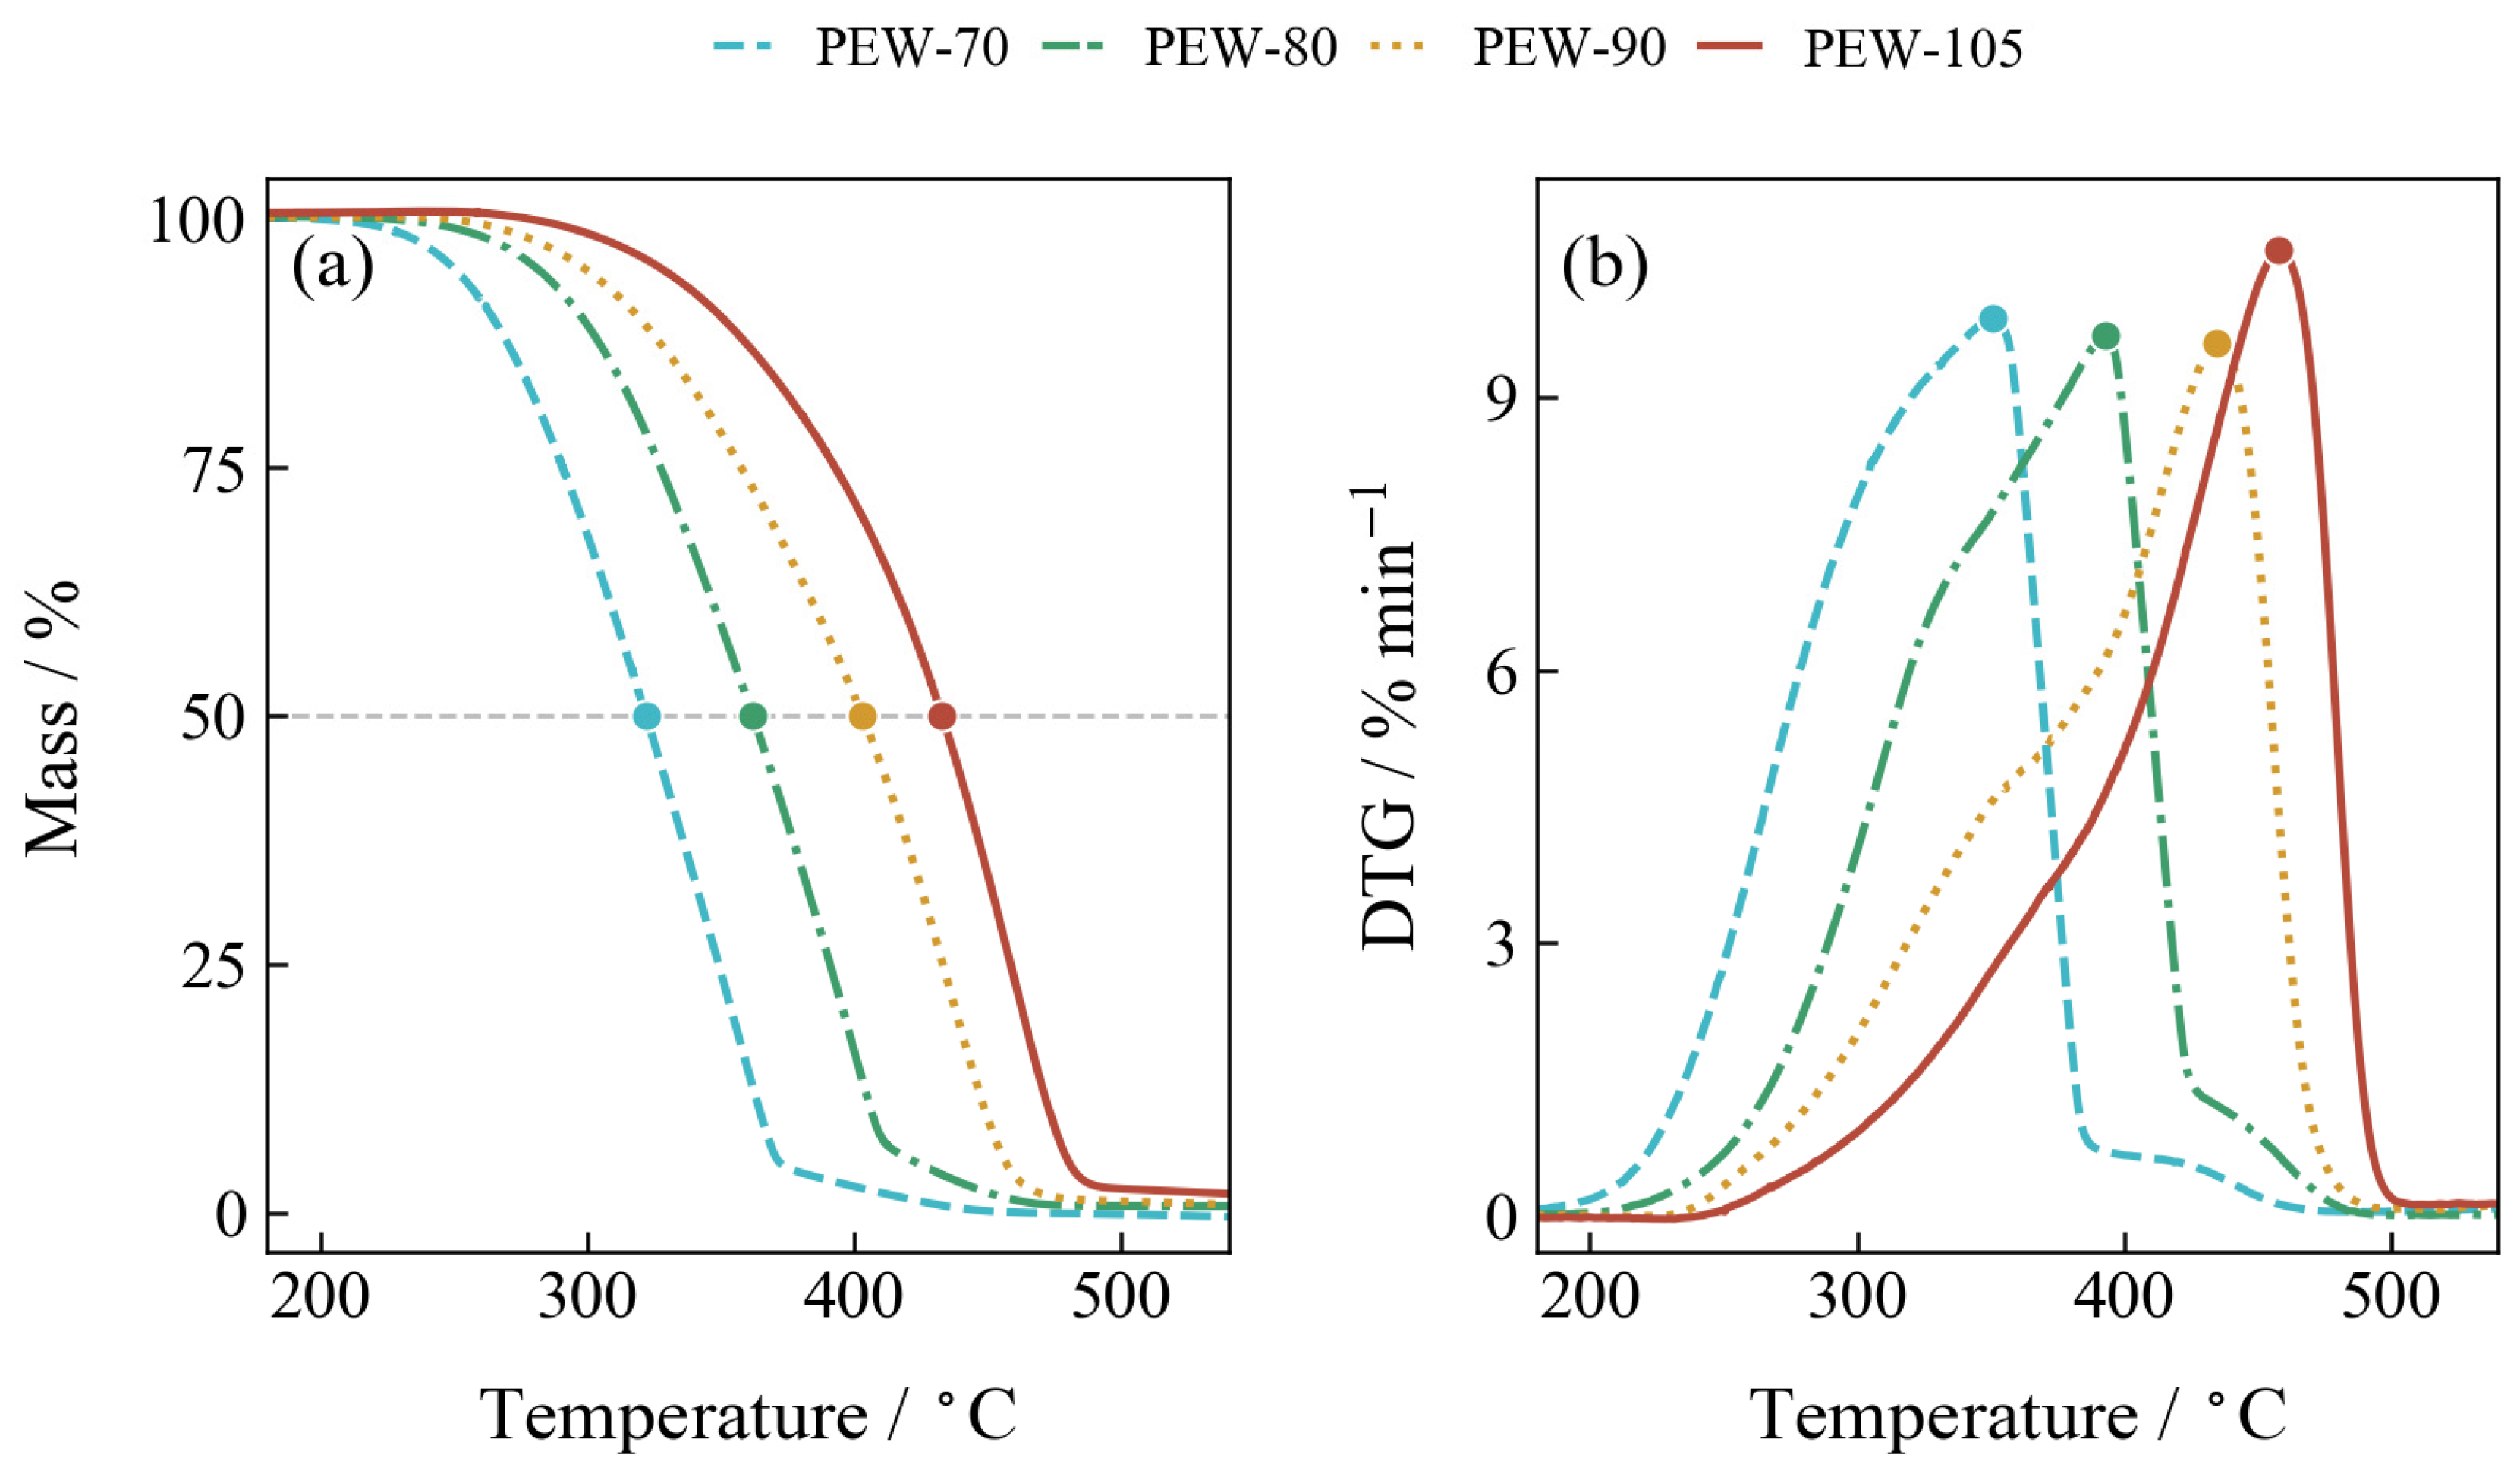
Thermal mass-loss behaviour for PEW-70 through PEW-105 is characterized in Table 5, with the TG and DTG curves shown in Figure 6. The feedstock was consumed during the fractionation campaign, and insufficient material remained for TGA under identical conditions; the feedstock is therefore absent from Table 5 and Figure 6, and the comparison in this section is drawn among the four graded fractions that share a common analytical protocol.
Table 5.
TGA/DTG characteristic parameters of the PEW fractions.
Figure 6.
Thermogravimetric behaviour of the fractions: (a) TG curves, where the dashed line indicates the 50% mass level and filled circles mark T50%; (b) DTG curves, where filled circles mark the peak temperatures.
From PEW-70 to PEW-105, T5% increased from 250.1 to 327.6 °C, T50% from 321.9 to 432.7 °C, and the DTG peak temperature from 350.9 to 457.9 °C. This corresponds to an overall right-shift of 77.5 to 110.8 °C for the initial and main mass-loss regions. Between Tm,2 and T50%, the regression yielded an R-square of 0.992, the highest correlation observed in the study. This tight coupling suggests that the melting-temperature region and the main mass-loss temperature region are governed by a shared dependence on chain-length distribution. In contrast, the maximum mass-loss rate remained in a narrow band from 9.594 to 10.615% per minute, indicating that the fractions differ in the temperature range over which mass loss occurs rather than in the intensity of the loss process itself. Residual mass at 600 °C remained below 1.3% for all four fractions, consistent with essentially complete devolatilization under nitrogen.
Mechanistically, mass loss in a paraffinic system under inert atmosphere is governed jointly by evaporation of low-carbon chains and thermal scission of longer chains. Low-carbon fractions carry higher vapour pressures and therefore begin to lose mass at lower temperatures, whereas heavy fractions require higher temperatures to reach the same vapour pressures or to undergo chain scission. Kinetic analyses of low-density polyethylene pyrolysis have shown that a single main degradation zone can be described by a well-defined activation-energy range once chain-length effects are accounted for [34]. Comparable modelling for related polymer systems has emphasized the strong coupling between initial mass-loss temperature and the light-component fraction [44]. As the graded series moves toward PEW-105, both the average carbon number and the apparent molecular weight rise, and the mass-loss temperature region shifts upward as a consequence. Oxidative modification of the polymer backbone, which would introduce a separate loss mechanism, is not implicated here because the samples were graded fractions of a physically separated PEW rather than oxidized derivatives. Earlier work on oxidized PEW decomposition identifies distinct behaviour for such systems [45], and the present TG and DTG profiles show single-region loss consistent with chain-length control.
The right-shift in TG indicators carries different physical meanings depending on the specific temperature chosen. T5% is sensitive to the light tail and reports on the onset of mass loss. T50% approaches the loss temperature of the dominant chain-length population. Tp marks the temperature of the fastest mass-loss rate. The observed right-shifts of 77.5, 110.8 and 107.0 °C, respectively, indicate that both the light-tail depletion and the migration of the main population contribute to the overall shift. This coordinated behaviour parallels observations in catalytic upgrading of pyrolysis waxes, where thermal-stability indicators depend on chain-length distribution and heating history in similar ways [46].
TG and DTG together corroborate the composition-to-property picture built up through basic wax testing and DSC. The correlation between Tm,2 and T50% underlines that the same chain-length redistribution that determines the melting-transition region also determines where the main mass loss occurs. The implication is that thermal stability, as measured under nitrogen, is not an independent axis of grade differentiation. It can be predicted from the same compositional variable that predicts drop melting point and DSC melting temperature, which simplifies the design of grade-specific wax products for applications where thermal-processing windows must be defined in advance.
3.6. Operation to CND to Property Three-Level Correspondence
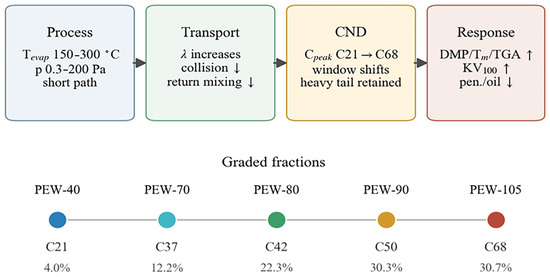
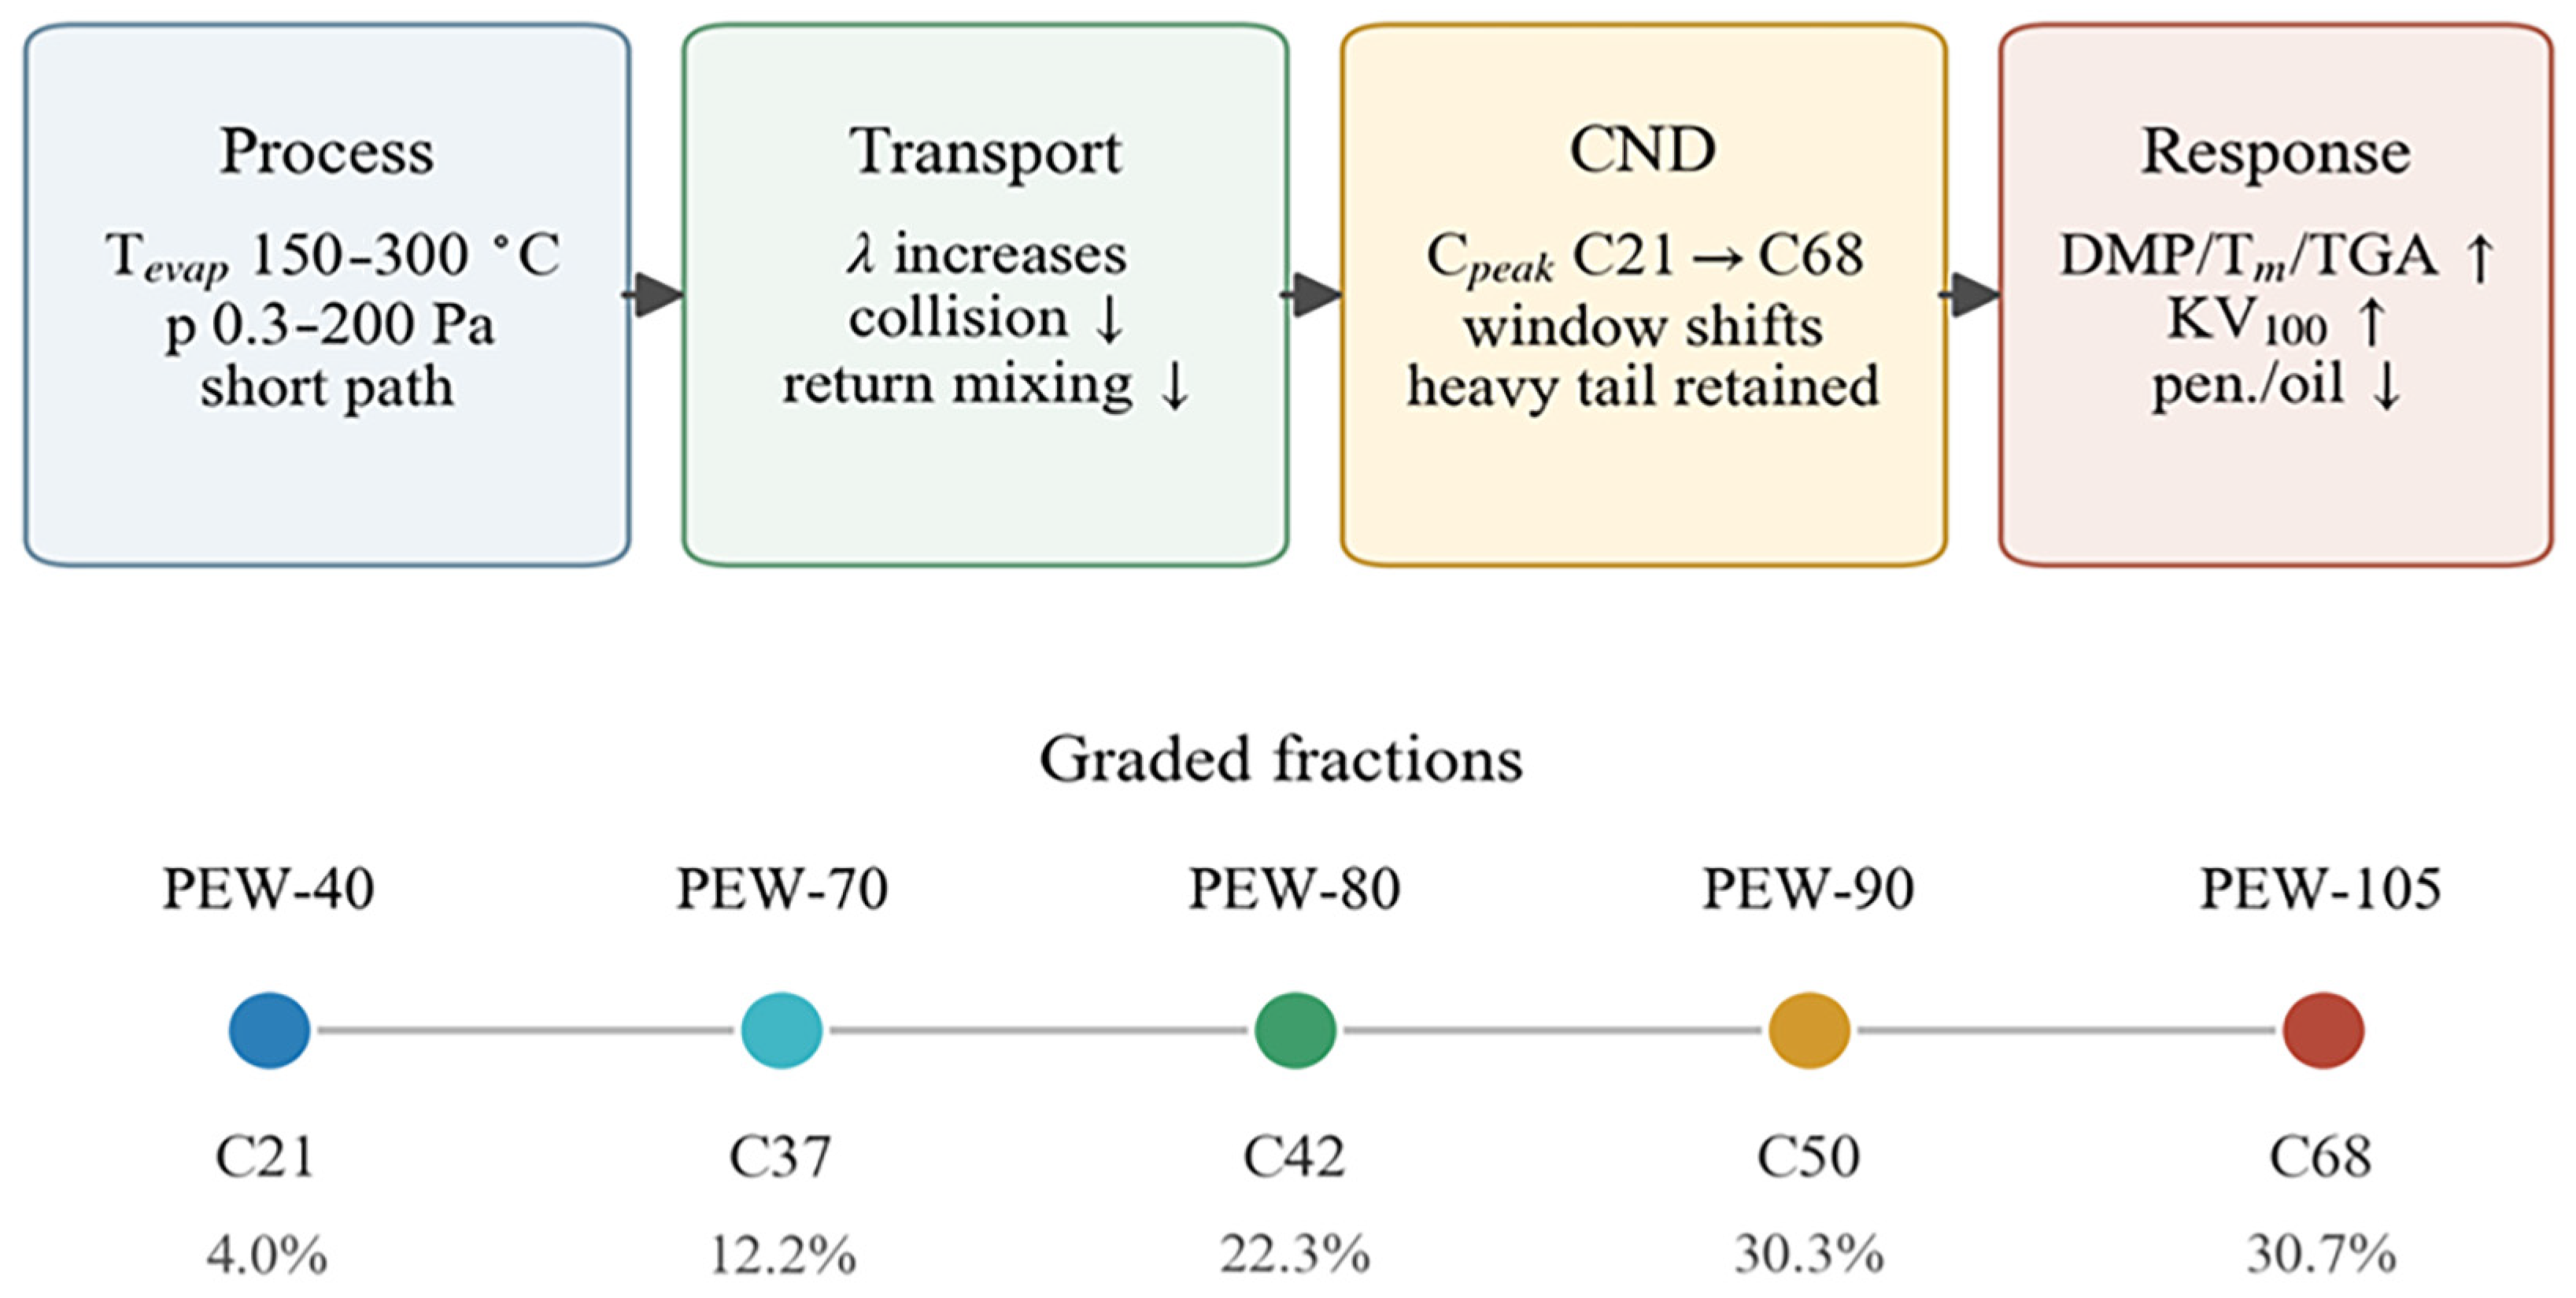
The results collected across the fractions can be organized as a three-level correspondence in which distillation operation drives CND reshaping, and CND reshaping in turn drives fraction properties. A schematic representation of this framework is presented in Figure 7.
Figure 7.
Schematic of the operation to CND to property response in multistage molecular distillation of PEW. The arrows between boxes indicate the direction of transmission across the three levels. In the Response box, ↑ and ↓ denote increasing and decreasing trends, respectively; DMP, KV100 and pen. denote drop melting point, kinematic viscosity at 100 °C and penetration.
At the operation level, high vacuum lengthens the mean free path and short-path geometry reduces the gas-phase mass-transfer resistance for high-boiling wax molecules. Thin-film renewal on the wiped surface shortens the liquid-phase heat exposure and reduces the diffusion length. These conditions cause chains of different volatility to migrate into different phases at each stage, with lighter chains preferentially entering the distillate and heavier chains being retained. This mechanistic picture has been developed and refined for molecular distillation applied to high-boiling materials [12], and its transferability to PEW has already been demonstrated at pilot scale [19]. The present study places the same framework in a multigrade context, and shows that the operating principle carries through five sequential separations without loss of consistency.
At the CND level, the operational drive is expressed as peak migration, distribution narrowing, main-window transformation and heavy-tail retention. The five fractions form a progression in which the peak carbon number shifts by more than 45 units and the distribution width narrows by up to 75%. Adjacent grades retain overlap in their tails, yet each carries a distinctive main window and peak position. This pattern is characteristic of continuous-carbon-window separation rather than sharp cut-off separation, and it defines what a molecular-distillation grade family is realistically able to achieve, namely a graded compositional structure rather than a set of pure components.
At the property level, the CND reshaping is transmitted into freezing point, drop melting point, kinematic viscosity, penetration, oil content, DSC transition temperatures and TGA mass-loss temperatures, all of which move in a consistent direction from PEW-40 to PEW-105. The R-square values collected across the various property indicators fall in a range of 0.780 to 0.992, and the highest coupling appears between Tm,2 and T50%. This distribution of correlations suggests that the further downstream a property is, from composition through crystallization behaviour to mass-loss temperature, the tighter its coupling to the underlying chain-length distribution becomes. Basic wax indicators such as penetration and oil content, being more sensitive to secondary structural details and to the operational definition of the measurement, show somewhat lower correlations but still fall on the same directional trend. Recent reviews of molecular-distillation modelling have argued that composition-linked property prediction is the natural extension of first-principles design [13], and the present results provide an empirical anchor for that expectation in the PEW context.
The datasets collectively validate each other. The yield-weighted mean carbon number of the fractions closes back to the feedstock within about 4%, indicating that the material balance is preserved. Adjacent-fraction overlap coefficients and main-window shifts show that the process produces continuous carbon-number windows rather than pure single-carbon products. Basic properties, DSC and TGA all move in the same direction across the graded series, showing that compositional change has been transmitted to usable product properties. Similar patterns have been observed in molecular-distillation studies of density-based fraction analysis of vacuum residues, where sub-fractions inherit the trend of the parent stream [37]. Beyond the wax family, analogous composition-to-property mapping has been reported for wiped-film distillation of cannabinoid-rich feedstocks, where fraction identity was defined jointly by yield, composition and physical properties [17]. The three-level correspondence therefore describes an empirically supported chain of transmission rather than a hypothetical mechanism, and it aligns with the direction taken in adjacent separation contexts. A quantitative comparison with the pilot-scale work of Maziero et al. [19] illustrates the difference in grade coverage: their single-stage distillation at 184 °C and 0.1 Pa produced a light wax spanning n-C13 to n-C30 with 63.4% distillate recovery, whereas the present three-stage layout resolved the feedstock from C12 through C117 into five products whose peak carbon numbers span 47 units. The monotonic transmission from weighted mean carbon number to drop melting point (R2 = 0.938) and kinematic viscosity (R2 = 0.951) is consistent with the chain-length dependence reported for solvent-fractionated paraffin waxes [8] and supercritical-fluid fractionation [9], although those studies did not apply the same multigrade correlation framework.
The observations position PEW fractionation with respect to several specific downstream applications. Fractions such as PEW-90 and PEW-105 possess drop melting points and thermal-stability temperatures compatible with mid-temperature phase-change materials, and the availability of a narrower melting window than the feedstock provides a favourable starting point for further formulation with conductive fillers [42]. Broader assessments of phase-change materials in solar and industrial contexts have underlined the importance of a well-defined melting window in this application space [4], and the graded PEW products discussed here can be viewed as candidates for such uses. Fractions with lower melting points, such as PEW-70 and PEW-80, align with softening-point requirements for pyrolytic-wax-modified bitumen, where a controlled mid-temperature transition helps balance rutting resistance against low-temperature performance [5]. Life-cycle analyses of such systems have added an environmental dimension to material selection and suggest that grade-oriented feedstock design can strengthen the sustainability case for wax-modified paving materials [6]. Additive applications, in which a narrow molecular-weight envelope is required for consistent rheological behaviour, can draw on the same graded compositional structure [7]. Analogous considerations apply to functionalized-wax use in filled polyolefin composites, where processing behaviour is sensitive to both molecular weight and chain uniformity. The composition-to-property correspondence developed here does not by itself deliver an application-ready material for any of these uses, but it offers a compositional basis on which application-specific selection or blending can be built.
The economic rationale for multistage grading lies in converting a low-value by-product stream into specification-grade products that each command a higher unit price than the undifferentiated feedstock. PEW-70 through PEW-90 fall within the melting-point and penetration windows of commercial paraffin grades used in coatings, adhesives, and candle formulations, while PEW-105 targets high-melting-point applications, including phase-change-material carriers and polymer-processing lubricants. Whether the added product value offsets the capital and energy costs of the vacuum and thermal-oil systems depends on throughput and local price differentials, and a formal techno-economic assessment lies beyond the scope of this study.
Several limitations should be acknowledged. This study used a single industrial PEW feedstock and a single set of operating conditions; the composition–property relationships should not be assumed to be transferable to other PEW types. Metallocene-catalyzed PEW typically exhibits a narrower molecular-weight distribution (Mw/Mn ≈ 2.0) and melting temperatures of 125 to 135 °C [47,48], and its more uniform chain architecture may alter the chain-length-to-property transmission. Pyrolysis-derived PEW introduces additional variables including higher olefin content and branching heterogeneity [22], which could weaken the correlation observed in the present normal-paraffin-dominated system. Whether the three-level correspondence and the regression parameters hold across feedstock families requires independent testing. Zinc-enhanced metallocene routes, for example, have been shown to produce PEW with distinctive molecular-weight signatures [49], while chain-end-functionalized nickel-catalyzed materials introduce structural features that are not present in the feedstock studied here [1]. Laser-induced flash pyrolysis of waste polyethylene delivers wax cuts whose chain-length signatures again differ from conventional industrial by-product streams [3], and pyrolysis-wax solvent uses have highlighted the compatibility issues that arise with such materials [50]. Wiped-film essential-oil purification of Pinus roxburghii resins has shown that stringent process control is required for consistent product identity in fine chemical applications [16]. Wax fractionation for essential-oil purification protocols relies on similar composition control [51], and adsorption-based petroleum hydrocarbon separation illustrates a complementary path that could be combined with molecular distillation for narrow cuts [10]. The DSC and TGA measurements were carried out with single replicates (n = 1), and the correlation coefficients are exploratory indicators rather than statistically validated predictive models. The third-stage heavy fraction retained a wide high-carbon tail, and further fine fractionation of that stream, whether by additional molecular-distillation stages or by combination with alternative separation methods, has not been investigated here. Future work is expected to address these points through multifactor exploration of operating variables, expansion of the feedstock base to metallocene-derived and pyrolysis-derived waxes, application of finer thermal-fractionation protocols, and validation of application performance in phase-change-material and bitumen-modification contexts.
4. Conclusions
This study fractionated an industrial polyethylene wax into five graded products through a combined wiped-film and three-stage molecular distillation, and examined the correspondence between distillation operation, carbon-number distribution reshaping and fraction properties. The five fractions carried normalized yields of 4.03, 12.16, 22.26, 30.33 and 30.71%, with peak carbon numbers migrating from C21 to C68 and weighted mean carbon numbers rising from 21.60 to 73.55. The 10 to 90% distribution width narrowed from 36 in the feedstock to 9 to 18 in the light and intermediate grades, while the heavy grade retained a broader tail as expected of a third-stage residue. Basic wax properties, DSC transition temperatures and TGA mass-loss temperatures moved in a consistent direction with the compositional shift, and correlation coefficients between weighted mean carbon number and property indicators fell in a range of 0.780 to 0.951, with the coupling between the second-heating melting peak and 50% mass-loss temperature reaching 0.992. The observed grade-level behaviour was governed by chain-length variation rather than by structural rearrangement, which supports the interpretation of a three-level correspondence connecting distillation operation, CND reshaping and fraction properties.
Taken together, the results suggest that molecular distillation can be used as a grade-oriented physical process for polyethylene wax rather than only as an analytical-scale enrichment technique. The graded fractions carry compositional and thermal properties that are compatible with several application-specific requirements, ranging from mid-temperature phase-change materials to bitumen modification and polymer processing additives. The correlation-based transmission from composition to property positions carbon-number distribution as a design variable that can be manipulated through operating parameters and read as an indicator of downstream behaviour, and this may support the broader use of molecular distillation in industrial wax grading.
This study used a single industrial feedstock and a single multistage configuration, and it does not resolve lamellar heterogeneity within individual grades or validate performance in application contexts. Multifactor exploration of operating conditions would establish quantitative links between process variables and cut boundaries. Expansion of the feedstock base to metallocene-catalyzed and pyrolysis-derived waxes would test whether the observed composition–property relationships are transferable. Integration of finer thermal-fractionation protocols would add a crystallographic dimension that the present CND and bulk-DSC data do not capture. Application testing in phase-change-material, bitumen-modification and polymer-additive contexts would close the loop from grade formation to end-use performance. These extensions would strengthen molecular distillation as a practical route from broad-distribution industrial waxes to graded, property-differentiated products.
Funding
This research received no external funding.
Data Availability Statement
The original contributions presented in this study are included in the article. Further inquiries can be directed to the corresponding author.
Conflicts of Interest
The author declares no conflicts of interest.
References
- Chen, J.; Lu, Z.; Dai, S. Synthesis of chain-end functionalized highly branched polyethylene waxes using sterically open α-diimine Ni(II) catalysts. J. Polym. Sci. 2024, 62, 4051–4057. [Google Scholar] [CrossRef] [Scilit]
- Nouri-Ahangarani, F.; Bahri-Laleh, N.; Abedini, H.; Nekoomanesh, M. Effect of adduct synthesis parameters on the ethylene polymerization kinetics of Ziegler Natta catalysts. J. Appl. Polym. Sci. 2023, 140, e54053. [Google Scholar] [CrossRef] [Scilit]
- Chen, F.R.; Chen, L.; Chang, F.L.; Hua, Z.Y.; Yang, H.; Wang, S.; Cao, X.W.; Yin, X.C.; He, G.J. Polyethylene Wax Upcycled From Waste Polyethylene by Laser-Induced Flash Pyrolysis and Its Plasticizing Performance. Polym. Eng. Sci. 2025, 65, 5413–5424. [Google Scholar] [CrossRef] [Scilit]
- Jayathunga, D.S.; Karunathilake, H.P.; Narayana, M.; Witharana, S. Phase change material (PCM) candidates for latent heat thermal energy storage (LHTES) in concentrated solar power (CSP) based thermal applications—A review. Renew. Sustain. Energy Rev. 2024, 189, 113904. [Google Scholar] [CrossRef] [Scilit]
- Vargas, C.A.; El Hanandeh, A. Eco-friendly asphalt mixtures: Examining the performance of PE pyrolytic wax-modified bitumen for road construction. Clean Technol. Environ. Policy 2024, 26, 447–465. [Google Scholar] [CrossRef] [Scilit]
- Vargas, C.A.; Lu, H.R.; El Hanandeh, A. Environmental impact of pavements formulated with bitumen modified with PE pyrolytic wax: A comparative life cycle assessment study. J. Clean. Prod. 2023, 419, 138070. [Google Scholar] [CrossRef] [Scilit]
- Mhlabeni, T.; Ngobese, C.; Ramjee, S.; Focke, W. Rheological characterization of linear low-density polyethylene-Fischer-Tropsch wax blends. J. Vinyl Addit. Technol. 2023, 29, 698–708. [Google Scholar] [CrossRef] [Scilit]
- Zaky, M.T.; Mohamed, N.H.; Farag, A.S. Separation of different paraffin wax grades using two comparative deoiling techniques. Fuel Process. Technol. 2007, 88, 913–920. [Google Scholar] [CrossRef] [Scilit]
- Crause, J.C.; Nieuwoudt, I. Fractionation of Paraffin Wax Mixtures. Ind. Eng. Chem. Res. 2000, 39, 4871–4876. [Google Scholar] [CrossRef] [Scilit]
- Yu, H.; Zang, J.; Guo, C.; Li, B.; Li, B.; Zhang, X.; Chen, T. Research Progress on Adsorption and Separation of Petroleum Hydrocarbon Molecules by Porous Materials. Separations 2023, 10, 17. [Google Scholar] [CrossRef] [Scilit]
- Hickman, K.C.D. High-vacuum short-path distillation: A review. Chem. Rev. 1944, 34, 51–106. [Google Scholar] [CrossRef] [Scilit]
- Lutišan, J.; Cvengroš, J. Mean free path of molecules on molecular distillation. Chem. Eng. J. Biochem. Eng. J. 1995, 56, 39–50. [Google Scholar] [CrossRef] [Scilit]
- Idárraga-Vélez, Á.M.; Orozco, G.A.; Gil-Chaves, I.D. A systematic review of mathematical modeling for molecular distillation technologies. Chem. Eng. Process.-Process Intensif. 2023, 184, 109289. [Google Scholar] [CrossRef] [Scilit]
- Tovar, L.P.; Lopes, M.S.; de Brito Filho, J.G.; Lopes, E.S.; Maciel Filho, R.; Wolf Maciel, M.R. Molecular distillation of heavy petroleum fractions: Knowledge-based understanding of its hydrodynamic parameters. Pet. Sci. Technol. 2017, 35, 2187–2193. [Google Scholar] [CrossRef] [Scilit]
- Rodriguez, N.E.; Martinello, M.A. Molecular distillation applied to the purification of biodiesel from ethanol and soybean oil. Fuel 2021, 296, 120597. [Google Scholar] [CrossRef] [Scilit]
- Ayub, M.A.; Amin, H.I.M.; Waseem, R.; Amin, K.Y.M.; Hanif, M.A.; Hussain, A.; Issa, K.D.; Ramírez, J.; Armijos, C.; Zubair, M.; et al. Short path molecular distillation of the essential oil from Pinus roxburghii oleoresin affords volatile fractions with powerful antioxidant and antimicrobial activities comparable with common synthetic agents and antimicrobials. Heliyon 2025, 11, e42282. [Google Scholar] [CrossRef] [Scilit]
- Valizadehderakhshan, M.; Kazem-Rostami, M.; Shahbazi, A.; Azami, M.; Bhowmik, A.; Wang, L. Refining Cannabidiol Using Wiped-Film Molecular Distillation: Experimentation, Process Modeling, and Prediction. Ind. Eng. Chem. Res. 2022, 61, 6628–6639. [Google Scholar] [CrossRef] [Scilit]
- Buitrago-Suescún, O.Y.; Martínez-Riascos, C.; Orjuela, A. Experimental optimization of a short-path distillation of alcoholic extracts from hemp. Chem. Eng. Process.-Process Intensif. 2026, 220, 110658. [Google Scholar] [CrossRef] [Scilit]
- Maziero, E.V.; Salles, R.B.; Tovar, L.P.; Tanabe, E.H.; Bertuol, D.A. Fractionation of polyethylene wax by pilot-scale molecular distillation: New insights on process development. Chem. Eng. Res. Des. 2019, 152, 201–215. [Google Scholar] [CrossRef] [Scilit]
- Poornachary, S.K.; Chia, V.D.; Schreyer, M.K.; Chow, P.S.; Tan, R.B.H. Relating Alkyl Chain Length of Additives to Wax Crystallization Inhibition: Toward the Rational Design of Pour Point Depressants. Cryst. Growth Des. 2022, 22, 4031–4042. [Google Scholar] [CrossRef] [Scilit]
- SH/T 0653-1998; Petroleum waxes—Determination of Carbon Number Distribution of Normal Paraffin and Non-Normal Paraffin Hydrocarbons—Gas Chromatography. State Bureau of Petroleum and Chemical Industry: Beijing, China, 1998.
- Klippel, M.S.; Martins, M.F. Physicochemical assessment of waxy products directly recovered from plastic waste pyrolysis: Review and synthesis of characterization techniques. Polym. Degrad. Stab. 2022, 204, 110090. [Google Scholar] [CrossRef] [Scilit]
- ASTM D938-17; Standard Test Method for Congealing Point of Petroleum Waxes, Including Petrolatum. ASTM International: West Conshohocken, PA, USA, 2017.
- ASTM D127-19; Standard Test Method for Drop Melting Point of Petroleum Wax, Including Petrolatum. ASTM International: West Conshohocken, PA, USA, 2019.
- GB/T 8026-2014; Petroleum Waxes and Petrolatum—Determination of Drop Melting Point. Standardization Administration of China: Beijing, China, 2014.
- ASTM D1321-16; Standard Test Method for Needle Penetration of Petroleum Waxes. ASTM International: West Conshohocken, PA, USA, 2021.
- GB/T 4985-2010; Petroleum Waxes—Determination of Needle Penetration. Standardization Administration of China: Beijing, China, 2010.
- ASTM D445-23; Standard Test Method for Kinematic Viscosity of Transparent and Opaque Liquids (and Calculation of Dynamic Viscosity). ASTM International: West Conshohocken, PA, USA, 2024.
- GB/T 265-1988; Petroleum Products—Determination of Kinematic Viscosity and Calculation of Dynamic Viscosity. Standardization Administration of China: Beijing, China, 1988.
- ASTM D721-17; Standard Test Method for Oil Content of Petroleum Waxes. ASTM International: West Conshohocken, PA, USA, 2022.
- GB/T 3554-2008; Petroleum Waxes—Determination of Oil Content. Standardization Administration of China: Beijing, China, 2008.
- ASTM D156-23; Standard Test Method for Saybolt Color of Petroleum Products (Saybolt Chromometer Method). ASTM International: West Conshohocken, PA, USA, 2023.
- Ciesińska, W.; Liszyńska, B.; Zieliński, J. Selected thermal properties of polyethylene waxes. J. Therm. Anal. Calorim. 2016, 125, 1439–1443. [Google Scholar] [CrossRef] [Scilit]
- Dubdub, I.; Al-Yaari, M. Pyrolysis of Low Density Polyethylene: Kinetic Study Using TGA Data and ANN Prediction. Polymers 2020, 12, 891. [Google Scholar] [CrossRef] [Scilit]
- Wynne, E.; Connell, S.D.; Shinebaum, R.; Blade, H.; George, N.; Brown, A.; Collins, S.M. Grain and Domain Microstructure in Long Chain N-Alkane and N-Alkanol Wax Crystals. Cryst. Growth Des. 2024, 24, 10127–10142. [Google Scholar] [CrossRef] [Scilit]
- Leyva-Gutierrez, F.M.A.; Wang, T. Rotator Phases of Aliphatic Aldehydes and Implications for Wax Crystal Growth in Plants. Cryst. Growth Des. 2023, 23, 2351–2360. [Google Scholar] [CrossRef] [Scilit]
- León, A.Y.; Sandoval-Amador, A.; Peña-Ballesteros, D.Y.; Molina, D.R.; Corredor, O. Innovative density measurement techniques for vacuum residues of crude oil and their fractions using toluene dilution. Chem. Pap. 2025, 79, 1739–1751. [Google Scholar] [CrossRef] [Scilit]
- Morozov, E.V.; Nizovtseva, P.V.; Martyanov, O.N. From Components to Phase-Dependent Dynamics of Diffusivity in Wax Solutions Subjected to Fluid-Solid Phase Transition: Insights from Pulsed Field Gradient NMR. Energy Fuels 2022, 36, 14696–14709. [Google Scholar] [CrossRef] [Scilit]
- Pérez-Camargo, R.A.; Cavallo, D.; Müller, A.J. Recent applications of the Successive Self-nucleation and Annealing thermal fractionation technique. Front. Soft Matter 2022, 2, 1003500. [Google Scholar] [CrossRef] [Scilit]
- Góra, M.; Tranchida, D.; Albrecht, A.; Müller, A.J.; Cavallo, D. Fast successive self-nucleation and annealing (SSA) thermal fractionation protocol for the characterization of polyolefin blends from mechanical recycling. J. Polym. Sci. 2022, 60, 3366–3378. [Google Scholar] [CrossRef] [Scilit]
- Scoppio, A.; Cavallo, D.; Müller, A.J.; Tranchida, D. Temperature modulated DSC for composition analysis of recycled polyolefin blends. Polym. Test. 2022, 113, 107656. [Google Scholar] [CrossRef] [Scilit]
- Macherzyńska, B.; Pitera, A.; Nowicka-Dunal, K.; Pielichowska, K. Polyethylene-Based Phase Change Materials Modified with Hexagonal Boron Nitride Nanoparticles with Enhanced Thermal Stability and Thermal Conductivity. Materials 2026, 19, 455. [Google Scholar] [CrossRef] [Scilit]
- Ong, P.J.; Heng, Z.X.J.; Xing, Z.; Ko, H.Y.Y.; Wang, P.; Liu, H.; Ji, R.; Wang, X.; Tan, B.H.; Li, Z.; et al. Wax from Pyrolysis of Waste Plastics as a Potential Source of Phase Change Material for Thermal Energy Storage. Trans. Tianjin Univ. 2023, 29, 225–234. [Google Scholar] [CrossRef] [Scilit]
- Zeller, M.; Garbev, K.; Weigel, L.; Saatzer, T.; Merz, D.; Tavakkol, S.; Stapf, D. Thermogravimetric studies, kinetic modeling and product analysis of the pyrolysis of model polymers for technical polyurethane applications. J. Anal. Appl. Pyrolysis 2023, 171, 105976. [Google Scholar] [CrossRef] [Scilit]
- Al-Sammerrai, D.; Selim, W. The thermal decomposition of oxidized polyethylene wax. Polym. Degrad. Stab. 1986, 15, 183–187. [Google Scholar] [CrossRef] [Scilit]
- Sotoudehnia, F.; Orji, B.; Mengistie, E.; Alayat, A.M.; McDonald, A.G. Catalytic Upgrading of Pyrolysis Wax Oil Obtained from Waxed Corrugated Cardboard Using Zeolite Y Catalyst. Energy Fuels 2021, 35, 9450–9461. [Google Scholar] [CrossRef] [Scilit]
- Napoli, M.; De Vita, R.; Immediata, I.; Longo, P.; Guerra, G. Polyethylene waxes by metallocenes. Polym. Adv. Technol. 2011, 22, 458–462. [Google Scholar] [CrossRef] [Scilit]
- Lamb, J.V.; Buffet, J.-C.; Turner, Z.R.; Khamnaen, T.; O’Hare, D. Metallocene polyethylene wax synthesis. Macromolecules 2020, 53, 5847–5856. [Google Scholar] [CrossRef] [Scilit]
- Gui, X.; Liu, Y.; Wang, S.; Guo, Q.; Xing, X.; Liu, W.; Jiang, T.; Yan, B. Advanced Polyethylene Wax via Zinc-Enhanced Metallocene Catalysis: Insights Into Molecular Weight Regulation Mechanisms. Macromol. React. Eng. 2026, 20, e70003. [Google Scholar] [CrossRef] [Scilit]
- Zolghadr, A.; Kulas, D.; Shonnard, D. Evaluation of Pyrolysis Wax as a Solvent in Polyolefin Pyrolysis Processing. Ind. Eng. Chem. Res. 2022, 61, 11080–11088. [Google Scholar] [CrossRef] [Scilit]
- Zhou, W.; Li, J.; Wang, X.; Liu, L.; Li, Y.; Song, R.; Zhang, M.; Li, X. Research Progress on Extraction, Separation, and Purification Methods of Plant Essential Oils. Separations 2023, 10, 596. [Google Scholar] [CrossRef] [Scilit]

Disclaimer/Publisher’s Note: The statements, opinions and data contained in all publications are solely those of the individual author(s) and contributor(s) and not of MDPI and/or the editor(s). MDPI and/or the editor(s) disclaim responsibility for any injury to people or property resulting from any ideas, methods, instructions or products referred to in the content. |
© 2026 by the author. Licensee MDPI, Basel, Switzerland. This article is an open access article distributed under the terms and conditions of the Creative Commons Attribution (CC BY) license.