


Abstract
Efficient dewatering of fine clay-rich coal tailings water is a critical bottleneck in water process engineering, restricting water recovery and increasing environmental discharge risks. This study demonstrates that dodecylamine hydrochloride (DAH) induces boundary slip at the solid–liquid interface to significantly improve the dewatering performance of filter cakes composed of kaolinite, a typical clay mineral. A slip-modified capillary filtration model was developed by incorporating slip length into the classical capillary filtration framework, quantitatively linking interfacial slip to cake-specific resistance and filtrate flow. DAH adsorbed onto kaolinite via electrostatic attraction and hydrogen bonding, enhancing surface hydrophobicity and increasing the interfacial slip length to approximately 70 nm. Consequently, the cake-specific resistance decreased from 1.90 × 10¹⁵ to 0.76 × 10¹⁵ m−2, and the filtration rate increased markedly. X-ray microtomography showed that the addition of DAH produced a more connected pore network: total porosity increased from 12.62% to 13.73%, effective porosity increased from 9.09% to 11.74%, and the isolated-pore fraction decreased from 27.73% to 14.57%. Lattice Boltzmann simulations further revealed that boundary slip induced by DAH addition reduces interfacial resistance within pore channels, increases the fraction of high-velocity streamlines, and thereby markedly enhances permeability. These findings confirm that DAH addition triggers boundary slip and improves the dewatering performance of kaolinite, which provides a theoretical basis for enhancing dewatering performance and process efficiency in the treatment of clay-rich coal tailings.
1. Introduction
Mineral processing and coal washing are water-intensive industries that generate large volumes of tailings water containing fine clay minerals [1,2]. With increasingly stringent discharge regulations and growing demand for water reuse, efficient solid–liquid separation and dewatering of these streams have become critical in water process engineering. Pressure/vacuum filtration is widely employed for this purpose because it can produce a handleable filter cake and recover clean water [3,4]. However, kaolinite-rich tailings are difficult to dewater. Their fine particle size, strong negative surface charge, and hydrophilic nature promote the formation of highly resistant filter cakes, cause fines migration and pore clogging, and retain water through strong solid–liquid interactions, leading to low filtration rates and high energy consumption [5]. Overcoming this bottleneck is essential for reducing tailings water volume, improving water recovery, and minimizing environmental risks.
To enhance the filtration performance of kaolinite, it is common practice to introduce filter aids to improve solid–liquid separation efficiency. Existing studies have demonstrated that the addition of polyacrylamide-based (PAM) flocculants can promote particle aggregation and settling through bridging effects, while the addition of surfactants such as cetyltrimethylammonium bromide (CTAB) and dodecyltrimethylammonium chloride (DTAC) enhance surface hydrophobicity via electrostatic adsorption and hydrogen bonding [6,7,8,9]. In contrast, dodecylamine hydrochloride (DAH), exhibits pH-responsive charge characteristics, can adsorb onto different basal planes of kaolinite through synergistic electrostatic and hydrogen-bonding interactions, and has a broader dosage window. These features confer potential unique advantages in dewatering applications [10,11,12].
Previous studies have confirmed flow slippage in bubble-surrounding flow fields. On this basis, interfacial nanobubbles are generally regarded as the primary cause of boundary slip over hydrophobic surfaces [13]. Furthermore, solid–liquid interfacial slip depends on the properties of interfacial water molecules, occurring when the work of adhesion falls below the cohesive work of water [14]. As reported by G Sánchez et al., water exhibits boundary slip over hydrophobic solid surfaces, where slip length is governed by surface hydrophobicity, surface topography and wall shear rate [15]. Previous experimental work by Chen et al. identified interfacial water slip in graphene nanochannels. On this basis, the team constructed a refined capillary flow model that accounts for direction-dependent heterogeneous velocity fields, slip boundary effects, and dynamic contact angle variations [16]. In the field of solid–liquid separation, Yoon and Albijanic et al. investigated fluid boundary slip phenomena induced by changes in surface hydrophobicity during capillary flow and highlighted the significant impact of fluid boundary slip effects on the filtration rate of fine particle slurries [17,18]. However, existing studies have not yet revealed the microscopic induction mechanisms of fluid boundary slip effects in hydrodynamics, making it difficult to further achieve fluid drag reduction and efficient dewatering of kaolin through the regulation of slip effects.
By introducing slip boundary effects into the Navier–Stokes governing equation, this study develops an improved capillary flow model, which can quantitatively characterize the explicit correlation between slip length and cake-specific resistance. Through controlled hydrophobic surface modification of kaolinite, filtration kinetics are experimentally measured and the slip length is back-calculated from the experimental data. Furthermore, X-ray microtomography (Micro-CT) is employed to directly visualize the three-dimensional pore network of filter cakes under both slip and no-slip conditions, and lattice Boltzmann method (LBM) simulations are conducted to compare velocity fields and permeability. This multi-scale approach—integrating a new theoretical model, filtration experiments, pore-scale imaging, and flow simulations—aims to establish a quantitative, mechanistic understanding of how boundary slip enhances kaolinite dewatering, thereby providing a rational basis for optimizing fine clay filtration processes.
2. Theoretical Model
A filtration model can be established by simulating the migration behavior of fluids within porous filter cake structures [17]. Many previous studies have confirmed that surface hydrophobicity acts as a vital index to regulate filtrate transport, and high hydrophobicity can greatly boost fluid flow capacity and transport efficiency [19,20,21,22]. Based on the above findings, it is reasonable to speculate that particle surfaces adsorbed with hydrophobic particles yield lower water flow resistance compared with fully wetted hydrophilic particle surfaces, and fluid slip is the fundamental cause of decreased flow resistance.
During filtration, the filtrate migrates through the pore voids among adjacent solid particles. Despite the inherent tortuosity and uneven transverse of real fluid flow passages, to simplify the complex flow pathways within the actual filter cake, the complicated pore channels are approximated as bundles of uniform capillaries defined by radius R and channel length L, where channel length equals filter cake thickness [23,24].
To describe fluid motion inside capillary channels, Fluid flow in a capillary channel is described by the simplified cylindrical-coordinate Navier–Stokes equation [25].
In the above equation, ∆P is defined as the overall pressure drop, v describes the flow speed of the liquid phase, and μ is the dynamic viscosity coefficient of the fluid, while r denotes radial position relative to the capillary centerline.
Performing integration on Equation (1) yields:
C1 and C2 are integral constants, which can be quantified by plugging in the corresponding boundary conditions.
For the no-slip boundary condition that zero fluid velocity exists at solid particle surfaces, the parabolic distribution of flow velocity can be expressed via Equation (3):
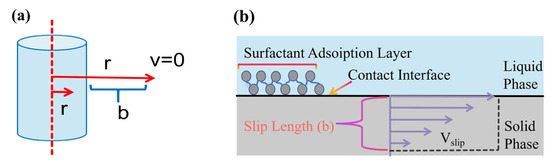
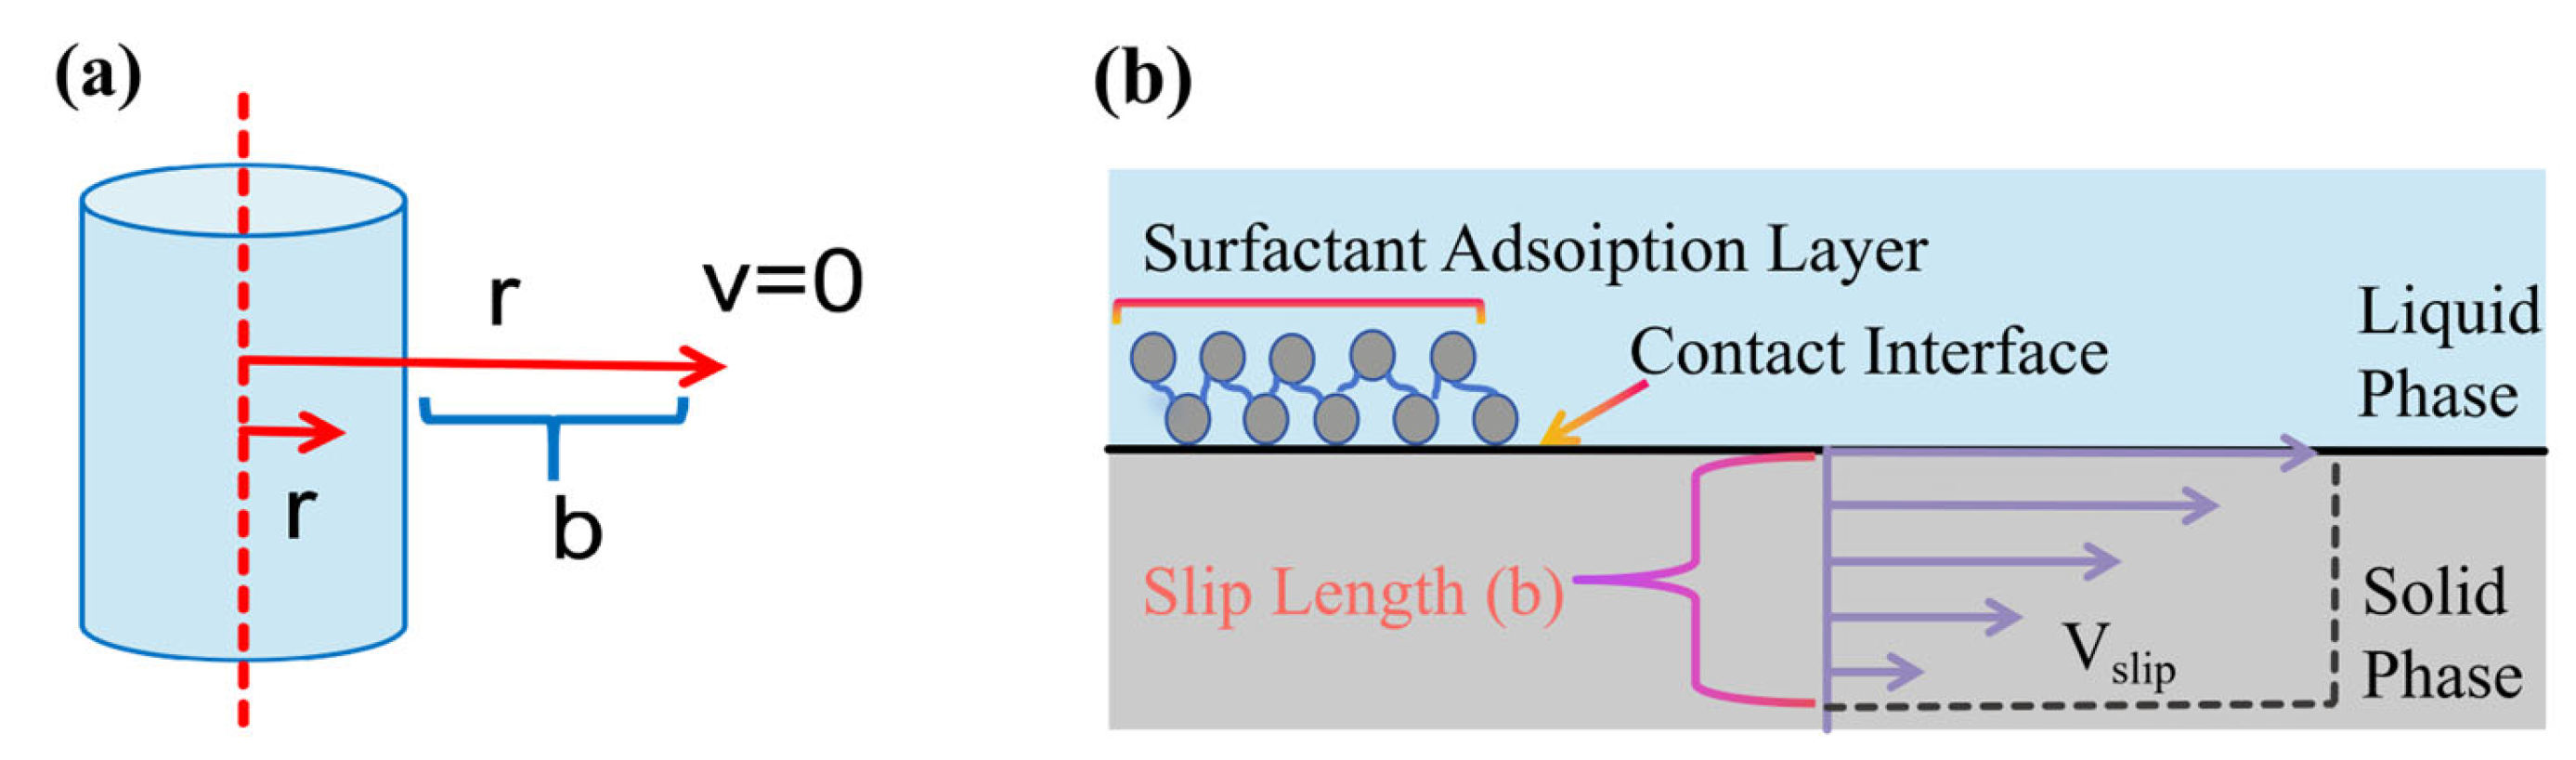
When slip boundary conditions are introduced, Mooney confirmed the existence of a non-zero slip velocity on the inner walls of capillary tubes [26,27]. As illustrated schematically in Figure 1a, by linearly extrapolating the velocity profile to the point where the slip velocity (vslip) becomes zero, the distance between this virtual zero-velocity point and the solid wall refers to the slip length (b).
Figure 1.
Schematic of slip length. (a) Definition of slip length. (b) Velocity variation on the capillary surface within the slip-length range.
It is additionally supposed that the surface velocity gradient changes linearly throughout the slip length, as sketched in Figure 1b. Accordingly, slip velocity is obtained by calculated the wall velocity gradient with slip length, as expressed below:
b denotes the slip length.
Through simultaneous solution of Equations (3) and (4), the velocity profile accounting for interfacial slip is determined as:
Evaluating the integral of Equation (5) over the transverse area leads to the volumetric flow rate:
Q denotes the volume flow rate of filtrate.
The total volumetric flow rate through all capillary tubes:
V denotes the filtrate volume.
By establishing a mass balance for solids accumulated on the filtration medium, the cake thickness L can be acquired:
A denotes the transverse area of the cake, w stands for the solid volume deposited per unit volume of filtrate, and ε represents the cake porosity.
By merging Equations (6) and (7), we can derive ΔPc, which refers to the pressure loss through the filter cake:
The pressure drop generated within porous filter media can be assessed via Darcy’s law [28]:
rm is the filter-medium resistance.
Summing the respective pressure losses of the filtration medium and cake yields the total pressure drop:
By transposing terms in Equation (10), the filtration rate can be solved for:
Equation (12) indicates that a larger slip length corresponds to a higher filtration rate. Incorporating hydrophobic additives enhances slip length and consequently promotes the filtration rate. It is worth noting that slip length equals zero without hydrophobic additives, since hydrophilic solid surfaces conform to the no-slip condition at liquid–solid interfaces.
By introducing the cake-specific resistance rc, Equation (12) can be rearranged into the classical filtration model [29]:
where
which reduces to
in the absence of slip.
3. Materials and Methods
3.1. Materials
The raw kaolin sample adopted in this experiment was obtained from Shanxi Shiyu Mining Co., Ltd., Yangquan City, China, with a purity of 98%. The material was presented as a white powder characterized by a lamellar structure and was stored under sealed conditions. The filtration aid employed was dodecylamine hydrochloride (DAH), a cationic surfactant supplied by Shandong Keyuan Biochemical Co., Ltd., Heze City, China.
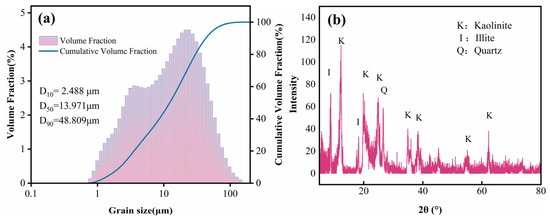
Dynamic image analysis was performed on kaolinite powders via a MorphoView series instrument from Opptronix Technology Shanghai Co., Ltd., Shanghai City, China to determine their particle size distribution. Prior to the particle size test, the kaolinite was uniformly dispersed in deionized water, followed by particle size measurement. The particle size measurement outcomes are presented in Figure 2a.
Figure 2.
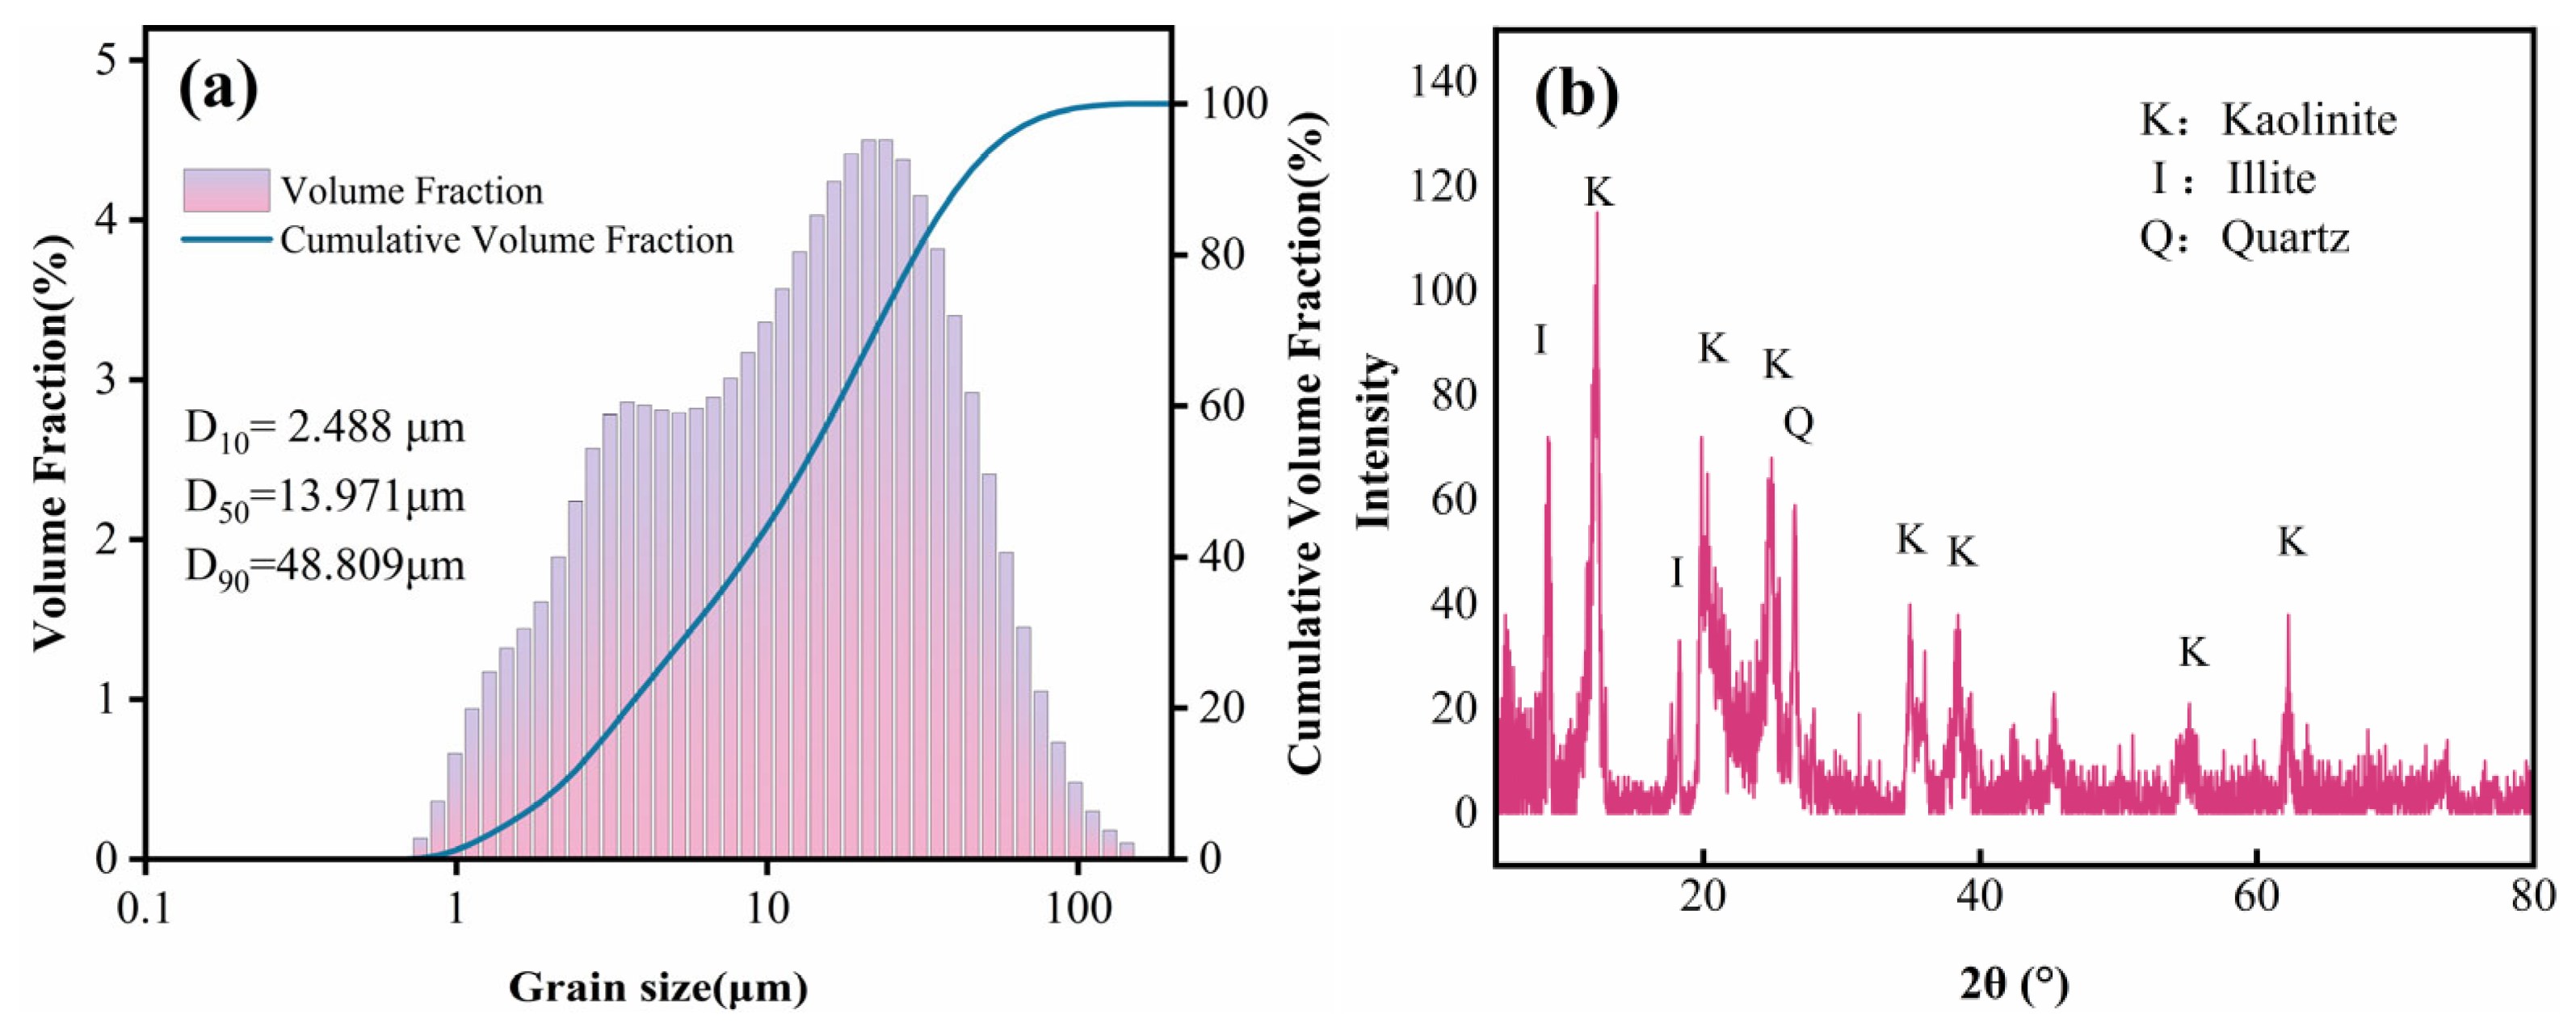
Basic property analysis of kaolinite sample. (a) Particle size distribution. (b) XRD.
The values of D10 (10% undersize particle size), D50 (median particle diameter) and D90 (90% undersize particle size) are 2.488 μm, 13.971 μm and 48.809 μm correspondingly. These data indicate a notably high proportion of fine particles (typically defined as smaller than 50 μm) within the sample. During the subsequent dewatering process, these fine kaolinite particles tend to migrate and progressively block the internal pores of the cake. This phenomenon, known in mineral processing as fines migration, ultimately imposes a severe constraint on the efficient operation of the dewatering process [30].
To determine the mineral composition of the kaolinite sample, X-ray diffraction (XRD) analysis was conducted in this study, with the results shown in Figure 2b. The XRD pattern exhibits complete, dense, and complex diffraction peaks, indicating that kaolinite is the predominant component in the sample, accompanied by minor impurities of illite and quartz.
3.2. Filtration Tests
In the filtration experiments, the DAH dosage (0, 0.2, 0.5, 1.0, 2.0, 4.0, 7.0, and 10.0 kg/t) was set as the variable, and all tests were conducted using deionized water. The experimental samples were prepared via the following steps. A total of 1 g of DAH was dispersed in 100 mL of deionized water, yielding a 1% (w/v) DAH reagent solution. Subsequently, 5 g of kaolinite was mixed with 50 mL of deionized water, and different volumes (0.0, 0.1, 0.25, 0.5, 1.0, 2.0, 3.5, and 5.0 mL) of the DAH reagent were injected into the mixture using a syringe with a maximum capacity of 0.5 mL. The kaolinite suspension was then stirred uniformly at 300 r/min for 20 min using a magnetic stirrer to ensure homogeneous distribution of the components.
All filtration experiments were carried out with a Huichuang SCJ-10 pressure filter from Huichuang Chemical Instrument Co., Ltd., Shanghai City, China, and the vacuum pressure was kept stable at 71 kPa throughout the tests. Due to the presence of extremely fine particles in the suspension, all filtration tests employed BWD102 qualitative filter paper from Suzhou Baoweide Environmental Protection Technology Co., Ltd., Suzhou City, China as the filtration medium. The filter paper has a maximum pore size of 7–8 μm, an ash content of ≤0.15%, and a diameter of 4.2 cm. Filtrate was collected in 5 mL aliquots throughout filtration, with the matching recording time used to derive filtration rates. Filtration test was performed in triplicate, and the average value was adopted as the final result.
3.3. Determination of Slip Length
The capillary flow model proposed in Section 2 was adopted to back-calculate the slip length (b) from the acquired filtration experimental results. Analytical solutions to the differential equation in Equation (13) can be obtained through the following steps:
Equation (18) describes the filtrate collection rate. Linear curve is generated if t/(V/A) is plotted against the term (V/A). By virtue of the linear fitting curve, we can separately resolve the cake-specific resistance (rc) and filter-medium resistance (rm) from its slope and intercept.
M denotes the dry weight of the cake, ρsolid represents the particle density, A is the effective filtration area, and L refers to the cake thickness.
Subsequently, by calculating the porosity ε using Equation (19) and determining the capillary radius R via Equation (15), the slip length can then be calculated using Equation (14). All calculations were performed using the average values obtained from triplicate filtration experiments. The resulting slip lengths are reported in nanometers.
3.4. Surface Characterization
To unravel the underlying mechanism of modification by revealing the evolution of surface chemical composition, functional groups, interfacial charge and wettability, we sequentially performed zeta potential tests, contact angle measurements, XPS analysis and FTIR spectroscopy in this section. The suspension pH was not controlled, which may limit the assessment of its potential influence on DAH adsorption.
The determination of zeta potential values was completed with a Zetasizer Nano ZS device supplied by Malvern Instruments Ltd., Malvern, UK. The detailed operation steps were arranged as stated in the following content: we took 5 g kaolinite specimen and mixed it evenly with 50 mL deionized water, then supplemented DAH with a series of concentration gradients into the mixture. The mixture was magnetically stirred for 5 min to form a homogeneous suspension. After settling, the supernatant was collected as the test sample. The test was performed in triplicate, and the average value was taken as the final result.
The contact angle characteristic of molded kaolinite filter cakes was characterized through a HARKE-SPCA apparatus, with its manufacturer being Harke Test Instruments Co., Ltd. based in Beijing, China. Filtration tests were conducted under different DAH dosage gradients. The subsequent experimental operation was arranged as follows: a 0.3 g portion of filter cake was dried at a constant temperature of 105 °C for two hours, and compression processing at 20 MPa with a duration of one minute was conducted afterward. The resulting disc-shaped sample (10 mm in diameter) was tested at 25 °C for surface contact angle measurement. The test was performed in triplicate, and the average value was taken as the final result.
Fourier-transform infrared spectroscopy and X-ray photoelectron spectroscopy were applied to analyze DAH adsorption onto kaolin filter cakes, with the respective instruments being the Thermo Scientific NICOLET IS50 (Thermo Fisher Scientific, Madison, WI, USA) and ESCALAB 250XI (Thermo Fisher Scientific, East Grinstead, UK). All test specimens were kept at a constant temperature of 55 °C for a full 24 h to complete drying, then ground thoroughly to form fine powders before instrumental analysis.
For FTIR, powdered samples were mixed with KBr (1:100 by mass) and pressed into pellets under 15 MPa. Spectra were collected in transmission mode (4000–400 cm−1, 2 cm−1 resolution, 32 scans) after purging with dry nitrogen for 10 min. Background correction and smoothing were performed using OMNIC 9.2 software. For XPS, powder was adhered to conductive carbon tape and analyzed using Al Kα radiation. The instrument was calibrated with Au foil. After collecting survey spectra (0–1200 eV, step size 1 eV, pass energy 100 eV), high-resolution scans were recorded for C 1s, Al 2p and N 1s signals (0.1 eV step, 20 eV pass energy).
3.5. Micro-CT Imaging
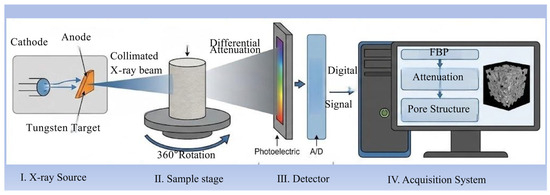
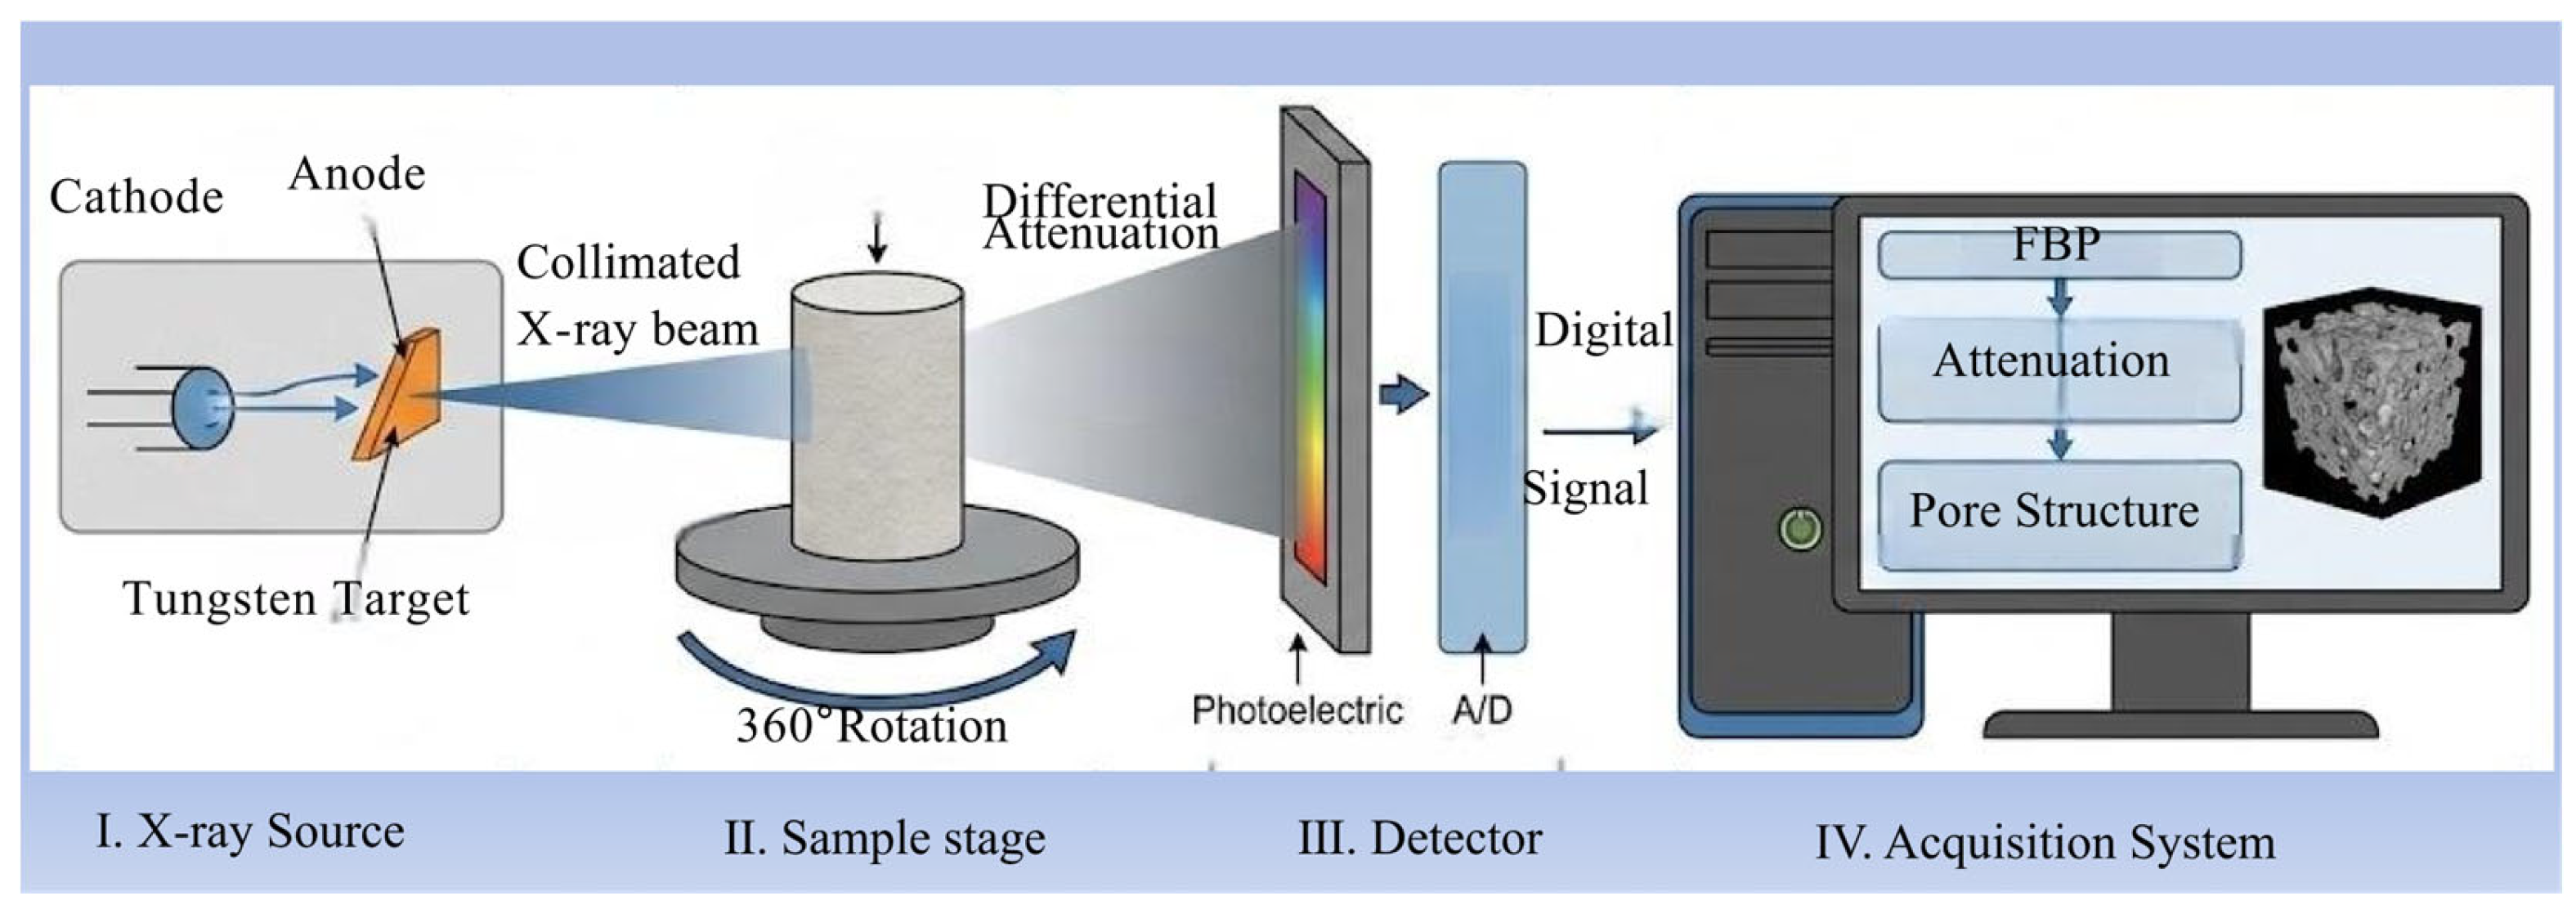
This study adopted micro-computed tomography (Micro-CT) to explore the pore structural characteristics of kaolin filter cakes. The filter cake structures of kaolinite, both without DAH and with an addition of 10 kg/t DAH, were scanned using NanoVoxel-4000 from Tianjin Auxinbo Technology Co., Ltd., Tianjin City, China. The imaging system of this equipment, as shown in Figure 3, primarily consists of an X-ray source (I), a sample stage (II), a detector (III), and a processor integrated with a data acquisition system (IV) for signal processing, ultimately reconstructing a three-dimensional structural image of the sample.
Figure 3.
Micro-CT scanning system.
The working principle is as follows: a collimated X-ray beam is generated by electrons emitted from a cathode bombarding a tungsten target anode. The sample, rotated 360°, undergoes projection scanning. As different components within the sample possess distinct linear attenuation coefficients, the transmitted X-rays undergo differential attenuation across various projection directions. A rear-positioned detector receives the attenuated signals, converts the transmitted X-rays into visible light, and then transforms the light into digital signals via a photoelectric converter and an analog-to-digital (A/D) converter for storage in a computer. The volumetric attenuation distribution is then recovered using algorithms such as filtered back-projection or iterative reconstruction, finally yielding a high-resolution three-dimensional internal structure image.
3.6. Lattice Boltzmann Method (LBM) Simulation
As the core variable of the LBM, the discrete velocity distribution function f(x, t, ζ) is employed for flow field calculation [31,32,33]. It characterizes the probability that a simulated particle exists at position x with velocity ζ at time t. The discrete Boltzmann equation can be formulated by means of the BGK collision approximation:
fi denotes the particle distribution function for lattice discrete velocity ei. The dimensionless relaxation time τ correlates with the kinematic viscosity of the fluid, and δt stands for the simulation time step. Equation (21) gives the equilibrium distribution function fieq:
where u describes the macroscopic fluid velocity, ωi refers to the weighting factor for particle populations moving along at lattice discrete velocity ei, ρ signifies fluid density, and the lattice sound speed follows Cs = 1/√3.
To numerically resolve the Lattice Boltzmann equation, the D3Q19 [34] lattice model is employed in the present study for three-dimensional flow analysis, whose weighting factors are listed below: ω0 = 1/3, ω1–6 = 1/18 and ω7–18 = 1/36. The expression of dimensionless relaxation time τ as a function of kinematic viscosity v takes the form:
Macroscopic density ρ and fluid velocity u can be calculated via the equilibrium function fieq as follows:
For weakly compressible fluids within the low-Mach-number range, the LBM restores the standard Navier–Stokes equation through Chapman–Enskog expansion analysis. The correlation between fluid pressure and density in this model is described by the equation of state below:
During further numerical computations, a fixed pressure gradient propels the water flow downward from the upper boundary to the lower boundary. Furthermore, to investigate the influence of fluid boundary slip length on the flow characteristics in filter cakes, we employed the partial bounce-back slip boundary scheme for fluid–solid boundary nodes. The partial bounce-back scheme is a linear combination of the standard bounce-back scheme (no-slip) and the specular reflection scheme (full-slip). Its core concept is that when fluid particles collide with a wall, a fraction of the particles return according to the bounce-back rule, while the remaining portion returns following the specular reflection rule. The partial bounce-back slip boundary scheme is a flexible, intuitive, and easy-to-implement slip boundary treatment method in LBM. By adjusting the bounce-back coefficient β, the degree of slip can be precisely controlled, making it suitable for studying the influence of slip on flow characteristics. Through Chapman–Enskog analysis, the relationship between the slip length Ls and the bounce-back coefficient β can be derived.
The coefficient β is calibrated so that the simulated slip length equals the value back-calculated from the filtration experiments. The lattice spacing is fixed by the resolution of the reconstructed geometry. The volume of interest is a cube of approximately 400 μm on each side; this follows directly from the Micro-CT pore volume and porosity in Table 1 (for the reagent-free cake, 8,079,439 μm3/0.1262 ≈ 6.40 × 107 μm3, corresponding to a side length of about 400 μm). This volume is resolved by 400 lattice nodes along each axis, so the lattice spacing is Δx ≈ 1.0 μm (=1000 nm). The same Δx and the same boundary scheme are applied to both cakes.
Table 1.
Filter cake pore structure parameters.
In the half-way bounce-back format the standard no-slip wall (β = 1) is located half a lattice inside the solid node, so the quantity returned by Equation (26) contains a geometric offset of 0.5Δx rather than a physical slip. The physical slip length is therefore b = Ls − 0.5Δx = (1/β − 1)Δx, and inversion gives the calibration rule
β = 1/(1 + b/Δx)
For the 10 kg/t DAH condition, substituting b ≈ 70 nm and Δx = 1000 nm gives β = 1/(1 + 0.07) ≈ 0.935, i.e., about 93.5% of the colliding particles follow the bounce-back rule and the remaining 6.5% follow the specular rule. Using the independently reconstructed value b = 64.8 nm gives β ≈ 0.939, in close agreement. The reagent-free cake uses β = 1 (pure bounce-back, no physical slip). Because b/Δx = 0.07, the imposed slip is small relative to the lattice spacing and therefore well resolved, which keeps the boundary treatment numerically stable.
A single-phase lattice Boltzmann model (LBM) was constructed through self-programming in Python 3.10. The computational performance was efficiently harnessed via the OpenMPI 4.1.8 parallel computing library to fully utilize processor resources, and the simulation results were post-processed and analyzed using the scientific data visualization tool ParaView 5.11.2. All computational tasks were performed on a parallel cluster running the Ubuntu operating system, equipped with 112 Intel Xeon processors (2.4 GHz base frequency, and 512 GB of memory).
4. Results and Discussion
4.1. Quantification of Slip Length and Filtration Enhancement
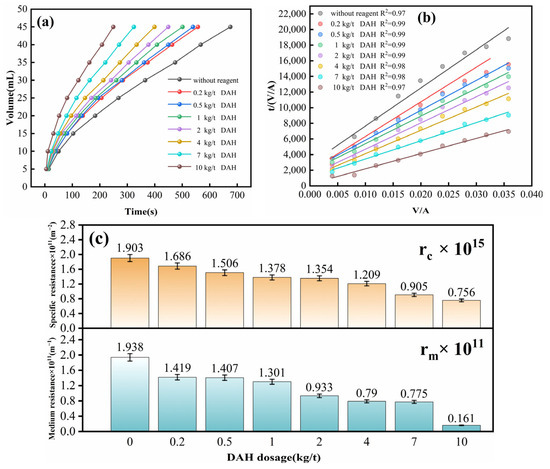
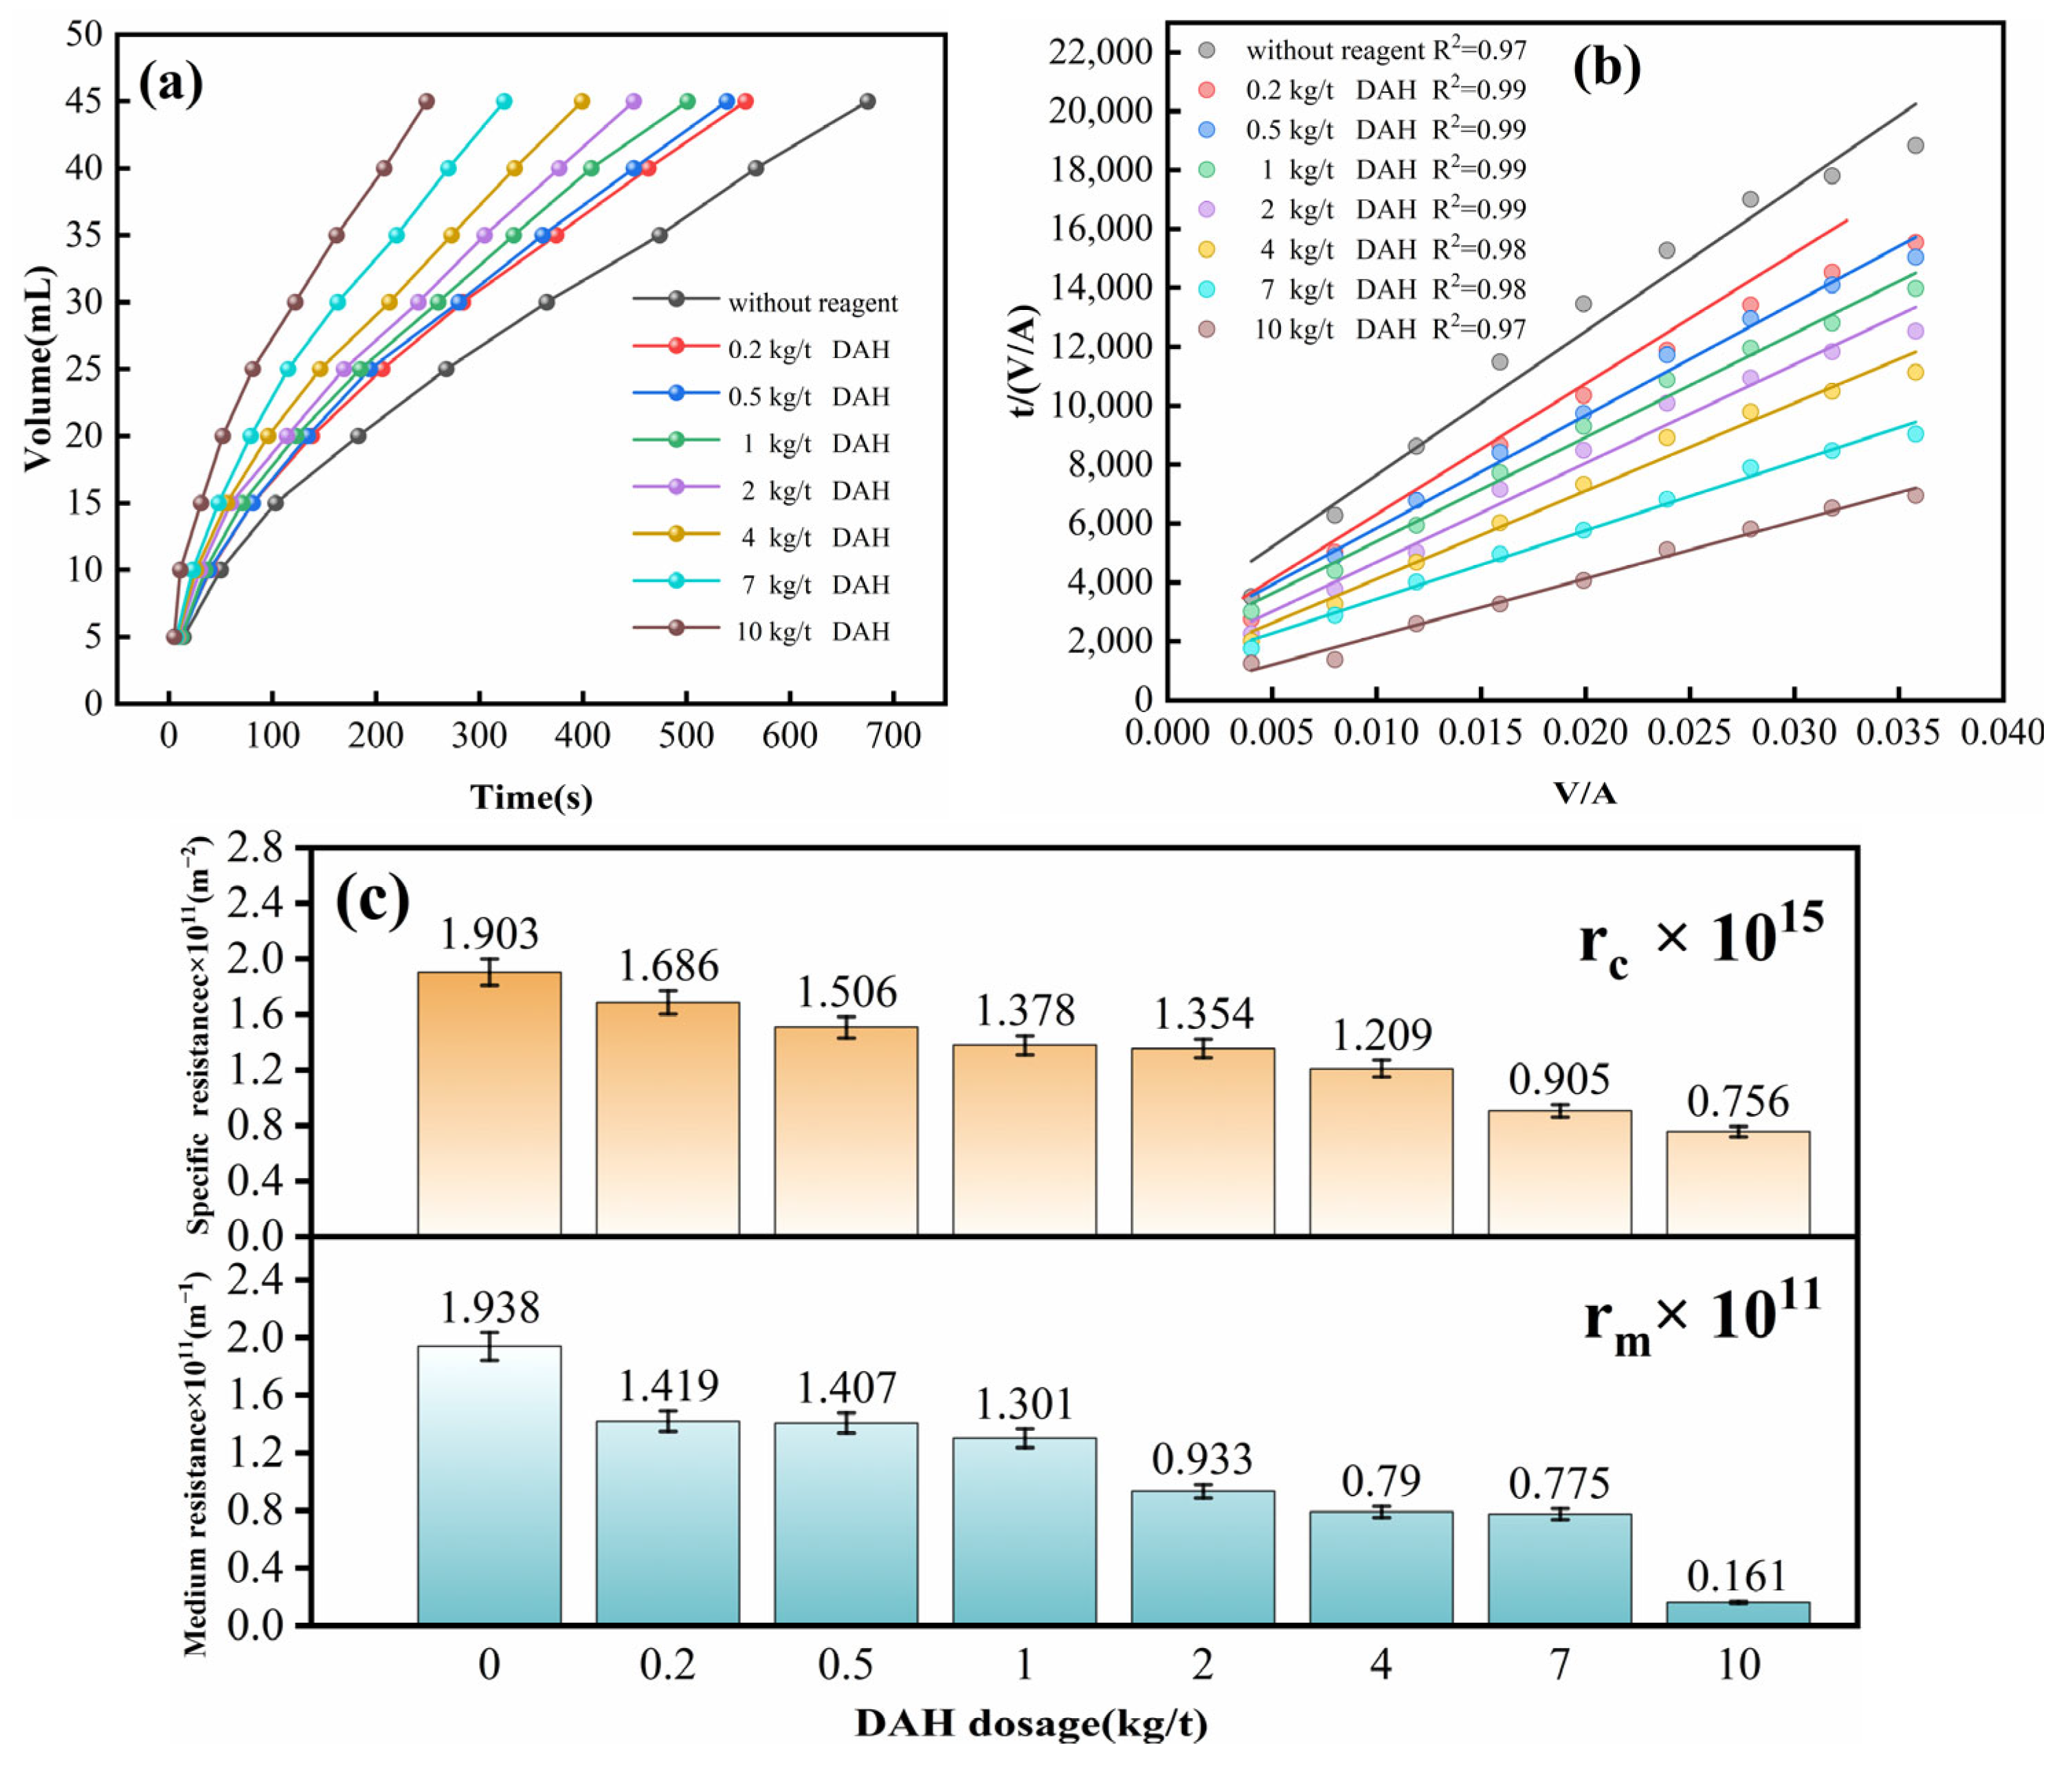
Filtration rate is a critical performance indicator in filtration processes, reflecting both operational efficiency and the overall condition of the filtration system. In this study, the kaolin filtration process is shown in Figure 4a, where the filtrate volume (which corresponds to the filtration rate per unit time) varies with time under different DAH dosages. In the absence of a reagent, the filtrate volume increased slowly over time, indicating the lowest filtration rate. As the DAH dosage was raised from 0.2 kg/t to 10 kg/t, the filtrate volume exhibited a gradually accelerating growth trend. Ultimately, at a DAH dosage of 10 kg/t, the rate of filtrate volume increase reached its peak, corresponding to the highest filtration rate among all tested conditions.
Figure 4.
Influence of DAH on filtration. (a) Filtrate volume vs. filtration time. (b) Linear fitting curve. (c) Cake-specific resistance and filter-medium resistance.
The fitting curve in Figure 4b was derived from the experimental filtration data in conjunction with the filtration model established in Section 3.3. Figure 4b presents the linear fitting curves under different DAH dosage gradients and the goodness-of-fit (R2) of all adjusted datasets is greater than 0.96. The cake-specific resistance (rc) is determined via the slope of the fitted curve, and the filter-medium resistance (rm) can be obtained from the corresponding intercept term. Figure 4c illustrates the relationship between DAH dosage, cake-specific resistance (rc), and filter-medium resistance (rm). It can be observed that both the cake-specific resistance and filter-medium resistance decrease with the elevated dosage of DAH. This can be attributed to the significant reduction in flow resistance induced by DAH in fine-particle systems. In such systems, which exhibit effective capillary characteristics, DAH promotes particle aggregation, thereby reducing pore blockage in the filter cloth and consequently lowering the overall filtration resistance.
The presence of a hydrophobic reagent reduces the specific resistance of the filter cake and enhances the flow rate within the capillary channels of the cake, which is attributed to the occurrence of the “particle surface slip” phenomenon. This section describes the procedure for estimating the slip length based on the filtration model outlined in Section 3.3 under the action of the hydrophobic reagent. The model requires the determination of four parameters: cake-specific resistance (rc), medium resistance (rm), cake porosity (ε), and mean capillary radius (R). According to Equation (18) and the linear fitting of the macroscopic filtration data in Figure 4b, the cake-specific resistance (rc) and filter-medium resistance (rm) are obtained from the slope and intercept of the fitted line, respectively. According to Equation (18) and the linear fitting of the macroscopic filtration data in Figure 4b, the cake-specific resistance (rc) and filter medium resistance (rm) are obtained from the slope and intercept of the fitted line, respectively. In addition to rc, rm and ε, determining the slip length also requires calculating the mean capillary radius (R). The capillary model assumes the flow channels to be cylindrical structures with a constant radius. Accordingly, Equation (15) was utilized to evaluate R from the experimentally determined previously obtained parameters under the condition without reagent addition. Following the acquisition of four characteristic parameters (rc, rm, ε, and R), the slip length b was solved via Equation (14), and calculated data are presented in Figure 5.
Figure 5.
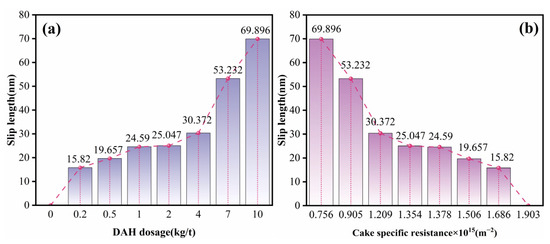
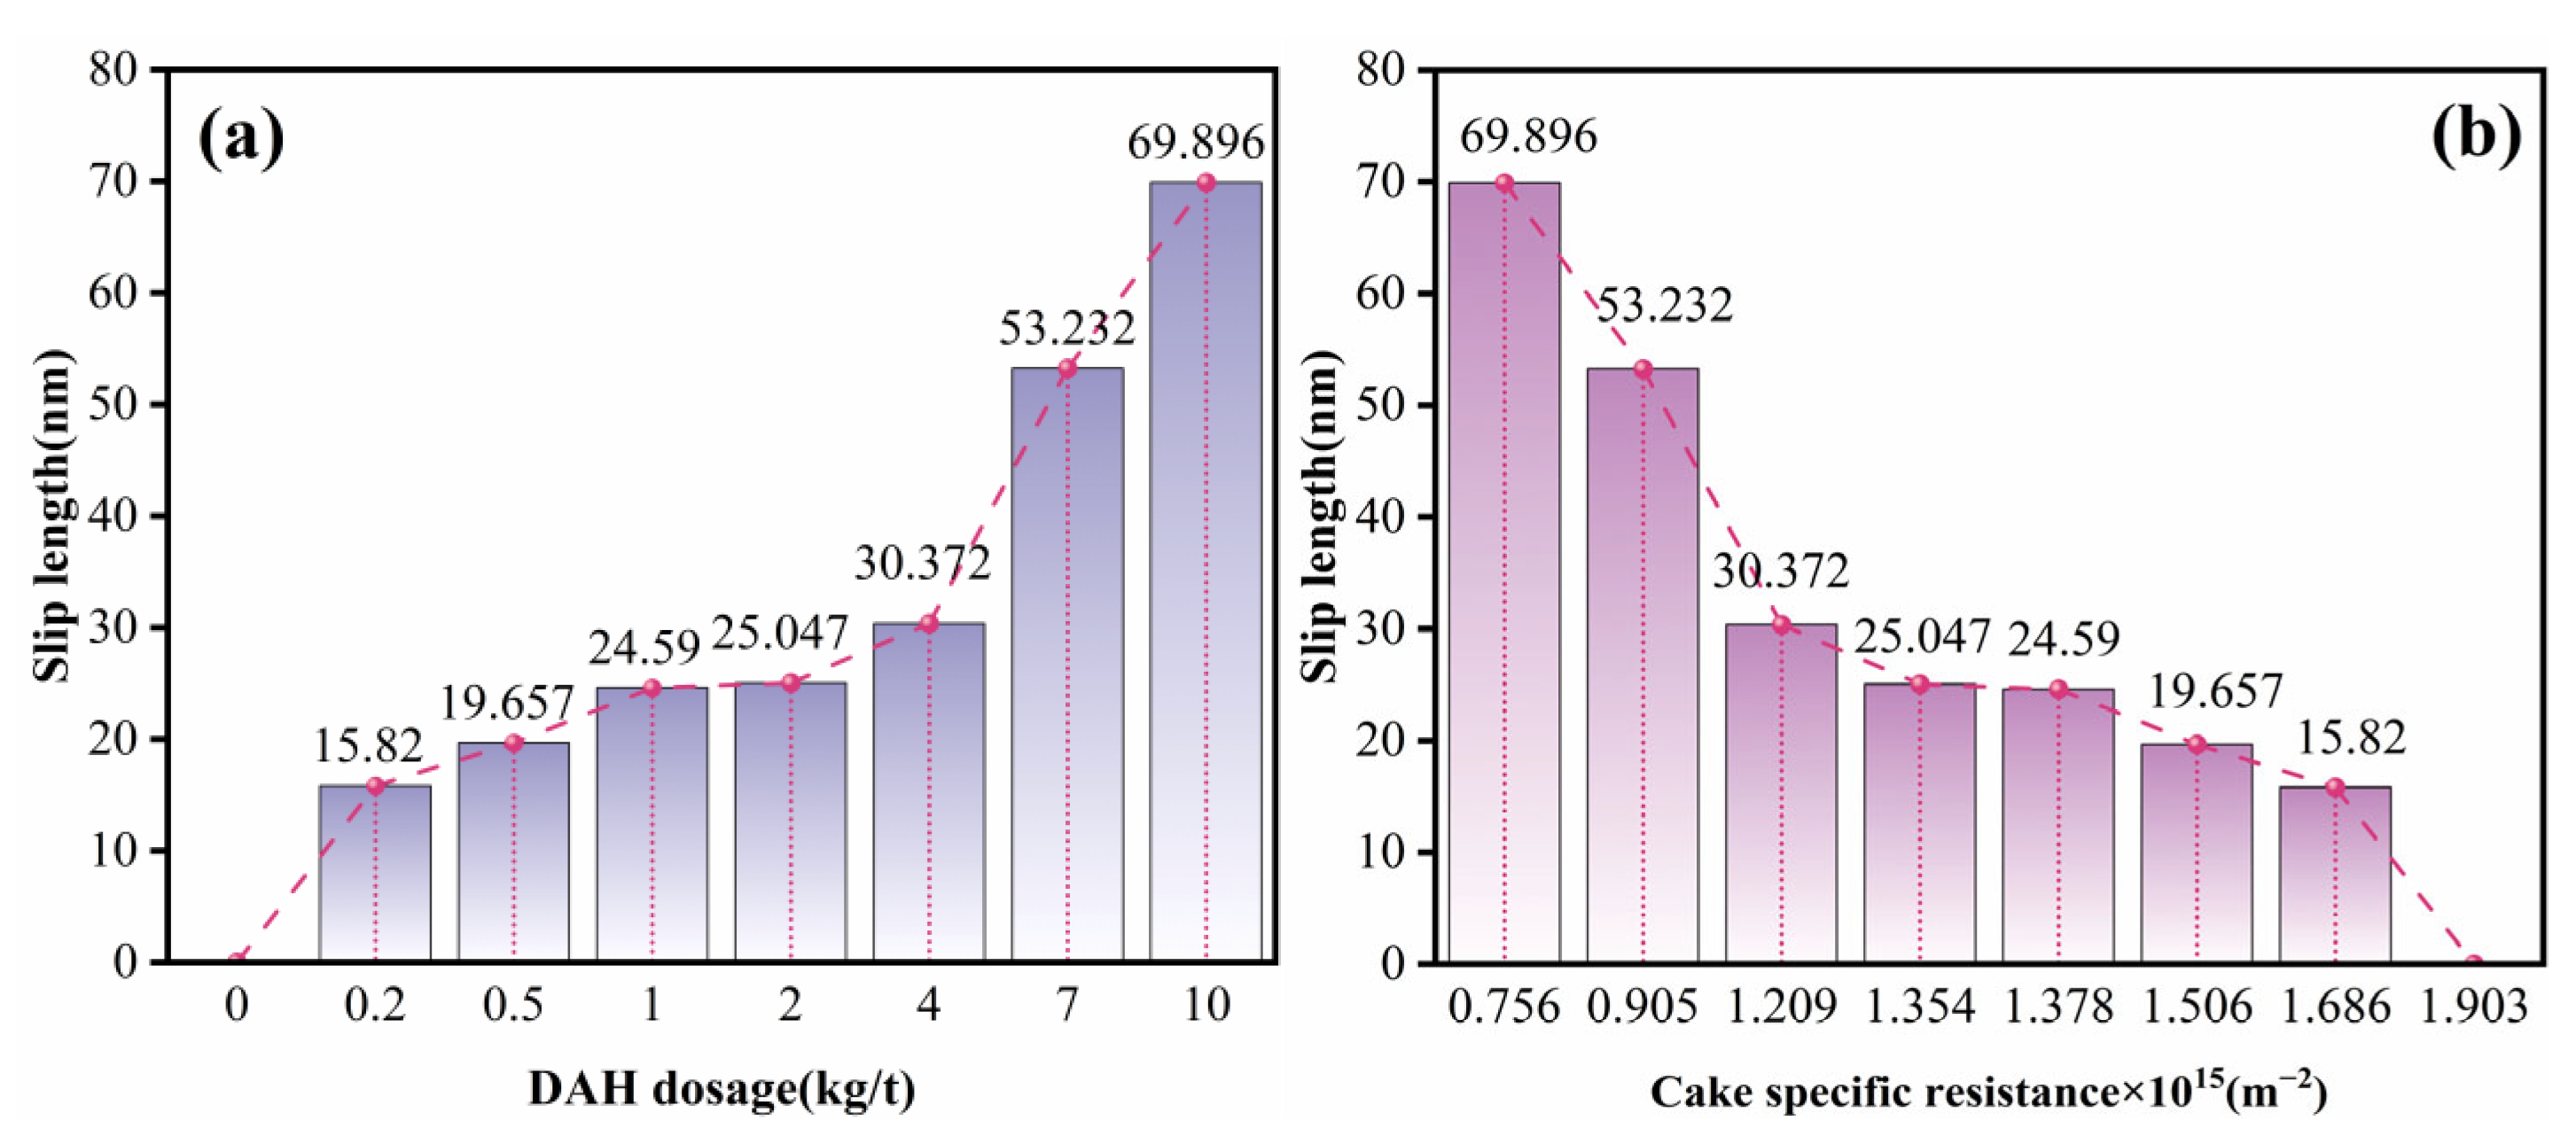
Relationship between slip length, specific resistance, and DAH dosage. (a) DAH dosage vs. slip length. (b) Slip length vs. specific resistance.
Figure 5 illustrates the relationship among slip length, cake-specific resistance, and DAH dosage in the kaolinite filtration system. It can be observed that the slip length increases with higher DAH dosage, while it exhibits a negative correlation with cake-specific resistance. These observations demonstrate that DAH dosing improves the filtration behavior of kaolinite through an elevated slip length. This phenomenon stems from the adsorption of DAH onto kaolinite particle surfaces. The adsorbed DAH modifies the wettability and interfacial tension at the particle-filtrate interface, which effectively reduces filter cake resistance and increases the filtrate slip length along cake pore walls.
4.2. Effect of Hydrophobicity
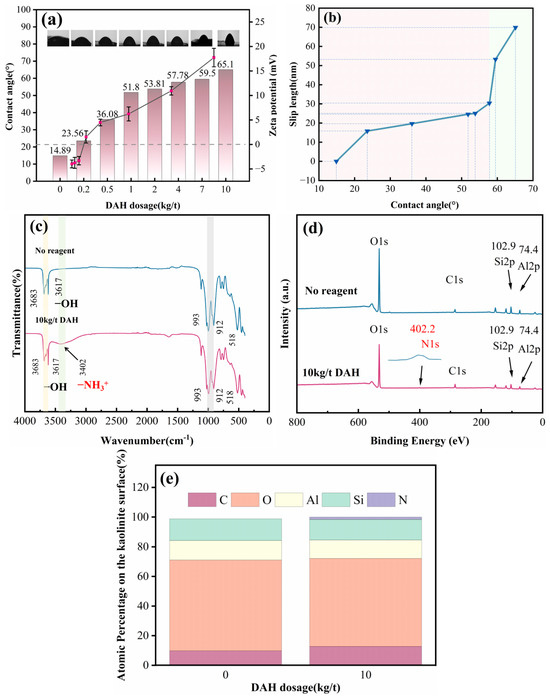
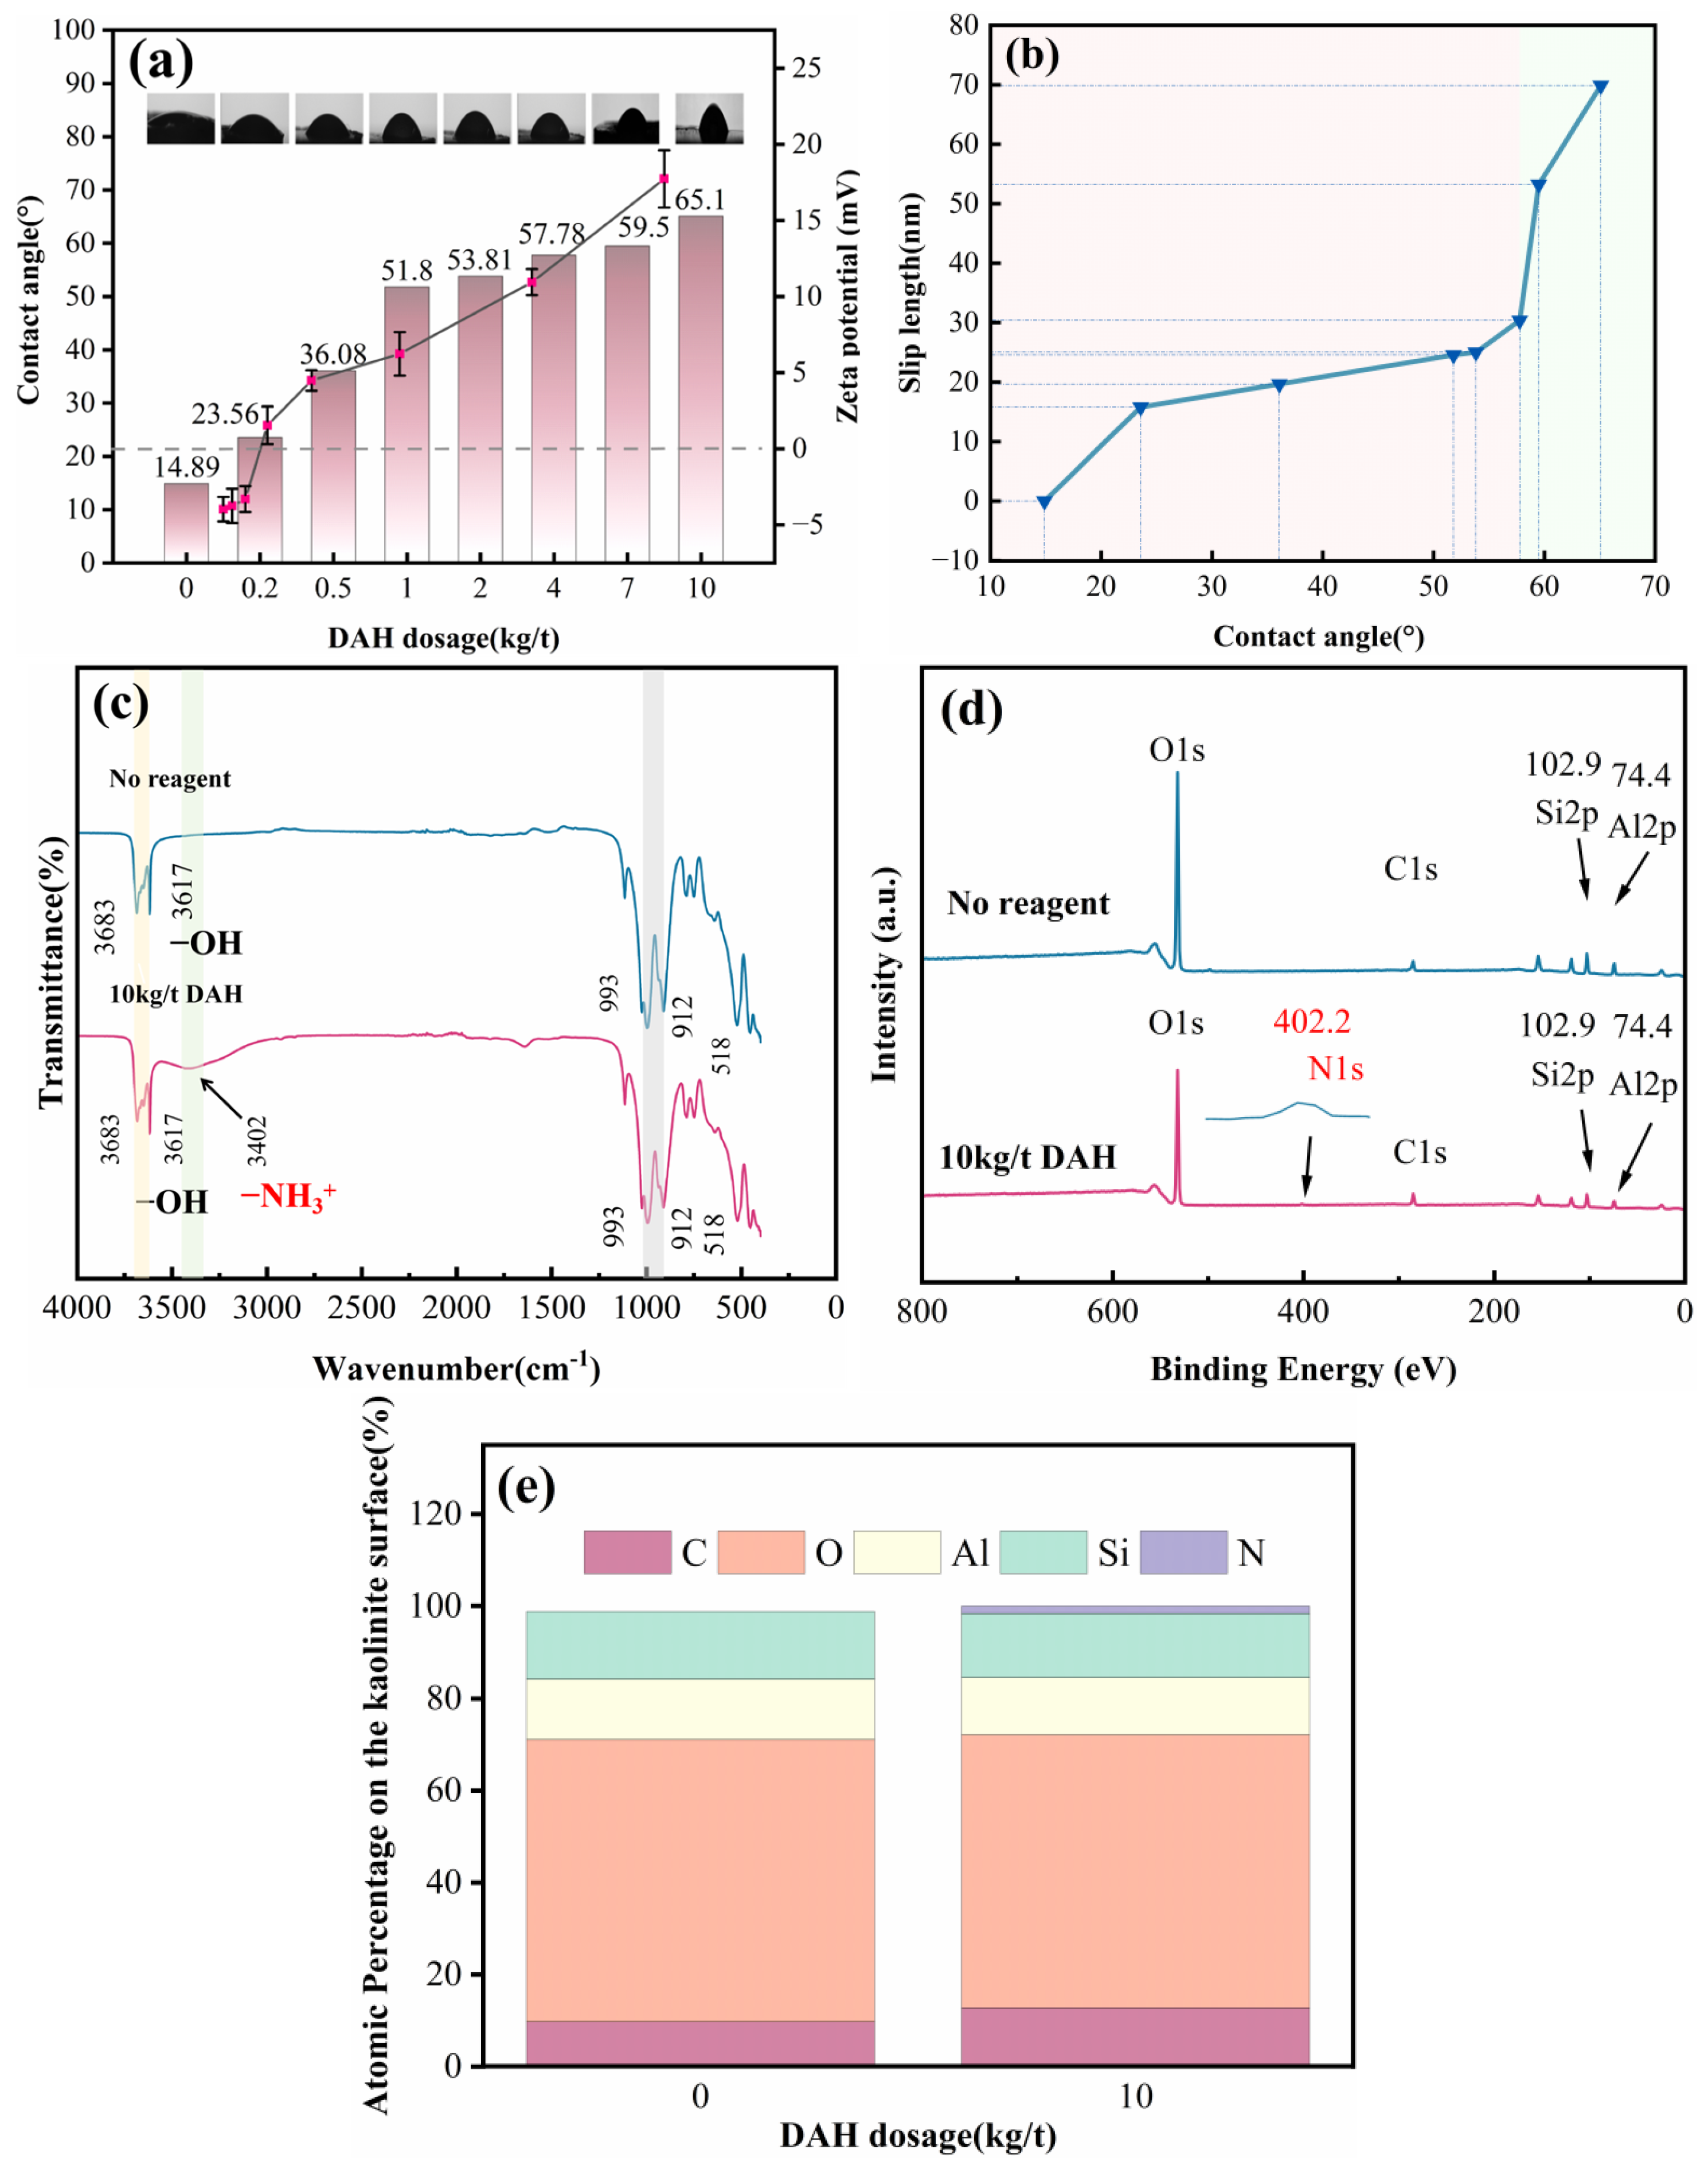
Zeta potential serves as a key indicator for characterizing both the nature and magnitude of surface charges on particles [35]. The measured supernatant potential results in the kaolin suspension system are presented in Figure 6a.
Figure 6.
Characterization results of kaolinite hydrophobicity. (a) Contact angle and zeta potential at different DAH dosages. (b) Contact angle vs. slip length. (c) FTIR. (d) XPS. (e) Atomic percentage on the kaolinite surface.
The results in Figure 6a show that the zeta potential of kaolinite increases rapidly at lower DAH concentrations and then rises gradually as the dosage further increases. This trend can be explained by the initially negative surface charge of kaolinite. At lower dosages, cationic groups of DAH neutralize the negative surface charge via electrostatic interactions, leading to a sharp increase in Zeta potential. With increasing DAH dosage, enhanced adsorption promotes a transition of the particle surface charge from negative to positive.
The contact angle corresponds to the steady angle generated at the three-phase contact line once liquid droplets rest on solid surfaces and attain thermodynamic equilibrium. This angle is determined by the interplay of surface tensions among the solid, liquid, and gas phases, and directly reflects the wettability of the solid surface. The measured contact angles for kaolin filter cake tablets under different DAH dosages are shown in Figure 6a. It can be observed that as the DAH dosage increases, the contact angle exhibits a significant upward trend. This variation originates from the adsorption of DAH onto the kaolin surface, where it forms a hydrophobic film. This process reduces the hydrophilicity of the particle surface, consequently leading to an increase in the apparent contact angle.
Building on the adsorption behavior and surface chemical modification mechanism of DAH on kaolin, we further investigated how surface hydrophobicity modulates solid–liquid interfacial slip properties. As shown in Figure 6b, the water contact angle exhibits a significant positive correlation with the slip length. The underlying mechanism can be attributed to the synergistic evolution of molecular interactions and microstructures at the solid–liquid interface: strong hydrogen bonding between hydrophilic surfaces and water molecules forms a dense, stationary boundary water layer that obeys the classical no-slip boundary condition; as hydrophobicity increases, solid–liquid interactions weaken, leading to a substantial reduction in interfacial frictional resistance and thus pronounced slip. These results demonstrate that tuning surface hydrophobicity enables a continuous transition from no-slip to strong slip, providing an effective approach for the controllable construction of slip effects with varying intensities.
To further elucidate the adsorption intensity of DAH on kaolinite particles, Fourier-transform infrared spectroscopy (FTIR) and X-ray photoelectron spectroscopy (XPS) were employed to investigate the variations in surface functional groups and elemental composition. The corresponding spectra and analysis results are presented in Figure 6c–e.
As shown in Figure 6c, the FTIR spectrum of the kaolin filter cake without DAH exhibits characteristic peaks at 3683 cm−1 and 3617 cm−1, which correspond to the stretching vibrations of surface hydroxyl groups (-OH) and represent inherent structural signals of kaolinite. After the addition of 10 kg/t DAH, a new peak emerges at 3402 cm−1, attributed to the stretching vibration of protonated amino groups (-NH3+). This results from the tendency of DAH (dodecylamine) to combine with H+ in aqueous solution, forming positively charged -NH3+ groups, while the kaolinite surface typically carries a negative charge. Adsorption thus may occur primarily through electrostatic attraction. The retention of the original hydroxyl peaks indicates that DAH adsorption may involve surface immobilization via electrostatic interactions and hydrogen bonding, rather than complete displacement of kaolinite hydroxyl groups. This process effectively modifies the surface hydrophobicity of kaolinite.
Figure 6d and the surface elemental composition data in Figure 6e clearly demonstrate the characteristic XPS peaks and their corresponding atomic percentages for Al 2p, Si 2p, O 1s, and C 1s in the DAH-free kaolin filter cake. Upon the addition of 10 kg/t DAH, a new N 1s peak emerges with an atomic concentration of 1.55%, while the contents of the characteristic kaolin elements Al and Si decrease by 0.72% and 0.73%, respectively. The appearance of nitrogen, a distinctive element of DAH, confirms its successful adsorption onto the kaolin surface, with the concurrent increase in carbon content attributed to DAH’s hydrocarbon chains. The slight reduction in O, Al, and Si percentages results from the partial masking of the kaolin surface by the adsorbed DAH layer. Moreover, the absence of significant binding energy shifts in the Al 2p and Si 2p peaks indicates that DAH adsorption occurs only superficially without altering the crystal structure of kaolin. The N 1s peak located at 402.2 eV further suggests that the adsorbed nitrogen exists in a protonated form (-NH3+) rather than as free -NH2. This is attributed to the protonation of DAH in aqueous solution to form positively charged -NH3+ species, which may electrostatically interact with negatively charged sites on the kaolinite surface arising from hydroxyl dissociation, thereby modifying the surface charge and hydrophobicity of the filter cake.
4.3. Evolution of Pore Network Under Slip Conditions
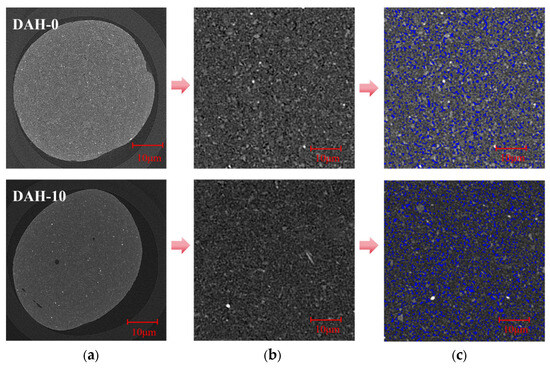
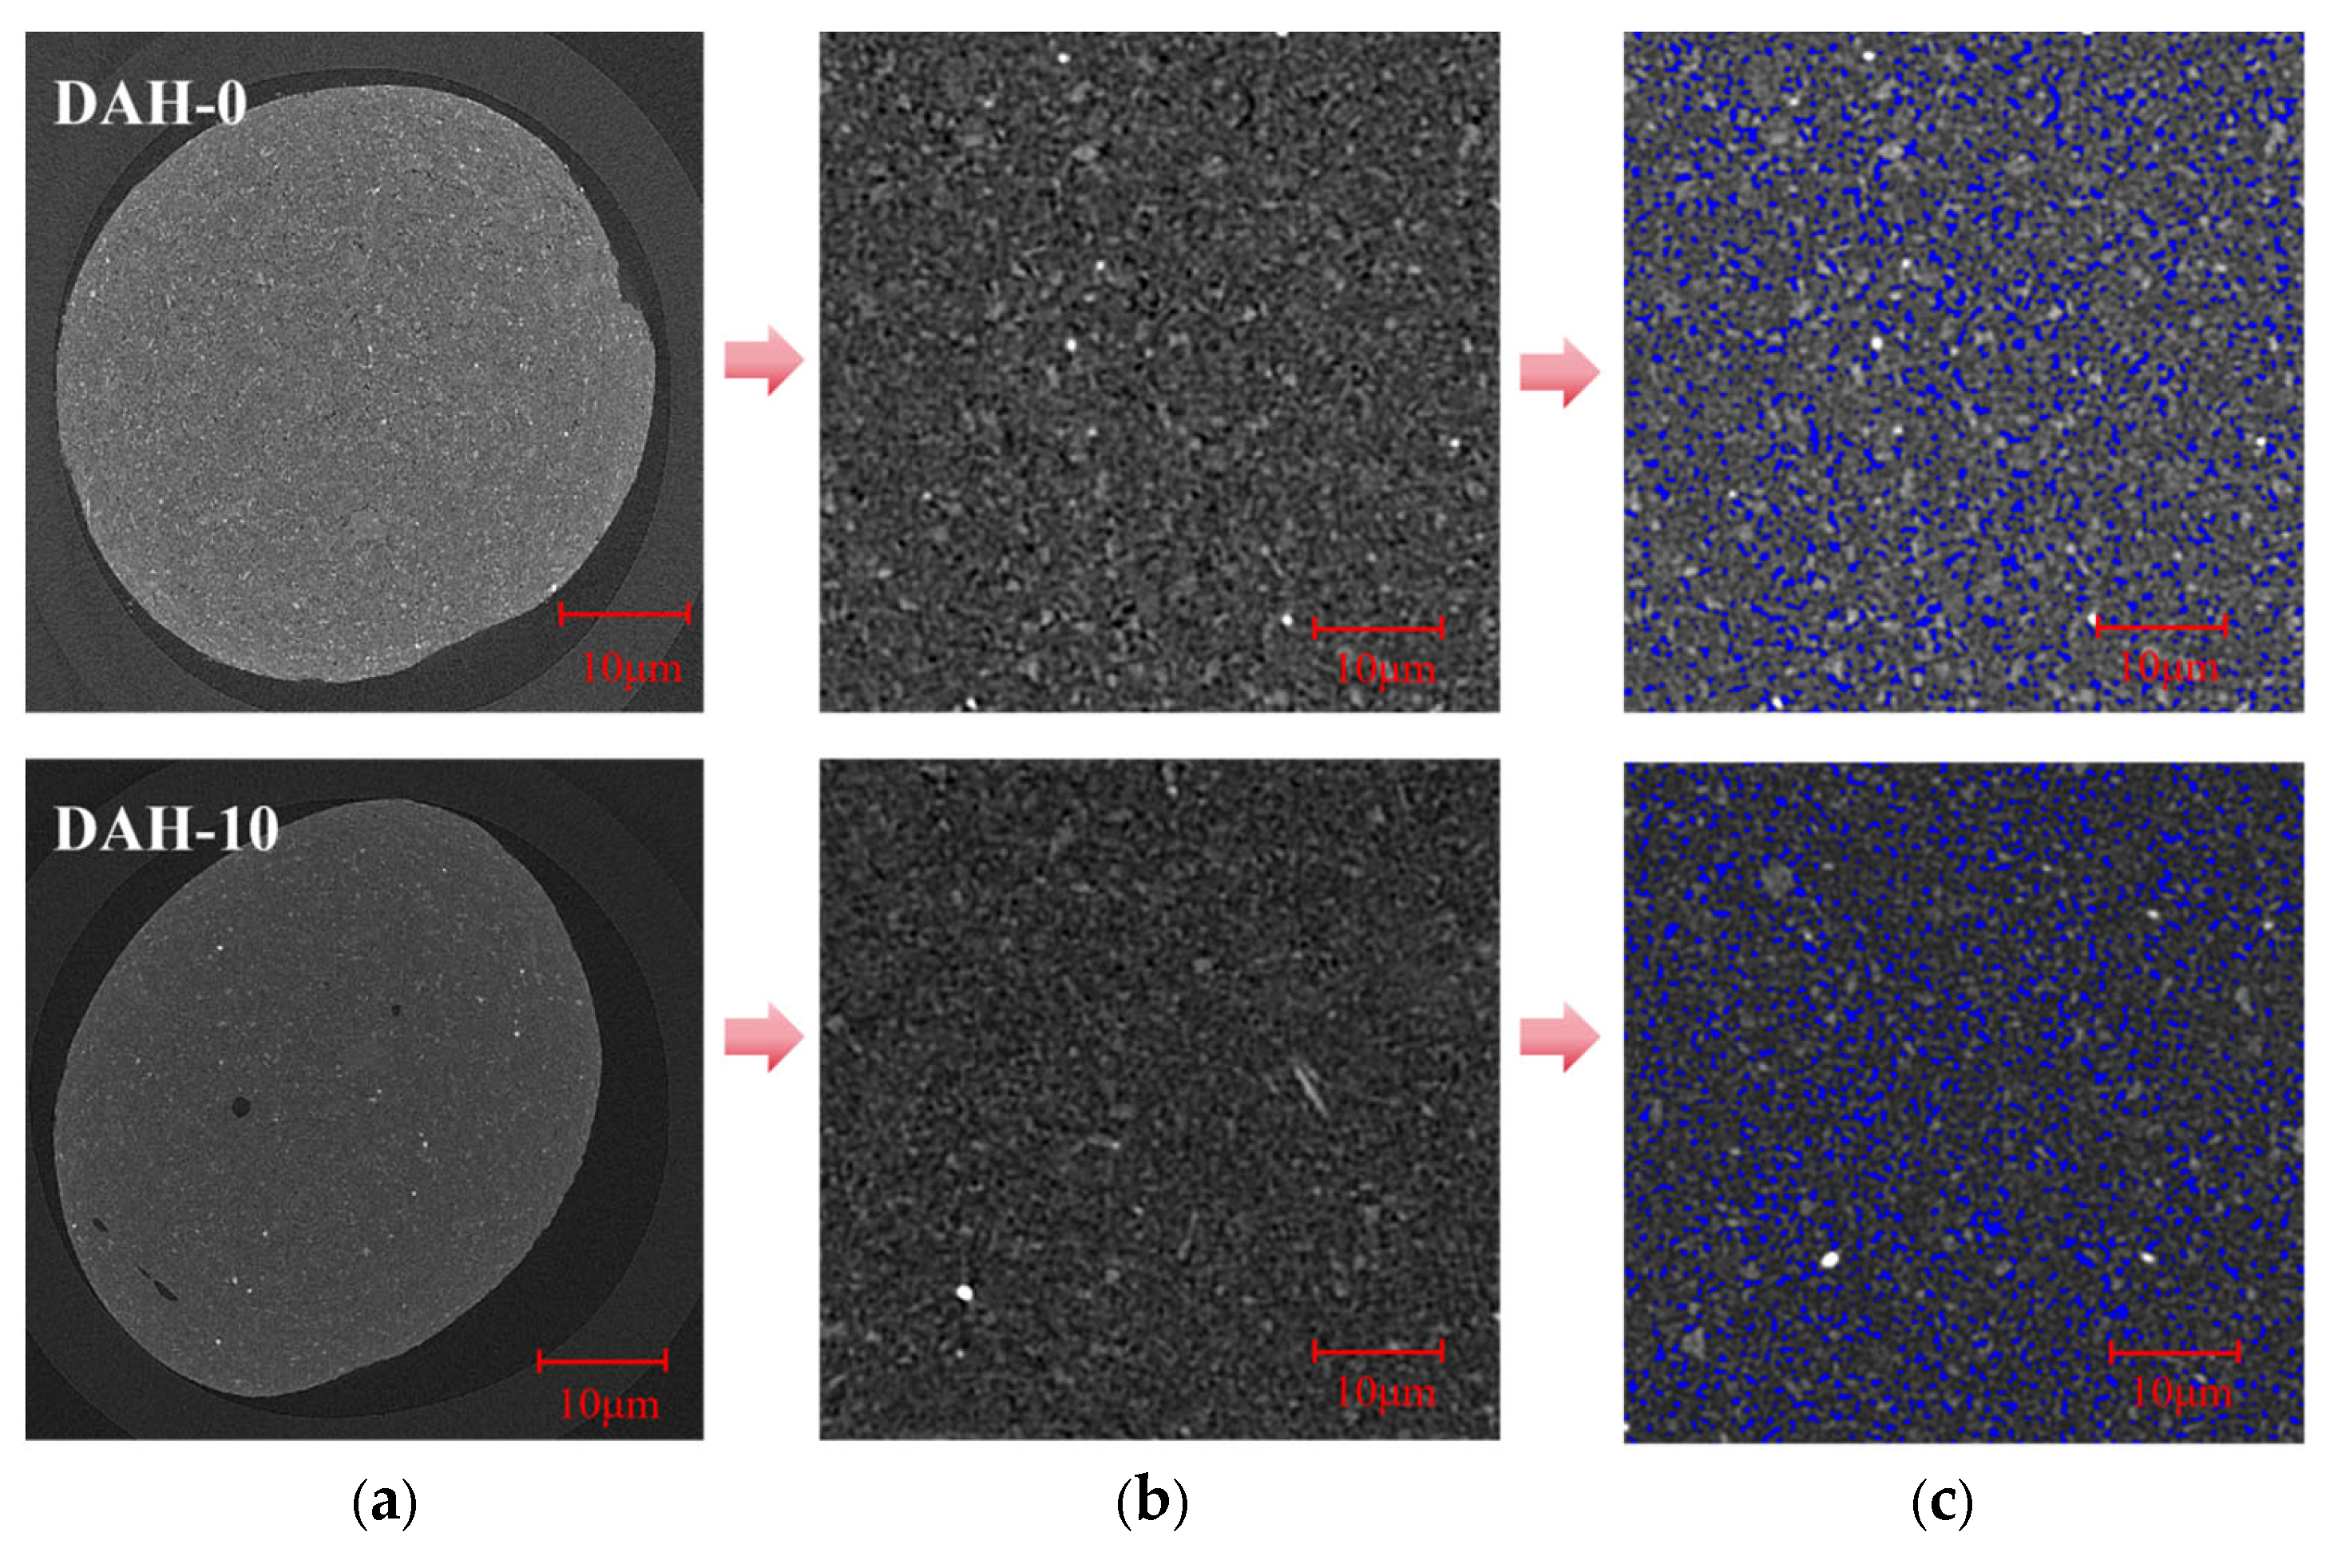
CT scanning (computed tomography) is a non-destructive, high-precision imaging technique that offers significant advantages and distinct features over traditional methods such as mercury intrusion porosimetry and nitrogen adsorption when analyzing pore structures [36]. When performing CT scans, the extent of X-ray attenuation relies on the density and atomic number of the target materials [37]. In this study, Avizo 2024 software was employed for the preprocessing of the scanning results and the same relevant treatments were applied to both samples. As shown in Figure 7 the upper panels display the scanning results without DAH, while the lower panels represent those with the addition of DAH. As illustrated in Figure 7a,b, representative grayscale slices were selected and cropped to define an appropriate volume of interest for subsequent threshold segmentation. The corresponding processed images after threshold segmentation are shown in Figure 7c. Pores (blue) are embedded between kaolinite particles.
Figure 7.
Post-processing of two-dimensional CT results. (a) Raw slice image. (b) Image enhancement. (c) Threshold segmentation.
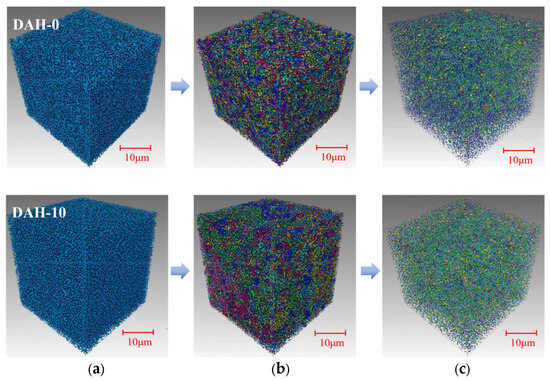
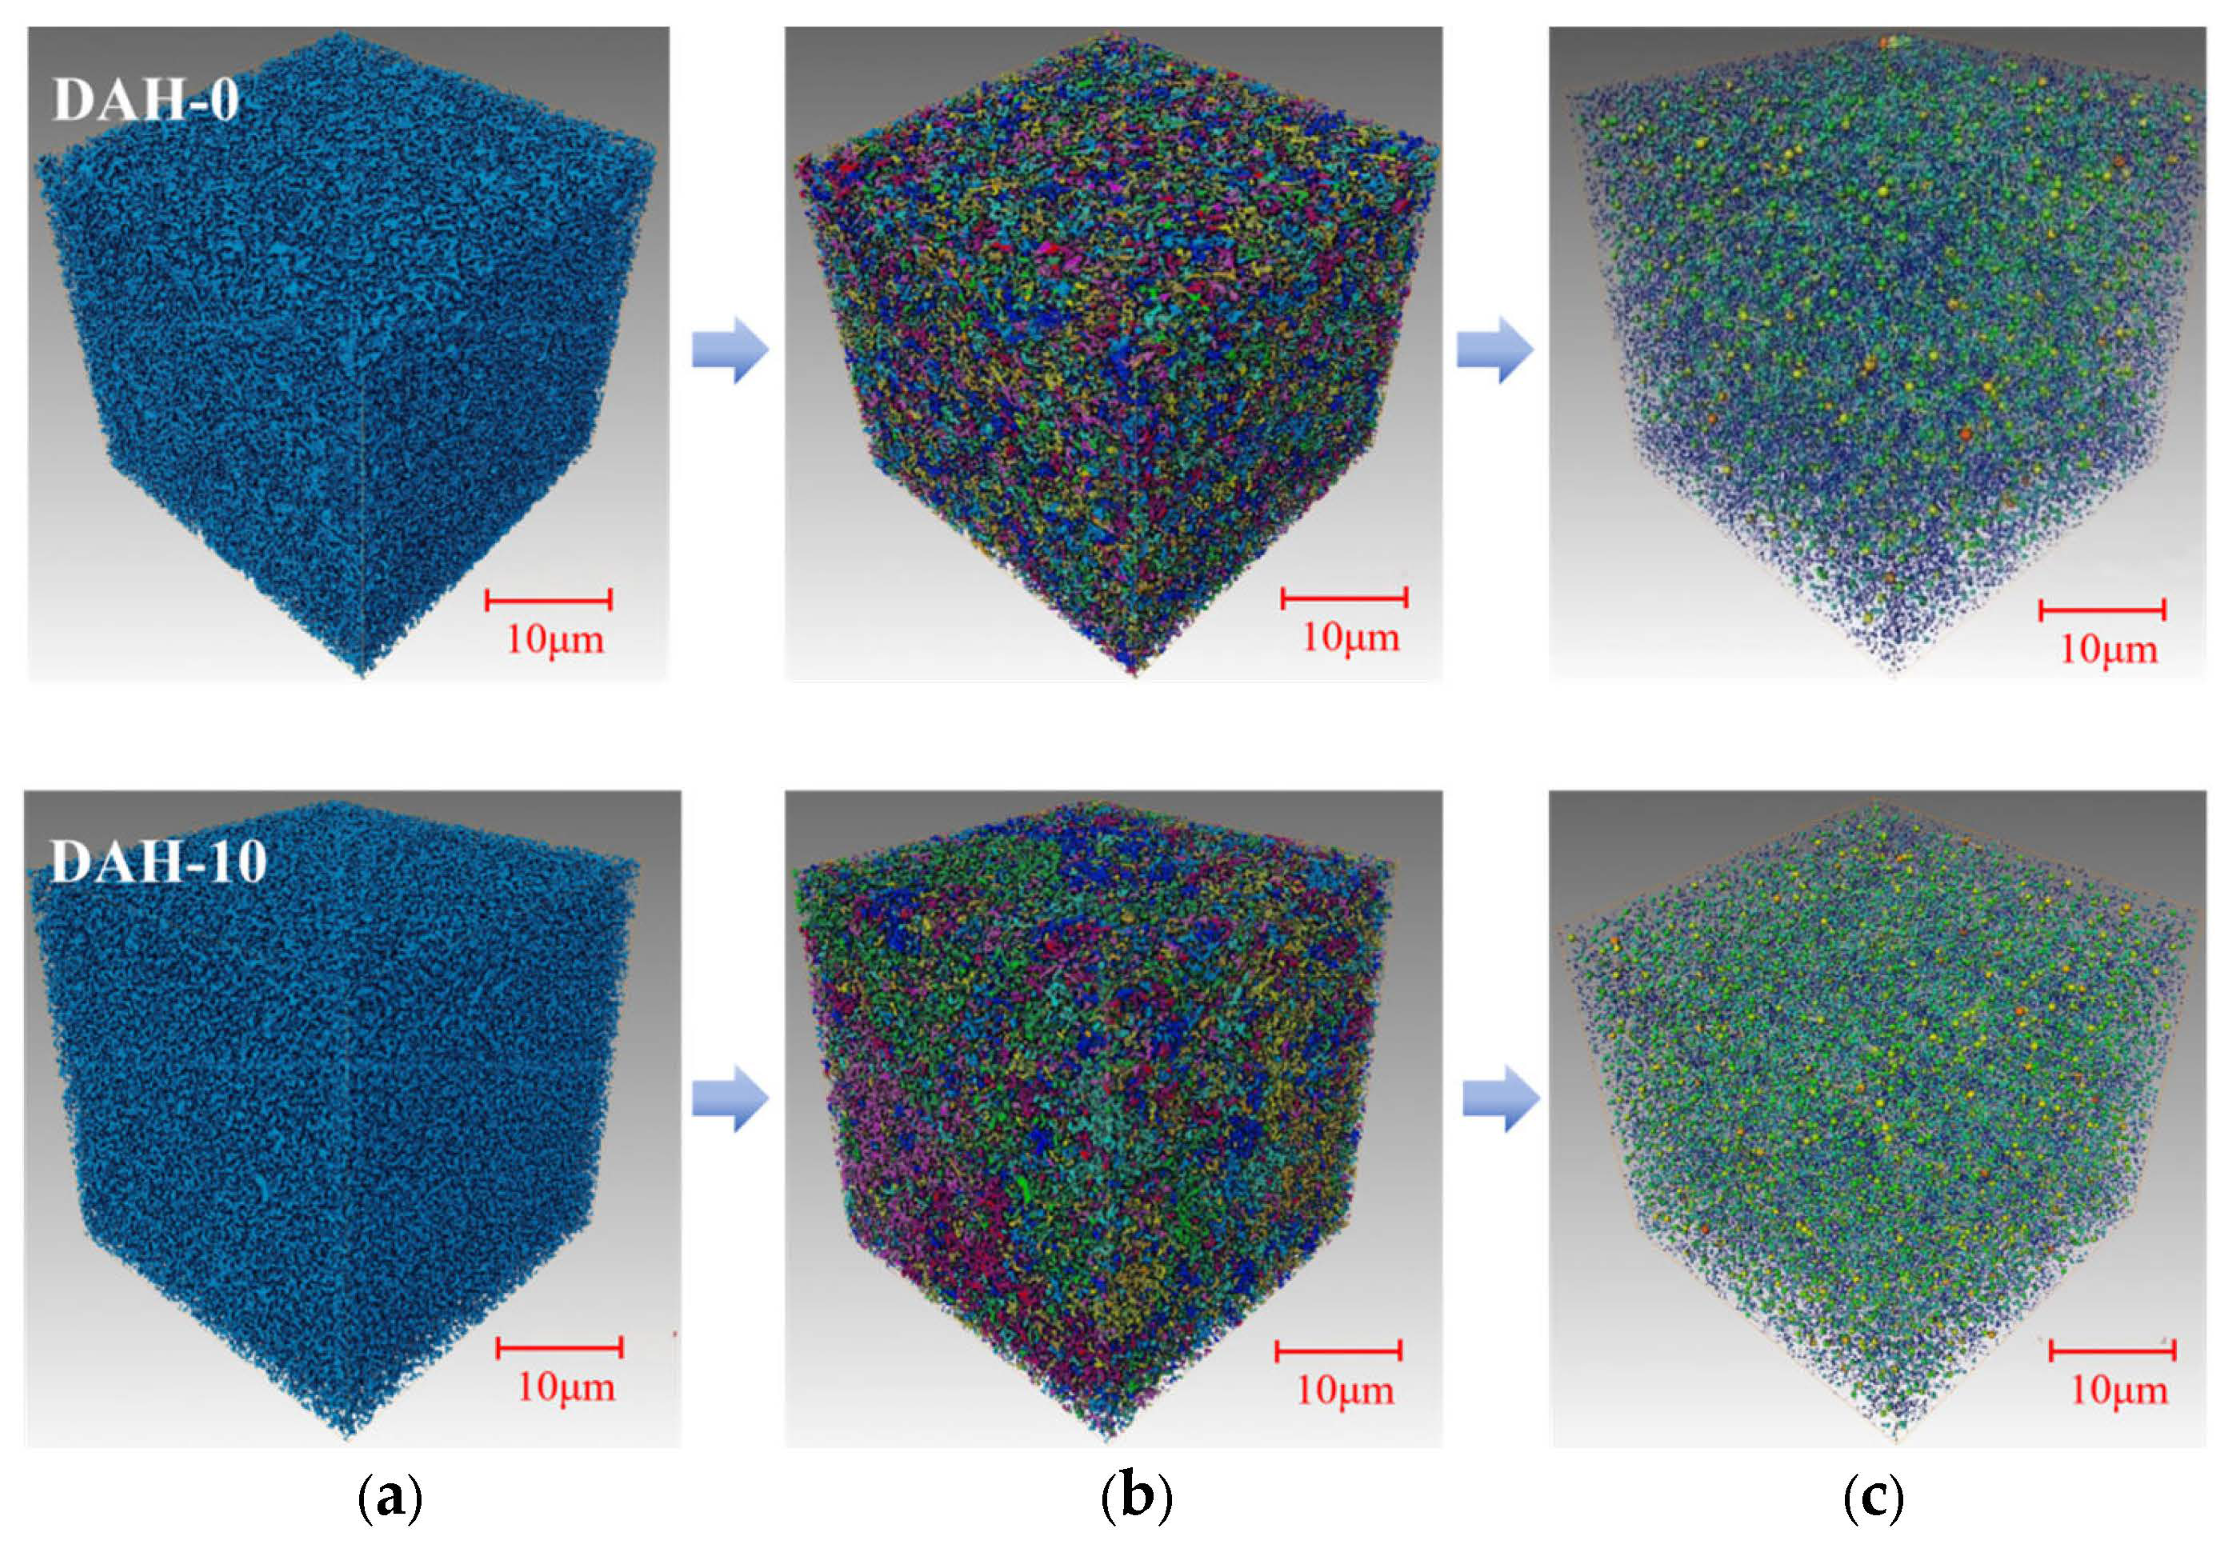
Compared with two-dimensional image analysis, constructing three-dimensional pore structures can restore the true spatial morphology and connectivity of pores, providing both intuitive visualization and a high-fidelity geometric model for simulating fluid transport [38], as illustrated in Figure 8a. The “Separate Objects” module was adopted to segment pore spaces, which were then grouped by size ranges and assigned different colors for differentiation; their 3D structures are illustrated in Figure 8b. Subsequently, label analysis together with relevant algorithms were utilized to compute the porosity of the established pore model, and the results are summarized in Table 1.
Figure 8.
Post-processing of three-dimensional CT results. (a) 3D pore reconstruction. (b) Separated pore reconstruction. (c) Pore-network model.
Common methods for pore-network extraction mainly include four types: the maximal ball method [39], the multi-directional scanning method [40], the Voronoi diagram method [41], and the medial axis method [42,43]. Due to the complex characteristics of filter cake pores—high randomness, heterogeneity, multi-scale nature, and the presence of numerous blind pores—this study employs the maximal ball algorithm. This method accurately defines pore bodies and throats through a mechanism of “sphere expansion until contact with solid particles.” The resulting pore-network model is shown in Figure 8c, where spheres of different colors and sizes represent pores of different volumes, and cylinders of varying lengths and radii correspond to connecting throats.
As shown in Table 1, the model is dominated by small pores and fine throats. After the addition of DAH, the filter cake porosity increased from 12.62% to 13.73%, with a simultaneous increase in pore volume. The proportion of effective volume rose from 9.09% to 11.74%, while the proportion of isolated pores decreased from 27.73% to 14.57%. This is attributed to the adsorption of cationic DAH onto the surface of kaolinite, neutralizing its charge and imparting hydrophobicity. To escape the aqueous environment, these hydrophobic particles form a dense and stable particle network. This network skeleton exhibits high strength and uniform pore distribution, transforming previously loose, isolated pores into connected channels.
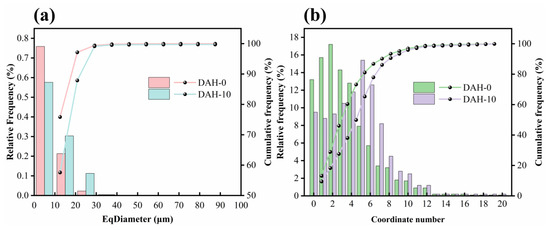
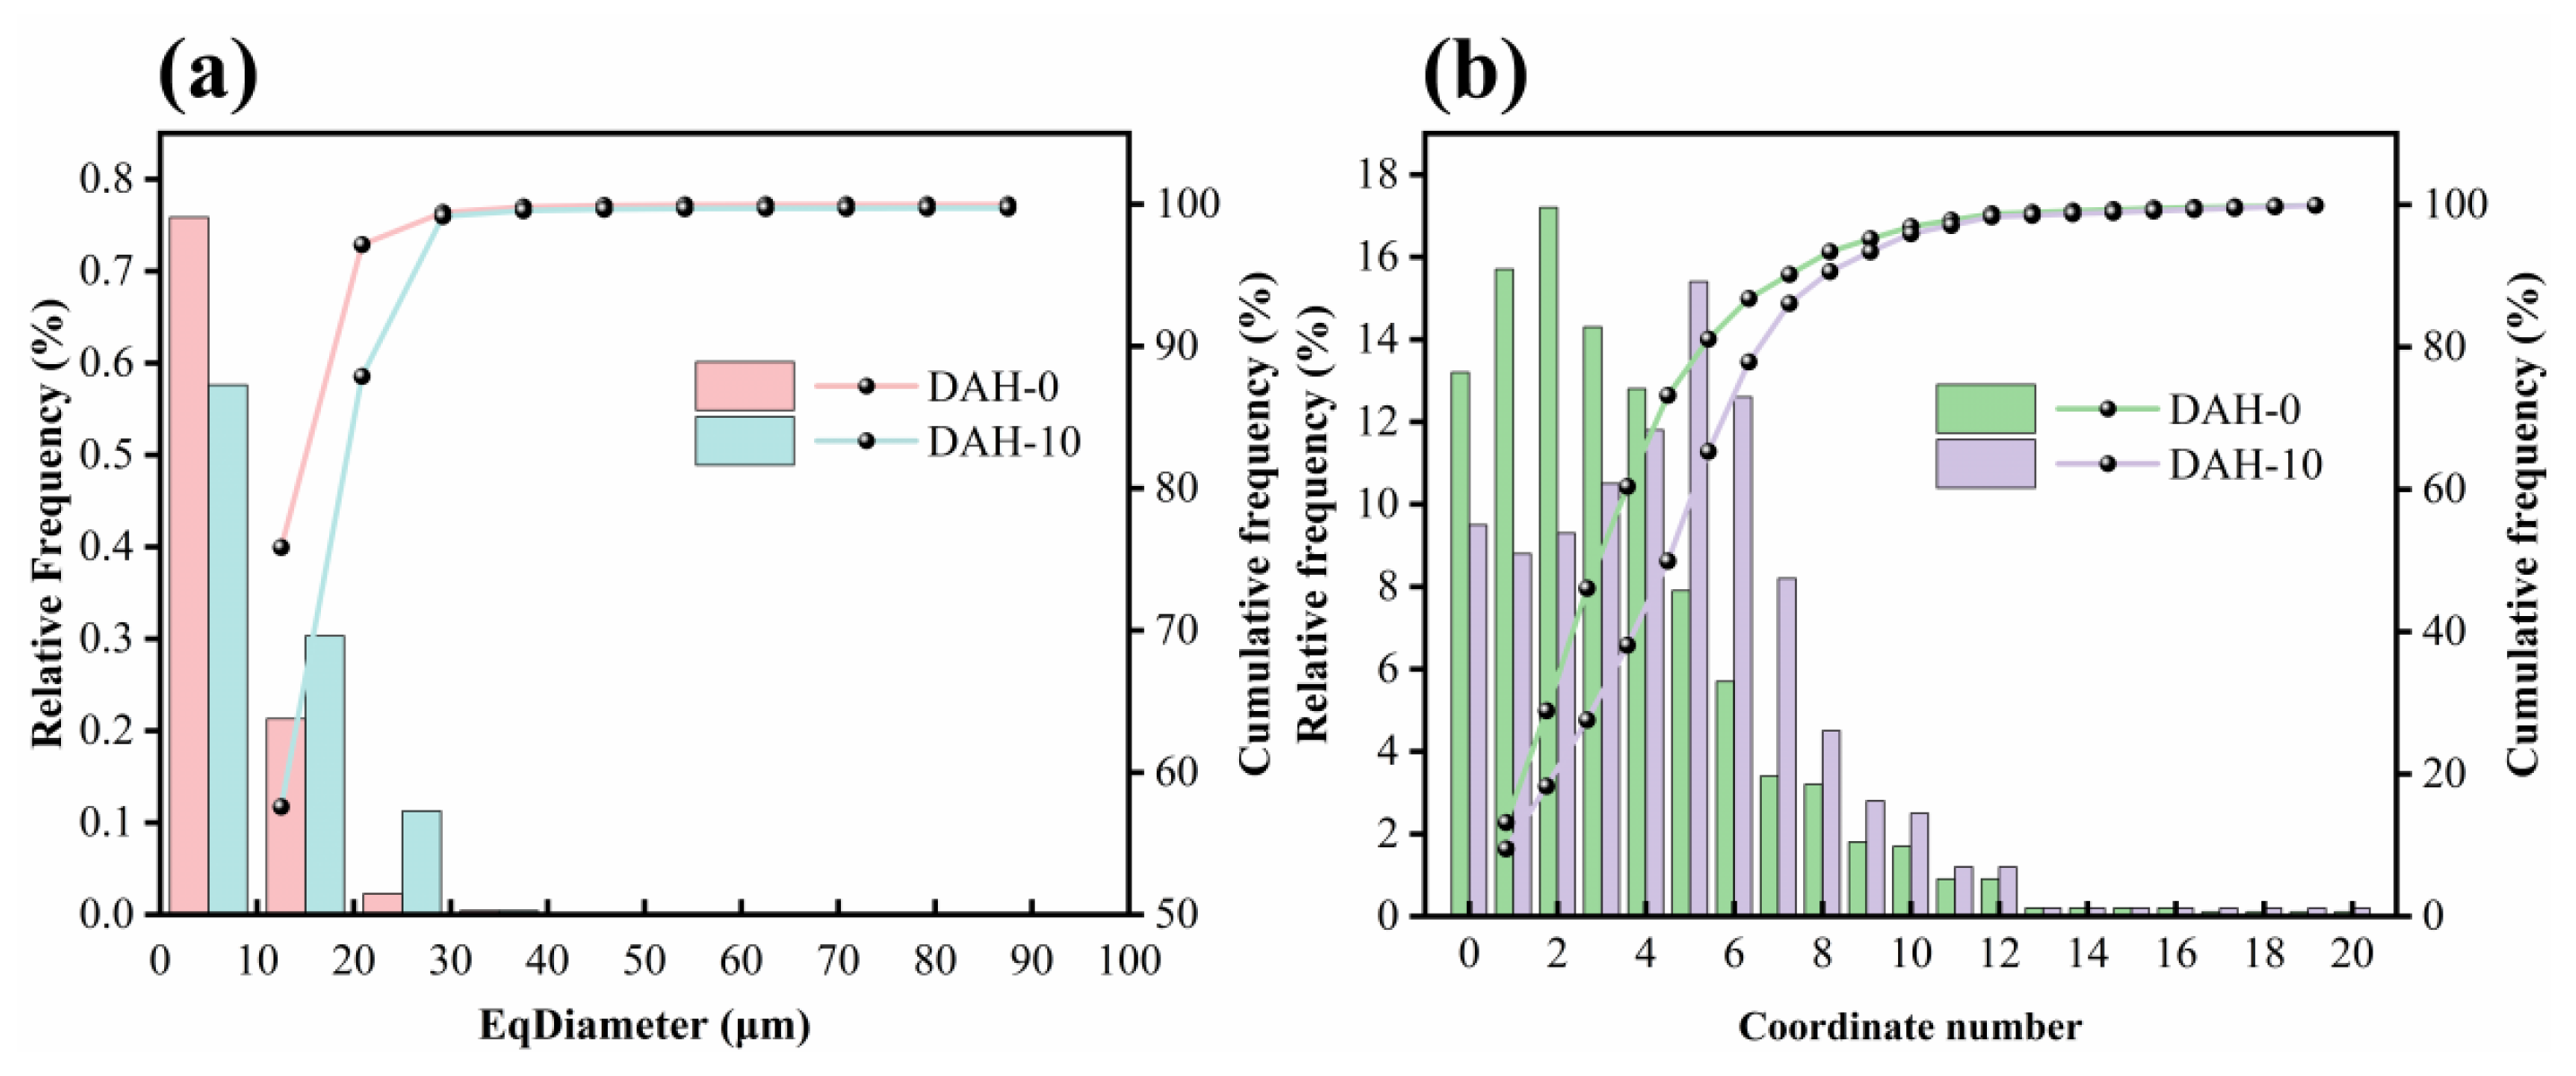
To further quantify the evolution of the internal structure, the equivalent diameters of individual pores and coordination numbers were calculated, as presented in Figure 9. The addition of DAH compresses the electrical double layer and attenuates the inter-particle electrostatic repulsion, which facilitates the rearrangement of particles within the filter cake. Consequently, the fraction of micropores (0–10 μm) is reduced while the proportion of mesopores (10–30 μm) increases accordingly, ultimately leading to a shift in the pore size distribution toward larger diameters. Furthermore, the peak range of the coordination number shifts from 1–3 to 4–6, indicating a distribution bias toward higher values. This shift reflects a significant enhancement in the connectivity and homogeneity of the pore network.
Figure 9.
Results of pore size distribution (a) and distribution of pore coordinate numbers (b).
4.4. LBM Simulation Result
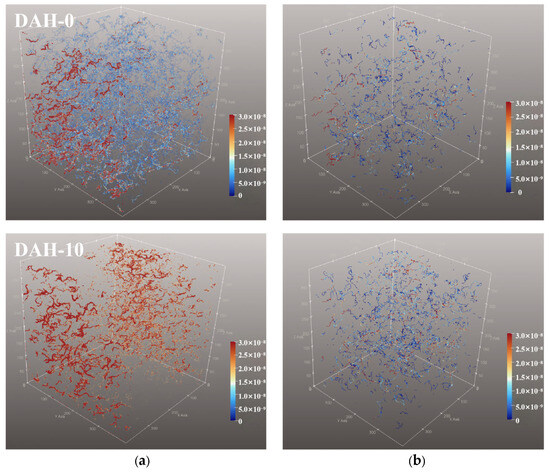
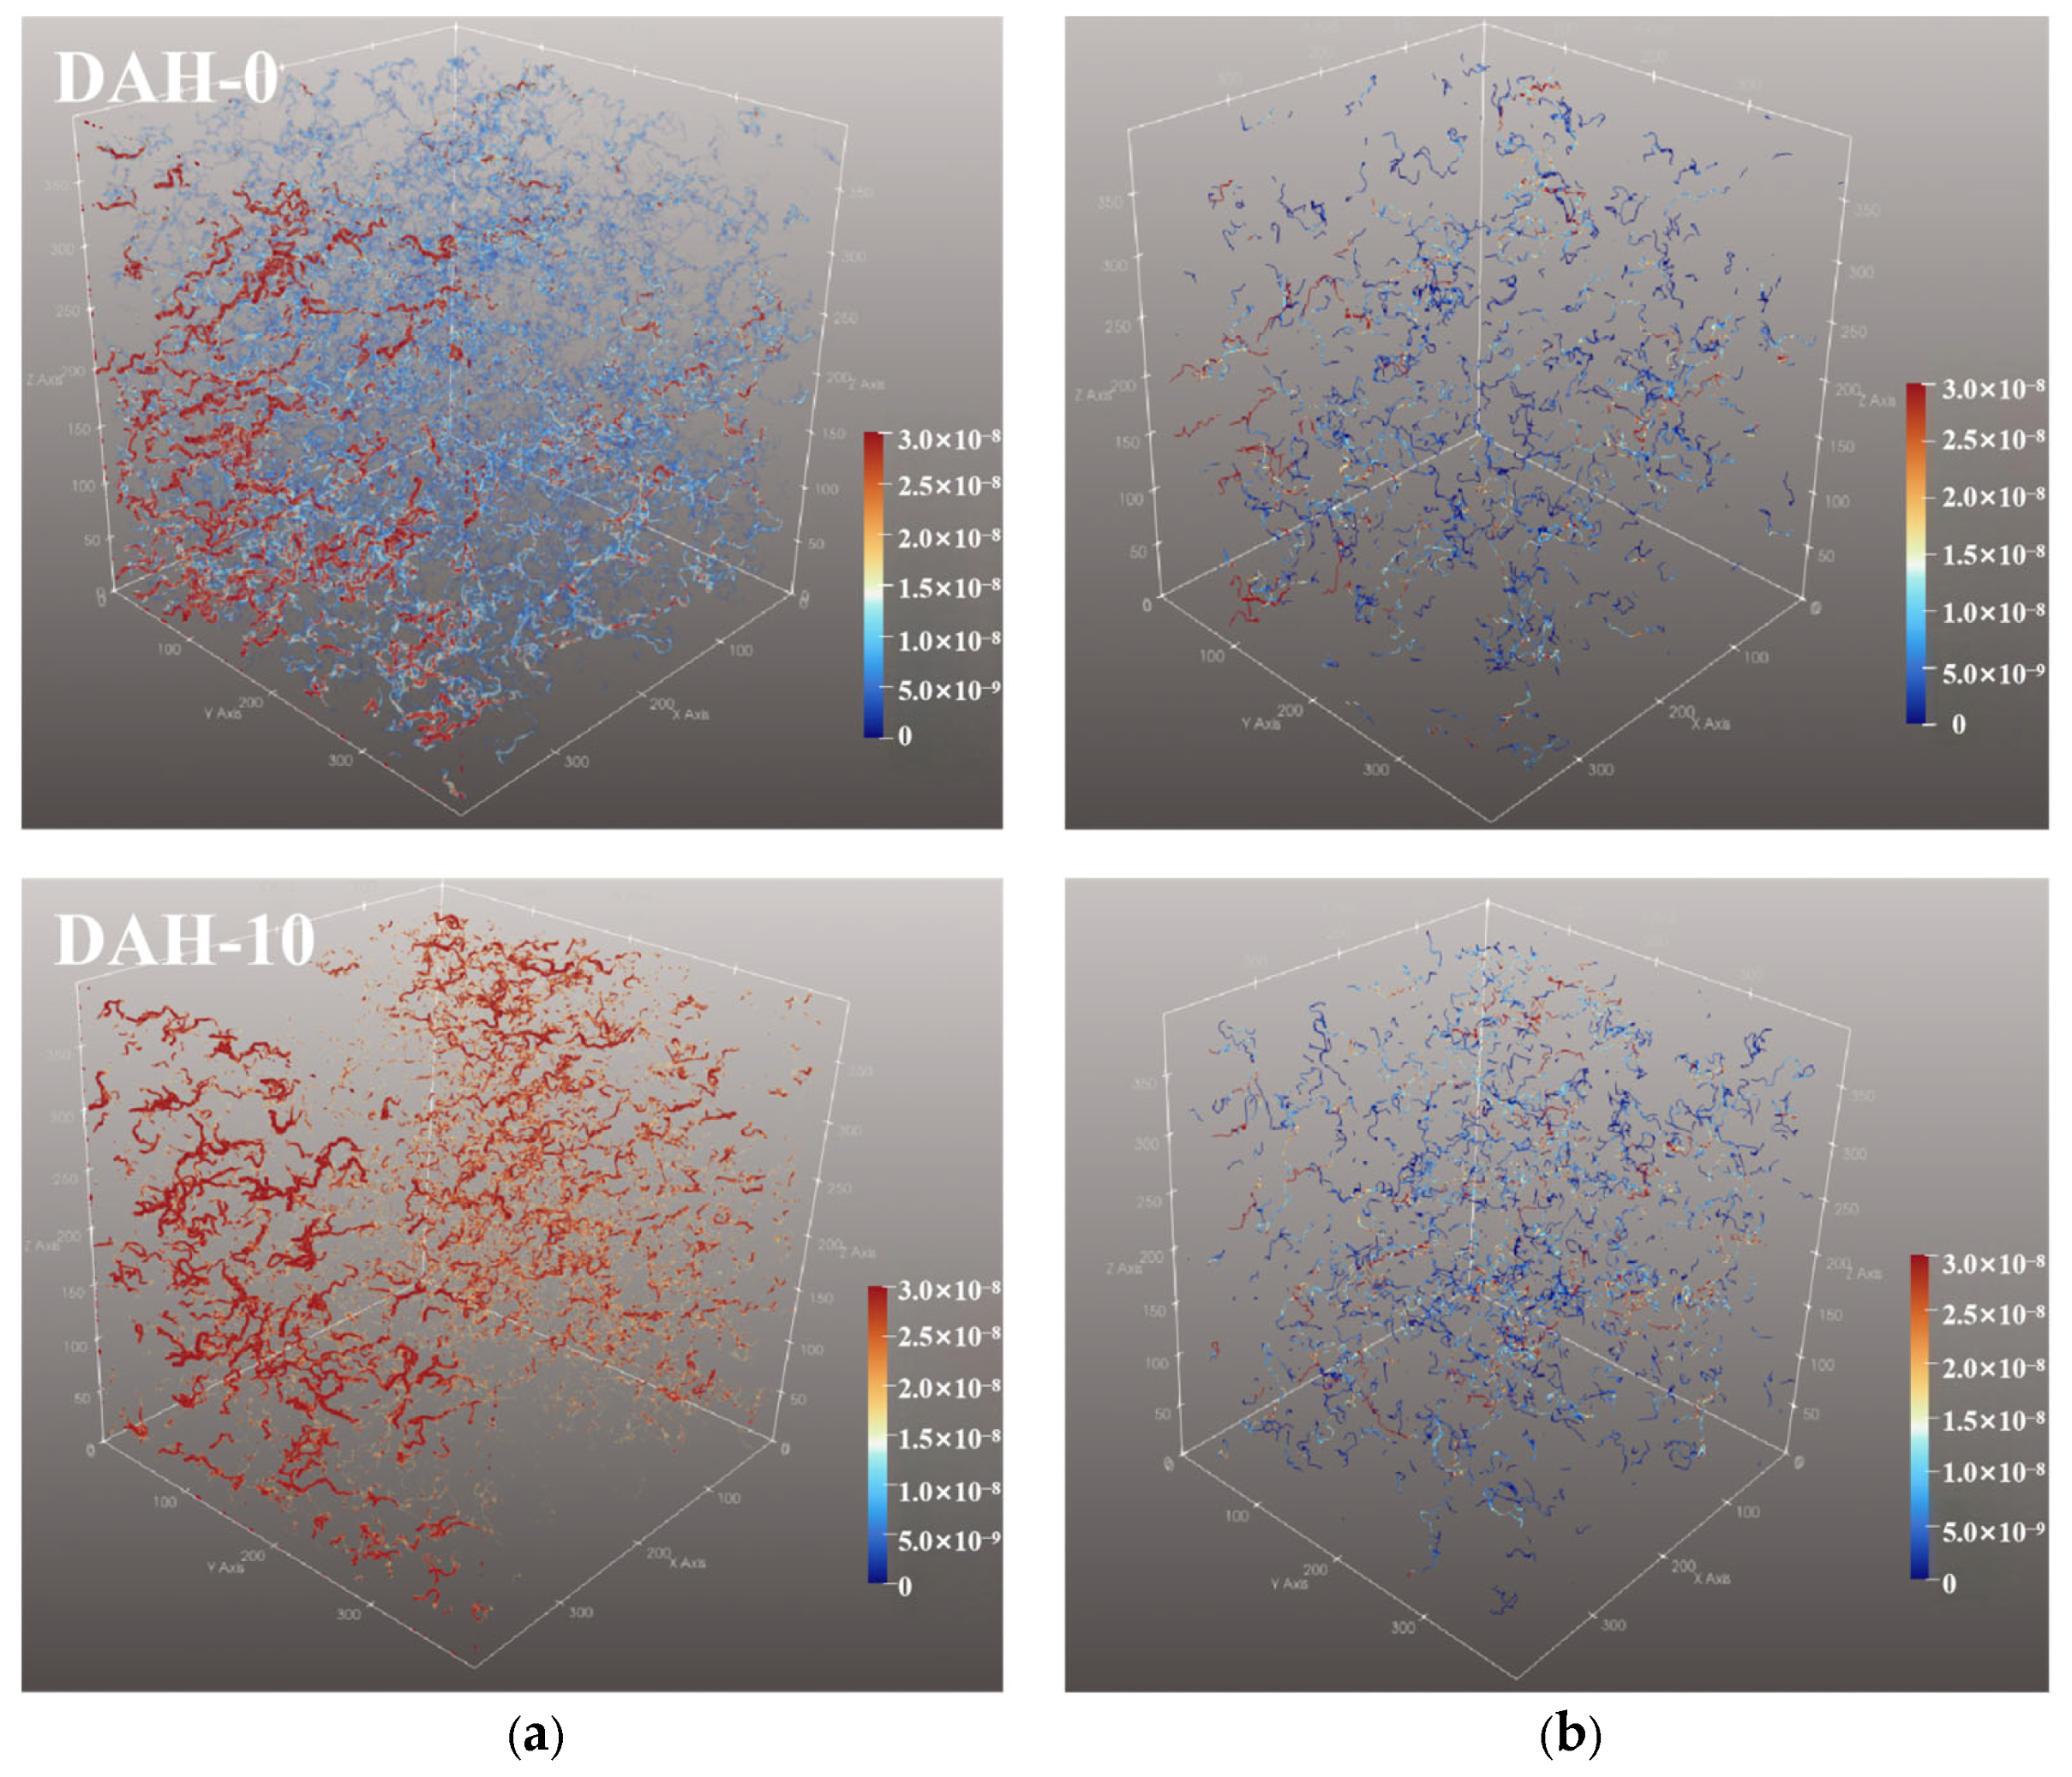
Compared to the no-slip boundary condition, the introduction of a slip boundary condition in the LBM enables a more realistic and accurate simulation of fluid flow within filter cakes during filtration. The previously reconstructed three-dimensional pore structure of the filter cake was adopted as the computational domain for the simulation. Figure 10a presents the LBM-simulated three-dimensional fluid velocity field during kaolinite filter cake filtration. Under the no-slip condition, the velocity field exhibits significant heterogeneity, with high- and low-speed zones interwoven, and numerous low-velocity stagnation regions appear within the pore network of the filter cake. This occurs because the strong fluid–particle adhesion and substantial solid–liquid interfacial frictional resistance under no-slip conditions hinder fluid movement in narrow pores or particle-aggregated regions, leading to local flow stagnation. In contrast, under the slip-length condition, the velocity field is dominated by red and orange-red high-value zones, with low-velocity regions nearly absent. This is attributed to the increased slip length enhancing the wall-slip effect, effectively reducing the solid–liquid interfacial friction and the flow resistance within the pores, resulting in a more uniform velocity distribution. Figure 10b further illustrates that under the no-slip condition, streamlines contain a higher proportion of low-velocity paths, with some showing local winding or stagnation. This is due to the still noticeable solid–liquid interfacial friction, where adhesion to particle surfaces causes fluid flow to frequently hesitate within pores, making it difficult to form continuous pathways. Under the slip condition, however, the proportion of high-velocity streamlines increases, and the overall streamline pattern becomes more continuous with less winding. This improvement results from the optimized slip length further reducing interfacial resistance, allowing fluid to follow smoother paths through the pores and avoiding “path blocking” caused by local stagnation.
Figure 10.
Post-processing of LBM simulations. (a) Velocity field distribution. (b) Streamline distribution.
Permeability is a key parameter characterizing the ability of a porous medium to allow fluid passage through its pore network, directly influencing filtration efficiency [44,45,46]. As shown in Table 2, when slip effects are present, both fluid velocity and permeability are higher compared to the no-slip case. Without slip, the fluid velocity at the wall is zero, and strong near-wall viscous resistance leads to lower internal flow velocity, and accordingly lower permeability. With slip introduced, the fluid exhibits non-zero velocity at the wall, flow resistance decreases, and velocity increment permeability rises accordingly.
Table 2.
LBM simulation results.
4.5. Uncertainty, Sensitivity Analysis, and Model Limitations
The slip length is not measured directly at the solid–liquid interface; it is inferred indirectly from macroscopic filtration data through the capillary model. To establish the reliability of the reported value and to clarify the limits of its mechanistic interpretation, this section (i) restates the back-calculation procedure and propagates the input uncertainties, (ii) quantifies the sensitivity of b to the cake-specific resistance, porosity and capillary radius, and (iii) examines the direction of bias arising from the geometrical idealizations and from the factors that are not explicitly represented in the model.
4.5.1. Back-Calculation and Propagation of Uncertainty
Four quantities are required. The cake-specific resistance rc and the filter-medium resistance rm are obtained, respectively, from the slope and intercept of the linear fit in Figure 4b (Equation (18)); the porosity ε is calculated from the measured dry cake mass, filtration area and cake thickness (Equation (19)); and the mean capillary radius R is determined under the reagent-free, no-slip condition from Equation (15). With these quantities fixed, the slip length follows from Equation (14), which can be rearranged into the closed form
b = [8/(rc ε (1 − ε)) − R2]/(4R)
For the present system, using rc = 1.90 × 10¹⁵ and 0.76 × 10¹⁵ m−2 for the reagent-free and 10 kg/t DAH conditions and ε = 0.1262 and 0.1373, the calibrated radius is R = 195.4 nm and the back-calculated value is b = 64.8 nm. This is consistent with the approximately 70 nm reported in Figure 5; the small difference arises from the porosity value used here and from averaging the triplicate measurements.
A first-order (Taylor) propagation gives the relative combined standard uncertainty of b as
where Erc, Eε and ER are the elasticity coefficients derived below. For representative relative uncertainties of 5% in rc, 3% in ε and 6% in R, the combined uncertainty of b is about 18% (±11.6 nm), giving an interval of roughly 53–77 nm. If all three inputs are assigned a conservative uncertainty of 10%, the corresponding value is about 34%. These bounds indicate that the precise magnitude of b is not tightly constrained, although the qualitative trend—b increasing with DAH dosage—is robust.
ub/b = [Erc2 (urc/rc)2 + Eε2 (uε/ε)2 + ER2 (uR/R)2]1⁄2
4.5.2. Single-Factor Sensitivity Analysis
The sensitivity is expressed by the elasticity Ex = (∂b/∂x)(x/b), which measures the fractional change in b induced by a fractional change in an input x. Writing A = 8/[rc ε (1 − ε)], differentiation of the closed form gives
Erc = −A/(4 R b)
Eε = −A (1 − 2ε)/[4 R b (1 − ε)]
ER = −(A + R2)/(4 R b)
At the 10 kg/t DAH baseline these evaluate to Erc = −1.75, Eε = −1.47 and ER = −2.51. All three are negative, so an increase in any input lowers the inferred slip length. The radius is the most influential quantity, followed by the cake-specific resistance and then the porosity. Table 3 reports the finite-difference response to ±10% perturbations applied to one factor at a time while the other two are held fixed. Because b is a nonlinear function of these quantities, the positive and negative perturbations are not perfectly symmetric.
Table 3.
Sensitivity of the back-calculated slip length to ±10% variations in the input parameters (baseline b = 64.85 nm).
4.5.3. Direction of Bias from Model Assumptions and Unmodeled Factors
Because R is calibrated under the reagent-free, no-slip condition, the static geometric features that do not change with DAH dosage—including the baseline surface roughness and tortuosity—are absorbed into the effective radius and are neutral to first order in b. Bias arises principally from factors that change upon DAH addition or that act on the slip term disproportionately. The direction of each effect is summarized in Table 4.
Table 4.
Direction of bias introduced by unmodeled factors and geometrical idealizations.
Taken together, b is self-consistent when interpreted as an effective (apparent) slip length that integrates the hydrodynamic consequences of nanobubbles, heterogeneous wetting and pore-network geometry. Interpreting it as the intrinsic slip length of a smooth, uniform solid wall would be optimistic, because the nanobubble and tortuosity contributions would then be counted as intrinsic slip; the reported value should therefore be regarded as an upper bound on the intrinsic quantity. The central conclusion is nevertheless unaffected: the cake-specific resistance falls by about 60% (from 1.90 × 10¹⁵ to 0.76 × 10¹⁵ m−2), a change much larger than the ±18% uncertainty of b, and the LBM results independently confirm higher velocity and permeability under the slip condition.
5. Conclusions
This study identified the boundary slip effect as a key hydrodynamic mechanism for enhancing kaolinite filtration. A new capillary flow model incorporating a slip boundary condition into the Navier–Stokes equation was developed and experimentally validated through controlled hydrophobic surface modification. By integrating filtration experiments, theoretical modeling, Micro-CT imaging, and LBM simulations, the relationship between interfacial slip, pore-network evolution, and macroscopic dewatering performance was systematically elucidated. The main conclusions are summarized as follows:
The slip length (b) was successfully back-calculated from filtration data and increased progressively with surface hydrophobicity, reaching approximately 70 nm. This increase in b directly correlated with a substantial reduction in cake-specific resistance (from 1.90 × 10¹⁵ to 0.76 × 10¹⁵ m−2) and a marked improvement in filtration rate.
Micro-CT revealed that addition of DAH promotes the development of a better-connected pore network. The effective porosity rises from 9.09% to 11.74%, and the fraction of isolated pores drops from 27.73% to 14.57%, demonstrating enhanced pore connectivity.
LBM simulations results demonstrated that the boundary slip generated upon DAH addition raises the dewatering rate via reduced interfacial resistance within pore channels, elevates the proportion of high-velocity streamlines, and consequently yields a marked increase in permeability.
Author Contributions
L.D. Conceptualization, Methodology, Software, Investigation, Formal Analysis, Writing—Original Draft; Z.F.: Conceptualization, Funding Acquisition, Resources, Supervision, Writing—Review and Editing; X.D.: Resources, Supervision; X.M.: Visualization, Investigation; Y.S.: Visualization, Conceptualization, R.C.: Software, Validation. All authors have read and agreed to the published version of the manuscript.
Funding
This research was funded by the National Natural Science Foundations of China (Grant No. 52504302 and 52404291). This study was sponsored by the Fundamental Research Program of Shanxi Province (Grant No. 202203021212198). This paper was also funded by the Open Foundation of State Key Laboratory of Mineral Processing (Grant No. BGRIMM-KJSKL-2024-13).
Data Availability Statement
The original contributions presented in this study are included in the article. Further inquiries can be directed to the corresponding authors.
Conflicts of Interest
The authors declare that they have no known competing financial interests or personal relationships that could have appeared to influence the work reported in this paper.
References
- Raj, A.; Tembhurkar, A.R. Evolution of photocatalysis process for degradation of residual xanthate in wastewater from mineral processing industry—A review. J. Water Process Eng. 2024, 67, 106130. [Google Scholar] [CrossRef] [Scilit]
- Cui, Y.; Feng, Y.; Li, H.; Jiang, S.; Yao, Y.; Liu, M.; Wang, J. A study of the mechanism of the degradation of dodecylamine in mineral processing wastewater by deep-sea microflora. J. Water Process Eng. 1970, 70, 107081. [Google Scholar]
- Zou, W.; Gong, L.; Huang, J.; Zhang, Z.; Sun, C.; Zeng, H. Adsorption of hydrophobically modified polyacrylamide P(AM-NaAA-C16DMAAC) on model coal and clay surfaces and the effect on selective flocculation of fine coal. Miner. Eng. 2019, 142, 105887. [Google Scholar] [CrossRef] [Scilit]
- Wu, S.-E.; Lin, Y.-C.; Lin, K.-Y.; Hsueh, Y.-L. Evaluation of cake formation and filtration performance in rotating disk dynamic filtration of particulate suspension. J. Water Process Eng. 2025, 71, 107389. [Google Scholar] [CrossRef] [Scilit]
- Shi, Z.; Liu, L. Synergistic mechanism of CTAB and nonionic polyacrylamide on pore structure of kaolinite filter cake. Sep. Purif. Technol. 2023, 324, 124575. [Google Scholar] [CrossRef] [Scilit]
- Cao, L.; Peng, Y. Differential dewatering responses to flocculant dosage in particulate slurries: Centrifugation versus filtration. Powder Technol. 2025, 471, 122077. [Google Scholar] [CrossRef] [Scilit]
- Shi, Z.; Li, P.; Liu, L. Interactions between CTAB and montmorillonite by atomic force microscopy and molecular dynamics simulation. Colloids Surf. A Physicochem. Eng. Asp. 2023, 657, 130656. [Google Scholar] [CrossRef] [Scilit]
- Zeng, H.; Tang, H.; Sun, W.; Wang, L. Deep dewatering of bauxite residue via the synergy of surfactant, coagulant, and flocculant: Effect of surfactants on dewatering and settling properties. Sep. Purif. Technol. 2022, 302, 122110. [Google Scholar] [CrossRef] [Scilit]
- Nasser, M.S.; James, A.E. Effect of polyacrylamide polymers on floc size and rheological behaviour of kaolinite suspensions. Colloids Surf. A Physicochem. Eng. Asp. 2007, 301, 311–322. [Google Scholar] [CrossRef] [Scilit]
- Zhu, G.; Wang, Y.; Wang, X.; Yu, F.; Miller, J.D. States of coadsorption for oleate and dodecylamine at selected spodumene surfaces. Colloids Surf. A Physicochem. Eng. Asp. 2018, 558, 313–321. [Google Scholar] [CrossRef] [Scilit]
- Kou, J.; Tao, D.; Xu, G. A study of adsorption of dodecylamine on quartz surface using quartz crystal microbalance with dissipation. Colloids Surf. A Physicochem. Eng. Asp. 2010, 368, 75–83. [Google Scholar] [CrossRef] [Scilit]
- Chen, P.; Li, H.; Song, S.; Weng, X.; He, D.; Zhao, Y. Adsorption of dodecylamine hydrochloride on graphene oxide in water. Results Phys. 2017, 7, 2281–2288. [Google Scholar] [CrossRef] [Scilit]
- Lauga, E.; Stone, H.A. Effective slip in pressure-driven Stokes flow. J. Fluid Mech. 2003, 489, 55–77. [Google Scholar] [CrossRef] [Scilit]
- Granick, S.; Zhu, Y.; Lee, H. Slippery questions about complex fluids flowing past solids. Nat. Mater. 2003, 2, 221–227. [Google Scholar] [CrossRef] [Scilit]
- Sánchez, G.; Méndez, F.; Ramos, E.A. Effects of variable slip length over induced electric potentials in microchannels. Eng. Res. Express 2024, 6, 015033. [Google Scholar] [CrossRef] [Scilit]
- Chen, K.-T.; Li, Q.-Y.; Omori, T.; Yamaguchi, Y.; Ikuta, T.; Takahashi, K. Slip length measurement in rectangular graphene nanochannels with a 3D flow analysis. Carbon 2022, 189, 162–172. [Google Scholar] [CrossRef] [Scilit]
- Huang, K.; Pan, L.; Yoon, R. A capillary flow model for filtration. Miner. Eng. 2018, 115, 88–96. [Google Scholar] [CrossRef] [Scilit]
- Basnayaka, L.; Albijanic, B.; Subasinghe, N.; Panjipour, R. Influence of slip length on filtration performance of fine particles. Adv. Powder Technol. 2021, 32, 1333–1340. [Google Scholar] [CrossRef] [Scilit]
- Albijanic, B.; Ozdemir, O.; Hampton, M.; Nguyen, P.; Nguyen, A.; Bradshaw, D. Fundamental aspects of bubble–particle attachment mechanism in flotation separation. Miner. Eng. 2014, 65, 187–195. [Google Scholar] [CrossRef] [Scilit]
- Wang, L.-F.; He, D.-Q.; Tong, Z.-H.; Li, W.-W.; Yu, H.-Q. Characterization of dewatering process of activated sludge assisted by cationic surfactants. Biochem. Eng. J. 2014, 91, 174–178. [Google Scholar] [CrossRef] [Scilit]
- Wang, S.; Albijanic, B.; Tao, X.; Fan, H. Thin liquid film drainage mechanism between air bubbles and low-rank coal particles in the presence of surfactant. Fuel Process. Technol. 2019, 186, 18–24. [Google Scholar] [CrossRef] [Scilit]
- Zhou, Y.; Albijanic, B.; Tadesse, B.; Wang, Y.; Yang, J.; Zhu, X.-N. The Stefan–Reynolds Model and the Modified Stefan–Reynolds Model for Studying Bubble–Particle Attachment Interactions in the Context of Flotation. Langmuir 2019, 35, 4278–4286. [Google Scholar] [CrossRef] [Scilit]
- Chen, X.; Mo, D.; Gong, M. A Flexible Method for Nanofiber-based 3D Microfluidic Device Fabrication for Water Quality Monitoring. Micromachines 2020, 11, 276. [Google Scholar] [CrossRef] [Scilit]
- Wang, Q.; Graber, E.R.; Wallach, R. Synergistic effects of geometry, inertia, and dynamic contact angle on wetting and dewetting of capillaries of varying cross sections. J. Colloid Interface Sci. 2013, 396, 270–277. [Google Scholar] [CrossRef] [Scilit]
- Lin, P.; Chen, Q.; Liu, Y.; Hu, X.; Zhu, Z. Prediction of Newtonian Droplet Breaking Time from a Capillary at Low Weber Numbers. ACS Omega 2022, 7, 23890–23898. [Google Scholar] [CrossRef] [Scilit]
- Mooney, M. Explicit Formulas for Slip and Fluidity. J. Rheol. 1931, 2, 210–222. [Google Scholar] [CrossRef] [Scilit]
- Neto, C.; Evans, D.R.; Bonaccurso, E.; Butt, H.-J.; Craig, V.S.J. Boundary slip in Newtonian liquids: A review of experimental studies. Rep. Prog. Phys. 2005, 68, 2859–2897. [Google Scholar] [CrossRef] [Scilit]
- Nascimento, D.F.D.; Junior, J.R.V.; Paciornik, S.; Carvalho, M.S. Pore Scale Visualization of Drainage in 3D Porous Media by Confocal Microscopy. Sci. Rep. 2019, 9, 12333. [Google Scholar] [CrossRef] [Scilit]
- Vorobiev, E. Unified model for the prediction of consecutive solid–liquid filtration and expression at the constant pressure. AIChE J. 2021, 68, e17547. [Google Scholar] [CrossRef] [Scilit]
- Chen, J.; Min, F.; Liu, L. The interactions between fine particles of coal and kaolinite in aqueous, insights from experiments and molecular simulations. Appl. Surf. Sci. 2019, 467–468, 12–21. [Google Scholar] [CrossRef] [Scilit]
- Grissa, K.; Chaabane, R.; Lataoui, Z.; Benselama, A.; Bertin, Y.; Jemni, A. Lattice Boltzmann model for incompressible axisymmetric thermal flows through porous media. Phys. Rev. E 2016, 94, 043306. [Google Scholar] [CrossRef] [Scilit]
- Ren, J.; Lei, H. Lattice Boltzmann model for incompressible flows through porous media with time-fractional effects. Commun. Nonlinear Sci. Numer. Simul. 2024, 135, 108035. [Google Scholar] [CrossRef] [Scilit]
- Guo, Z.; Zhao, T.S. Lattice Boltzmann model for incompressible flows through porous media. Phys. Rev. E 2002, 66, 036304. [Google Scholar] [CrossRef] [Scilit]
- Wu, Z.; Zhu, P.; Huang, Y.; Yao, J.; Yang, F.; Zhang, Z.; Ni, M. A Comprehensive Review of Modeling of Solid Oxide Fuel Cells: From Large Systems to Fine Electrodes. Chem. Rev. 2025, 125, 2184–2268. [Google Scholar] [CrossRef] [Scilit]
- Kamble, S.; Agrawal, S.; Cherumukkil, S.; Sharma, V.; Jasra, R.V.; Munshi, P. Revisiting Zeta Potential, the Key Feature of Interfacial Phenomena, with Applications and Recent Advancements. ChemistrySelect 2022, 7, e202103084. [Google Scholar] [CrossRef] [Scilit]
- Yang, Y.; Wu, J.; Zhao, S.; Han, Q.; Pan, X.; He, F.; Chen, C. Assessment of the responses of soil pore properties to combined soil structure amendments using X-ray computed tomography. Sci. Rep. 2018, 8, 695. [Google Scholar] [CrossRef] [Scilit]
- Ma, X.; Wen, P.; Fan, Y.; Dong, X.; Sun, W.; Min, F.; Feng, Z.; Xie, J. Quantitative analysis of high-efficiency dewatering under ultrahigh pressures: Moisture storage state and filter-cake pore structure. Miner. Eng. 2026, 237, 109969. [Google Scholar] [CrossRef] [Scilit]
- Lin, C.L.; Miller, J.D. Network analysis of filter cake pore structure by high resolution X-ray microtomography. Chem. Eng. J. 2000, 77, 79–86. [Google Scholar] [CrossRef] [Scilit]
- Dong, H.; Blunt, M.J. Pore-network extraction from micro-computerized-tomography images. Phys. Rev. E 2009, 80, 036307. [Google Scholar] [CrossRef] [Scilit]
- Kwiecien, M.J.; Macdonald, I.F.; Dullien, F.A.L. Three-dimensional reconstruction of porous media from serial section data. J. Microsc. 1990, 159, 343–359. [Google Scholar] [CrossRef] [Scilit]
- Bryant, S.L.; King, P.R.; Mellor, D.W. Network model evaluation of permeability and spatial correlation in a real random sphere packing. Transp. Porous Media 1993, 11, 53–70. [Google Scholar] [CrossRef] [Scilit]
- Lobregt, S.; Verbeek, P.W.; Groen, F.C.A. Three-Dimensional Skeletonization: Principle and Algorithm. IEEE Trans. Pattern Anal. Mach. Intell. 1980, PAMI-2, 75–77. [Google Scholar] [CrossRef] [Scilit]
- Liang, Y.; Hu, P.; Wang, S.; Song, S.; Jiang, S. Medial axis extraction algorithm specializing in porous media. Powder Technol. 2019, 343, 512–520. [Google Scholar] [CrossRef] [Scilit]
- Liu, R.; Li, X.; Wang, H.; Kabgov, H.; Yuan, J.; Hu, Y.; Duan, C.; Feng, Y.; Jiang, H.; Huang, L. Interfacial conditioning improves pore network connectivity and dewatering performance of fine particulate filter cakes. Miner. Eng. 2026, 248, 110623. [Google Scholar] [CrossRef] [Scilit]
- Feng, Z.; Chen, R.; Dong, X.; Fan, Y.; Ma, X.; Guichuan, Y. A comprehensive study on the influence of pH for dewatering performance and filter cake characteristics in solid–liquid separation of clean coal. Sep. Purif. Technol. 2025, 363, 132208. [Google Scholar] [CrossRef] [Scilit]
- Chen, R.; Dong, X.; Feng, Z.; Fan, Y.; Ma, X. Investigation on permeability of filter cake with different particle sizes: Experimental and simulation study. Powder Technol. 2024, 433, 119191. [Google Scholar] [CrossRef] [Scilit]

Disclaimer/Publisher’s Note: The statements, opinions and data contained in all publications are solely those of the individual author(s) and contributor(s) and not of MDPI and/or the editor(s). MDPI and/or the editor(s) disclaim responsibility for any injury to people or property resulting from any ideas, methods, instructions or products referred to in the content. |
© 2026 by the authors. Licensee MDPI, Basel, Switzerland. This article is an open access article distributed under the terms and conditions of the Creative Commons Attribution (CC BY) license.