


Abstract
A microspherical hybrid fibroin-silica adsorbent (HFSA) was prepared and evaluated as a multifunctional stationary phase for the thin-layer chromatographic analysis of structurally diverse dyes. The material was synthesized by adding silk fibroin during the hydrolytic polycondensation of tetraethoxysilane (TEOS) and characterized using SEM-EDS, FTIR spectroscopy, XRD, and nitrogen adsorption-desorption analysis. HFSA exhibited a predominantly amorphous, microspherical, and porous structure, with a specific surface area of 318 m2/g and a total pore volume of 1.03 cm3/g. The chromatographic behavior of methyl orange, Sudan I, Sudan IV, and Rhodamine 6G was investigated by TLC using MPh1 [n-hexane:isopropanol (1:1, v/v)] and MPh2 [n-hexane:isopropanol:water:glacial acetic acid (1:1:0.5:0.1, v/v/v/v)]. Under MPh1, all four dyes exhibited greater apparent retention on HFSA than on microspherical silica gel (MSS), with the largest observed difference for Sudan IV. Introducing water and acetic acid markedly changed the migration order: Sudan IV and Sudan I became highly mobile, whereas methyl orange and Rhodamine 6G remained more strongly retained. A dimensionless retention transport reconstruction reproduced the experimental band-centroid positions and visualized condition-dependent migration without independently predicting experimental band broadening or resolution. Hydrogen bonding, hydrophobic association, van der Waals forces, π–π interactions, and possible electrostatic effects are proposed as contributions to retention; their individual roles were not experimentally distinguished. These findings demonstrate that HFSA provides a chemically diverse stationary phase that exhibits different retention behavior for the four investigated dyes under the two tested mobile-phase conditions.
1. Introduction
The widespread use of natural and synthetic dyes in the textile, food, pharmaceutical, cosmetic, and other industries has led to increased production and consumption. Every year, more than 100 tons of dyes are discharged into water bodies [1]. Although many natural dyes are biodegradable and relatively non-toxic, numerous synthetic dyes are non-biodegradable and may exhibit toxic, carcinogenic, or mutagenic effects [2]. Because of their complex aromatic structures and high chemical stability, synthetic dyes often degrade slowly in the environment. Moreover, incomplete dye fixation during industrial dyeing processes releases substantial amounts of residual dyes into wastewater, complicating removal through conventional treatment methods. Dye accumulation in aquatic environments can inhibit photosynthesis in plants, adversely affect aquatic organisms, and impair kidney, liver, and brain function in humans, potentially causing dysfunction of the central nervous and reproductive systems [3,4,5,6]. Therefore, detecting and removing trace dyes from wastewater and surface water is important for protecting human health and aquatic ecosystems. The reliable analysis of synthetic dyes is also essential for environmental monitoring, food-safety control, pharmaceutical quality assessment, and forensic investigations [7].
Several analytical and sample preparation techniques have been employed for dye detection and characterization. These include capillary electrophoresis–mass spectrometry, liquid chromatography–mass spectrometry [8], liquid-phase extraction [9], solid-phase extraction [10], thin-layer chromatography (TLC) [11], and high-performance thin-layer chromatography (HPTLC) [9,12].
Among these methods, TLC remains widely used for screening complex mixtures because of its operational simplicity, efficiency, accessibility, and low cost [11]. The stationary phase is a key factor governing analyte retention, migration, and separation in TLC [13]. However, conventional stationary phases, such as silica gel and alumina, may exhibit insufficient selectivity when separating compounds with similar polarities or closely related molecular structures. Therefore, developing stationary phases with chemically diverse interaction sites is important for improving the chromatographic discrimination of structurally different dyes.
Organic-inorganic hybrid materials offer a route to chromatographic adsorbents with complementary structural and chemical properties. The inorganic component generally provides mechanical strength, thermal stability, and porosity, whereas the organic component introduces additional functionality and specific analyte interaction sites [14]. This combination can create a chemically heterogeneous stationary phase capable of interacting with analytes that differ in terms of charge, polarity, hydrophobicity, aromaticity, and hydrogen-bonding ability.
Silk fibroin, a natural protein polymer obtained from the cocoons of the mulberry silkworm Bombyx mori, is a promising organic component for the preparation of hybrid chromatographic adsorbents [15]. The fibroin macromolecule comprises 18 amino acids connected through peptide bonds. Its most abundant amino acids, glycine, alanine, and serine, form the principal structural sequences associated with crystalline β-sheet domains [16,17]. Less abundant amino acid residues introduce various side-chain functional groups, including hydroxyl (-OH), carboxyl (-COOH), and amino (-NH2) groups, in addition to the carbonyl and NH groups of the peptide backbone. These groups, together with fibroin’s hydrophilic and hydrophobic domains, provide potential interaction sites for analytes with different chemical properties. Silica, the inorganic component, provides surface silanol (≡Si-OH) groups that can form hydrogen bonds with suitable analytes [18].
The sol-gel method facilitates the preparation of fibroin-silica hybrid materials by introducing fibroin during formation of the silica phase [19]. Consequently, a hybrid fibroin-silica adsorbent can provide several complementary interaction sites: (i) silica-derived silanol groups capable of hydrogen bonding; (ii) hydrophobic fibroin domains associated with β-sheet-rich regions and nonpolar amino acid residues; and (iii) polar and ionizable fibroin functional groups. The specific contribution examined here is the preparation and chromatographic evaluation of a microspherical fibroin-silica stationary phase in which fibroin is introduced during silica formation. Its analytical relevance is assessed through changes in dye retention and selectivity relative to an MSS reference.
The objectives of the present study were to prepare and characterize a microspherical hybrid fibroin-silica adsorbent as a candidate stationary phase for analytical TLC, compare its retention behavior with MSS under MPh1, examine mobile-phase-dependent selectivity on HFSA using MPh2, and interpret the observed trends in terms of possible analyte-surface interactions. Methyl orange, Sudan I, Sudan IV, and Rhodamine 6G were selected as model analytes because they differ substantially in molecular charge, polarity, hydrophobicity, aromatic structure, and hydrogen-bonding capability. These dyes provide a controlled test of chromatographic behavior rather than validation of a method for a specific sample matrix. Specifically, methyl orange is an anionic dye, Sudan I and Sudan IV are neutral, lipophilic dyes, and Rhodamine 6G is a cationic dye. Quantitative lipophilicity descriptors and their applicability to the investigated conditions are discussed in Section 3.3. The use of defined dye mixtures enables comparison under controlled conditions; application to wastewater, food, or pharmaceutical samples requires separate evaluation of matrix effects and analytical performance.
2. Experimental Section
2.1. Materials
TEOS, formic acid, ammonium hydroxide, n-hexane, ethanol, and isopropanol were purchased from Sigma-Aldrich (Schnelldorf, Germany). The dye standards were purchased from NPP KHIMTEK (Krasnodar, Russia): methyl orange, Sudan I, Sudan IV, and Rhodamine 6G. Fibroin was prepared by degumming the cocoons, dissolving the resulting fibers in an aqueous lithium bromide solution, dialyzing the fibroin solution, and lyophilizing it, as described previously [20]. The resulting fibroin was used as the organic component of the hybrid fibroin-silica adsorbent. MSS was prepared as a reference stationary phase for comparison with the hybrid material, as described elsewhere [21]. The experimental comparison was restricted to HFSA and MSS; commercial TLC plates, pure fibroin layers, and physical mixtures of fibroin and silica were not evaluated.
2.2. Preparation of the Microspherical Hybrid Fibroin–Silica Adsorbent
A one-step synthesis process was used to synthesize the hybrid fibroin-silica adsorbent, in which fibroin was added during the silica-phase formation. Briefly, fibroin was dissolved at 38.46 mg mL−1 in aqueous formic acid (reported as 4%; specified mass concentration, 3.85 wt%). A 10.4 mL aliquot of this solution, containing 400 mg of fibroin, was mixed with 11.1 mL of TEOS, giving a fibroin-solution/TEOS volume ratio of 0.94:1. An additional 2.0 mL of water was added separately. The aqueous reagents contributed an additional 9.6 mL of water, giving a total initial water content of 11.6 mL. The mixture was stirred at 1800 rpm for 15 min at 80 °C to ensure homogeneous mixing of the organic and inorganic components. Subsequently, 2.3 mL of a 25 wt% aqueous ammonium hydroxide solution (stated concentration, 13.3 mol L−1) was added dropwise to the reaction mixture. The nominal reaction volume after all additions was 25.8 mL. The reported fibroin/TEOS mass ratio was 0.03:1, and the H2O/TEOS and NH3/TEOS molar ratios were 12.95 and 0.61, respectively.
After adding ammonium hydroxide, the mixture was cooled to room temperature and maintained for 24 h to allow microgel formation and stabilization. The resulting suspension was filtered, and the recovered material was repeatedly washed with deionized water until the filtrate reached pH 7 to remove soluble reaction residues. Finally, the precipitate was dried at 95 °C for 48 h until a constant weight was achieved. The obtained material was used as a microspherical hybrid fibroin–silica adsorbent (HFSA) for further physicochemical characterization and chromatographic experiments.
2.3. Characterization Techniques
The morphology, particle size distribution, and elemental composition of the HFSA were examined using scanning electron microscopy (SEM) coupled with energy-dispersive X-ray spectroscopy (EDS) using a Jeol JSM-IT200LA instrument (JEOL Ltd., Akishima, Japan).
Fourier-transform infrared (FTIR) spectroscopy using a Perkin Elmer (Shelton, CT, USA) instrument was used to identify the silica and fibroin-associated functional groups and to assess the presence of fibroin-derived chemical features in the silica-based product. The samples were prepared as KBr pellets, and the spectra were recorded over 4000–400 cm−1. X-ray diffraction was performed on a XRD-6100 “Shimadzu” diffractometer (Shimadzu, Kyoto, Japan) using monochromated Cu Kα radiation with a wavelength of λ = 0.154 nm, to assess the structural organization and crystallinity of the materials. Furthermore, the textural properties of the adsorbent, including the specific surface area and total pore volume, were evaluated using nitrogen adsorption–desorption measurements at 77 K using a Quantachrome Nova 1000e static adsorption system (Quantachrome Instruments, Boynton Beach, FL, USA).
2.4. Chromatographic Procedure
The glass plates (10 cm × 10 cm) were first washed with ethanol and dried before the layers were prepared. Separate suspensions of HFSA and MSS in 70% isopropanol were prepared at 100 mg mL−1 for each adsorbent and applied without an added binder. A 5.0 mL aliquot of each suspension was spread over a coated area of 100 cm2 on a separate glass plate using an adjustable manual TLC coating spreader set to a wet-layer thickness of 500 µm. The nominal adsorbent loading, calculated from the suspension concentration, applied volume, and coated area, was 5.0 mg cm−2 for both HFSA and MSS. The plates were air-dried at room temperature for 24 h after coating. The prepared plates were activated at 110 °C for 1.5 h, cooled, and stored in a desiccator before use to reduce atmospheric moisture content. The dry-layer thickness was measured using a calibrated digital micrometer at four positions on two independently prepared plates. The measured thickness was 100 µm for both HFSA and MSS. Dry adsorbent loadings, determined gravimetrically, were 5.0 mg cm−2 for HFSA and 4.9 mg cm−2 for MSS. These measurements characterize the sampled plates but do not establish a uniform thickness across the entire coated surface. Plate activation and desiccator storage standardized handling before development; their effectiveness in controlling plate-to-plate or day-to-day variability was not independently evaluated.
MPh1: n-hexane:isopropanol (1:1, v/v).
MPh2: n-hexane:isopropanol:water:glacial acetic acid (1:1:0.5:0.1, v/v/v/v).
MPh1 and MPh2 designate mobile-phase compositions rather than distinct chromatographic modes. The same HFSA formulation was used with both eluents, and no additional hydrophobic modification was introduced for MPh2. Accordingly, the experiments were described as TLC using MPh1 or MPh2 without assigning reversed-phase operation.
Dye solutions were prepared in ethanol at a concentration of 15 mg mL−1. The selected dye mixtures were prepared before each chromatographic application to obtain a uniform test sample. All chromatographic experiments used standard dye solutions or their mixtures; no wastewater, food, or pharmaceutical samples were analyzed. A 1-µL aliquot of the freshly prepared dye mixture was applied to each chromatographic plate at an origin positioned 1.5 cm above the lower edge.
The glass chamber was equilibrated with the vapor of the relevant mobile phase for 30 min before the development. The temperature and relative humidity were not systematically varied to assess their influence on chromatographic performance. The plates were developed until the solvent front reached the predetermined development distance. The plates were removed from the chamber after development and air-dried overnight.
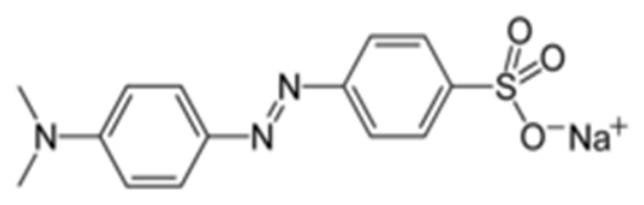
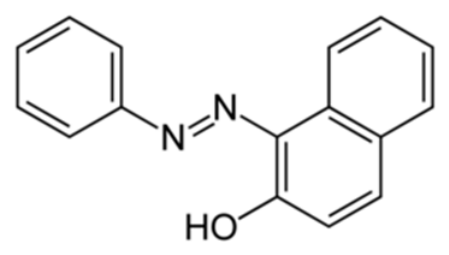
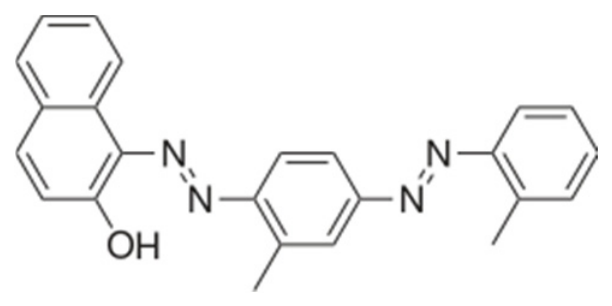
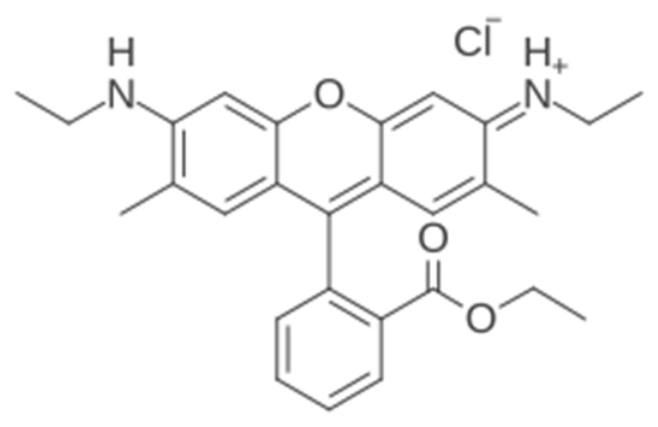
The separated dye spots were directly visualized using their characteristic colors. Methyl orange [sodium 4-(4-dimethylaminophenylazo)benzenesulfonate] produced a yellow spot, whereas Sudan I (2-hydroxynaphthalene-1-azobenzene) produced an orange spot. Sudan IV (o-tolylazo-o-tolylazo-2-naphthol) produced a dark red spot, whereas Rhodamine 6G, a cationic xanthene dye, produced a distinct pink-red spot. These distinctive colors allow for the direct visual identification of individual dyes after chromatographic separation.
The retention factor Rf of each dye was determined from its chromatographic migration distance. The retention factor was calculated as the distance migrated by the center of the analyte spot divided by the distance migrated by the solvent front, as expressed in Equation (1).
The calculated Rf values were compared to evaluate dye retention and migration on MSS and HFSA. The available dataset contains one reported Rf value per dye and chromatographic condition, without independent replicate measurements to determine experimental variability. Consequently, mean ± SD and statistical significance could not be calculated, and the quantitative comparisons are preliminary.
2.5. Dimensionless Retention-Transport Reconstruction
A dimensionless retention-transport reconstruction was developed to visualize the experimentally observed migration of methyl orange, Sudan I, Sudan IV, and Rhodamine 6G. The migration distance and development time were normalized to unity. For each dye i and chromatographic condition, the normalized band velocity was assigned directly from the experimentally measured retention factor, vi∗ = Rf,i. The one-dimensional convection-dispersion equation, given in Equation (2), represents the solute migration:
where ci is the normalized dye concentration, x* is the normalized migration distance, t* is the normalized time, and Di* is the dimensionless dispersion coefficient. The Gaussian concentration distributions were reconstructed using Di* = 0.0012 and an initial standard deviation of 0.018. These parameters were introduced solely to obtain consistent visual bandwidths and were not fitted to the experimental spot width measurements. The apparent chromatographic retention parameter was calculated using Equation (3), as follows:
Consequently, the reconstructed band centroids reproduce the experimental Rf values and should be interpreted as calibrated visualizations of the measured chromatographic behavior, rather than as independent predictions of solute transport or band broadening. Conversion k′ = (1 − Rf)/Rf is commonly used in planar chromatographic analysis [13]. Equation (3) provides an apparent retention parameter for comparison because the chromatographic phase ratio was not independently determined [13,22]. The apparent retention free-energy descriptor was calculated as ΔGapp = −RT ln(k′) (4), where R is the gas constant and T = 298.15 K.
3. Results and Discussion
3.1. Characterization of the Hybrid Adsorbent
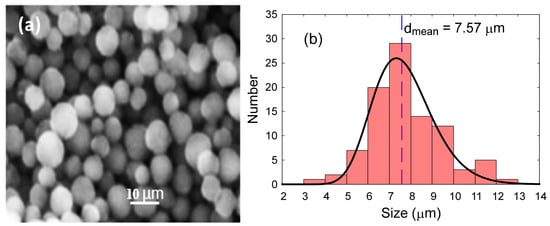
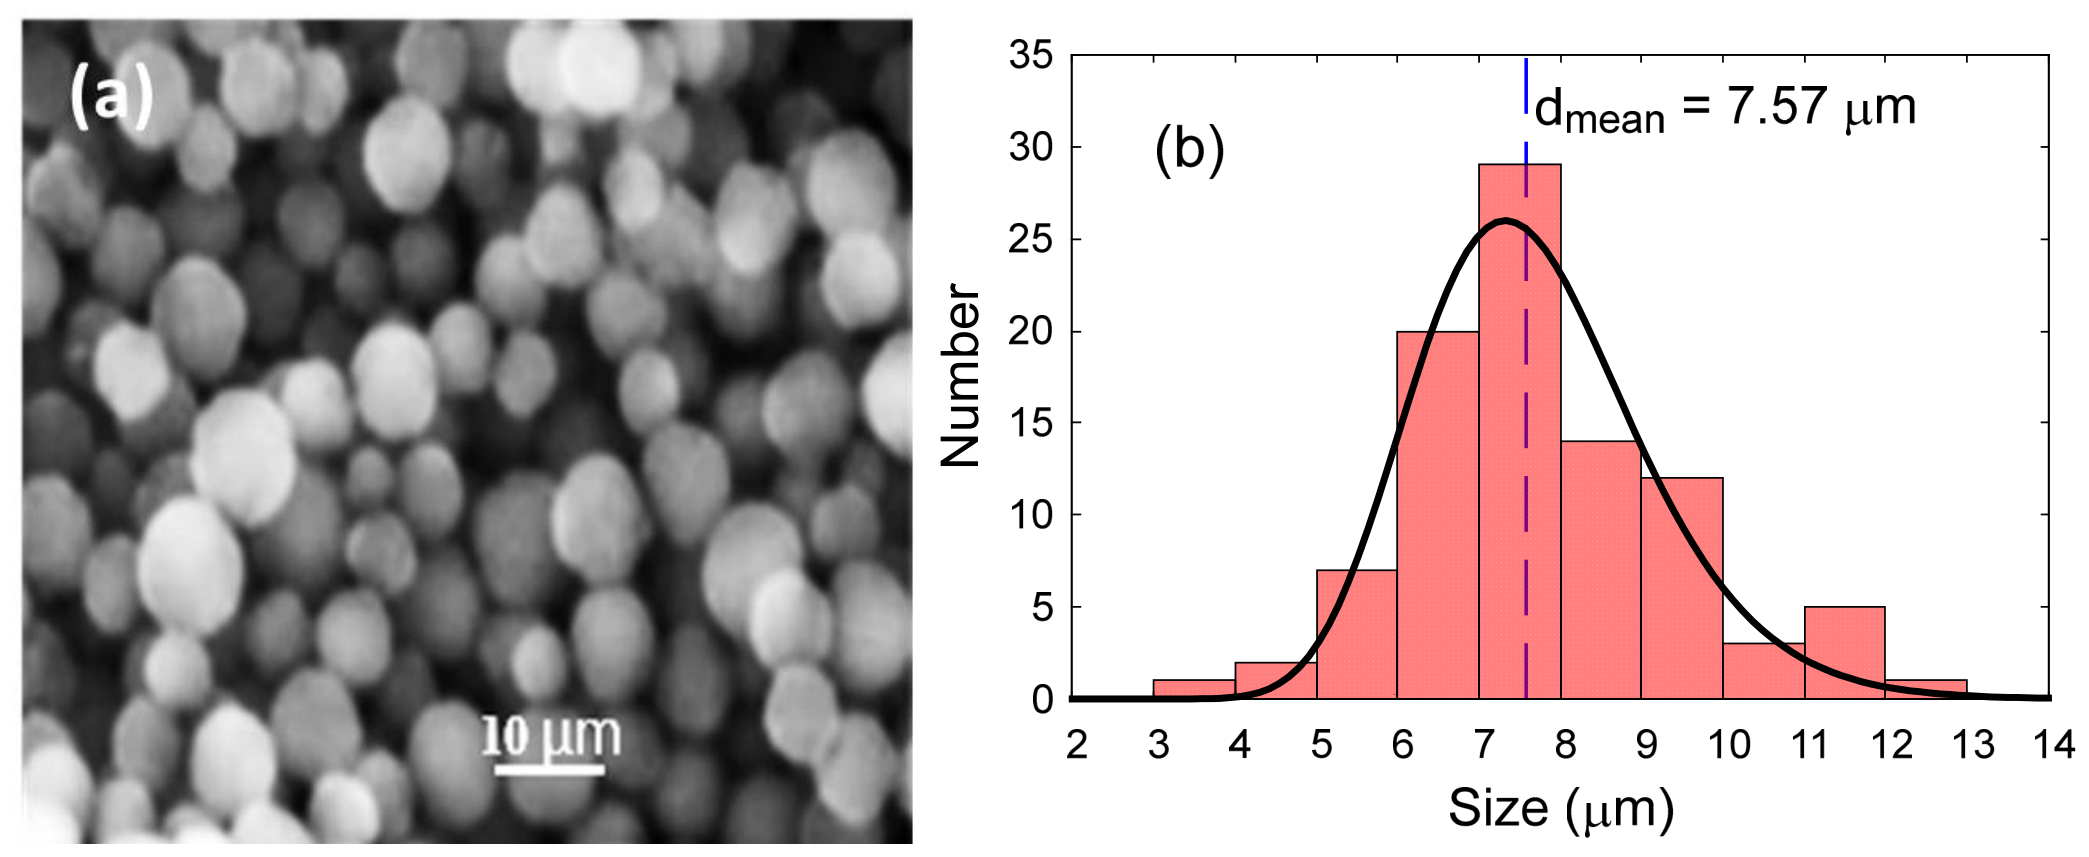
The morphology and elemental composition of the HFSA were determined using SEM-EDS. The SEM images showed that the synthesized material was predominantly composed of spherical particles with diameters in the range of approximately 4–12 µm (Figure 1a). To obtain quantitative information on the particle size, approximately 100 particles were randomly selected from representative SEM images, and their diameters were measured using ImageJ (version 1.54f). The resulting particle-size distribution was fitted with a log-normal function (Figure 1b), yielding a mean particle diameter of 7.57 µm. This microspherical morphology provides a basis for preparing particulate TLC layers; however, the uniformity and adhesion of the deposited coating cannot be established from the powder morphology alone.
Figure 1.
Morphological characteristics of the HFSA: (a) SEM micrograph of the microspherical particles and (b) corresponding particle size distribution, showing a mean diameter of 7.6 µm. Scale bar: 10 µm.
EDS detected C (8.09%), N (2.95%), O (51.80%), and Si (37.16%) in HFSA. The predominance of silicon and oxygen is consistent with a silica-rich inorganic framework. Nitrogen detection is consistent with nitrogen-containing material in the analyzed regions but is not specific to fibroin or proteins. The simultaneous detection of C, N, O, and Si is compatible with the intended hybrid composition. EDS alone, however, does not identify the nitrogen-containing component, establish its molecular incorporation into silica, or determine the nature of organic–inorganic interactions.
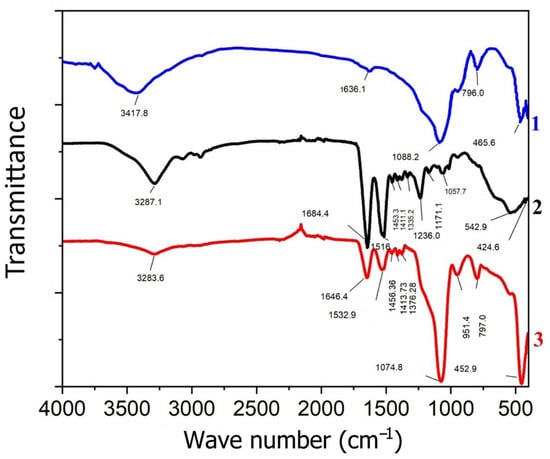
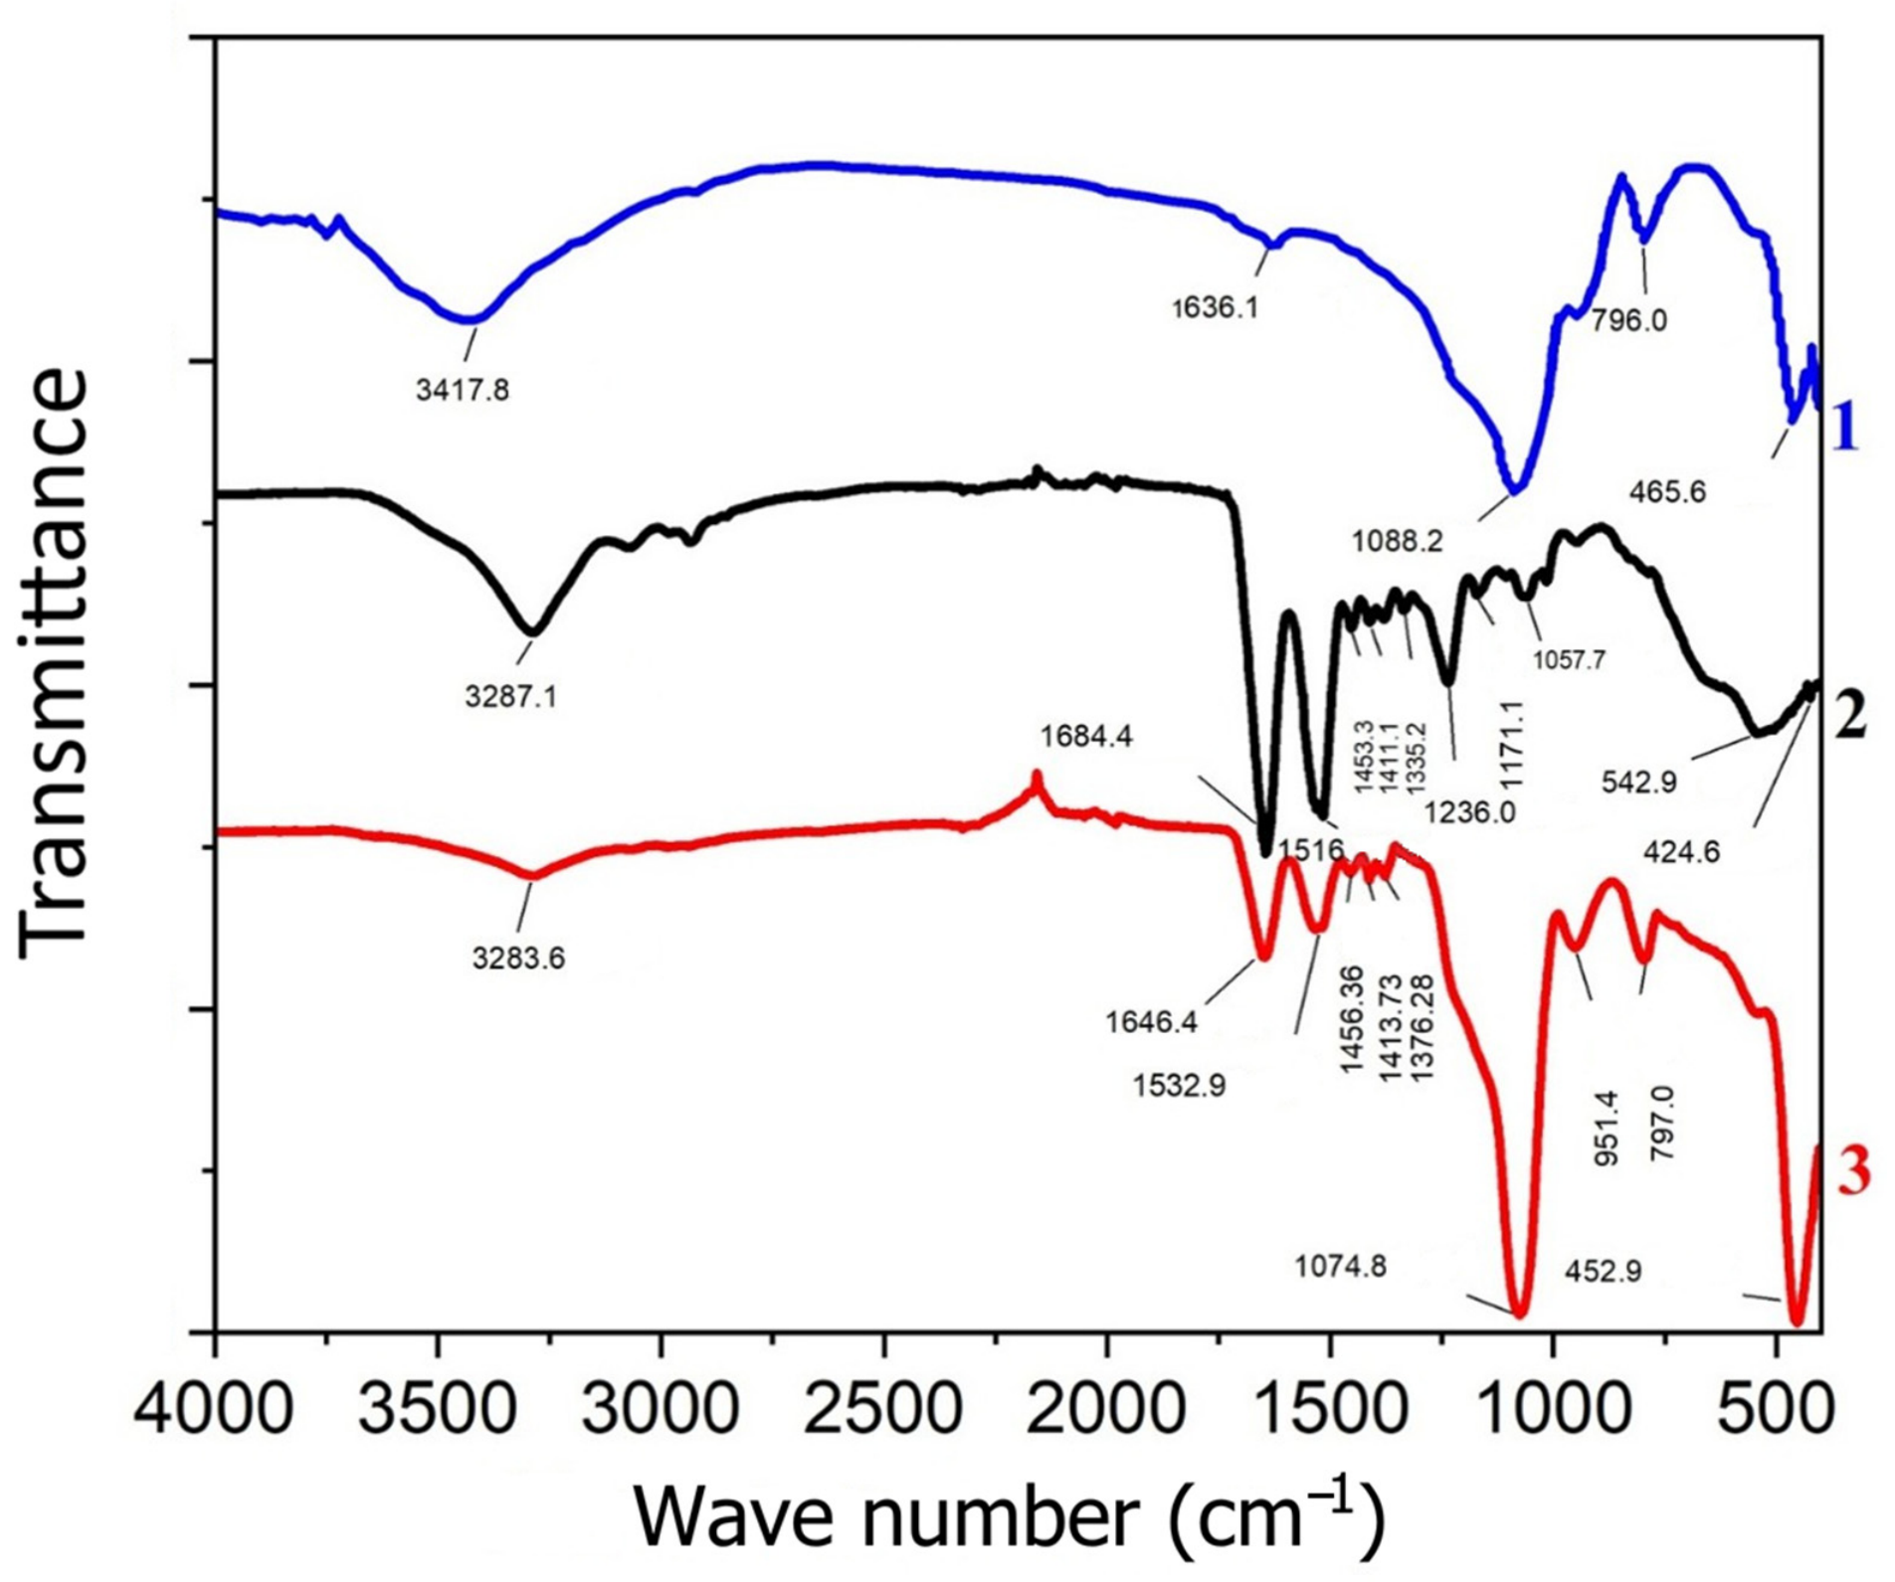
FTIR spectroscopy was used to identify the characteristic functional groups of MSS, fibroin, and HFSA and to complement the elemental evidence from EDS. As shown in Figure 2, the HFSA exhibited absorption bands associated with both silica and fibroin components. The broad band centered at approximately 3410 cm−1 was assigned to overlapping O-H stretching vibrations from surface silanol and hydroxyl groups, with a possible contribution from N-H stretching groups in the fibroin. The intense band at 1062 cm−1 is attributed to the asymmetric stretching vibrations of the siloxane network (≡Si-O-Si≡). The 1638 cm−1 feature may contain overlapping contributions from fibroin amide I and H–O–H bending of adsorbed water, whereas the 1521 cm−1 band is assigned to amide II. These spectral features are consistent with those of fibroin-containing materials [23]. As shown in Figure 2, fibroin provided the protein band reference and MSS the silica-associated background. Therefore, the possible amide I contribution in HFSA is interpreted alongside the accompanying amide II band, rather than from the 1638 cm−1 feature alone. Drying at 95 °C does not exclude residual or readsorbed water, and activation at 110 °C applies to TLC plates rather than establishing the hydration state of the FTIR KBr pellets. The relative protein and water contributions remain unresolved. The presence of amide-associated bands alongside silica-associated absorptions, together with nitrogen detection by EDS and the introduction of fibroin during synthesis, supports the presence of fibroin-derived material in the silica-based product. This assignment rests on combined evidence rather than elemental composition alone. The persistence of amide-associated bands after processing indicates that peptide-related chemical features remain detectable in HFSA, although FTIR alone does not establish preservation of the original fibroin chain length or quantify changes in secondary structure. These measurements do not distinguish adsorption, physical association, or entrapment from molecular-scale integration, nor establish covalent bonding or a uniform distribution of fibroin-derived material.
Figure 2.
FTIR spectra of (1) MSS, (2) fibroin, and (3) HFSA, showing the characteristic silica and fibroin-associated absorption bands consistent with the presence of fibroin-derived material in the silica-based product.
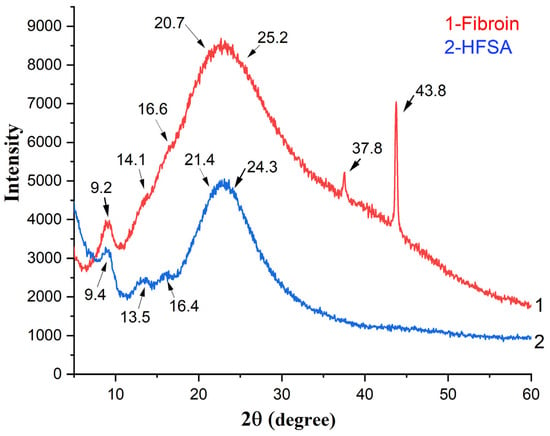
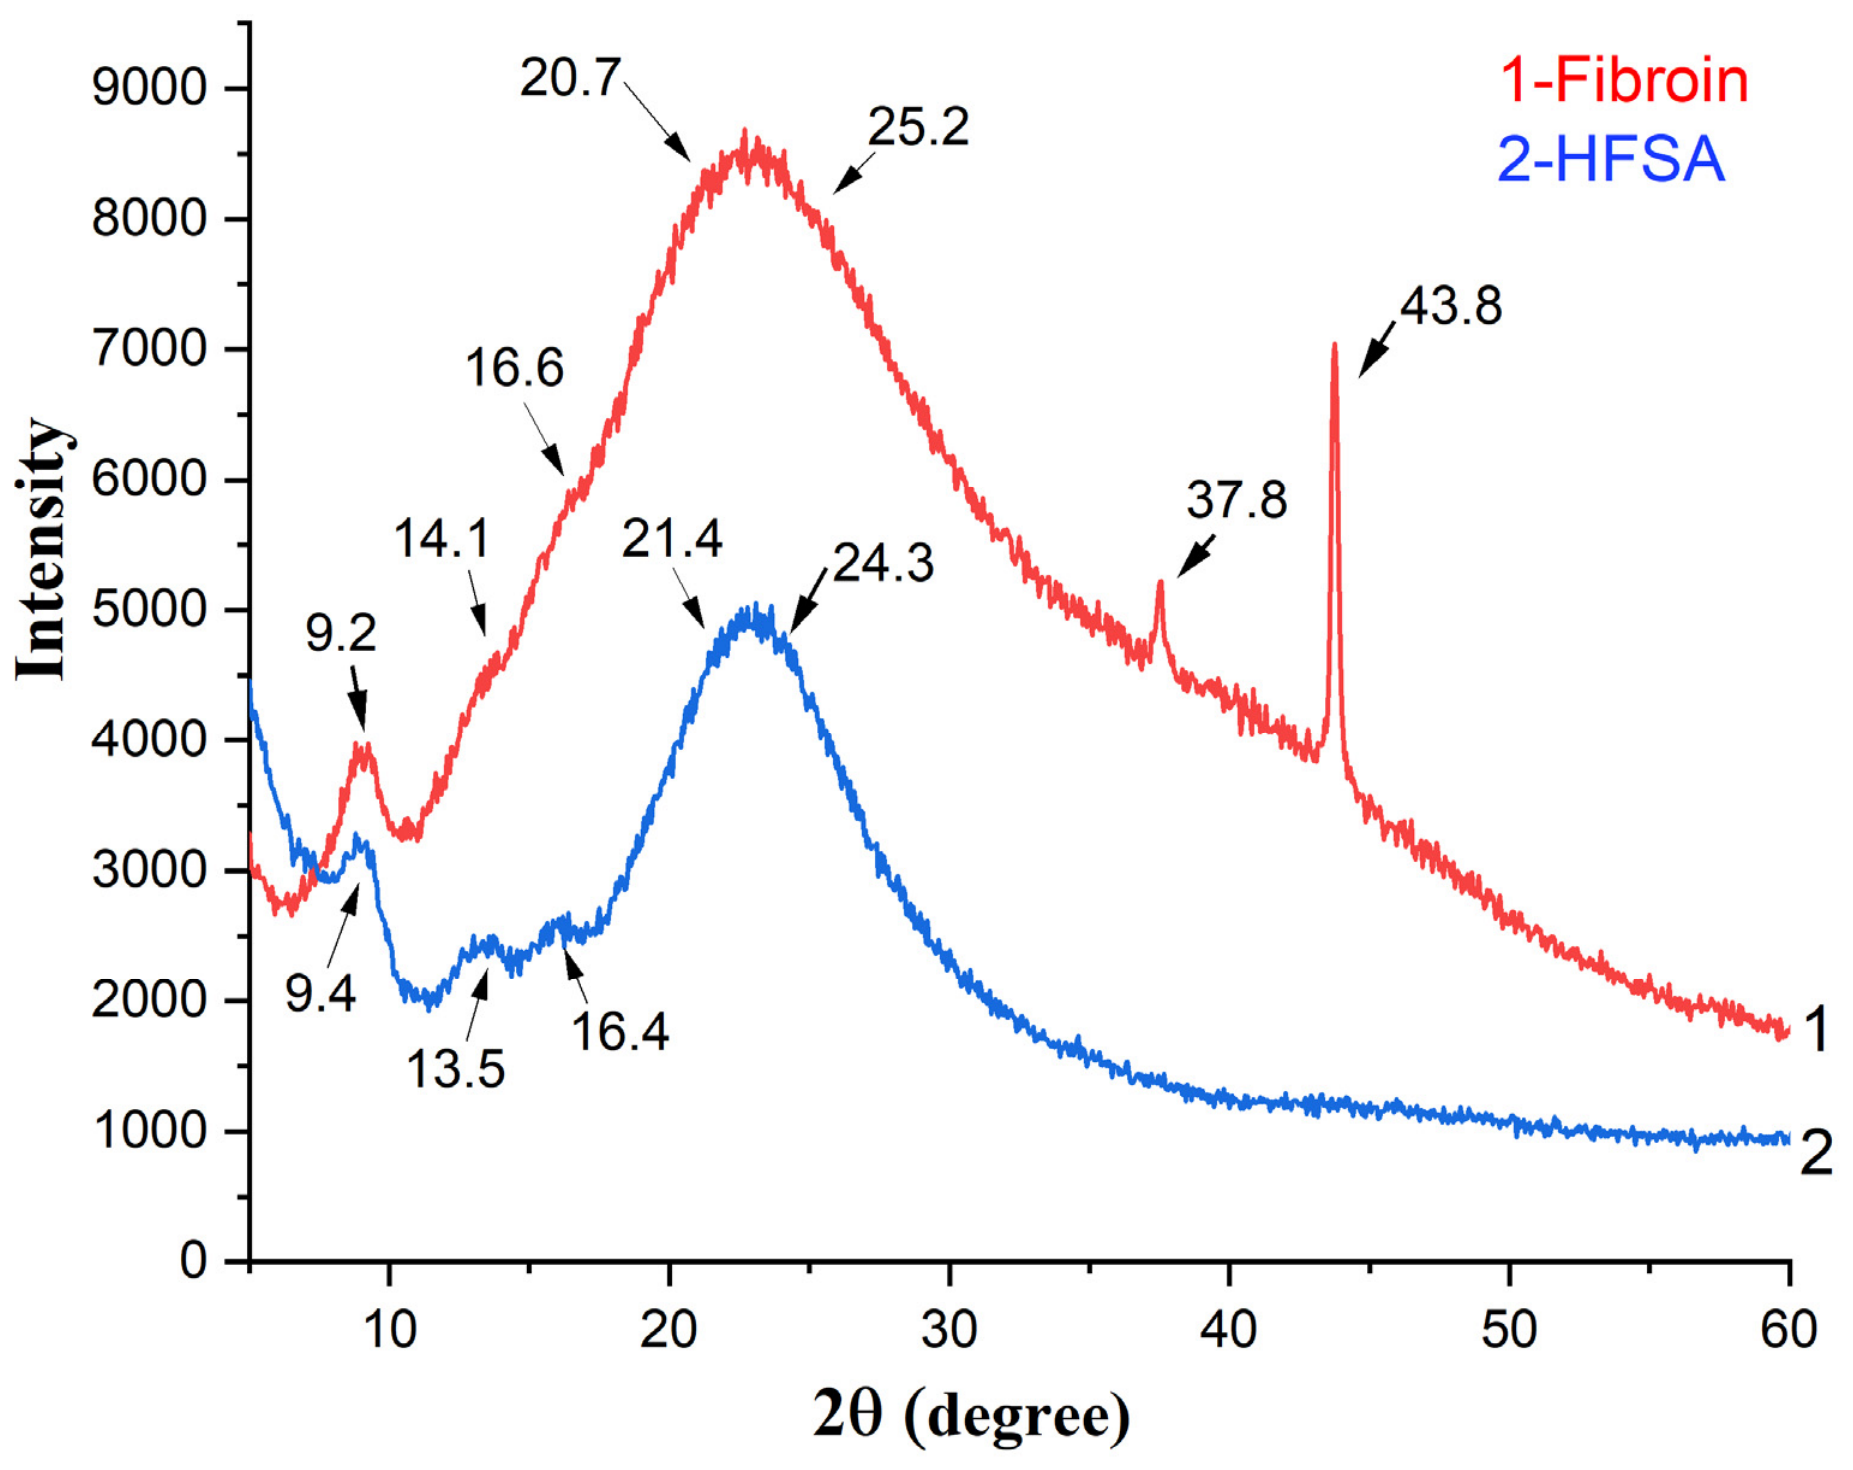
The structural organization of fibroin and HFSA was examined using XRD. The diffraction patterns (Figure 3) were dominated by broad features, indicating the largely amorphous or poorly crystalline character of both materials. Fibroin-related reflections associated with the Silk II β-sheet structure were observed at approximately 9–10°, 20.7°, and 24–25° (2θ) in both fibroin and HFSA, while an additional weak Silk II-related feature near 37.8° was distinguishable only in the fibroin sample [24]. In addition, weak features at approximately 14° and 16.5°, attributed to Silk I-type ordering, were more clearly resolved in HFSA, whereas in pure fibroin, they were largely obscured by the broad main diffraction band [24]. The persistence of the Silk II-associated peaks in HFSA is consistent with the retention of some fibroin-associated β-sheet ordering in the silica-based product. At the same time, the altered peak shape and intensity suggest differences in structural organization between fibroin and HFSA, although the contributions of the silica matrix and processing-induced rearrangement cannot be distinguished from these patterns alone. The intense and narrow reflection at approximately 43.8° in the fibroin pattern was not assigned to fibroin and is most likely associated with the steel sample holder [25].
Figure 3.
X-ray diffraction patterns of (1) fibroin and (2) HFSA.
N2 adsorption–desorption measurements were used to assess the textural properties of the MSS and HFSA. Table 1 summarizes the BET-specific surface area and total pore volume. The specific surface area of the hybrid material was 318 m2/g, which is approximately 11% higher than that of MSS (287 m2/g). The total pore volume was also higher for HFSA (1.03 cm3/g) than for MSS (0.24 cm3/g) samples.
Table 1.
Structural characteristics of MSS and HFSA.
These results indicate that incorporating fibroin during HFSA synthesis altered the reported textural properties relative to MSS. The higher reported surface area and pore volume suggest differences in accessible porosity but do not independently establish pore enlargement or improved accessibility for the investigated dyes. Combined with the chemically diverse functional groups introduced by fibroin, these textural characteristics may contribute to the observed retention differences, but their contribution cannot be separated from surface-chemical effects using the present measurements alone. Overall, the SEM-EDS, FTIR, XRD, and nitrogen adsorption and desorption results characterize HFSA as a porous microspherical silica-based product with detectable fibroin-derived chemical and structural features. These findings support the presence of fibroin-derived features after processing but do not establish preservation of the original fibroin molecular weight or secondary structure. Partial degradation or processing-induced rearrangement cannot be excluded, and the chromatographic observations therefore concern the processed fibroin-containing silica material.
3.2. Chromatographic Retention and Migration Behavior
The chromatographic behaviors of methyl orange, Sudan I, Sudan IV, and Rhodamine 6G were investigated using the two mobile phases specified in Section 2.4. We compared MSS and HFSA using MPh1 and evaluated the effect of mobile phase composition on HFSA by comparing MPh1 and MPh2 without changing the stationary-phase formulation. Table 2 summarizes the experimentally measured Rf values obtained under the three chromatographic conditions.
Table 2.
Rf values of the investigated dyes under different chromatographic conditions.
The results obtained with defined dye mixtures establish comparative retention behavior under the specified chromatographic conditions. In complex samples, co-extracted constituents may compete for adsorption sites, modify dye migration, or overlap with analyte spots. Because real samples and matrix-spiked controls were not examined, the magnitude of these effects and their influence on analyte recovery remain undetermined.
Dye migration was observed on the prepared binder-free HFSA layers under the investigated conditions. Although dry-layer thickness was measured at selected positions, spatial uniformity across the coated surface, adhesion, and solvent-induced leaching were not quantified. Powder morphology and dye migration do not establish these coating properties. Consequently, possible contributions of coating heterogeneity or material loss to the reported retention values cannot be excluded, and coating stability remains unverified.
As shown in Table 2, dye migration differed between the investigated stationary- and mobile-phase conditions. Under MPh1 conditions, the decreasing order of Rf values was methyl orange > Sudan I > Sudan IV > Rhodamine 6G on both MSS and HFSA. However, all four dyes exhibited lower Rf values on HFSA than on MSS, consistent with increased apparent retention in the reported experiments. The largest observed shift occurred for Sudan IV, whose Rf decreased from 0.54 on MSS to 0.33 on HFSA. In contrast, the changes observed for methyl orange, Sudan I, and Rhodamine 6G were more moderate. Without independent replicates, the reproducibility and statistical significance of these differences remain unestablished.
Changing the mobile phase from MPh1 to MPh2 on the HFSA markedly altered the migration sequences. Under MPh2-HFSA conditions, the Rf values decreased in the following order: Sudan IV > Sudan I > methyl orange > Rhodamine 6G. Sudan IV and Sudan I exhibited relatively high Rf values of 0.86 and 0.77, respectively, whereas methyl orange showed intermediate migration (Rf = 0.49), and Rhodamine 6G was strongly retained (Rf = 0.20). This redistribution suggests that dye polarity alone is insufficient to explain migration trends. Differences in solvation, competition for adsorption sites, and analyte–surface interactions may contribute to this phenomenon, although their individual effects have not been resolved.
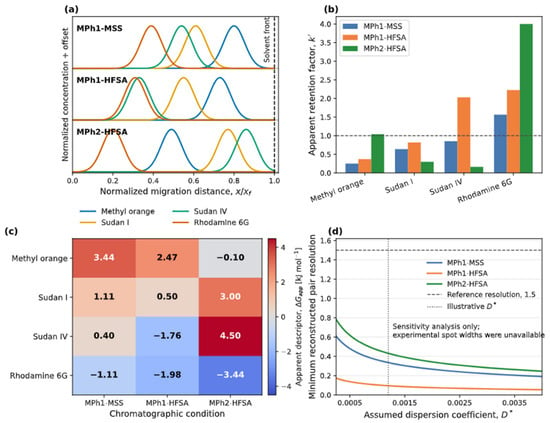
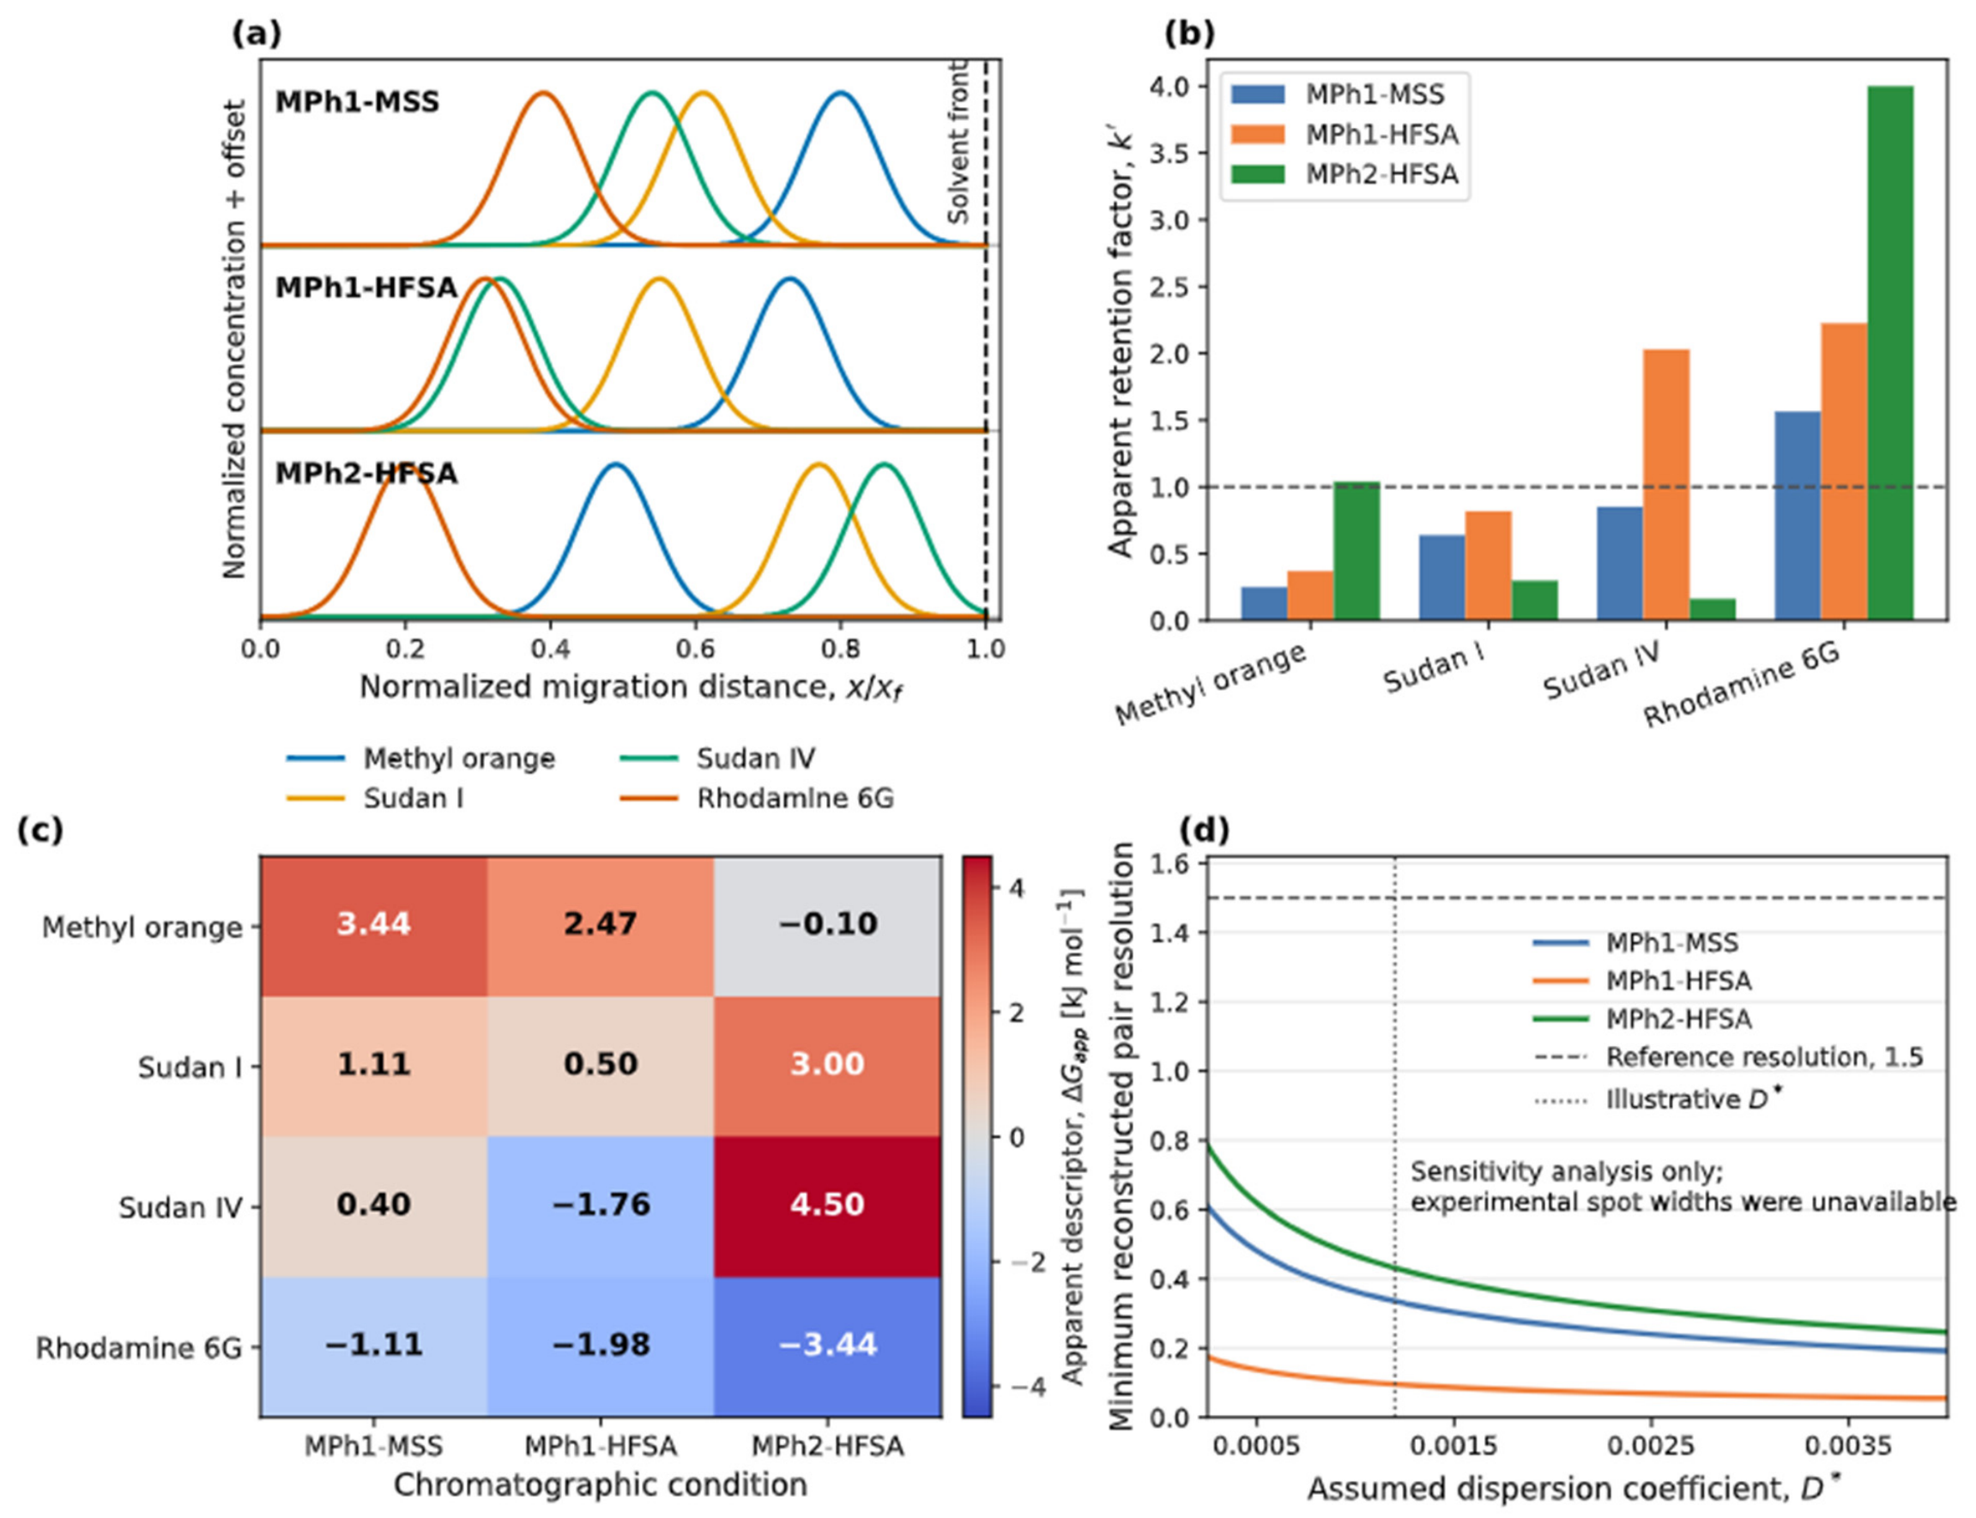
To provide a unified quantitative representation of the experimental results, we incorporated the measured Rf values into the dimensionless retention-transport reconstruction described in Section 2.5. The reconstructed Gaussian concentration profiles reproduced the measured band centroid positions and illustrated the condition-dependent changes in dye migration (Figure 4a). Because the normalized velocities were assigned directly from the experimental Rf values, these profiles represent calibrated reconstructions rather than independent predictions of chromatographic transport [26,27].
Figure 4.
Dimensionless reconstruction of dye migration and apparent retention on MSS and HFSA plates. (a) Gaussian concentration profiles of methyl orange (MO), Sudan I (SI), Sudan IV (SIV), and Rhodamine 6G (R6G) reconstructed from the experimental Rf values under MPh1-MSS, MPh1-HFSA, and MPh2-HFSA conditions at t* = 1. A common dispersion coefficient and initial bandwidth were used for visualization; therefore, the displayed widths were not the predicted widths. (b) Apparent retention factors calculated as k′ = (1 − Rf)/Rf. The dashed line at k′ = 1 corresponds to Rf = 0.5. (c) Apparent retention free-energy descriptor, ΔGapp = −RT ln(k′), calculated at 298.15 K. (d) Sensitivity of the minimum reconstructed adjacent-pair resolution to the assumed dimensionless dispersion coefficient, D*. The dashed and dotted lines indicate a reference resolution of 1.5 and an illustrative value of D* = 0.0012. Panel (d) shows the sensitivity analysis and does not predict the experimental resolution.
The apparent retention parameter (k’), calculated using Equation (3), provided a derived comparison of the reported retention differences between MSS and HFSA under MPh1 (Figure 4b). When MSS was replaced with HFSA, k’ increased from 0.25 to 0.37 for methyl orange, from 0.64 to 0.82 for Sudan I, from 0.85 to 2.03 for Sudan IV, and from 1.56 to 2.23 for Rhodamine 6G. Greater retention alone does not establish improved separation; its analytical benefit depends on the relative migration and experimental spot widths of the neighboring analytes.
Under the MPh2-HFSA conditions, the apparent retention parameters calculated using Equation (3) were approximately 0.163 for Sudan IV, 0.299 for Sudan I, 1.041 for methyl orange, and 4.00 for Rhodamine 6G. The low values for the Sudan dyes are consistent with their high Rf values, whereas Rhodamine 6G showed the highest and methyl orange intermediate apparent retention. The contrasting k′ values emphasize the dye-dependent effect of the mobile-phase composition.
The apparent retention free energy descriptor, calculated using Equation (4), provided an additional comparative representation of these changes (Figure 4c). Under MPh1 conditions, replacing MSS with HFSA shifted ΔGapp from 0.40 to −1.76 kJ mol−1 for Sudan IV and from −1.11 to −1.98 kJ mol−1 for Rhodamine 6G, consistent with their increased apparent retention on HFSA. In contrast, MPh2-HFSA produced positive ΔGapp values for Sudan I and Sudan IV and a strongly negative value for Rhodamine 6G, further demonstrating the dye-dependent influence of the mobile-phase composition. Because k’ was derived directly from the measured Rf values, and the TLC phase ratio was not independently determined, ΔGapp should be interpreted only as a comparative retention descriptor and not as a molecular adsorption free energy.
We examined the influence of the assumed dispersion coefficient on the reconstructed band separation using a sensitivity analysis (Figure 4d). For all three chromatographic conditions, the minimum reconstructed adjacent pair resolution decreased as the assumed dimensionless dispersion coefficient increased. Across the investigated range, MPh2-HFSA maintained the highest minimum reconstructed resolution, whereas MPh1-HFSA exhibited the lowest minimum reconstructed resolution. None of the reconstructed profiles reached the reference resolution value of 1.5, including the illustrative value (D* = 0.0012). However, we did not measure the experimental spot widths or dispersion coefficients. Therefore, Figure 4d quantifies only the sensitivity of the reconstruction to the assumed band broadening and should not be interpreted as a prediction or measurement of the experimental chromatographic resolution.
3.3. Proposed Mechanistic Interpretation of Dye Retention
The chromatographic behavior observed in Table 2 is discussed below in terms of possible interactions with the chemically heterogeneous HFSA surface. The silica component provides a rigid porous framework containing silanol (≡Si-OH) and siloxane (≡Si-O-Si≡) groups. Fibroin contributes peptide bonds (-CO-NH-), hydroxyl groups from amino acid residues such as serine and tyrosine, carboxyl groups from aspartic and glutamic acid residues, amino-containing groups, and hydrophobic domains associated with non-polar amino acid side chains. Consequently, dye retention on HFSA may involve hydrogen bonding, hydrophobic association, van der Waals forces, π-π interactions, and possible electrostatic effects. These assignments are hypotheses based on chemical functionality rather than direct measurements of individual interactions. The actual mobile-phase pH, analyte speciation, and HFSA surface charge under development conditions were not determined; electrostatic attraction, repulsion, or ion exchange therefore cannot be specifically assigned.
Abraham et al. reported a solubility-derived water–wet octanol logP of 5.60 for Sudan I [28]. Separately, calculated PubChem descriptors are 4.1 for Sudan I (XlogP3) and 7.1 for Sudan IV (XlogP3-AA), supporting greater predicted lipophilicity of Sudan IV [29,30]. For methyl orange and Rhodamine 6G, pH-specific logD is more appropriate; however, aqueous-buffer values cannot be assigned directly to MPh1 or MPh2 because mobile-phase pH and dye speciation were not determined. These descriptors therefore provide context, without establishing a hydrophobicity ranking under the TLC conditions or identifying the dominant retention mechanism.
Under MPh1 conditions, chromatographic retention may involve adsorption-related interactions and competition between the dye molecules and isopropanol for accessible surface sites. Isopropanol contains both a polar hydroxyl group and a hydrophobic -CH(CH3)2 group and may interact with both the polar and nonpolar regions of the hybrid stationary phase. Competition for accessible sites may favor dye desorption and migration. Nevertheless, the decreasing migration order of methyl orange > Sudan I > Sudan IV > Rhodamine 6G indicates increasing apparent retention under these conditions, without identifying the interactions responsible.
Methyl orange exhibited Rf values of 0.80 and 0.73 on MSS and HFSA, respectively, under MPh1 conditions (Table 2). The modest reduction in Rf indicates slightly stronger retention on the hybrid stationary phase. Methyl orange contains an azo group and sulfonate functionality that may interact with the polar and ionizable sites on HFSA. Polar interactions, including hydrogen bonding where chemically accessible, may contribute to retention [31]. However, neither the higher Rf relative to the other dyes nor its sulfonate functionality establishes the strength or direction of electrostatic interactions under MPh1 conditions.
Sudan I showed intermediate migration, with Rf values of 0.61 on MSS and 0.55 on HFSA (Table 2). This difference of 0.06 is an individual observed shift; without replicate measurements, it cannot be established whether the difference exceeds experimental variability. The azo and naphtholic hydroxyl groups of the dye provide potential sites for hydrogen bonding with oxygen-containing sites on silica and with the carbonyl or amino groups of the fibroin [31,32]. The aromatic structure of Sudan I may also participate in hydrophobic and π–π interactions with nonpolar and aromatic residues associated with fibroin. These structural considerations identify plausible interactions but do not establish their contributions to the measured retention.
Sudan IV showed the largest observed retention difference, with Rf values of 0.54 on MSS and 0.33 on HFSA (Table 2). Sudan IV contains an extended aromatic structure, two azo groups, methyl-substituted aromatic rings, and a naphthyl moiety, producing a comparatively large aromatic molecular surface. Its increased apparent retention on HFSA may be consistent with hydrophobic association with non-polar fibroin domains, van der Waals interactions, and possible π-π interactions with aromatic amino acid residues, such as tyrosine [28,33]. The higher calculated lipophilicity of Sudan IV supports the consideration of hydrophobic association, but does not demonstrate that this interaction controls its retention. Polar interactions involving azo and hydroxyl functionalities may provide additional stabilization. The present measurements do not establish which, if any, of these contributions dominates.
Rhodamine 6G exhibited the lowest Rf values under MPh1 conditions: 0.39 on the MSS and 0.31 on the HFSA (Table 2). Its extended xanthene ring system, ionic character, and polar functionalities suggest several possible modes of association with the stationary phase. The aromatic framework may participate in hydrophobic and π-π interactions, whereas its polar and ionic groups may support hydrogen bonding with silica and fibroin-derived sites. Any electrostatic contribution remains unresolved because the relevant surface charge and analyte speciation were not measured.
The migration-order reversal observed in MPh2 (Table 2) requires consideration of changes in solvent competition and analyte–surface interactions. Water and acetic acid increase the polarity and protic character of the mobile phase and may modify the competition for hydrogen-bonding sites and the protonation states of ionizable groups on the dyes and stationary phase. These effects provide possible explanations for the redistribution of analyte affinities [34,35].
Sudan IV exhibited the highest mobility under MPh2-HFSA conditions (Rf = 0.86). Its higher calculated octanol–water partition descriptor indicates greater predicted lipophilicity than that of Sudan I [29,30]; nevertheless, its higher mobility under MPh2 conditions illustrates that lipophilicity alone does not determine retention on the HFSA. Water, isopropanol, and acetic acid may compete for polar adsorption and hydrogen bonding sites on HFSA, thereby reducing the contribution of these sites to the retention of neutral Sudan dyes. The higher Rf of Sudan IV establishes lower apparent retention but does not identify its molecular origin. Sudan I migrated somewhat more slowly (Rf = 0.77), which may reflect differences in solvation or analyte–surface association; hydrogen bonding involving its naphtholic hydroxyl group is one possible contribution to this result. Their different migration patterns demonstrate mobile-phase-dependent selectivity without resolving the balance between individual interactions.
Methyl orange exhibited intermediate mobility under MPh2-HFSA conditions (Rf = 0.49). Its sulfonate-containing structure provides a basis for polar interactions; however, the net charge of the dye and the protonation state of HFSA under MPh2 conditions were not established. Therefore, electrostatic attraction between methyl orange and protonated fibroin sites cannot be assigned from acid addition alone. Hydrogen bonding and other polar interactions may also contribute to retention, alongside differences in mobile-phase solvation. These possibilities provide a qualitative interpretation of its lower mobility relative to the Sudan dyes, rather than a demonstrated mechanism [36].
Rhodamine 6G was the most strongly retained dye under MPh2-HFSA conditions, with an Rf value of 0.20 (Table 2). Although Rhodamine 6G is introduced as a cationic dye, its speciation and the charge of the HFSA surface under MPh2 conditions have not been measured. Its planar xanthene framework may participate in hydrophobic and π-π interactions with fibroin-associated nonpolar and aromatic domains, whereas its polar functionalities may support hydrogen bonding with suitable surface groups. Electrostatic effects remain possible, but their direction and magnitude cannot be inferred without surface charge and speciation measurements. The proposed interactions offer possible explanations for its pronounced retention but are not independently demonstrated by migration data [37].
Overall, the present data do not establish whether one interaction dominates or several contributions determine retention. The dye structure and mobile-phase composition provide possible explanations for the observed trends, but the individual interaction contributions were neither isolated nor quantified. Thus, the reversal in the migration order between MPh1 and MPh2 reflects a change in apparent retention and selectivity; its molecular basis remains a proposed interpretation.
3.4. Migration Maps and Chromatographic Selectivity
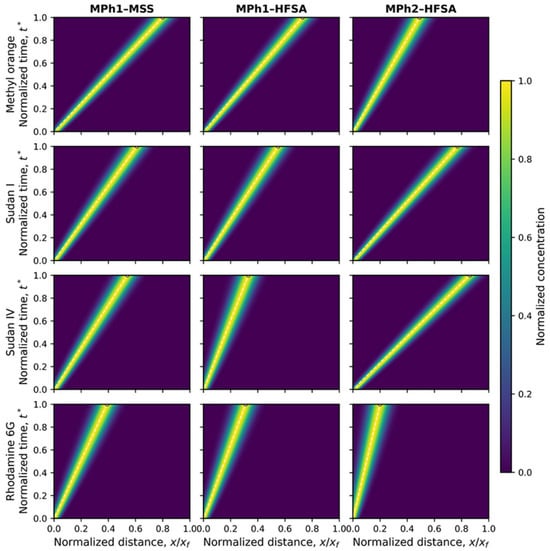
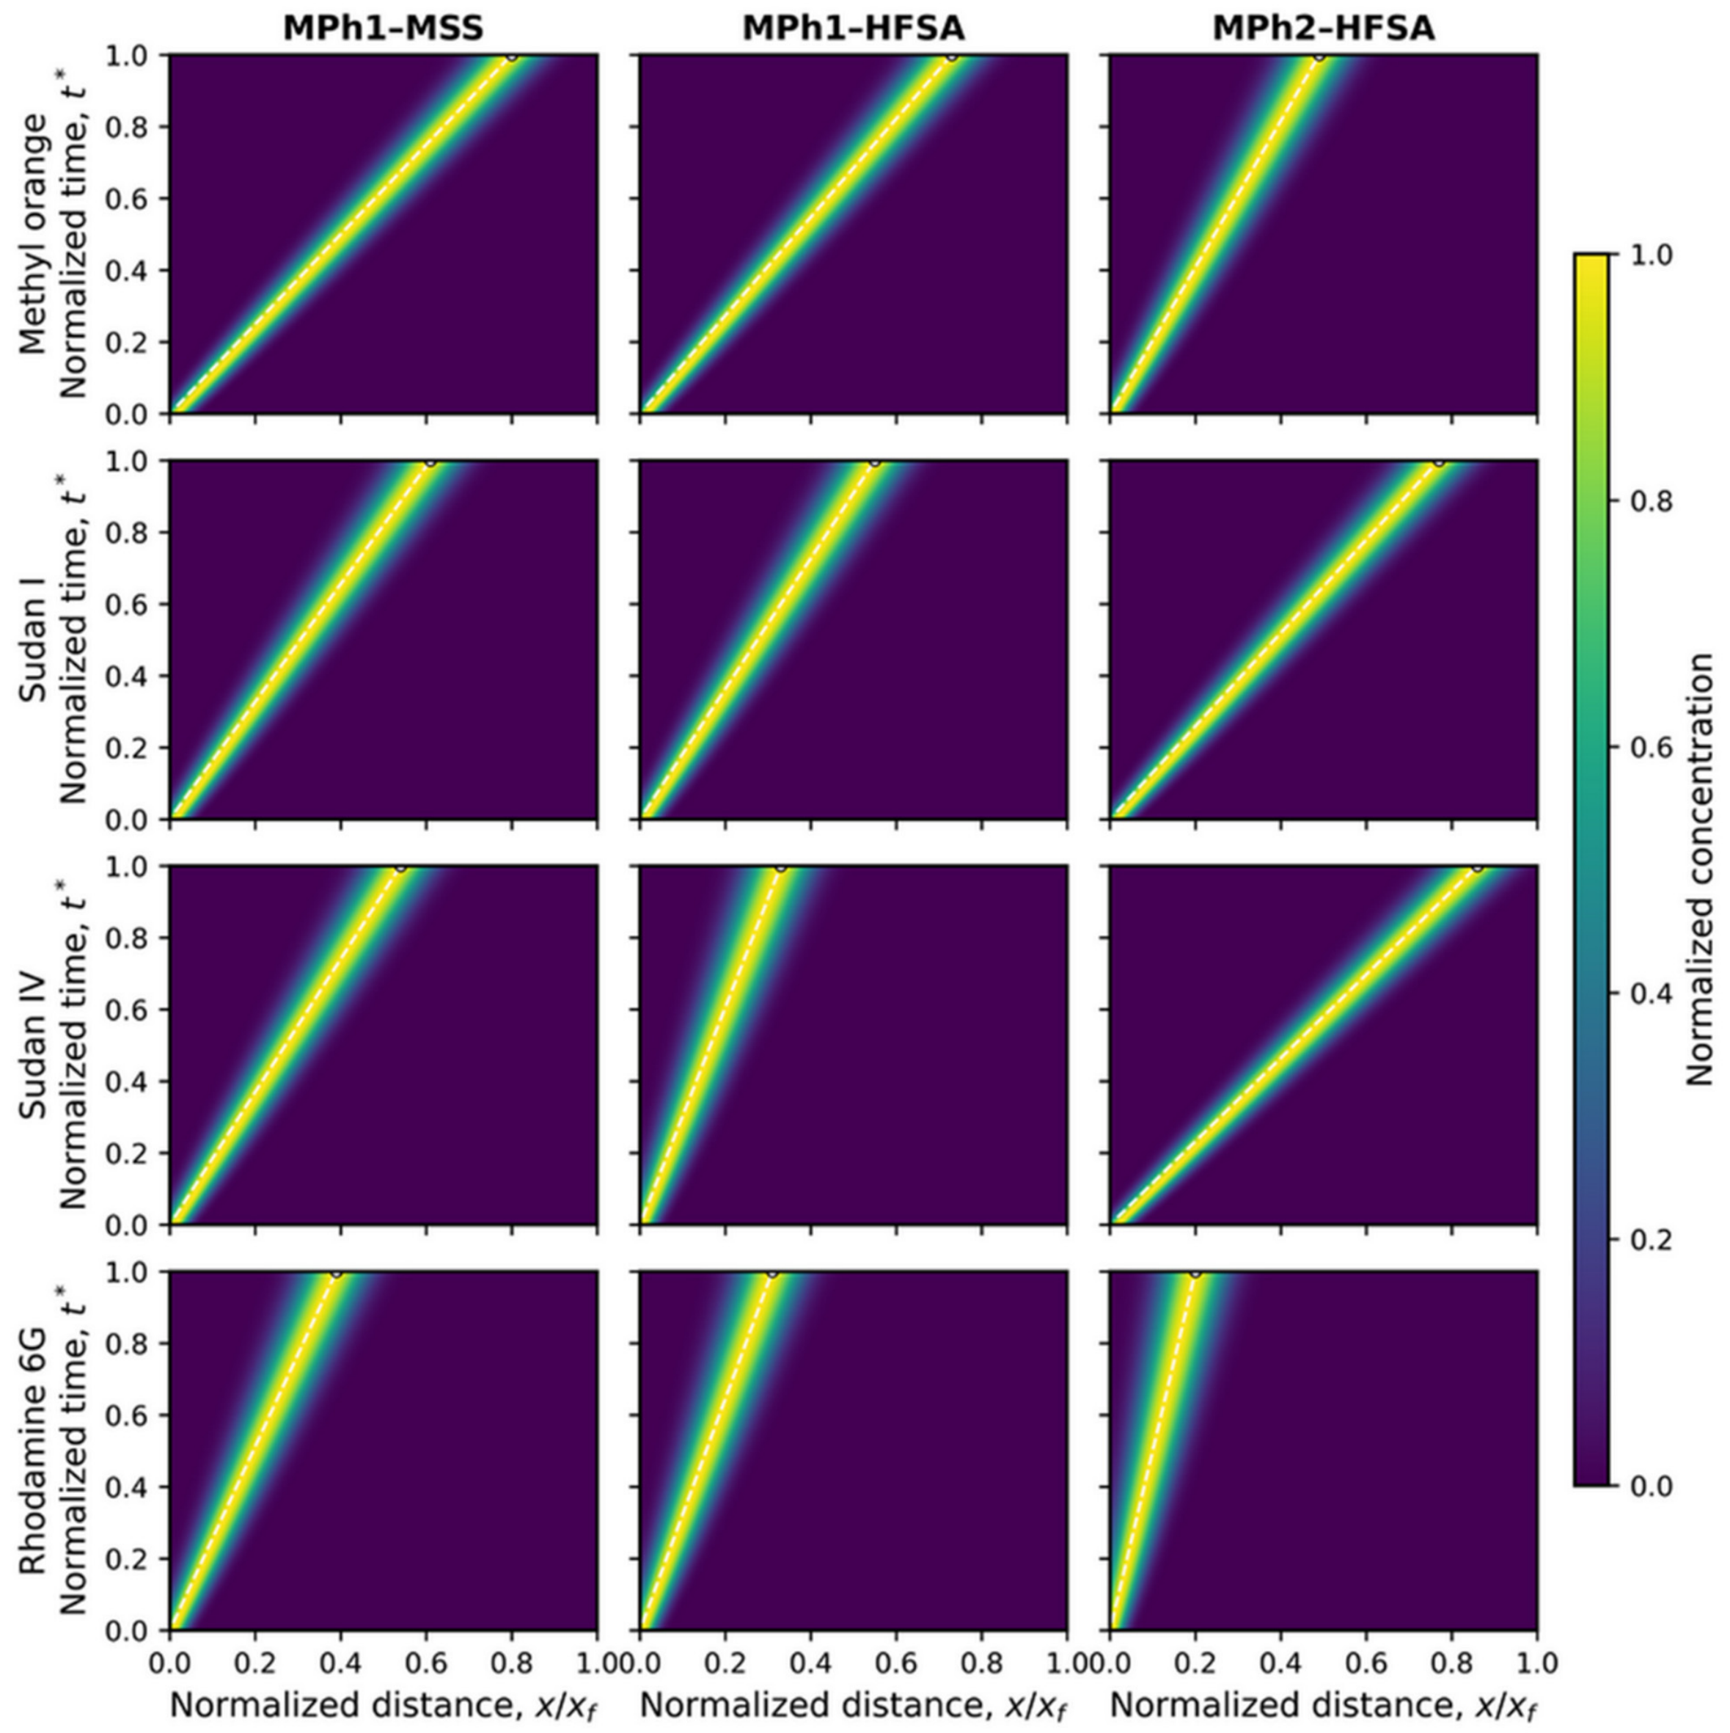
To visualize the evolution of the reconstructed dye bands during chromatographic development, dimensionless spatiotemporal migration maps were generated for all dyes under the three conditions (Figure 5). The prescribed band trajectories reproduced the experimentally determined final Rf positions at t* = 1 and illustrated the effects of the stationary and mobile phase composition on dye migration.
Figure 5.
Dimensionless spatiotemporal reconstruction of dye migration. Normalized concentration distributions of methyl orange, Sudan I, Sudan IV, and Rhodamine 6G as functions of normalized development time and migration distance under MPh1-MSS, MPh1-HFSA, and MPh2-HFSA conditions. Dashed trajectories indicate the prescribed band centroids corresponding to the experimentally determined Rf values at t* = 1. A common dimensionless dispersion coefficient (D* = 0.0012) and initial standard deviation (σ0* = 0.018) were applied to all the conditions. The maps are calibrated reconstructions and should not be interpreted as independent predictions of migration profiles.
Because the same dimensionless dispersion coefficient and initial band width were assigned to all dyes, the maps provided a standardized visualization of their measured migration behavior. They do not represent experimentally validated band shapes or independent predictions of band broadening. In particular, the final band centroids were constrained by the measured Rf values, whereas the displayed widths depended on the assumed dispersion parameters [38].
We further compared the chromatographic behavior under MPh1 conditions using measured Rf values and apparent retention parameters calculated using Equation (3). Table 3 presents the reported resolution values (Rs) alongside the (Rf)-derived selectivity factors for MSS and HFSA. The underlying spot-width measurements and calculation records for the reported (Rs) values were not available for independent verification. Therefore, these values are retained as preliminary reported descriptors and should not be interpreted as validated evidence of improved experimental resolution. The derived apparent retention parameters and selectivity factors inherit the uncertainty of the underlying Rf observations. Because replicate-based variability estimates are unavailable, these quantities are preliminary descriptors rather than statistically established differences between stationary phases. For each adjacent dye pair, the selectivity factor was calculated from the corresponding apparent retention parameters as
where k’1 and k’2 are the apparent retention parameters of the less-retained and more retained analytes, respectively. Calculations used the reported Rf values without intermediate rounding, and the final selectivity factors were rounded to two decimal places.
Table 3.
Rf-based comparison of dye separation using MPh1 on MSS and HFSA.
The Rf-derived comparisons indicated differences in the apparent retention and selectivity between MSS and HFSA under the tested conditions. For methyl orange and Sudan I, the selectivity factor α decreased from 2.56 for MSS to 2.21 for HFSA. In contrast, the selectivity between Sudan I and IV was higher on HFSA, increasing from 1.33 to 2.48, consistent with the particularly strong increase in the apparent retention of Sudan IV on HFSA compared to that on MSS. This preliminary comparison identified Sudan I/Sudan IV as a candidate for further investigation; however, confirmation requires replicate measurements and experimental spot-width analysis. The selectivity between Sudan IV and Rhodamine 6G decreased from 1.84 on MSS to 1.10 on HFSA because the two dyes exhibited similar apparent retention on the hybrid phase. Thus, fibroin incorporation did not uniformly improve the selectivity for every adjacent pair; instead, it redistributed the relative retention in a dye-dependent manner [39].
The MSS comparison establishes differences between the prepared silica reference and HFSA, but does not isolate the contribution of incorporating fibroin during silica formation from that achievable through physical mixing. Likewise, performance relative to pure fibroin layers or commercial TLC plates cannot be inferred from these results. Therefore, the present contribution demonstrates the retention behavior of this fibroin-containing formulation relative to MSS; superiority over previously reported silica–organic hybrids or other modified TLC adsorbents is not established. A comparative evaluation would require matched mobile-phase and development conditions, controlled analyte loading, and characterization of coating thickness and particle-size differences, together with replicate measurements of retention, spot widths, resolution, and coating integrity. The present comparison does not quantify variability across independent synthesis batches, separately prepared plates, or different measurement days. These sources of variability, together with sensitivity to temperature and relative humidity, require a dedicated reproducibility and robustness study.
The selectivity pattern obtained using MPh2 on HFSA was markedly different, as summarized in Table 4. The neutral Sudan dyes exhibited low k′ values owing to their high mobilities, whereas methyl orange and Rhodamine 6G exhibited considerably greater apparent retention.
Table 4.
Rf-based comparison of dye migration on HFSA using MPh2.
Under the MPh2-HFSA conditions, the selectivity factors were 1.83 for the Sudan IV/Sudan I pair, 3.48 for the Sudan I/methyl orange pair, and 3.84 for the methyl orange/Rhodamine 6G pair (Table 4). The highest selectivity was observed between methyl orange and Rhodamine 6G, reflecting their substantially different apparent retention under MPh2 conditions. Nevertheless, these selectivity factors describe differences in retention and do not establish complete experimental spot resolution because the spot widths required to calculate Rs are unavailable.
The selectivity trends were consistent with the complementary silica- and fibroin-derived interaction sites discussed in Section 3.3 [40]. The chemical diversity of HFSA provides a plausible basis for its interaction with structurally different dyes, although the retention measurements do not establish which interactions produce the observed selectivity [41]. These comparisons establish condition-dependent retention and selectivity, rather than stationary-phase tunability. The practical potential of HFSA lies in providing alternative selectivity for target dye pairs; however, whether this produces useful resolution gains requires experimental confirmation.
4. Conclusions
A microspherical hybrid fibroin-silica adsorbent was successfully prepared and evaluated as a stationary phase for the thin-layer chromatographic analysis of standard mixtures containing methyl orange, Sudan I, Sudan IV, and Rhodamine 6G. The material exhibited a predominantly amorphous and porous structure and showed silica-associated and amide-associated FTIR bands, which, together with nitrogen detection by EDS and the synthesis history, support the presence of fibroin-derived material in the silica-based product. The HFSA exhibited a higher reported specific surface area and total pore volume than MSS, together with chemical features that suggest additional potential analyte-interaction sites.
The preservation of fibroin molecular integrity and the stability of the deposited coating remain unverified. Comparative characterization before and after processing, together with further assessment of coating uniformity, adhesion, and material release during mobile-phase exposure, is required to establish these properties and assess their influence on chromatographic performance. The reported observations indicate differences in dye retention and migration between stationary- and mobile-phase conditions. Under MPh1 conditions, all four dyes exhibited greater apparent retention on HFSA than on MSS, with the most pronounced effect observed for Sudan IV. The apparent Sudan I/Sudan IV selectivity increased from 1.33 to 2.48, whereas selectivity decreased for the other adjacent pairs. These comparisons suggest a pair-specific selectivity change, but remain preliminary because independent replicate measurements and variability estimates are unavailable. Replacing MPh1 with the water- and acid-containing MPh2 on the same HFSA formulation altered the migration order: the neutral Sudan dyes became highly mobile, methyl orange showed intermediate retention, and Rhodamine 6G remained strongly retained. This finding demonstrates mobile-phase-dependent selectivity without establishing a transition between chromatographic modes. The observed chromatographic behavior may reflect differences in analyte structure and mobile-phase-dependent solvation, together with possible analyte-surface interactions. These explanations remain hypotheses: no dominant mechanism was demonstrated, and distinguishing individual contributions requires targeted measurements of surface charge and analyte speciation alongside controlled variation in solvent composition, acidity, and ionic strength.
The dimensionless reconstruction provided a comparative visualization of the measured migration behavior but did not independently predict the experimental band broadening or resolution. HFSA was proposed as a candidate stationary phase for analytical TLC, and Sudan I/Sudan IV was identified as a target pair for further investigation. Its potential advantage is alternative selectivity relative to MSS; however, its improved resolution and broader applicability remain to be validated. Validation should quantify the variability in Rf, selectivity, and experimental resolution across independent synthesis batches, separately prepared plates, and different days, and assess the robustness under controlled temperature and relative humidity. Its application to wastewater, food, or pharmaceutical matrices requires evaluation using representative samples, matrix blanks, and spiked-recovery experiments, together with assessment of selectivity and precision, and, where appropriate, comparison with an established analytical method. Establishing stationary-phase tunability additionally requires systematic variation in the HFSA composition or surface properties across a broader range of analytes and mobile-phase conditions.
Author Contributions
Conceptualization, D.S.; Methodology, D.S., D.E. and L.A.; Software, S.K. (Sarvarjon Kurbonov); Formal analysis, D.S., C.B. and D.E.; Investigation, D.S., C.B., A.-A.A., Z.A., D.E., S.K. (Sanobar Kurbanbayeva) and S.K. (Sarvarjon Kurbonov); Resources, S.K. (Sanobar Kurbanbayeva); Data curation, A.-A.A., Z.A., S.K. (Sanobar Kurbanbayeva), S.K. (Sarvarjon Kurbonov) and L.A.; Writing—original draft, D.S., S.K. (Sarvarjon Kurbonov) and L.A.; Writing—review & editing, D.S. and L.A.; Visualization, S.K. (Sarvarjon Kurbonov); Supervision, D.S., Z.A. and L.A.; Project administration, D.S.; Funding acquisition, D.S. All authors have read and agreed to the published version of the manuscript.
Funding
This work was supported by the Ministry of Higher Education, Science and Innovation of the Republic of Uzbekistan (Project No. FZ-2020093090).
Data Availability Statement
The original contributions presented in this study are included in the article. Further inquiries can be directed to the corresponding authors.
Acknowledgments
D.Sh. gratefully acknowledges the Laboratory of Physical and Chemical Research Methods at the Institute of General and Inorganic Chemistry, Academy of Sciences of the Republic of Uzbekistan, for providing the necessary analytical equipment and technical assistance during the analysis of the samples.
Conflicts of Interest
The authors declare no conflicts of interest.
References
- Yagub, M.T.; Sen, T.K.; Afroze, S.; Ang, H.M. Dye and its removal from aqueous solution by adsorption: A review. Adv. Colloid Interface Sci. 2014, 209, 172–184. [Google Scholar] [CrossRef] [Scilit] [PubMed]
- Melati, I.; Rahayu, G.; Henny, C. The recent status of synthetic dyes mycoremediation: A review. IOP Conf. Ser. Earth Environ. Sci. 2022, 1062, 012029. [Google Scholar] [CrossRef] [Scilit]
- Islam, T.; Repon Md, R.; Islam, T.; Sarwar, Z.; Rahman, M.M. Impact of textile dyes on health and ecosystem: A review of structure, causes, and potential solutions. Environ. Sci. Pollut. Res. 2023, 30, 9207–9242. [Google Scholar] [CrossRef] [Scilit] [PubMed]
- Mehra, S.; Singh, M.; Chadha, P. Adverse Impact of Textile Dyes on the Aquatic Environment as well as on Human Beings. Toxicol. Int. 2021, 28, 165–176. [Google Scholar] [CrossRef] [Scilit]
- Gupta, V.K.; Suhas. Application of low-cost adsorbents for dye removal—A review. J. Environ. Manag. 2009, 90, 2313–2342. [Google Scholar] [CrossRef] [Scilit] [PubMed]
- Terán, J.E.; Millbern, Z.; Shao, D.; Sui, X.; Liu, Y.; Demmler, M.; Vinueza, N.R. Characterization of synthetic dyes for environmental and forensic assessments: A chromatography and mass spectrometry approach. J. Sep. Sci. 2021, 44, 387–402. [Google Scholar] [CrossRef] [Scilit] [PubMed]
- Riu, J.; Schönsee, I.; Barceló, D. Determination of sulfonated azo dyes in groundwater and industrial effluents by automated solid-phase extraction followed by capillary electrophoresis/mass spectrometry. J. Mass Spectrom. 1998, 33, 653–663. [Google Scholar] [CrossRef] [Scilit]
- Oliveira, J.M.S.; Sabatini, C.A.; Santos-Neto, A.J.; Foresti, E. Broken into pieces: The challenges of determining sulfonated azo dyes in biological reactor effluents using LC-ESI-MS/MS analysis. Environ. Pollut. 2023, 318, 120877. [Google Scholar] [CrossRef] [Scilit] [PubMed]
- Boussouf, I.; Medjram, M.S. Optimizing ultrasonic-assisted liquid–liquid extraction for an efficient removal of methylene blue dye from wastewater. Euro-Mediterr. J. Environ. Integr. 2025, 10, 2049–2060. [Google Scholar] [CrossRef] [Scilit]
- Uflyand, I.E.; Zhinzhilo, V.A.; Nikolaevskaya, V.O.; Kharisov, B.I.; Oliva González, C.M.; Kharissova, O.V. Recent strategies to improve MOF performance in solid phase extraction of organic dyes. Microchem. J. 2021, 168, 106387. [Google Scholar] [CrossRef] [Scilit]
- Soponar, F.; Moț, A.C.; Sârbu, C. Quantitative determination of some food dyes using digital processing of images obtained by thin-layer chromatography. J. Chromatogr. A 2008, 1188, 295–300. [Google Scholar] [CrossRef] [Scilit] [PubMed]
- Evans, K.P.; Truslove, N.J. Advances in chromatography for dyestuffs. Rev. Prog. Color. Relat. Top. 1993, 23, 36–39. [Google Scholar] [CrossRef] [Scilit]
- Sherma, J.; Fried, B. (Eds.) Handbook of Thin-Layer Chromatography, 3rd ed.; CRC Press: Boca Raton, FL, USA, 2003. [Google Scholar]
- Hoffmann, F.; Cornelius, M.; Morell, J.; Fröba, M. Silica-based mesoporous organic–inorganic hybrid materials. Angew. Chem. Int. Ed. 2006, 45, 3216–3251. [Google Scholar] [CrossRef] [Scilit] [PubMed]
- Babu, K.M. Silk fibres—Structure, properties and applications. In Handbook of Natural Fibres, 2nd ed.; Kozłowski, R.M., Mackiewicz-Talarczyk, M., Eds.; Woodhead Publishing: Cambridge, UK, 2020; pp. 385–416. [Google Scholar] [CrossRef] [Scilit]
- Vepari, C.; Kaplan, D.L. Silk as a biomaterial. Prog. Polym. Sci. 2007, 32, 991–1007. [Google Scholar] [CrossRef] [Scilit] [PubMed]
- Zhou, C.-Z.; Confalonieri, F.; Jacquet, M.; Perasso, R.; Li, Z.-G.; Janin, J. Silk fibroin: Structural implications of a remarkable amino acid sequence. Proteins 2001, 44, 119–122. [Google Scholar] [CrossRef] [Scilit] [PubMed]
- Nawrocki, J. The silanol group and its role in liquid chromatography. J. Chromatogr. A 1997, 779, 29–71. [Google Scholar] [CrossRef] [Scilit]
- Maleki, H.; Huesing, N. Silica-silk fibroin hybrid (bio)aerogels: Two-step versus one-step hybridization. J. Sol-Gel Sci. Technol. 2021, 98, 430–438. [Google Scholar] [CrossRef] [Scilit] [PubMed]
- Rockwood, D.N.; Preda, R.C.; Yücel, T.; Wang, X.; Lovett, M.L.; Kaplan, D.L. Materials fabrication from Bombyx mori silk fibroin. Nat. Protoc. 2011, 6, 1612–1631. [Google Scholar] [CrossRef] [Scilit] [PubMed]
- Kabulov, B.D.; Grabovskaya, T.A.; Zalyalieva, S.V. Microspherical silica gel for high-performance liquid chromatography. Russ. J. Phys. Chem. 1993, 67, 2070–2072. [Google Scholar]
- Ettre, L.S. Nomenclature for chromatography (IUPAC Recommendations 1993). Pure Appl. Chem. 1993, 65, 819–872. [Google Scholar] [CrossRef] [Scilit]
- Hu, X.; Kaplan, D.; Cebe, P. Determining beta-sheet crystallinity in fibrous proteins by thermal analysis and infrared spectroscopy. Macromolecules 2006, 39, 6161–6170. [Google Scholar] [CrossRef] [Scilit]
- Eliaz, D.; Kellersztein, I.; Miali, M.E.; Benyamin, D.; Brookstein, O.; Daraio, C.; Wagner, H.D.; Raviv, U.; Shimanovich, U. Fine structural analysis of degummed fibroin fibers reveals its superior mechanical capabilities. ChemSusChem 2025, 18, e202401148. [Google Scholar] [CrossRef] [Scilit] [PubMed]
- AlGharram, M.; AlZoubi, T.; Makhadmeh, G.N.; El Moll, H. Core diffraction signatures as a reproducible XRD method for structural identification and microstructural assessment of body-centered cubic α-Fe. Physchem 2026, 6, 48. [Google Scholar] [CrossRef] [Scilit]
- Barth, H.G. Chromatography fundamentals, Part VI: The Gaussian distribution and moment analysis. LCGC N. Am. 2019, 37, 269–273. [Google Scholar] [CrossRef] [Scilit]
- Tudge, A.P. Studies in chromatographic transport: I. A simplified theory. Can. J. Phys. 1961, 39, 1600–1610. [Google Scholar] [CrossRef] [Scilit]
- Abraham, M.H.; Amin, M.; Zissimos, A.M. The lipophilicity of Sudan I and its tautomeric forms. Phys. Chem. Chem. Phys. 2002, 4, 5748–5752. [Google Scholar] [CrossRef] [Scilit]
- National Center for Biotechnology Information. PubChem Compound Summary for CID 13297, 1-(Phenylazo)-2-naphthol (Sudan I). Available online: https://pubchem.ncbi.nlm.nih.gov/compound/13297 (accessed on 25 October 2026).
- National Center for Biotechnology Information. PubChem Compound Summary for CID 62330, Sudan IV. Available online: https://pubchem.ncbi.nlm.nih.gov/compound/62330 (accessed on 25 October 2026).
- Gilbert, G.A. The combination of fibrous proteins with acids. II. The adsorption of dye anions. Proc. R. Soc. A 1944, 183, 167–181. [Google Scholar] [CrossRef] [Scilit]
- Ferrero, F.; Periolatto, M. Dyes adsorption on functionalized fibrous materials. Chem. Eng. Trans. 2011, 25, 1037–1042. [Google Scholar] [CrossRef] [Scilit]
- Xuan, J.; Zhang, C.; Huang, J.; Wei, D. A novel method of exploring the interaction mechanism between small molecule Sudan I and antibody binding (TECH1P.871). J. Immunol. 2014, 192, 69.39. [Google Scholar] [CrossRef] [Scilit]
- Korshin, G.V.; Kumke, M.U.; Li, C.-W.; Frimmel, F.H. Influence of Chlorination on Chromophores and Fluorophores in Humic Substances. Environ. Sci. Technol. 1999, 33, 1207–1212. [Google Scholar] [CrossRef] [Scilit]
- Lohr, J.E.; Kortüm, G. The effect of solvent, concentration and temperature on the spectra of a highly polar merocyanine. Ber. Bunsenges. Phys. Chem. 1966, 70, 817–823. [Google Scholar] [CrossRef] [Scilit]
- Dehn, W.M.; McBride, L. Studies of the chromoisomerism of methyl orange. J. Am. Chem. Soc. 1917, 39, 1348–1377. [Google Scholar] [CrossRef] [Scilit]
- Ortega, E. The Characterization of Xanthene Dyes on a Glass Substrate from Different Coating Techniques. Doctoral Dissertation, University of Rhode Island, Kingston, RI, USA, 2019. [Google Scholar] [CrossRef] [Scilit]
- Cegarra, J. Determination of the migratory properties of direct dyes. J. Soc. Dye. Colour. 1957, 73, 375–381. [Google Scholar] [CrossRef] [Scilit]
- Kusunoki, T. Further studies on the binding of dyes by proteins. J. Biochem. 1953, 40, 277–286. [Google Scholar] [CrossRef] [Scilit]
- Huggins, M.L. The structure of fibrous proteins. Chem. Rev. 1943, 32, 195–218. [Google Scholar] [CrossRef] [Scilit]
- Das, D.K.; Mondal, T.; Mandal, A.K.; Bhattacharyya, K. Binding of organic dyes with human serum albumin: A single-molecule study. Chem. Asian J. 2011, 6, 3097–3103. [Google Scholar] [CrossRef] [Scilit] [PubMed]

Disclaimer/Publisher’s Note: The statements, opinions and data contained in all publications are solely those of the individual author(s) and contributor(s) and not of MDPI and/or the editor(s). MDPI and/or the editor(s) disclaim responsibility for any injury to people or property resulting from any ideas, methods, instructions or products referred to in the content. |
© 2026 by the authors. Licensee MDPI, Basel, Switzerland. This article is an open access article distributed under the terms and conditions of the Creative Commons Attribution (CC BY) license.