


Abstract
Hedysari Radix, a valuable traditional Chinese medicinal herb, is rich in flavonoid constituents with considerable potential for the development of anticancer and immunomodulatory therapeutic agents. In this work, an integrated high-efficiency technical workflow was constructed for the extraction and purification of total flavonoids from H. Radix. A fully validated HPLC quantitative assay was adopted for component quantification, and spectroscopic analyses were performed to characterize the structural profiles of purified flavonoid fractions. Single-factor experiments coupled with response-surface methodology were implemented to optimize ethanolic extraction parameters, while tandem purification utilizing HPD722 macroporous resin and polyamide resin was carried out for crude sample refinement. The HPLC method was comprehensively validated in terms of system suitability, precision and solution stability. FT-IR and NMR spectroscopic measurements were further applied to identify the chemical structures of purified flavonoid components. The validated HPLC assay exhibited favorable precision, repeatability, and 24 h solution stability. Optimized extraction conditions were determined as 75% ethanol, solid–liquid ratio of 1:16, and extraction duration of 90 min, affording a total flavonoid yield of 6.17 mg·g−1, with calycosin and formononetin contents of 90.4 μg·g−1 and 212.9 μg·g−1, respectively. After sequential purification by macroporous resin followed by polyamide resin, the purity of total flavonoids reached 47.54%, corresponding to a 77-fold enhancement relative to the crude extract. Structural characterization confirmed that the purified compounds belonged to isoflavonoid glycosides. Collectively, these findings demonstrate that the established protocol enables stable and efficient extraction and purification of flavonoids from H. Radix, and provides theoretical basis and technical reference for developing anticancer and immunomodulatory therapeutics derived from this medicinal herb.
1. Introduction
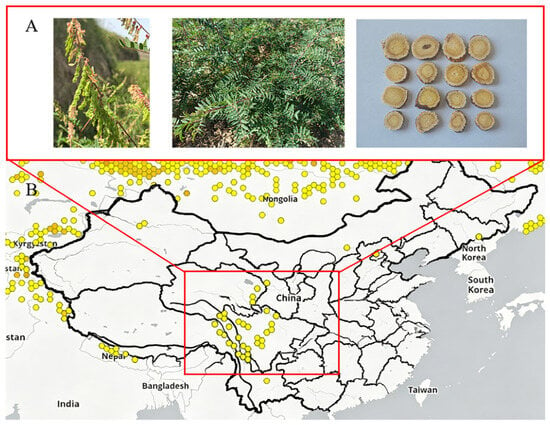
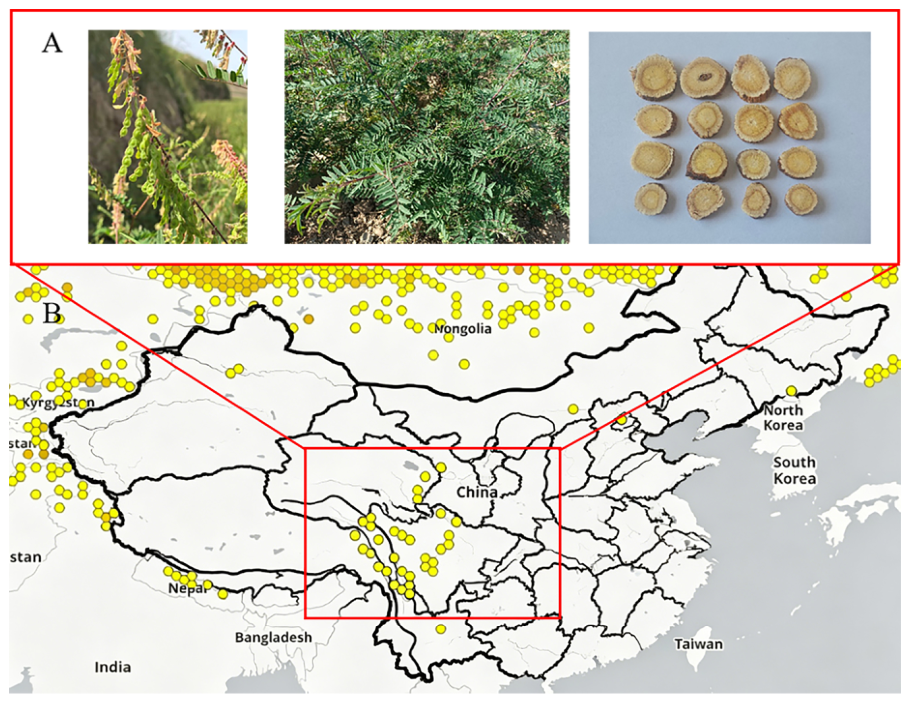
Hedysari Radix, a traditional Chinese herbal medicine, is derived from the dried root of Hedysarum polybotrys Hand.-Mazz. and is mainly cultivated in Gansu, China [1] (Figure 1). As a medicinal herb, H. Radix is well-known for its anti-inflammatory, antitumor, antioxidant, and immunomodulatory properties [2,3,4,5,6].
Figure 1.
Morphology (A) and global distribution (B) of H. Radix https://www.gbif.org/species/2960767 (accessed on 30 April 2026).
Flavonoids are the key bioactive constituents of H. Radix [7] and are primarily classified into seven subclasses: flavones, isoflavones, pterocarpans, coumestans, dihydroflavonols, chalcones, and flavonols [8], with isoflavones being the most abundant [9]. Consequently, four characteristic isoflavones—formononetin, ononin, calycosin, and calycosin-7-O-β-D-glucoside—are routinely employed as reference markers for quantitative analysis and quality control [10]. In this study, calycosin and formononetin were selected as target analytes. These two isoflavones are the dominant bioactive components in our H. Radix extracts and closely associated with the research objective of extraction process optimization.
The response surface method (RSM), originally proposed by Box and Wilson [11], is an optimization approach that integrates experimental design with mathematical modeling. By fitting a functional relationship between factors and responses through strategically selected experimental points [12], RSM enables the identification of optimal factor levels. Initially developed for physical experiments, RSM has evolved into a widely adopted theoretical optimization tool in recent years [13]. Compared with orthogonal designs, RSM determines optimal combinations across multiple factors and levels with minimal experimental runs, provides explicit regression equations, and effectively captures factor interactions [14]. Currently, RSM has become a mainstream methodology in natural product separation and purification research [15].
The main purification methods of total flavonoids include the macroporous adsorption resin method, silica gel column chromatography, polyamide column chromatography and glucan gel column chromatography, etc. [16]. Among them, the macroporous adsorption resin method has become one of the effective methods for extracting flavonoids, alkaloids and other active ingredients due to its advantages of large adsorption capacity, high resolution, strong selectivity and low cost [17]. However, it is also difficult to enrich and purify some flavonoids because they are insoluble in water [18]. Polyamide is a kind of polymer polymerized by an amide bond. It is mainly adsorbed by forming a hydrogen bond between a large number of amide groups and phenolic hydroxyl groups of flavonoids, which can remove pigment and some fat-soluble compounds and effectively make up for the partial deficiency of macroporous adsorption resin [19].
In this study, the effects of ethanol volume fraction, solid–liquid ratio and extraction time on the extraction of total flavonoids from H. Radix were studied through a single-factor experiment [20]. On this basis, the Box–Behnken method was used to optimize the optimal extraction process of total flavonoids from H. Radix, and HPD722 and polyamide macroporous adsorption resin were further used for enrichment and purification [21]. It provides a theoretical basis for the establishment of extraction and purification technology and industrial production of total flavonoids of H. Radix [22].
2. Materials and Methods
2.1. Materials
H. Radix was purchased from Hadapu Medicinal Material Market, Dangchang County, Longnan City, Gansu Province, China. Rutin reference standard (Batch No. 100080-200707, purity ≥ 91.7%) was purchased from the National Institutes for Food and Drug Control (NIFDC), (Beijing, China). Calycosin (Batch No. MUST-16031005, purity ≥ 99.08%) and formononetin reference standard (Batch No. MUST-16031110, purity ≥ 99.03%) was purchased from Chengdu Must Bio-Technology Co., Ltd. (Chengdu, China). Polyamide (sieved through a 450 μm mesh sieve) and HPD722 macroporous adsorbent resin were purchased from Cangzhou Baoen Adsorption Material Technology Co., Ltd. (Cangzhou Baoen, China). Ethanol, chloroform, n-butanol, hydrogen peroxide (H2O2), phenol, concentrated sulfuric acid and other reagents were of analytical grade. Deionized water was used for sample extraction and reagent preparation. Ultrapure water generated by the AFX2-0501-P ultrapure water system (Yiyang Enterprise Development Co., Ltd., (Hunan, China) was applied for HPLC analysis and mobile-phase preparation.
The Agilent 1100 high-performance liquid chromatograph coupled to a variable-wavelength ultraviolet (VWD) detector was manufactured by Agilent Technologies (Santa Clara, CA, USA). The UV-1800 ultraviolet spectrophotometer was manufactured by Shimadzu Corporation (Kyoto, Japan). The AE260 analytical balance was manufactured by Mettler Toledo (Greifensee, Switzerland). The Bruker Avance III 400 MHz nuclear magnetic resonance spectrometer and Bruker ALPHA II Fourier-transform infrared spectrometer were manufactured by Bruker (Ettlingen, Germany). The CXP-100 high-speed multi-functional grinder was manufactured by Shanghai Shengxi Pharmaceutical Machinery Co., Ltd. (Shanghai, China). The SK3310LHC ultrasonic cleaner was manufactured by Shanghai Kedao Ultrasonic Instrument Co., Ltd. (Shanghai, China). The 766-3 far-infrared fastdrying oven was manufactured by Nantong Jinyu Electrical Accessories Factory (Jiangsu, China). The RE-5299 rotary evaporator was manufactured by Gongyi Yuhua Instrument Co., Ltd. (Henan, China). The HH-4 thermostatic water bath was manufactured by Jingke Weiyongxing Instrument Co., Ltd. (Beijing, China).
2.2. Extraction and Content Determination of Total Flavonoids from H. Radix
Ethanolwater reflux extraction was adopted to extract total flavonoids from H. Radix. Briefly, the crude herb was ground and sieved through a 40-mesh screen [23]. Exactly 2.0 g of the powder was subjected to reflux extraction with aqueous ethanol in an 80 °C water bath, and the resulting mixture was filtered after extraction. The obtained filtrate was constant-volume fixed to 25 mL with the corresponding extraction solvent in a volumetric flask to obtain the crude total flavonoid extract of H. Radix [24].
Total flavonoid yield (mg·g−1, mass of total flavonoids per gram of raw herb) was taken as the evaluation index to optimize extraction parameters. Rutin was used as the reference standard for ultraviolet-spectrophotometric colorimetric quantification of plant total flavonoids. Total flavonoid content was determined via ultraviolet spectrophotometry [25]. Precisely 0.2 mL of the above crude flavonoid solution was used for colorimetric detection following the procedure reported by Yu and Liu [26], with distilled water as the blank control. The rutin standard curve was established according to the protocol described by Ren et al. [27].
2.3. Determination Method and Reliability Verification of Flavonoids in H. Radix
HPLC was adopted to quantify calycosin and formononetin in H. Radix. Reference standard solution preparation: accurately weighed 1.10 mg calycosin and 1.00 mg formononetin reference standards were separately dissolved and diluted to constant volume with HPLC-grade methanol, yielding individual stock solutions at concentrations of 0.22 mg·mL−1 and 0.20 mg·mL−1, respectively. Afterwards, 2.5 mL of each stock solution was combined and diluted with HPLC-grade methanol to afford a mixed standard solution containing 110 μg·mL−1 calycosin and 100 μg·mL−1 formononetin.
Test sample solution preparation: The crude extract obtained via ethanol–water reflux extraction was filtered through a 0.45 μm microporous membrane, and the filtrate was collected as the test sample solution of total flavonoids from H. Radix.
Chromatographic conditions: Chromatographic separation was carried out on an Agilent TC-C18 column (250 mm × 4.6 mm, 5 μm). The mobile phase consisted of acetonitrile (Phase A) and 0.1% aqueous phosphoric acid solution (Phase B) with a gradient elution program: 0–15 min, 30% A; 15–35 min, 35% A. The flow rate was set at 1.0 mL·min−1, detection wavelength at 254 nm, column temperature at 25 °C, and injection volume at 20 μL.
System suitability test: The diluted mixed standard solution (16.5 μg·mL−1 calycosin and 15.0 μg·mL−1 formononetin) was injected six consecutive times, and test sample solutions were injected at a volume of 20 μL under the above chromatographic conditions. Retention time, resolution and theoretical plate number of the chromatographic peaks corresponding to calycosin and formononetin were recorded.
Linearity investigation: Serial dilutions were prepared by precisely transferring 0.01, 0.05, 0.15, 0.25, 0.35, 0.45 and 0.55 mL of the mixed standard solution, followed by volume fixation with HPLC-grade methanol. Each diluted solution (20 μL) was injected into the HPLC system, and corresponding peak areas were recorded. Calibration curves were constructed by plotting peak area (Y) against analyte concentration (X, μg·mL−1). The mixed-standard working solution contained 110 μg·mL−1 calycosin and 100 μg·mL−1 formononetin. The concentrations of calycosin and formononetin in practical test sample solutions ranged from 8.35 to 8.77 μg·mL−1 and 26.10 to 27.98 μg·mL−1, respectively, which were within the linear ranges of the calibration curves.
Precision test: Six consecutive injections of 20 μL mixed standard solution were performed under the aforementioned chromatographic conditions. Peak areas of calycosin and formononetin were recorded to calculate the relative standard deviation (RSD) of replicate injections.
Repeatability test: Six 2.0 g aliquots of pulverized H. Radix powder (sieved through a 40-mesh screen) from the same batch were processed in parallel following the above sample-preparation procedure. All solutions were analyzed under the specified chromatographic conditions, and the contents of calycosin and formononetin were determined to calculate RSD values.
Stability test: Test sample solution was prepared using the identical repeatability protocol. Aliquots of the solution were analyzed at 0, 2, 4, 6, 8, 12 and 24 h post-preparation with six parallel replicates at each time point. The contents of two target compounds were quantified, and corresponding RSD values were computed.
Spiked recovery test: Nine 0.5 g portions of homogenized 40-mesh H. Radix powder with known endogenous flavonoid contents were weighed accurately. Low, medium and high levels of mixed standard solution (equivalent to 80%, 100% and 120% of the native compound content) were separately spiked into the nine samples. All spiked samples were treated and analyzed under the established chromatographic conditions, and the measured amounts of calycosin and formononetin were used to calculate recovery rates and their corresponding RSD values.
2.4. Optimization of Extraction Conditions of Total Flavonoids from H. Radix by Single-Factor Experiment
The content of total flavonoids of H. Radix was determined according to the combination of extraction conditions (Table 1), and the optimal extraction response surface analysis conditions were selected.
Table 1.
Effects of single-factor on the experimental conditions to extract flavonoids from H. Radix.
2.5. Optimal Analysis of Total Flavonoids Extraction by Response Surface Method
The optimization analysis data for the extraction of total flavonoids from H. Radix using response surface methodology employed the Hassan method [28]. The contents of total flavonoids, along with the flavonoid compounds calycosin and formononetin, were converted into normalized values (di) using the formula: di = (ymax − yi)/(ymax − ymin). The converted values of total flavonoids, calycosin, and formononetin were collectively assigned a total of 100 points. A comprehensive scoring formula from multi-index experiments was then applied to evaluate the response surface results of the total flavonoid extraction process [29].
Overall score (%) = d1 × 50% + d2 × 25% + d3 × 25%
Among them, d1 is the normalized value of total flavonoid content; d2 is the normalized value of calycosin content, and d3 is the normalized value of formononetin content.
The total flavonoids content of H. Radix and the comprehensive scores of calycosin and formononetin were used as response values for experimental design (Table 2).
Table 2.
Factors and levels of Box–Behnken design for total flavonoid extraction from H. Radix.
2.6. Enrichment and Purification of Total Flavonoids from H. Radix
Weigh an appropriate amount of resin, soak it in 95% ethanol overnight, remove the debris and debris in the resin, wet load the column with ethanol, continue to flush the column with ethanol, check the effluent at any time, and wash the ethanol in the chromatographic column with a large amount of distilled water until it is not white and cloudy when mixed with water, and then wash off the ethanol in the chromatographic column for use [30]. HPD722 macroporous resin was used, the concentration of total flavonoids in the sample solution was 0.71 mg·mL−1, and the pH value was 3.0. According to the pre-experiment, bed volume (BV) of 2 mL·min−1 was used to remove impurities, 4 BV distilled water was used to remove impurities, and 6 BV 70% ethanol was used for analysis. The analytical solution was collected and then rotary evaporation was used to obtain total flavonoids of H. Radix [31].
After 30 g of pretreated polyamide was added to 30–60 mg, the total flavone aqueous solution of H. Radix was obtained, and the sample was taken with 1 mL·min−1 1 BV, 3 BV 30% ethanol for impurity removal, 3 BV 90% ethanol for desorption, and the analytical solution was collected. Ethanol was recovered from the analytical solution, and the water was drained under vacuum pressure at 60 °C on the rotary evaporator to obtain yellow powder, which was the total flavonoids of H. Radix.
2.7. FTIR and NMR Analysis
A total of 5.5 mg of H. Radix flavonoid sample was weighed and dissolved in 500 μL of deuterated dimethyl sulfoxide (DMSO-d6), then transferred into an NMR tube. The 1H NMR spectrum was acquired at room temperature. For FTIR analysis, the KBr pellet method was adopted [32,33]. Briefly, 10 mg of sample was accurately weighed and fully ground and blended with 200 mg of dry potassium bromide (KBr) powder in an agate mortar to form a homogeneous mixture, which was subsequently pressed into a transparent pellet. The pellet was placed in the optical path of a BRUKER ALPHA II Fourier-transform infrared spectrometer (Bruker, Karlsruhe, Germany). Scanning was performed over the wavenumber range of 4000–500 cm−1, and the infrared absorption spectrum was recorded.
2.8. Data-Processing Method
SPSS16.0 statistical software was used for one-way ANOVA and correlation analysis; Design-Expert 10 software was used for response surface analysis and response surface mapping; Origin7.5 software was used for mapping.
3. Results
3.1. Reliability Analysis of HPLC Method for Determination of Flavonoids in H. Radix
Rutin was used as the reference substance for the ultraviolet-spectrophotometric colorimetric assay of total flavonoids. The linear calibration curve of rutin for total flavonoid quantification was fitted as yabsorbance = 0.0121xrutin concentration − 0.0065 (R2 = 0.9999). Rutin exhibited favorable linearity within the concentration range of 5.1–61.2 μg·mL−1. Residual analysis was performed for each calibration standard point. The residuals were randomly distributed around zero, confirming that ordinary least-squares (OLS) regression was suitable for this calibration dataset.
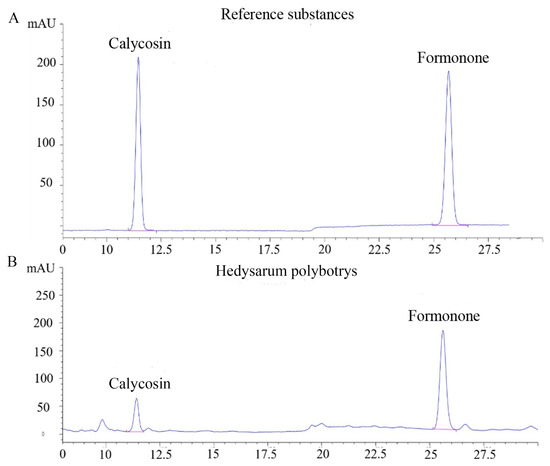
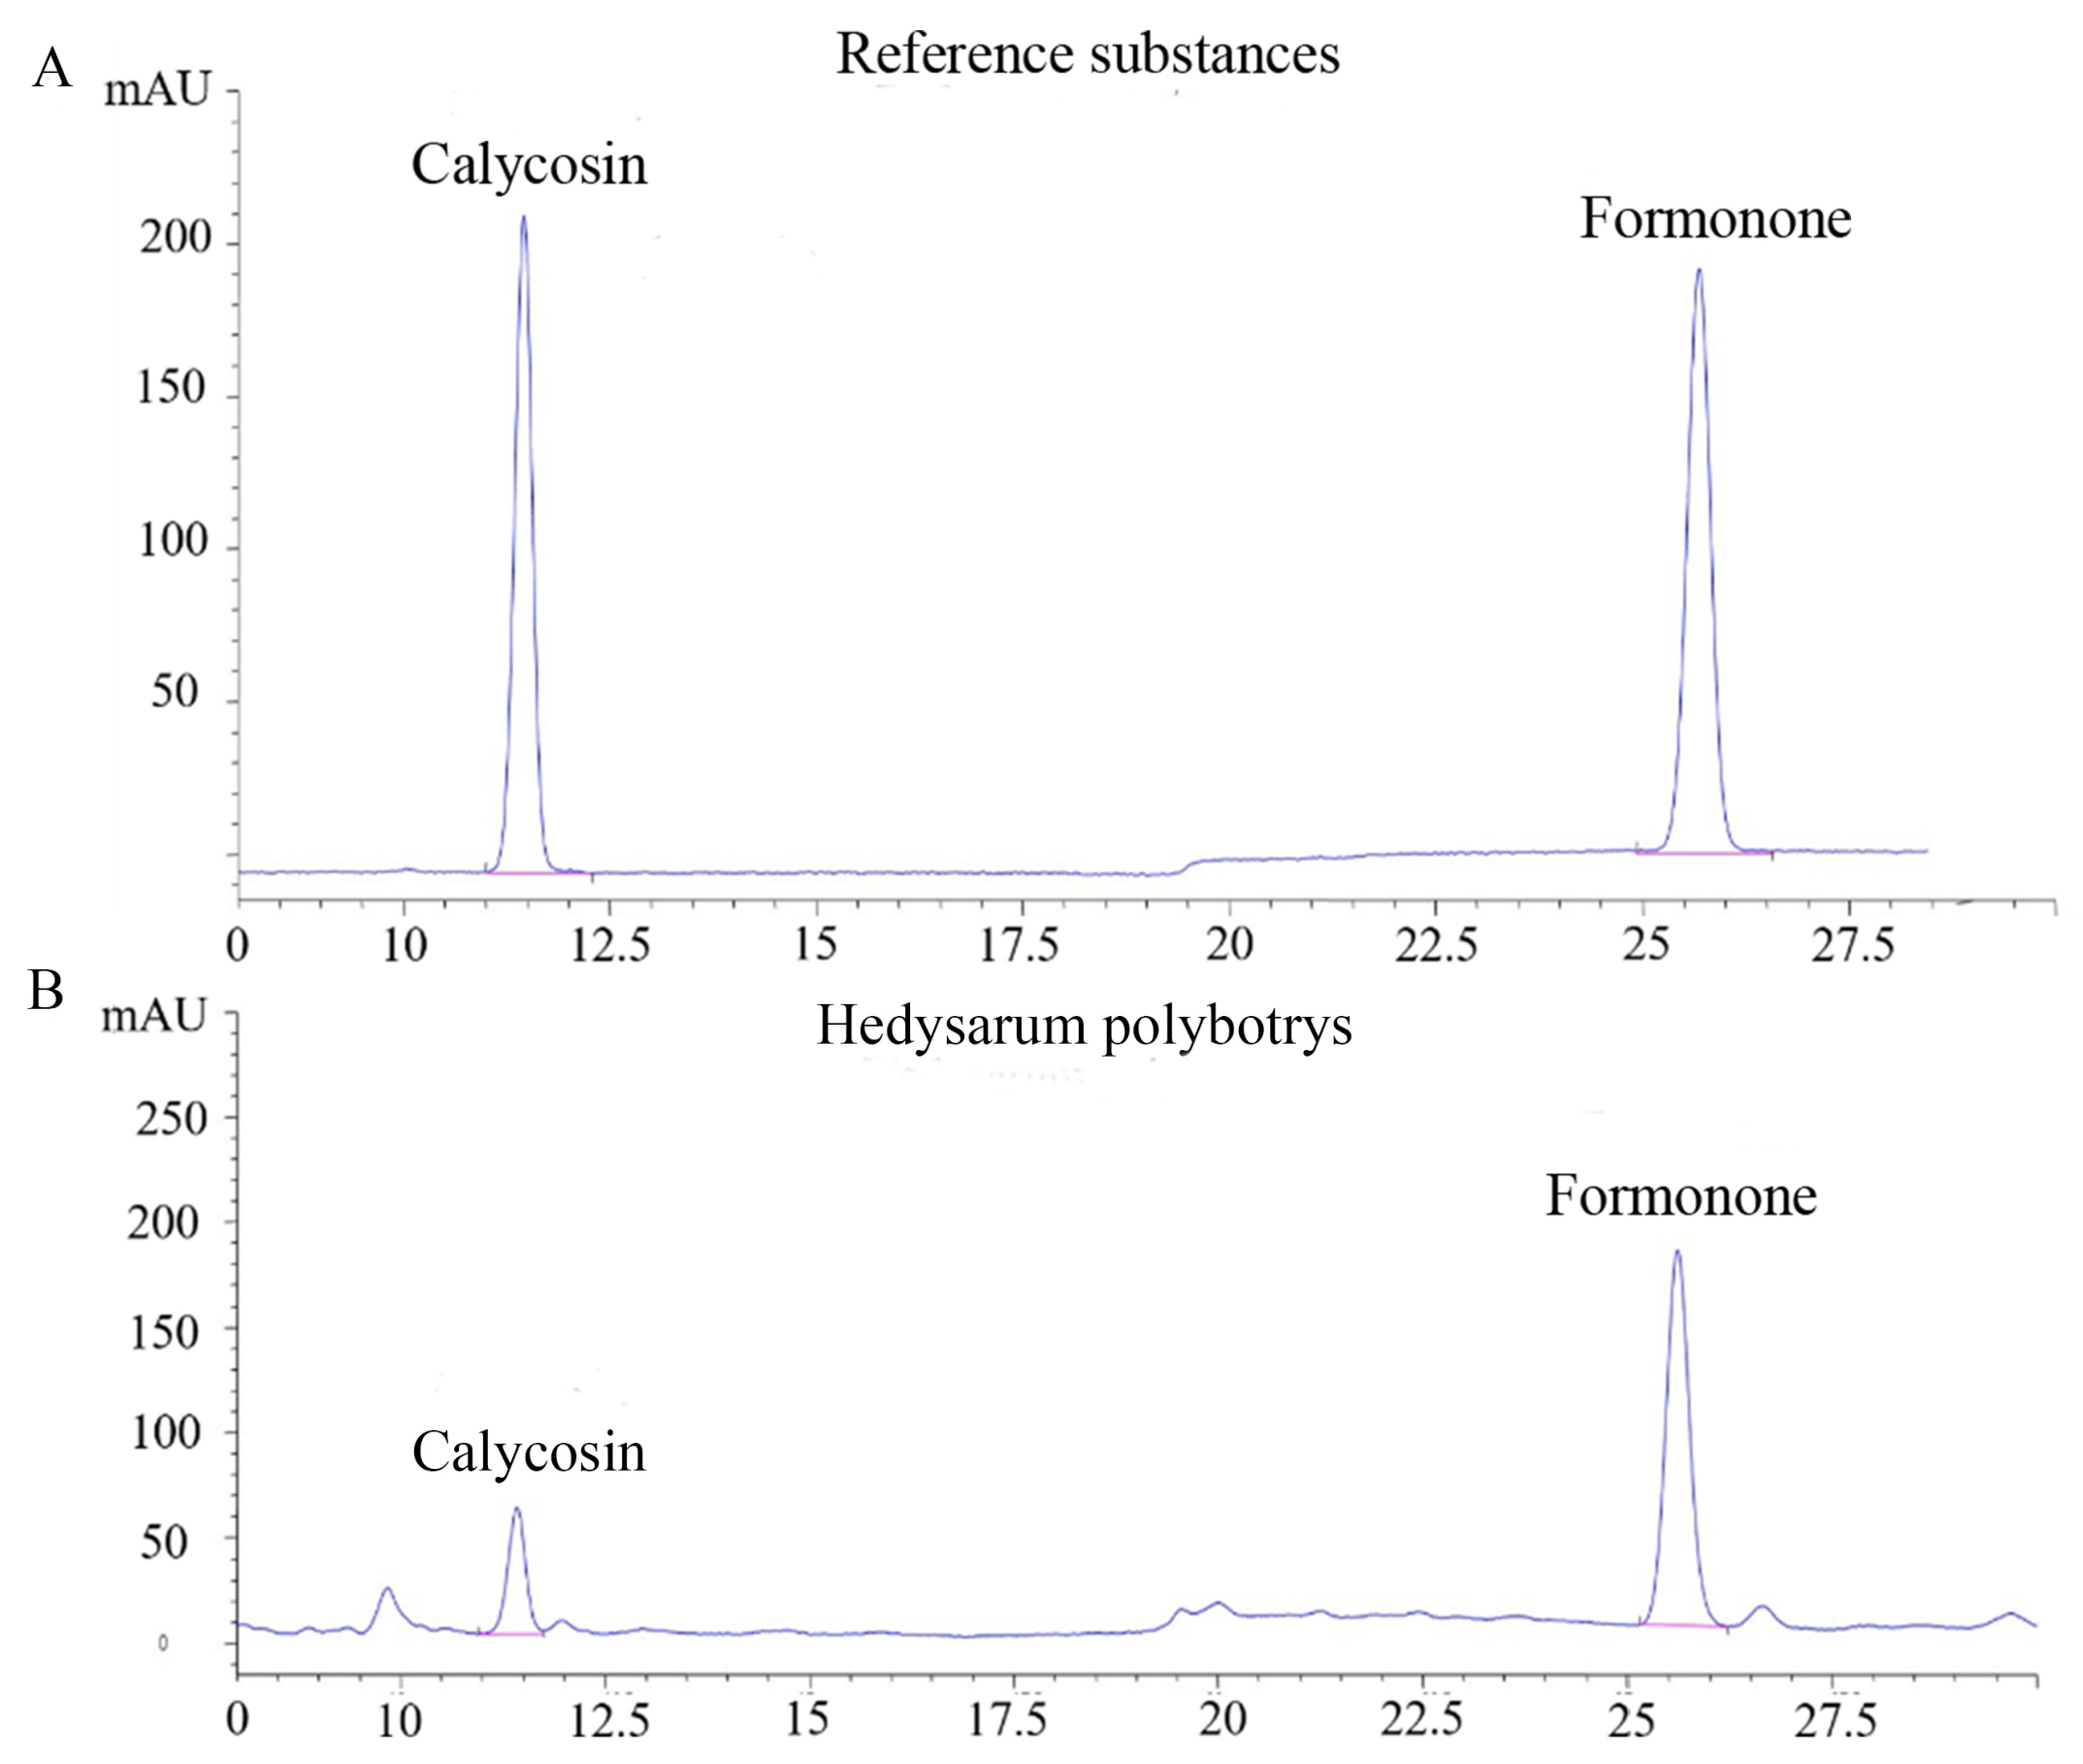
System suitability tests showed that the mixed reference–standard solution was injected six consecutive times (n = 6). The mean retention times of calycosin and formononetin were 11.252 min and 25.263 min (Figure 2), with RSD values of 0.25% and 0.20%, respectively. Their mean peak areas were 3334.22 and 3919.58, with corresponding RSD values of 1.30% and 1.49%. The resolution between target peaks and adjacent peaks was greater than 1.5, and the theoretical-plate number calculated based on formononetin exceeded 5000, indicating satisfactory system-suitability performance.
Figure 2.
The HPLC chromatograms of H. Radix. (A) Reference substances; (B) H. Radix sample; 1-calycosin; 2-formononetin. The short red bar under each peak denotes the integration boundary, indicating the start and end retention time for peak area calculation.
Calibration equations of calycosin and formononetin were obtained by ordinary least-squares (OLS) regression: ycalycosin = 103.017x − 31.406 (r2 = 0.9997) and yformononetin = 132.664x − 27.143 (r2 = 0.9997), both presenting excellent fitting degrees. Calycosin showed good linearity over 1.1–60.5 μg·mL−1, and formononetin had a linear range of 1.0–55.0 μg·mL−1 against corresponding peak areas.
The peak area RSD values of calycosin and formononetin were 1.30% and 1.49%, respectively. Repeatability tests gave average contents of 0.055 mg·g−1 for calycosin and 0.139 mg·g−1 for formononetin, with RSDs of 2.12% and 2.23%. For stability assessment, six replicate injections at different time points yielded RSDs of 2.38% (calycosin) and 1.35% (formononetin). The average recoveries of the two analytes were 102.4% and 96.8%, with corresponding RSDs of 2.35% and 2.30%. Collectively, these results demonstrated that the established HPLC method for flavonoids in H. Radix possessed reliable system suitability, precision, repeatability and 24 h solution stability, as well as acceptable recovery performance.
3.2. The Extraction Conditions of Total Flavonoids from H. Radix Were Optimized by Single-Factor Experiment
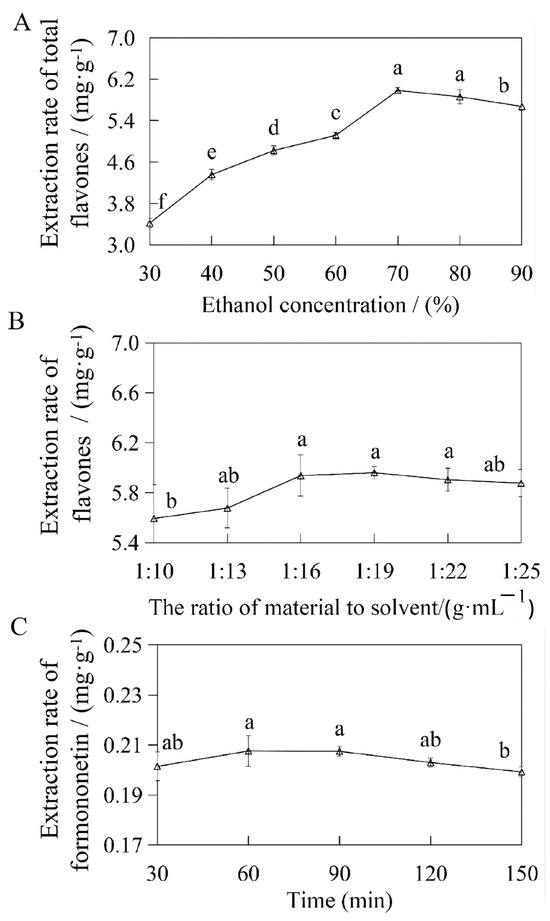
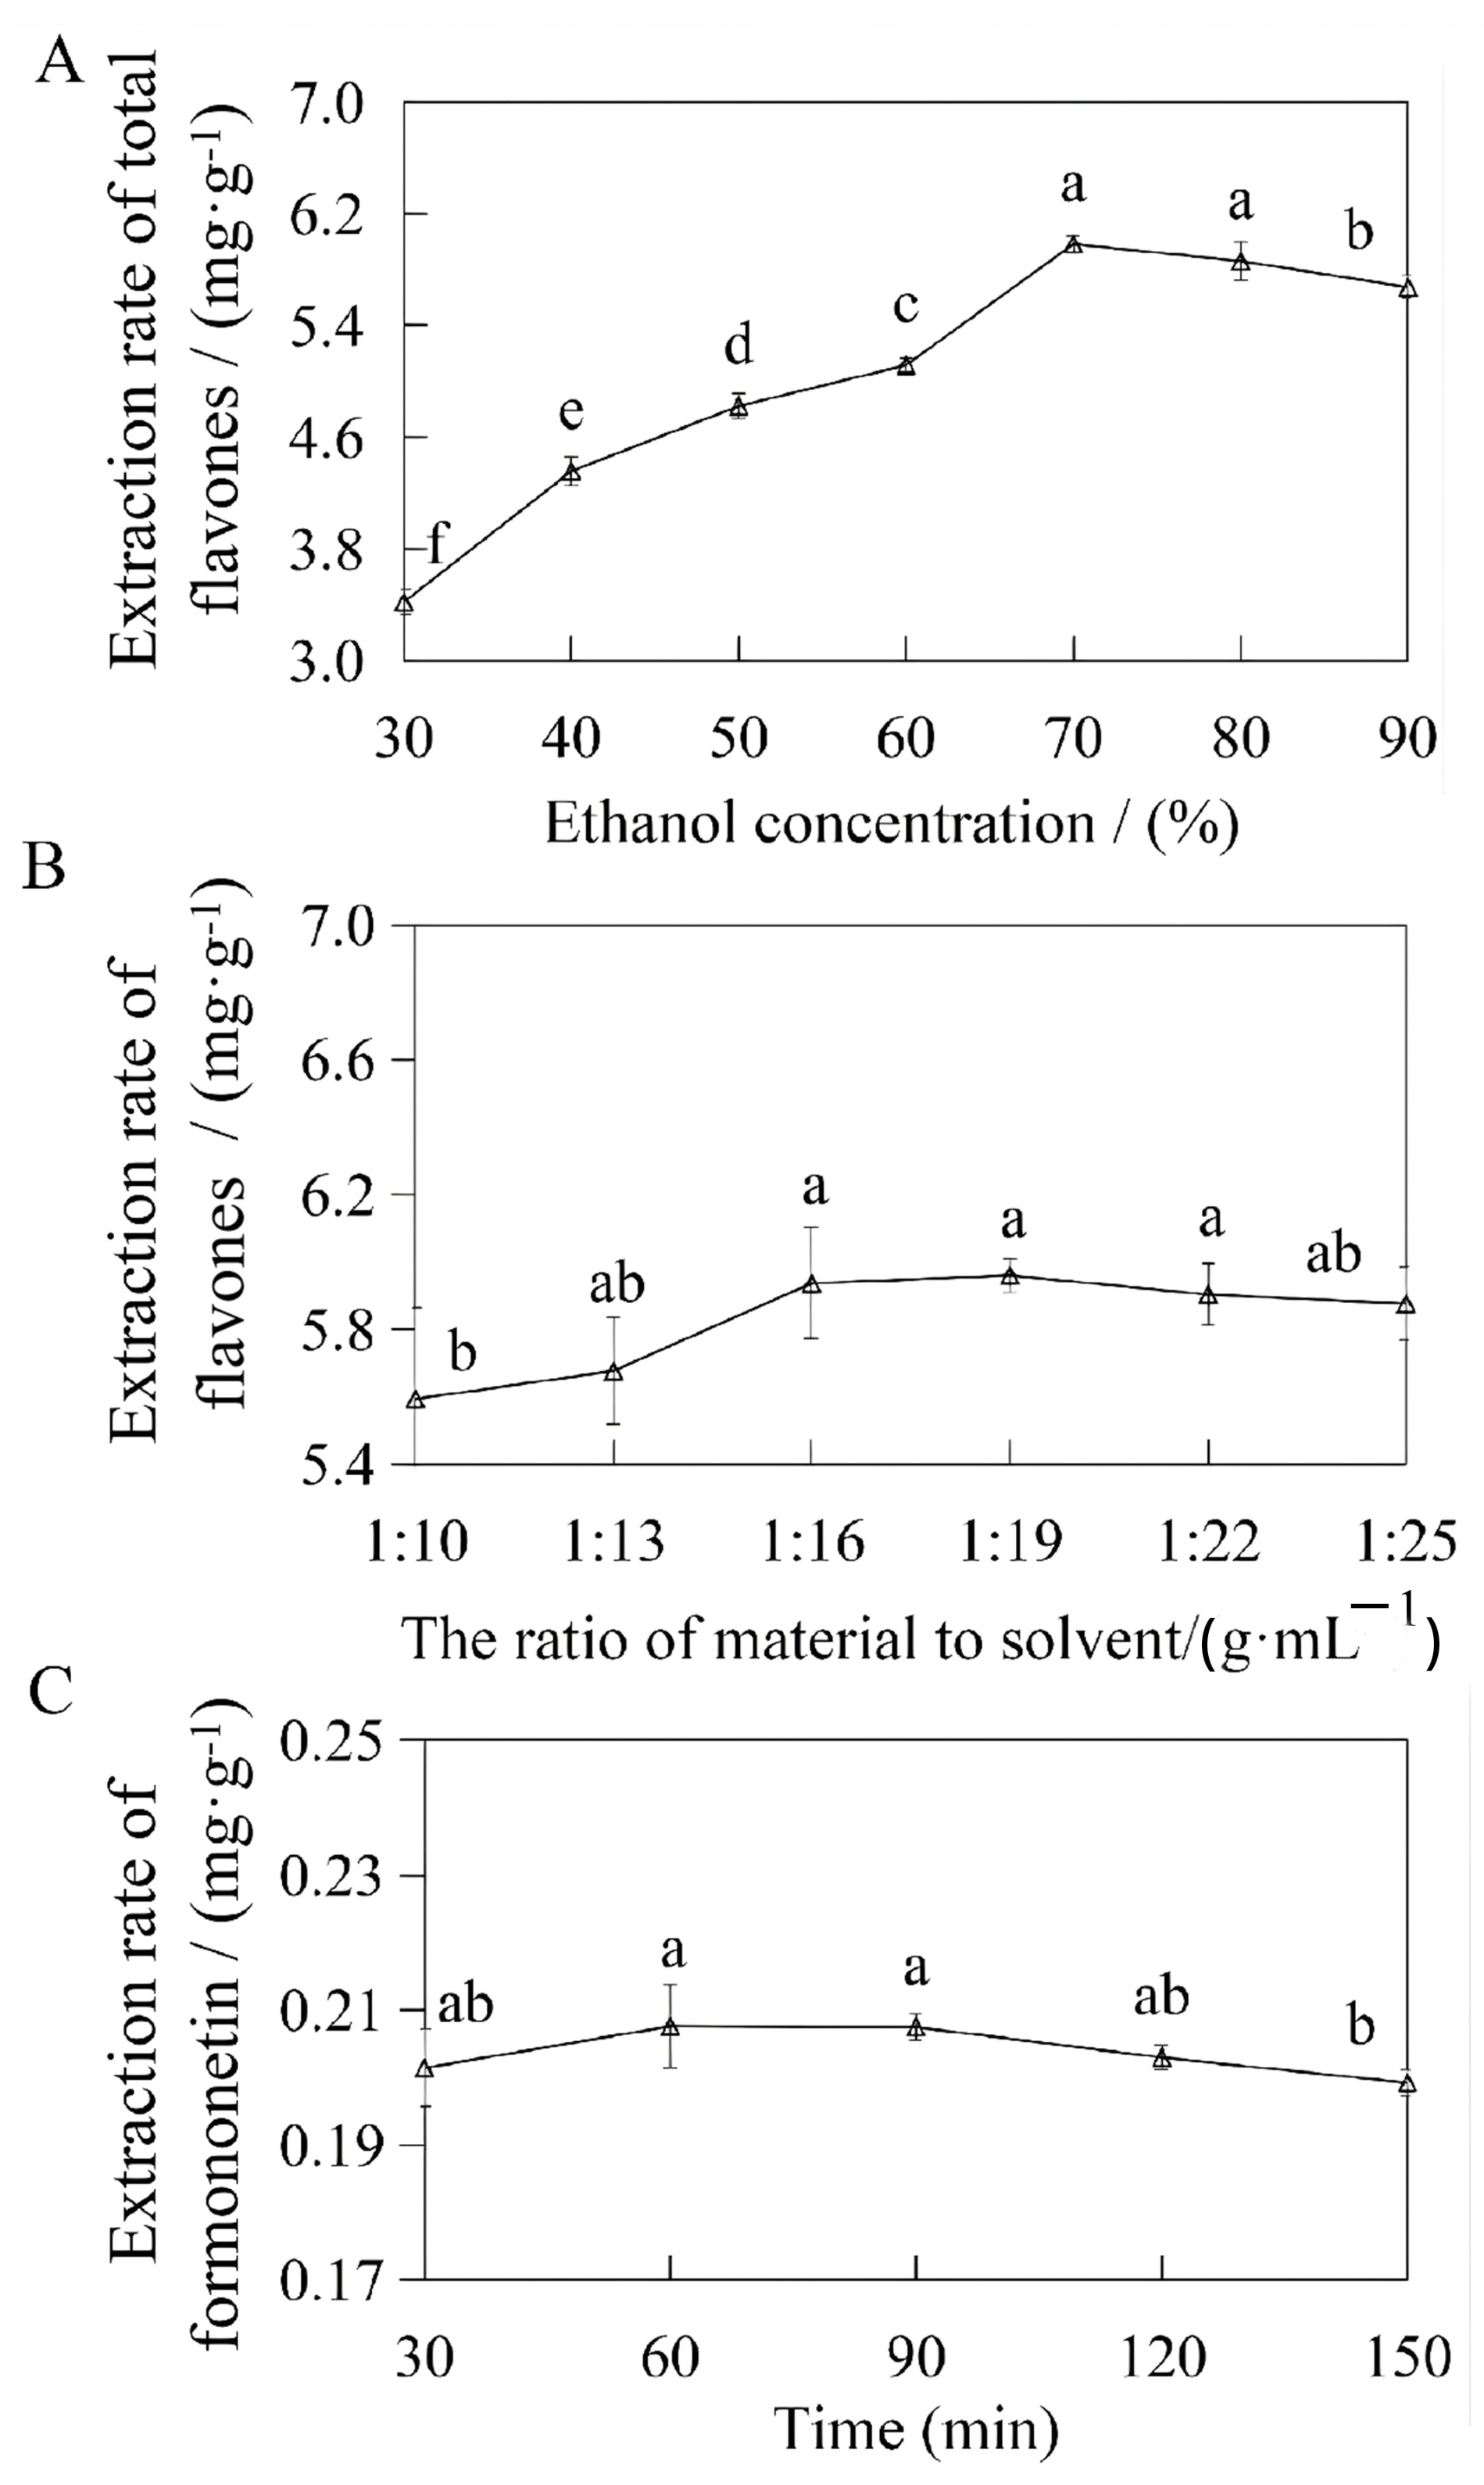
There existed a strong positive correlation between total flavonoid extraction yield of H. Radix and ethanol volume fraction (ηPearson = 0.914, p < 0.01). The yield markedly rose with increasing ethanol proportion, peaked at an ethanol volume fraction of 70–80%, and subsequently declined at higher ethanol concentrations (Figure 3A).
Figure 3.
Effect of single factor on total flavonoids contents from H. Radix. values with different letters are significantly different (p < 0.05). (A) Effect of ethanol concentration on the extraction rate of flavones. (B) Effect of solid-to-liquid ratio on the extraction yield of flavones. (C) Effect of extraction time on the extraction yield of formononetin.
No significant difference in total flavonoid yield was detected across solid–liquid ratios ranging from 1:13 to 1:25 (p > 0.05). Accordingly, 1:13 was selected as the optimal solid–liquid ratio (Figure 3B).
For extraction durations of 30–150 min, yields of total flavonoids and calycosin exhibited no statistical discrepancy (p > 0.05). By contrast, formononetin yield remained stable within 30–120 min (p > 0.05) yet dropped remarkably when extraction lasted over 120 min (Figure 3C), which could be attributed to oxidative degradation of formononetin under prolonged heating. Hence, the optimal extraction time was set at 30–120 min.
3.3. Response Surface Method Was Used to Optimize the Ethanol Reflux Extraction of Total Flavonoids from H. Radix
Response surface methodology (RSM) was carried out on experimental data (Table 3) via Design-Expert 10. A quadratic regression model was constructed, where the comprehensive score of total flavonoids, calycosin and formononetin in H. Radix served as the response value (Y), and ethanol concentration (A), solid–liquid ratio (B) and extraction time (C) were taken as independent variables.
YOverall score = 88.78 + 16.87A + 3.18B + 11.60C − 1.05AB − 9.71AC − 7.41BC − 16.24A2 − 19.20B2 − 25.22C2
Table 3.
Experimental design and results with Box–Behnken.
A larger F-value represents stronger influence of the corresponding factor on flavonoid extraction yield. Accordingly, the influencing intensity of the three parameters on total flavonoid extraction efficiency of H. Radix ranked in descending order: ethanol concentration > extraction time > solid–liquid ratio. The pairwise interaction terms (AB, AC, BC) exerted no significant effects on the yields of total flavonoids and the two target flavonoids (p > 0.05), revealing negligible interactions among variables (Table 4).
Table 4.
Analysis on variance of regression model for the extraction of the flavonoids from H. Radix.
The established quadratic regression model was highly significant (p < 0.01), while lack-of-fit was non-significant (p > 0.05), demonstrating that the model well fitted experimental data and irrelevant unknown factors barely interfered with detection results. The adjusted determination coefficient Radj2 = 0.9686 was close to the coefficient of determination R2 = 0.9425, which proved the model could accurately predict variations in the contents of total flavonoids and two monomer flavonoids under different extraction parameters (Table 4).
3.4. Effect Surface Optimization and Validation
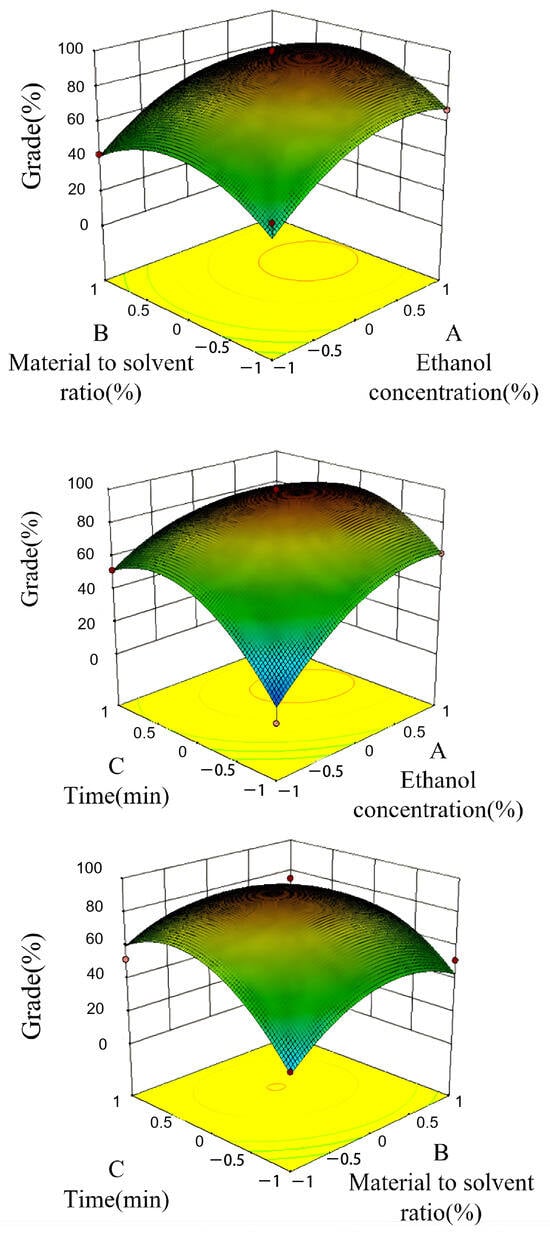
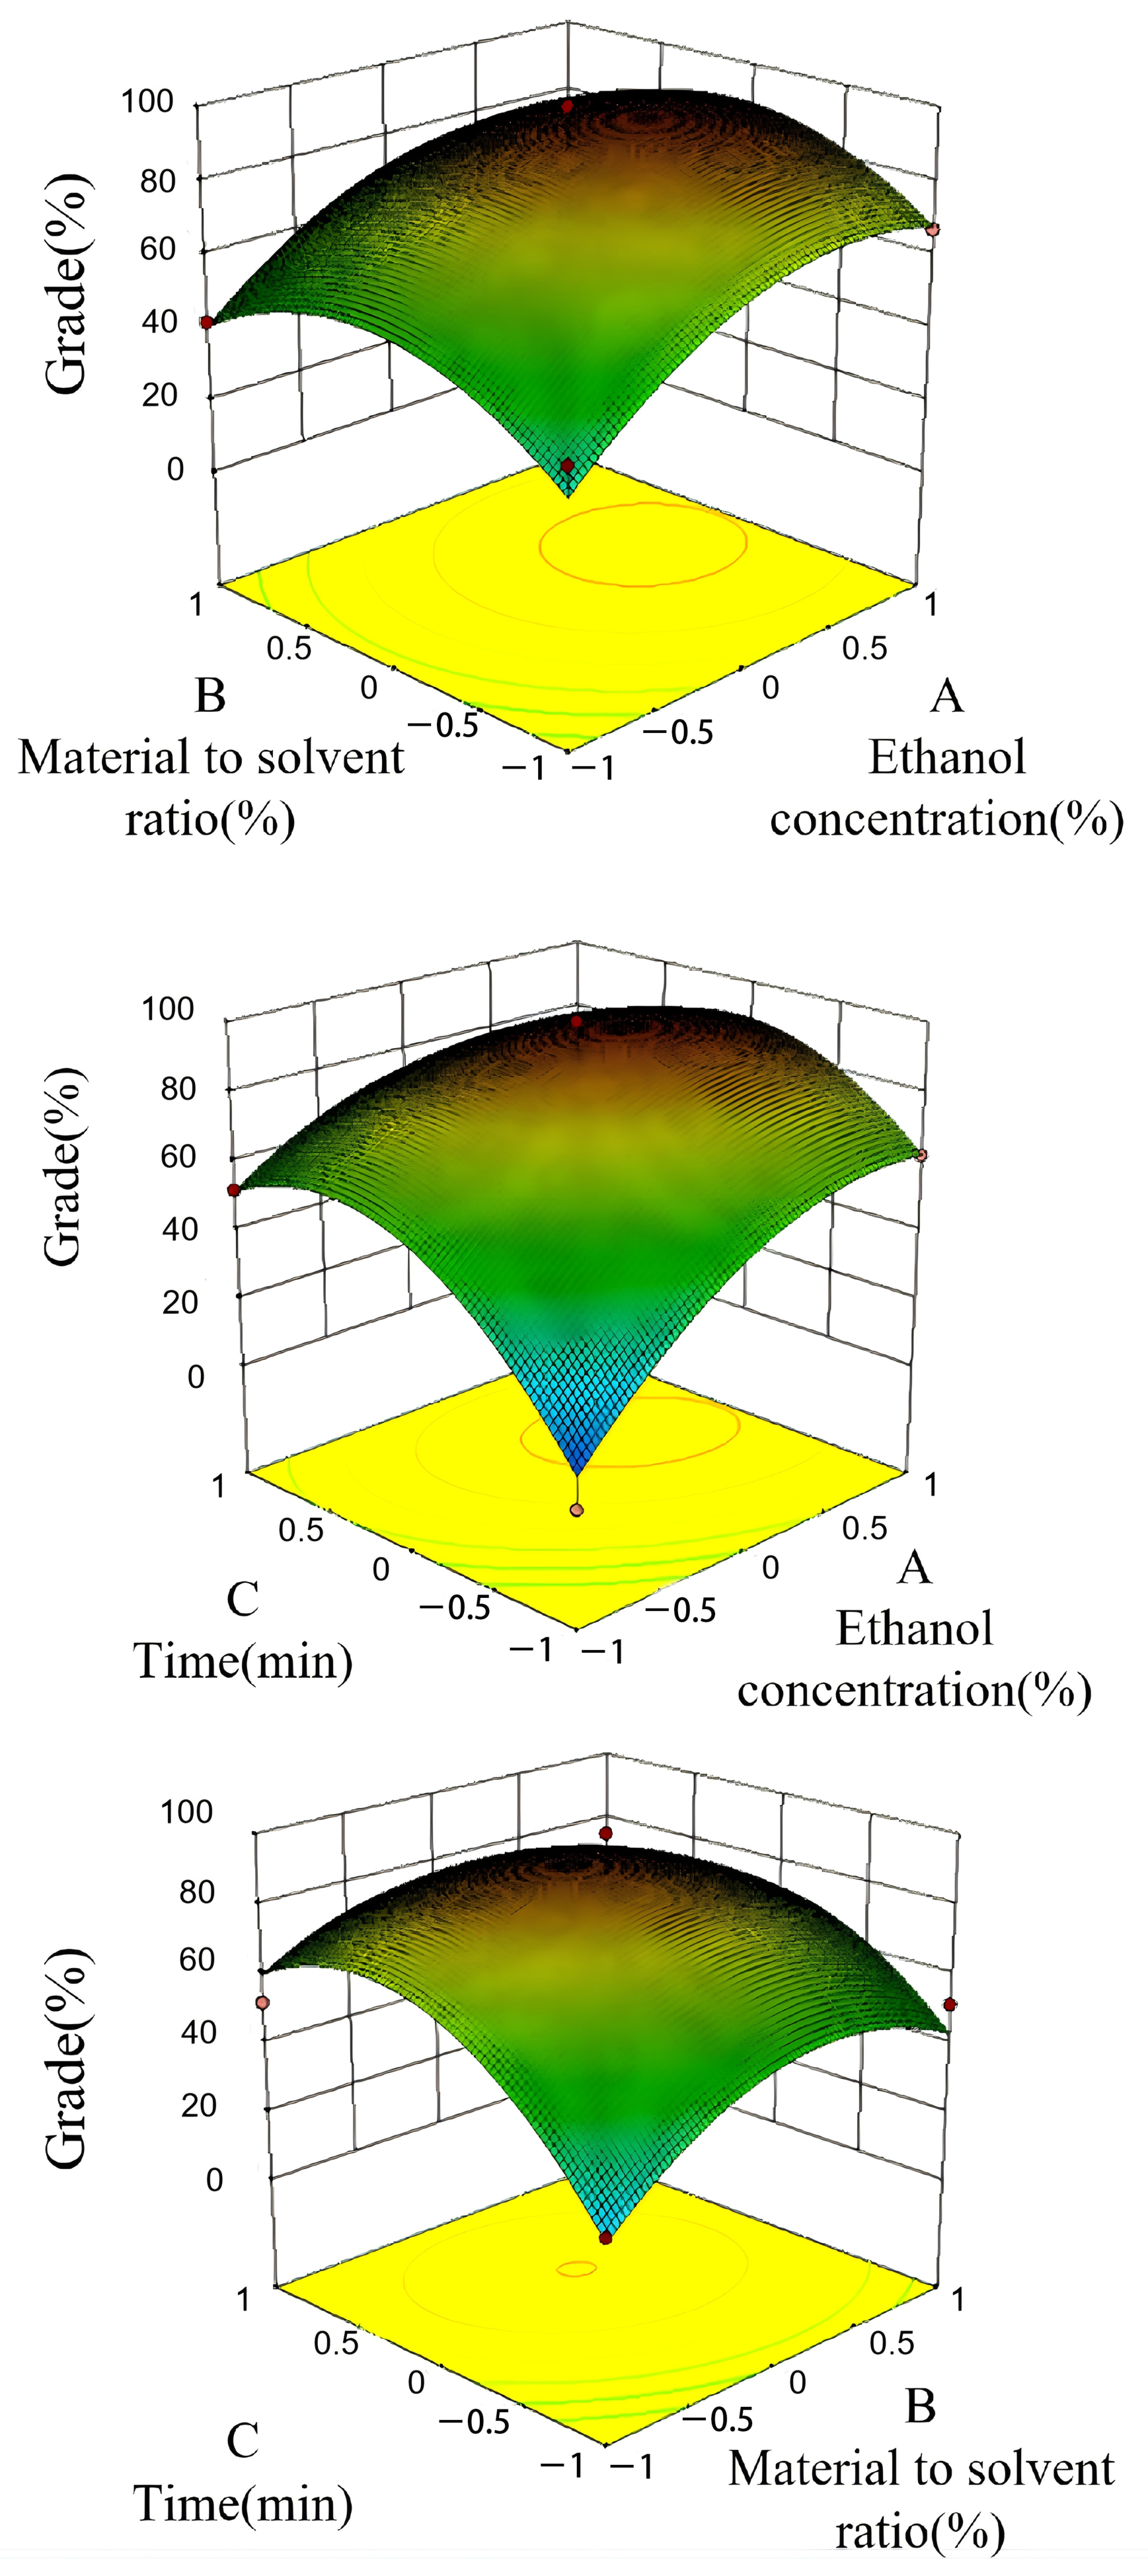
Design-Expert 10 was adopted to analyze factor interactions affecting the comprehensive score (integrating total flavonoid, calycosin and formononetin contents) during the extraction of total flavonoids from H. Radix. Response surface plots were drawn to intuitively reflect the parameter effects on the comprehensive score. The results revealed that ethanol concentration and extraction time exerted prominent effects on the score, corresponding to steep curved surfaces. By comparison, solid–liquid ratio produced trivial impacts with gentle flat curves, implying that slight changes in this parameter barely altered the response value (Figure 4).
Figure 4.
Response surface and contour plots for the effect of operating parameters on the extraction rate of total flavonoids from H. Radix.
Prediction based on the regression model afforded the optimal steady-state extraction parameters for total flavonoids from H. Radix: ethanol concentration of 74.78%, solid–liquid ratio of 1:16.14, extraction duration of 93.94 min, with a maximum predicted comprehensive score of 93.65%.
To facilitate practical operation, the optimized conditions were rounded to 75% ethanol, solid–liquid ratio 1:16 and extraction time 90 min. Three parallel validation experiments yielded average extraction yields of 6.1679 mg·g−1 for total flavonoids, 90.4 μg·g−1 for calycosin and 212.9 μg·g−1 for formononetin. The experimental comprehensive score integrating all target analytes averaged 94.09%, with an RSD of 1.66%. This measured value only deviated by 0.47% from the model-predicted score (93.65%), which verified the high reliability and reproducibility of the optimized extraction procedure.
3.5. Effect of HPD722 Macroporous Adsorption Resin on the Adsorption Process of Total Flavonoids of H. Radix
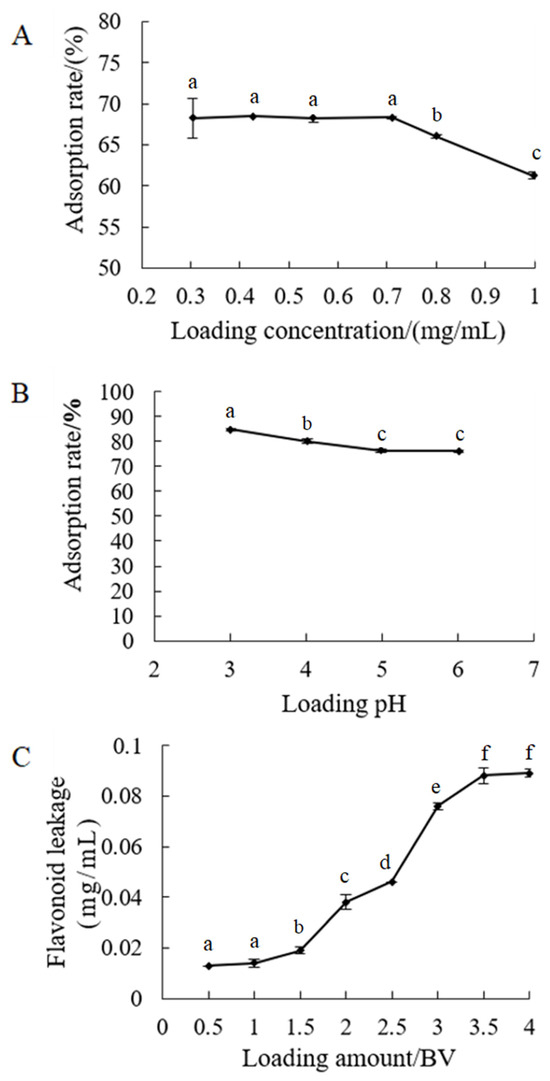
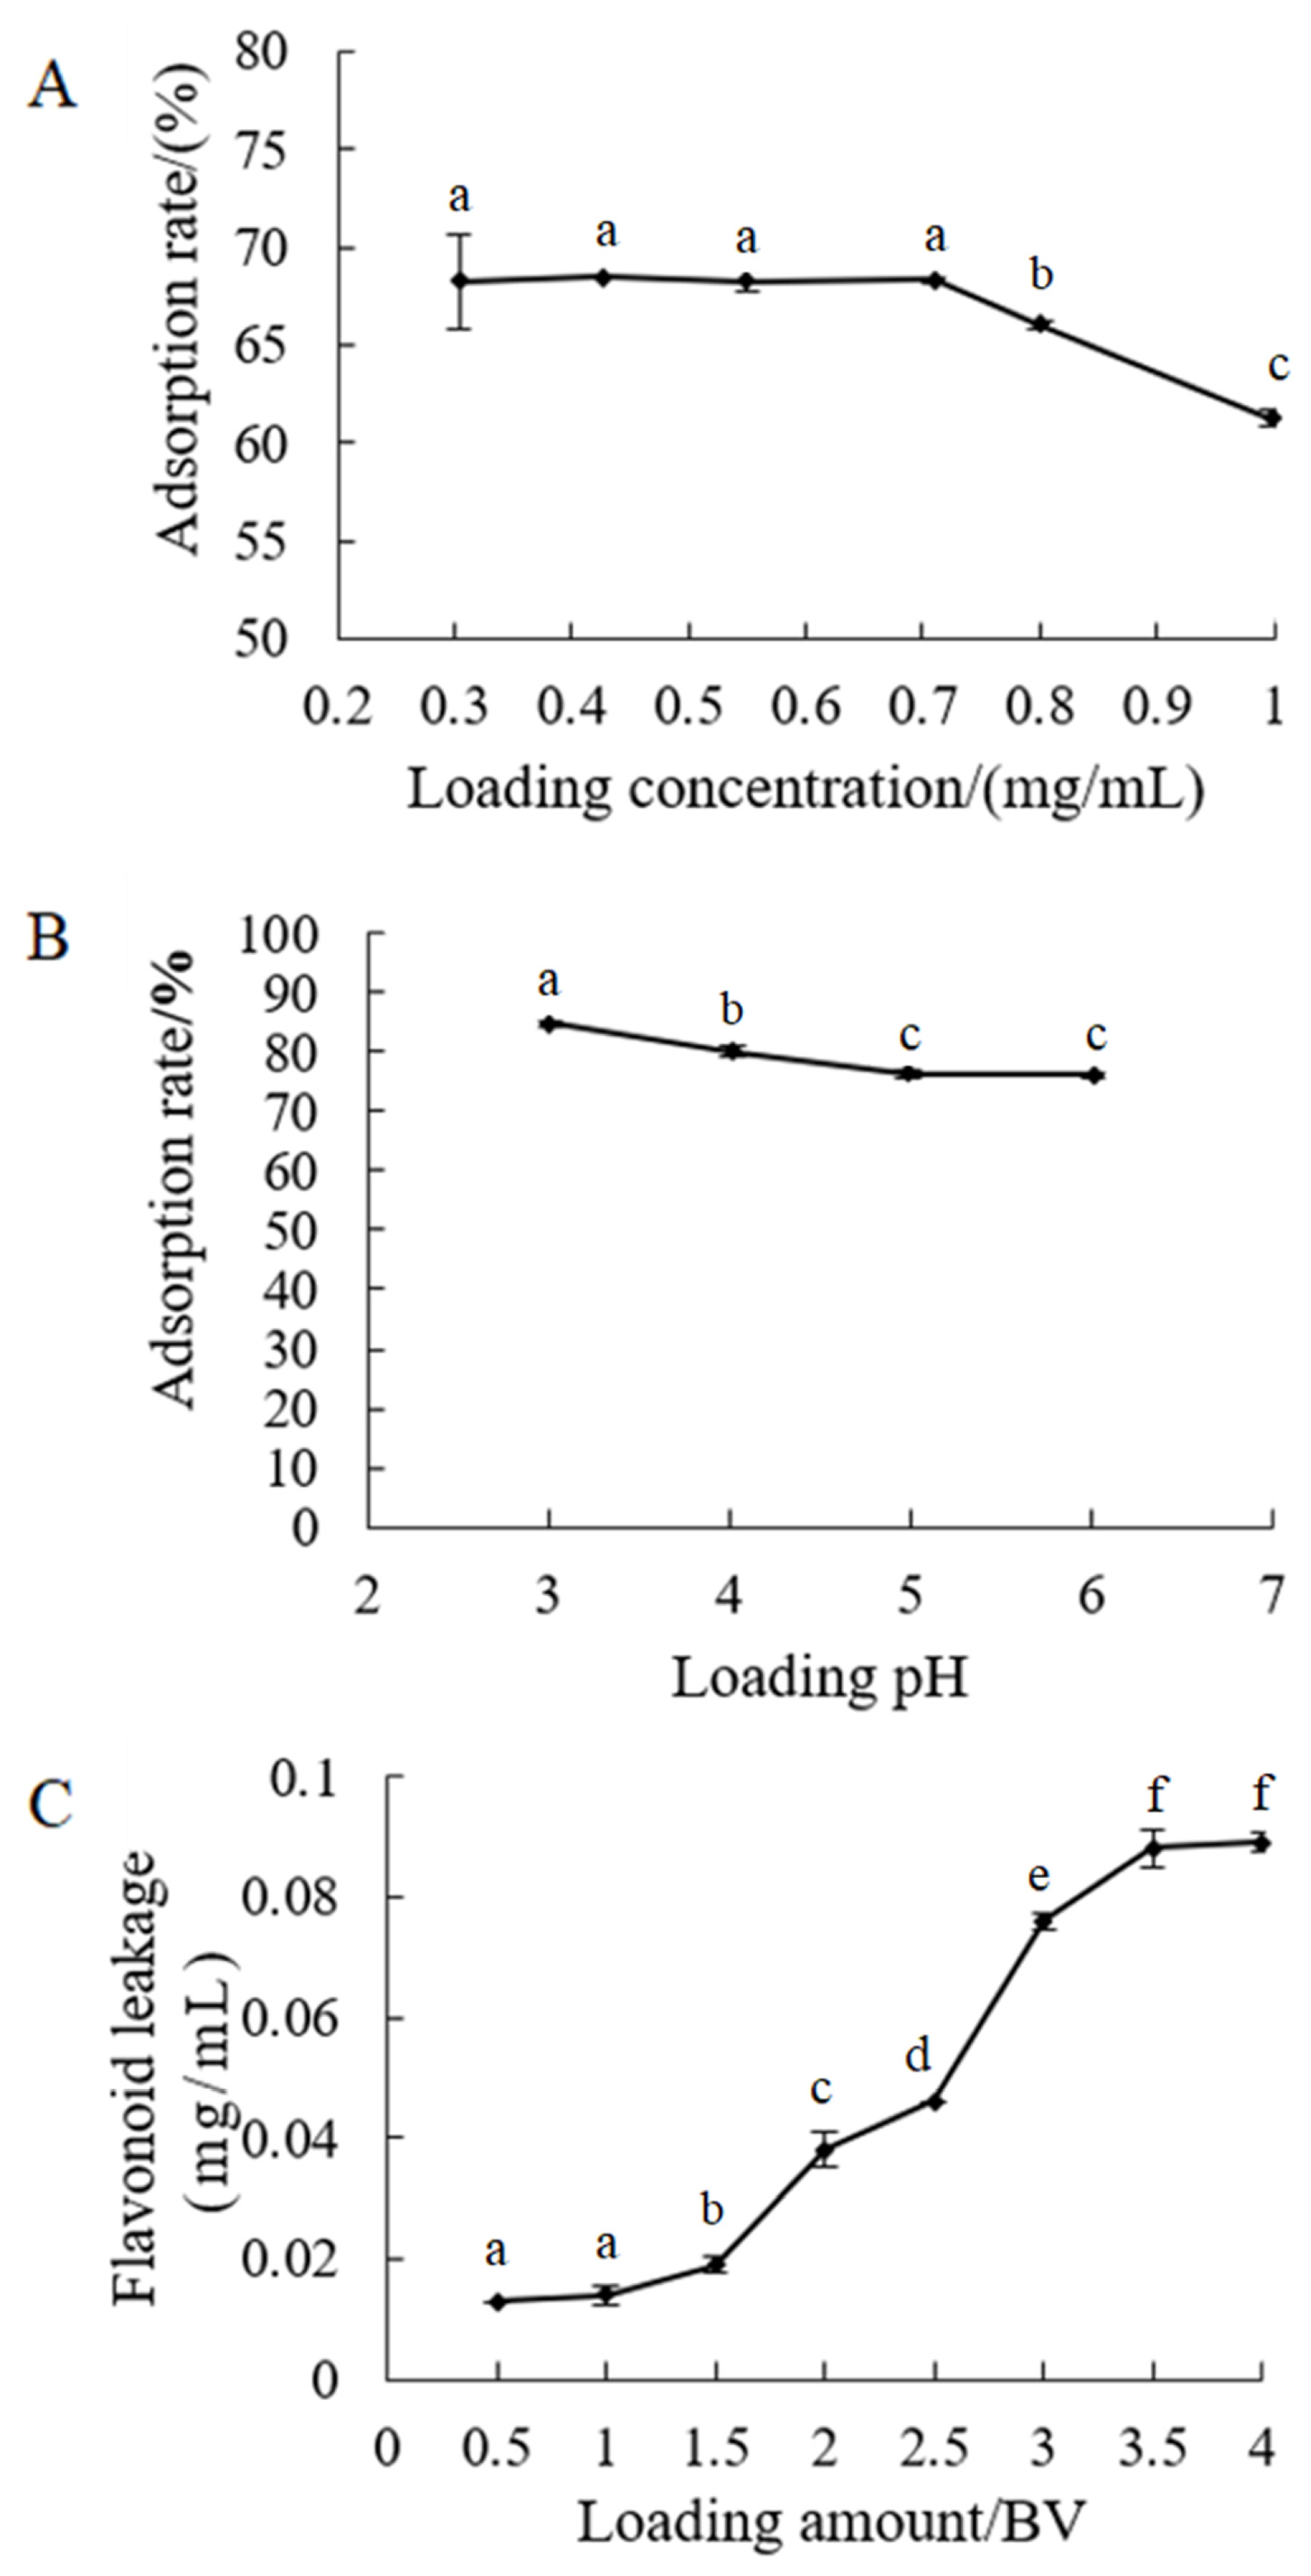
When the loading solution contained total flavonoids at 0.3–0.71 mg·mL−1, HPD722 resin presented strong adsorption capacity toward flavonoids from H. Radix. Adsorption efficiency declined once the concentration exceeded 0.7 mg·mL−1 (Figure 5A), which was attributed to saturated adsorption sites on the resin. Accordingly, 0.71 mg·mL−1 was chosen as the optimal loading concentration.
Figure 5.
Effects of the sample concentration (A), pH (B), amount (C) on adsorption rates of flavonoids. Values with different letters are significantly different (p < 0.05).
Adsorption efficiency of HPD722 resin for flavonoids of H. Radix gradually rose as loading pH decreased, reaching the maximum at pH 3.0 (Figure 5B).
Flavonoid concentration in effluent fractions elevated sequentially. Flavonoid leakage occurred at the third collected fraction, where the effluent concentration approached 10% of the loading concentration (0.07 mg·mL−1). Hence, the optimal loading volume was set at 3 BV (Figure 5C).
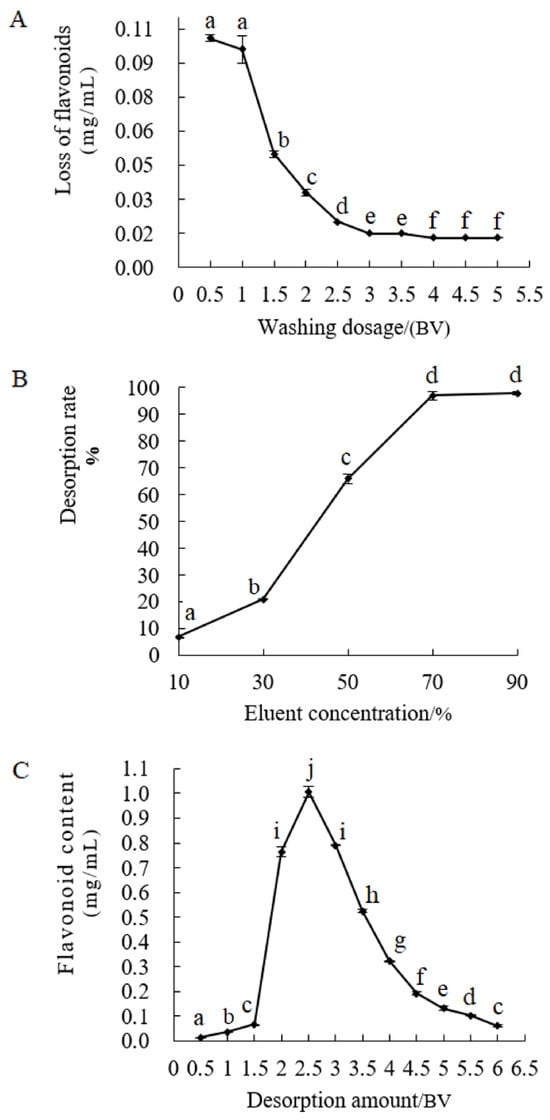
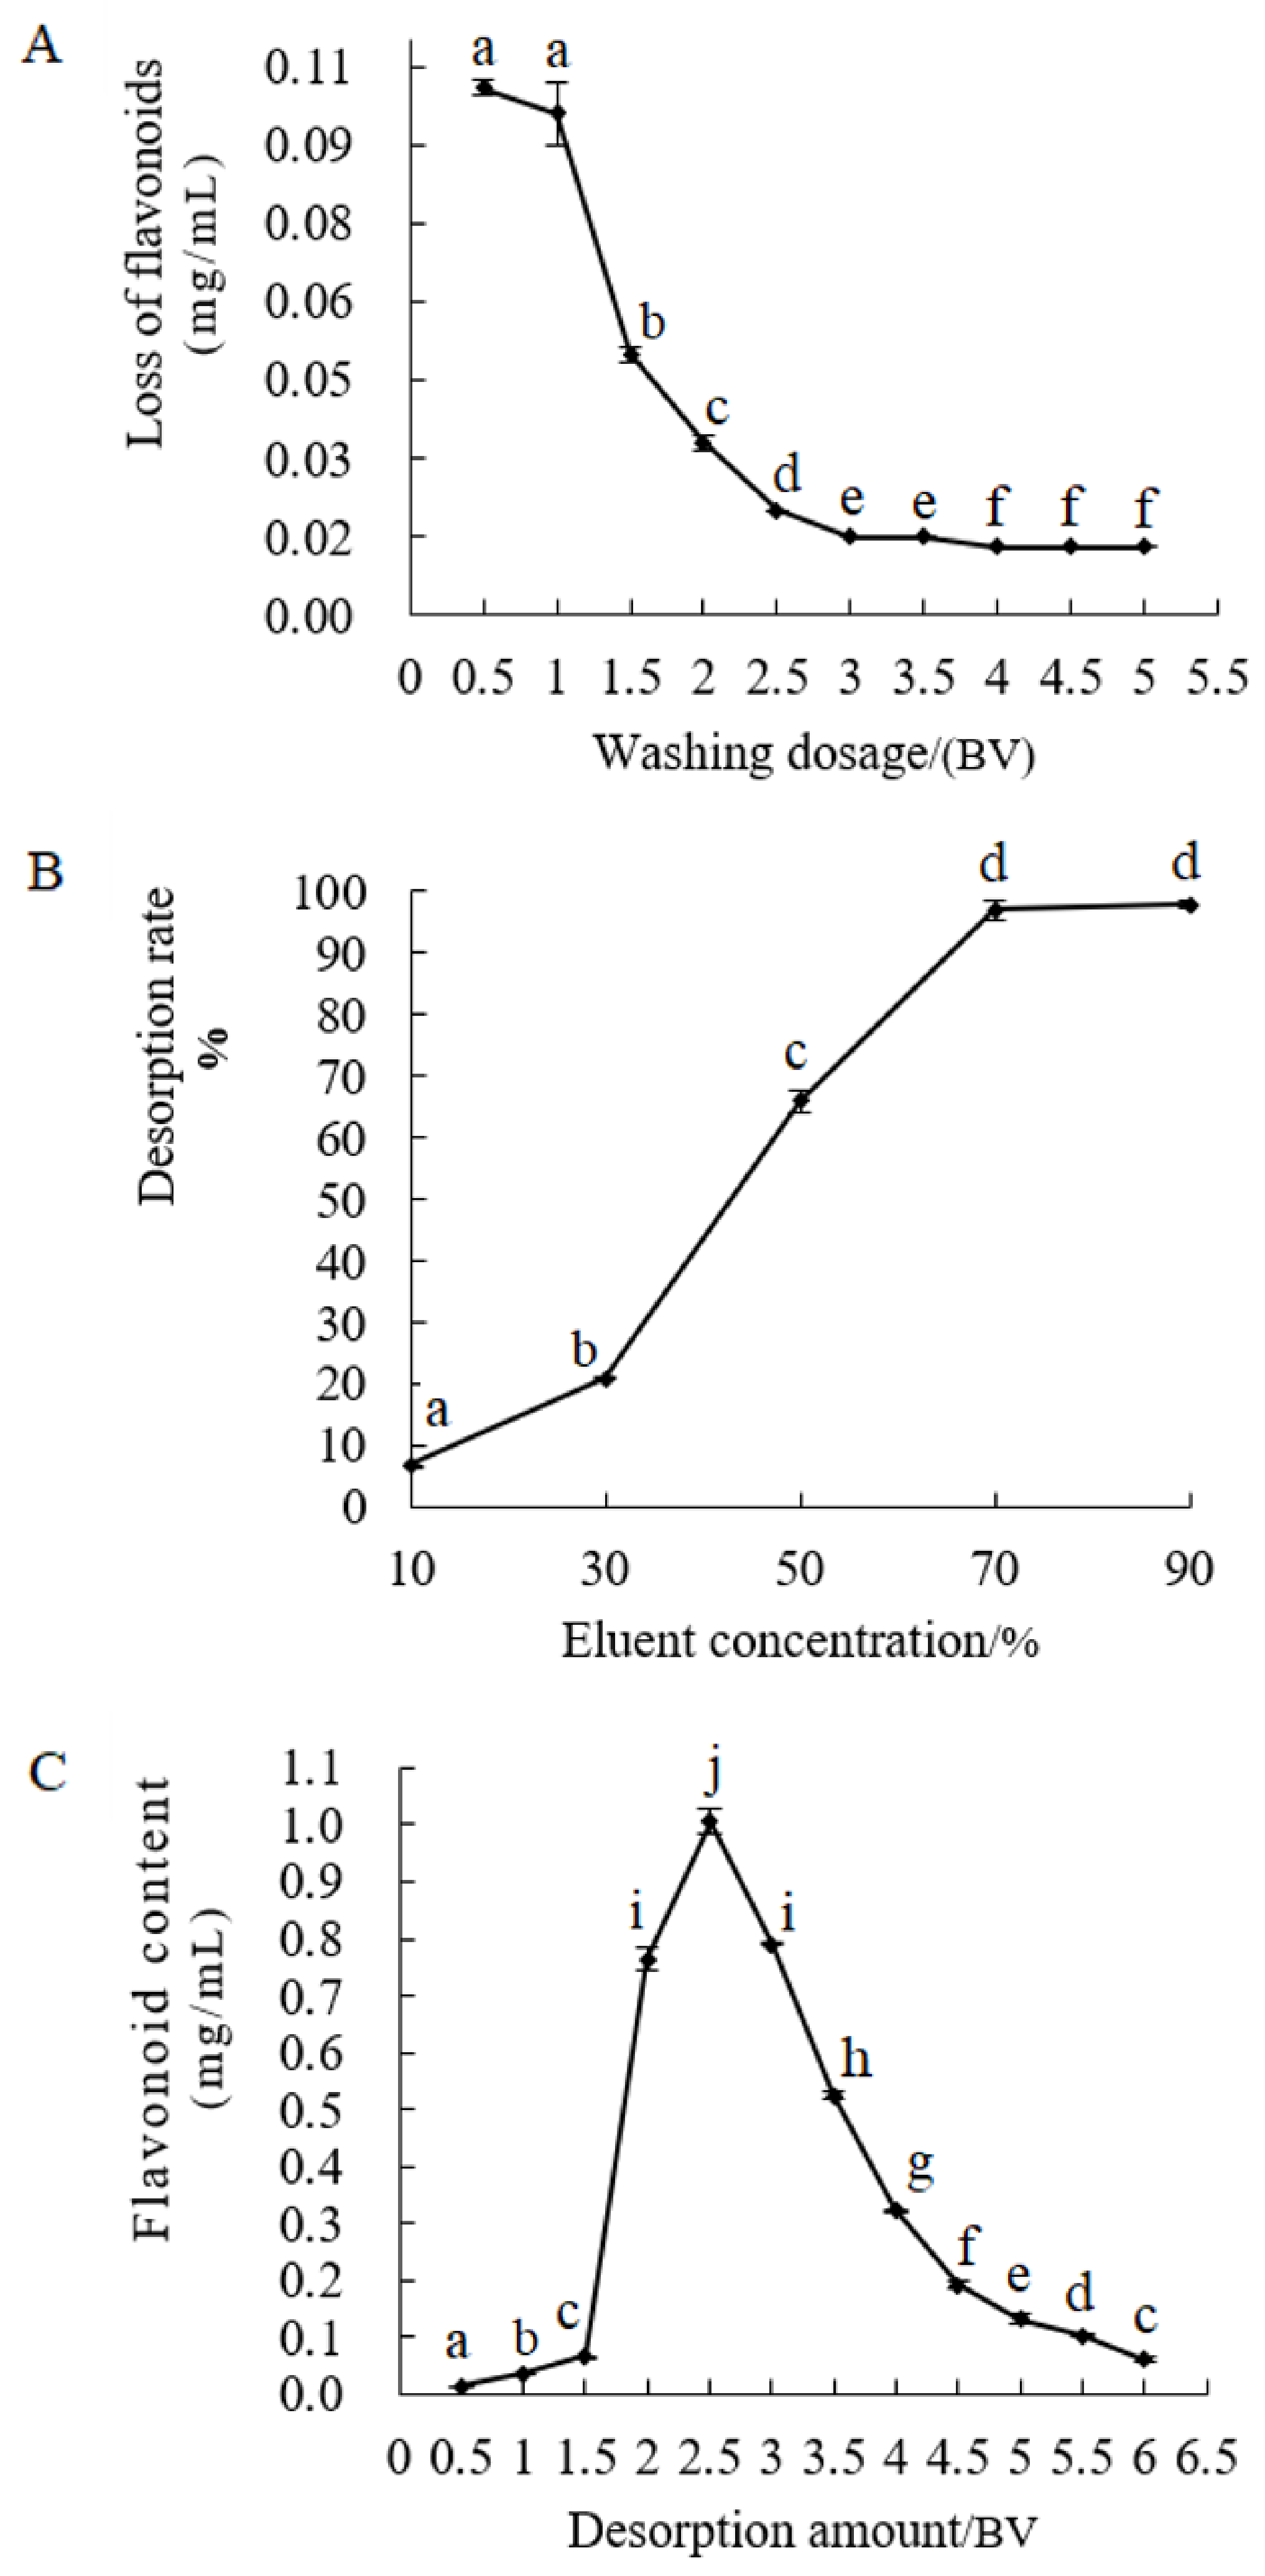
During impurity washing, total flavonoid levels in washing liquid continuously dropped with rising bed volume. Flavonoid loss became negligible after washing with 4 BV, accompanied by a stabilized concentration curve (Figure 6A). Therefore, 4 BV was selected as the optimal washing volume for impurity removal.
Figure 6.
Results of varying washing dosage for impurity removal (A), different eluent concentrations (B) and elution dosages of ethanol (C). Values with different letters are significantly different (p < 0.05).
Desorption efficiency of HPD722 resin peaked at 70% ethanol eluent. Further elevations of ethanol concentration barely improved desorption performance, revealing strong compatibility between 70% ethanol and aqueous flavonoids of H. Radix (Figure 6B). Thus, 70% ethanol was adopted as the optimal eluent.
HPD722 resin exhibited ideal desorption performance for H. Radix flavonoids with sharp elution peaks and insignificant tailing, and few target compounds remained retained on the resin. Flavonoid concentration in eluent first increased and then declined with growing elution volume, and most adsorbed flavonoids were fully eluted within the first 6 BV (Figure 6C). Consequently, 6 BV was defined as the optimal elution volume.
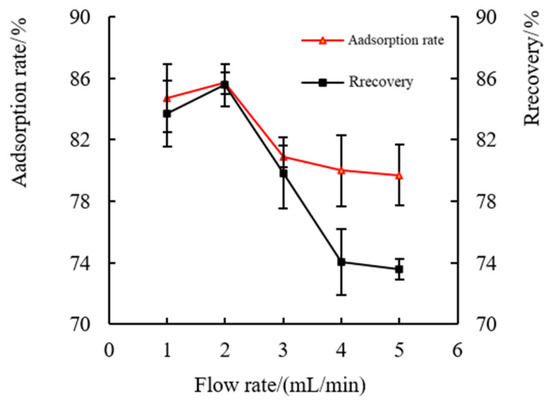
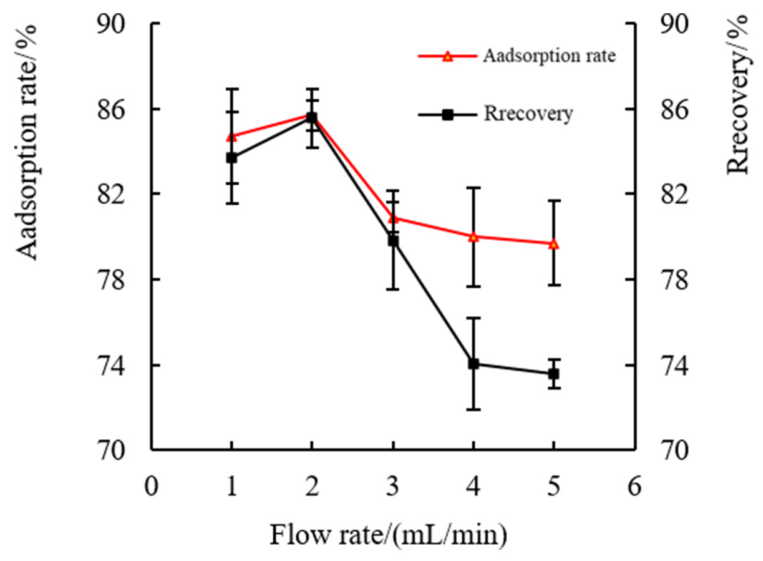
Loading flow rate exerted remarkable effects on flavonoid adsorption. Both adsorption and recovery rates of target flavonoids increased first and then decreased along with faster flow, and both indexes reached maxima at 2 mL·min−1 (Figure 7). Therefore, 2 mL·min−1 was determined as the optimal loading flow rate.
Figure 7.
Results of investigation at different flow rates.
Purification under all above optimized enrichment conditions significantly raised total flavonoid content of H. Radix crude extract from 12.44 mg·g−1 to 161.96 mg·g−1, with a purification fold of 13.02 and a recovery rate of 85.56%. Quantification results showed that purified flavonoid powder contained 3.85 mg·g−1 calycosin and 4.02 mg·g−1 formononetin. These results verified that the established purification procedure efficiently enriched flavonoids from H. Radix, delivering high purification efficiency and acceptable recovery of bioactive constituents.
3.6. Purification and Preparation of Total Flavonoids from H. Radix
Tandem purification with HPD722 and polyamide resins greatly improved the purification efficiency of total flavonoids from H. Radix (Table 5). The final purified product contained total flavonoids at 475.36 mg·g−1, corresponding to a 77.04-fold enrichment relative to raw H. Radix. The contents of characteristic flavonoids calycosin and formononetin were 28.41 mg·g−1 and 7.11 mg·g−1, with enrichment folds of 521.28 and 51.04 against crude herbal samples, respectively. The combined resin procedure remarkably elevated both enrichment efficiency and recovery of total flavonoids in H. Radix.
Table 5.
Content of total flavonoids and two kinds of flavonoids in H. Radix.
3.7. Functional Groups and Chemical Structure Identification of Flavonoid Compounds
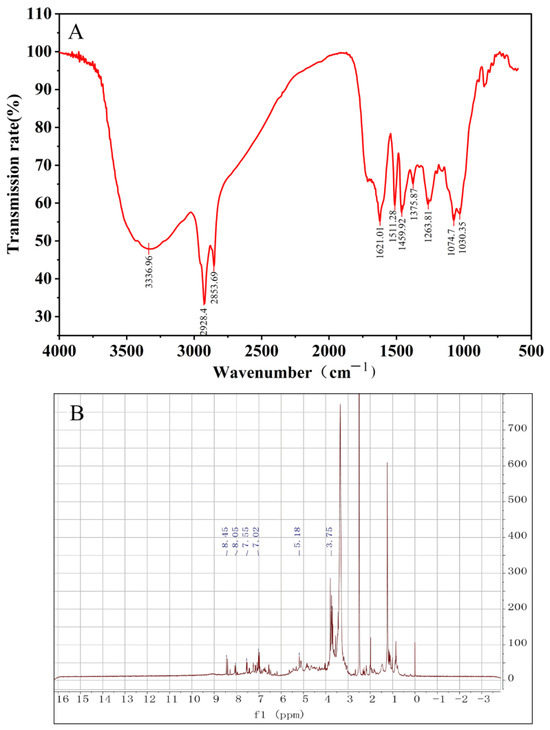
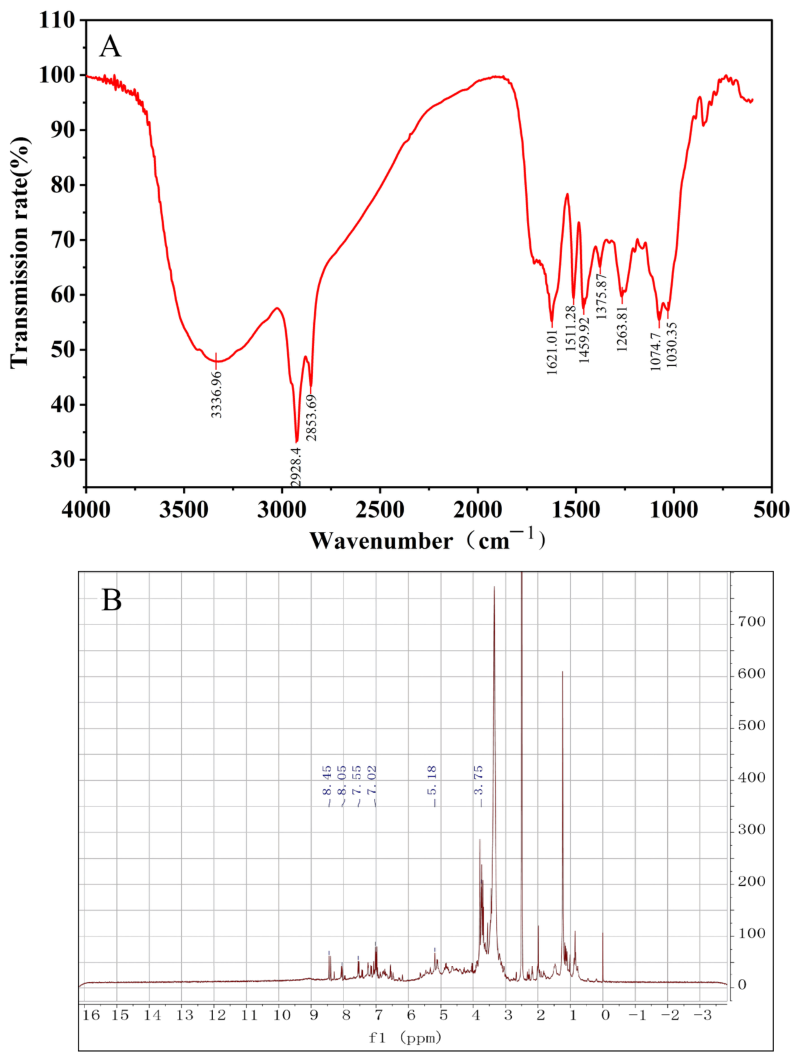
FT-IR and NMR spectroscopy were applied to characterize functional groups and chemical structures of flavonoids isolated from H. Radix. In the FT-IR spectrum (Figure 8A), a broad intense band at 3336 cm−1 originated from O-H stretching vibrations of phenolic and saccharide hydroxyl groups. Weak peaks at 2928 cm−1 and 2853 cm−1 arose from C-H stretching of methoxy and aromatic C-H moieties. Signals at 1621 cm−1 and 1511 cm−1 were characteristic of conjugated C=O stretching and aromatic C=C skeleton vibration of the flavonoid backbone, respectively. The band near 1459 cm−1 corresponded to aromatic ring skeleton vibration and -CH3 bending, while the peak at 1375 cm−1 belonged to symmetric C-H bending. The band at 1263 cm−1 was ascribed to C-O-C ether stretching, confirming methoxy substitution. Peaks at 1074 cm−1 and 1030 cm−1 represented C-OH stretching and pyranose C-O-C vibrations.
Figure 8.
FT-IR spectrum (A) and 1H NMR spectrum (B) of flavonoids from H. Radix.
In the 1H NMR spectrum (Figure 8B), a singlet at δ 8.45 ppm was attributed to the C2 proton of the isoflavone skeleton, serving as a diagnostic marker for isoflavonoids. Aromatic proton signals at δ 8.04, 7.55 and 6.99 ppm revealed substitution patterns of rings A and B (A-H5, B-H2′, B-H6′, B-H3′, B-H5′). A signal at δ 5.18 ppm confirmed glycosidic linkages, proving flavonoid glycosides existed in the sample. A singlet at δ 3.79 ppm further verified methoxy (-OCH3) substitution.
4. Discussion
Numerous studies have investigated the flavonoid constituents of H. Radix. Ye et al. 31 employed ethanol reflux extraction combined with HPLC to determine flavonoids in annual and biennial H. Radix samples collected from 29 sites across Longnan City, Gansu Province. They quantified four characteristic flavonoids—calycosin-7-O-β-D-glucoside, ononin, calycosin, and formononetin—and validated their method with satisfactory reliability. Although their analytical principle aligns with that of our study, the reported contents of the target compounds were considerably lower: calycosin ranged from 3.34 to 10.4 μg·g−1 and formononetin from 42.7 to 145 μg·g−1. In contrast, our optimized method yielded average contents of 90.4 μg·g−1 for calycosin and 212.9 μg·g−1 for formononetin, representing an increase of at least 7.7-fold for calycosin and 46.8% for formononetin relative to Ye’s findings.
Li et al. [34] determined flavonoid levels in H. Radix samples harvested from Xiabashan Village, Jiangtai Township, Dangchang County, during July to October using methanol reflux extraction combined with HPLC. In their study, calycosin contents ranged from 18 to 28.2 μg·g−1, while formononetin concentrations varied between 77.7 and 539.5 μg·g−1, with a mean value of 227.8 μg·g−1. Compared with the present work, their calycosin levels were at least 2.2-fold lower, whereas their average formononetin content was only 7% higher. In a separate study, Liu et al. [35] employed a methanol reflux–HPLC protocol similar to that reported by Li et al. [34] on H. Radix samples collected from Hadapu Town, Dangchang County, reporting calycosin and formononetin contents of 9.3 μg·g−1 and 112.9 μg·g−1, respectively, values that were 8.7-fold and 88.6% lower than those obtained in the current investigation. The relatively high formononetin concentration observed by Li et al. [34] may be attributed to suitable harvest time and distinct geographical origin, which likely facilitated natural accumulation of this metabolite in the crude herb, rather than reflecting superior extraction efficiency of their procedure. The plant material used in the present experiment consisted of mixed batches purchased from the Hadapu medicinal market in Dangchang County, collected during the July–October harvest season. Overall, the optimized extraction protocol established in this work achieved formononetin contents of 212.9 μg·g−1 and significantly elevated calycosin yields up to 90.4 μg·g−1, thereby demonstrating its excellent performance in recovering flavonoids from H. Radix.
Response surface methodology (RSM), which integrates experimental design and regression modeling, is a well-established optimization tool widely adopted in pharmaceutical, chemical and environmental research [36]. In this study, a quadratic regression model for flavonoid extraction from H. Radix. was established based on the Box–Behnken design, and the optimal extraction conditions were determined as 75% ethanol, a solid–liquid ratio of 1:16, and an extraction time of 90 min. Under these conditions, the comprehensive evaluation score reached 94.09% with an RSD of 1.66%, only deviating by 0.47% from the model-predicted value of 93.65%. These results demonstrate that the regression model possesses high precision and reliability to accurately predict flavonoid extraction performance of H. Radix., and this method can also provide credible technical references for the extraction and processing of flavonoids from other Astragalus medicinal materials.
Macroporous adsorption resins (MARs) are cross-linked polymeric adsorbents featuring divinylbenzene backbones, which enable reversible adsorption and desorption for the separation of natural products, along with convenient regeneration and recyclability [37,38,39]. However, conventional single-type macroporous resins offer limited purification performance for flavonoids from Astragalus extracts; for instance, the XDA-5 resin achieved a total flavonoid purity of only 28.75% after purification 36. To date, systematic purification strategies specifically designed for total flavonoids from H. Radix have rarely been reported. In the present study, a two-step purification approach combining HPD722 macroporous resin with polyamide resin was established. Following sequential enrichment, the total flavonoid purities of common Astragalus and H. Radix reached 310.63 mg·g−1 and 475.36 mg·g−1, respectively. Compared with single-resin purification, the complementary adsorption characteristics of the dual-adsorbent system significantly enhanced enrichment efficiency, while offering straightforward operation and pronounced purification effects.
Structural characterization via FT-IR and 1H NMR collectively confirmed that the purified active substances separated from H. Radix belong to typical isoflavone glycosides with intact chemical skeletons. No damage to core functional groups or glycosidic linkages was observed after the whole extraction and two-stage purification workflow. This evidence further demonstrates that the integrated preparation route established in this research can stably acquire high-purity structurally complete flavonoid components, laying solid material and technical foundations for subsequent pharmacological exploration and translational development of H. Radix flavonoids.
5. Conclusions
In summary, this study aimed to optimize the extraction and purification technology of total flavonoids from H. Radix for the acquisition of high-purity bioactive flavonoid components. The optimal extraction process was determined as reflux extraction with 75% (v/v) ethanol at a solid–liquid ratio of 1:16 in an 80 °C water bath for 90 min. Under these conditions, the total flavonoid yield reached 6.17 mg·g−1, containing 0.0904 mg·g−1 calycosin and 0.2129 mg·g−1 formononetin. The extraction performance surpassed the data reported in previous studies, demonstrating prominent optimization effects. HPD722 macroporous resin exhibited excellent refining capacity for H. Radix total flavonoids, with the optimal purification parameters listed as follows: flavonoid loading solution at 0.71 mg·mL−1 (pH 3.0) was loaded at a flow rate of 2 mL·min−1 with three bed volumes (BV), impurities were washed with 4 BV distilled water, and target flavonoids were eluted using 6 BV 70% ethanol. The combined use of HPD722 macroporous resin and polyamide adsorption resins constructed a simple and efficient purification system, which markedly raised the enrichment efficiency and purification recovery of total flavonoids. Overall, this work establishes a reliable technical approach for obtaining flavonoid fractions from H. radix, which may lay a foundation for subsequent pharmacological investigations into immunomodulatory and anti-tumor activities [40].
Author Contributions
Conceptualization, H.-J.Y., W.-H.H. and S.-S.X.; Methodology, H.-J.Y., H.X. and W.L.; Software, H.X.; Validation, H.X., Y.-S.L. and Y.-J.Y.; Formal analysis, H.-J.Y. and H.X.; Investigation, H.-J.Y., H.X. and Y.-S.L.; Resources, W.-H.H.; Data curation, H.-J.Y. and Y.-S.L.; Writing—original draft preparation, H.-J.Y., H.X., H.-W.Z. and F.-Y.Z.; Writing—review and editing, H.-J.Y., H.X., W.-H.H., H.-W.Z., W.L., S.-S.X. and F.-Y.Z.; Visualization, H.X. and Y.-J.Y.; Supervision, W.-H.H. and S.-S.X.; Project administration, W.-H.H. and Y.-J.Y. All authors have read and agreed to the published version of the manuscript.
Funding
This work was financially supported by the National Natural Science Foundation of China (Grant Nos. 81360619 and 32060390) and Lanzhou Shiban Agricultural Biotechnology Co., Ltd-Funded Project (Grant Nos. HX2025A51000002). The former project is entitled “Screening of the anticancer ingredients from Gansu geoherbs based on the inhibition of thioredoxin reductase activity” and the latter is entitled “Functional analysis of LbCER3 in the synthesis of long-chain alkanes in the cuticle of Lycium barbarum”. Corporate-Funded Project is entitled “Development of technologies for the separation, extraction, and activity analysis of bioactive components from characteristic resource plants of Gansu province, and their application in and cosmetics”.
Data Availability Statement
Data is available upon request.
Conflicts of Interest
The authors declare no conflicts of interest.
Abbreviations
The following abbreviations are used in this manuscript:
| H. Radix | Hedysari Radix |
References
- Xia, S.Q.; Wang, P.L.; Zhang, L.; Yang, Y.L.; Wang, Z.D. A study of bacteriostasis of Chinese herbal medicine feed additive and its application status. Acta Agric. Univ. Jiangxiensis 2020, 42, 1231–1236. [Google Scholar]
- Wang, B.; Wang, J.M.; Wang, S.H.; Liu, K.L.; Huang, J.; Wang, Y.L. Study on high performance liquid phase fingerprint of compound Astragalus feed additive. Feed Res. 2021, 44, 101–104. [Google Scholar]
- Li, J.Y.; Qiang, Z.Z.; Li, C.Y. Herbalogical study of Radix Astragali. China Pharm. 2015, 26, 4860–4862. [Google Scholar] [CrossRef] [Scilit]
- Mo, X.L.; Guo, D.K.; Jiang, Y.G.; Chen, P.; Huang, L.F. Isolation, structures and bioactivities of the polysaccharides from Radix Hedysari: A review. Int. J. Biol. Macromol. 2022, 199, 212–222. [Google Scholar] [CrossRef] [Scilit]
- Jia, M.T.; Li, C.Y.; Sun, T.X.; Wang, L.; Qiang, Z.Z.; Li, B. Recent progress in the study on pharmacological action of hedysarum polysaccharide. Pharmacol. Clin. Chin. Mater. Med. 2020, 36, 235–239. [Google Scholar]
- Wei, D.F.; Wei, Y.X.; Cheng, W.D.; Zhang, L.F. Sulfated modification, characterization and antitumor activities of Radix hedysari, polysaccharide. Int. J. Biol. Macromol. 2012, 51, 471–476. [Google Scholar] [CrossRef] [Scilit]
- Li, J.T.; Zhu, X.D.; Dai, E.L.; Yang, F.D.; Jin, H. Longyuan herb garden fragrance-analysis of ecological conditions and medicinal value of representative genuine medicinal materials in Gansu province. Mod. Chin. Med. 2013, 15, 80–82. [Google Scholar]
- Li, Y.F.; Zhang, Y.G.; Niu, J.T.; Xin, E.D.; Zhang, S.J.; Yan, X.K. Comparative study of radix hedysari and radix astragali. Lishizhen Med. Mater. Med. Res. 2019, 30, 2462–2463. [Google Scholar]
- National Pharmacopoei Committee. Pharmacopoeia of the People’s Republic of China (Part I); China Medical Science and Technology Press: Beijing, China, 2015; pp. 152–153. [Google Scholar]
- Li, Y.; He, J.G.; Feng, H.M.; Wei, X.C.; Zhang, G.M.; Zhou, R.J.; Li, C.Y. Research progress and potential advantages of hedysarum flavonoid. Chin. Arch. Tradit. Chin. Med. 2022, 40, 89–93. [Google Scholar]
- Box, G.E.P.; Wilson, K.B. On the Experimental Attainment of Optimum Conditions. Stat 1951, 13, 1–45. [Google Scholar] [CrossRef] [Scilit]
- Li, S.G.; Wang, D.G.; Tian, W.; Wang, X.X.; Zhao, J.X.; Liu, Z.; Chen, R. Characterization and anti-tumor activity of a polysaccharide from Hedysarum polybotrys Hand.-Mazz. Carbohydr. Polym. 2008, 73, 344–350. [Google Scholar] [CrossRef] [Scilit]
- Zhang, S.J.; Zhang, Y.G.; Xin, E.D.; Niu, J.T.; Si, X.L.; Li, D.H.; Wu, H.W.; Li, Y.F. Research progress of Hongqi (Hedysari Radix) and predictive analysis of quality markers. Chin. Arch. Tradit. Chin. Med. 2022, 40, 70–74. [Google Scholar]
- Feng, H.M.; Li, C.Y.; He, J.G.; Li, Y.; Qiang, Z.Z.; Jia, M.T.; Wang, L.; Sun, T.X.; Luo, X.D.; Liang, T.T.; et al. Research progress on chemical constituents and pharmacological effects of Hedysari Radix and predictive analysis on quality markers. Chin. Tradit. Herb. Drugs 2021, 52, 2831–2842. [Google Scholar]
- Wang, Y.; Zhang, Y.; Li, J.; Li, X.Y.; Liu, Y.Q.; Su, W.; Ling, X.Y.; Li, J.T. Effects of Radix Hedysari polysaccharide, Radix Hedysari flavone and Radix Hedysari saponin on bleomycin-induced pulmonary interstitial fibrosis in rats. Chin. Tradit. Pat. Med. 2022, 44, 573–578. [Google Scholar]
- Shi, G.G.; Wang, D.H.; Xue, Z.Y.; Zhou, X.L.; Fang, Y.Y.; Feng, S.L.; Zhao, L.G. The amelioration of ulcerative colitis induced by dinitrobenzenesulfonic acid with radix hedysari. J. Food Biochem. 2020, 4, e13421. [Google Scholar] [CrossRef] [Scilit]
- Hou, M.; Hu, W.; Xiu, Z.; Jiang, A.; Men, L.; Hao, K.; Sun, X.; Cao, D. Preparative Purification of Total Flavonoids from Sophora tonkinensis Gagnep. by Macroporous Resin Column Chromatography and Comparative Analysis of Flavonoid Profiles by HPLC-PAD. Molecules 2019, 24, 3200. [Google Scholar] [CrossRef] [Scilit]
- Yuanfeng, W.; Lei, Z.; Jianwei, M.; Shiwang, L.; Jun, H.; Yuru, Y.; Lehe, M. Kinetic and thermodynamic studies of sulforaphane adsorption on macroporous resin. J. Chromatogr. B Anal. Technol. Biomed. Life Sci. 2016, 1028, 231–236. [Google Scholar] [CrossRef] [Scilit]
- Ji, Y.; Li, B.; Qiao, M.; Li, J.; Xu, H.; Zhang, L.; Zhang, X. Advances on the in vivo and in vitro glycosylations of flavonoids. Appl. Microbiol. Biotechnol. 2020, 104, 6587–6600. [Google Scholar] [CrossRef] [Scilit]
- Ruan, X.; Zhan, L.M.; Gao, X.X.; Yan, L.Y.; Zhang, H.; Zhu, Z.Y.; Wang, Q.; Jiang, D.A. Separation and purification of flavonoid from Taxus remainder extracts free of taxoids using polystyrene and polyamide resin. J. Sep. Sci. 2013, 36, 1925–1934. [Google Scholar] [CrossRef] [Scilit]
- Wu, W.; Cui, G.H.; Lu, B. Optimization of multi ple evariables: Application of central composite design and overall desirability. Chin. Pharm. J. 2000, 35, 530–533. [Google Scholar]
- Teng, L.; Ma, G.Z.; Sun, D.J.; Li, J. Optimization of the Sanyue Ephedra granules prescription by three comprehensive index quantitative methods. Chin. Tradit. Pat. Med. 2009, 31, 707–711. [Google Scholar]
- Li, L.; Zhang, S.; He, Q.; Hu, X.B. Application of response surface methodology in experiment design and optimization. Res. Explor. Lab. 2015, 34, 41–45. [Google Scholar]
- Song, S.Y.; Su, P.; Wang, L.J.; Zou, M.M.; Sun, X. Optimization of ultrasonic-assisted extraction by response surface methodology and antioxidant activities of pectic polysaccharide from okra flowers. Food Sci. 2017, 38, 283–289. [Google Scholar]
- Yuan, H.J.; Li, X.; Jia, H.Z.; Yuan, Y.J. Optimization of extraction technology for total flavonoids from astragali radix by response surface methodology and their preliminary enrichment. Pratacultural Sci. 2019, 36, 1683–1691. [Google Scholar]
- Yu, X.C.; Liu, G.F. Application of response surface analysis in extraction and preparation of traditional Chinese medicine. J. Chin. Med. Mater. 2010, 33, 1651–1655. [Google Scholar]
- Ren, H.J.; Lin, W.W.; Lu, S.; Li, T.T.; Zhou, R. Degradation of ofloxacin by thermally activated persulfate and its response surface optimization. J. Jilin Univ. (Earth Sci. Ed.) 2021, 51, 887–897. [Google Scholar]
- Hassan, E.E.; Parish, R.C.; Gallo, J.M. Optimized formulation of magnetic chitosan microspheres containing the anticancer agent, oxantrazole. Pharm. Res. 1992, 9, 390–397. [Google Scholar] [CrossRef] [Scilit]
- Yan, Y.P.; Wang, G.; Jiang, S.J.; Wang, L.L. Response surface methodology for optimizing Cu2+ removal by heavy metal flocculant DTAPAM. Acta Sci. Circumst. 2021, 41, 2156–2161. [Google Scholar]
- Tian, Y.F.; Wan, H.T.; Zhu, Z.Y.; Zheng, P.P.; Yu, L.; He, Y. Multi-objective optimization of purification technology for licorice flavonoids based on entropy-weight method. Chin. Tradit. Herb. Drugs 2016, 47, 1118–1125. [Google Scholar]
- Ye, Y.; Bao, Q.; Wang, R.H.; Bai, D.; Tian, S.H.; Liu, P.Y.; Liu, W.D.; Peng, J.P.; Chen, Y.G.; Yang, L.X.; et al. Determination of astragaloside IV in Gansu Hedysari Radix and comparison of astragaloside IV and total saponins content in one year old and two years old Hedysari Radix and Astragali Radix. Chin. J. Exp. Tradit. Med. Formulae 2018, 24, 69–75. [Google Scholar]
- Fracasso, B.; Girelli, R.C.; Fazzi, C.M.; Calabrese, A.; Campanale, M.; Cesari, G.; Fanizzi, F.P. 1H NMR based-metabolomic approach to evaluate biocompost application on tomato fruit. Food Res. Int. 2026, 242, 120144. [Google Scholar] [CrossRef] [Scilit]
- Babu, R.; Ganga, A.; Anand, C.P. FT-IR method development and validation for quantitative estimation of zidovudine in bulk and tablet dosage form. Drug Res. 2013, 63, 165–170. [Google Scholar] [CrossRef] [Scilit]
- Li, J.Y.; Qiang, Z.Z.; Luo, X.D.; Li, S.; Li, C.Y. Analysis characteristics of four kinds of isoflavones from Gansu Hedysari Radix in different months and different regions. J. Chin. Med. Mater. 2017, 40, 562–567. [Google Scholar]
- Liu, X.Y.; Li, J.P.; Chen, X.Y.; Chen, Y.L.; Hong, Y.; Feng, S.L. Determination of eight active components in Radix Hedysari by HPLC and its cluster analysis. Acta Pharm. Sin. 2016, 51, 786–791. [Google Scholar]
- Zhang, Y.R.; Yin, X.J.; Tong, J.Y.; Zhang, F.L. Macroporous Resin Purifies Total Flavonoids of Mosla Dianthera with Process Research and Component Analysis. Chin. J. Mod. Appl. Pharm. 2025, 42, 1069–1076. [Google Scholar]
- Cheng, J.M.; Ge, T.T.; Peng, G.P.; Zheng, Y.F. Optimization of Purification Technology for Total Flavonoids from Salvia plebeia by Macroporous Adsorption Resin. Chin. J. Exp. Tradit. Med. Formulae 2012, 18, 20–24. [Google Scholar]
- Wang, R.H.; Liu, H.B.; Tang, Z.S.; Zhu, H.; Liu, H.; Guo, R.; Song, Z.; Xu, H.; Li, B.; Li, G.; et al. Effect of the Total Saponins of Bupleurum chinense DC. Water Extracts Following Ultrafiltration Pretreatment on Macroporous Resin Adsorption. Molecules 2024, 29, 5153. [Google Scholar] [CrossRef] [Scilit]
- Wang, Z.P.; Gao, Y.; Li, W.M.; Liu, J. Study on purification of total flavonoids and saponins of Astragalus with macroporous resin. J. Chin. Med. Mater. 2010, 33, 1163–1166. [Google Scholar]
- Huang, C.; Mao, H.; Wan, W.; Ren, C.; Ji, X.; Yue, B.; Zhang, X.; Wu, Q. Extraction, content determination, component analysis, and pharmacological action of Hedysari flavonoids: A review of research progress. Front. Pharmacol. 2025, 16, 1517832. [Google Scholar] [CrossRef] [Scilit]

Disclaimer/Publisher’s Note: The statements, opinions and data contained in all publications are solely those of the individual author(s) and contributor(s) and not of MDPI and/or the editor(s). MDPI and/or the editor(s) disclaim responsibility for any injury to people or property resulting from any ideas, methods, instructions or products referred to in the content. |
© 2026 by the authors. Licensee MDPI, Basel, Switzerland. This article is an open access article distributed under the terms and conditions of the Creative Commons Attribution (CC BY) license.