


Abstract
This study investigated the immobilization of Chlorella sp. in a nylon matrix to analyze its retention behavior and monitor biomass adhesion. Image capture and processing techniques were combined with capacitance measurements over time, using a Python-based data analysis code. The experiment was carried out in a 2 L photobioreactor under controlled conditions (24 °C, continuous aeration at 9.31 L/min, and light intensity of 71 μmol m−2 s−1). The methodology allowed for quantification of biomass distribution on the matrix surface, as well as changes in the capacitance and optical density of the microalgal culture. The results indicated maximum growth around day 15, showing a strong correlation between optical density (absorbance at 686 nm), image analysis of the matrix, and capacitance records. At this point, absorbance reached 3.913, coverage of 24.56% on the nylon matrix, and capacitance of 375.9 μF. Capacitance measurement proved to be a useful indirect tool to estimate biomass adhesion, while image analysis provided spatial distribution. The observed upward trend in process variables highlights the potential of electrical parameters, such as capacitance, for monitoring microalgal immobilization in suspended systems without altering biofilm structure. This approach supports future applications in scaling processes for bioactive compound production or environmental treatment systems.
1. Introduction
The global microalgae market size was estimated at USD 12.81 billion in 2024 and is projected to increase from USD 13.85 billion in 2025 to approximately USD 27.54 billion in 2034, with a compound annual growth rate (CAGR) of 7.95% between 2025 and 2034 [1]. North America dominated the microalgae market with a share of 37.2% in 2024 [2].
Microalgae provide benefits for humans and ecosystems, as they absorb carbon dioxide and release oxygen during photosynthesis. In addition, microalgae have gained particular interest in several biotechnological applications. Biofuel production is among the most sought-after applications. For instance, Ananthi et al. [3] presented a realistic scenario for microalgae-based biodiesel as a third-generation biofuel, while Ganesan et al. [4] provided a comprehensive review of its potential and challenges. Khoo et al. [5] emphasized strategies such as genetic modification to enhance lipid production, whereas Peng et al. [6] highlighted the environmental benefits of microalgal biofuels. More recently, Sathya et al. [7] discussed the research gaps and technical barriers that must be overcome for large-scale adoption.
Bioremediation is another widely studied application. Devi et al. [8] demonstrated the dual role of microalgae in removing pollutants from tannery wastewater while producing value-added compounds. Kashem et al. [9] analyzed their role in treating brackish aquaculture wastewater. Tambat et al. [10] reported the successful removal of molybdenum pollutants, and Khan et al. [11] provided a broader perspective on the treatment of pharmaceutical wastewater using microalgal systems. The ability of microalgae to generate value-added compounds has been highlighted by several authors. Beyond their use in wastewater treatment [8], Maghzian et al. [12] explored pathways to efficiently obtain commercial products. Pradhan et al. [13] reviewed pretreatment strategies for improving recovery, while Sun et al. [14] focused on CO2 conversion into high-value bioproducts. Ezhumalai et al. [15] discussed their role in a circular bioeconomy, Li et al. [16] emphasized nutrient recovery from wastewater, and Katiyar and Arora [17] identified microalgal lipids with health-promoting properties.
In Colombia, the main reports on microalgae use are concentrated in the Caribbean Coast region, particularly as feed in aquaculture production systems [18,19]. In the industrial sector, microalgae have been investigated for biodiesel production [20], while in the food sector, they are employed as dietary supplements for disease prevention and health improvement [21].
The global market is distributed among various species of microalgae, including Spirulina, Chlorella, Nannochloropsis, Haematococcus, Isochrysis, and Chlamydomonas, among others [15]. These species are used in food and feed applications. Ezhumalai et al. [15] underlined their role in sustainable biomass utilization, while Castro et al. [22] compared protein production potential in Spirulina and Chlorella strains for nutritional purposes. The global market has experienced significant growth in recent years, driven by increasing research and development in nutrients such as proteins and vitamins derived from these species [1].
The development of technologies for large-scale production of biobased compounds using microalgae requires systems capable of maintaining high cell concentrations during processing. For this purpose, immobilization systems are employed, which enhance biomass concentration while protecting cells through immobilization matrices. These systems reduce substrate and product inhibition, extend growth periods, improve metabolic activity, increase productivity, and facilitate separation processes, leading to clarified end-products. Immobilization technology also addresses concerns related to stability, cell viability, economic benefits through repeated use and recovery, reduced operating times, lower production costs, and the feasibility of batch processes [23].
In the literature, microalgal immobilization has been reported for Nannochloropsis sp. encapsulated in sodium alginate gel, and similarly, Scenedesmus sp. cells were immobilized in alginate gel spheres [24]. Other techniques include chemical binding, which involves covalent bonds or cross-linking agents such as glutaraldehyde and photo-crosslinkable resins; however, this approach may damage the cell surface and drastically reduce the viability of living microalgae [25].
Ionic attraction has also been used as an immobilization method, as it produces less impact on cell viability, although its effectiveness depends on the pH and ionic strength of the medium. Another alternative is immobilization using flocculants, where milk casein flocs have served both as immobilization material and biosorbent, capturing up to 67% of microorganisms present in cultures [25]. Adsorption processes on polymeric matrices have also been employed, enabling biomass confinement with low-cost agents such as carboxymethylcellulose [23]. This latter technology involves the synergistic combination of polymeric gel immobilization and adsorption on a nylon mesh.
Immobilization is a technique that confines biomass (microorganisms or enzymes) within a defined spatial domain by physical or chemical means, preventing free movement while maintaining activity and facilitating separation and recovery [26]. This process is affected by the reversible adhesion of cells to supports through weak bonds such as hydrogen bonds, Van der Waals forces, and hydrophobic interactions [23].
Despite the wide range of technologies presented in the literature, there are limitations in quantifying microorganisms and their adhesion on surfaces, due to variable culture conditions, rapid growth rates, and interspecies differences.
In this study, the immobilization process of Chlorella sp. was evaluated to determine its immobilization rate in relation to capacitance measurements. A correlation was established between growth parameters and quantitative analysis of immobilized surface areas through the development of a code that identifies regions with higher cell density, as well as surface changes on the nylon polymeric matrix. This approach presents an alternative for monitoring the immobilization of microalgal species in submerged systems, with potential industrial applications in metabolite production, wastewater treatment, and effluent recovery.
2. Materials and Methods
2.1. Chlorella sp.
The microalgal strain used for the immobilization process was Chlorella sp., obtained from the culture collection of the Centro de Estudios e Investigación en Biotecnología (CIBIOT), Universidad Pontificia Bolivariana (Medellín, Colombia). The process was conducted in sterile 1.5 L reactors, using the addition of 0.5 g/L of N.P.K. foliar fertilizer liquid (16:16:12) (Vanofis, Colombia) as the culture medium. The initial electrical conductivity of the formulated medium was measured at 0.94 mS/cm, and the initial pH was 6.8 ± 0.2, within the optimal range for Chlorella sp. cultivation. The cultures were maintained under continuous aeration at 9.31 L/min using a cylindrical sparger system of porous ceramics, a temperature of 24 °C, and continuous illumination, allowing growth over a period of 15 days.
2.2. Kinetics of the Growth Process of Chlorella sp.
For the control experiment, the growth kinetics of Chlorella sp. were monitored in a 2 L bioreactor with an effective working volume of 1.6 L, under the same operational conditions described in Section 2.1. Samples of 10 mL were taken every 24 h, homogenized, and subjected to spectral scanning using a UV-Vis spectrophotometer (Shimadzu, UV-160IPC, Kyoto, Japan) in the range of 400–700 nm to identify turbidity changes. Growth kinetics were tracked through optical density at the characteristic wavelength determined by the spectral scan.
2.3. Immobilization of Chlorella sp.
The microalga Chlorella sp. was immobilized on a nylon polymeric matrix submerged in a 2 L photobioreactor (operating volume 1.6 L), following the methodology described by [23]. Carboxymethylcellulose at 1% (w/v) (purity 99.5%, Mundo Huevo, Medellín, Colombia) was added as a polymeric agent, and the system was operated for 15 days.
Immobilization monitoring was performed by capacitance measurements using a digital multimeter (UNI-T, UT89X, Dongguan, China) every 12 h, along with photographic monitoring every 24 h under controlled illumination, intensity, and neutral background. Images were captured with a fixed 12 MP camera (Galaxy S24, Samsung, Seoul, Republic of Korea) equipped with a wide-angle system and 1.5× magnification. Each image was subsequently processed in the analysis environment using the function cv2.imread(). To improve thresholding quality and reduce the impact of digital noise, images were converted to grayscale (cv2.cvtColor) and smoothed with a Gaussian blur filter (cv2.GaussianBlur, kernel 5 × 5), generating grayscale intensity matrices.
All experiments for growth and immobilization of microalgae were conducted in triplicate, with error bars representing the standard deviation of experimental data (mean ± SD).
2.4. Dynamic Similarity Analysis Between Growth and Immobilization Processes
To compare the dynamic similarity and behavioral patterns among three variables of bioprocess monitoring—A (absorbance at 686 nm of the culture without immobilization), I (capacitance of the immobilized culture, μF), and C (capacitance of the non-immobilized culture, μF)—an analytical procedure was developed to evaluate temporal and dynamic similarity among these data series, considering the complete 15-day experimental period. Each variable was normalized on a scale from 0 to 1 to facilitate comparison.
2.4.1. Calculation of Second-Order Derivatives
To capture the dynamics of change and acceleration of the process, the second numerical derivative of each variable with respect to time was calculated. Since the sampling intervals were not uniform, a finite-difference scheme for non-uniform grids was employed, based on second-order interpolation. The second derivative at the point was estimated as a weighted average between forward and backward differences, as shown in Equation (1).
where
- : current position in the temporal axis (days) corresponding to the point of interest in the series.
- , : positions prior and posterior to , respectively.
- : value of the analyzed variable (A, I, o C) at time .
- , : values of the variable at the previous and next time points.
- : estimated second derivative of variable with respect to time at point , representing the acceleration of change or the local curvature of the series.
This procedure was applied to each variable (A, I, and C), generating three new series: d2A/dt2, d2I/dt2, and d2C/dt2.
2.4.2. Similarity Analysis Using Dynamic Time Warping (DTW)
To evaluate the dynamic similarity between the curves, the Dynamic Time Warping (DTW) algorithm was applied, which allows comparison of time series that may be shifted or exhibit different rates of change [27]. The fastdtw implementation was used to approximate the minimum warping distance with computational efficiency, employing the Euclidean distance metric. DTW distances were calculated between each pair of second derivatives: DTW(d2A/dt2, d2I/dt2), DTW(d2A/dt2, d2C/dt2), DTW(d2I/dt2, d2C/dt2). Each result was expressed as a scalar distance, representing the temporal alignment cost between the two curves.
The analysis was carried out in Python 3.11 (Python Software Foundation, Wilmington, DE, USA), using the algorithm described in Code 1, and employing the libraries pandas (v2.2.2), NumPy (v2.0.2), fastdtw (v0.3.4), and matplotlib (v3.10.0). The time series were analyzed from a structured Microsoft Excel 2021 file (.xlsx) (Microsoft Corporation, Redmond, WA, USA), containing one column for the sampling days and one column for each variable (A, I, and C).
| Code 1. Python 3.11 algorithm for DTW calculation import pandas as pd from fastdtw import fastdtw import numpy as np def custom_euclidean_distance(x, y): return np.sqrt(np.sum((x − y)**2)) file_name = “data.xlsx” df = pd.read_excel(file_name) required = {‘A’, ‘I’, ‘C’} missing = required − set(df.columns) if missing: raise ValueError(f”Missing required columns in the Excel file: {sorted(missing)}”) column_A = df[‘A’].to_numpy() column_I = df[‘I’].to_numpy() column_C = df[‘C’].to_numpy() distance_AI, path_AI = fastdtw(column_A, column_I, dist=custom_euclidean_distance) distance_AC, path_AC = fastdtw(column_A, column_C, dist=custom_euclidean_distance) distance_IC, path_IC = fastdtw(column_I, column_C, dist=custom_euclidean_distance) print(f”DTW distance between A and I: {distance_AI}”) print(f”DTW distance between A and C: {distance_AC}”) print(f”DTW distance between I and C: {distance_IC}”) |
2.5. Optical Analysis of Cell Immobilization by Digital Image Processing
To quantify the immobilization area of cells on circular support surfaces, a computational optical analysis procedure was implemented using Python 3.11 with the libraries OpenCV, NumPy, and Matplotlib.
2.5.1. Detection of Dark Zones (Immobilized Biomass)
A thresholding criterion was defined to identify dark regions associated with biomass adhered to the surface. Depending on the experimental configuration, one of the following methods was applied:
- Fixed threshold: a predetermined intensity value (e.g., 50 on a scale from 0 to 255) was applied using the function cv2.threshold() with the option cv2.THRESH_BINARY_INV. Pixels with intensities below the threshold were considered as part of the biomass-covered zones.
- Adaptive threshold (Otsu): alternatively, Otsu’s method (cv2.THRESH_OTSU) was used to automatically calculate the optimal threshold that separates the bimodal distribution of intensities (biomass vs. clean background), avoiding the need for manual calibration.
2.5.2. Spatial Segmentation of the Analysis Region
Since immobilization occurs exclusively within the active area of the nylon mesh (circular in shape), a circular mask centered on the image was defined to restrict the analysis to the region of interest (ROI). This mask was generated using the function cv2.circle() with a radius slightly smaller than half the image width, eliminating irrelevant borders or external areas that could introduce error in the area calculation. Final segmentation of the biomass was obtained through the logical operation cv2.bitwise_and(), applying the circular mask to the thresholded image. This procedure allowed precise isolation of dark zones within the useful analysis area.
2.5.3. Calculation of Coverage Percentage
From the masked image, two metrics were calculated: the total area, defined as the number of active pixels within the circular mask, and the dark area, corresponding to the number of pixels classified as biomass (white value in the inverted mask). The coverage percentage was then determined as the ratio of dark area to total area, expressed as a percentage, as shown in Equation (2).
This value represents a quantitative metric of cell immobilization on the support for each day analyzed.
2.5.4. Visualization and Validation
The procedure included generating three visual panels for each processed image: the original color image, a grayscale image, and an image with dark zones overlaid in red using cv2.addWeighted(). These visualizations allowed validation of segmentation and accurate delimitation of the analysis area, while the threshold value used, the total area, the dark area, and the coverage percentage were displayed as complementary numerical results.
2.5.5. Trend Analysis of Immobilization Process Variables
Results of absorbance, coverage percentage, and capacitance were analyzed using linear regression by least squares and the Mann–Kendall test, in order to establish trend conditions based on Kendall’s tau () direction among variables. The analyses were conducted using a custom Python 3.11 routine, employing NumPy (v1.26), SciPy (v1.11), and pyMannKendall (v1.4) libraries. The code is available upon request to ensure reproducibility.
3. Results and Discussion
3.1. Chlorella sp. Immobilization
The use of Chlorella sp. in cell immobilization processes enables cultivation of the microorganism within a defined space, preserving its biological activities and increasing cell density, which promotes substance exchange and allows cell reuse in the medium. This demonstrates the ability of mixotrophic Chlorella species to remove biological and chemical contaminants from wastewater, where microalgal cells adhere to each other and to external surfaces [28]. Similarly, Hu et al. [29] reported that biomass from co-cultures of Chlorella sp. and bacteria immobilized in polymeric matrices or attached to solid supports in the form of biofilms is widely used for the treatment of municipal, domestic, and swine wastewater. Immobilization offers several advantages when microalgal species are employed for wastewater treatment, including high contaminant removal efficiency, ease of control, and enhanced biomass accumulation.
Cultivation conditions such as nitrogen supplementation (0.5 g/L) from N.P.K. fertilizer (16:16:12) or biostimulation have been used to enhance cell growth rate and biomass productivity in species such as Chlorella vulgaris [30]. These strategies are also considered low-cost alternatives for large-scale algal production, where providing traditional culture media with excess nutrients poses an economic challenge [31].
The aeration value of 9.31 L/min is linked to the bioventing technique, which enhances gas–liquid mass transfer in terms of oxygen and nutrients for microalgal growth. This significantly influences CO2 transport, nutrient availability, and the spatial distribution of microalgal cells in illuminated and dark zones, thereby impacting key biochemical reactions such as photosynthesis [32].
Continuous illumination has also been described as a relevant factor in microalgal biofilm-based cultivation systems. In the case of Chlorella vulgaris, notable tolerance to intense light has been demonstrated, resulting in elevated chlorophyll a production, likely as a protective mechanism against photodamage [33].
3.2. Growth Kinetics of Chlorella sp.
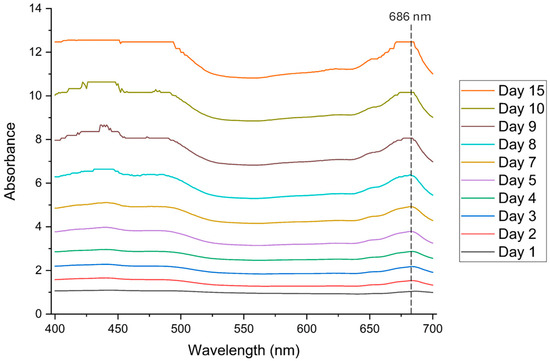
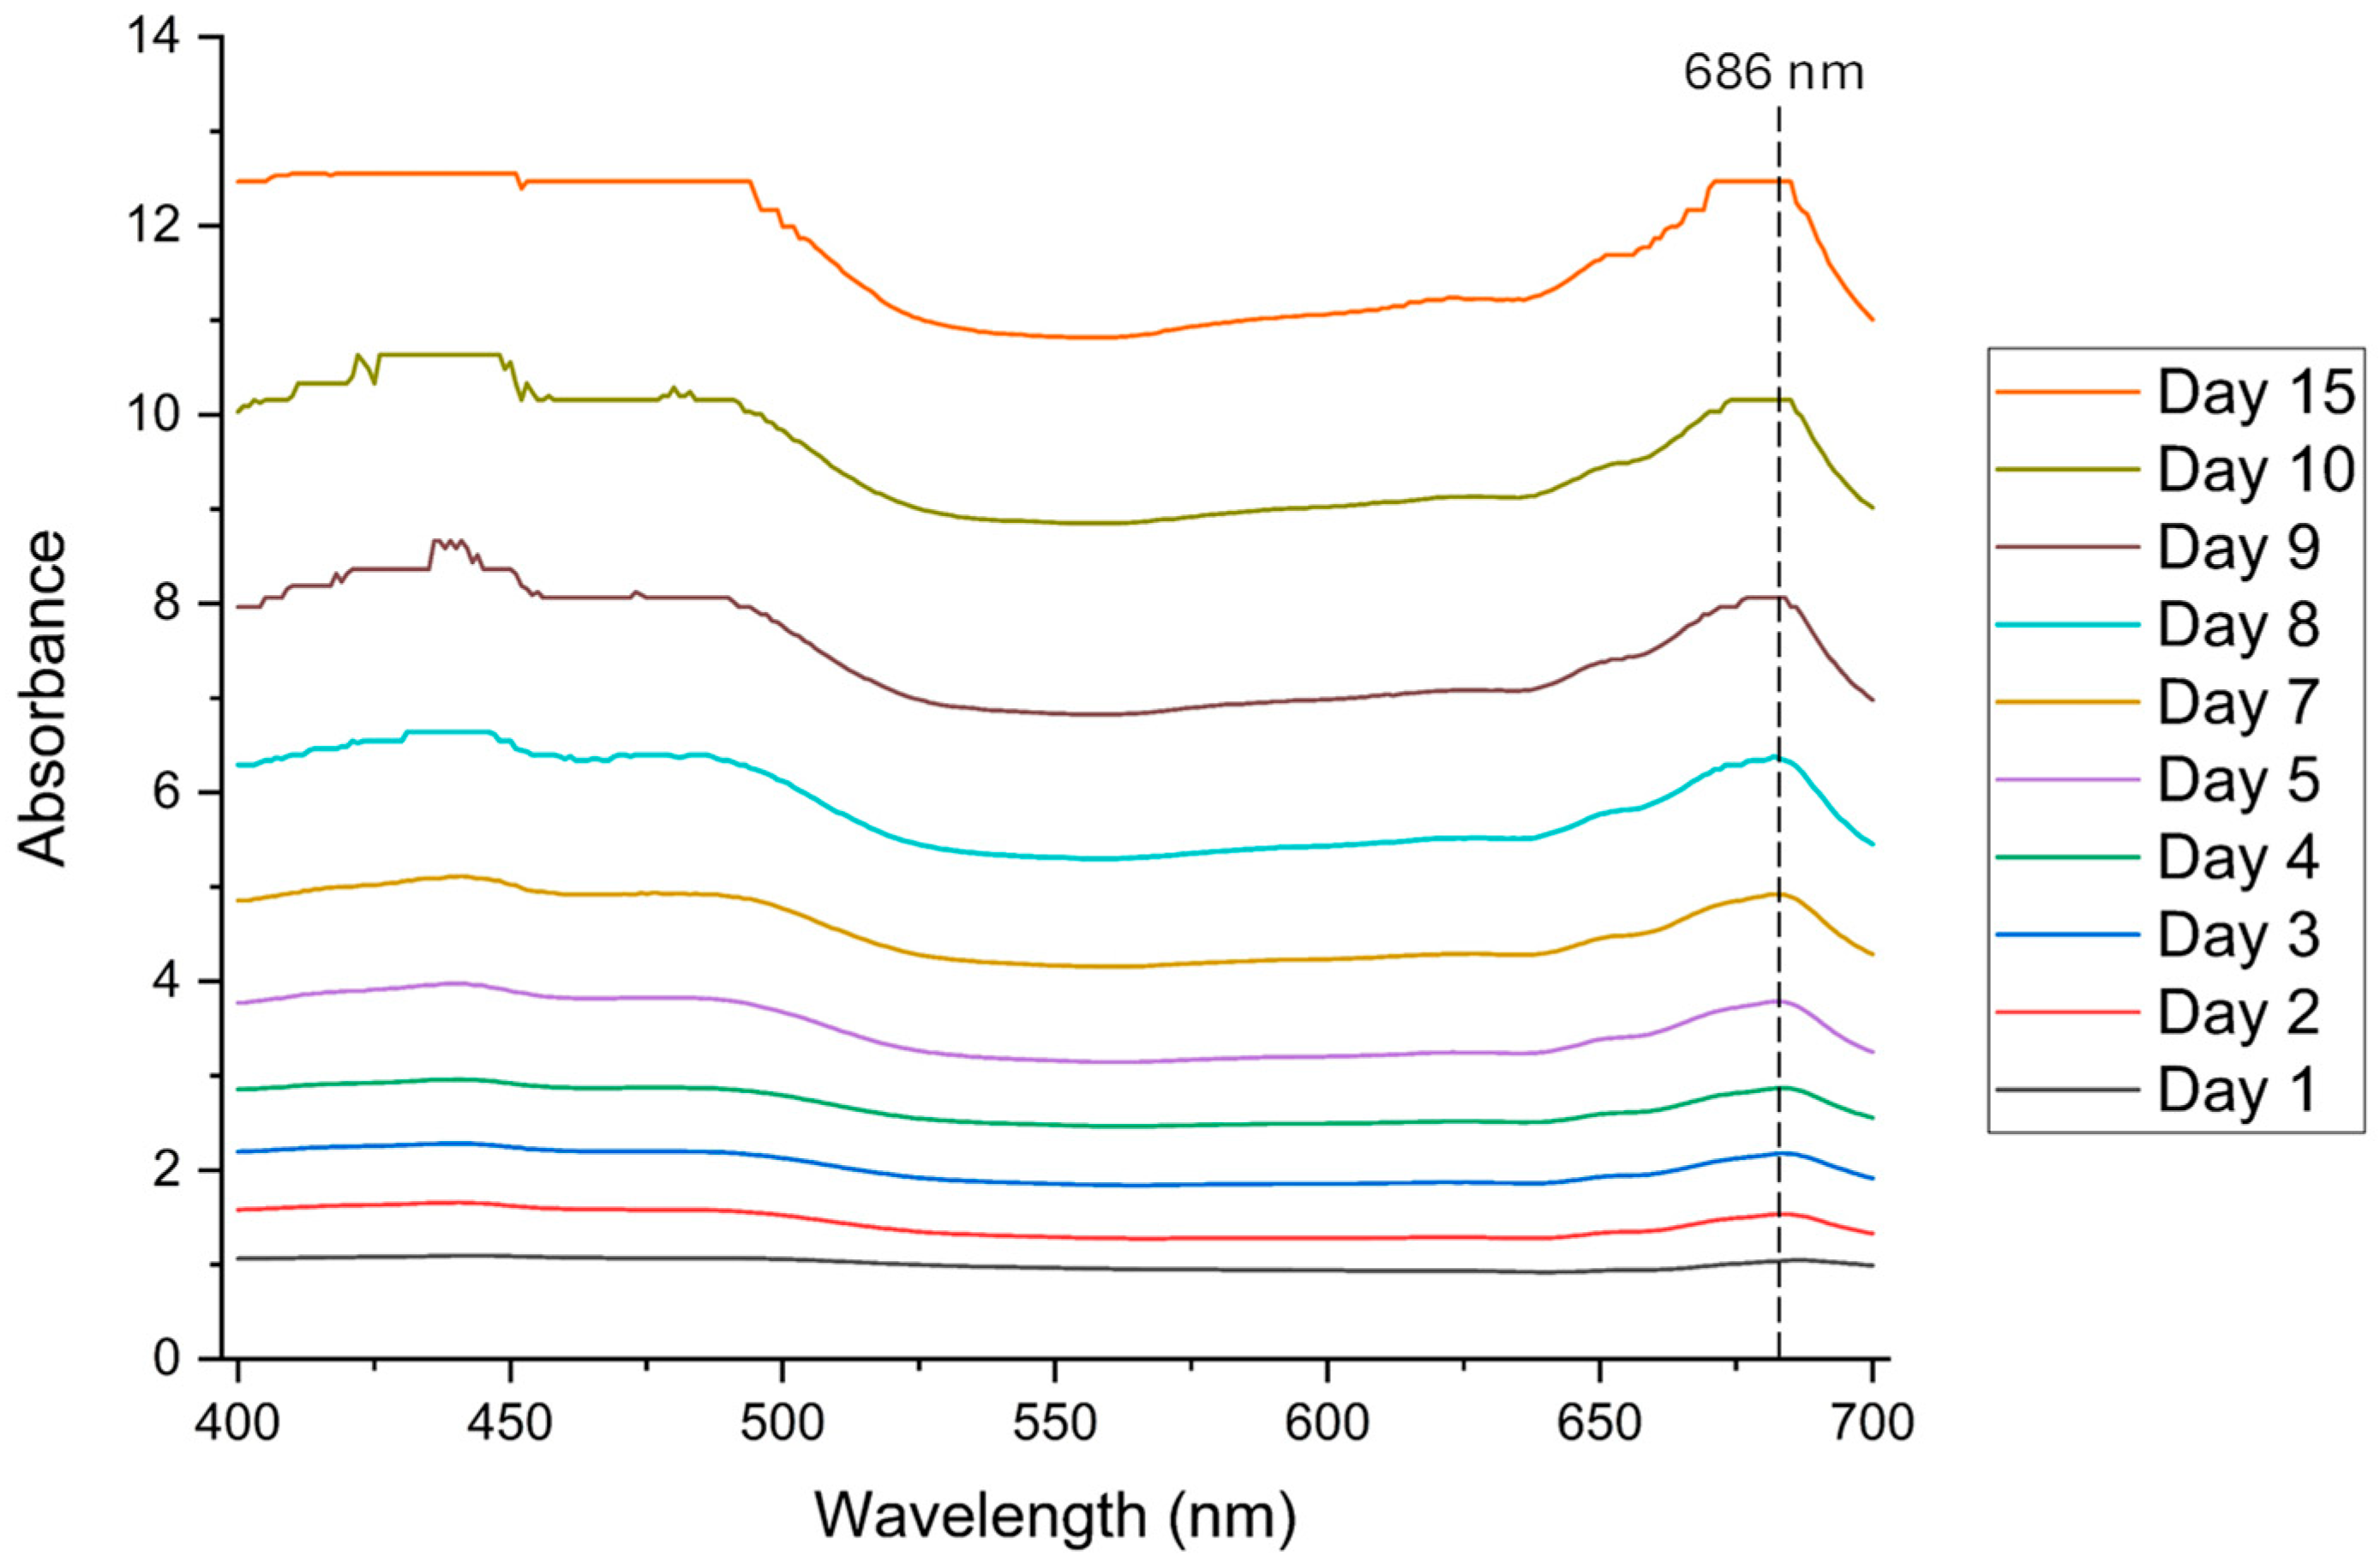
In the growth kinetics of Chlorella sp., spectral changes were identified within the 400–700 nm range during the 15-day immobilization process, as shown in Figure 1. This increase in absorbance was associated with higher optical density of the microalgal culture and the production of active chemical species in the visible spectrum, such as chlorophyll a, chlorophyll b, and related derivatives, including pheopigments a. These compounds are relevant since they represent an indirect measure of biomass production, pigment preservation, and early diagenetic effects [34].
Figure 1.
Spectral scan from 400 to 700 nm during the 15-day immobilization process. Measurements were performed on 10 mL liquid suspension samples. Absorbance peak values at 686 nm are indicated on the plot. The plateau region observed from days 10–15 reflects the genuine instrument response at high cell densities and is reported as-measured; samples were not diluted since the objective of this scanning was qualitative trend monitoring, not quantitative biomass calibration.
In Figure 1, the appearance of a characteristic wavelength at 686 nm is observed. This wavelength has been reported in the literature as one of the main peaks associated with chlorophyll production and is particularly sensitive for quantifying concentrations of species such as Chlorella vulgaris [35] and Chlorella sorokiniana [36].
Additionally, in the spectral scan of the immobilization process, a peak at 686 nm was evident, displaying a microalgal growth pattern consistent with systems adapted to photobioreactors supplemented with nitrogen and other nutrients. Similar findings were reported by Ma and Jian [37], who modeled the growth of Chlorella sp. with a logistic-type behavior, showing a progressive increase in optical density over time and highlighting the relevance of variables such as medium pH, nitrogen concentration, inoculum concentration, and temperature.
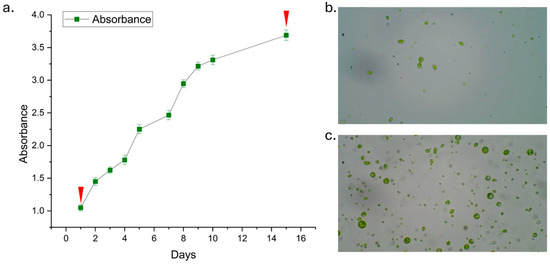
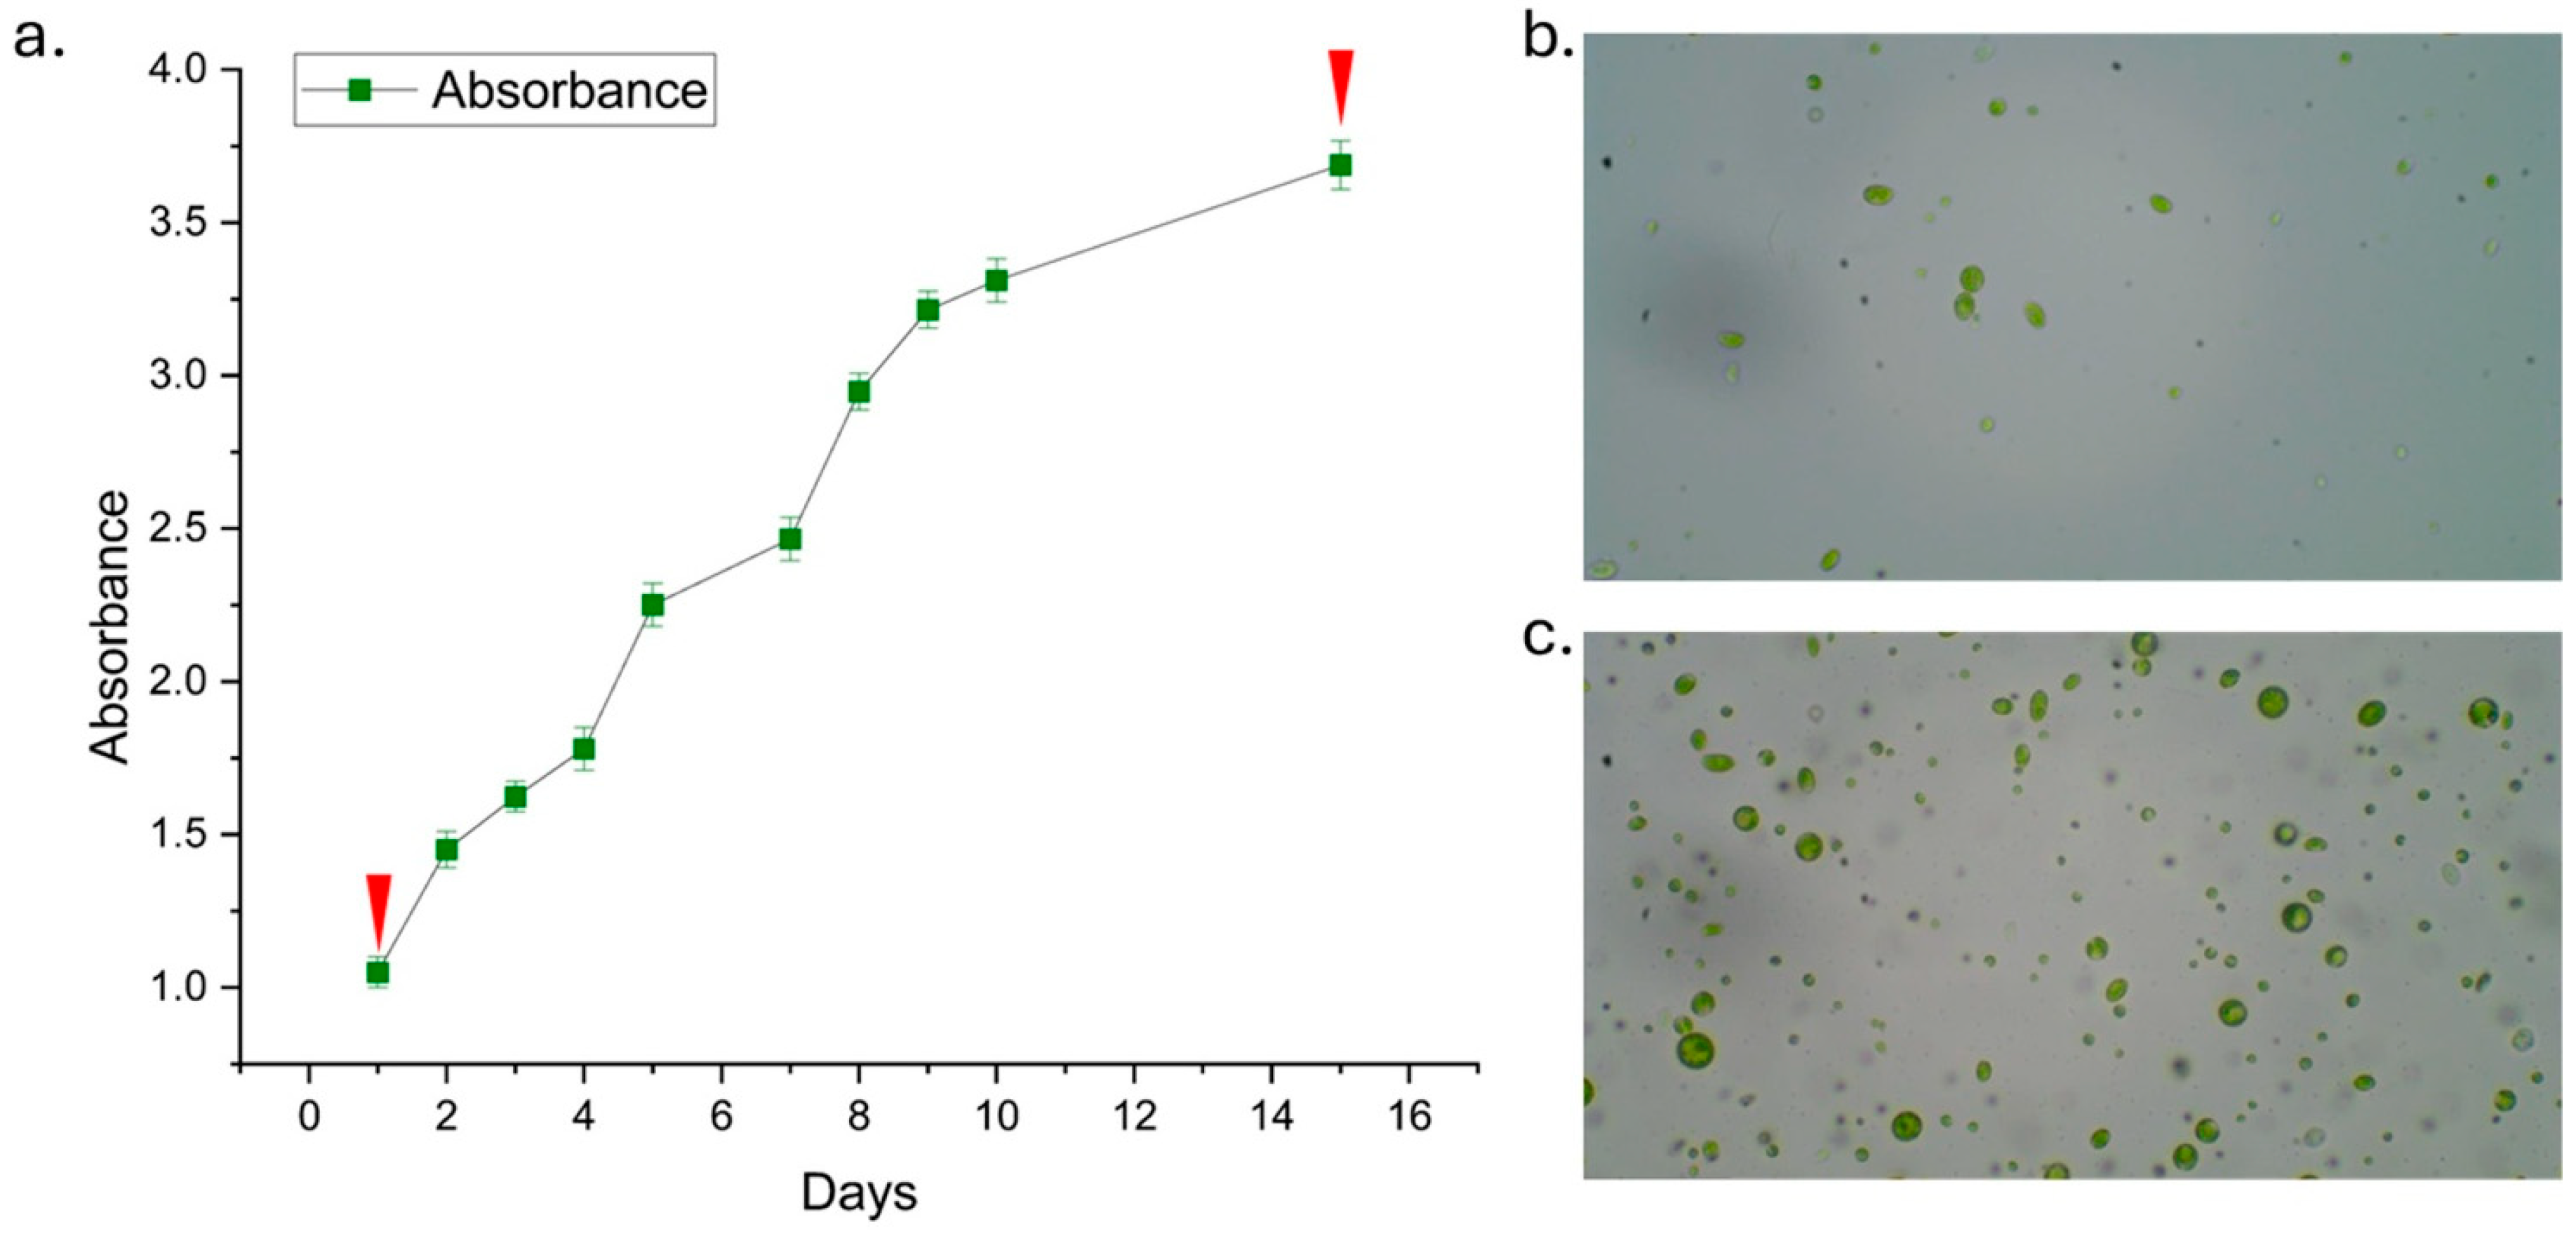
Figure 2 shows the microalgal growth kinetics in the immobilization system at 686 nm.
Figure 2.
(a) Growth kinetics by cell density at 686 nm. (b) Microscopic image of Chlorella sp. on day 1, corresponding to the first red marker in (a). (c) Microscopic image of Chlorella sp. on day 15, corresponding to the second red marker in (a).
For Figure 2b,c, although no phenotypic changes were identified in the microorganism, after 15 days in the immobilization system, an increase in cell density and cell size was observed. This may indirectly reflect the state of microscopic particles in the culture, the accumulation of intracellular metabolites, and the metabolic activity involved in substrate transformation and energy generation [38].
Monitoring the growth kinetics of microalgae at a specific wavelength allows estimation of biomass accumulation yield, which is the product of the total number of cells in the culture and the average weight of a single unit cell [38].
3.3. Immobilization of Chlorella sp.
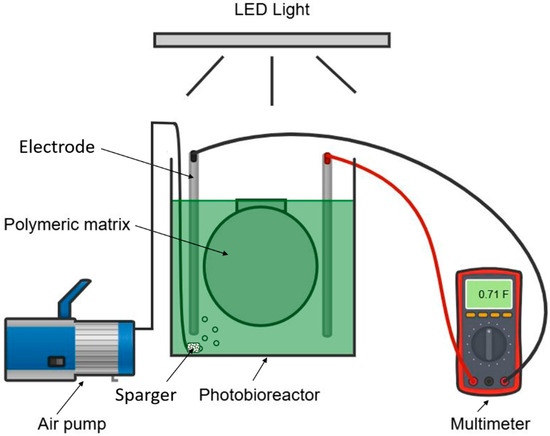
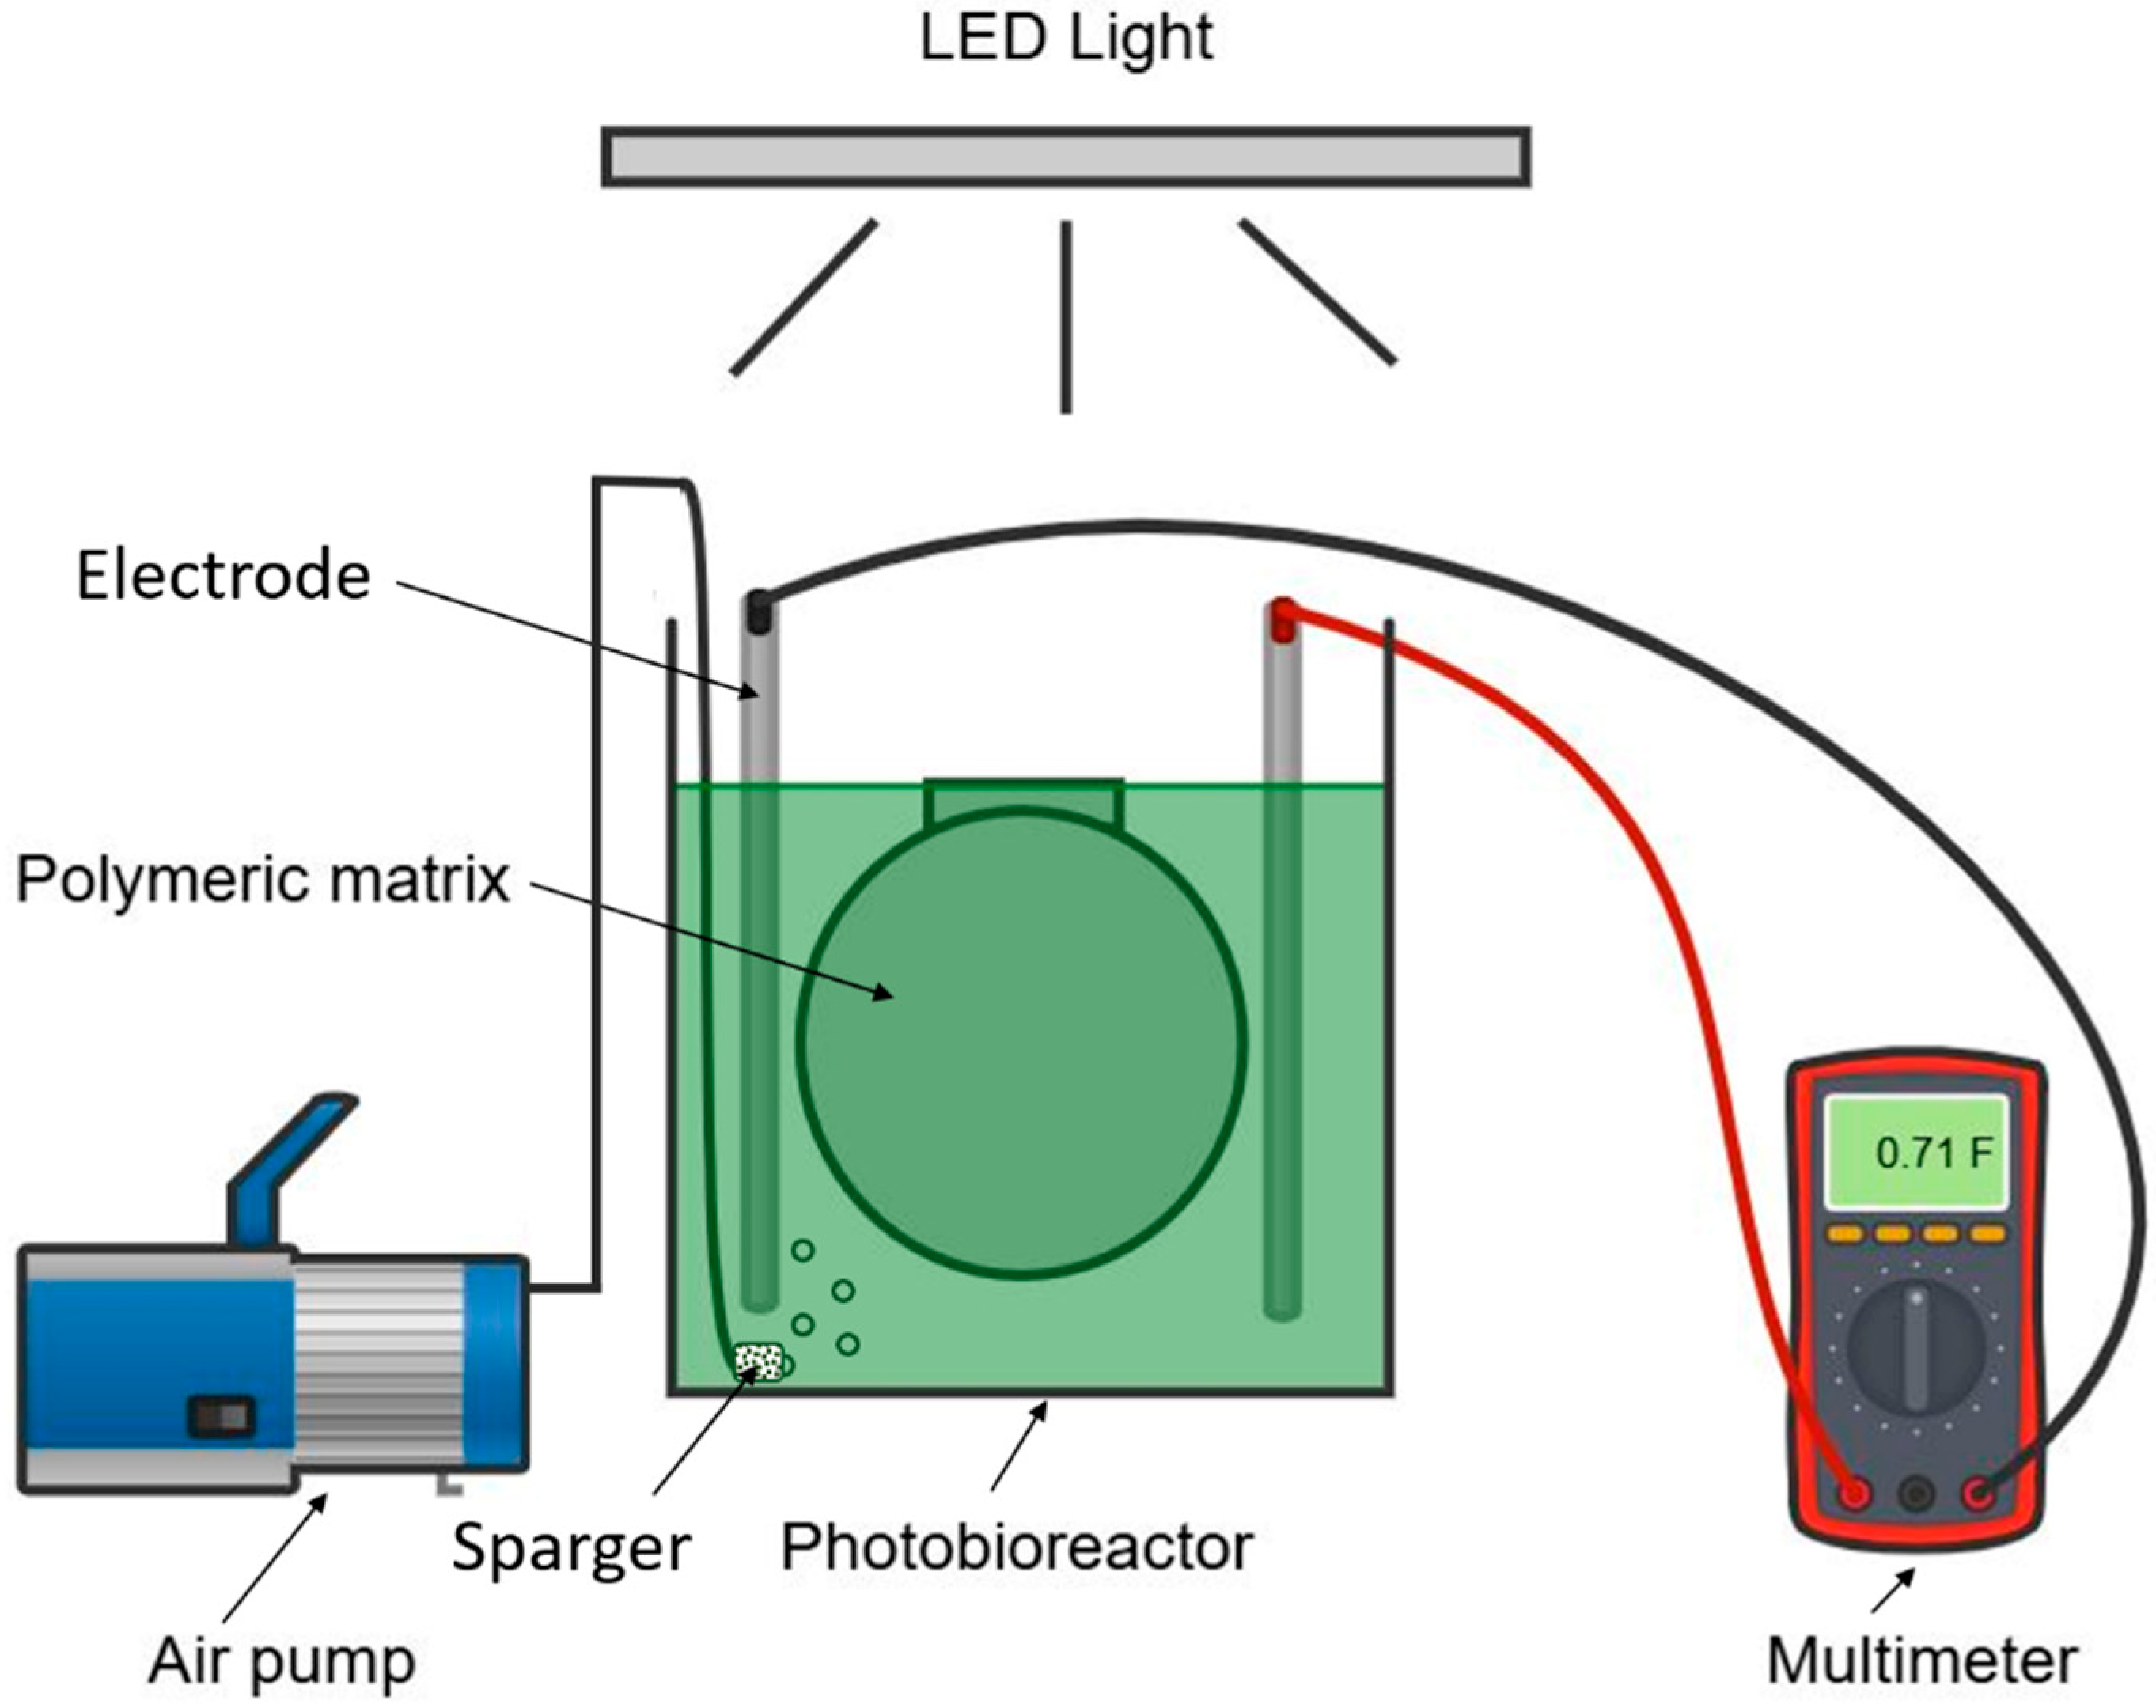
The immobilization process was carried out as described in Section 2.3, where the working volume was adjusted to 1.6 L to cover the entire area of the polymeric matrix in the photobioreactor and to achieve adhesion of the microalga in different segments of the matrix, as shown in Figure 3.
Figure 3.
Schematic diagram immobilization Chlorella sp. at laboratory scale.
In this study, carboxymethylcellulose was used to assist immobilization by adhesion onto the polymeric matrix (nylon). Previous studies have reported the use of carboxymethylcellulose as an immobilization and encapsulation polymer for microalgal species such as Spirulina maxima and aggregated algal consortia [39], Chlorella vulgaris [40], Lobosphera sp. [41], among others. This polymer enables microalgal cells to be trapped through a gelatinization or cross-linking process, as well as the formation of biomass layers over the pores of the polymer [39]. The structural stability of Chlorella sp. adhesion to the nylon matrix under comparable conditions has been previously characterized through SEM micrographs in our prior work [23], confirming that immobilized cells remain anchored to the polymer surface after 15 days of operation, and supporting the reliability of this system as a platform for the monitoring strategy presented here.
In addition, image analysis was employed to estimate biomass growth, similar to the method used by Acevedo et al. [42], in which immobilization rates before and after the growth of yeast strains were calculated by correlating the intensity of primary colors (red, green, and blue) with biomass concentration.
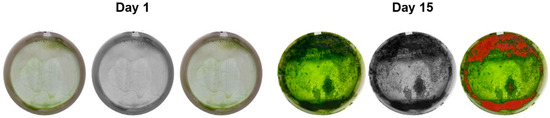
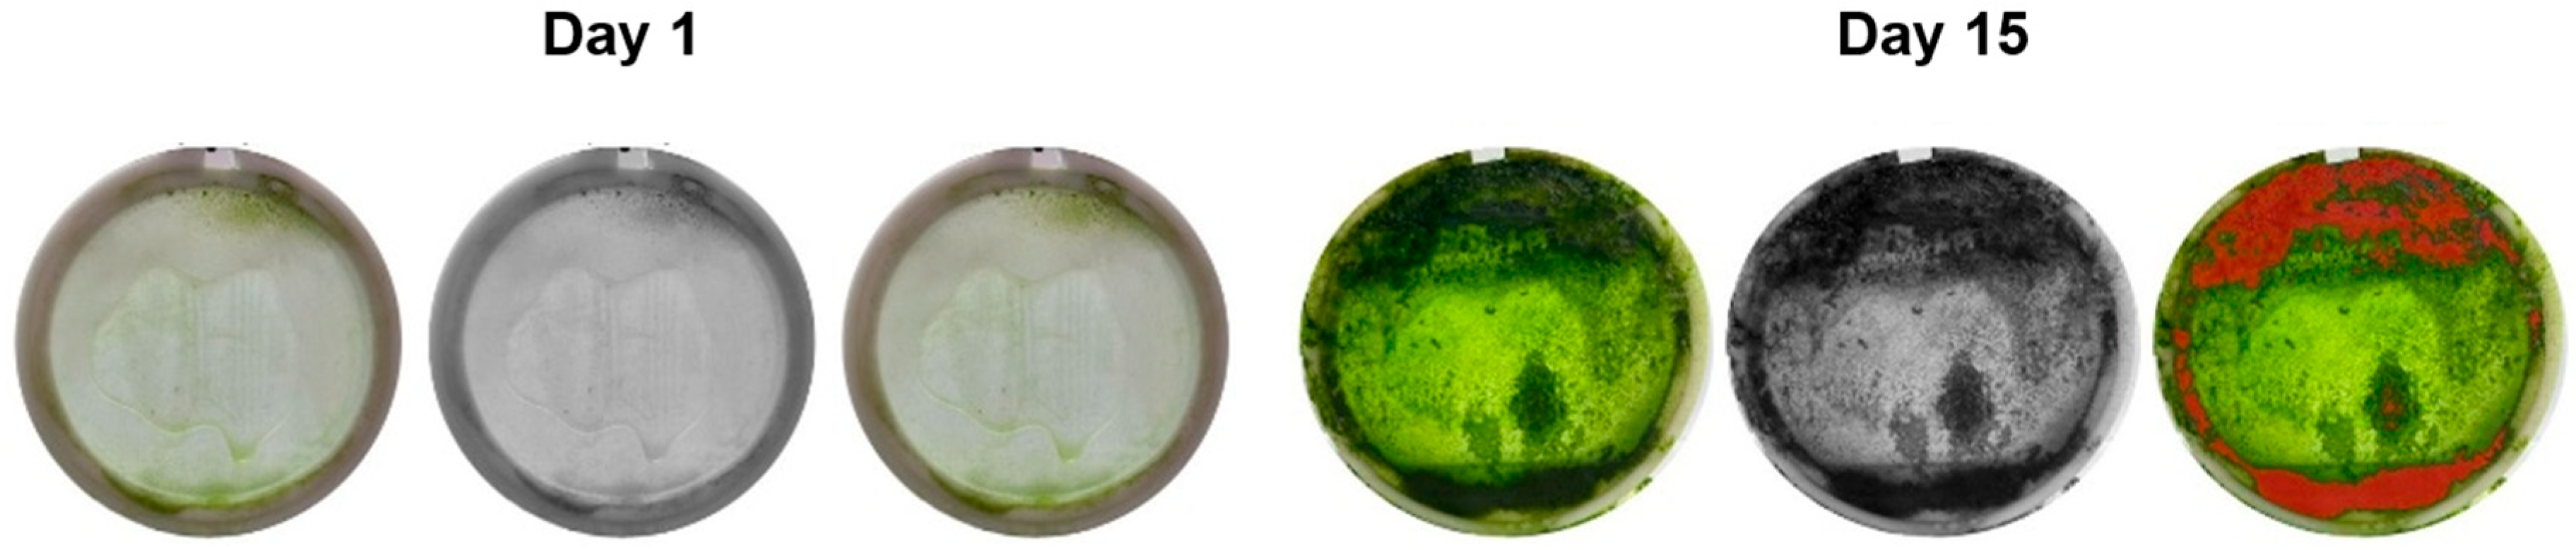
The image analysis results are presented in Figure 4, where the spatial segmentation of immobilized regions is shown in orange, corresponding to areas of higher resolution in the study of microalgal immobilization.
Figure 4.
Photographic analysis for the identification of regions with higher cell density. Each day is represented by three images: on the left, the immobilization mesh; in the center, the grayscale-transformed image; and on the right, the processed image obtained using the Python routine to identify immobilized areas. Additional photographs for the remaining days of the immobilization process are provided in the Supplementary Material (see Supplementary Material, Figure S1 for details).
In Figure 4, it is shown that biomass retention increased progressively over time through cell adhesion to the nylon matrix. This behavior is attributed to the capacity of species such as Chlorella sp. to adhere to hydrophilic materials [43] and rough surfaces [44,45], both characteristics of nylon, which also facilitates nutrient diffusion in the medium and light penetration.
During the formation of the microalgal biofilm, cells produce compounds such as negatively charged carboxyl or phosphate groups, polysaccharides, proteins, nucleic acids, lipids, and phospholipids, which play an important role in nutrient exchange and are responsible for cell cohesion and adhesion. These processes have been reported in studies evaluating the growth of species such as Chlorella trebouxioides, Chlorella luteroviridis, Stichococcus bacillaris, and Scenedesmus obliquus, among others [46].
In addition to photographic monitoring for indirect quantification of biomass adhesion, the inclusion of electrical capacitance as a monitoring variable represents a significant contribution to online control of microalgal immobilization. Similarly to previous studies estimating biomass in suspended microalgae [47], this technique, based on indirect signals, offers an alternative to represent biomass accumulation.
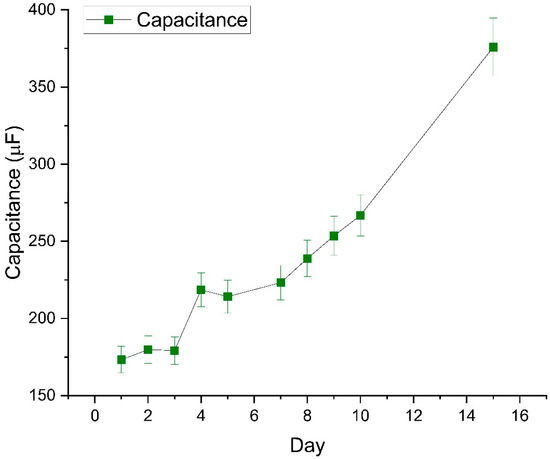
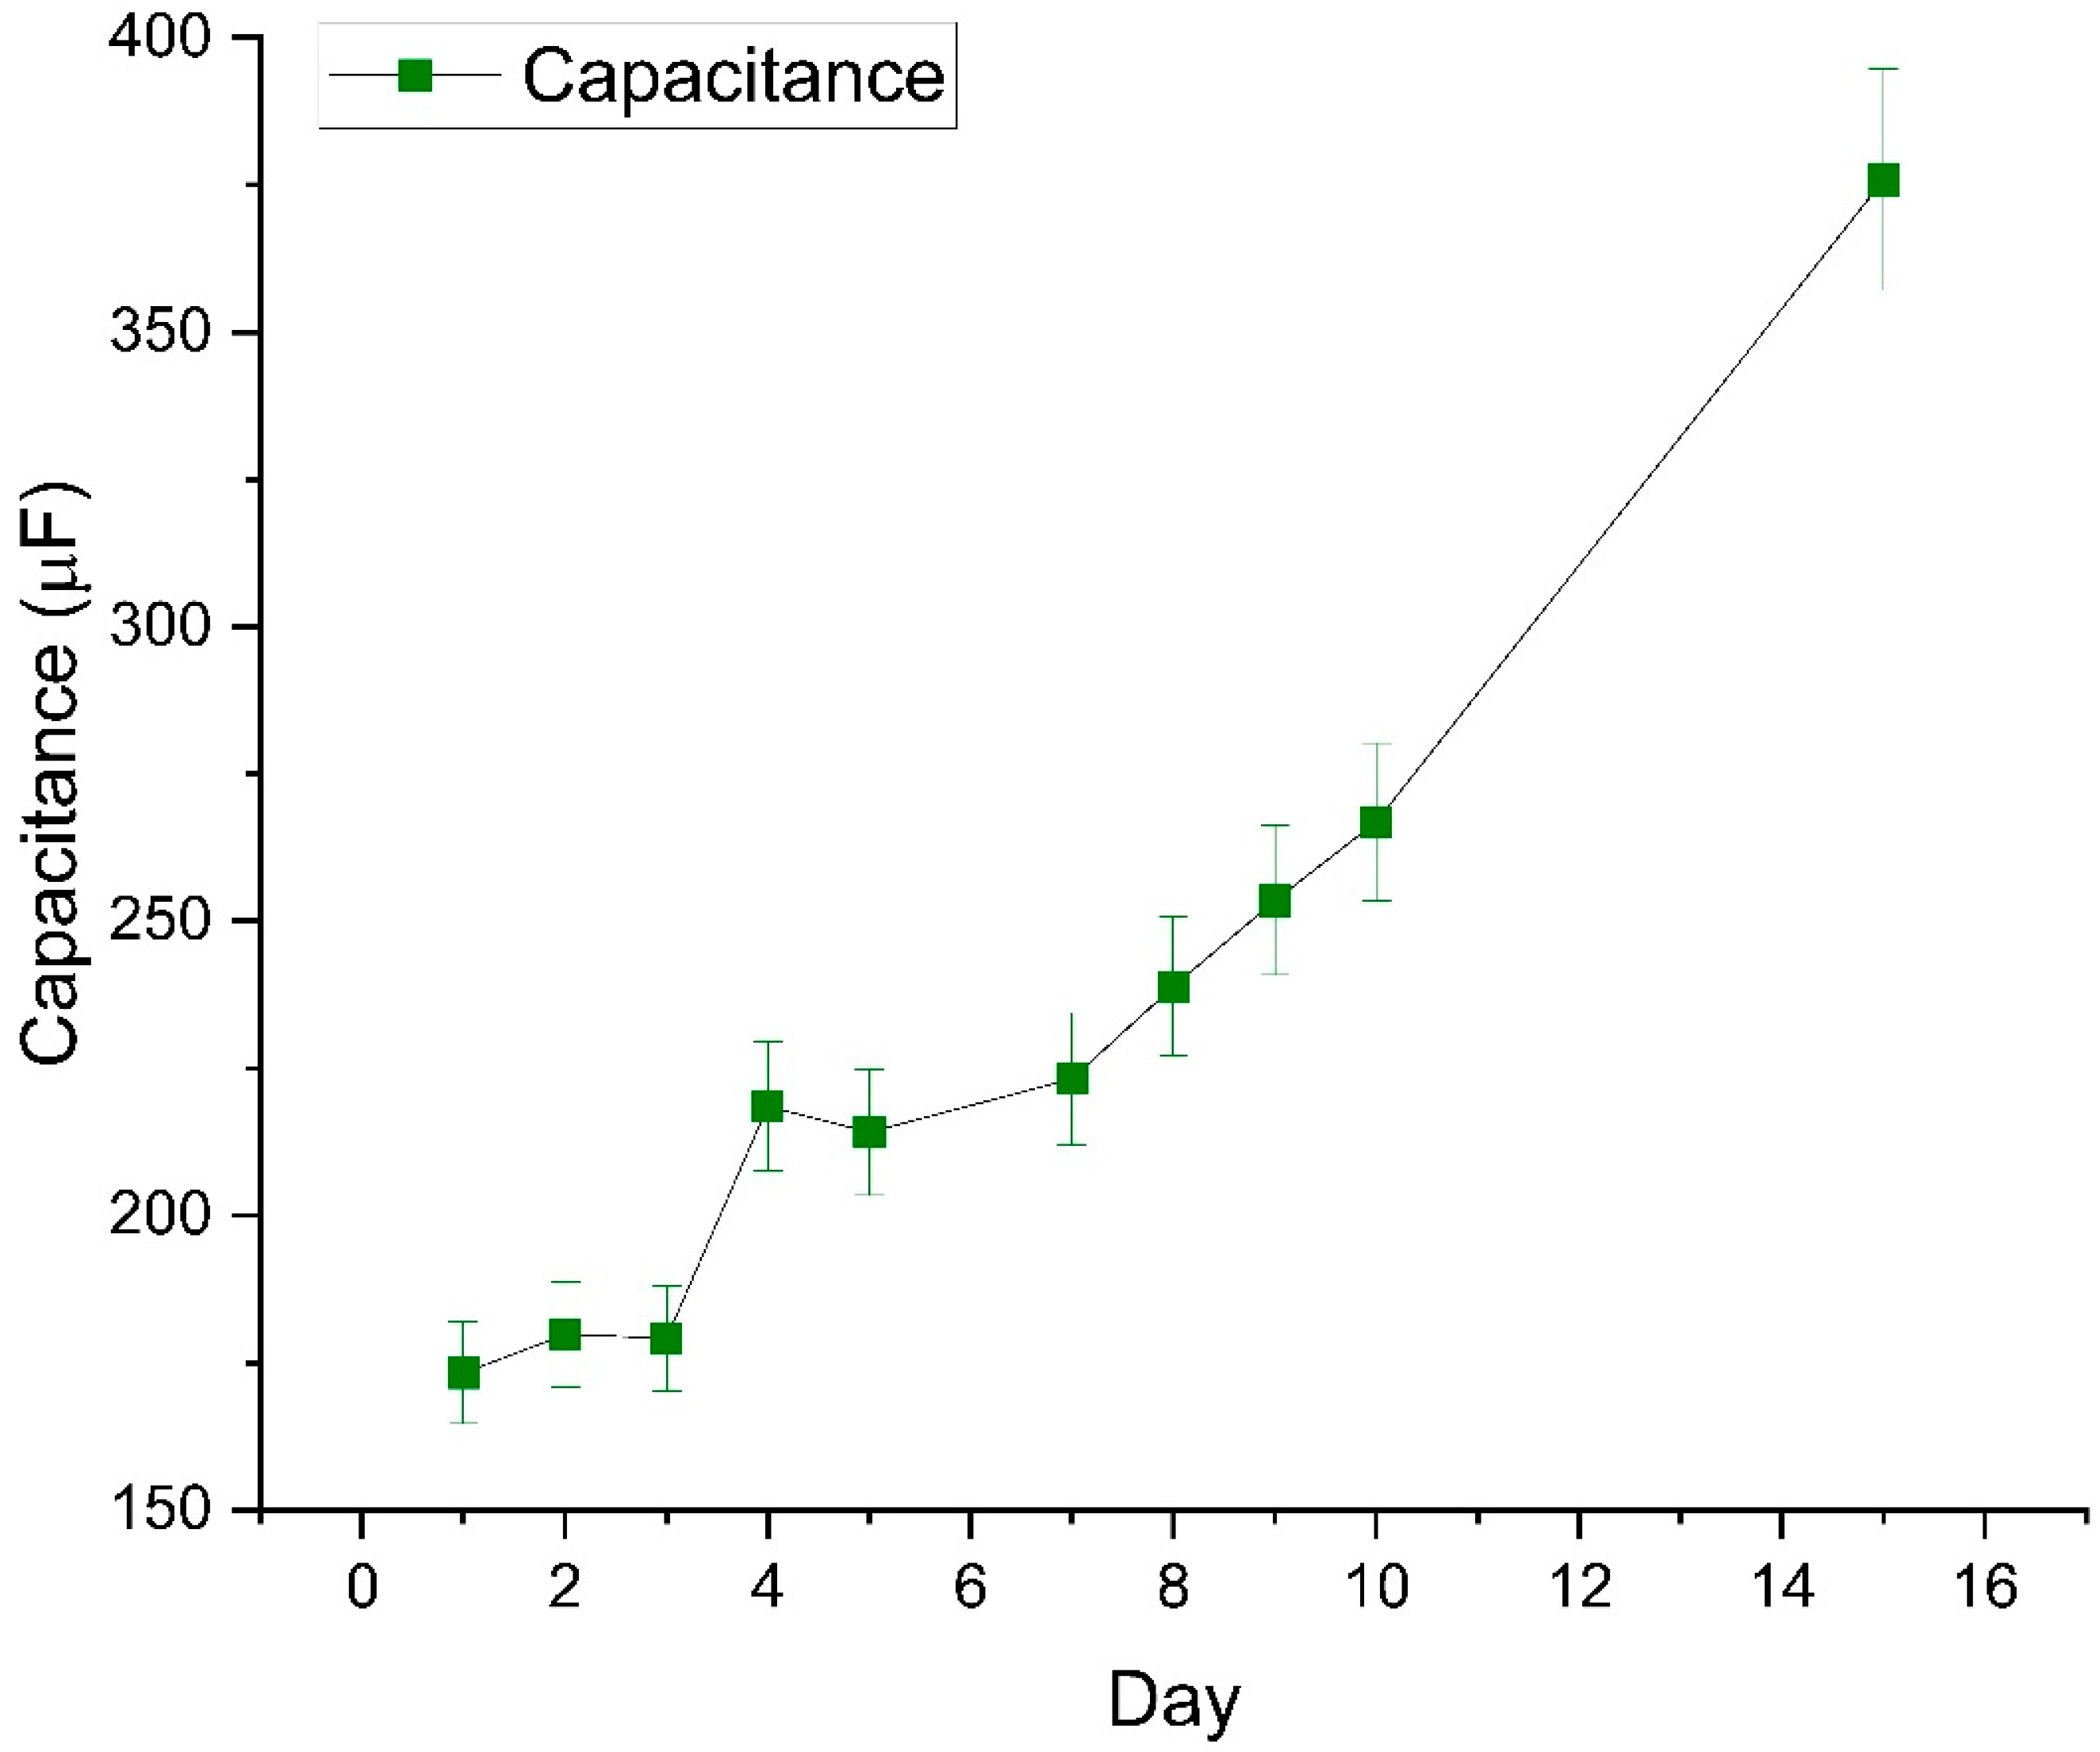
In this study, system capacitance showed a progressive increase during the 15 days of immobilization, from 173.3 μF on day 1 to 375.9 μF on day 15. Figure 5 presents the capacitance monitoring.
Figure 5.
Monitoring of capacitance in the immobilization system of Chlorella sp.
As shown in Figure 5, capacitance exhibited a proportional trend relative to the biomass accumulation observed on the nylon matrix (see Supplementary Material, Figure S1). This progressive increase in capacitance is driven by the cumulative effect of multiple physicochemical changes during biomass growth and immobilization. The UT89X digital multimeter measures capacitance via DC charging—determining the RC time constant needed to charge the circuit to a reference voltage threshold—and is therefore sensitive to the overall dielectric and conductive state of the system [48]. As microalgal biomass and associated biopolymers (CMC, lipids, polysaccharides, and extracellular matrix compounds) progressively accumulate on the nylon matrix, the following factors collectively contribute to the observed rise: (i) changes in bulk ionic conductivity of the medium as cells consume nutrients and excrete metabolic byproducts; (ii) modification of the electrode-medium interface geometry by biofouling; and (iii) the intrinsic dielectric response of microalgal cells, whose phospholipid membranes and lipid bodies influence interfacial polarization under an applied electric field [49]. This capacitance-biomass relationship is consistent with reported positive correlations between living cell density and measured capacitance in submerged biofilm systems, confirming its value as a process-level proxy variable [49]. These results are consistent with the photographic records of retained biomass density. The combined monitoring of electrical and photographic variables therefore provides insights not only into biological parameters, such as cell count and viability, but also into physiological parameters, including substrate concentrations, metabolites, and potentially products. Furthermore, in cell culture applications, a wide range of physicochemical parameters such as pH, temperature, and osmolarity are routinely monitored [48].
3.4. Dynamic Similarity Analysis Between Growth and Immobilization Processes
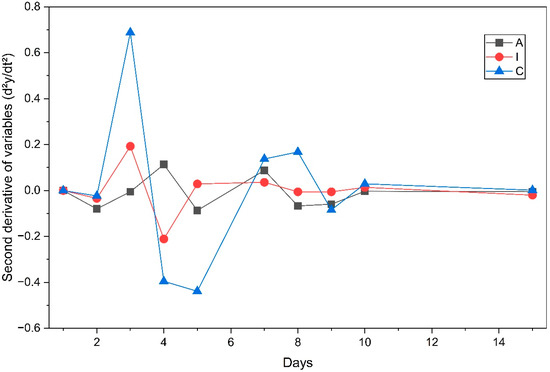
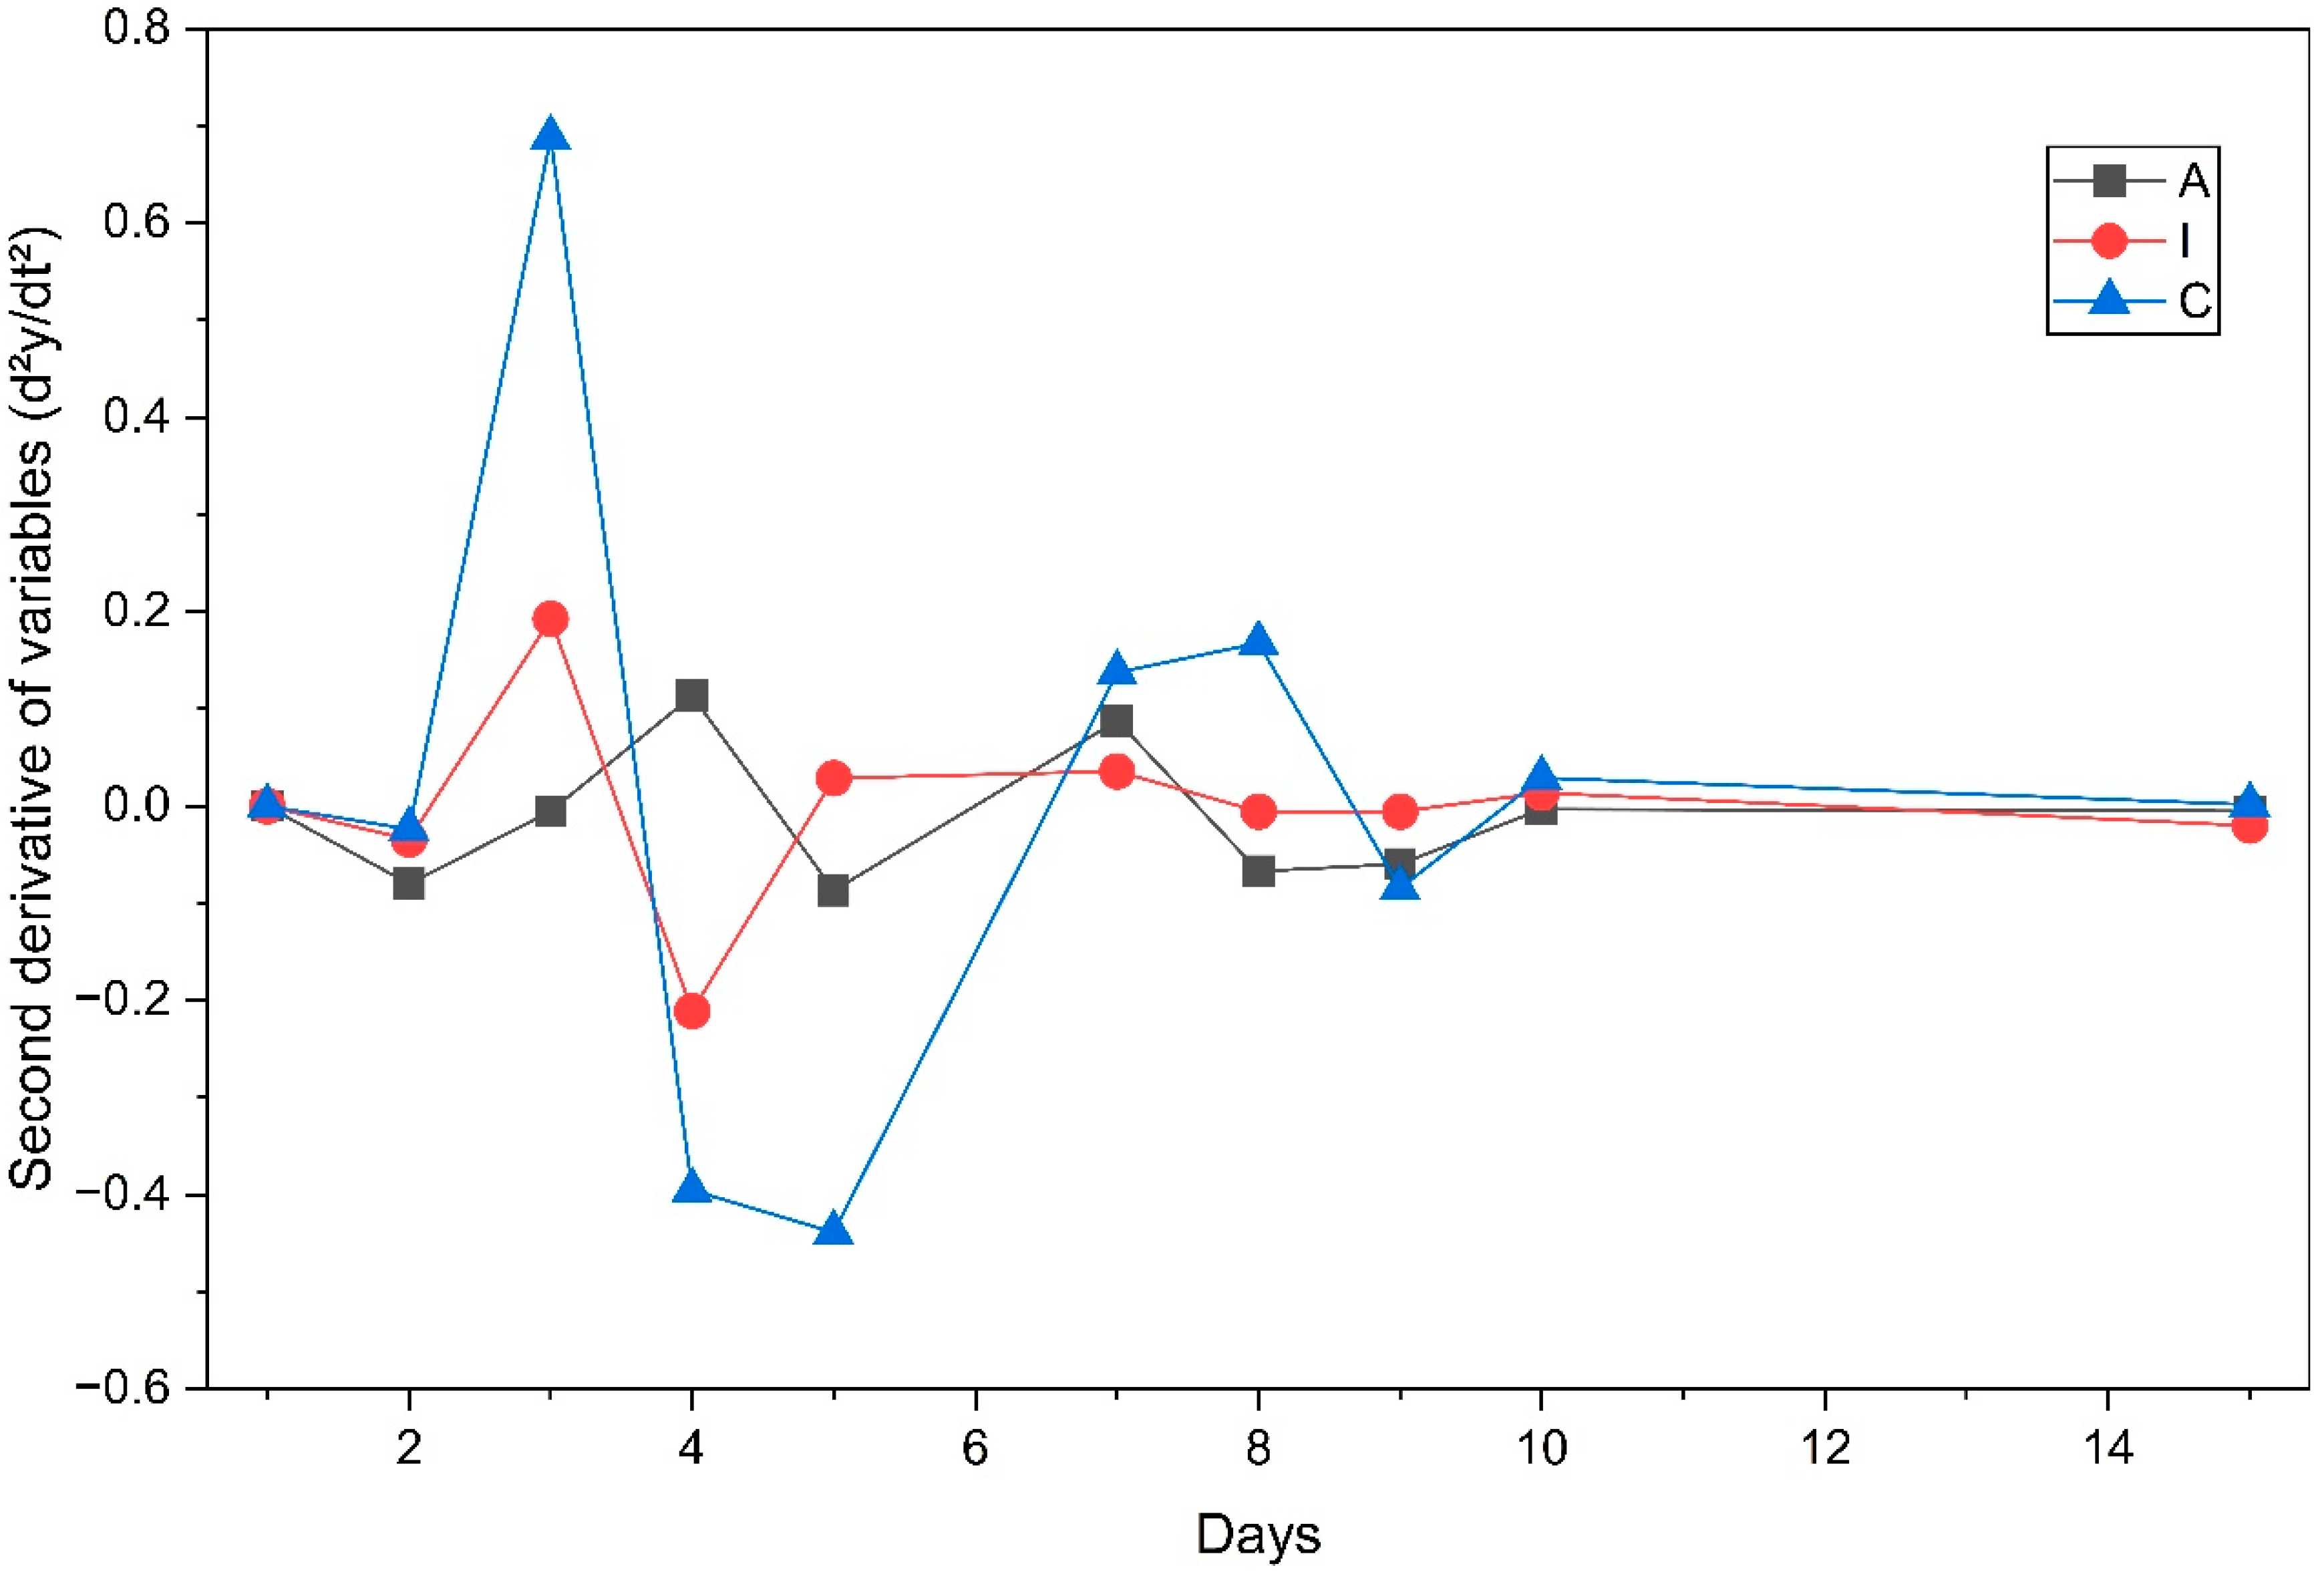
To validate the existence of a common dynamic pattern among the three independent variables (A, I, and C), a second-order analysis was performed by calculating and comparing their respective second derivatives over time, as shown in Figure 6.
Figure 6.
Second derivative of the variables A (absorbance at 684 nm of the non-immobilized culture), I (capacitance of the immobilized culture, μF), and C (capacitance of the non-immobilized culture, μF) over time.
These derivatives reflect the acceleration or deceleration of the rate of change, allowing the detection of latent synchronizations or transitions that are not evident in the original data or in the first derivatives. Górecki and Łuczak [50] recommend the use of second derivatives in the evaluation of time series because they provide additional information about changes in concavity, which enables more accurate detection of behavioral patterns in complex dynamic systems.
The Dynamic Time Warping (DTW) algorithm was applied to the time series of the second derivatives to quantify the degree of similarity among the variables. The DTW distances obtained were: DTW(d2I/dt2, d2A/dt2) = 0.53, DTW(d2I/dt2, d2C/dt2) = 1.31, and DTW(d2C/dt2, d2A/dt2) = 1.52. These results confirm a notably high similarity between variables A and I, both in their original behavior and in their second-order dynamics.
The methodological approach employed is consistent with that proposed by Levnajić and Pikovsky [51], who used DTW to align plant physiological responses in the time domain, demonstrating that applying DTW to second derivatives improves the detection of deep similarities between biological processes. This acceleration-based analysis allows the identification of critical change points beyond the global shapes of the curves. Such a strategy broadens the scope of DTW, validating its use not only on original series but also on their derivatives as a robust tool for comparing underlying dynamics in differentiated processes.
The plotted curves of the second derivatives reinforce this relationship, showing that A and I not only exhibit simultaneous increases but also share coincident inflection points and acceleration patterns. In contrast, variable C displays more pronounced deviations and lower synchrony, suggesting that it may still be responding to the same underlying phenomenon, albeit with a temporal lag or reduced sensitivity.
These results support the hypothesis that A and I capture the same underlying phenomenon with high fidelity, whereas C represents a partial or delayed response. This multilevel analysis, which integrates raw values, second-order derivatives, and temporal alignment, strengthens the argument for the occurrence of a common causal event influencing the behavior of these variables, as also noted by Rastkar et al. [52].
3.5. Optical Analysis of Cell Immobilization by Digital Image Processing
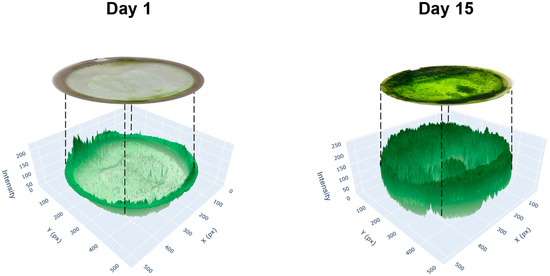
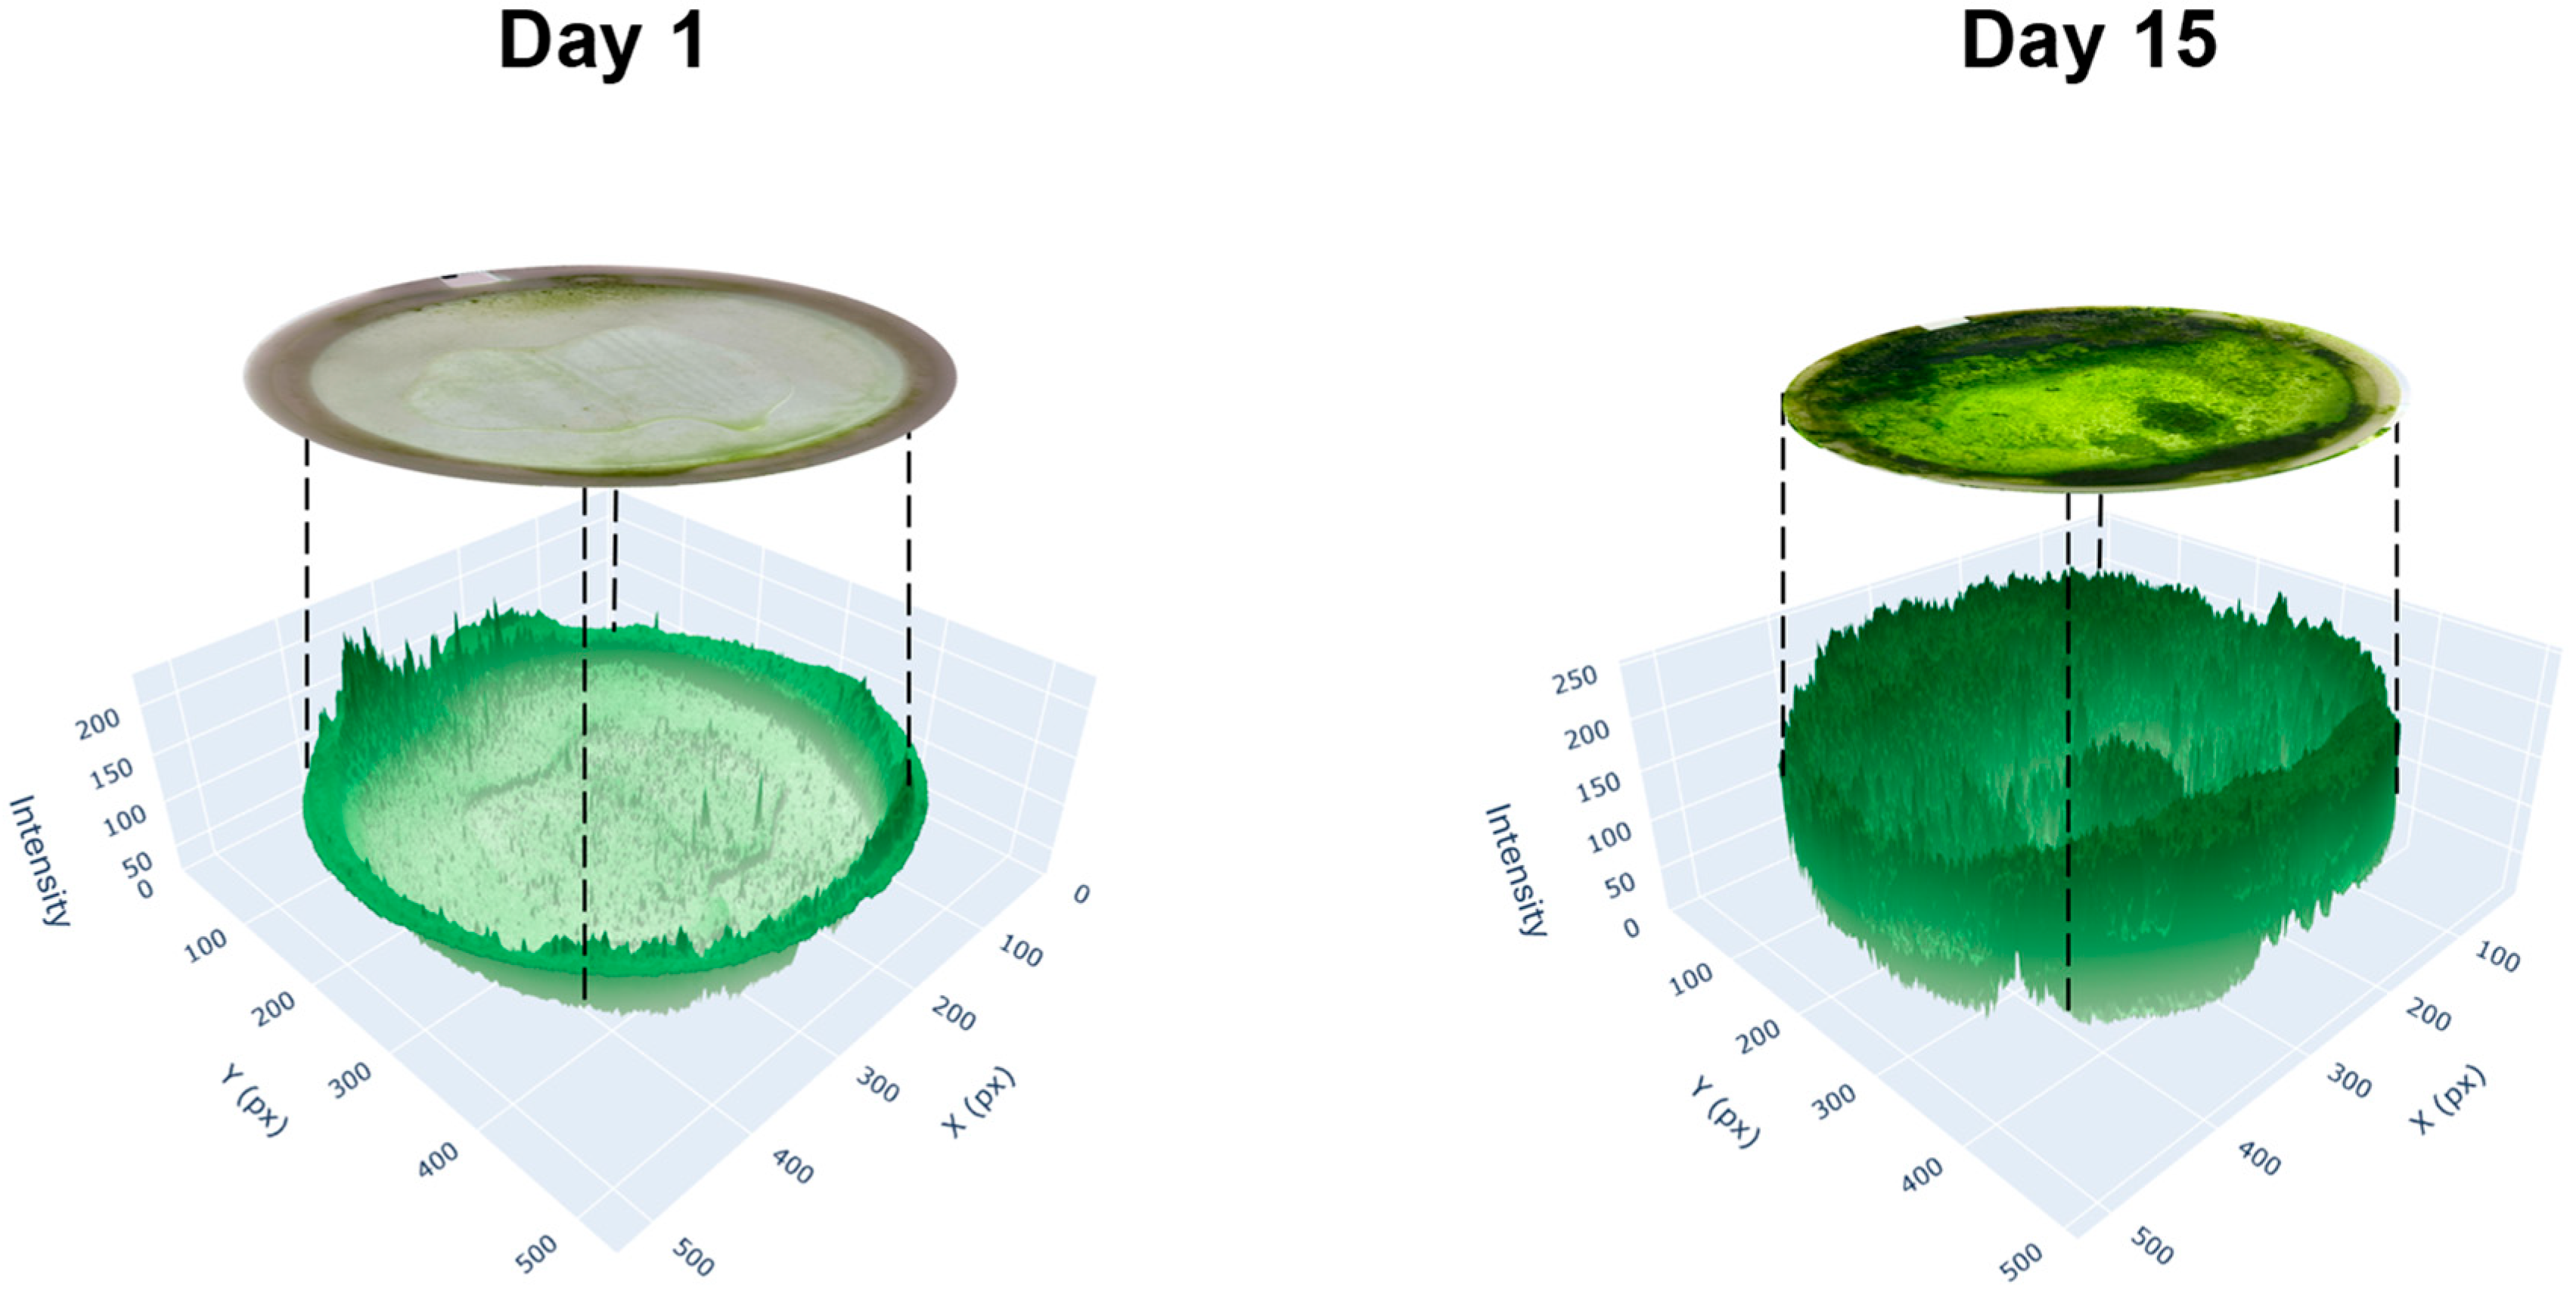
The results obtained indicate that the in situ immobilization technique, based on image capture and capacitance analysis, provides an estimation of microalgal density. Through color analysis and zone segmentation, as shown in Figure 7, it was possible to represent the spatial distribution of biomass retained in the immobilization matrix.
Figure 7.
Topographic map of 2D pixel color intensity (green channel, 0–255 scale) showing the spatial distribution of algal biomass on the immobilization matrix. These scalar-field surface plots are computed from digital image data and do not represent physical 3D scans of biofilm structure. Maps for each day of the immobilization process are provided in the Supplementary Material (see Supplementary Material, Figure S2 for details).
The topographic intensity analysis of the immobilized matrices enabled visualization of the spatial distribution of adhered biomass. It is important to clarify that these surface plots are computational representations of a 2D scalar field of pixel color intensity (green channel, 0–255)—not physical 3D scans of biofilm architecture such as those obtained by CLSM or OCT. Higher intensity values correspond to stronger green coloration associated with denser microalgal coverage, and the height axis of each surface plot represents the magnitude of the local pixel intensity value, enabling visual identification of zones with greater microalgal growth and colonization of the polymeric matrix.
On the first day, the formation of a conditioning film was observed, produced immediately after the surface was submerged in the medium, creating a layer of ions and organic molecules. Once this conditioning film was formed, microorganisms began to adhere [46], thereby increasing the immobilized cell density on the nylon polymeric matrix.
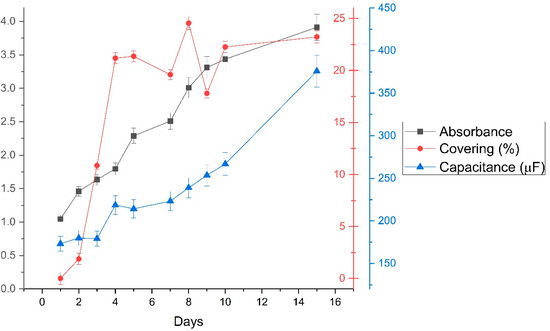
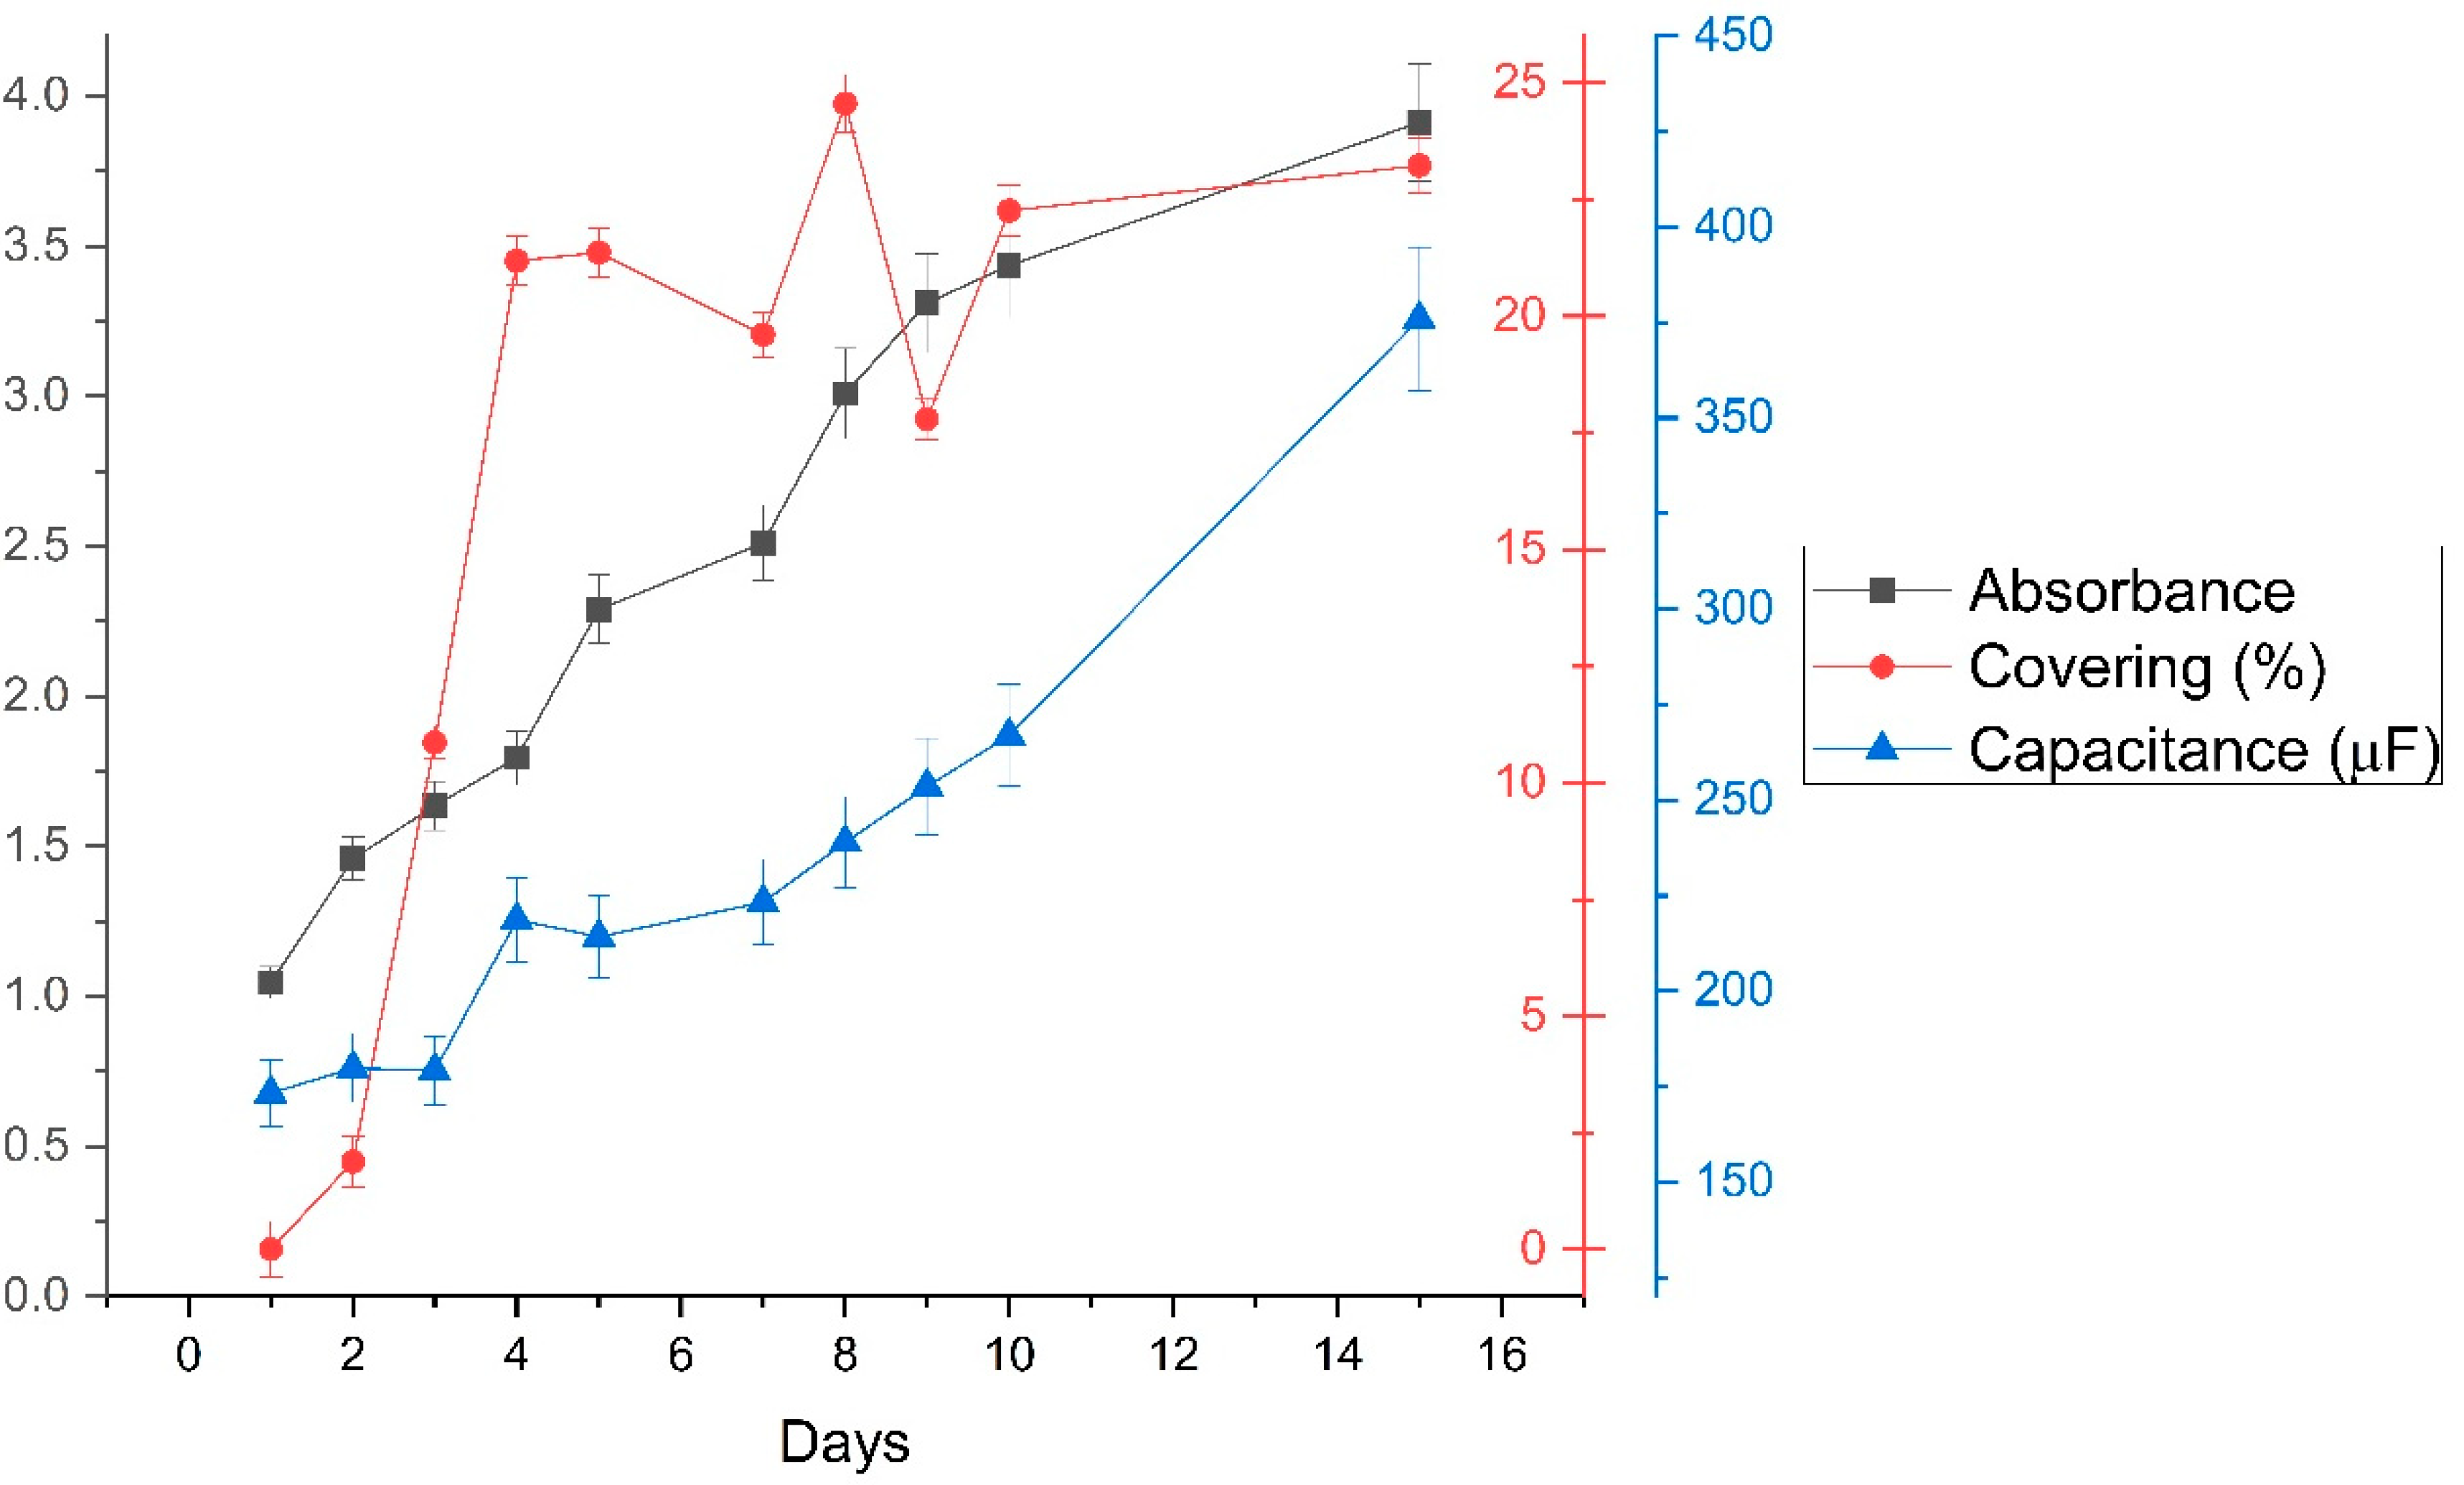
The methodology presented here offers measurable advantages over conventional biofilm quantification techniques. Standard methods such as crystal violet staining, colony-forming unit (CFU) plating, and confocal laser scanning microscopy (CLSM) require sample disruption, chemical treatments, or specialized equipment, making them unsuitable for real-time, non-invasive monitoring of submerged immobilization systems. In contrast, the combined use of digital image analysis and capacitance measurements enables continuous in situ tracking of biomass adhesion and surface coverage without disturbing the biofilm. The image-based approach provides spatial resolution of coverage distribution across the nylon matrix, while capacitance offers a rapid electrical proxy sensitive to cumulative system changes driven by biomass accumulation. This dual-variable monitoring strategy bridges a recognized gap between destructive analytical methods and the demands of scalable, automated bioprocess control aligned with Process Analytical Technology (PAT) frameworks [53,54]. To complement the three-dimensional analyses with a quantitative measure, coverage area was calculated, contrasting the experimental behavior with immobilization trends. Figure 8 provides an overview of the immobilization system performance through the growth curves of Chlorella sp., capacitance, and coverage percentages during the 15-day process.
Figure 8.
Multivariable monitoring of the Chlorella sp. immobilization system.
Figure 8 show the behavior of the variables absorbance, coverage, and capacitance, all of which exhibit an increasing trend over time. Although no direct correlation among the variables is implied, a proportionality may exist that enables indirect monitoring of the microalgal immobilization process on polymeric matrices in a submerged medium, avoiding deterioration or detachment of the biofilm.
Initially, least-squares regression between the variables absorbance, coverage, and capacitance yielded R2 coefficients of 0.78 for Absorbance–Coverage, 0.89 for Absorbance–Capacitance, and 0.65 for Coverage–Capacitance. These values indicated the presence of a trend relationship among the variables over time. Based on these coefficients, the variance relation of the Mann–Kendall trend test statistic was identified, which revealed an increasing trend for the interactions among the three variables, as shown in Table 1.
Table 1.
Coefficients of the Mann–Kendall trend test.
Where τ-Kendall represents the direction of the trend for each variable, the p-value is the test statistic, which for values below 0.05 indicates statistical significance at a 95% confidence level, and the trend corresponds to the analysis of the significance of τ -Kendall.
The Mann–Kendall test was used due to its ability to evaluate the significance of trends in various time series [55,56]. In addition, it has been applied as a statistical model in biotechnological contexts to study trends in submerged systems, such as dissolved oxygen, biochemical oxygen demand, chemical oxygen demand, ammoniacal nitrogen, suspended solids, and pH [57].
Based on the τ -Kendall values obtained, it is possible to state that each of the variables exhibits a significant trend with respect to the others, enabling the integration of detection technologies that facilitate cell immobilization monitoring without the need for invasive sampling or system intervention [53,54]. Moreover, the identification of reproducibility, robustness, and scalability conditions can be achieved through the monitoring of electrical variables such as capacitance and optical density at specific wavelengths.
4. Conclusions
The development of tools for cell culture monitoring, such as capacitance-based tracking, makes it possible to better understand growth properties and substrate affinity, and to establish and ensure reproducible, robust, and scalable cultures.
It is concluded that the monitoring of microalgal immobilization of Chlorella sp. using electrical and optical variables exhibits trend-based results for cell adhesion, with coverage areas of 24.56 ± 0.61%, and the presence of zones of higher cell density associated with culture maturity and cell reproduction. While image-based techniques provide spatial details and information on biomass distribution within the nylon matrix, electrical capacitance offers advantages for implementation in large-scale control systems, where rapid analysis and online operation are critical factors for bioprocess management.
Supplementary Materials
The following supporting information can be downloaded at: https://www.mdpi.com/article/10.3390/pr14091388/s1. Figure S1: Complete photographic record of the immobilization process over 15 days. Each day is represented by three images: (left) immobilization mesh, (center) grayscale-transformed image, and (right) processed image using the Python routine to identify immobilized areas; Figure S2: Three-dimensional representations of algal biomass distribution for each day of the immobilization process. Each panel shows the reconstructed spatial distribution of biomass on the nylon matrix over the 15-day experimental period.
Author Contributions
Conceptualization, C.O.-L., Á.O.-S., M.R.-C. and L.R.-C.; methodology, M.R.-C., L.R.-C., C.O.-L. and Á.O.-S.; software, C.O.-L. and Á.O.-S.; validation, C.O.-L., L.R.-C., M.R.-C., F.G.-L. and S.R.-N.; formal analysis, C.O.-L., L.R.-C., M.R.-C., F.G.-L. and S.R.-N.; investigation, C.O.-L., L.R.-C., M.R.-C., F.G.-L., Á.O.-S. and S.R.-N.; resources, C.O.-L., L.R.-C. and M.R.-C.; data curation, C.O.-L., L.R.-C., M.R.-C., F.G.-L. and S.R.-N.; writing—original draft preparation, C.O.-L., L.R.-C., M.R.-C., F.G.-L. and S.R.-N.; writing—review and editing, C.O.-L., L.R.-C., M.R.-C., F.G.-L. and S.R.-N.; visualization, C.O.-L. and L.R.-C.; supervision, C.O.-L. and Á.O.-S.; project administration, M.R.-C.; funding acquisition, C.O.-L., Á.O.-S. and M.R.-C. All authors have read and agreed to the published version of the manuscript.
Funding
This research received no external funding.
Data Availability Statement
The original contributions presented in this study are included in the article/Supplementary Material. Further inquiries can be directed to the corresponding author.
Conflicts of Interest
The authors declare no conflicts of interest.
References
- Precedence Research. Microalgae Market Size and Forecast 2025 to 2034; Precedence Research: Ottawa, ON, Canada, 2025; Available online: https://www.precedenceresearch.com/microalgae-market (accessed on 26 August 2025).
- Fortune Business Insights. Microalgae Market Size, Share & Industry Analysis and Regional Forecast, 2025–2032; Fortune Business Insights: Pune, India, 2025; Available online: https://www.fortunebusinessinsights.com/microalgae-market-110314 (accessed on 26 August 2025).
- Ananthi, V.; Raja, R.; Carvalho, I.S.; Brindhadevi, K.; Pugazhendhi, A.; Arun, A. A realistic scenario on microalgae-based biodiesel production: Third generation biofuel. Fuel 2021, 284, 118965. [Google Scholar] [CrossRef] [Scilit]
- Ganesan, R.; Manigandan, S.; Samuel, M.S.; Shanmuganathan, R.; Brindhadevi, K.; Chi, N.T.L.; Duc, P.A.; Pugazhendhi, A. A review on prospective production of biofuel from microalgae. Biotechnol. Rep. 2020, 27, e00509. [Google Scholar] [CrossRef] [Scilit]
- Khoo, K.S.; Ahmad, I.; Chew, K.W.; Iwamoto, K.; Bhatnagar, A.; Show, P.L. Enhanced microalgal lipid production for biofuel using different strategies including genetic modification of microalgae: A review. Prog. Energy Combust. Sci. 2023, 96, 101071. [Google Scholar] [CrossRef] [Scilit]
- Peng, L.; Fu, D.; Chu, H.; Wang, Z.; Qi, H. Biofuel production from microalgae: A review. Environ. Chem. Lett. 2020, 18, 285–297. [Google Scholar] [CrossRef] [Scilit]
- Sathya, A.B.; Thirunavukkarasu, A.; Nithya, R.; Nandan, A.; Sakthishobana, K.; Kola, A.K.; Sivashankar, R.; Tuan, H.A.; Deepanraj, B. Microalgal biofuel production: Potential challenges and prospective research. Fuel 2023, 332, 126199. [Google Scholar] [CrossRef] [Scilit]
- Devi, A.; Verma, M.; Saratale, G.D.; Saratale, R.G.; Ferreira, L.F.R.; Mulla, S.I.; Bharagava, R.N. Microalgae: A green eco-friendly agent for bioremediation of tannery wastewater with simultaneous production of value-added products. Chemosphere 2023, 336, 139192. [Google Scholar] [CrossRef] [Scilit] [PubMed]
- Kashem, A.H.M.; Das, P.; AbdulQuadir, M.; Khan, S.; Thaher, M.I.; Alghasal, G.; Hawari, A.H.; Al-Jabri, H. Microalgal bioremediation of brackish aquaculture wastewater. Sci. Total Environ. 2023, 873, 162384. [Google Scholar] [CrossRef] [Scilit]
- Tambat, V.S.; Tseng, Y.-S.; Kumar, P.; Chen, C.-W.; Singhania, R.R.; Chang, J.-S.; Dong, C.-D.; Patel, A.K. Effective and sustainable bioremediation of molybdenum pollutants from wastewaters by potential microalgae. Environ. Technol. Innov. 2023, 30, 103091. [Google Scholar] [CrossRef] [Scilit]
- Khan, A.H.; Khan, N.A.; Naushad, M.; Aziz, H.A. The Treatment of Pharmaceutical Wastewater, 1st ed.; Elsevier: Amsterdam, The Netherlands, 2023. [Google Scholar] [CrossRef] [Scilit]
- Maghzian, A.; Aslani, A.; Zahedi, R.; Yaghoubi, M. How to effectively produce value-added products from microalgae? Renew. Energy 2023, 204, 262–276. [Google Scholar] [CrossRef] [Scilit]
- Pradhan, N.; Kumar, S.; Selvasembian, R.; Rawat, S.; Gangwar, A.; Senthamizh, R.; Yuen, Y.K.; Luo, L.; Ayothiraman, S.; Saratale, G.D.; et al. Emerging trends in the pretreatment of microalgal biomass and recovery of value-added products: A review. Bioresour. Technol. 2023, 369, 128395. [Google Scholar] [CrossRef] [Scilit]
- Sun, Z.; Chen, H.; Sun, L.; Wang, Q. Converting carbon dioxide to high value-added products: Microalgae-based green biomanufacturing. GCB Bioenergy 2023, 15, 386–398. [Google Scholar] [CrossRef] [Scilit]
- Ezhumalai, G.; Arun, M.; Manavalan, A.; Rajkumar, R.; Heese, K. A holistic approach to circular bioeconomy through the sustainable utilization of microalgal biomass for biofuel and other value-added products. Microb. Ecol. 2024, 87, 61. [Google Scholar] [CrossRef] [Scilit]
- Li, K.; Liu, Q.; Fang, F.; Luo, R.; Lu, Q.; Zhou, W.; Huo, S.; Cheng, P.; Liu, J.; Addy, M.; et al. Microalgae-based wastewater treatment for nutrients recovery: A review. Bioresour. Technol. 2019, 291, 121934. [Google Scholar] [CrossRef] [Scilit]
- Katiyar, R.; Arora, A. Health promoting functional lipids from microalgae pool: A review. Algal Res. 2020, 46, 101800. [Google Scholar] [CrossRef] [Scilit]
- Pereira Gutiérrez, M.F.; Jáuregui Romero, G.A.; Devia Barros, A.; Rojas Ruiz, J. Cultivo de microalgas Isochrysis galbana y Nannochloropsis sp. para alimentación de larvas de peces marinos. Rev. Mutis 2017, 7, 75–80. [Google Scholar] [CrossRef] [Scilit]
- Carrera, S.; Velasco, L.A.; Barreto-Hernández, A. Potencial de microalgas bentónicas del Mar Caribe como alimento en maricultura. Rev. Biol. Mar. Oceanogr. 2019, 53, 321–330. [Google Scholar] [CrossRef] [Scilit]
- Tejeda-Benítez, L.; Henao-Argumedo, D.; Alvear-Alayón, M.; Castillo-Saldarriaga, C.R. Caracterización y perfil lipídico de aceites de microalgas. Rev. Fac. Ing. 2015, 24, 43–54. [Google Scholar] [CrossRef] [Scilit]
- Hernández-Pérez, A.; Labbé, J.I. Microalgas, cultivo y beneficios. Rev. Biol. Mar. Oceanogr. 2014, 49, 157–173. [Google Scholar] [CrossRef] [Scilit]
- Castro, G.; Sánchez, M.; Aristizábal, Y.; Acosta, D. Comparación de la producción de proteínas alimentarias a partir de microalgas de los géneros Spirulina sp. y Chlorella sp. ReCiTeIA 2021, 19, 14–21. [Google Scholar]
- Ocampo-López, C.; Ramírez-Carmona, M.; Rendón-Castrillón, L.; Muñoz-Blandón, O.; González-Pérez, L.; Ospina-Sanjuan, Á. Combined in-situ immobilization system of Chlorella sp. in photobioreactor. Case Stud. Chem. Environ. Eng. 2023, 8, 100462. [Google Scholar] [CrossRef] [Scilit]
- Dębowski, M.; Krzemieniewski, M.; Zieliński, M.; Kazimierowicz, J. Immobilized microalgae-based photobioreactor for CO2 capture (IMC-CO2PBR): Efficiency estimation, technological parameters, and prototype concept. Atmosphere 2021, 12, 1031. [Google Scholar] [CrossRef] [Scilit]
- Moreno-Garrido, I. Microalgae immobilization: Current techniques and uses. Bioresour. Technol. 2008, 99, 3949–3964. [Google Scholar] [CrossRef] [Scilit] [PubMed]
- Li, H.-B.; Jiang, Y.; Chen, F. Isolation and purification of lutein from the microalga Chlorella vulgaris by extraction after saponification. J. Agric. Food Chem. 2002, 50, 1070–1072. [Google Scholar] [CrossRef] [Scilit]
- Salvador, S.; Chan, P. Toward accurate dynamic time warping in linear time and space. Intell. Data Anal. 2007, 11, 561–580. [Google Scholar] [CrossRef] [Scilit]
- Wu, J.-Y.; Lay, C.-H.; Chiong, M.-C.; Chew, K.W.; Chen, C.-C.; Wu, S.-Y.; Zhou, D.; Kumar, G.; Show, P.L. Immobilized Chlorella species mixotrophic cultivation at various textile wastewater concentrations. J. Water Process Eng. 2020, 38, 101609. [Google Scholar] [CrossRef] [Scilit]
- Hu, J.; Liu, H.; Shukla, P.; Lin, W.; Luo, J. Nitrogen and phosphorus removals by agar-immobilized Chlorella saccharophila with long-term preservation at room temperature. Chemosphere 2020, 251, 126406. [Google Scholar] [CrossRef] [Scilit] [PubMed]
- Magyar, T.; Németh, B.; Tamás, J.; Nagy, P.T. Improvement of N and P ratio for enhanced biomass productivity and sustainable cultivation of Chlorella vulgaris microalgae. Heliyon 2024, 10, e23238. [Google Scholar] [CrossRef] [Scilit]
- Mtaki, K.; Kyewalyanga, M.S.; Mtolera, M.S.P. Supplementing wastewater with NPK fertilizer as a cheap source of nutrients in cultivating live food (Chlorella vulgaris). Ann. Microbiol. 2021, 71, 7. [Google Scholar] [CrossRef] [Scilit]
- Cui, X.; Yang, J.; Cui, M.; Zhang, W.; Zhao, J. Comparative experiments of two novel tubular photobioreactors with an inner aerated tube for microalgal cultivation. Algal Res. 2021, 58, 102364. [Google Scholar] [CrossRef] [Scilit]
- Gao, Y.; Bernard, O.; Fanesi, A.; Perré, P.; Lopes, F. The effect of light intensity on microalgae biofilm structures and physiology under continuous illumination. Sci. Rep. 2024, 14, 1151. [Google Scholar] [CrossRef] [Scilit]
- González-López, F.; Rendón-Castrillón, L.; Ramírez-Carmona, M.; Ocampo-López, C. Evaluation of a landfill leachate bioremediation system using Spirulina sp. Sustainability 2025, 17, 2385. [Google Scholar] [CrossRef] [Scilit]
- Tasnim, N.; Karmakar, D.; Hasan, R.; Islam, R.; Hossain, S.; Shaikh, A.; Karim, R. Effect of light intensity and pH on cell density assessed by spectrophotometry for Chlorella vulgaris. Am. J. Plant Sci. 2023, 14, 472–481. [Google Scholar] [CrossRef]
- Nunes, N.S.P.; Oliveira, I.G.S.; Ansilago, M.; Carvalho, E.M. Analysis of functional relationships between the cell quantification variables in the microalgae Chlorella sorokiniana. Rev. Ibero-Am. Cienc. Ambient. 2020, 12, 453–460. [Google Scholar] [CrossRef] [Scilit]
- Ma, X.; Jian, W. Growth conditions and growth kinetics of Chlorella vulgaris cultured in domestic sewage. Sustainability 2023, 15, 2162. [Google Scholar] [CrossRef] [Scilit]
- Li, T.; Xu, J.; Gao, B.; Xiang, W.; Li, A.; Zhang, C. Morphology, growth, biochemical composition and photosynthetic performance of Chlorella vulgaris (Trebouxiophyceae) under low and high nitrogen supplies. Algal Res. 2016, 16, 481–491. [Google Scholar] [CrossRef] [Scilit]
- Abou Taleb, M.F.; Farouk, A. Potential application of carboxymethyl cellulose/sodium alginate aerogels loaded with algal biomass for disinfection of contaminated water. J. Environ. Chem. Eng. 2024, 12, 111860. [Google Scholar] [CrossRef] [Scilit]
- Abu Sepian, N.R.; Mat Yasin, N.H.; Zainol, N. Characterization of gel beads used for immobilization of Chlorella vulgaris and enhancement of its density for lipid production. IOP Conf. Ser. Mater. Sci. Eng. 2020, 991, 012007. [Google Scholar] [CrossRef] [Scilit]
- Vasilieva, S.; Lobakova, E.; Grigoriev, T.; Selyakh, I.; Semenova, L.; Chivkunova, O.; Gotovtsev, P.; Antipova, C.; Zagoskin, Y.; Scherbakov, P.; et al. Bio-inspired materials for nutrient biocapture from wastewater: Microalgal cells immobilized on chitosan-based carriers. J. Water Process Eng. 2021, 40, 101774. [Google Scholar] [CrossRef] [Scilit]
- Acevedo, C.A.; Skurtys, O.; Young, M.E.; Enrione, J.; Pedreschi, F.; Osorio, F. A non-destructive digital imaging method to predict immobilized yeast biomass. LWT—Food Sci. Technol. 2009, 42, 1444–1449. [Google Scholar] [CrossRef] [Scilit]
- Tang, J.; Liu, B.; Gao, L.; Wang, W.; Liu, T.; Su, G. Impacts of surface wettability and roughness of styrene-acrylic resin films on adhesion behavior of microalgae Chlorella sp. Colloids Surf. B Biointerfaces 2021, 199, 111522. [Google Scholar] [CrossRef] [Scilit]
- Huang, Y.; Zheng, Y.; Li, J.; Liao, Q.; Fu, Q.; Xia, A.; Fu, J.; Sun, Y. Enhancing microalgae biofilm formation and growth by fabricating microgrooves onto the substrate surface. Bioresour. Technol. 2018, 261, 36–43. [Google Scholar] [CrossRef] [Scilit]
- Tong, C.; Derek, C. Membrane surface roughness promotes rapid initial cell adhesion and long-term microalgal biofilm stability. Environ. Res. 2022, 15, 112602. [Google Scholar] [CrossRef] [Scilit]
- Katarzyna, L.; Sai, G.; Singh, O.A. Non-enclosure methods for non-suspended microalgae cultivation: Literature review and research needs. Renew. Sustain. Energy Rev. 2015, 42, 1418–1427. [Google Scholar] [CrossRef] [Scilit]
- Nguyen, L.; Nguyen, D.K.; Nguyen, T.; Nguyen, B.; Nghiem, T.X. Analysis of microalgal density estimation using LASSO and image texture features. Sensors 2023, 23, 2543. [Google Scholar] [CrossRef] [Scilit]
- Schwamb, S.; Puskeiler, R.; Wiedemann, P. Monitoring of cell culture. In Bioprocess Monitoring and Control; Springer: Cham, Switzerland, 2015; pp. 185–221. [Google Scholar] [CrossRef] [Scilit]
- Alias, A.B.; Mishra, S.; Pendharkar, G.; Chen, C.-S.; Liu, C.-H.; Liu, Y.-J.; Yao, D.-J. Microfluidic microalgae system: A review. Molecules 2022, 27, 1910. [Google Scholar] [CrossRef] [Scilit]
- Górecki, T.; Łuczak, M. First and second derivatives in time series classification using DTW. Commun. Stat. Simul. Comput. 2014, 43, 2081–2092. [Google Scholar] [CrossRef] [Scilit]
- Levnajić, Z.; Pikovsky, A. Untangling complex dynamical systems via derivative-variable correlations. Sci. Rep. 2014, 4, 5030. [Google Scholar] [CrossRef] [Scilit] [PubMed]
- Rastkar, S.T.; Jamili, S.; De Santis, E.; Rizzi, A. Improving prediction performances by integrating second derivative in microgrids energy load forecasting. In Proceedings of the 2024 International Joint Conference on Neural Networks (IJCNN), Yokohama, Japan, 30 June–5 July 2024; pp. 1–8. [Google Scholar] [CrossRef] [Scilit]
- Reyes, S.J.; Durocher, Y.; Pham, P.L.; Henry, O. Modern sensor tools and techniques for monitoring, controlling, and improving cell culture processes. Processes 2022, 10, 189. [Google Scholar] [CrossRef] [Scilit]
- Rösner, L.; Walter, F.; Ude, C.; John, G.; Beutel, S. Sensors and techniques for on-line determination of cell viability in bioprocess monitoring. Bioengineering 2022, 9, 762. [Google Scholar] [CrossRef] [Scilit]
- Hamed, K.H.; Ramachandra Rao, A. A modified Mann–Kendall trend test for autocorrelated data. J. Hydrol. 1998, 204, 182–196. [Google Scholar] [CrossRef] [Scilit]
- Hamed, K.H. Exact distribution of the Mann–Kendall trend test statistic for persistent data. J. Hydrol. 2009, 365, 86–94. [Google Scholar] [CrossRef] [Scilit]
- Hashim, M.; Nayan, N.; Setyowati, D.L.; Said, Z.M.; Mahat, H.; Saleh, Y. Analysis of water quality trends using the Mann–Kendall test and Sen’s estimator of slope in a tropical river basin. Pollution 2021, 7, 933–942. [Google Scholar] [CrossRef]

Disclaimer/Publisher’s Note: The statements, opinions and data contained in all publications are solely those of the individual author(s) and contributor(s) and not of MDPI and/or the editor(s). MDPI and/or the editor(s) disclaim responsibility for any injury to people or property resulting from any ideas, methods, instructions or products referred to in the content. |
© 2026 by the authors. Licensee MDPI, Basel, Switzerland. This article is an open access article distributed under the terms and conditions of the Creative Commons Attribution (CC BY) license.