


Abstract
Research on low-concentration CO2 capture technology is of great significance for China to achieve “carbon peak and carbon neutrality”. However, there are currently two challenges in low-concentration CO2 capture technology: high energy consumption and significant methane loss. Therefore, in this study, a numerical simulation method is used to establish the reaction model of the piperazine-activated N-methyl diethanolamine (abbreviated as MDEA-PZ) system with CO2 using Aspen HYSYS industrial software, taking shale gas from a production area as the raw material gas. Single-factor sensitivity analysis is conducted to study the impact of N-methyl diethanolamine (abbreviated as MDEA) mass fraction, piperazine (abbreviated as PZ) mass fraction, CO2 absorption temperature, and amine liquid regeneration temperature on the process. The results show that when the N-methyl diethanolamine mass fraction is between 37% and 42% and the piperazine mass fraction is between 2.5% and 5%, the regeneration energy consumption is lower and methane loss is smaller. For the raw material gas in this study, the recommended optimal amine liquid mass ratio is 40% of N-methyl diethanolamine + 3% of piperazine. Under this condition, the preferred absorption temperature is 46 °C, the amine liquid circulation rate is 45 m3/h, and the regeneration temperature is 118 °C, resulting in a significant reduction in the total energy consumption by 8.9% compared with the initial value.
1. Introduction
The energy crisis is one of the biggest challenges around the world today [1,2,3,4,5]. Under the backdrop of the continuous rise in global energy demand and the transformation of the energy structure, the development and utilization of shale gas have played a pivotal role in alleviating the energy crisis while also fostering economic growth and strengthening national energy security [6,7,8,9,10,11]. Shale gas is one of the unconventional gas energy sources with huge reserves and broad application prospects both in China and around the world [12,13,14,15]. China is a major shale gas producer, with domestic shale gas reserves accounting for about 15.3% of the world’s total reserves, ranking first globally [16,17,18,19,20,21,22,23,24,25]. The northern Guizhou region is an important production area of shale gas [26,27]. Therefore, in the context of the deepening global energy crisis, conducting research on shale gas processing technology is of significant practical importance for ensuring energy security and supporting the transformation of the national energy structure [28,29,30,31,32,33,34,35].
Commonly used gas decarbonization methods include membrane separation, adsorption, chemical solvent absorption, low-temperature distillation, etc. Among these methods, chemical solvent absorption is the most mature and extensive solution to remove CO2 in industrial practice [36,37,38,39]. Activated MDEA solution is widely used in the natural gas decarbonization process due to its advantages, such as high acid gas loading, low regeneration energy consumption, and low corrosiveness for equipment [40,41]. Under industrial conditions, the design and process parameters of shale gas decarbonization are usually determined according to the natural gas decarbonization process. However, due to the huge differences between shale gas and conventional natural gas, the process design and key parameters of shale gas decarbonization are bound to differ greatly from natural gas decarbonization [42,43,44]. Recently, a large number of studies have been carried out on the natural gas decarbonization process [45]. However, studies on the decarbonization process of shale gas are insufficient.
The CO2 capture from shale gas is a fundamental process in the shale gas refining procedure. Research and practice in gas CO2 capture technology indicate that the activated MDEA solution using alkanolamine is widely used in the natural gas industry due to its advantages, such as high acid gas loading, low regeneration energy consumption, and low equipment corrosiveness [46,47]. However, the application of PZ-activated MDEA in the CO2 capture process for shale gas is less common. In engineering practice, the process formulation and design parameters for CO2 capture from shale gas typically refer to those established for natural gas CO2 capture. However, there are significant differences in the gas composition between shale gas and conventional natural gas. Taking the shale gas field in the northern Guizhou region as an example, the methane content in shale gas accounts for over 95%, with very low CO2 content, and only trace amounts of impurities, such as hydrogen and helium. In contrast, natural gas is a multi-component gaseous mixture predominantly composed of methane, usually with a higher CO2 content. Therefore, the process formulation and parameters for low-concentration CO2 capture from shale gas will inevitably differ significantly from those used in natural gas CO2 capture.
Shale gas from one shale gas field in northern Guizhou, China, was selected as the research object in this research. The deep decarbonization process model was established with Aspen HYSYS (V14.0) based on PZ-activated MDEA solution. The focus was on the effect of key parameters on absorption effect and energy consumption by sensitivity analysis. The key parameters of the shale gas decarbonization process were then optimized. The results of the research can provide guidance for the shale gas decarbonization process in industrial practice.
2. Methodology
2.1. Mechanism
Chemical absorption is currently the most widely used and mature technology for carbon dioxide capture in industries of China. In this paper, the pyrazine (PZ)-activated N-methy diethanolamine (MDEA) process in the chemical absorption method was used for CO2 capture and treatment of shale gas. Chemical reaction Equations (1)–(7) were introduced to describe the reaction process between the MDEA-PZ system and CO2, and kinetic reaction-related data were applied to improve the CO2 capture process model, thus enhancing the calculation accuracy of the process model.
MDEA+ + H2O ⇋ MDEA + H3O+
CO2 + 2H2O ⇋ H3O+ + HCO3−
2H2O ⇋ H3O+ + OH−
PZH+ ⇋ PZ + H+
PZ + CO2 ⇋ PZCOO−
H+ + PZCOO− ⇋ PZCOOH
PZCOO− + CO2 ⇋ OOPZCOO− + H+
Furthermore, adding an activator of PZ could effectively increase the chemical reaction rate of CO2 with MDEA solution. PZ can be fully regenerated and reactivated in the regeneration process; thus, PZ can be regarded as a homogeneous catalyst for the reaction. Moreover, the catalytic activation of PZ could increase the rate of CO2 absorption and re-solution by MDEA, which can greatly reduce the regeneration energy consumption of decarbonization. absorption and re-solution by MDEA, which can greatly reduce the regeneration energy consumption of decarbonization.
2.2. Process Model
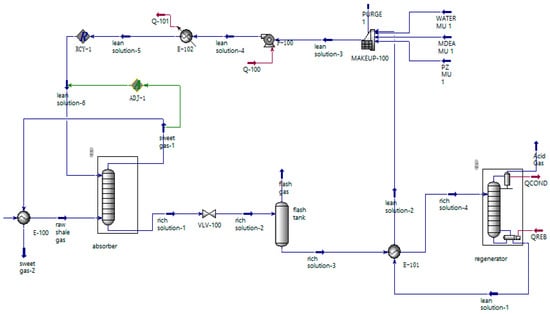
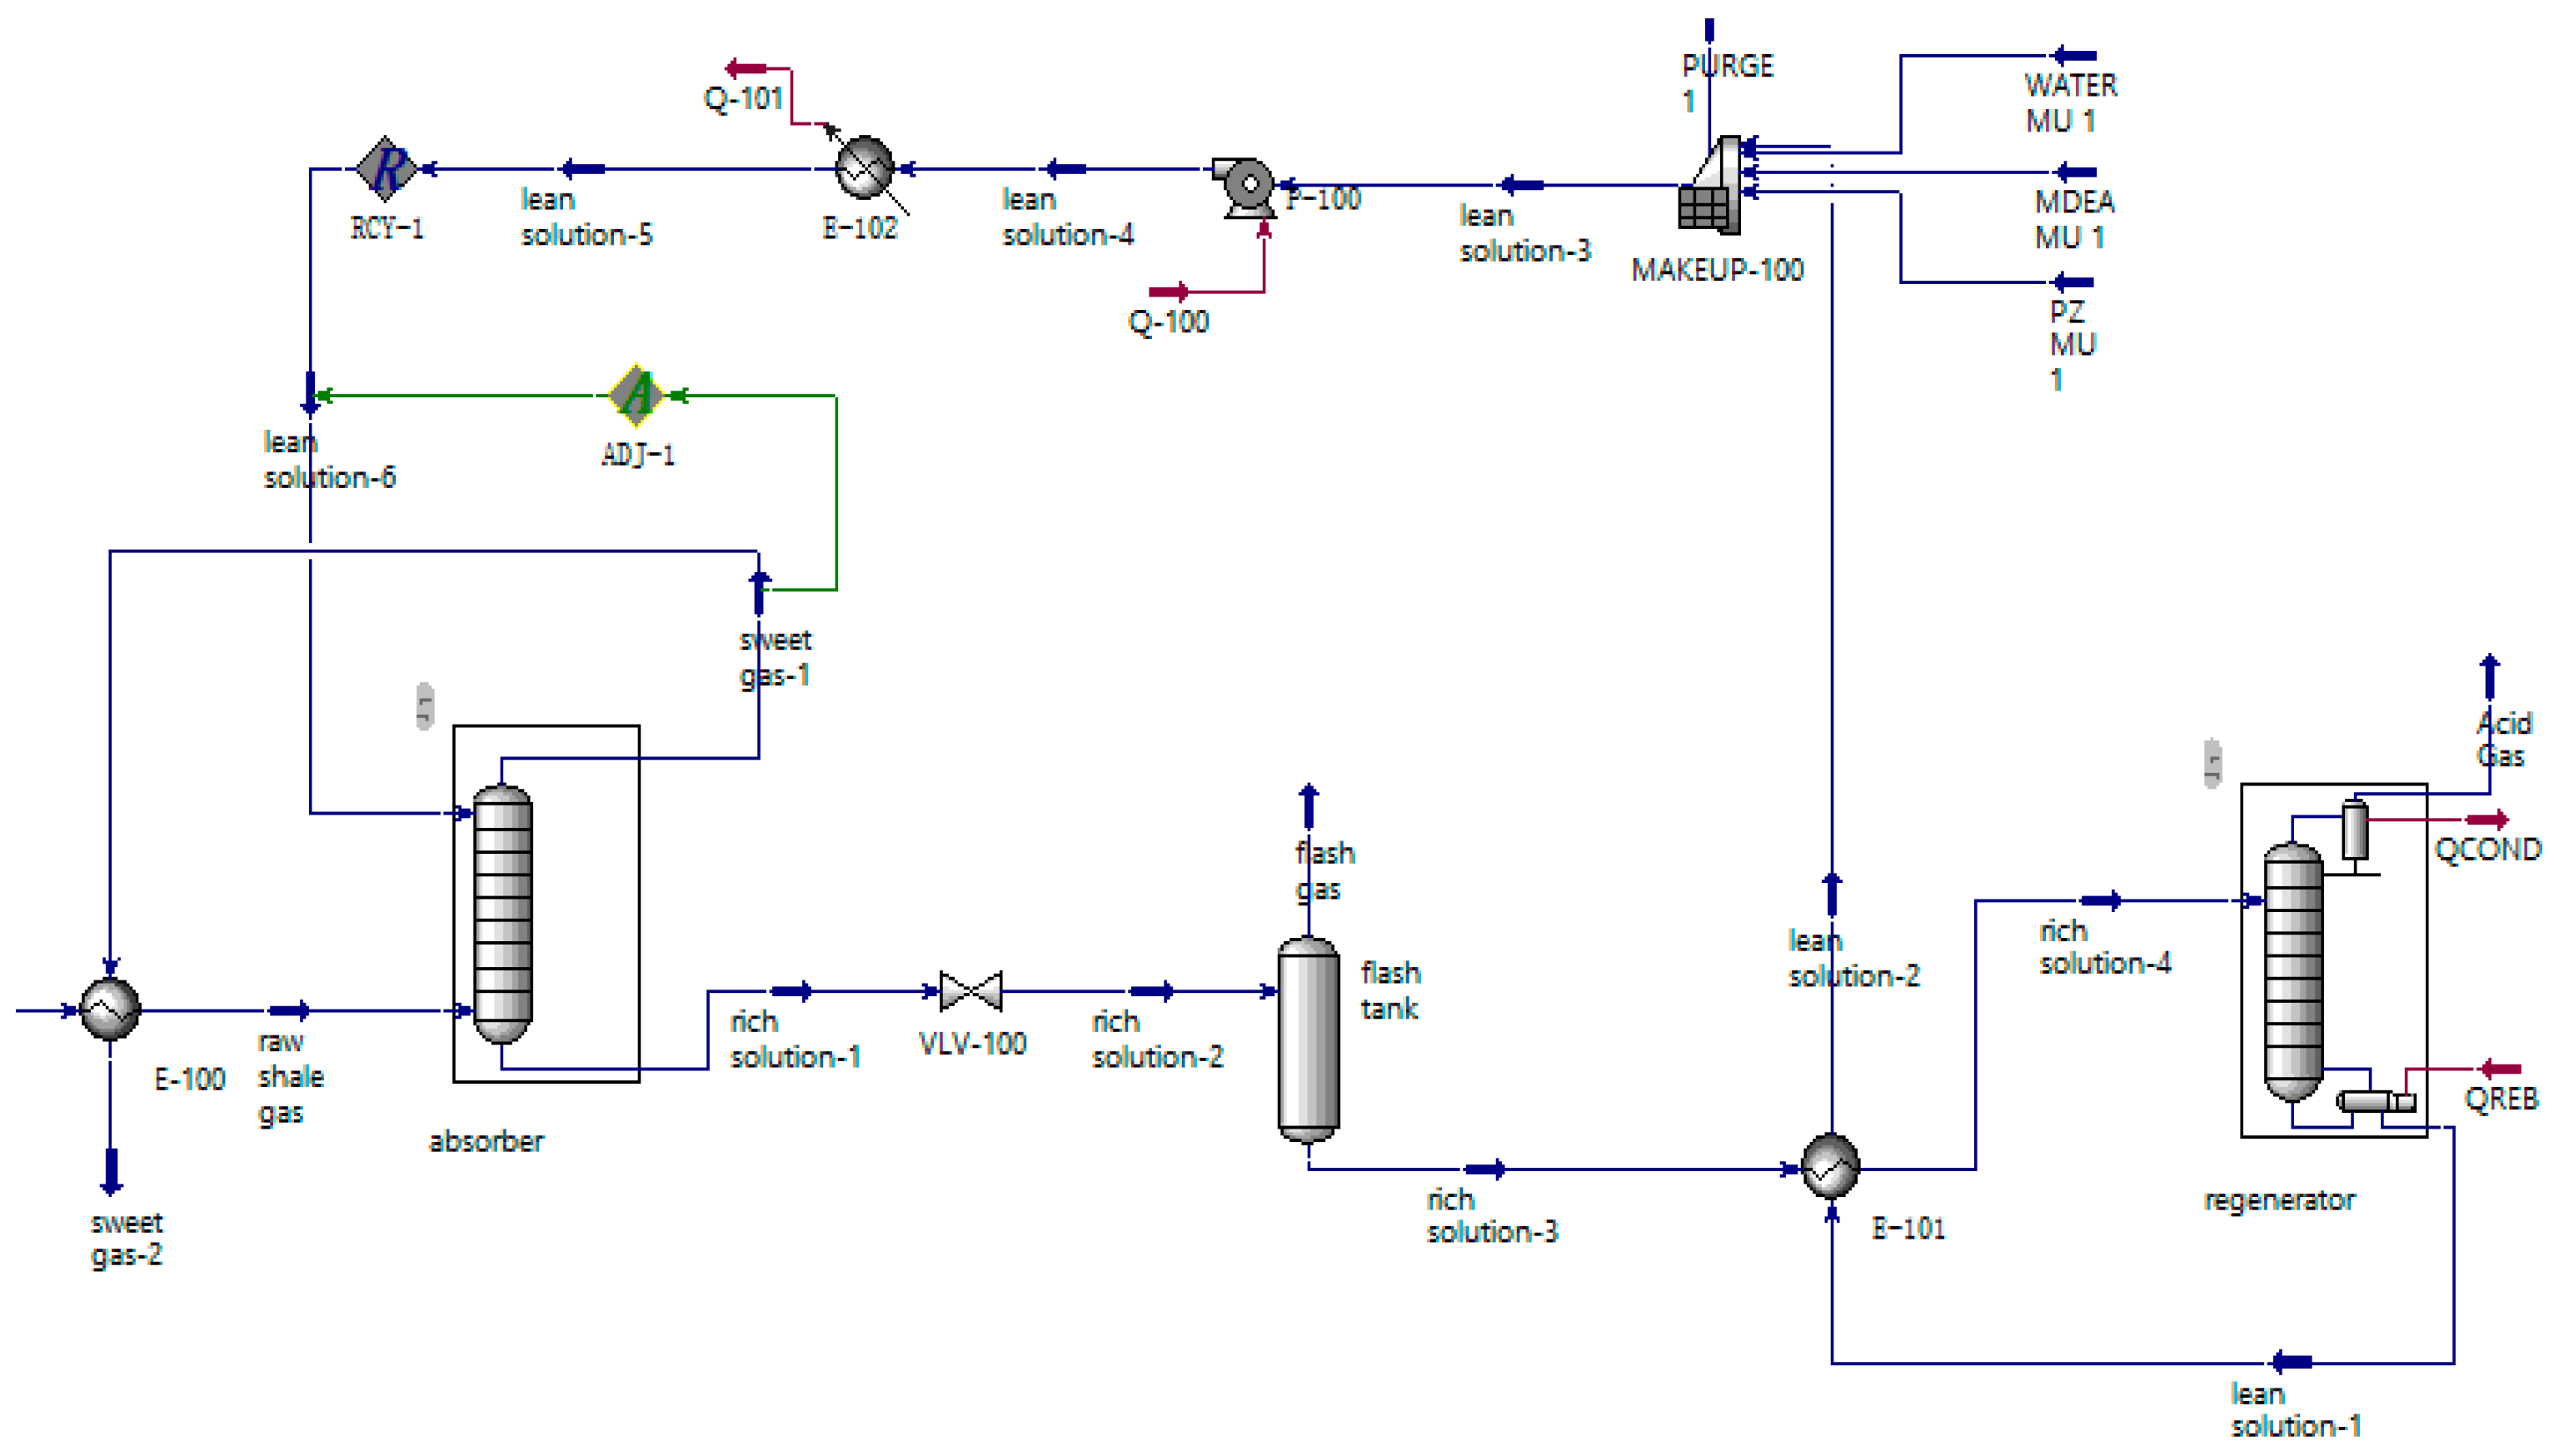
The raw shale gas is heated by a heat exchanger with sweet gas and enters the absorption tower from the gas phase inlet. In the tower, it comes into contact with the lean amine solution entering the tower from the liquid phase inlet and undergoes an absorption reaction. The excess CO2 component in the raw shale gas is removed, and it becomes sweet gas. The sweet gas flows out from the top outlet of the absorption tower and enters downstream processes. The rich solution absorbing CO2 enters the flash tank for flash separation. Dissolved hydrocarbons and a small amount of CO2 gas are separated. The flashed gas is pressurized and used as fuel gas after pressure adjustment. The liquid flowing out from the bottom of the flash tank enters the lean-rich solution heat exchanger for heat exchange. After the heat exchanger, the rich solution enters the regeneration tower and regenerates into a lean solution after CO2 is stripped out in the tower. The lean solution flows out from the bottom of the regeneration tower and enters the lean-rich solution heat exchanger for heat exchange and cooling. It is then sequentially sent to the lean solution pump and the lean solution cooler and transported to the top of the absorption tower to complete one cycle of amine solution.
Based on the process above, the simulation model of the low-concentration CO2 capture process was established using Aspen HYSYS (V14.0) software as shown in Figure 1. The MDEA-PZ-H2O-CO2 system is a complex chemical system that involves gas–liquid phase equilibrium, ionization equilibrium, and chemical equilibrium. Therefore, the Acid Gas Chemical Solvent property package for acidic gas chemical solvents in HYSYS (V14.0) was selected. This property package is developed based on the Peng–Robinson (PR) equation of state and the electrolyte non-random two-liquid (NRTL) activity coefficient model, and it can accurately describe the reaction process between amine solutions and CO2. According to the on-site operation data, key parameters, such as feed gas, amine solution formulation (MDEA and PZ mass ratio), operating pressure, and temperature, were input into the above process model, and by adjusting the model parameters, the CO2 volume fraction in the sweet gas was adjusted to meet the decarbonization target.
Figure 1.
Simulation model for the low-concentration CO2 capture process of shale gas.
3. Data
3.1. Solid Adsorption
Shale gas produced from one of the typical shale gas fields was selected as the raw gas, as shown in Table 1. The main component of the raw gas was methane, with trace impurities and a low CO2 content. The total flow rate of raw gas was 120 × 104 Nm3·d−1 (standard condition 20 °C, 101.325 kPa, the same below). The temperature of the raw gas from the shale gas field was 45 °C, and the incoming gas pressure was 5.3 MPa.
Table 1.
Component of raw gas.
Raw gas decarbonization index requirements: CO2 volume fraction in sweet gas ≤50 × 10−6, H2S volume fraction ≤2 × 10⁻⁶.
3.2. Verification
The simulation data from the model were compared with the on-site operation data to verify the accuracy of the shale gas decarbonization model. The results are shown in Table 2. From Table 2, the field operation data showed that the volume fraction of CO2 in the sweet gas from the decarbonization unit was 7.01 × 10⁻⁶, while the HYSYS process model calculated the volume fraction of CO2 in the sweet gas after decarbonization to be 7.21 × 10⁻⁶. The simulation result was slightly better than the field operation result, with an error of 0.28%. Therefore, the results show that the HYSYS process model can simulate the operation condition of the on-site decarbonization unit accurately and reliably.
Table 2.
Comparison of operation data and simulation data.
4. Results and Discussion
4.1. Optimization of Amine Solution Formulation
4.1.1. Optimization of MDEA Mass Fraction
Based on the HYSYS model above, by changing the MDEA mass fraction in the amine solution, the effect of the MDEA mass fraction on amine solution circulation volume, regeneration energy, methane loss, and CO2 loading was investigated when amine solutions with different MDEA mass fractions were used to remove the CO2 content in shale gas to less than 50 × 10−6. During the analysis, other key process parameters, as shown in Table 3, were selected, and the mass fraction of activating agent PZ was chosen as 2.5%.
Table 3.
Key parameters of the process.
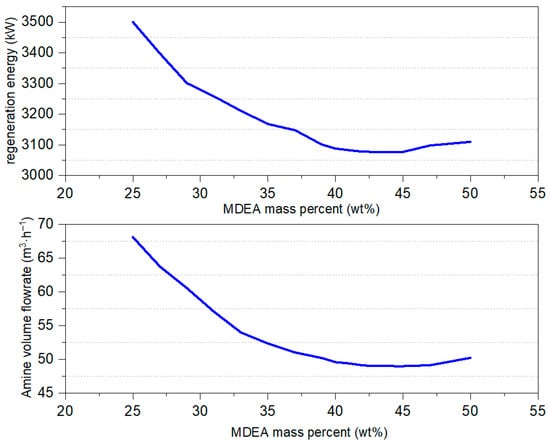
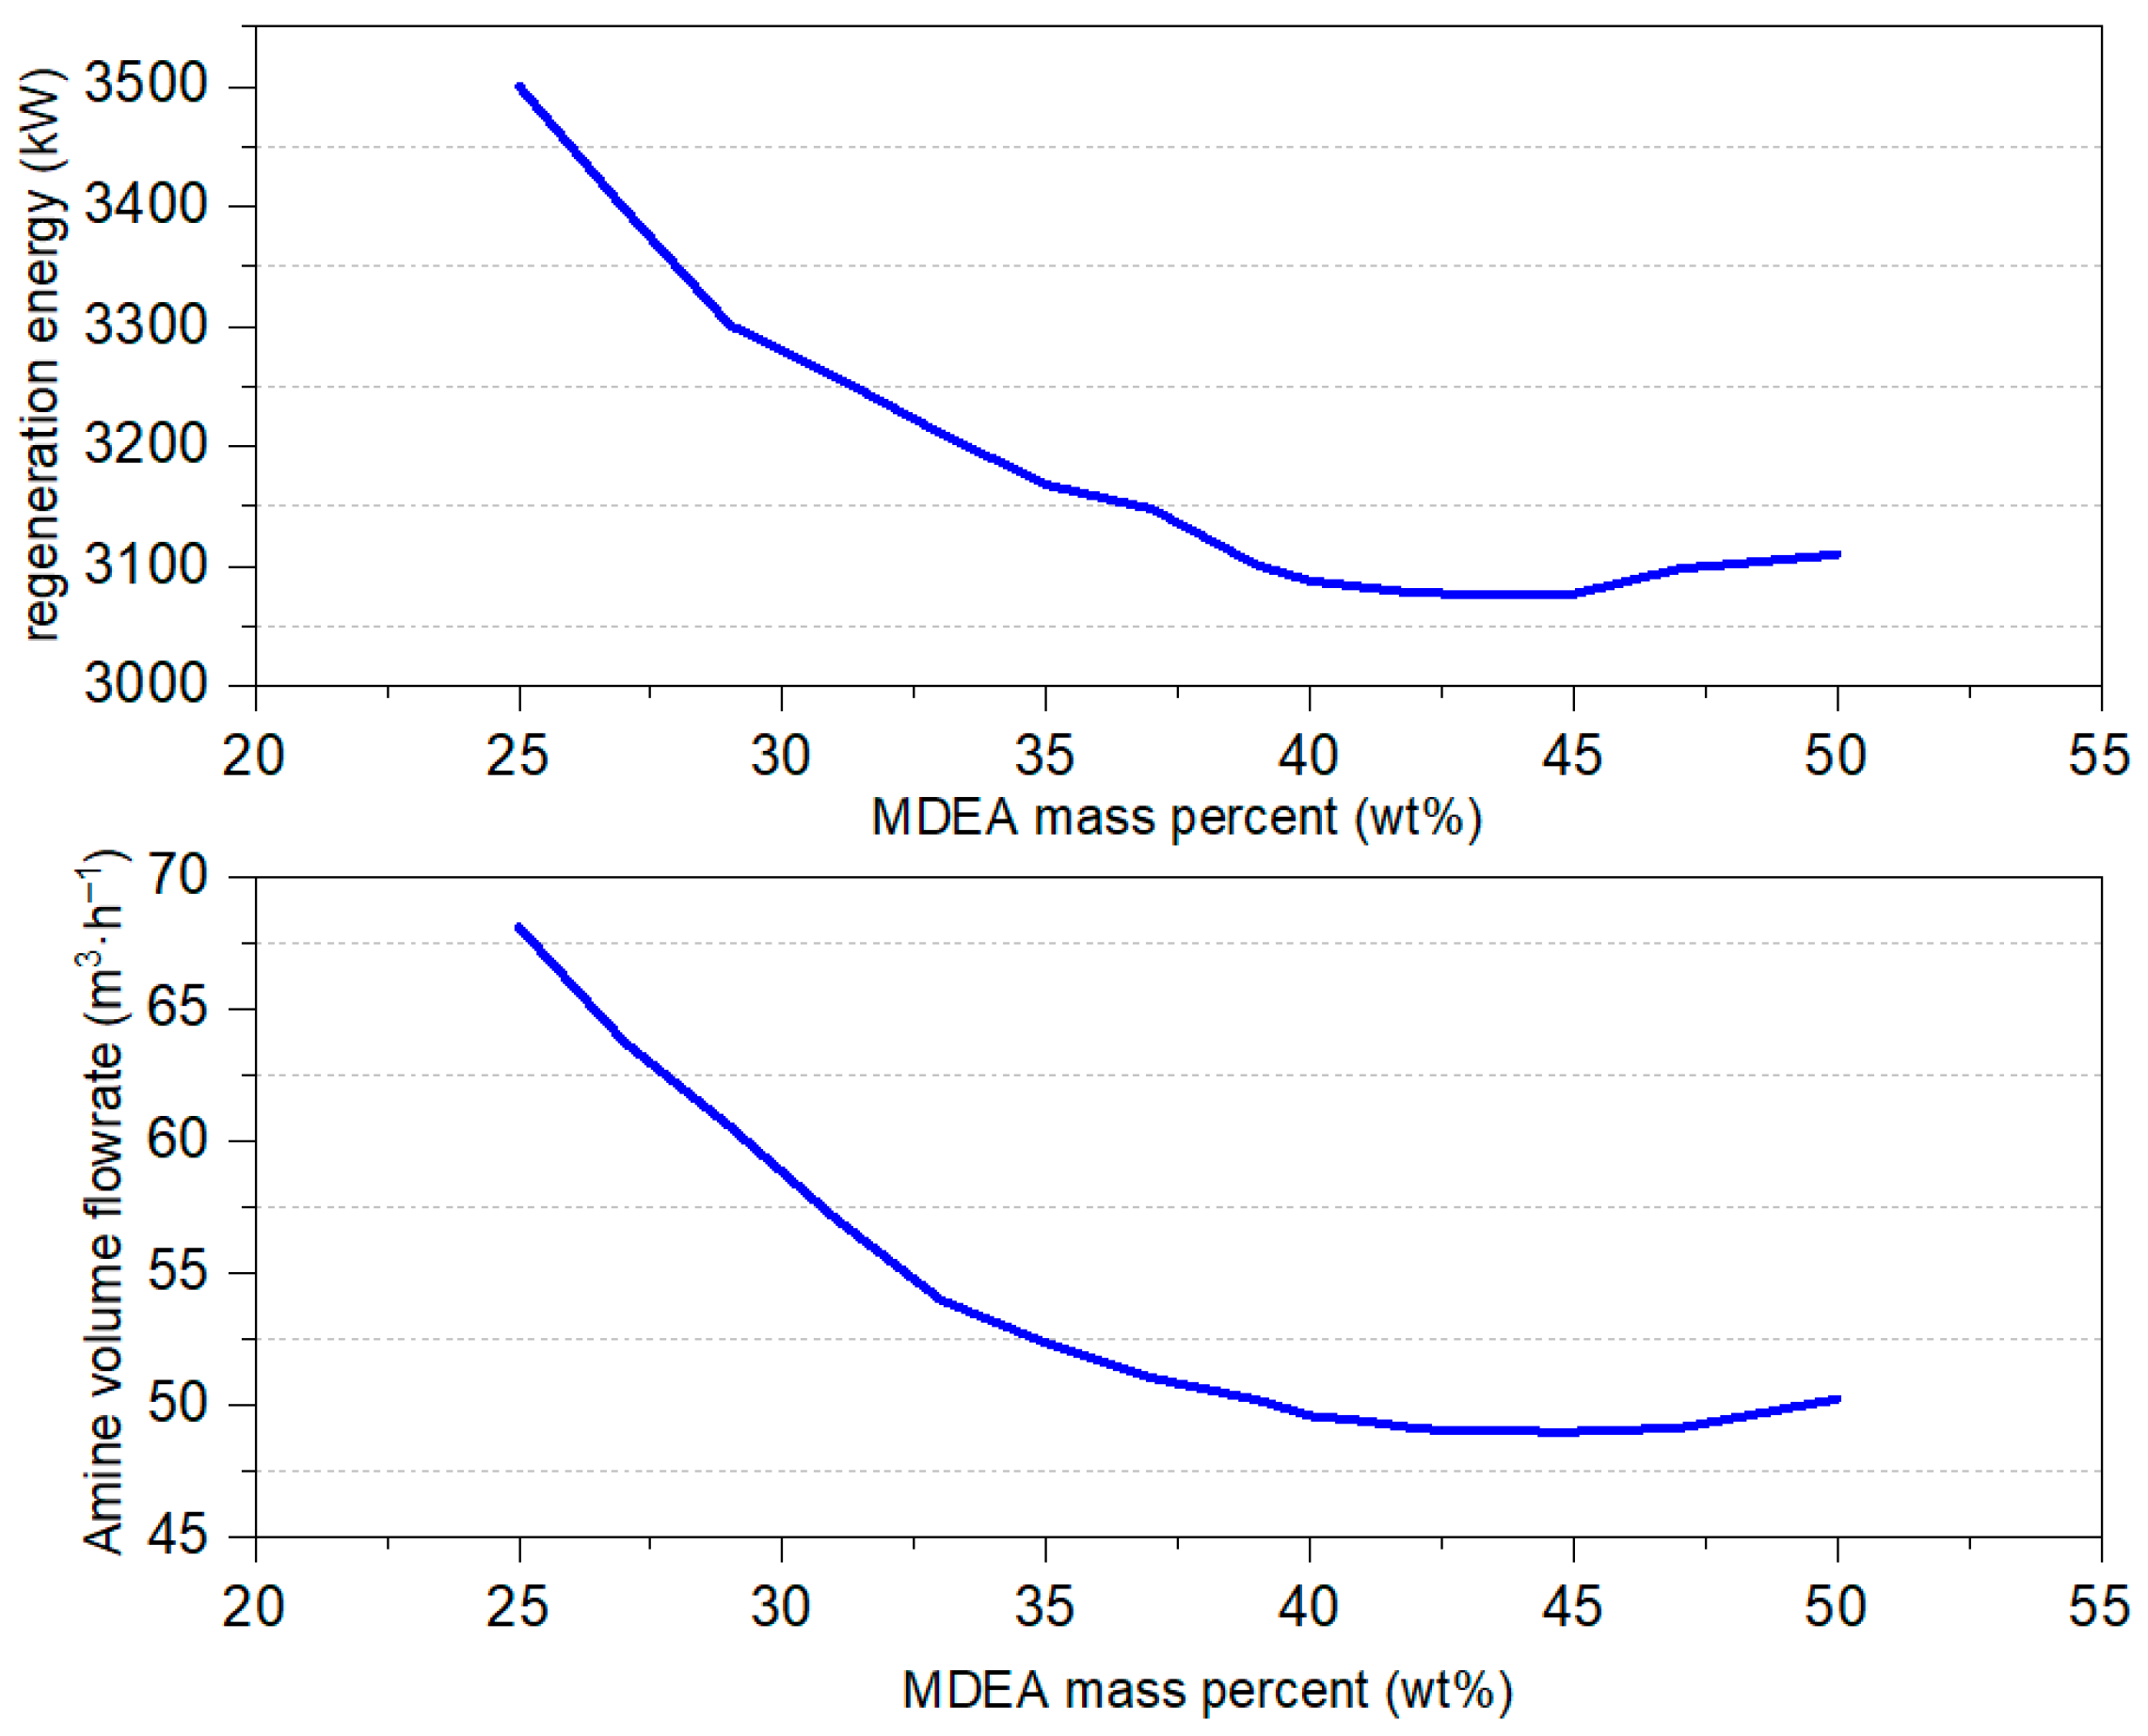
The results are shown in Figure 2, Figure 3 and Figure 4. As can be seen from Figure 2, with the gradual increase in MDEA mass fraction in amine solution, the amine solution flow rate required to remove CO2 content to below 50 × 10−6 gradually decreased until the MDEA mass fraction reached 45% and then began increasing. The trend of regeneration energy consumption is consistent with the trend of the amine solution flow rate with the change in MDEA mass fraction. When the MDEA mass fraction gradually increased from 25% to 37%, reducing the CO2 volume fraction in shale gas to below 50 × 10−6, the circulation of amine and regeneration energy consumption decreased significantly. This shows that the increase in MDEA mass fraction in the amine greatly enhanced the absorption capacity of the amine for CO2. When the MDEA mass fraction was between 37% and 40%, the decrease in amine circulation and regeneration energy consumption decreased as the MDEA mass fraction increased. When the MDEA mass fraction reached 40–45%, the decrease in amine circulation and regeneration energy consumption tended to slow down. However, when the MDEA mass fraction reached 46% and above, the circulation of amine and regeneration energy consumption gradually increased with the increase in MDEA mass fraction. This is because the increase in MDEA mass fraction leads to an increase in amine viscosity. Based on the dual-film theory, excessive amine viscosity will increase the mass transfer resistance between the gas–liquid films, thereby reducing the gas–liquid mass transfer rate, that is, the CO2 absorption rate decreases, requiring a large amount of amine to absorb CO2.
Figure 2.
Effect of MDEA mass percent on amine volume flow and regeneration energy.
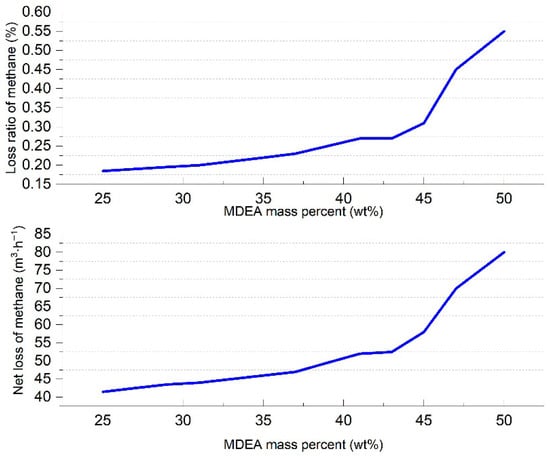
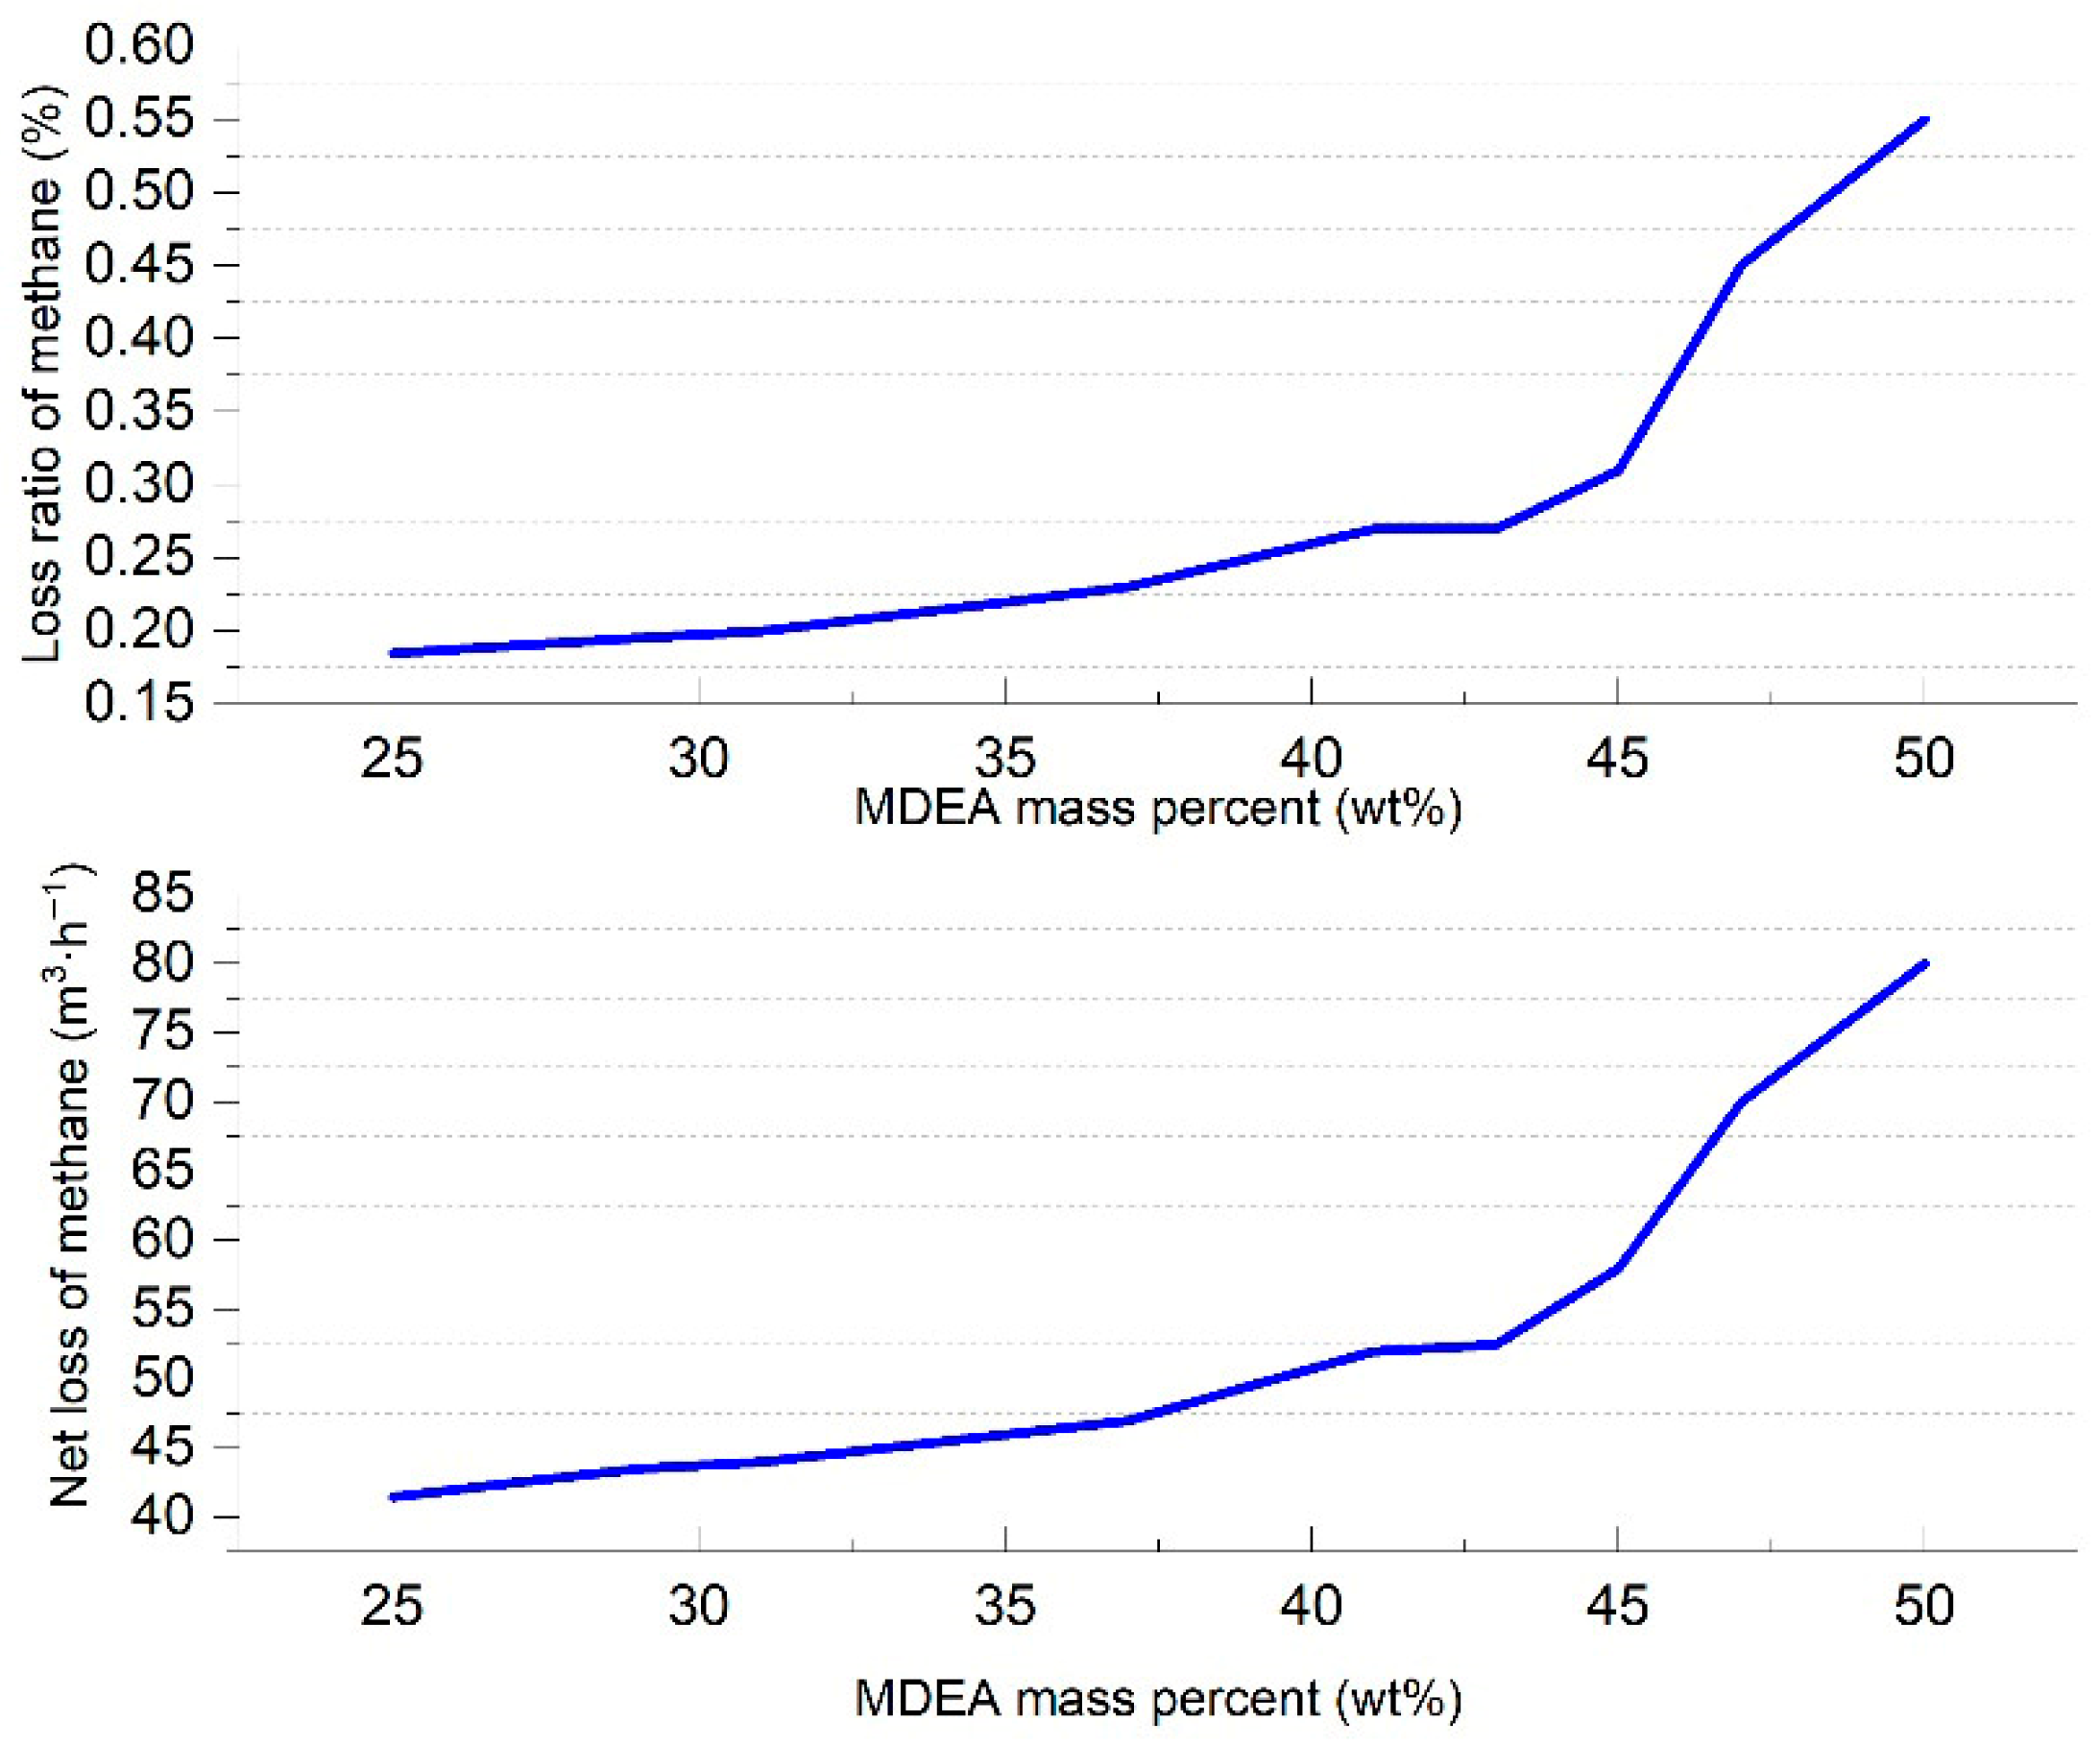
Figure 3.
Effect of MDEA mass fraction on methane loss.
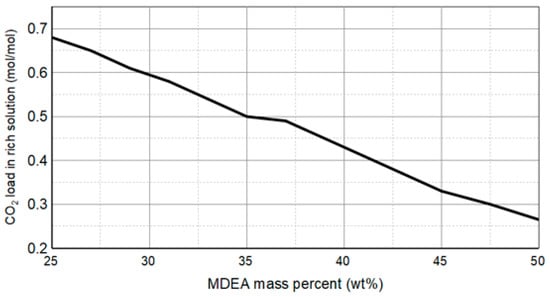
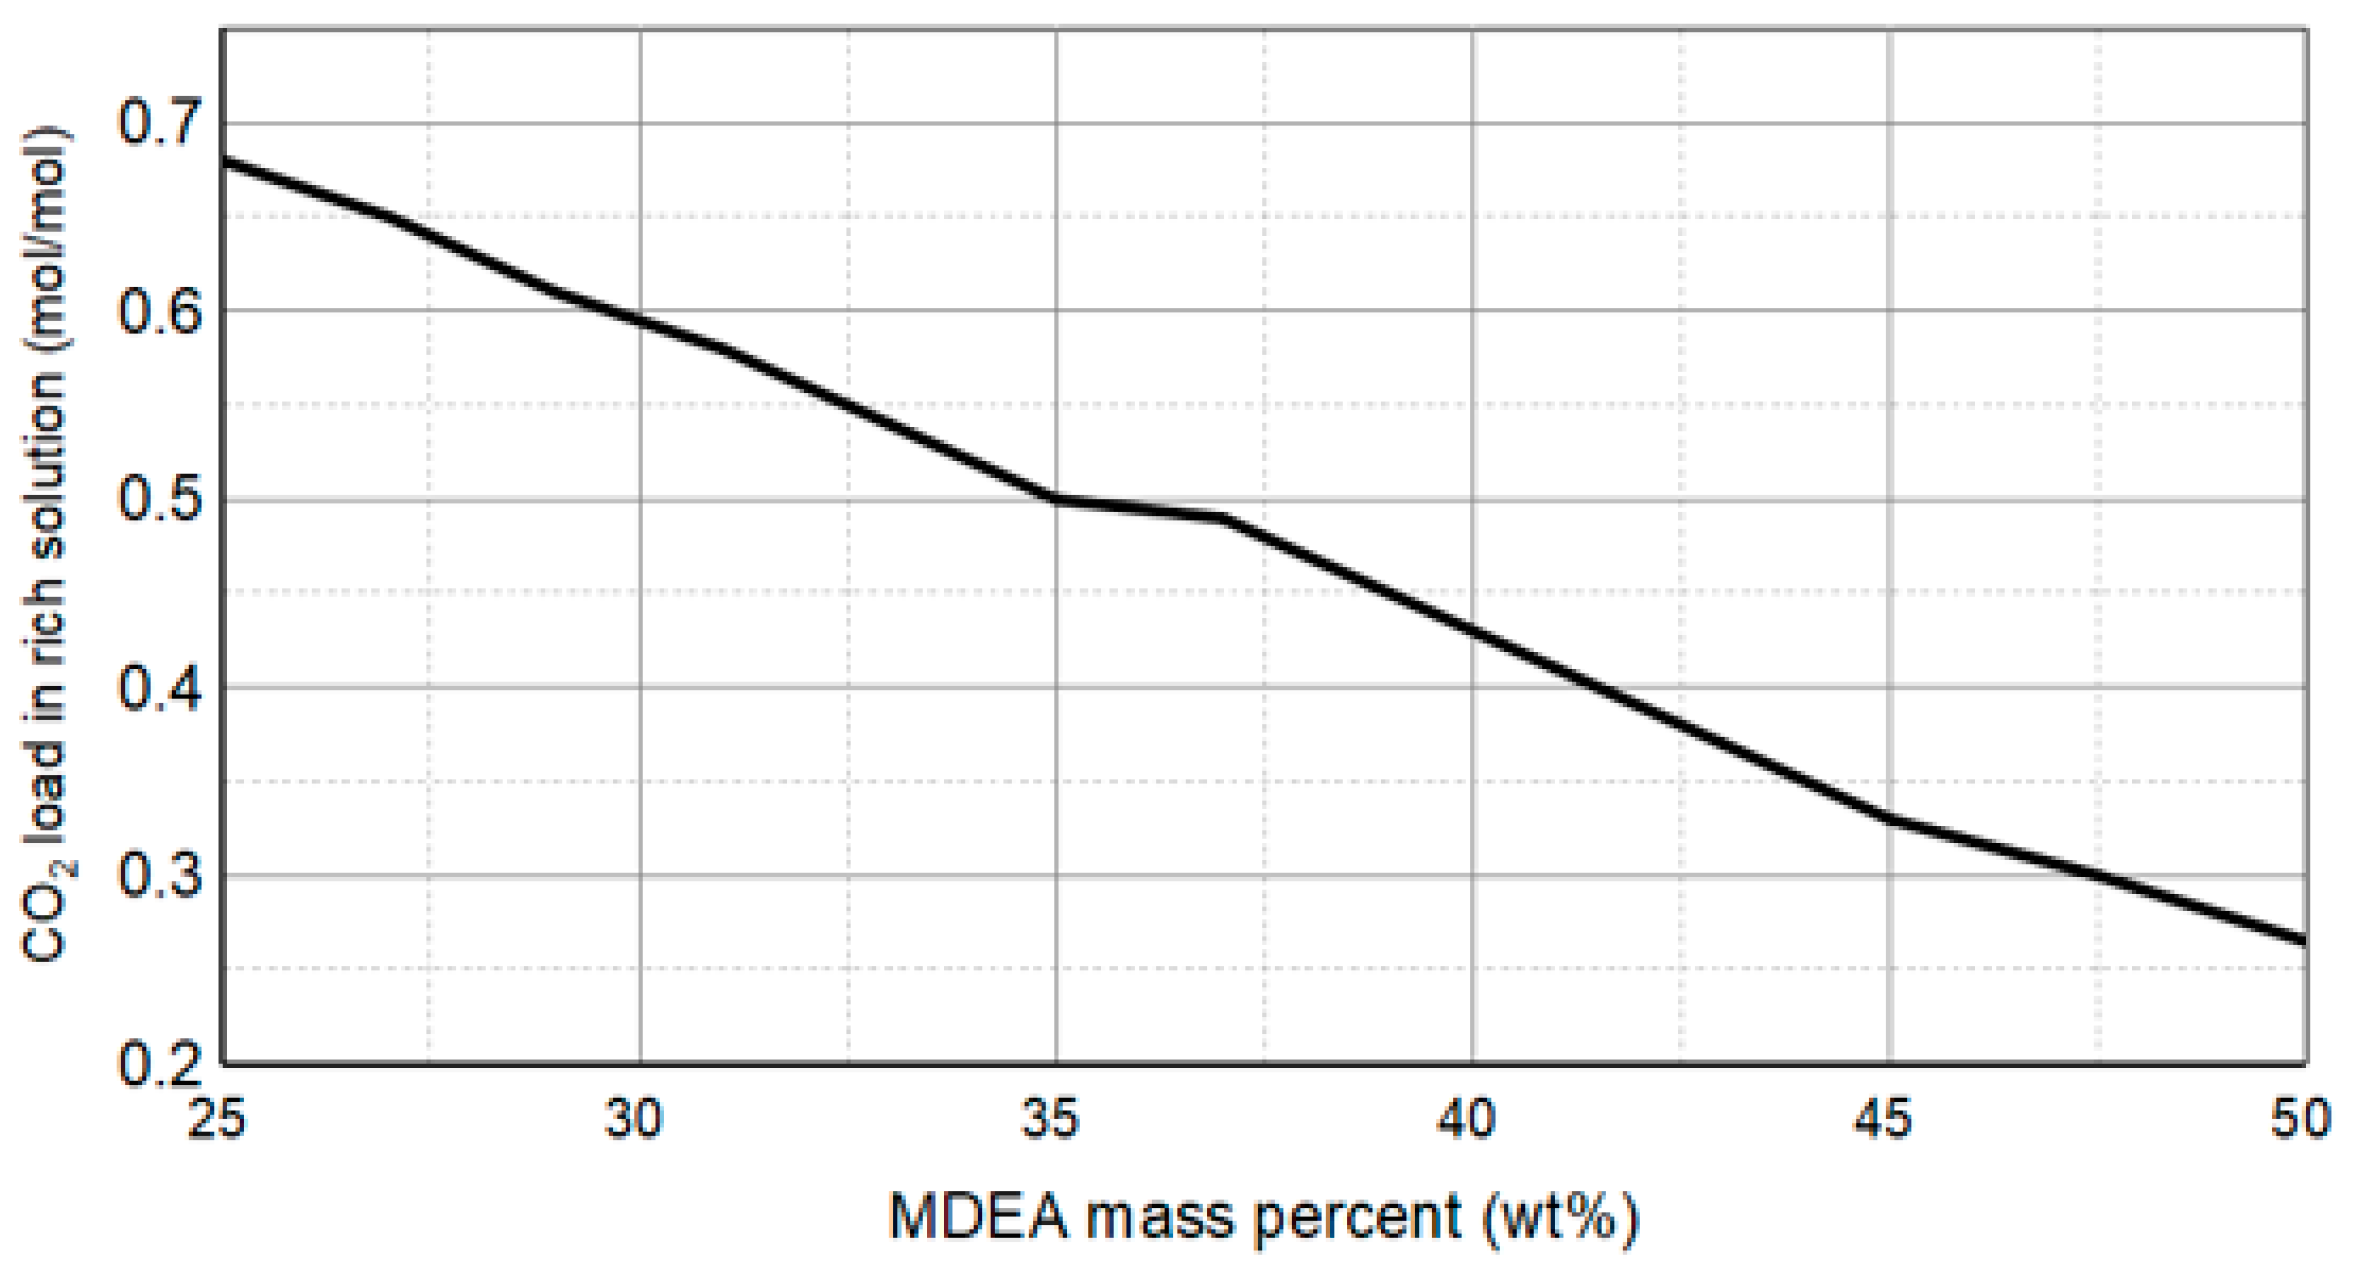
Figure 4.
Effect of MDEA mass fraction on CO2 loading in rich solution.
As can be seen from Figure 3, the loss of methane increased with the MDEA mass fraction. Through analysis of Figure 2, it can be concluded that when the MDEA mass fraction was above 46%, the increase in both the circulating amine solution volume and MDEA quality score led to a sudden increase in the amount of methane dissolved in the amine solution, resulting in a sharp increase in methane loss at the bottom of the absorption tower. Based on engineering experience, it is recommended that the loss rate of methane be kept no more than 0.3% in order to minimize economic losses. Therefore, the MDEA mass fraction should be controlled below 43% to keep the loss rate of methane below 0.3%.
As can be seen from Figure 4, the CO2 load in the rich liquid gradually increased with the decrease in MDEA mass fraction. In practical application, the CO2 load in rich liquid should not be higher than 0.6 mol/mol, as it will cause serious corrosion of the downstream carbon steel pipeline. Although increasing the MDEA mass fraction can reduce the CO2 load in the rich liquid, it will also cause a higher loss rate of methane. Therefore, it is recommended that the CO2 load in rich liquid should not be higher than 0.6 mol/mol. At the same time, the downstream pipeline in contact with the rich liquid should be stainless steel.
Based on the comprehensive analysis of amine circulation rate, regeneration energy consumption, methane loss, and rich amine acid gas load trend, it can be concluded that the optimal range of MDEA mass fraction is 37~42%. Within this range, when the MDEA mass fraction is 40%, the amine circulation rate and regeneration energy consumption curves reach a minimum, while the methane loss rate is less than 0.3% and meets the requirement of the rich amine acid gas load limit; therefore, the optimized value of the MDEA mass fraction is 40%.
4.1.2. Optimization of PZ Mass Fraction
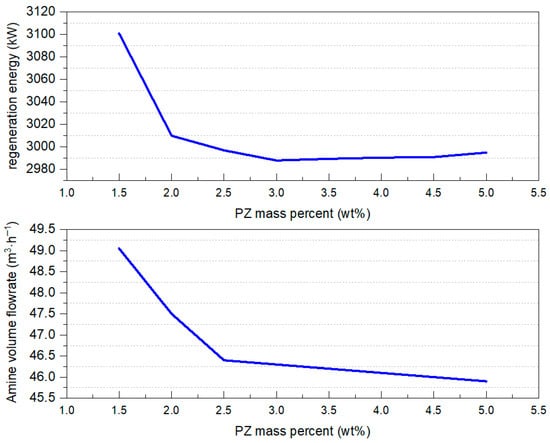
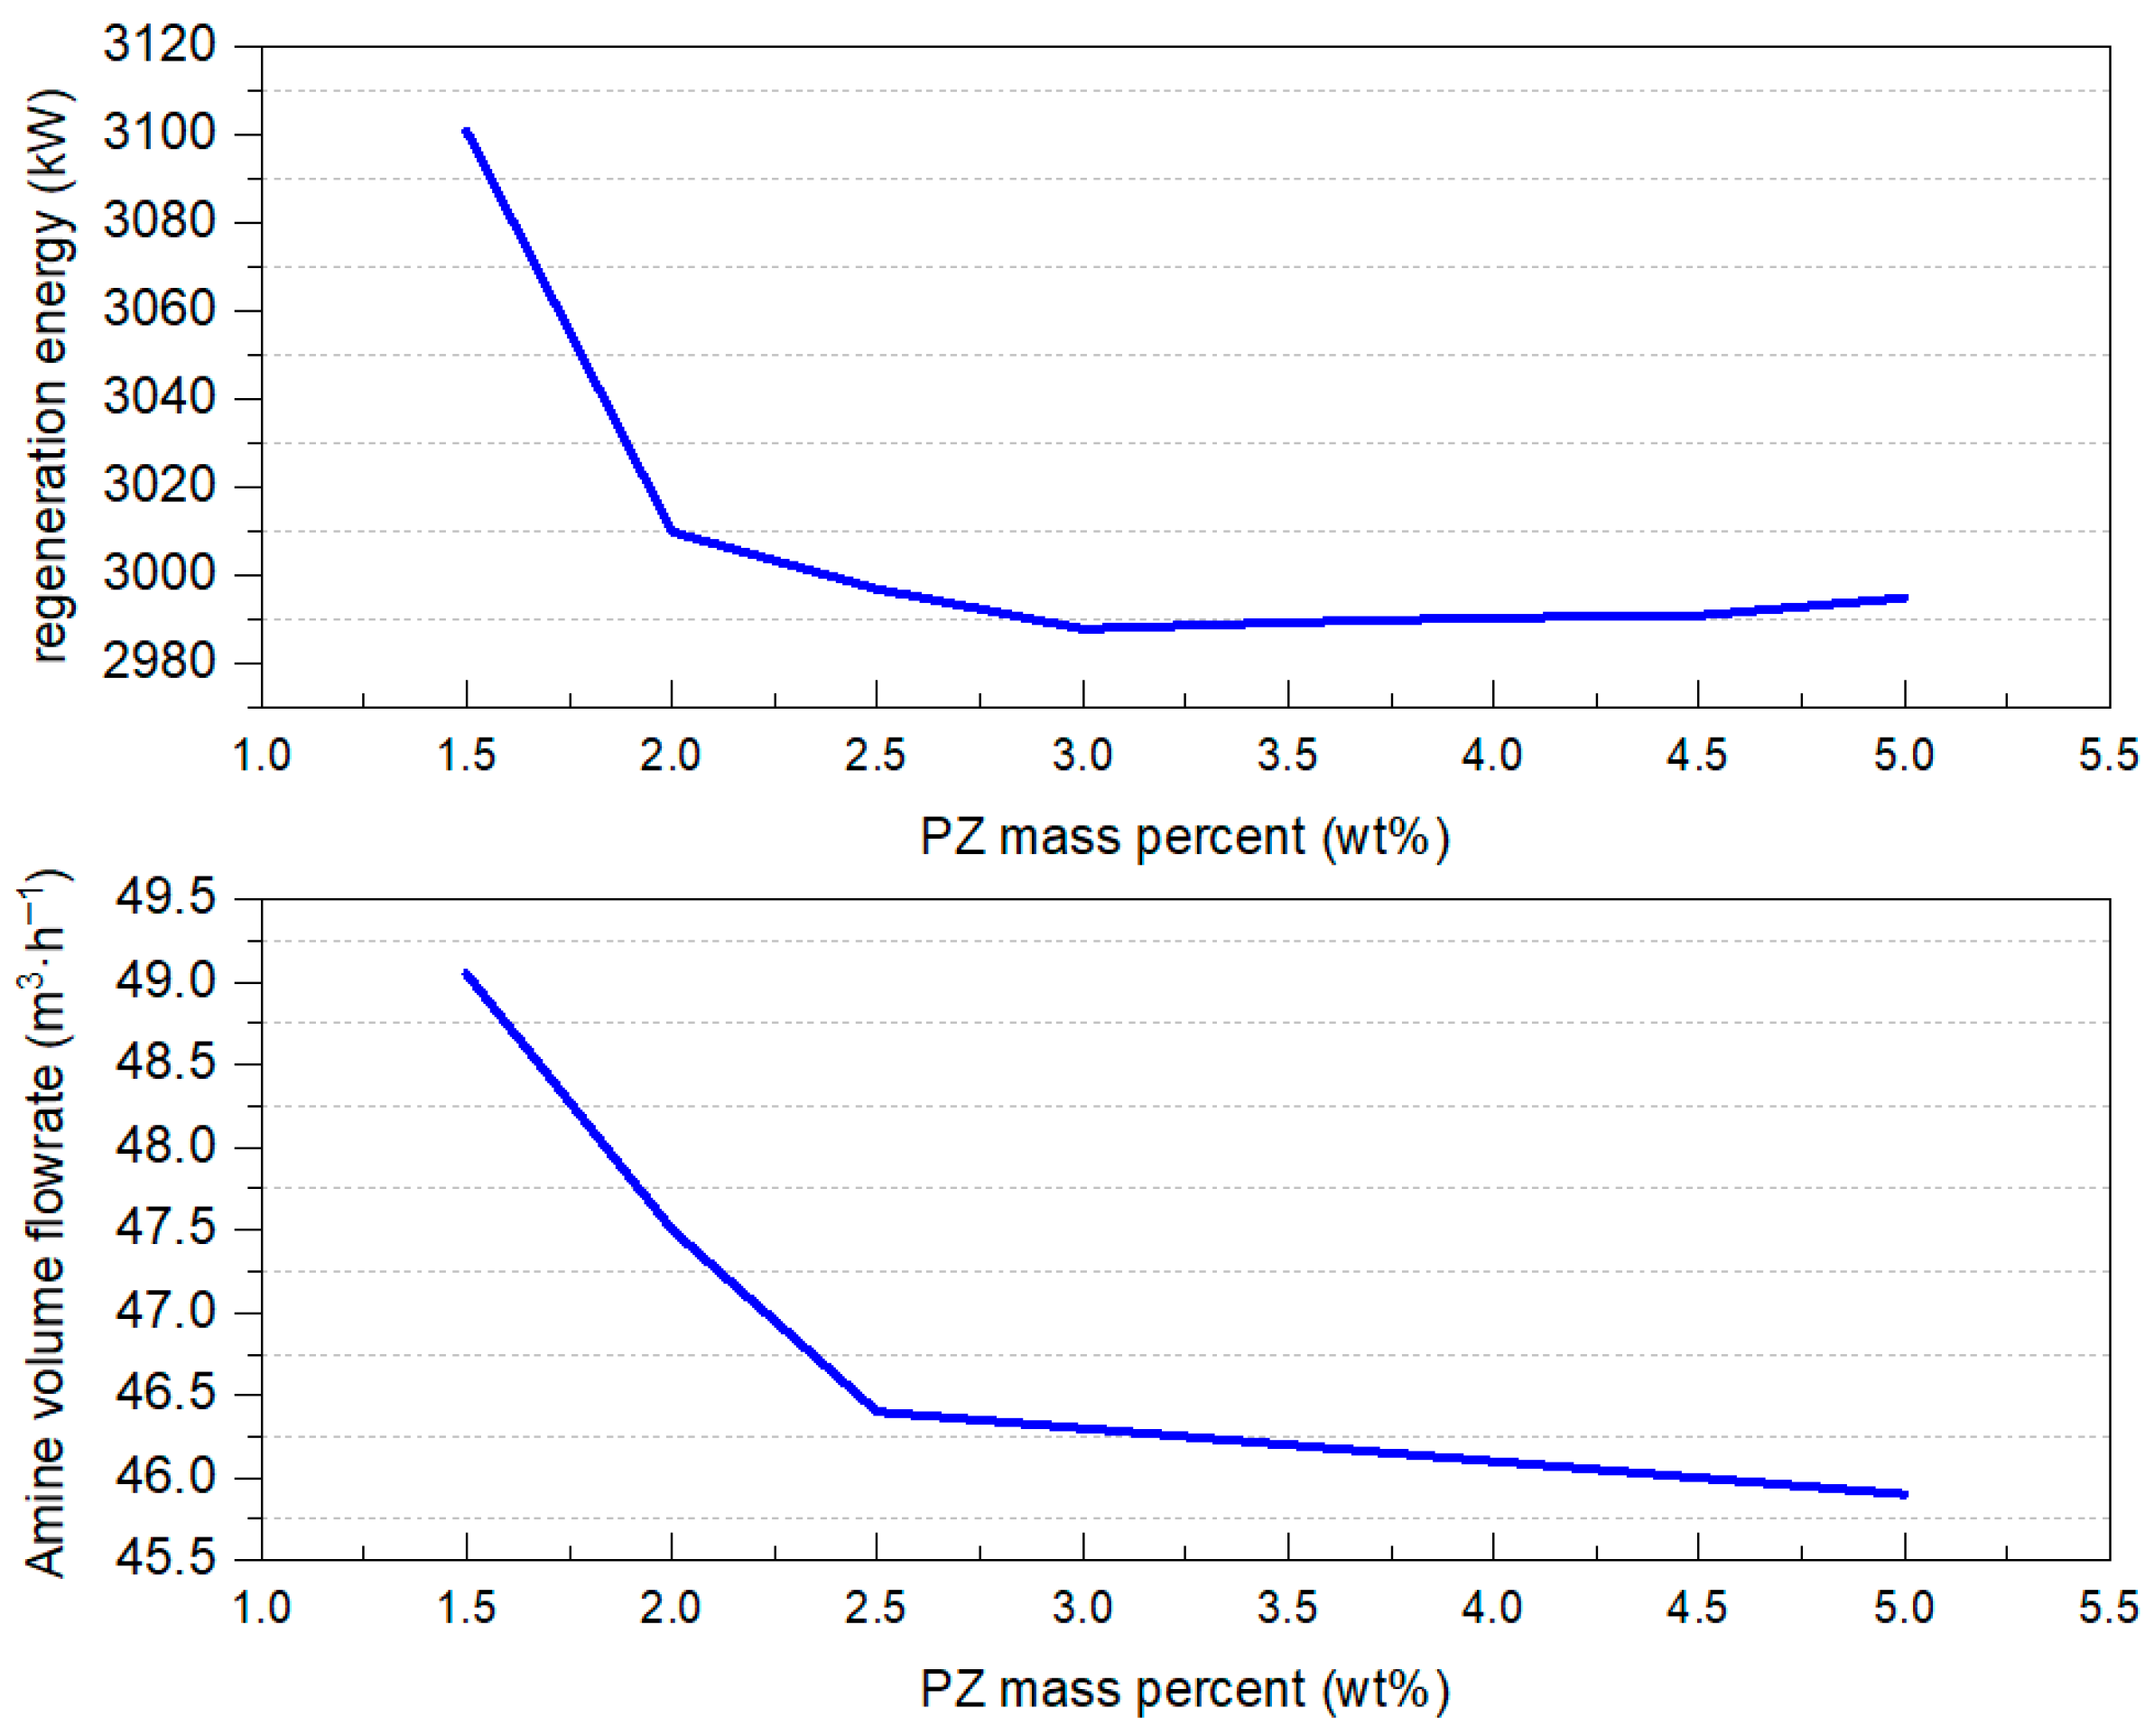
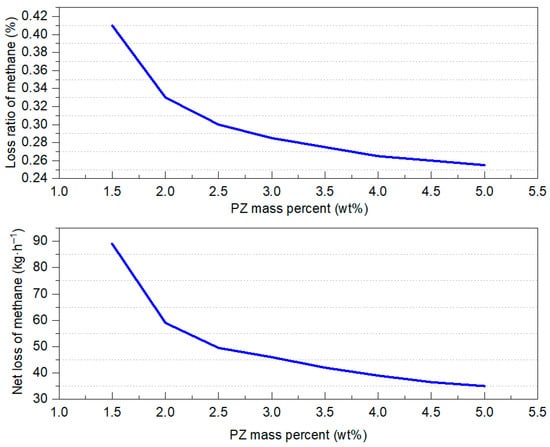
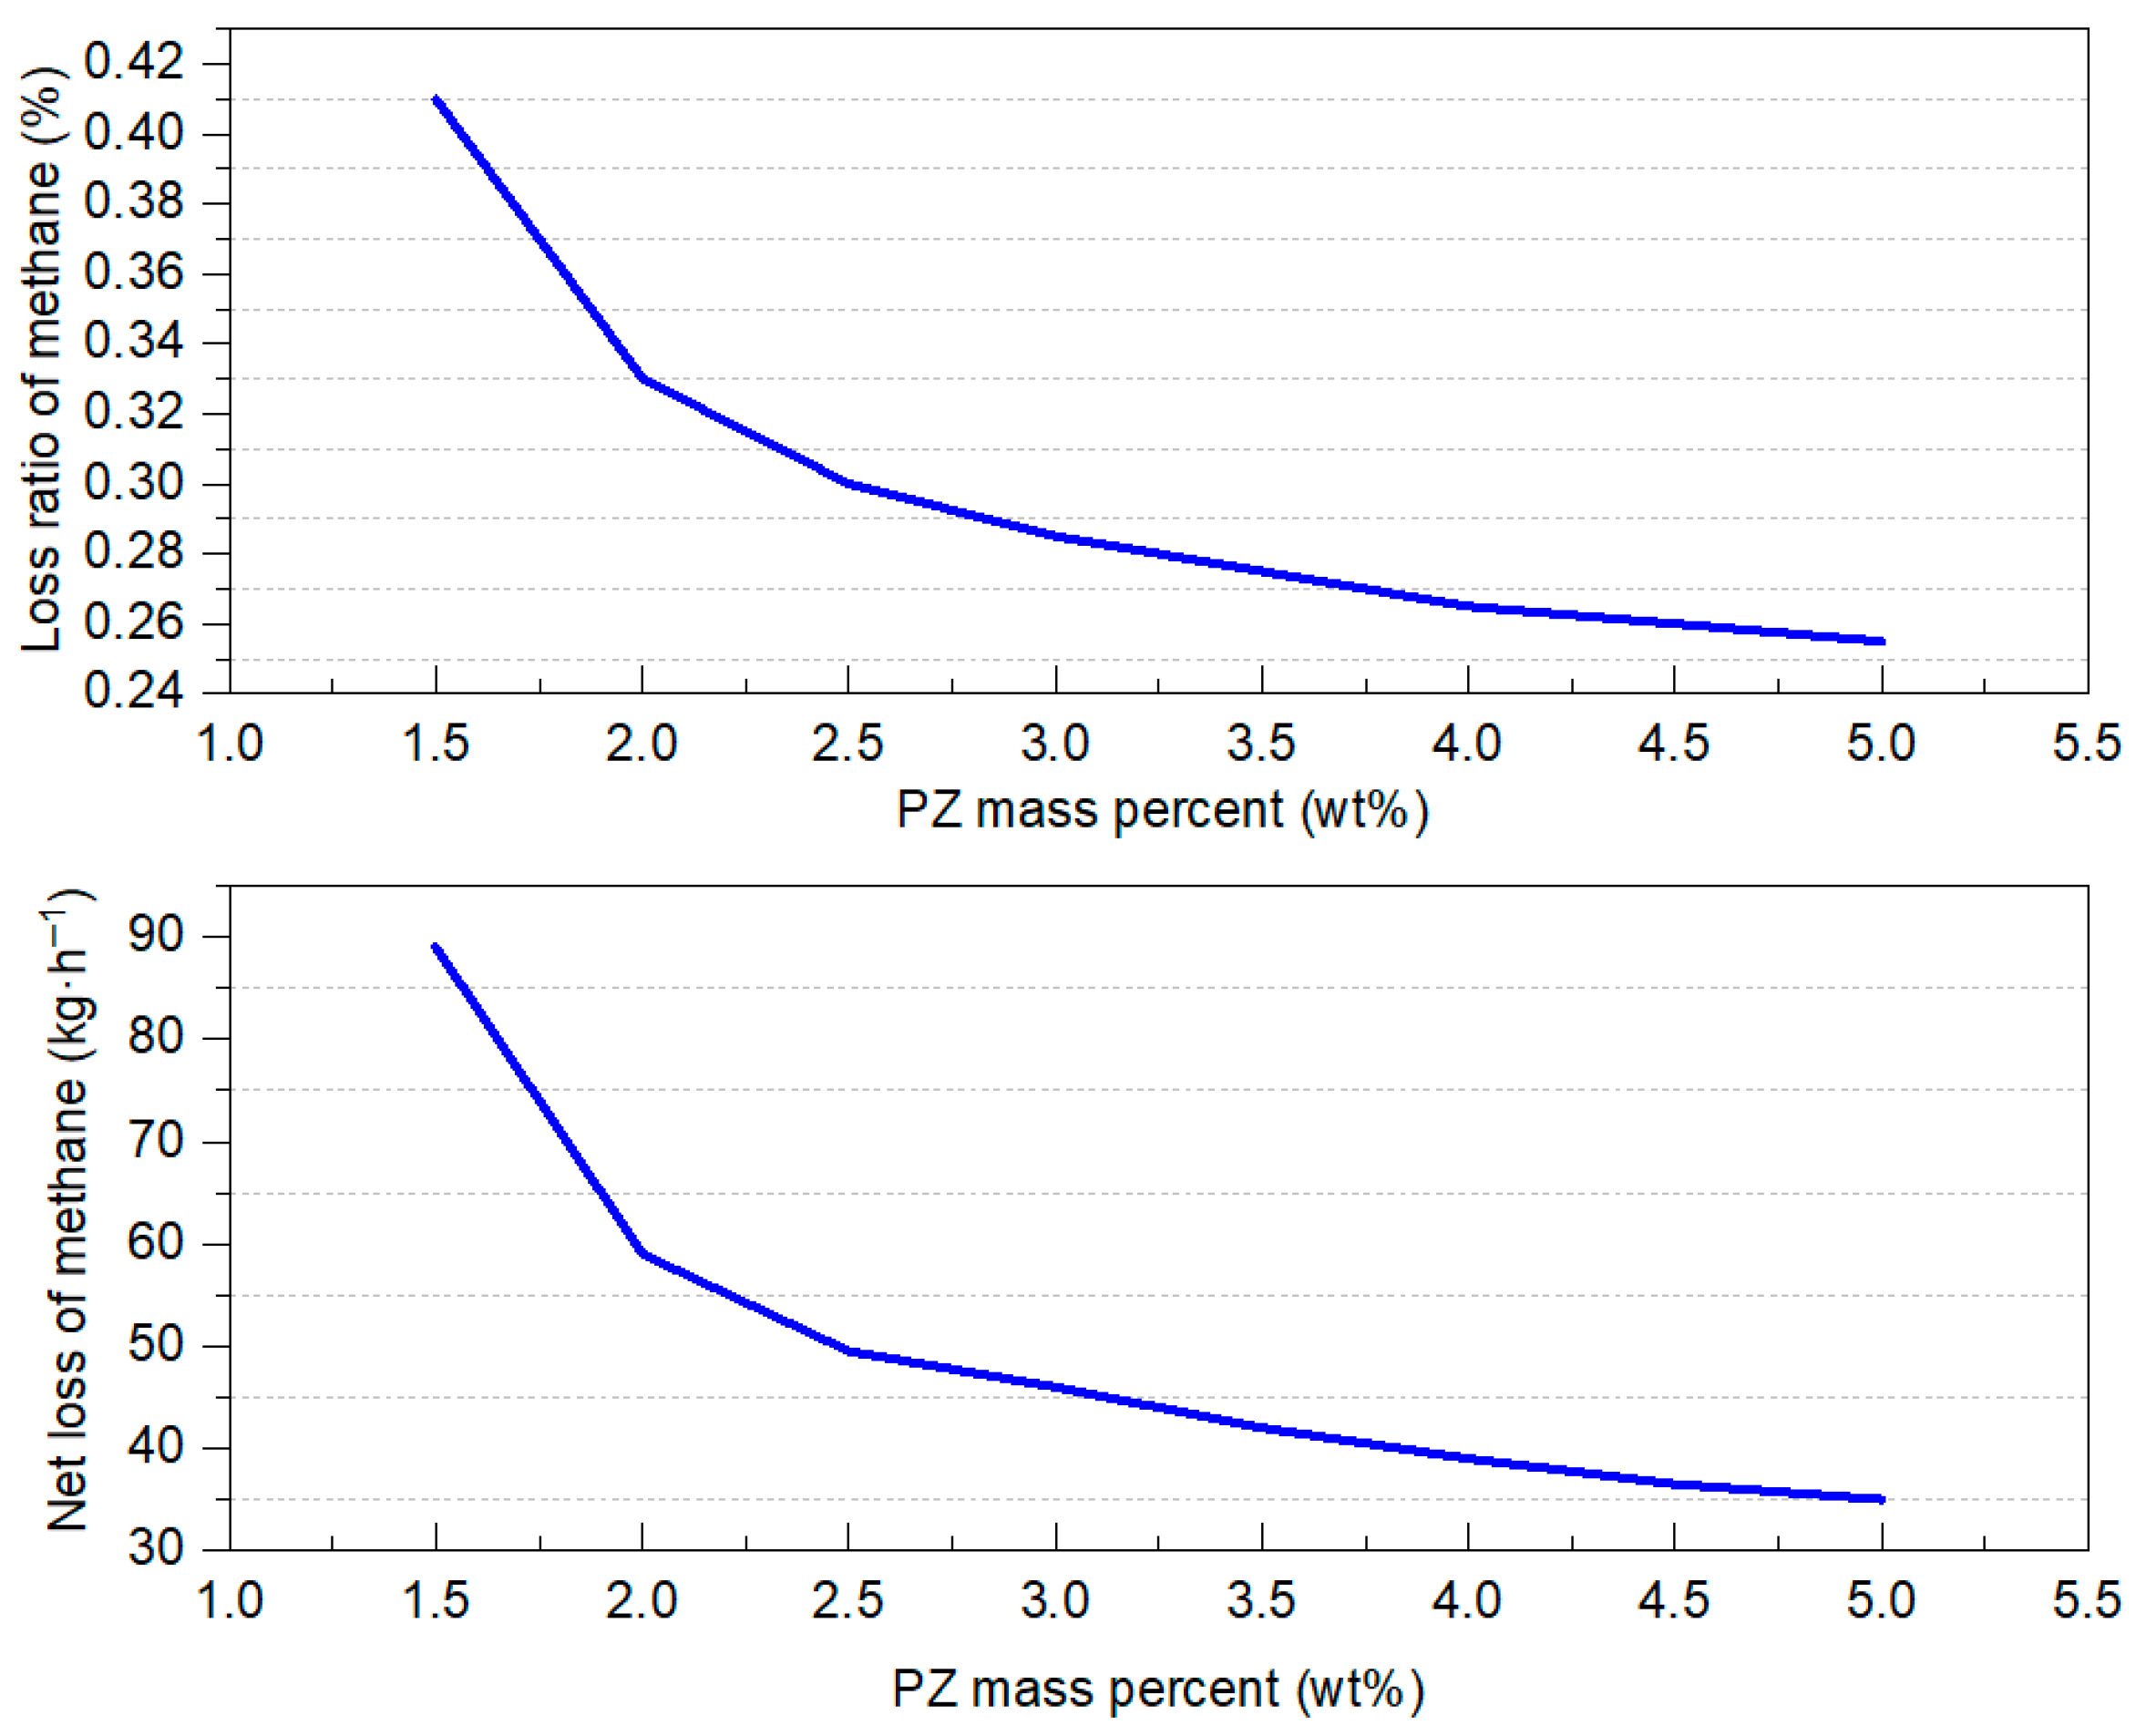
Based on the screening results in Section 3.1, the MDEA mass fraction was set to 40%. The effect of MDEA mass fraction on amine solution volume flow rate, regeneration energy consumption, methane loss, and CO2 load was investigated when amine solutions with different PZ mass fractions were used to remove CO2 from raw shale gas to less than 50 × 10−6. The results are shown in Figure 5, Figure 6 and Figure 7.
Figure 5.
Effect of PZ mass fractions on amine volume flow and regeneration energy.
Figure 6.
Effect of PZ mass fractions on methane loss.
Figure 7.
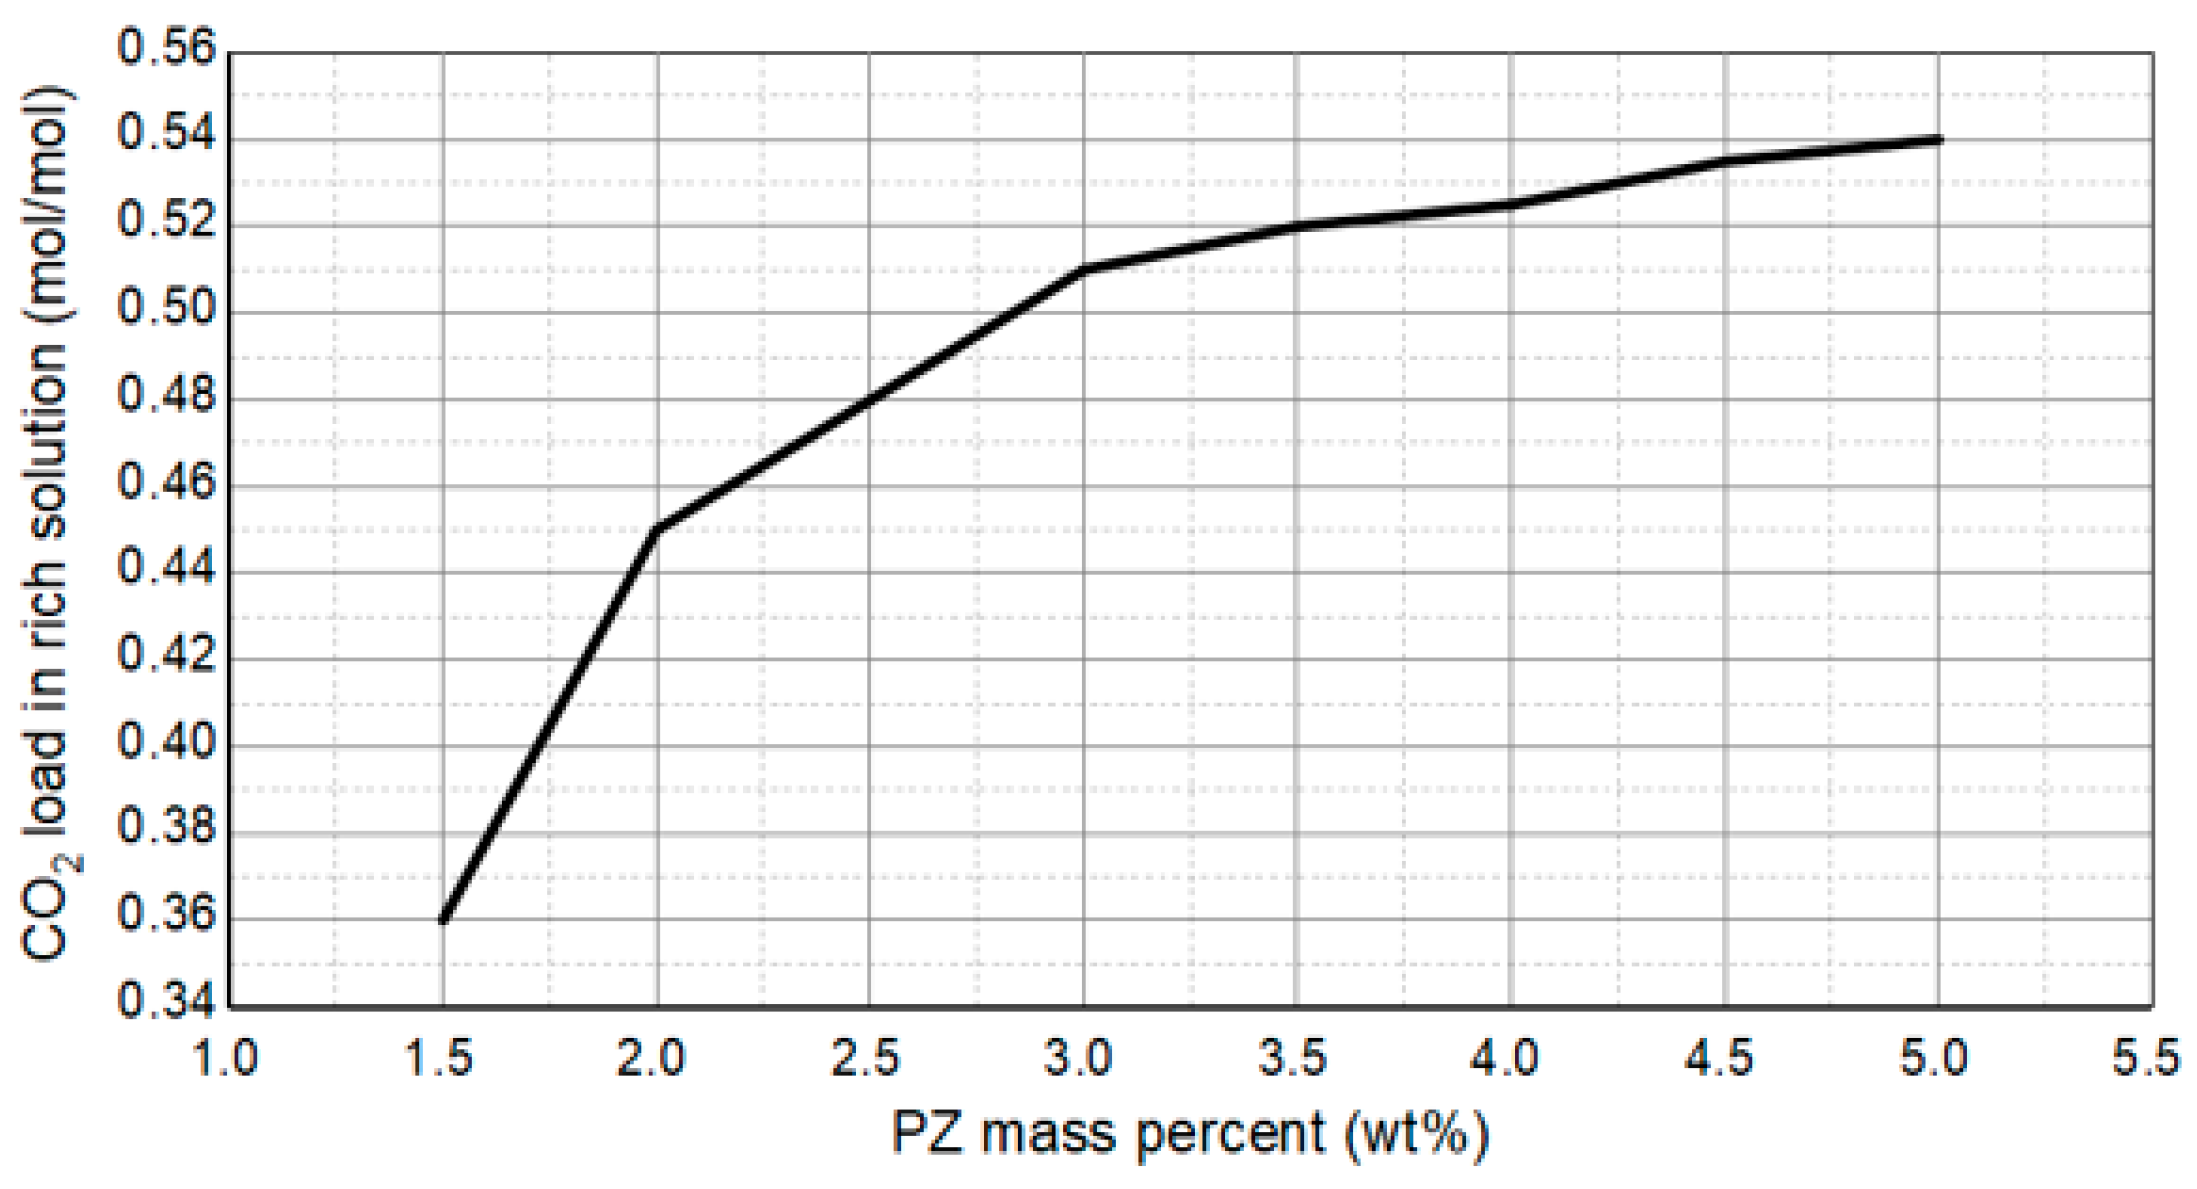
Effect of PZ mass fractions on rich solution.
As can be seen from Figure 5, when the PZ mass fraction was lower than 2.5%, both the amine solution flow rate and regeneration energy consumption decreased greatly with the increase in the PZ mass fraction. This was because the PZ mass fraction in the amine liquid was low, and a small amount of PZ could produce a significant activation effect on MDEA. When the PZ mass fraction was higher than 2.5%, the amine solution flow rate decreased slowly with the increase in PZ mass fraction. When the mass fraction of PZ reached 3% or above, further increasing the PZ addition had little effect on the energy consumption for regeneration, indicating that a low dosage of the activating agent PZ can already provide a good activation effect on MDEA, and increasing the PZ content further will not significantly improve the activation effect on MDEA.
As can be seen from Figure 6, the effect of PZ mass fraction on methane loss was opposite to that of MDEA mass fraction on methane loss. It can be seen that as the PZ mass fraction increased, the methane loss gradually decreased, indicating that the increase in PZ quality score helps to reduce methane loss. According to the “uniform activation” theory (the activation effect of PZ is mainly reflected in the reduction in the activation free energy of the reaction, which promotes the efficient progress of the CO2 absorption reaction), PZ enhances the activation effect of MDEA, accelerates the rate at which MDEA absorbs CO2, and thereby reduces the absorption of methane by the amine solution. Based on practical engineering experience, the methane loss rate is recommended to be controlled below 0.3%. As shown in the curve in Figure 6, when the PZ quality score reaches 2.5% and above, the methane loss rate is lower than the recommended value, indicating a lower methane loss.
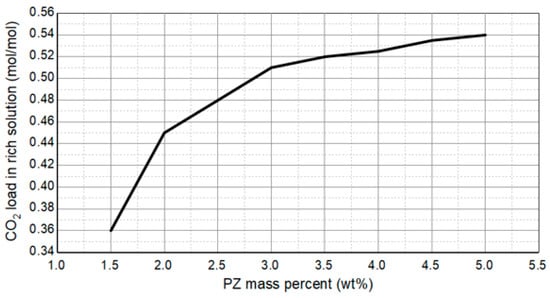
As can be seen from Figure 7, when the mass fraction of PZ was less than 3%, the rich acid gas load increased significantly with the increase in PZ mass fraction. This indicates that in this concentration range, the dosage of activator PZ is low, and a slight increase in its content can significantly enhance the activation effect on MDEA, thereby significantly increasing the rich acid gas load. When the mass fraction of PZ reached 3% or above, the rich acid gas load gradually reached a higher value, and the increasing trend of the rich acid gas load became flat, indicating that the content of activator PZ had reached a good activation effect at this time.
Based on the analysis above, it can be concluded that a small amount of PZ addition can significantly improve the absorption effect of the amine solution on CO2. By comprehensively examining the effect of PZ mass fraction on amine solution volume flow rate, regeneration energy consumption, methane loss, and CO2 load, it is not difficult to find that the preferred range of PZ mass fraction is 2.5–5%. Based on the manufacturer’s proposal and industrial experience, it is recommended that the best PZ mass fraction be 3%.
In summary, it is recommended that the preferred amine solution mass ratio be 40% MDEA + 3.0% PZ for low-concentration CO2 capture of typical shale gas from the northern Guizhou region in China.
4.2. Optimization of Process Parameters
Based on the preferred amine solution with a mass ratio of 40% MDEA + 3.0% PZ selected in Section 3.1 above, sensitivity analysis was used to optimize the key parameters of the shale gas low-concentration CO2 capture process, as shown below.
4.2.1. Amine Liquid Circulation
With the HYSYS model above, by changing the amine liquid circulation in the process, the effect of amine liquid circulation on the decarbonization effect was investigated when the CO2 content in shale gas was removed to less than 50 × 10−6. The result is shown in Figure 8. And the effect of amine liquid circulation on energy consumption of key equipment are shown in in Figure 9 and Table 4.
Figure 8.
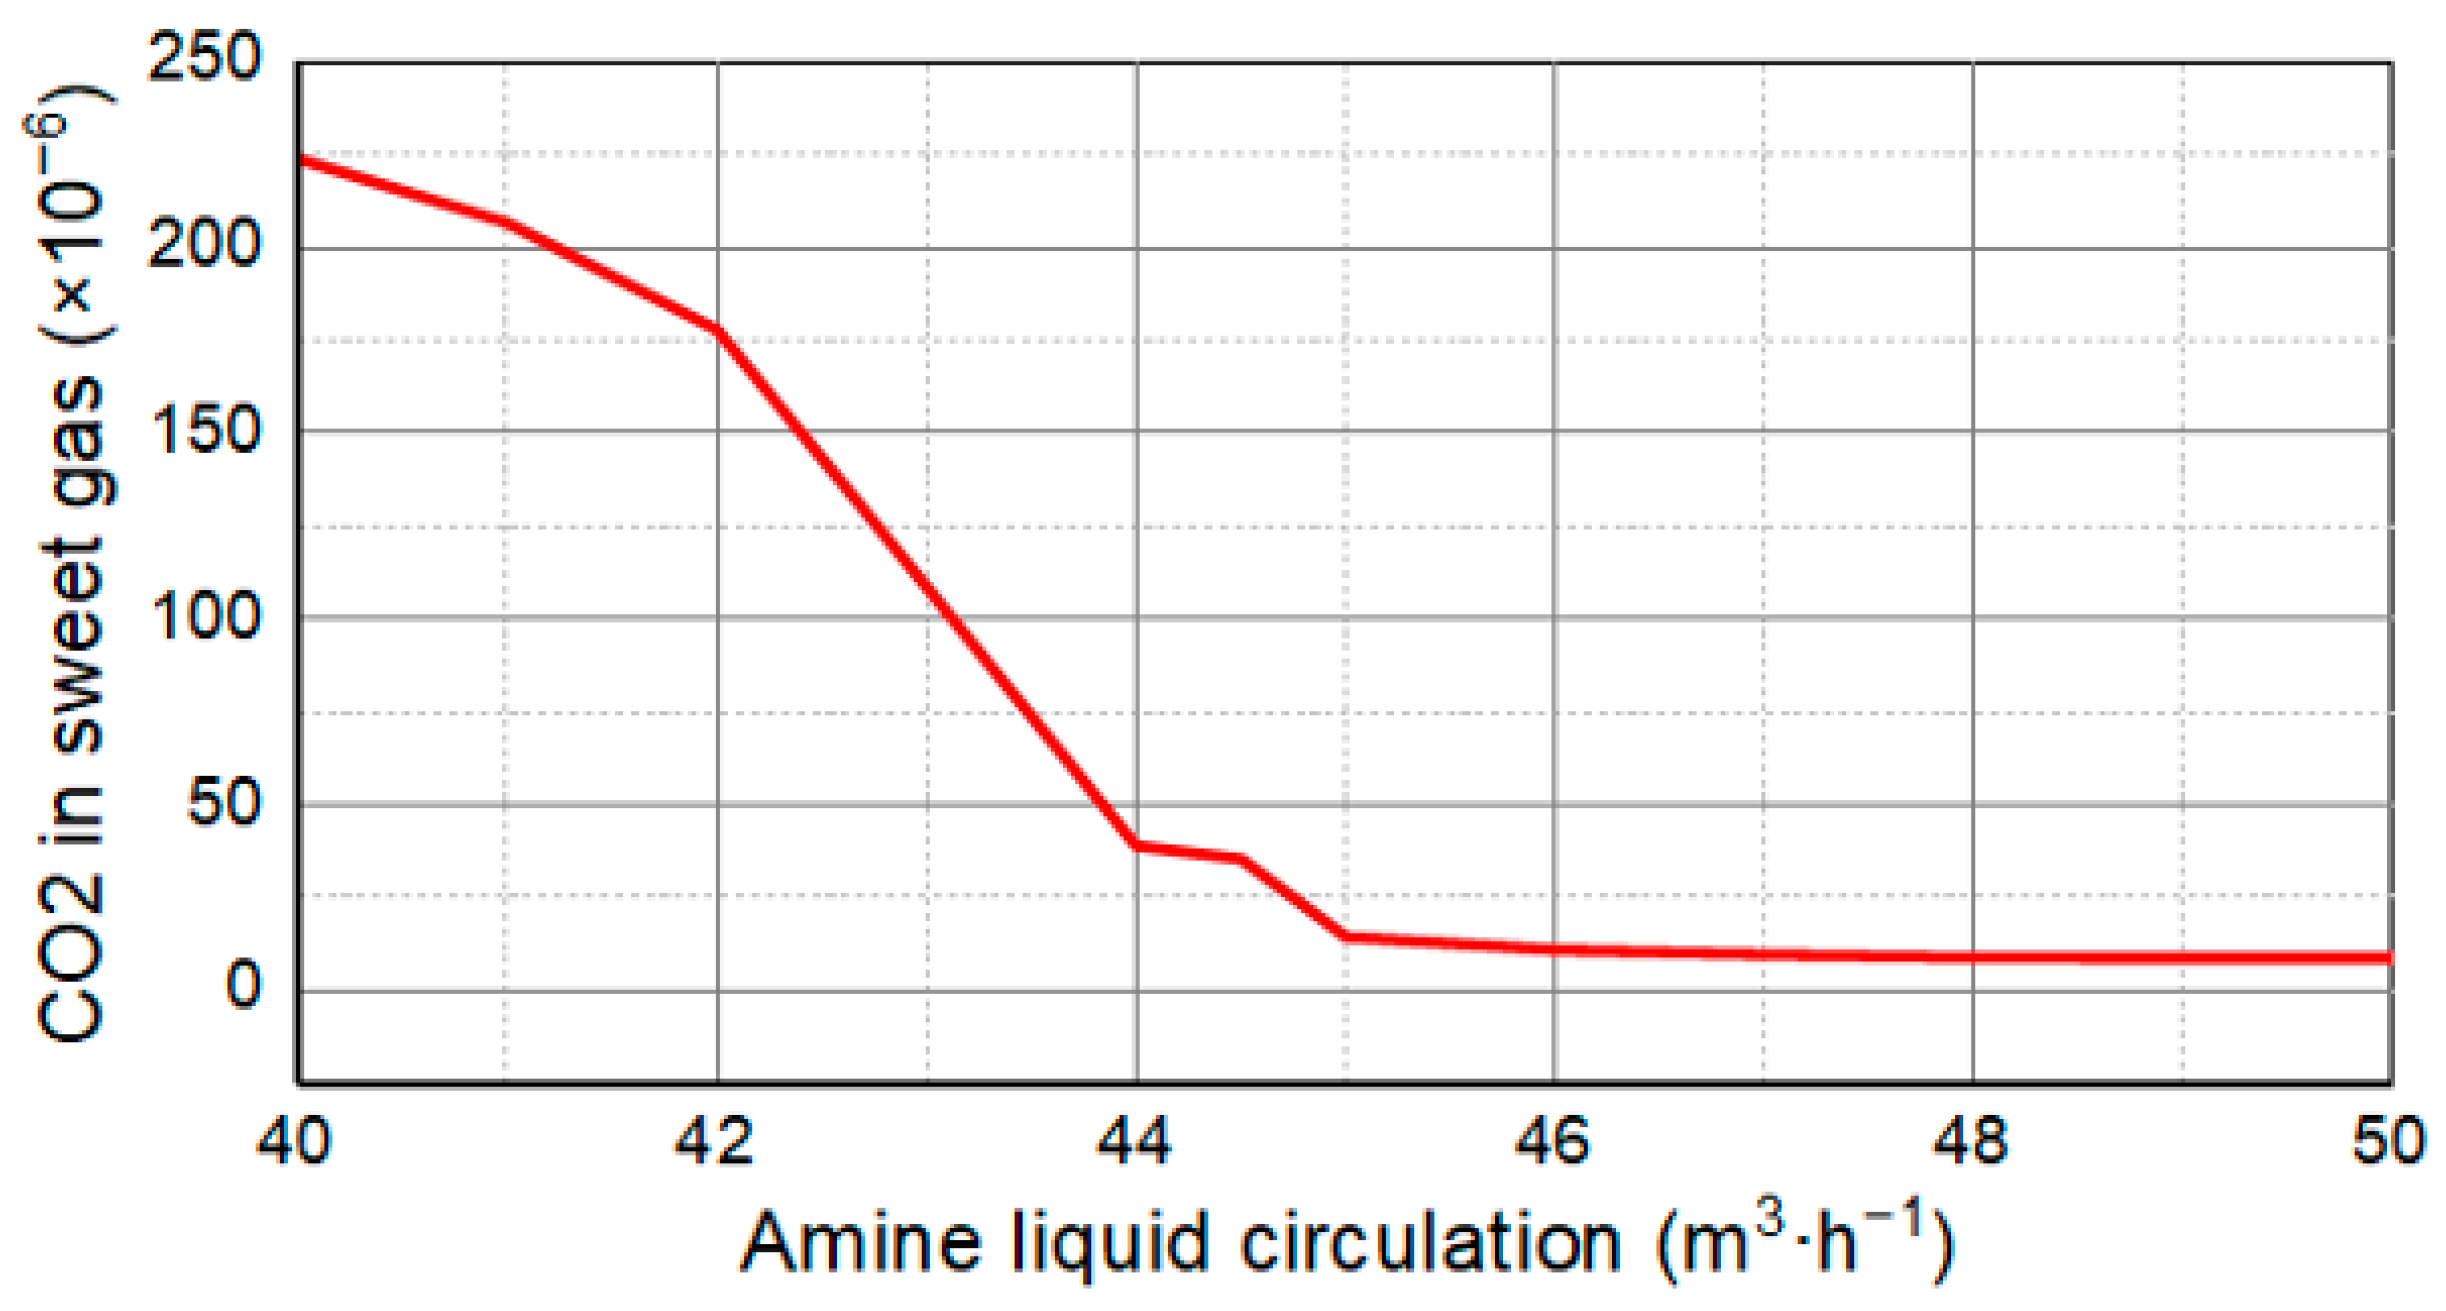
Effect of amine circulation on decarbonization effect.
Figure 9.
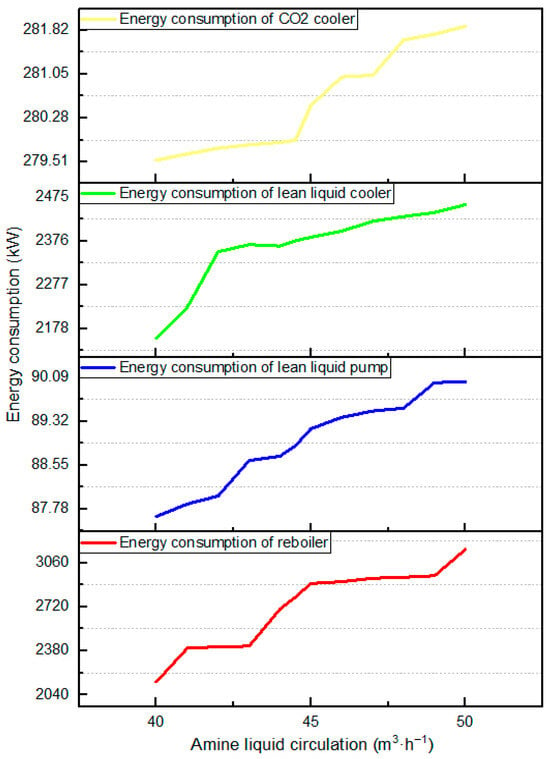
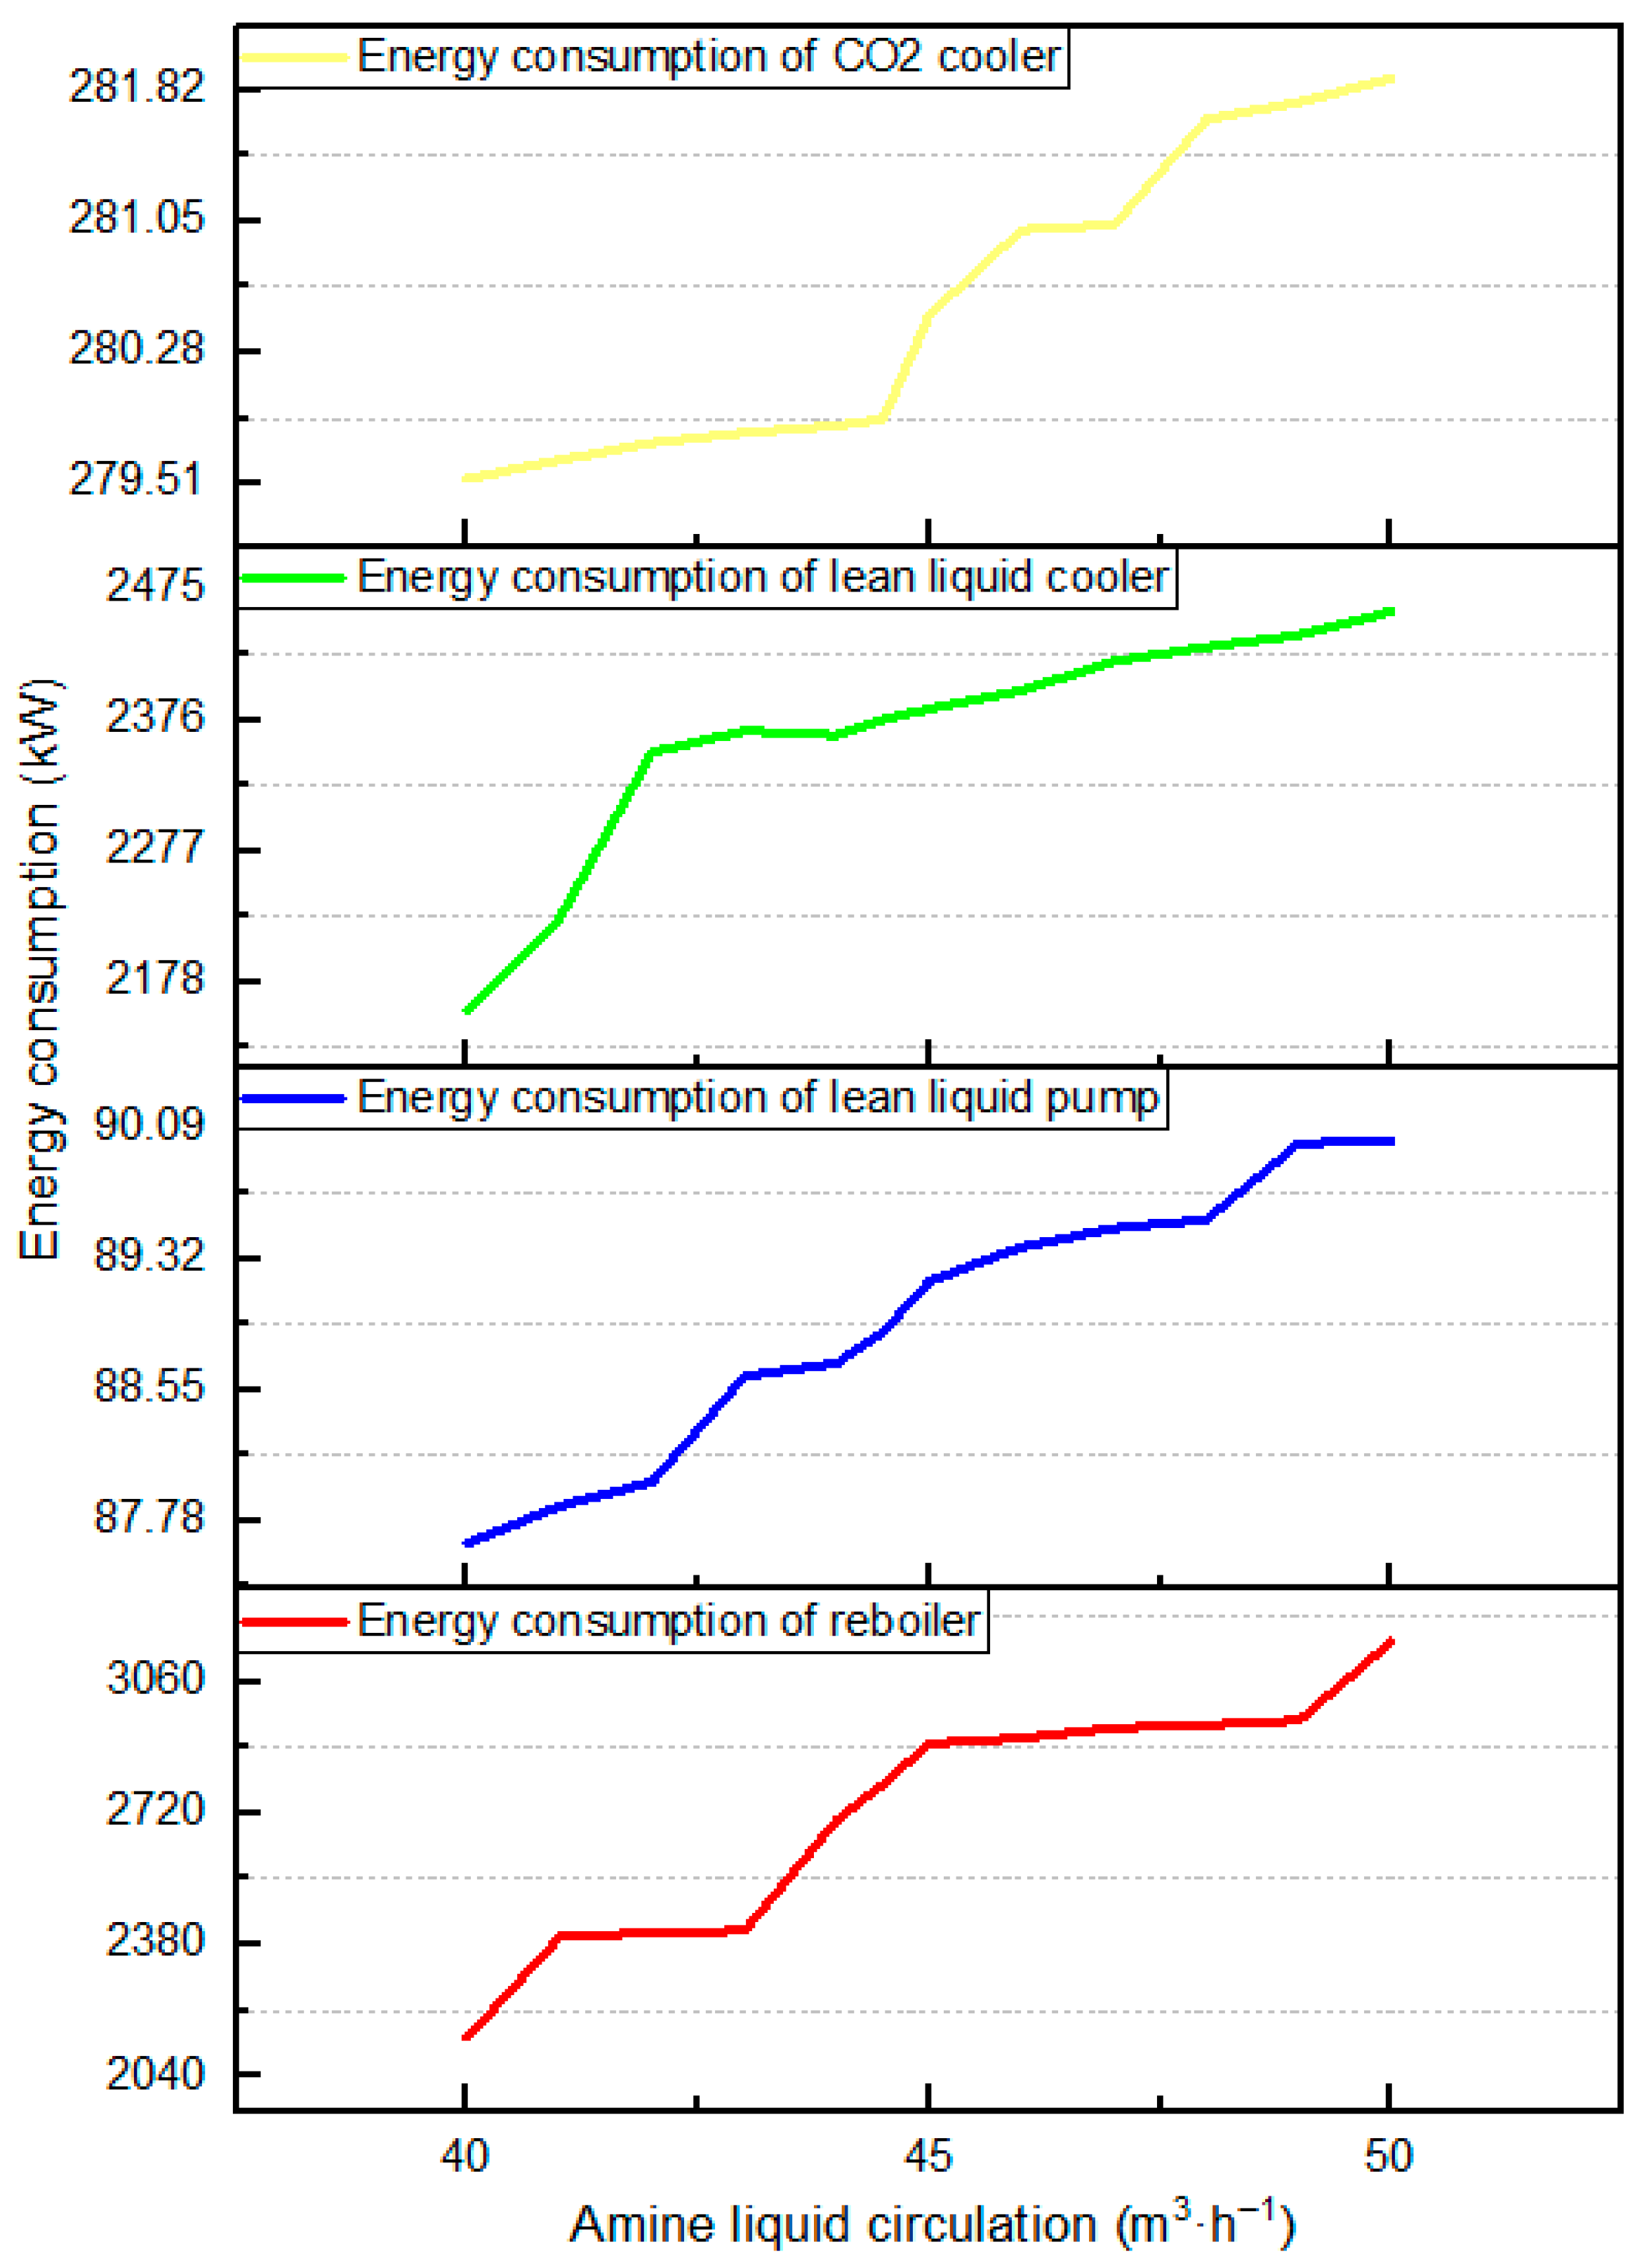
Effect of amine circulation on energy consumption.
Table 4.
Effect of amine circulation on energy consumption of key equipment.
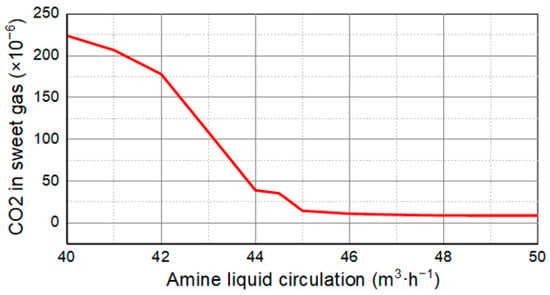
As can be seen from Figure 8, with the gradual increase in amine liquid circulation, the volume fraction of CO2 in sweet gas gradually decreased as well, indicating that the decarbonization became more effective. As can be seen from Figure 9, the energy consumption of the reboiler, lean liquid pump, lean liquid cooler, and acid gas condenser increased gradually. The results show that the decarbonization effect is positively correlated with the amine liquid circulation, and the energy consumption of key equipment is inversely correlated with the amine liquid circulation.
In particular, as can be seen from Table 4 and Figure 9, when the amine liquid circulation was lower than 44.5 m3/h, the CO2 content in sweet gas could not meet the decarbonization requirements. When the amine liquid circulation reached 44.5 m3/h, the CO2 content in sweet gas fell below 50 × 10−6. The growing trend of energy consumption of the key equipment slowed down. When the amine liquid circulation volume was 45~47 m3/h, the decarbonization effect increased significantly, and the energy consumption of key equipment increased slowly with the increase in amine liquid circulation. When the amine liquid circulation was 48~50 m3/h, the CO2 content in sweet gas basically remained stable, but the energy consumption of key equipment was at a high level. Therefore, 45 m3/h is recommended as the preferred amine circulation volume considering the decarbonization effect and the energy consumption of key equipment.
4.2.2. Absorption Temperature
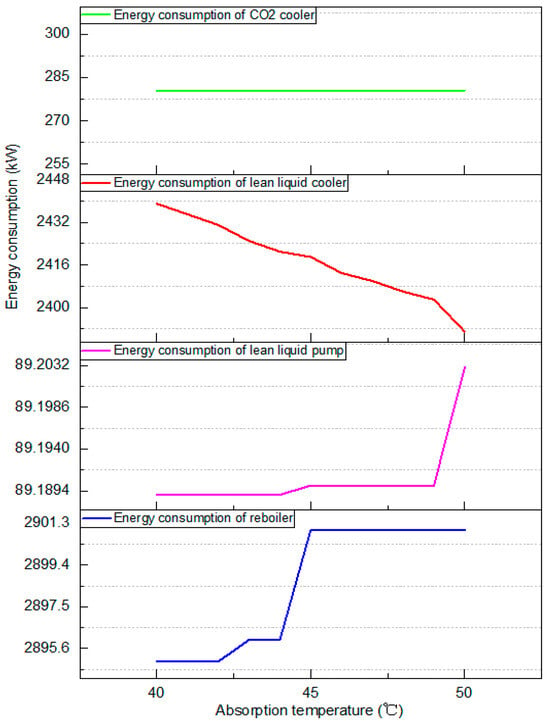
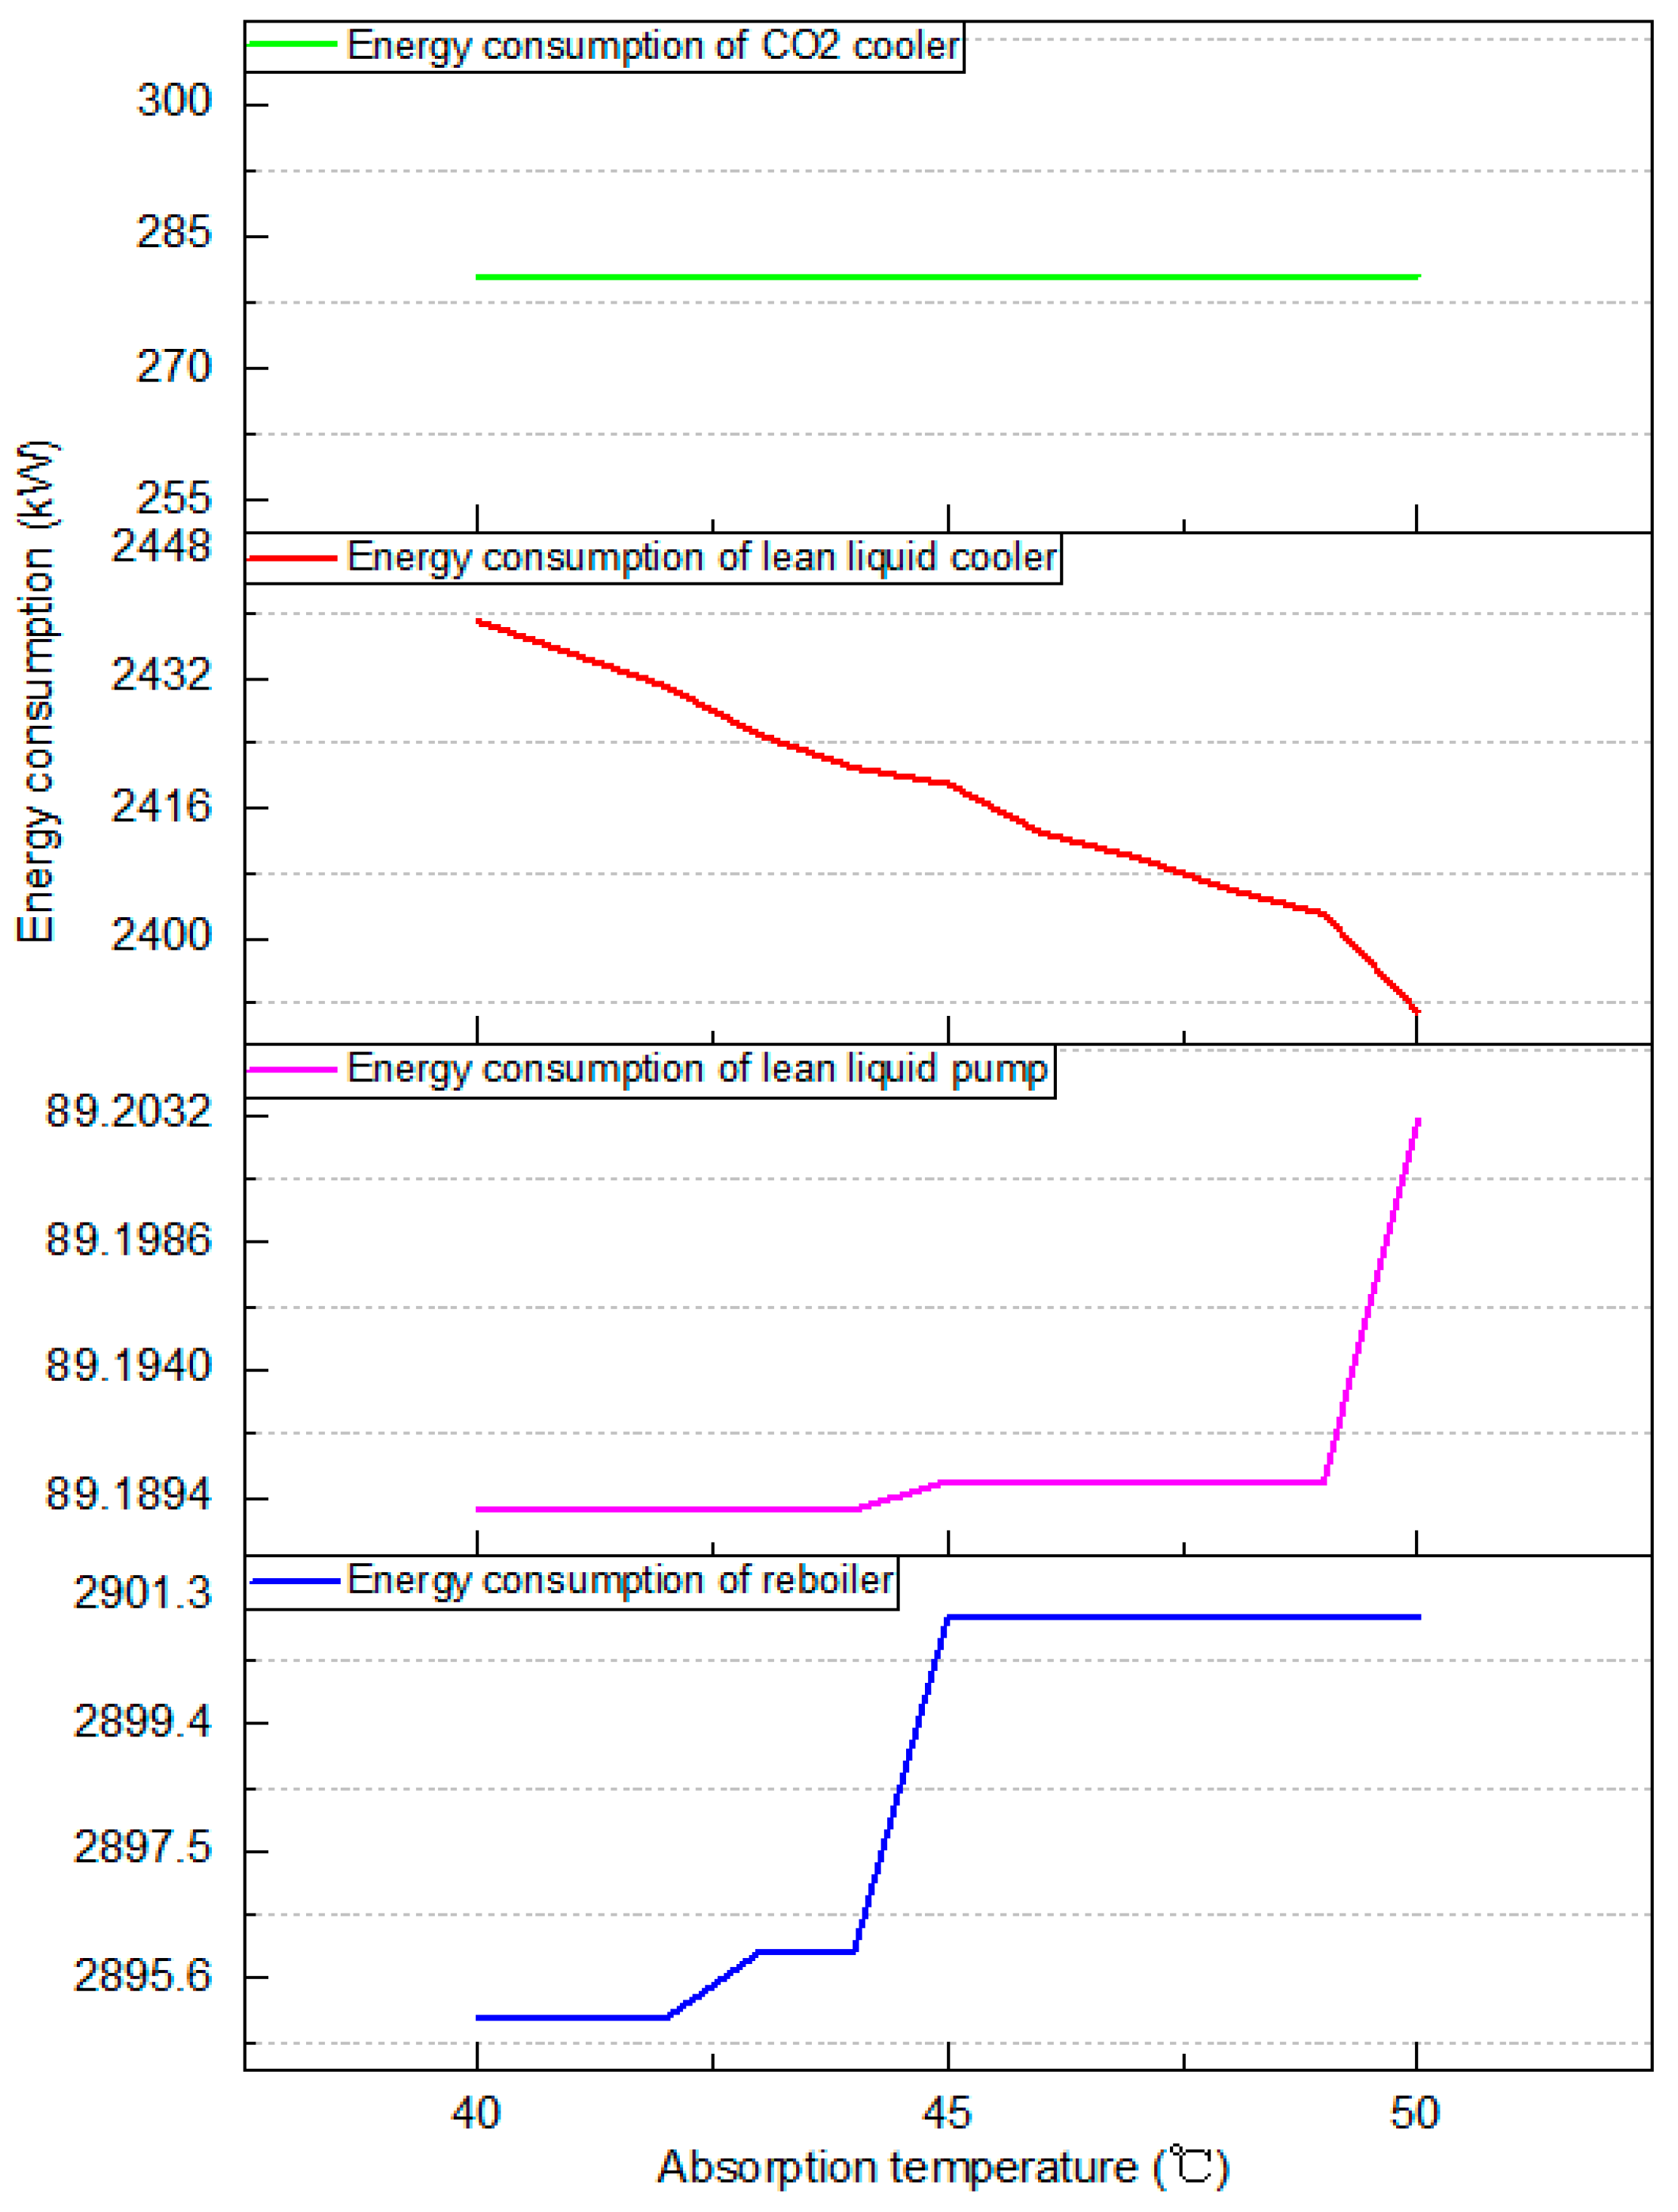
Under the recommended amine liquid circulation volume of 45 m3/h, the effect of absorption temperature on the decarbonization effect (volume fraction of CO2 in sweet gas) and energy consumption of key equipment was investigated. The results are shown in Figure 10 and Figure 11, and Table 5.
Figure 10.
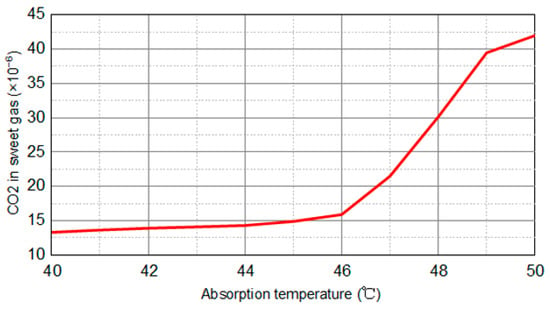
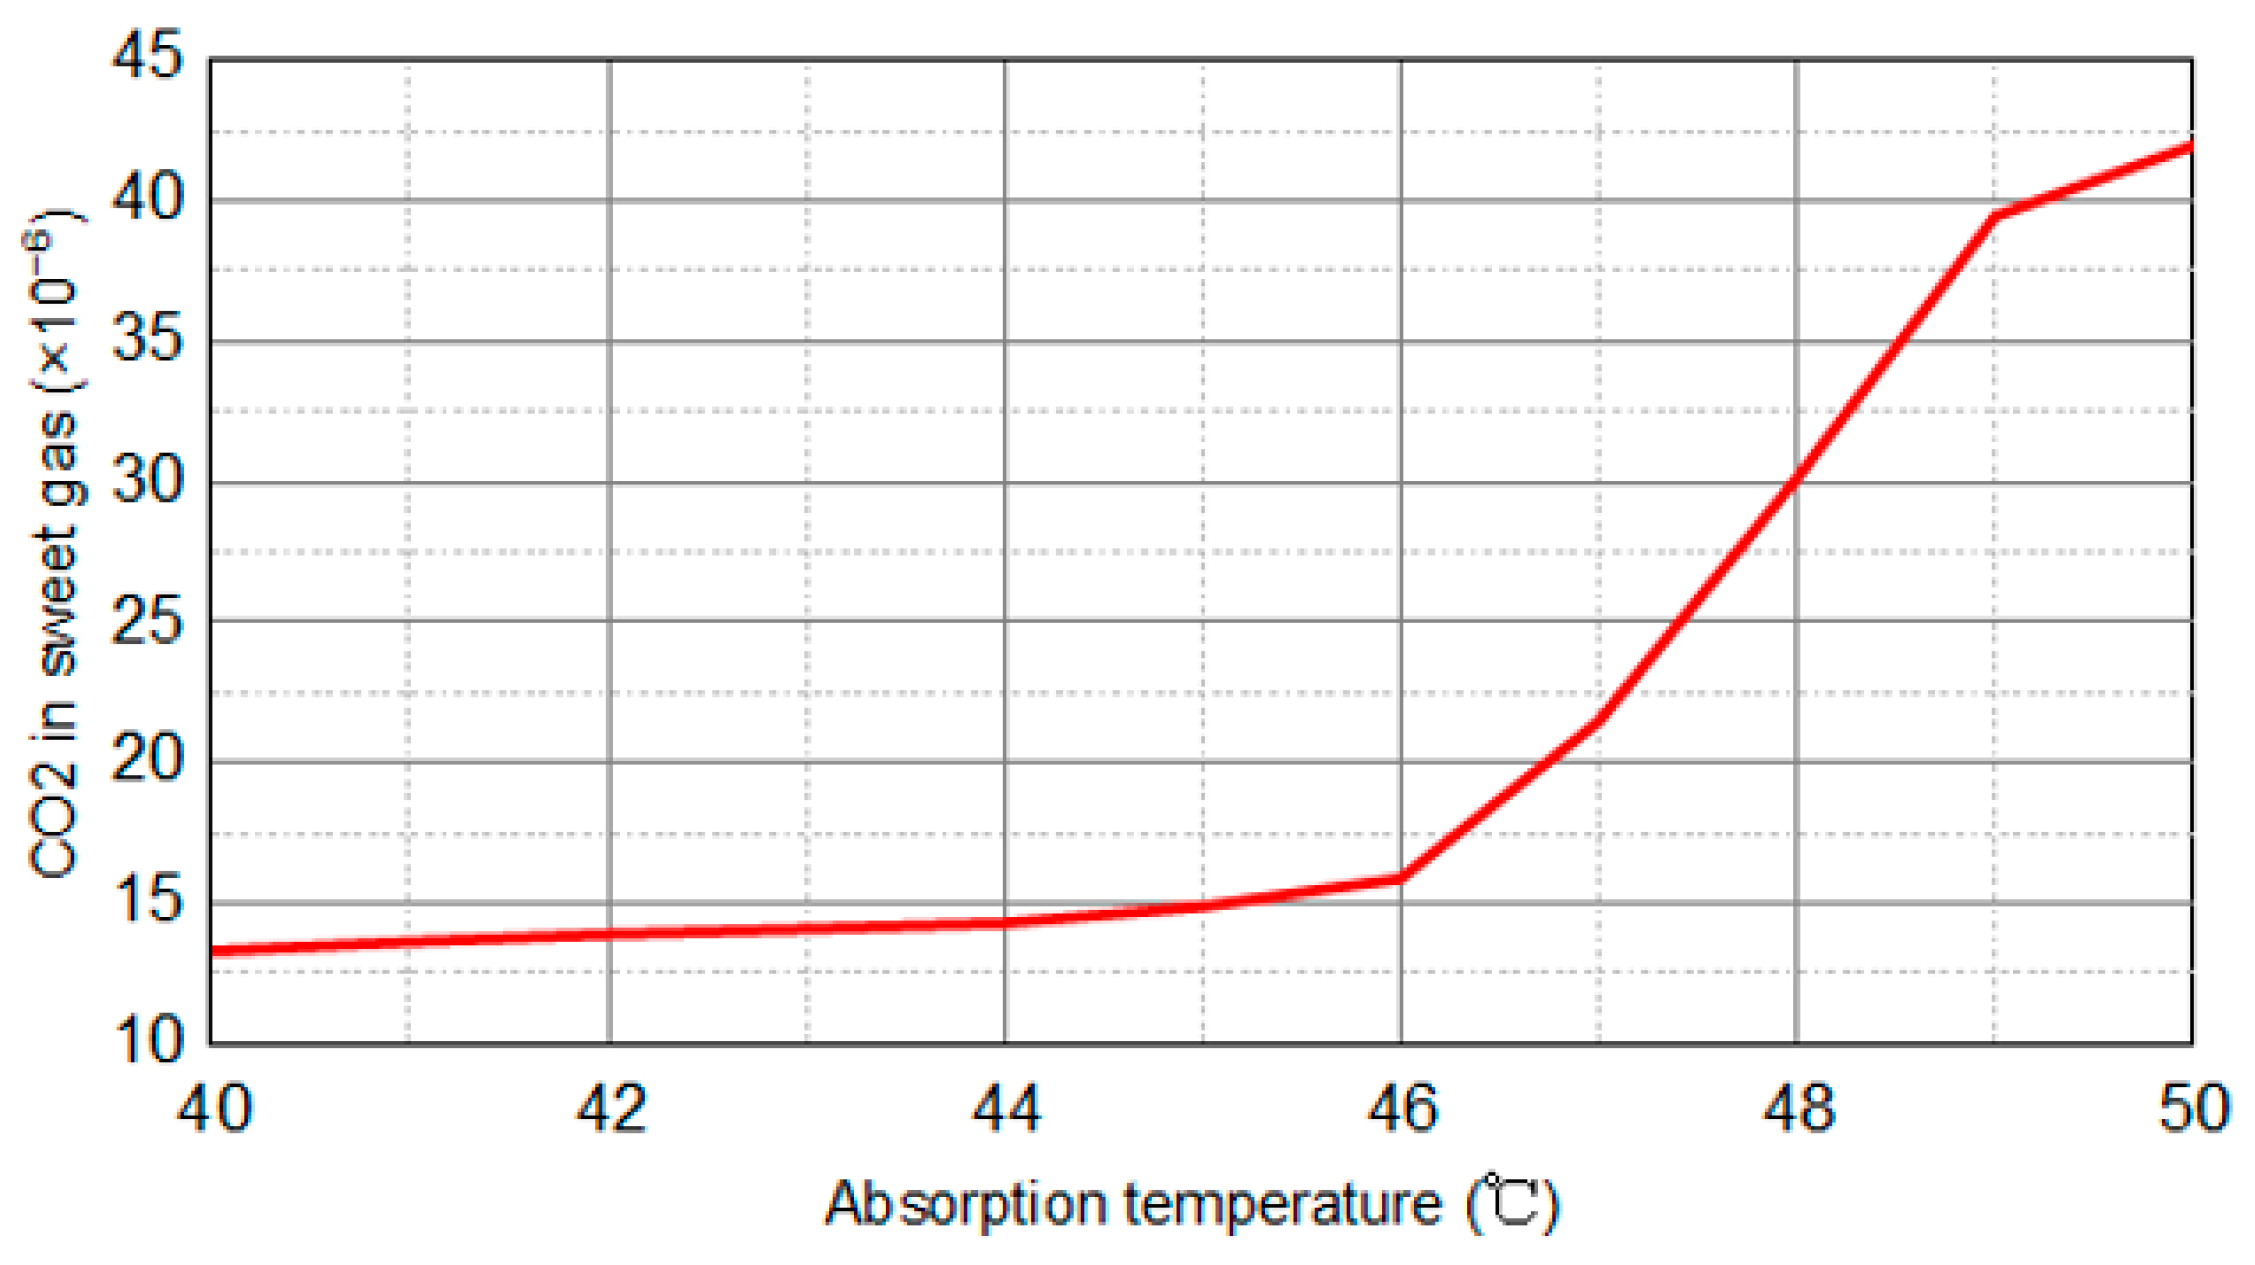
Effect of absorption temperature on decarbonization effect.
Figure 11.
Effect of absorption temperature on energy consumption.
Table 5.
Effect of absorption temperature on energy consumption of key equipment.
As can be seen from Figure 10, with the increase in absorption temperature, the volume fraction of CO2 in the sweet gas increased from 13.31 × 10⁻⁶ to 35.01 × 10⁻⁶. With the absorption temperature increasing from 40 °C to 46 °C, the decarbonization effect decreased slowly. When the absorption temperature was higher than 46 °C, the tendency for the decarbonization effect to deteriorate accelerated with the temperature increase. At the same time, it should be noted that a higher absorption temperature is favorable to accelerate the absorption reaction rate. In industrial practice, absorption temperature should not be higher than 50 °C to avoid a large loss of amine liquid.
As can be seen from Table 5 and Figure 11, in addition to a slight increase in the energy consumption of the lean liquid cooler, the energy consumption of the rest of the equipment was basically unchanged as the absorption temperature increased. Therefore, the change in the absorption temperature did not have much impact on the total energy consumption of the unit.
In summary, taking into account the rapid and large amount of CO2 removal, 46 °C is recommended as the preferred absorption temperature.
4.2.3. Regeneration Temperature
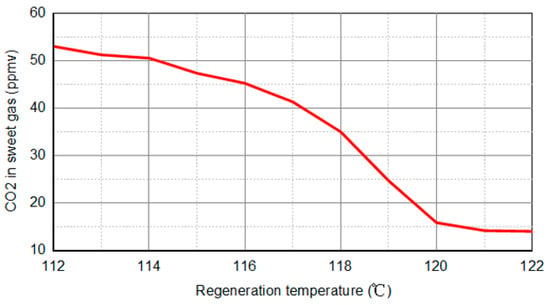
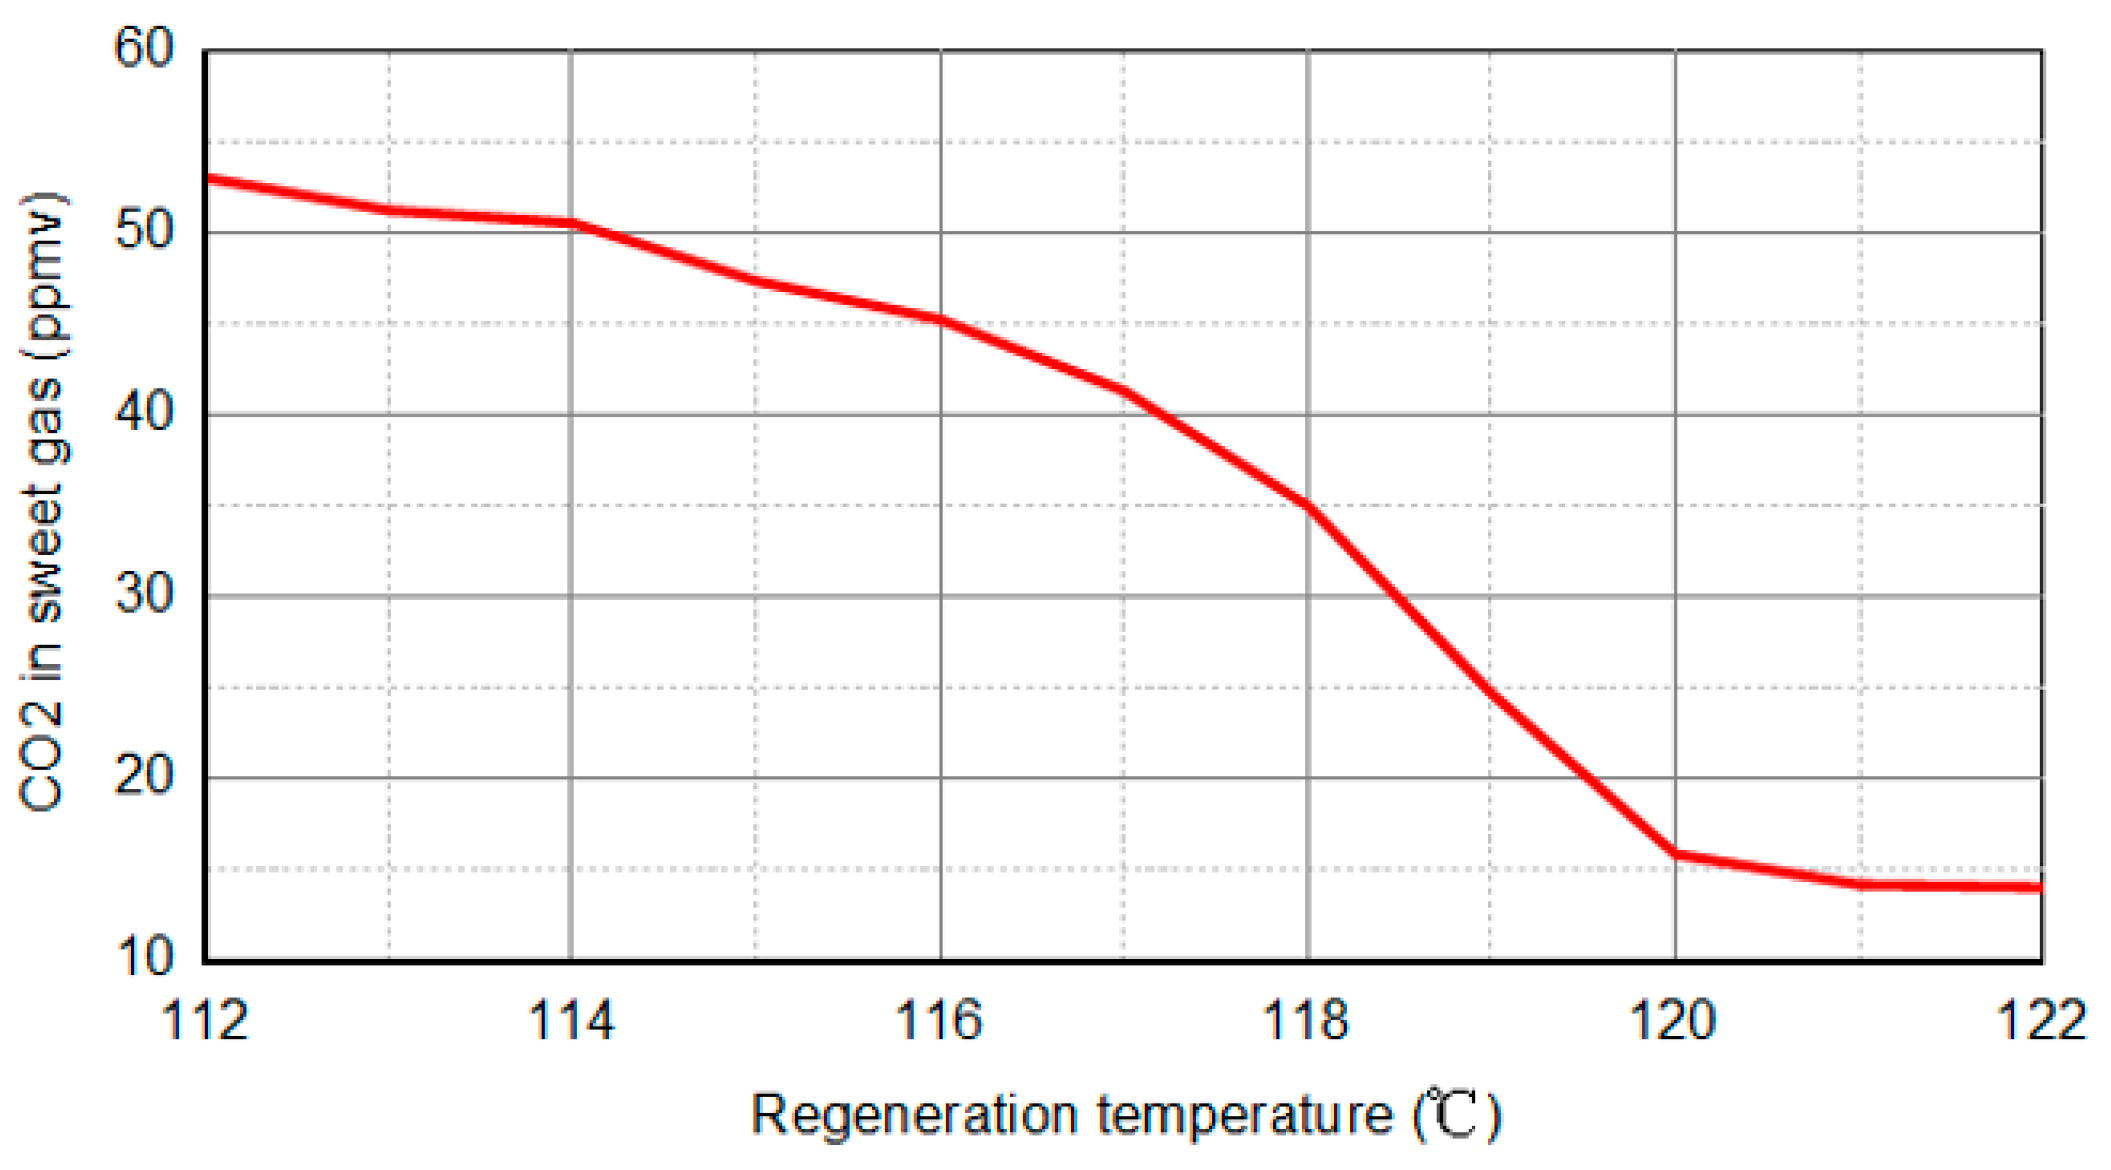
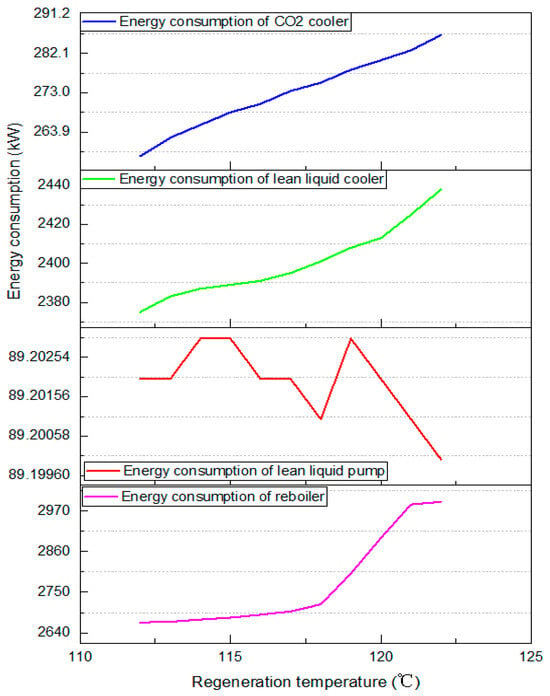
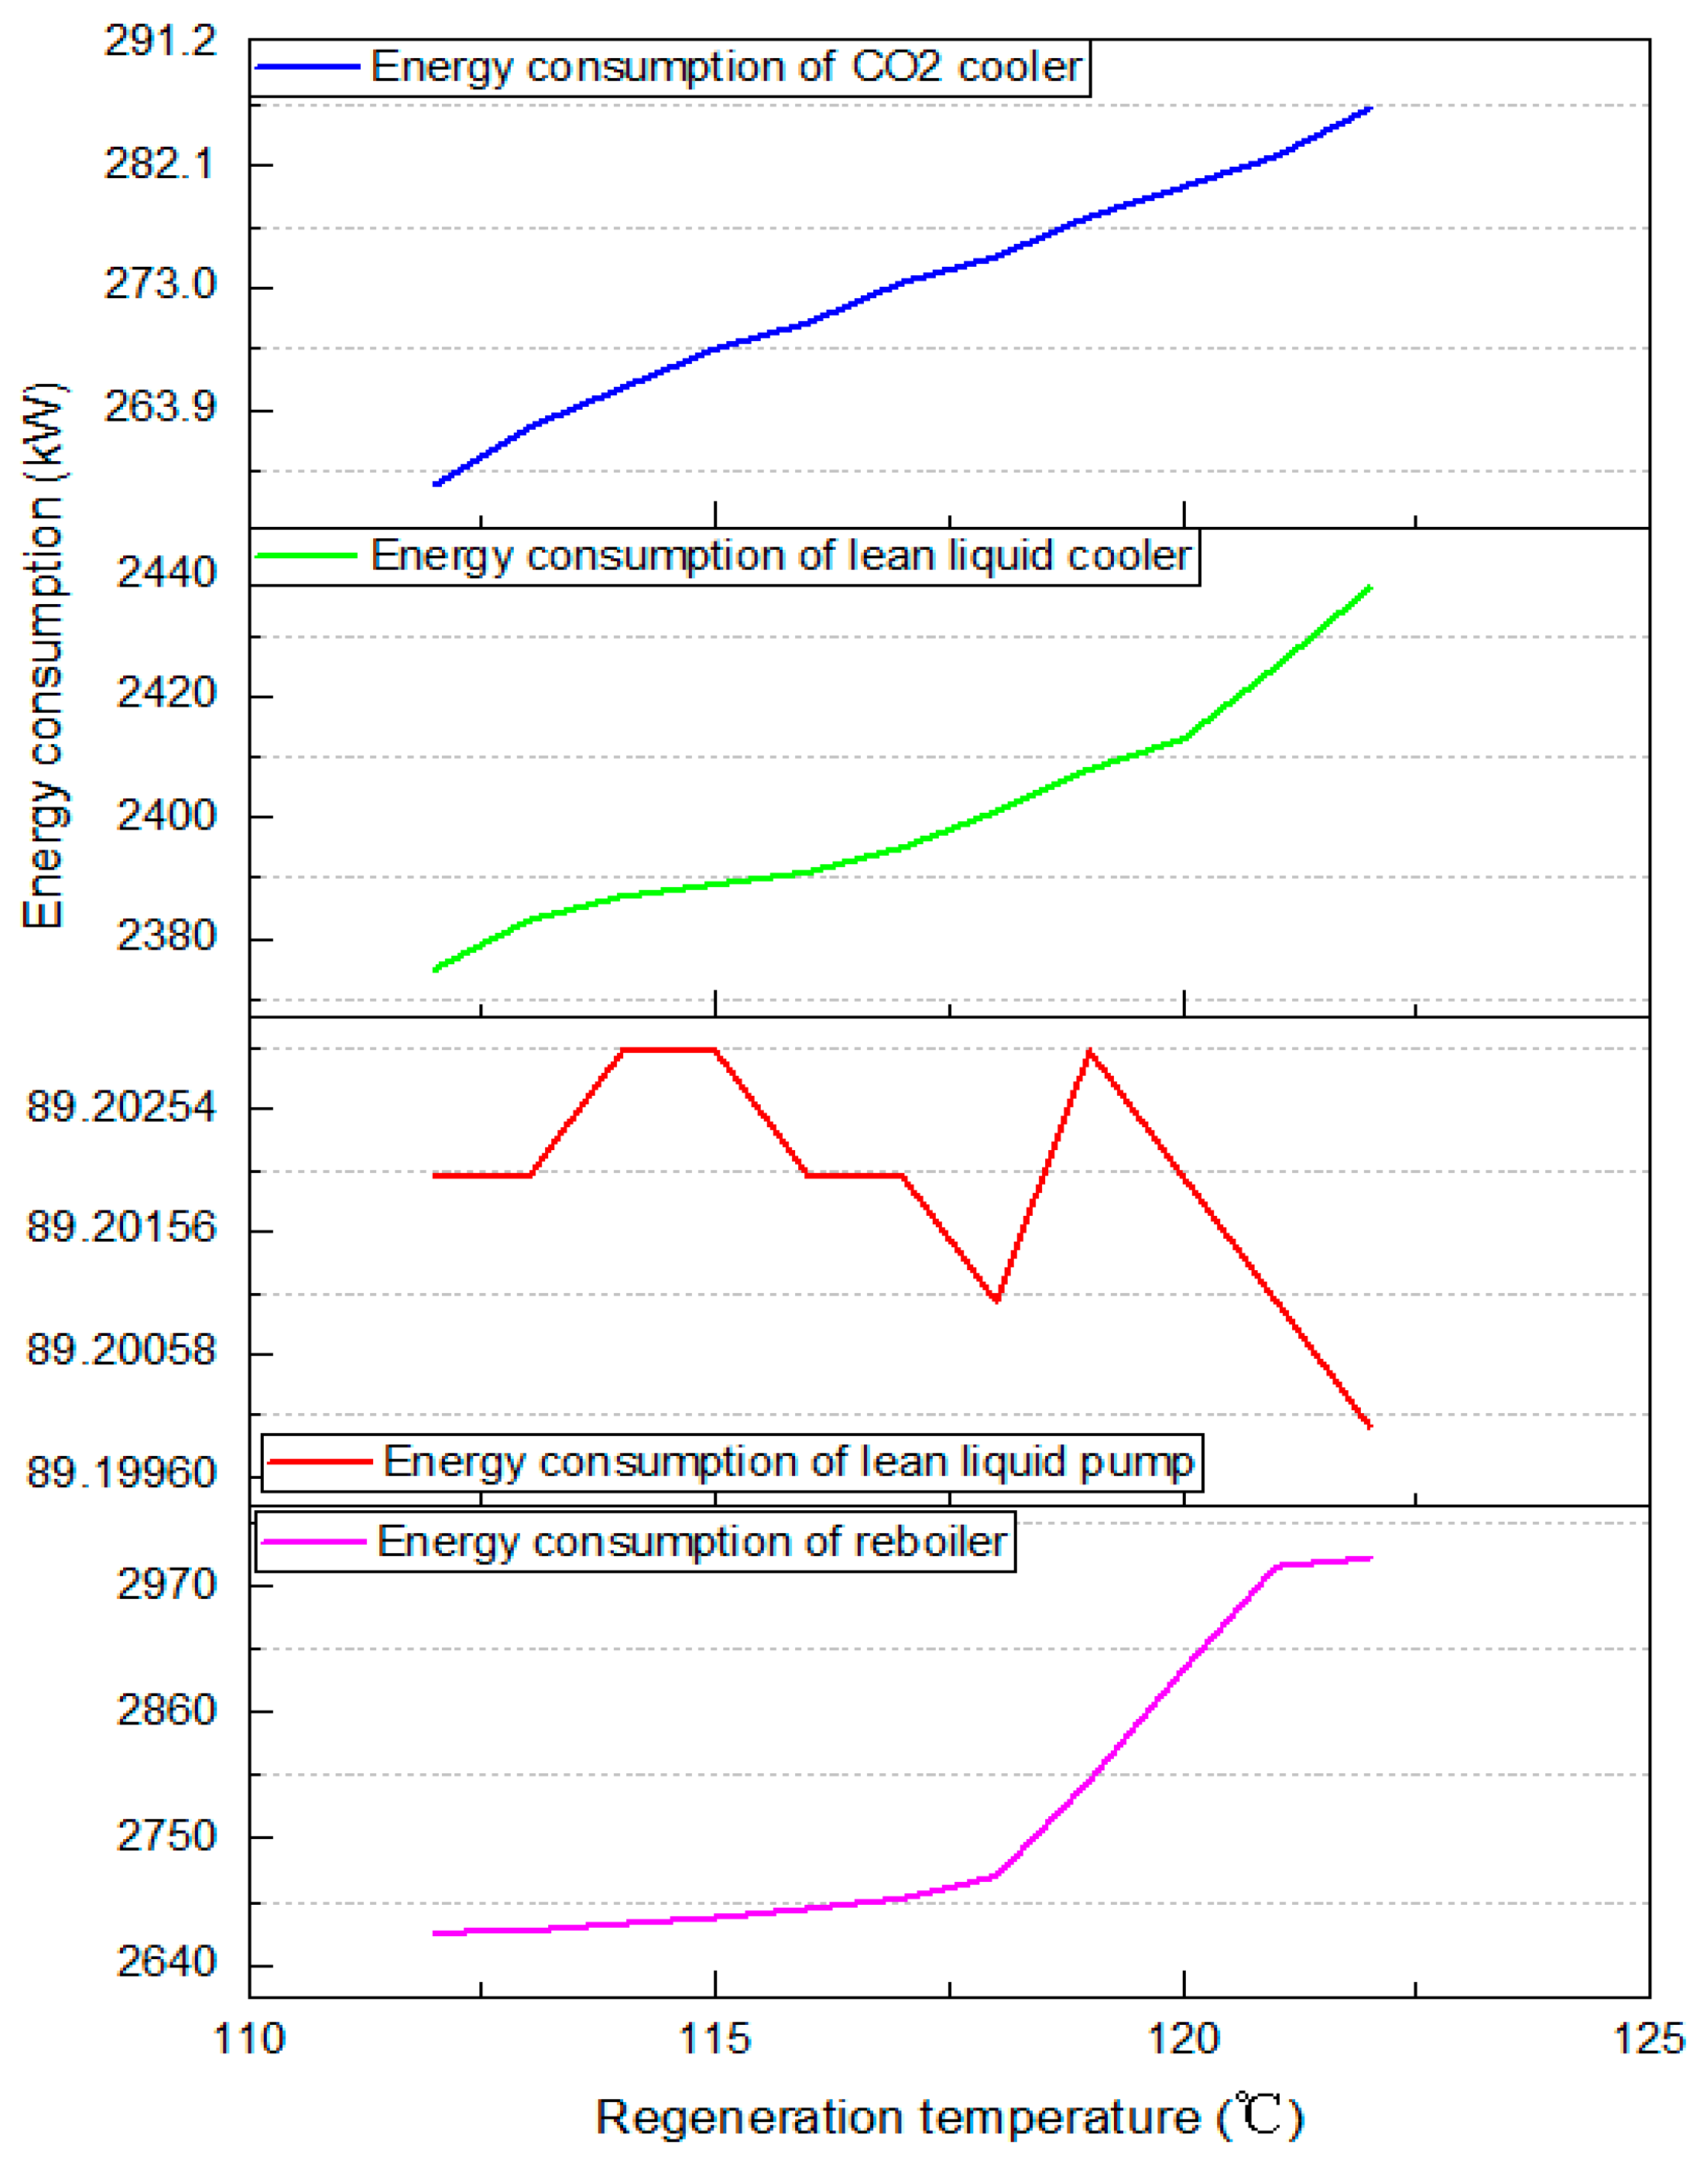
Under the recommended amine liquid circulation of 45 m3/h and absorption temperature of 46 °C, the effects of regeneration temperature on decarbonization effect (volume fraction of CO2 in sweet gas) and energy consumption of key equipment were investigated. The results are shown in Figure 12, Figure 13 and Table 6.
Figure 12.
Effect of regeneration temperature on decarbonization effect.
Figure 13.
Effect of regeneration temperature on energy consumption.
Table 6.
Effect of regeneration temperature on energy consumption of key equipment.
As can be seen from Figure 12, when the regeneration temperature was lower than 114 °C, the volume fraction of CO2 in the sweet gas failed to meet the standard requirement under the condition of keeping process parameters unchanged. As can be seen from Figure 13 and Table 6, when the regeneration temperature increased from 115 °C to 118 °C, the decarbonization effect improved smoothly, and the energy consumption of key equipment increased gradually and slowly. When the regeneration temperature increased from 119 °C to 122 °C, the volume fraction of CO2 in the sweet gas decreased abruptly and was much lower than the index requirement of 50 ppmv. When the regeneration temperature increased from 119 °C to 122 °C, the volume fraction of CO2 in sweet gas decreased abruptly and was far below the index requirement. Also, the energy consumption of key equipment remained at a stable high level.
In summary, considering the decarbonization effect and energy consumption of key equipment, 118 °C is recommended as the preferred regeneration temperature.
4.3. Results
According to Table 7, keeping other process parameters constant, the optimal capture solution with a mass ratio of 40% MDEA + 3% PZ was selected, and the absorption temperature was increased to 46 °C to accelerate the reaction rate. The circulation of the amine solution was reduced by 10%, and the regeneration temperature was reduced to 118 °C. By optimizing key process parameters such as the mass ratio of amine solution, amine solution circulation, absorption temperature, and regeneration temperature, the CO2 volume fraction in the sweet gas after CO2 capture treatment was 35 × 10−6. This means the CO2 capture effect meets the requirements and is in a reasonable range. Meanwhile, the regeneration energy consumption was reduced by 12%, the total energy consumption of the CO2 capture device was reduced by 8.9%, and the energy-saving effect was significant.
Table 7.
Comparison of decarbonization effect and unit energy consumption.
5. Conclusions
In this article, a low-concentration CO2 capture model for shale gas in the northern Guizhou region was established using Aspen HYSYS software. The research results of this paper can be extended to shale gas treatment processes with similar components. The amine formulation was optimized based on amine circulation rate, regeneration energy consumption, methane loss, and acid gas load. Based on the optimal amine formulation, sensitivity analysis was used to optimize the amine circulation rate, lean liquid absorption temperature, and rich liquid regeneration temperature, leading to the following conclusions:
- (a)
- The optimal range of MDEA mass fraction is 37–42%. Within this range, selecting the optimal value of MDEA mass fraction of 40% can achieve relatively high CO2 capture performance with low energy consumption, and methane loss is within the engineering-recommended range.
- (b)
- The optimal range of PZ mass fraction is 2.5% to 5%; adding a small amount of PZ to the MDEA solution can significantly improve the absorption efficiency of MDEA for CO2.
- (c)
- The preferred amine solution mass ratio is 40% MDEA + 3% PZ. Considering the capturing efficiency and energy consumption of key equipment in the process system, the optimal amine circulation rate is determined to be 45 m3/h using the sensitivity analysis method. The optimal absorption temperature is 46 °C, and the optimal regeneration temperature is 118 °C. Under these conditions, the energy consumption for regeneration is reduced by 12%, and the total energy consumption of the CO2 capture unit is reduced by 8.9%. The energy-saving effect is significant after optimizing the process parameters.
Author Contributions
T.Z.: Writing—original draft, software. Y.L.: Data curation. X.L.: Investigation. H.L.: Writing—review and editing. All authors have read and agreed to the published version of the manuscript.
Funding
This research received no external funding.
Data Availability Statement
The original contributions presented in this study are included in the article. Further inquiries can be directed to the corresponding author.
Acknowledgments
The authors would like to thank all colleagues and collaborators who provided valuable discussions and technical support during the course of this work.
Conflicts of Interest
Authors Tianjiao Zhang, Yongduo Liu, Xin Liu were employed by the China Petroleum Engineering & Construction Corporation (CPECC) North Branch. The remaining author declares that the research was conducted in the absence of any commercial or financial relationships that could be construed as a potential conflict of interest. The China Petroleum Engineering & Construction Corporation (CPECC) North Branch had no role in the design of the study; in the collection, analyses, or interpretation of data; in the writing of the manuscript, or in the decision to publish the results.
References
- Wojtaszek, H.; Miciuła, I.; Modrzejewska, D.; Stecyk, A.; Sikora, M.; Wójcik-Czerniawska, A.; Smolarek, M.; Kowalczyk, A.; Chojnacka, M. Energy Policy until 2050—Comparative Analysis between Poland and Germany. Energies 2024, 17, 421. [Google Scholar] [CrossRef] [Scilit]
- Marcel, C.P. Addressing the Global Energy Problem: Perspectives, Challenges, and Potential Solutions. Nucl. Eng. Des. 2023, 414, 112610. [Google Scholar] [CrossRef] [Scilit]
- Pieroni, V. Energy shortages and aggregate demand: Output loss and unequal burden from HANK. Eur. Econ. Rev. 2023, 154, 104428. [Google Scholar] [CrossRef] [Scilit]
- Abdi, A.; Astaraei, F.R.; Rajabi, N. GIS-AHP-GAMS based analysis of wind and solar energy integration for addressing energy shortage in industries: A case study. Renew. Energy 2024, 225, 120295. [Google Scholar] [CrossRef] [Scilit]
- Cheba, K.; Bąk, I.; Pietrzak, M.B. Conditions of the green transformation. the case of the European Union. Technol. Econ. Dev. Econ. 2022, 29, 438–467. [Google Scholar] [CrossRef] [Scilit]
- Sayed, E.T.; Wilberforce, T.; Elsaid, K.; Rabaia, M.K.H.; Abdelkareem, M.A.; Chae, K.-J.; Olabi, A. A critical review on environmental impacts of renewable energy systems and mitigation strategies: Wind, hydro, biomass and geothermal. Sci. Total. Environ. 2021, 766, 144505. [Google Scholar] [CrossRef] [Scilit] [PubMed]
- Yang, L.; Hui, P.; Yasmeen, R.; Ullah, S.; Hafeez, M. Energy consumption and financial development indicators nexuses in asian economies: A dynamic seemingly unrelated regression approach. Environ. Sci. Pollut. Res. 2020, 27, 16472–16483. [Google Scholar] [CrossRef] [Scilit] [PubMed]
- Zhang, L.; Xu, M.; Chen, H.; Li, Y.; Chen, S. Globalization, Green Economy and Environmental Challenges: State of the Art Review for Practical Implications. Front. Environ. Sci. 2022, 10, 870271. [Google Scholar] [CrossRef] [Scilit]
- Zhang, Z.; Nuță, F.M.; Dimen, L.; Ullah, I.; Xuanye, S.; Junchen, Y.; Yihan, Z.; Yi, C. Relationship between FDI Inflow, CO2 Emissions, Renewable Energy Consumption, and Population Health Quality in China. Front. Environ. Sci. 2023, 11, 1120970. [Google Scholar] [CrossRef] [Scilit]
- Hosseini, F.; Nasimifar, M.; Sivaneswaran, N.; Golalipour, A. Mutual Impacts of Changing Climate and Flexible Pavement Performance Considering Resilience and Sustainable Aspects. J. Clean. Prod. 2024, 460, 142594. [Google Scholar] [CrossRef] [Scilit]
- Corigliano, O.; Algieri, A. A Comprehensive Investigation on Energy Consumptions, Impacts, and Challenges of the Food Industry. Energy Convers. Manag. X 2024, 23, 100661. [Google Scholar] [CrossRef] [Scilit]
- Zou, C.; Zhao, Q.; Zhang, G.; Xiong, B. Energy revolution: From a fossil energy era to a new energy era. Nat. Gas Ind. 2016, 36, 8–17, (In Chinese with English Abstract). [Google Scholar] [CrossRef] [Scilit]
- Zou, C.; Zhao, Q.; Dong, D.; Yang, Z.; Qiu, Z.; Liang, F.; Wang, N.; Huang, Y.; Duan, A.; Zhang, Q.; et al. Geological characteristics, main challenges and future prospect of shale gas. J. Nat. Gas Geosci. 2017, 2, 273–288. [Google Scholar] [CrossRef] [Scilit]
- EIA. Shale in the United States. Available online: https://www.eia.gov/energy_in_brief/article/shale_in_the_United_states.cfm (accessed on 8 March 2026).
- Jin, Z.; Bai, Z.; Gao, B.; Li, M. Has China ushered in the shale oil and gas revolution? Oil Gas Geol. 2019, 40, 451–458, (In Chinese with English Abstract). [Google Scholar] [CrossRef]
- Song, M.S.; Xiang, K.; Zhang, Y.; Cai, P.; Liu, J.L.; Yang, R. Research Progresses on Muddy Gravity Flow Deposits and Their Significances on Shale Oil and Gas: A Case Study from the 3rd Oil-Member of the Paleogene Shahejie Formation in the Dongying Sag. Acta Sedimentol. Sin. 2017, 35, 740–751, (In Chinese with English abstract). [Google Scholar] [CrossRef]
- Zou, C.; Dong, D.; Wang, Y.; Li, X.; Huang, J.; Wang, S.; Guan, Q.; Zhang, C.; Wang, H.; Liu, H.; et al. Shale gas in China: Characteristics, challenges and prospects (II). Pet. Explor. Dev. 2016, 43, 166–178. [Google Scholar] [CrossRef] [Scilit]
- Liu, H.; Zhang, S.; Song, G.; Zhang, S.; Hao, X.; Xie, Z.; Xu, N.; Liu, P. A discussion on the origin of shale reservoir inter-Laminar fractures in the Shahejie Formation of Paleogene, Dongying Depression. J. Earth Sci. 2017, 28, 1064–1077. [Google Scholar] [CrossRef] [Scilit]
- Zhang, J.; Tao, J.; Li, Z.; Wang, X.; Li, X.; Jiang, S.; Wang, D.; Zhao, X. Prospect of deep shale gas resources in China. Nat. Gas Ind. 2021, 41, 15–28, (In Chinese with English abstract). [Google Scholar] [CrossRef]
- Ahmad, A.; Rezaee, R.; Rasouli, V. Significance of Compressional Tectonic on Pore Pressure Distribution in Perth Basin. J. Unconv. Oil Gas Resour. 2014, 7, 55–61. [Google Scholar] [CrossRef] [Scilit]
- Zou, C.; Dong, D.; Wang, Y.; Li, X.; Huang, J.; Wang, S.; Guan, Q.; Zhang, C.; Wang, H.; Liu, H.; et al. Shale gas in China: Characteristics, challenges and prospects (I). Pet. Explor. Dev. 2015, 42, 753–767. [Google Scholar] [CrossRef] [Scilit]
- Li, M.; Liu, Y.; Feng, D.; Shen, B.; Du, W.; Wang, P. Presentation and future exploration direction of Marine Shale Gas Resources in China. Pet. Geol. Exp. 2023, 45, 1097–1108. [Google Scholar] [CrossRef]
- He, L.; Chen, B.; Luo, Y.; Xu, Y.; Ye, W.; Guo, M.; Wu, P.; Li, Z.; Chen, Y.; Feng, H.; et al. Comparison of water stress regarding potential shale energy development in China and the US. Resour. Conserv. Recycl. 2023, 190, 106823. [Google Scholar] [CrossRef] [Scilit]
- Mi, S.; Guo, Q.; Zhang, Q.; Wang, J. Classification and potential of continental shale oil resources in China and resource evaluation methods and criteria. Oil Shale 2023, 40, 283–320. [Google Scholar] [CrossRef] [Scilit]
- He, H.; Xiao, J.; Lan, Q.; Yang, H.; Huang, M. Black Mudstone Sedimentary Environment and Shale Gas Accumulation Conditions of Lower Silurian Longmaxi Formation in Northern Guizhou Province. Earth Environ. 2022, 50, 898–908, (In Chinese with English abstract). [Google Scholar] [CrossRef]
- Sun, J.B.; Liu, G.; Shi, P.; Xue, P.; Liu, C.; Xu, J. Reservoir characteristics and analysis of shale gas resource potential in Shanxi Formation in Yan’an Area. Unconv. Oil Gas 2023, 10, 44–51, (In Chinese with English abstract). [Google Scholar] [CrossRef]
- Zhao, X.; Kang, J.; Lan, B. Focus on the development of shale gas in China—Based on SWOT analysis. Renew. Sustain. Energy Rev. 2013, 21, 603–613. [Google Scholar] [CrossRef] [Scilit]
- Liu, D.; Wang, H.; Zhao, Q.; Zhang, L.; Liu, H.; Liu, D.; Liu, J. Major Understanding and Innovation, Challenges and Potential analysis of Shale Gas Exploration and Development in China. IOP Conf. Ser. Earth Environ. Sci. 2021, 696, 12016. [Google Scholar] [CrossRef] [Scilit]
- Zhang, Z.; Xu, S.; Gou, Q.; Li, Q. Reservoir Characteristics and Resource Potential of Marine Shale in South China: A Review. Energies 2022, 15, 8696. [Google Scholar] [CrossRef] [Scilit]
- Hu, F.; Wang, J.; Liu, Z. Sedimentary Characteristics of the Permian Zhesi Formation in Eastern Inner Mongolia, China: Implications for Sedimentary Background and Shale Gas Resource Potential. ACS Omega 2022, 7, 45287–45300. [Google Scholar] [CrossRef] [Scilit]
- Chen, Y.; Xu, J.; Wang, P. Shale gas potential in China: A production forecast of the Wufeng-Longmaxi Formation and implications for future development. Energy Policy 2020, 147, 111868. [Google Scholar] [CrossRef] [Scilit]
- Guo, X.; Hu, Z.; Shen, B.; Du, W.; Sun, C.; Wan, C.; Wang, G.; Li, M.; Wang, R. Classification and exploration significance of source-reservoir coupling types of shale oil and gas in China. Acta Pet. Sin. 2024, 45, 1565–1578, (In Chinese with English abstract). [Google Scholar] [CrossRef]
- Jin, Z.; Wang, G.; Liu, G.; Gao, B.; Liu, Q.; Wang, H.; Liang, X.; Wang, R. Research progress and key scientific issues of continental shale oil in China. Acta Pet. Sin. 2021, 42, 821–835, (In Chinese with English abstract). [Google Scholar] [CrossRef]
- Wang, R.; Sang, S.; Jin, J.; Zhao, L.; Gao, W.; Fu, W.; Shi, F.; Deng, E. Characteristics and significance of heterogeneity of sea-land transitional facies shale gas reservoir in North Guizhou, China. Geosci. J. 2019, 23, 101–117. [Google Scholar] [CrossRef] [Scilit]
- Zhang, T.J.; Liu, X.; Liu, Y.D. Research on CO2 Capture Technology for Ten Million Cubic Meter per Day Natural Gas Scale. Mod. Chem. Ind. 2024, 44, 223–227, (In Chinese with English Abstract). [Google Scholar] [CrossRef]
- Zhang, T.J.; Liu, X.; Liu, Y.D.; Zhou, J.; Zhang, Q. Study on coupled decarbonization process for split absorption-interstage circulation cooling. Mod. Chem. Ind. 2024, 44, 215–219. [Google Scholar] [CrossRef]
- Fathi, E.; Akkutlu, I.Y. Multi-component gas transport and adsorption effects during CO2 injection and enhanced shale gas recovery. Int. J. Coal Geol. 2014, 123, 52–61. [Google Scholar] [CrossRef] [Scilit]
- Jin, C.; Lim, Y. Economic evaluation of NGL recovery process schemes for lean feed compositions. Chem. Eng. Res. Des. 2018, 129, 297–305. [Google Scholar] [CrossRef] [Scilit]
- Nadeem, R.; Azmi, S.N. Unlocking the shale potential: Examining the effects on oil prices and the potential for global adoption. Cogent Econ. Financ. 2024, 12, 2402029. [Google Scholar] [CrossRef] [Scilit]
- Chen, Z.; Zhao, X.; Zhu, H.; Tang, Z.; Zhao, X.; Zhang, F.; Sepehrnoori, K. Engineering factor analysis and intelligent prediction of CO2 storage parameters in shale gas reservoirs based on deep learning. Appl. Energy 2025, 377, 124642. [Google Scholar] [CrossRef] [Scilit]
- Shah, K. Transformation of Energy, Technologies in Purification and End Use of Shale Gas. J. Combust. Soc. Jpn. 2013, 55, 13. [Google Scholar] [CrossRef]
- Han, W.G. Research on natural gas carbon dioxide removal technology. Liaoning Chem. Ind. 2023, 52, 420–422+429, (In Chinese with English abstract). [Google Scholar] [CrossRef]
- Ma, G.; Wang, J.; Zhang, T. Design and optimization of CO2 capture coupled process. Low-Carbon Chem. Chem. Eng. 2024, 49, 76–83, (In Chinese with English abstract). [Google Scholar] [CrossRef]
- Haghani, H.; Sema, T.; Na Ranong, P.; Kiattinirachara, T.; Chalermsinsuwan, B.; Gao, H.; Liang, Z.; Tontiwachwuthikul, P. Volumetric and viscometric properties of aqueous 1,2-dimethylethylenediamine solution for carbon capture application. Petroleum 2024, 10, 326–337. [Google Scholar] [CrossRef] [Scilit]
- Chen, Z.; Liu, J.; Elsworth, D.; Connell, L.D.; Pan, Z. Impact of CO2 injection and differential deformation on CO2 injectivity under in-situ stress conditions. Int. J. Coal Geol. 2010, 81, 97–108. [Google Scholar] [CrossRef] [Scilit]
- Busch, A.; Gensterblum, Y.; Krooss, B.M.; Littke, R. Methane and carbon dioxide adsorption–diffusion experiments on coal: Upscaling and modeling. Int. J. Coal Geol. 2004, 60, 151–168. [Google Scholar] [CrossRef] [Scilit]
- Zhang, H.-M.; Han, G.-P.; Cheng, W.-L.; Liu, S.-J.; Wang, X.-H. Cationic CO2-based Waterborne Polyurethane with High Solid Content and Excellent Ageing Resistance. Chin. J. Polym. Sci. 2022, 40, 1183–1192. [Google Scholar] [CrossRef] [Scilit]

Disclaimer/Publisher’s Note: The statements, opinions and data contained in all publications are solely those of the individual author(s) and contributor(s) and not of MDPI and/or the editor(s). MDPI and/or the editor(s) disclaim responsibility for any injury to people or property resulting from any ideas, methods, instructions or products referred to in the content. |
© 2026 by the authors. Licensee MDPI, Basel, Switzerland. This article is an open access article distributed under the terms and conditions of the Creative Commons Attribution (CC BY) license.