Article

Digital Twin Technology for Encapsulation of Plant Extracts in Lipid Nanoparticles Toward Autonomous Operation


Institute for Separation and Process Technology, Clausthal University of Technology, Leibnizstr. 15, 38678 Clausthal-Zellerfeld, Germany
*
Author to whom correspondence should be addressed.
Processes 2026, 14(9), 1351; https://doi.org/10.3390/pr14091351
Submission received: 20 February 2026 / Revised: 18 April 2026 / Accepted: 21 April 2026 / Published: 23 April 2026
(This article belongs to the Section AI-Enabled Process Engineering)

Abstract

Plant extracts are widely used as natural pesticides, cosmetic ingredients, and in pharmaceutical applications. However, their poor water solubility and stability limit their usability. Lipid nanoparticles (LNPs) offer an effective encapsulation strategy to overcome these challenges. This study demonstrates the encapsulation of three representative substances from these industries: quercetin as a pesticide, irones as a cosmetic ingredient, and nucleic acids for pharmaceutical use. Ultrasonic treatment was used for the encapsulation of quercetin and irones, and a concept for continuous encapsulation in a plug flow reactor was proposed for process intensification. Inline multi-angle light scattering and dynamic light scattering measurements proved effective for real-time monitoring and enabled the replacement of traditional batch measurements. In the pharmaceutical area, mRNA-based therapies require LNP encapsulation to prevent nucleic acid degradation. Plant-based β-sitosterol was used as an alternative helper lipid to cholesterol, resulting in an average particle diameter of 72 nm and an encapsulation efficiency of 91%, comparable to commercial formulations such as the Comirnaty vaccine. Furthermore, a novel process model based on population balances was developed to simulate the entire manufacturing process, from rapid mixing in a T-mixer to particle stabilization via buffer exchange during diafiltration. By applying a quantitative and distinctive model validation workflow, the model was shown to be as accurate and precise as the experimental data, enabling its use as a digital twin for autonomous continuous operation. In summary, this study contributes to reducing the facility footprint and cost of goods through the implementation of continuous processing and model-based control. This approach improves productivity by 20% and reduces process time by a factor of two.

1. Introduction

Ingredients derived from plant materials are primarily characterized by their low toxicity and high environmental compatibility, which makes them particularly suitable for use in the cosmetics and pharmaceutical industries as well as pesticides [1,2]. However, many of these active ingredients are often unstable during production and storage and have poor (water) solubility and bioavailability [3,4]. Because of their low water solubility, organic solvents are often used during extraction; however, these solvents are not allowed for use in natural products or human applications. This restriction applies not only to the extraction process but also to the formulation of the final product.
Lipid nanoparticles (LNPs) encapsulate plant-based active ingredients to enhance solubility and stability. Encapsulation depends on lipid structures forming bilayers, enclosing hydrophilic molecules like mRNA in aqueous cores or lipophilic molecules such as quercetin or irones within the lipid bilayer [5,6]. This confers controlled release with low toxicity and improved efficacy [5,6,7].
Common LNP types include liposomes, solid lipid nanoparticles (SLNPs), and nanostructured lipid carriers (NLCs), produced by mixing lipids and drug phases. Liposomes use phospholipids, SLNP lipids that are solid at room temperature, and NLC mixtures of solid and liquid lipids [8,9,10,11]. Formulation techniques include homogenization and sonication [3,4,12,13,14], while lipid–drug conjugates and polymer–lipid nanoparticles involve chemical binding or polymer incorporation [8,15,16].
Liposomes and polymeric nanoparticles face stability issues and costly manufacturing, limiting scale-up [3,9]. SLNPs offer enhanced stability, control drug release, and improve bioavailability, especially for hydrophobic molecules [3,12,17,18,19]. They also adhere well to skin, forming hydrating lipid films for cosmetic use [3,20,21,22]. SLNPs comprise a lipid core and stabilizers like phospholipids or bile salts, remaining solid at room and body temperature, with various morphologies [3,8,10,23].

1.1. Encapsulation of Pesticides

The agricultural industry currently often relies on chemical pesticides [6,24], which have undesirable side effects, such as toxic effects on pollinators or the contamination of soils and groundwater [6,25]. As a result, nanoparticles are increasingly being used for pest control [6]. Quercetin, a flavonoid with phenolic functional groups, which is found in the leaves of the neem tree [26], is primarily known for its anti-cancer, anti-inflammatory, and antioxidant effects [3,27,28,29,30,31]. However, similar to Azadirachtin A, plant protection effects are also known [4,32,33,34,35,36,37]. In addition to its low water solubility, quercetin exhibits high instability when exposed to light and heat. These limitations can be overcome by encapsulation in SLNPs [3,38,39]. Furthermore, encapsulation offers a better dispersion of the pesticide compared to conventional formulations [4,40,41]. Initial studies show applications of encapsulated quercetin in LNPs for the reduction of salt stress in tomato plants or for the treatment of plant viral diseases, also known as plant cancer [4,33].

1.2. Encapsulation of Fragrances

The use of nanoparticles is already widespread in the cosmetics industry. Well-known examples include the encapsulation of coenzyme 10 (Q10) for anti-aging creams [42,43], or the use of octocrylene in sun creams [44]. By encapsulating hydrophobic fragrances, such as irons, they can be stabilized and integrated into the creams. By using irons in SLNPs, the advantage of the above-mentioned hydration of the skin can also be exploited. They are also easier to integrate into aqueous systems, which opens up a wider field of application.

1.3. Encapsulation of Nucleic Acids

mRNA vaccines, notably Comirnaty™ from BioNTech/Pfizer (Mainz, Germany/New York, NY, USA), brought LNPs into the spotlight as effective carriers protecting mRNA from degradation and facilitating delivery to target cells [45,46,47,48].
LNPs for nucleic acids typically consist of four components: an ionizable lipid that enables particle assembly and cell fusion, a sterol for stability, PEG-conjugated lipid to prevent aggregation and manage particle size, and a neutral phospholipid [47,49,50,51].
Cholesterol strengthens bilayer integrity but, being animal-derived, can trigger undesired immune reactions. Plant-derived phytosterols such as β-sitosterol offer comparable stability with reduced immunogenicity [52,53,54,55,56,57]. In particular, C-24 alkyl-substituted cholesterol analogs, such as β-sitosterol, can promote transfection in vitro [54,56,57,58] and, depending on the dose, translation in vivo [58], regardless of cell type, ionizable lipid, or nucleic acid load. Studies have shown that the replacement of cholesterol with β-sitosterol, which is found in the rhizomes of iris, for example, leads to comparably large LNPs with high encapsulation efficiency (EE > 90%) of mRNA, as when encapsulated with cholesterol [56,57]. Consequently, it can be assumed that if cholesterol is replaced by β-sitosterol, particles of the same size can be produced with an encapsulation efficiency that meets the regulatory requirements.

1.4. Population Balance Modeling

Various modeling approaches exist to describe lipid nanoparticle formation, differing in complexity and computational demand [59]. Simple models typically consider mass and energy balances in the T-mixer [59,60] plus the subsequent diafiltration [61]. The distribution of mass and energy within the units can be modeled using more complex computational fluid dynamics (CFD) models, enabling, for example, a precise analysis of the mixing process. Although these models allow conclusions to be drawn about encapsulation efficiency (EE) [61], statements about the particle size distribution (PSD), which, in addition to the mean particle diameter (Dmean), also contains information about the width of the distribution and thus the polydispersity (represented by the polydispersity index, PDI), cannot be made (simple models) or require high computing capacities (CFD) due to their complexity. However, this information is essential for predicting whether the LNPs produced satisfy the regulatory requirements and, when used as a process model, should also have a computational time as short as possible. LNP formation is often described as antisolvent crystallization and nanoprecipitation [62,63]. To describe the formation process, population balance equations (PBEs), which are already widely used in crystallization modeling, are suitable here [64,65,66,67,68,69,70]. In addition, first publications show their applicability in modeling LNP formulation [62,71]. These describe the formation and growth of LNPs in the T-mixer and the subsequent aggregation. However, the diafiltration used in the industrial process for buffer exchange and stabilization of the LNPs is not modeled.
To demonstrate the broad applicability of lipid nanoparticles for stabilizing bioactive plant-derived compounds, this study investigates the encapsulation of representative ingredients from three industrial sectors: pesticides, cosmetics, and pharmaceuticals. This illustrates the versatility of LNP technology across diverse materials and regulatory requirements.
Current process models often lack comprehensive coverage of the entire continuous manufacturing process and do not simultaneously predict all critical quality attributes, such as encapsulation efficiency and particle size distribution. This gap limits their practical use for process control and optimization.
To address this, this study develops and validates a population balance-based process model that predicts both particle size distribution and encapsulation efficiency throughout the full continuous process, from rapid mixing in the T-mixer to stabilization by diafiltration. Inline spectral methods as well as multi-angle and dynamic light scattering support real-time monitoring and quality control.
As Processes is a journal focused on chemical and bioengineering process development, this work emphasizes process design optimization and control. Consequently, detailed characterization of physicochemical properties, such as zeta potential long-term stability and drug release, as well as bioavailability studies, which are essential for final product evaluation, are beyond the scope of this study and addressed in separate product development efforts.
By integrating validated process models with process analytical technologies, this work contributes to the development of autonomous, model-based process control that enhances process robustness and minimizes out-of-specification (OOS) runs in continuous LNP manufacturing.

2. Materials and Methods

2.1. Encapsulation of Pesticides and Fragrances in SLNPs Using Ultrasonication

For the production of LNPs using homogenization and sonication, palmitic acid or iris butter was heated to 70 °C on a heatable stirring plate (IKA-Werke GmbH & Co. KG, Staufen, Germany). In parallel, an additional 40 mL of an ethanol–ethyl acetate mixture (1:1), optionally containing dissolved quercetin (Thermo Fisher Scientific, Waltham, MA, USA), was also heated to 70 °C. In addition, the aqueous surfactant solution, consisting of 10 mL of water and Tween 80, was heated to 70 °C. The ethanol–ethyl acetate mixture was added to the lipid and stirred for one minute at 300 rpm. The aqueous surfactant solution was then added, and an oil–water emulsion was created by stirring for three minutes at 300 rpm. The emulsion was additionally homogenized at 9000 rpm for 3 min (Ultra Turrax T25 Basic, IKA Korea. Ltd., Seoul, Republic of Korea) and finally sonicated for 10 min at an amplitude of 30%. The entire process took place at 70 °C [3]. The LNPs were generated by rapid cooling by diluting the emulsion five times with 4 °C cold water [3,14].

2.2. Encapsulation of Nucleic Acids in LNPs by Pipetting

The LNPs were formed by rapid mixing of an ionizable lipid (ALC-0315; Cayman Chemical, Ann Arvor, MI, USA), β-sitosterol as phytosterol (MedChemExpress, Monmouth Junction, NJ, USA), a PEG lipid (ALC-0159; Cayman Chemical, Ann Arvor, MI, USA), and a phospholipid (1,2-distearoyl-sn-glycero-3-phosphocholine, DSPC; Avanti Polar Lipids, Alabaster, AL, USA) with the nucleic acid in aqueous buffer at pH 4 and subsequent buffer exchange in PBS at pH 7.4. Since the encapsulated pDNA encodes the BNT162b2 mRNA (GenScript Biotech, Piscataway, NJ, USA), the molar ratios of the lipids in the lipid mixture were also based on the Pfizer/BioNTech mRNA vaccine formulation [47,72]. Empty LNPs were prepared as a positive control. All experiments were performed at a scale of 1.25 mL.

2.3. Determination of Encapsulation Efficiency

The quercetin concentration was determined using RP-HPLC with a PharmPrep (RP18 endcapped, 10 µm, 4.6 × 250 mm, Merck Millipore, Burlington, MA, USA) according to a previously published method [73]. Iron concentrations were determined using an in-house GC method with an FID detector, helium as the carrier gas, and a flow rate of 1 mL/min.
To determine the free and encapsulated nucleic acid concentration, an anion exchanger was used (TSKgel® DNA-NPR; 7.5 cm × 4.6 mm, 2.5 µm particle size; Tosoh Bioscience, Tokyo, Japan) and the peak area was determined.
The concentration of the free components ( c free ) was determined by measuring the solution without pretreatment. The LNPs were lysed ( c Lysed   LNP ) by adding methanol (quercetin) or ethanol (iris butter) [3,74]. Lysis of nucleic acid-loaded LNPs was achieved by the addition of Triton X-100 (Merck Millipore, Burlington, MA, USA) [75,76,77,78]. The encapsulation efficiency can then be determined using the following equation [75,76]:
E E = c L y s e d   L N P c f r e e c I n p u t · 100 .

2.4. Particle Analysis

Particle sizes of the generated LNPs were determined using dynamic light scattering (DLS). For this purpose, the MALS/DLS detector DAWN® (Wyatt Technology Corporation, Santa Barbara, CA, USA) was compared with the Malvern Zetasizer Nano ZS ZEN3600 (Malvern Panalytical Ltd., Malvern, UK). Measurements with the Zetasizer were conducted at 20 °C after dilution with deionized water. Measurements compromised by sedimentation or poor mixing were excluded.
The particle size of LNPs produced by ultrasonication was determined in batch mode using DAWN, where diluted samples (1:100 with water) were pumped through the detector. The measurement interval was 1 s, and the detection angle was 135°. For nucleic-acid-loaded LNPs, particle size was measured in flow-through after size exclusion chromatography (SEC) separation combined with diode array detector (DAD), MALS/DLS, and refractive index (RI) detectors. SEC was conducted isocratically with 1× PBS pH 7.4 at 0.3 mL/min [79].
The evaluation was carried out with Astra 8.1.2 software. The mean hydrodynamic diameter and polydispersity index (PDI) for monomodal distributions were determined using the cumulant method, which is the standard analysis procedure in the Zetasizer software 7.13. The cumulant method relies on the assumption of a single Gaussian particle size distribution and calculates the mean diffusion coefficient from the intensity autocorrelation function [80]. However, in the presence of multimodal distributions, as observed in this study, the cumulant method provides only an approximate mean size and can lead to overestimation of PDI. More advanced methods, such as regularization, were also applied to resolve complex size distributions [81,82].
Further mathematical details and in-depth treatment of the cumulant method are available in the literature [80]. Particle concentration of nucleic acid LNPs was estimated from MALS data using the sphere model with refractive indices of 1.33 and 1.45 for buffer and particles, respectively [83,84].

2.5. Population Balance Modeling

The previously published model [61] is mainly based on simple mass balances.
The pH value established after mixing in the T-mixer and increased to a neutral level during diafiltration was calculated using the Henderson–Hasselbalch equation (Equation (2)). This describes the pH of buffer systems by considering the negative decadic logarithm of the acid constant ( p K a ) as well as the acid ( c H A ) and the conjugated base concentration ( c A ) [85]:
p H = p K a + log ( c A c H A ) .
It is assumed that the particle formation follows the following kinetics, with r as the reaction rate, ci as the reactants, and the stochiometric coefficients fi as exponents:
r = k · c n u c ( z ) f n u c · c i o n ( z ) f i o n · c h e l p ( z ) f h e l p · c c h o l ( z ) f c h o l · c P E G ( z ) f P E G .
The proportions of lipids and nucleic acids ( f i ) in a LNP and the rate constant were taken from the literature. The pH dependence of the rate constant (k) can be described as follows [72,86,87]:
k = k 1 · K a + k 2 · c H 3 O + K a +   c H 3 O + .
The rate constant depends on the rate constants ( k 1 and k 2 ) of the forward and reverse reactions of ionization as well as the oxonium ion concentration ( c H 3 O + ) and the acid constant of the ionizable lipid ( K a ).
The formation of LNPs in the T-mixer was modeled using the axial dispersion approach. This model describes the overall concentration change as the sum of three effects along the reactor length: convection caused by the fluid velocity u, dispersion analogous to Fick’s law with the axial dispersion coefficient Dax quantifying the degree of back-mixing, and the concentration change resulting from the particle formation [88]. The fluid velocity results from the flow rates and reactor dimensions used in the experiments performed prior [89]. For the calculation of the axial dispersion coefficient, commonly used correlations like Trivedi–Vasudeva and Saxena–Nigam were applied:
c i t = u   · c i z + D a x   · 2 c i z 2 f i · r .
The differential equations can be solved by introducing the Danckwerts boundary conditions for the closed–closed vessel [90,91]:
c z = L z = 0 ,
D a x · c z = 0 z = u · c z = 0 c i n .
The simulation of the diafiltration step was based on a validated process model previously developed and published by Huter et al. [92,93] and Thiess et al. [94]. The permeate volume flow is dependent on the permeability LP, the total membrane area Am, and the driving force DF:
V ˙ P = L p D F A m = J V A m .
Driving force reducing effects such as osmotic pressure POsm can be calculated by correlations based on the solute concentration on the membrane surface cm:
D F = T M P P O s m ( c m ) .
The transmembrane flux decline by concentration polarization can then be described by the following equation, first introduced by Michaels [95]:
J V = k f   ln c m c b .
The permeability of the membrane is given by Equation (11), with the viscosity η assumed to equal water and the membrane resistance Rm calculated from the normal water permeability of the membrane prior to the performed experiment:
L P = 1 η R m   ,
so that the total transmembrane flux V ˙ P can be calculated as:
V ˙ P = T M P P o s m η R m A m .
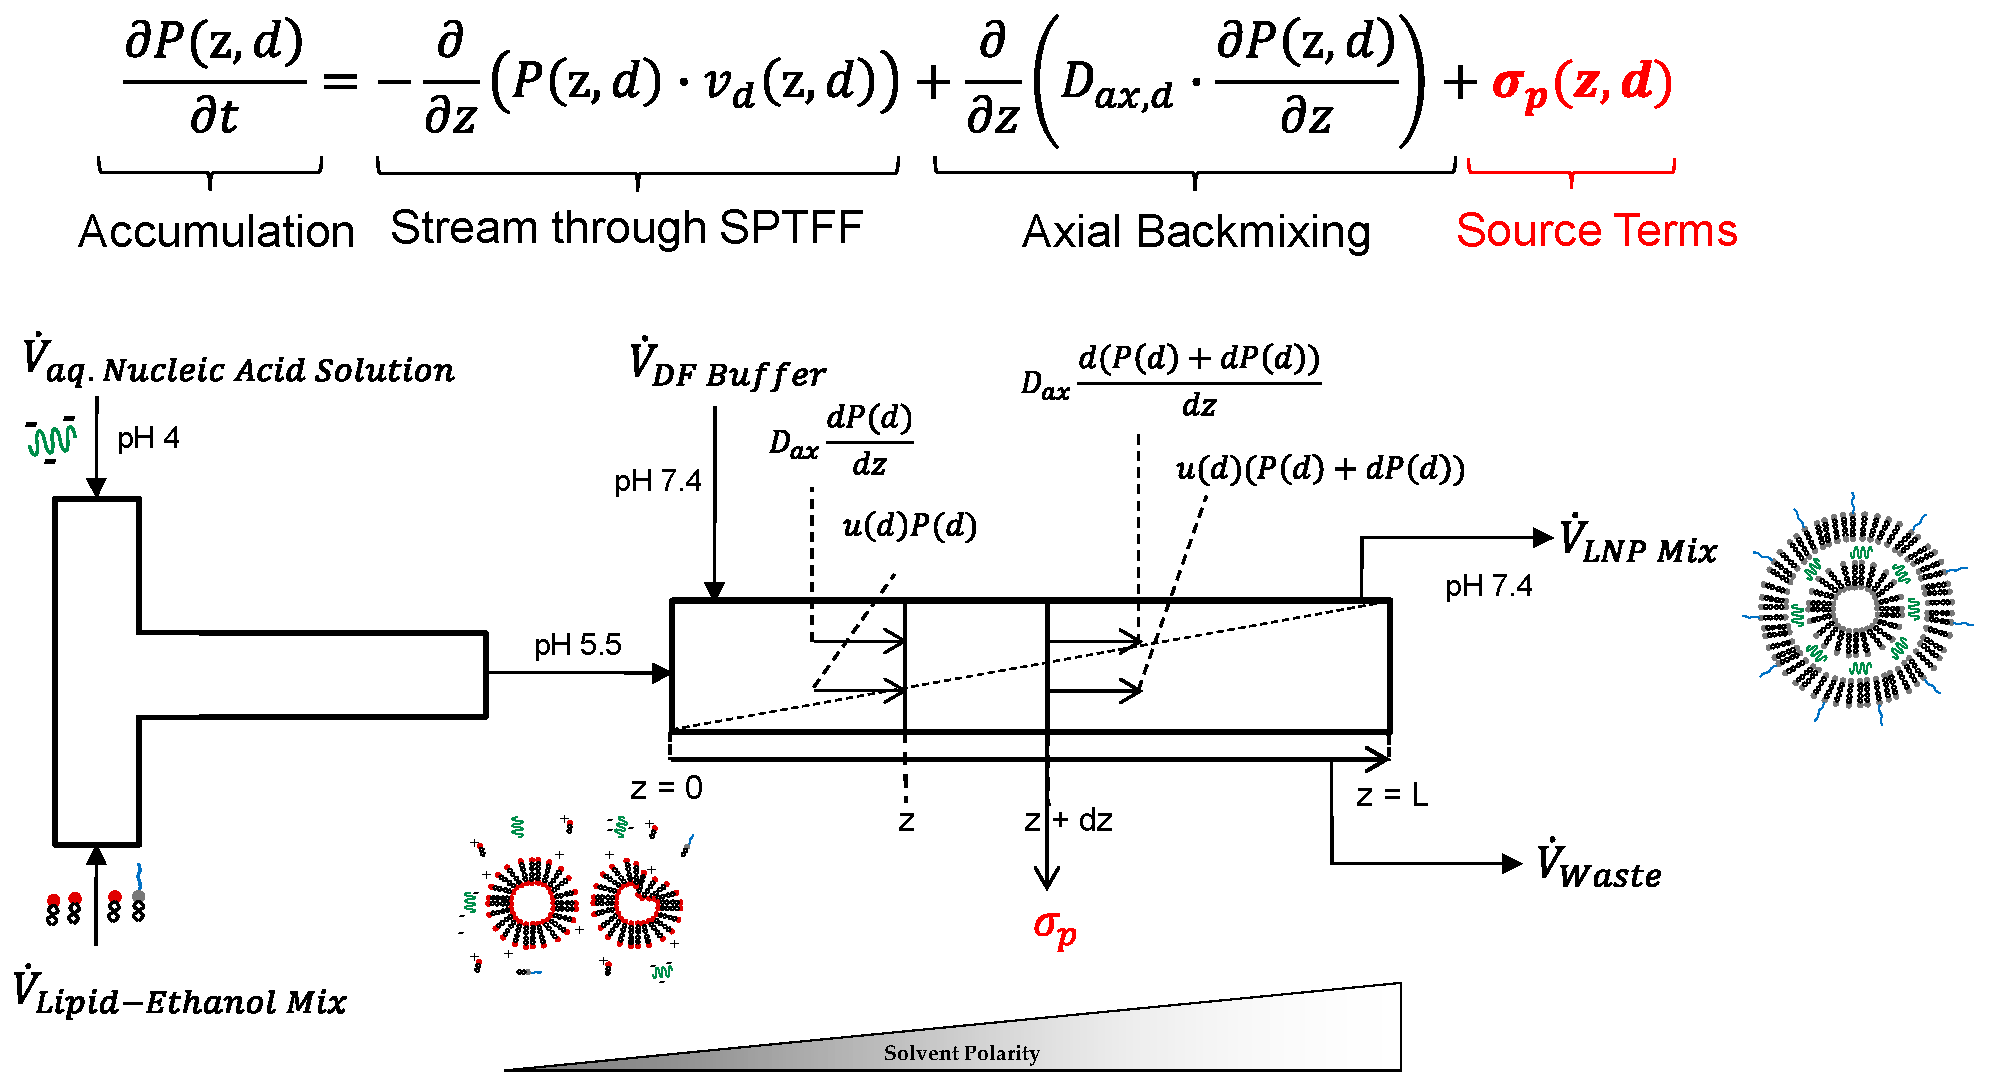
To be able to predict the particle size distribution and, therefore, the mean particle diameter and the updated encapsulation efficiency, the model is expanded by population balance equations (PBEs) (Figure 1).
The PBEs typically consist of the following parts, known as source terms: nucleation, growth, aggregation, and breakage [59,62,96]. Nucleation describes the incorporation of various molecules that form an LNP. During growth, additional molecules attach to the existing LNPs, resulting in an increase in volume. Aggregation represents the fusion of two or more particles into a larger particle. In the originally defined meaning, the breakage term describes the fragmentation of an LNP into two or more smaller particles [59]. Since this behavior is rather unlikely in nucleic acid LNPs and primarily results in complete disintegration, which is characterized by the release of nucleic acids and a consequent decrease in encapsulation efficiency [89], breakage is described in this work as the complete disintegration of particles due to shear influence:
σ P ( d ) = R N u c l e a t i o n ( d ) + R G r o w t h ( d ) + R B r e a k a g e ± ( d ) + R A g g r e g a t i o n ± ( d ) ,
n ( D ) t = N N D G n D D b D + A a d D a ( d ) .

2.5.1. Nucleation

The location-dependent (z) nucleation Nn is calculated using Equation (16) and consists of the nucleation rate N0, the Dirac delta function δ, and the particle size D. The calculation of the mean particle concentration (Dmean) in the Dirac delta function is based on findings from the literature [60], taking into account the proportionality factor a1, which was chosen so that the resulting mean particle size matches the experimental data and has a value of 13. The smallest particle size D0 was assumed to correspond to the size formed when a single nucleic acid molecule is encapsulated according to the stoichiometric coefficients of the lipids. This size was determined based on molecular weight analysis using MALS. The Dirac delta function assumes that the nuclei are monodisperse, which is a good assumption for particles formed in a T-mixer under turbulent, well-mixed conditions [59]. The nucleation rate can be calculated based on the assumption of a spontaneous crystallization or precipitation process via supersaturation [59,97,98,99]. Another possibility is to describe the process using mass action kinetics, taking into account the concentrations of the reactants with the stoichiometric coefficients in the exponent [100,101,102]. Since the composition of the lipids and nucleic acid was taken from Pfizer/BioNTech in this study, the stoichiometric composition (assumed to be constant here) and concentrations are known and already incorporated in the mass action kinetic described in Equation (3), and the mass action kinetics in Formula (16) was chosen. To determine the number-based particle concentration, the molar mass of an LNP MLNP, calculated by the molecular weight of the incorporated components and their respective stoichiometric coefficients, and the Avogadro constant NA are also taken into account:
N n z , D = N 0 ( z ) · δ ( z , D ) · ( D D 0 ) ,
N 0 z = k · c n u c ( z ) f n u c · c i o n ( z ) f i o n · c h e l p ( z ) f h e l p · c c h o l ( z ) f c h o l · c P E G ( z ) f P E G M L N P · N A .

2.5.2. Growth

The formation and thus the growth of particles depend significantly on the concentration of the ionic lipid cion [60]. In addition, the growth rate kG and the number particle size distribution n(D) are considered. The growth rate was determined by one factor at a time (OFAT) simulations, so that the results were numerically stable and the resulting deviation of the particle size distribution was lower than the experimental error and was 4.5 times smaller than the rate constant k of the formation:
G D = k G · D · c i o n z · n ( D ) .

2.5.3. Aggregation

The birth (Aa) and death (Da) rates due to aggregation of two smaller particles of size λ and D 3 λ 3 1 3 are calculated as follows [103]:
A a = D 2 2 D 0 D β ( ( D 3 λ 3 ) 1 3 , λ ) ( D 3 λ 3 ) 2 / 3 · n ( D 3 λ 3 1 3 , t ) · n λ , t d λ ,
D a = n ( D , t ) D 0 β ( D , λ n λ , t d λ .
β represents a proportionality constant, which is referred to as the aggregation kernel or collision rate. This is often described by the Smucholski collision kernel based on Brownian motion [104,105,106,107] and depends on the particle sizes, the Boltzmann constant kB, the viscosity η, and the temperature T. In addition, the influence of van der Waals interactions ΦVDW and electrostatic forces Φelec, which together result in Φtot, between the particles is taken into account via the attachment efficiency α. In the calculation of electrostatic forces, the zeta potential is included as a key parameter. Since the formulation is based on the established process by Pfizer/BioNTech, it is assumed that the zeta potential is comparable and, therefore, the corresponding values have been taken from the literature [108]. The calculation of the attachment efficiency is based on the Erjaguin–Landau–Verwey–Overbeek (DLVO) theory (Equation (21)) [109], where a represents the interparticle distance. Since the PEG lipid prevents aggregation, the proportionality factor kPEG is also introduced [62] and calculated by the division of the parameter aPEG by the PEG lipid concentration. aPEG was calculated for the center-point concentration of the PEG lipid, so that the resulting proportionality factor corresponded to that reported in the literature [62]:
β D , λ = α ( D , λ ) · 2 · k B · T 3 · η · ( D + λ ) 2 D · λ ,
α ( D , λ ) = k P E G ( D + λ ) 2 0 λ ( u ) e Φ V D W D , λ , a k B · T ( 2 + u ) 2 d u · 0 λ ( u ) e Φ t o t a l D , λ , a k B · T ( 2 + u ) 2 d u 1 ,
Φ t o t a l = Φ V D W + Φ e l e c ,
λ ( u ) = 6 ( u ) 2 + 13 u + 2 6 ( u ) 2 + 4 ( u ) ,
u = a D .

2.5.4. Breakage

The disintegration of the particles due to shear stress Db was calculated using the breakage rate kb. Since the ionized lipid and the LNPs were stabilized with increasing diafiltration and consequently with increasing pH value, this pH dependence of kb was calculated analogous to Equation (4) [86]. In addition, the shear dependence was calculated taking into account the viscosity η, the fluid velocity u, and the fiber length LFiber. The parameter γ describes the probability of particle breakage occurring at forces exceeding the reference force F0. For very low values of γ, breakage is considered a random, independent event that can occur even below F0, while for very high values of γ, breakage below the reference force is unlikely [110]. Since it is assumed that LNP disintegration is caused both by initial particle instability at the start of diafiltration and by shear forces exerted by the peristaltic pump, both effects were expected, and the value of γ was chosen as one to represent a balanced probability of breakage.
The determination of the reference force F0 was performed similarly to kG via OFAT simulations. This approach ensures that the calculated encapsulation efficiency remains within the experimental accuracy without compromising the numerical stability of the model, resulting in a value of 2.2 N. In order to calculate the new encapsulation efficiency (Formula (27)), the released nucleic acid concentration cnuc,b is required. This was derived from the size-dependent total number of nucleic acid molecules nnuc(D) released by the disintegration and calculated by experimentally determined size-dependent payload distribution [111]. The proportion of loaded LNPs is described by fnuc-LNP, and the molar mass of the nucleic acid by Mnuc:
D b D = k b · η · u · D 2 F 0 · L F i b e r γ · n ( D ) ,
c n u c , b = f n u c L N P · 1 N A · 0 n n u c D · D b D   d D · M n u c ,
E E = c n u c , 0 ( c n u c , R e t + c n u c , b ) c n u c , 0 · 100 .

3. Results

3.1. Encapsulation of Pesticides

Quercetin was chosen due to its plant protection properties. Under ultrasound treatment, an emulsion was produced from the target substance, which is soluble in ethanol, the lipid (palmitic acid), and the surfactant Tween 80. Rapid cooling of this emulsion produces the SLNPs. Particles without quercetin (empty particles) were also produced as a positive control.
Particle analysis was performed using dynamic light scattering in batch mode with the Zetasizer and as an alternative inline method with the DAWN. The Zetasizer can resolve a size range from 0.3 nm to 10 µm. According to the manufacturer, the DAWN covers a range from 1 nm to 2 µm in batch mode. For better comparability, the maximum particle size was set to 10 µm in the evaluation. In addition, if the particle properties (shape and optical properties) are known and after prior separation, e.g., via SEC, it would be possible to determine the particle concentration via MALS.
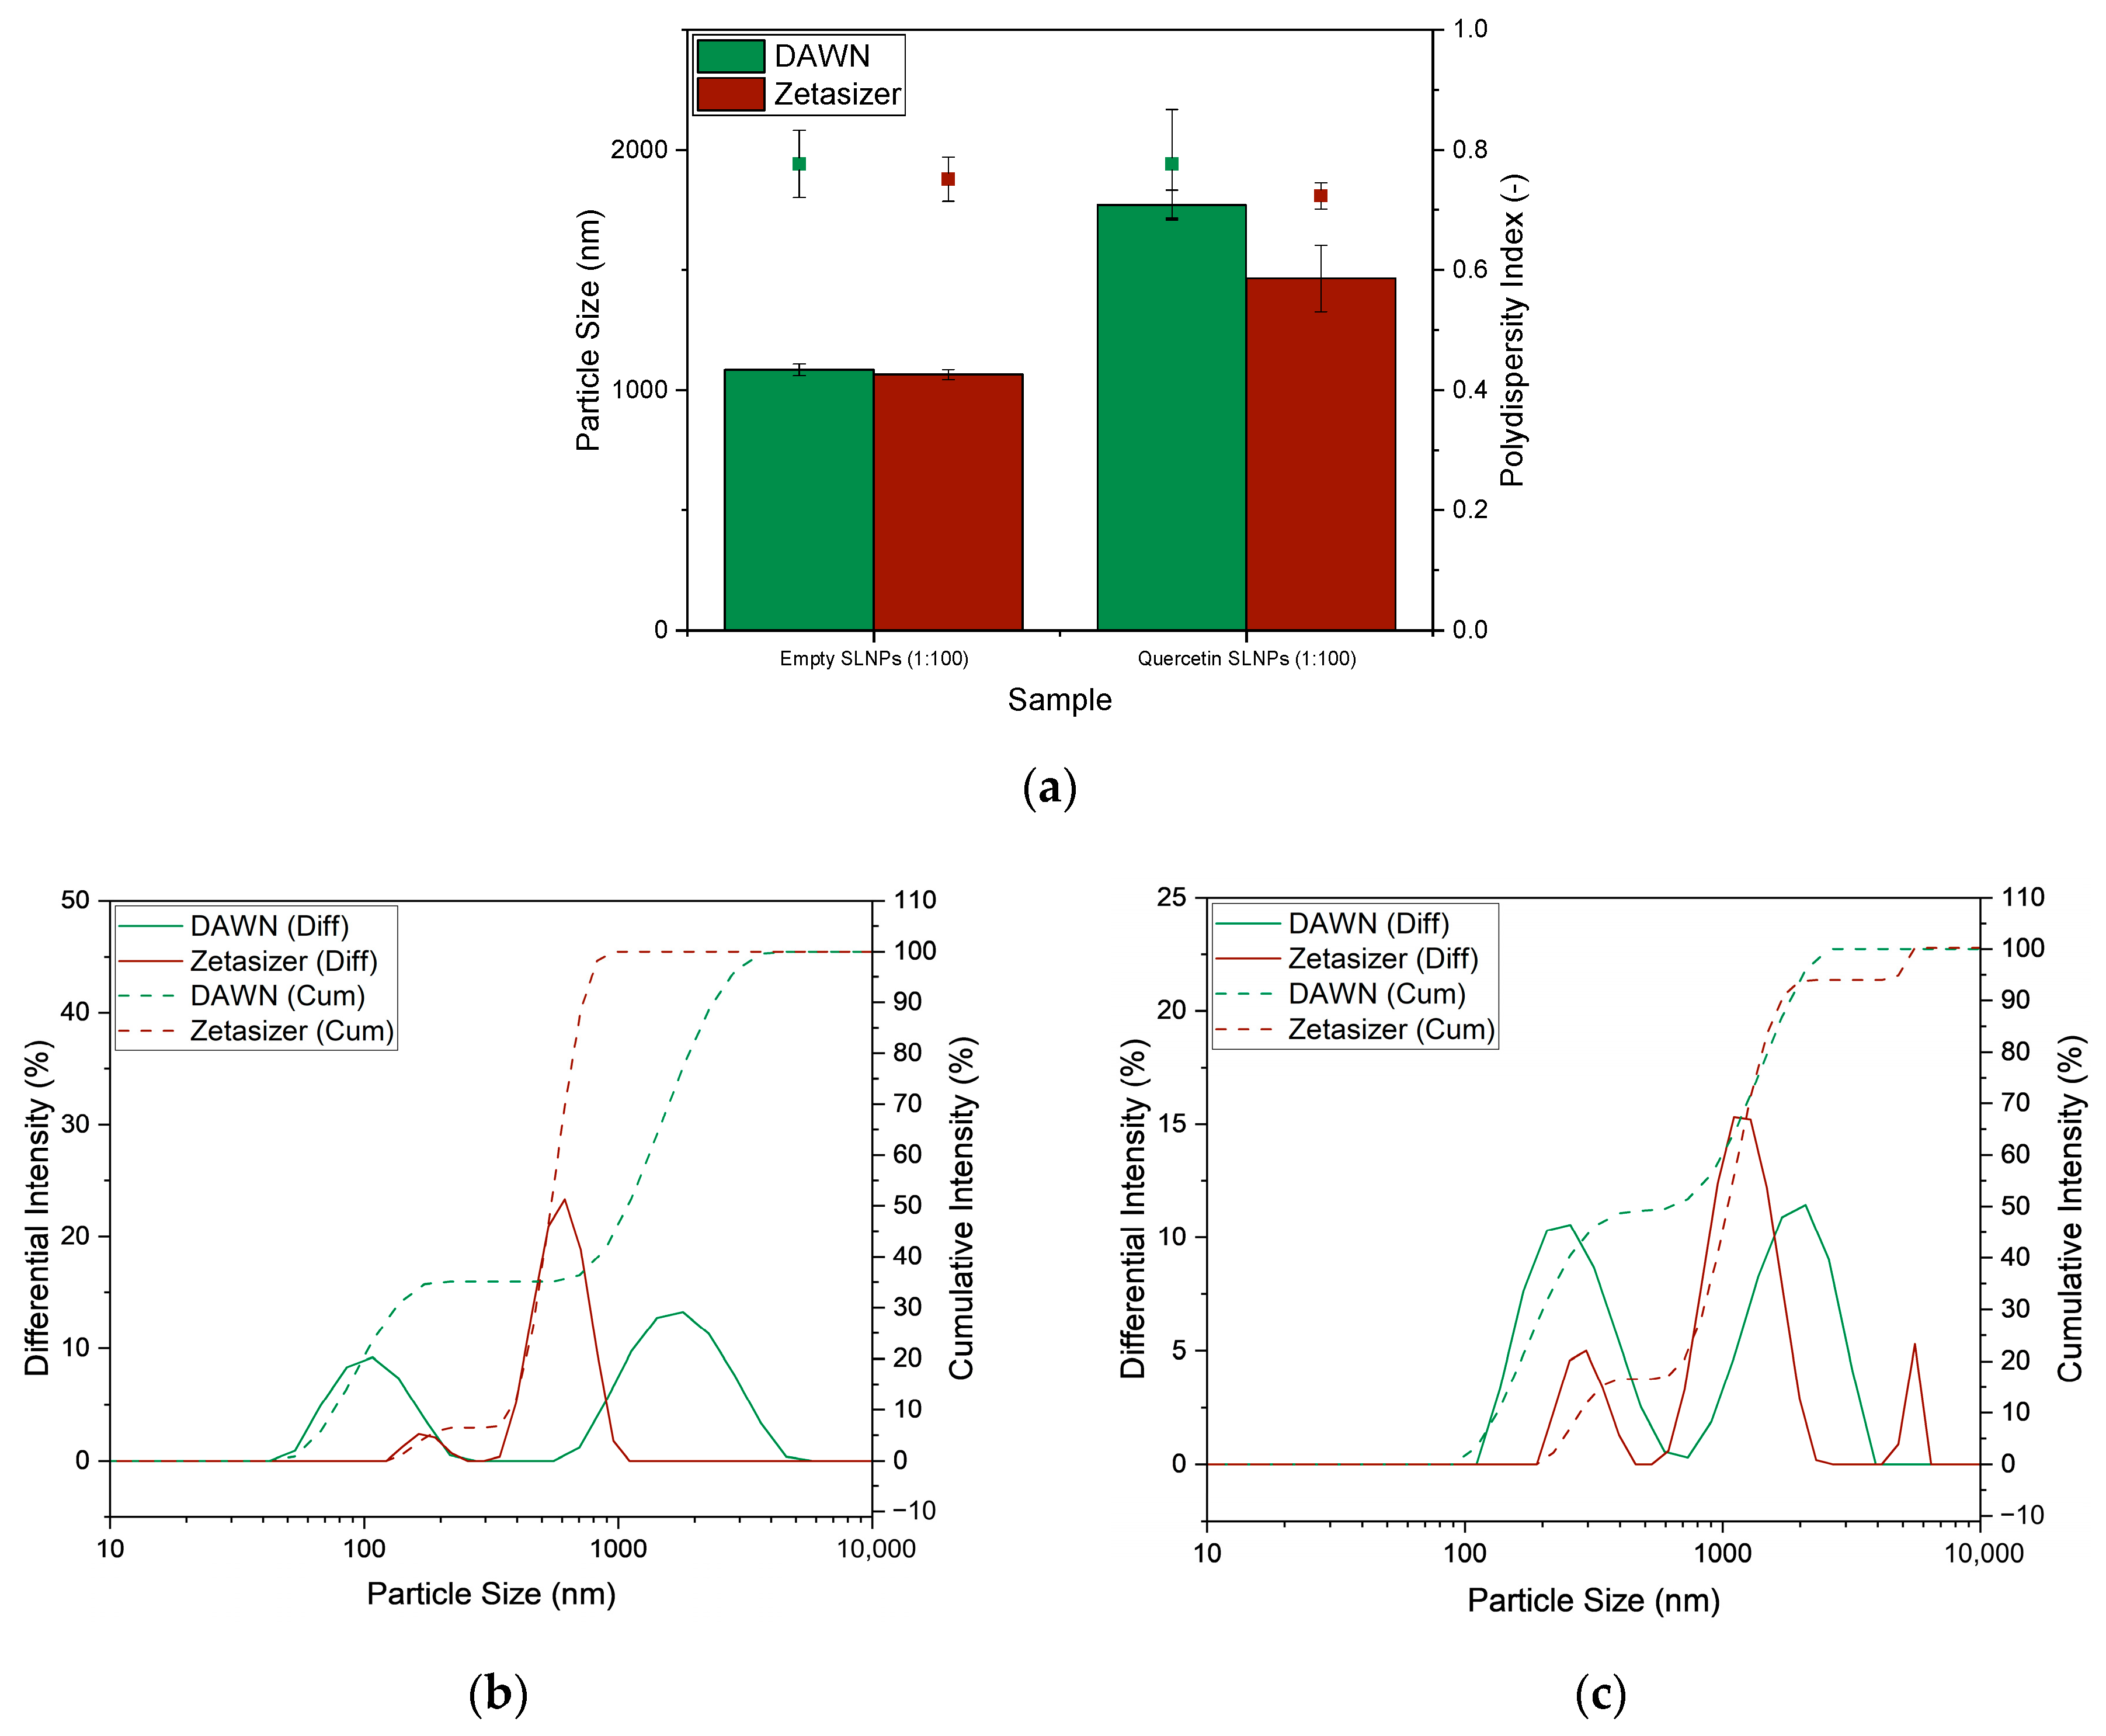
The average particle size determined using the cumulants method is 1065 ± 21 nm (Zetasizer) and 1084 ± 24 nm (DAWN) for the empty particles (see Figure 2a). There is a greater difference between the particle size of the quercetin LNPs measured with the Zetasizer (1464 ± 138 nm) and that determined with the DAWN (1770 ± 62 nm).
Two species can be identified in the intensity distribution (Figure 2b for the empty particles and Figure 2c for the particles loaded with quercetin). Cooling the emulsion by diluting it with cold water produces free quercetin crystals in addition to the LNPs. At a temperature of 25 °C and a pH value of 7, these are in the size range of approximately 200–1400 nm. At a pH value of 2, the size range shifts to approximately 400–2200 nm. In addition to the pH value, larger particles also occur as the temperature decreases [112]. The particles produced in this study are cooled to 4 °C at a pH value of 4.4. Consequently, the second peak at a particle size of approximately 1200 nm (Zetasizer and DAWN) for the particles loaded with quercetin can be attributed to free quercetin crystals and free lipid. Since a second peak also occurs in the preparation without quercetin (approximately 620 nm Zetasizer, 1800 nm DAWN), it is assumed that free solidified lipid is also present in this peak.
The particles in the first peak for the positive control are in the range of 53–220 nm with a peak maximum at 108 nm (DAWN) and in the range of 122–220 nm with a peak maximum at 164 nm (Zetasizer). Thus, the particles are in a comparable range for both measuring devices, with the DAWN additionally detecting more smaller particles. When the particles are loaded with quercetin, the peak maximum of the LNPs is 275 nm (Zetasizer) and 233 nm (DAWN), respectively, which corresponds to the size of 274 ± 15 nm documented in the literature [3]. The localization of the peaks in the intensity distribution of DAWN and Zetasizer is comparable, only the ratio of the two peaks is shifted toward the first peak in DAWN.
Due to this bimodal distribution, the application of the cumulants method to determine the mean particle diameter is improper and leads to high polydispersity indexes of 0.72–0.78. Furthermore, this must be taken into account when determining the encapsulation efficiency. Various methods are used in the literature as pretreatment for quercetin analysis. Common methods include prior filtration through a filter with a pore size between 0.45 µm [113] and 5 µm [3], or prior centrifugation at speeds of at least 4000 g [14,74,113,114]. However, filtration at the aforementioned cutoff would not result in complete separation of the free quercetin. With a smaller pore size of 0.5–1 µm, most of the free quercetin could be removed, but this may result in the separation of LNPs as well. Furthermore, hardly any quercetin could be detected in the supernatant of the centrifuged sample (<2.5% of the total amount), confirming that centrifugation causes not only the LNPs but also the free quercetin to sediment.
One way to determine the proportion of free quercetin would be to investigate the volume distribution. For particles that are ten times smaller than the wavelength of the measuring device (Zetasizer: 632.8 nm, DAWN: 659.4 nm), the Rayleigh range applies, in which the intensity of the particles is proportional to d6 [115,116,117]. For particles larger than ten times the wavelength, the Fraunhofer range can be used, in which the intensity is proportional to d2 [118,119,120]. However, the latter is only applicable when measuring at angles smaller than 30° (Zetasizer: 175°, DAWN: 135°) [120]. Since none of the peaks fall within these ranges, only evaluation using Mie’s theorem would be possible. However, the following assumptions have to be made for this [121]:
  • All particles are spherical.
  • All particles have the same homogeneous density.
  • The optical properties of the particles, such as the refractive index, are known.
  • The intensity distribution is not subject to any error.
  • Since the instruments are already affected by an error of 10–15%, the last assumption is always incorrect [121].
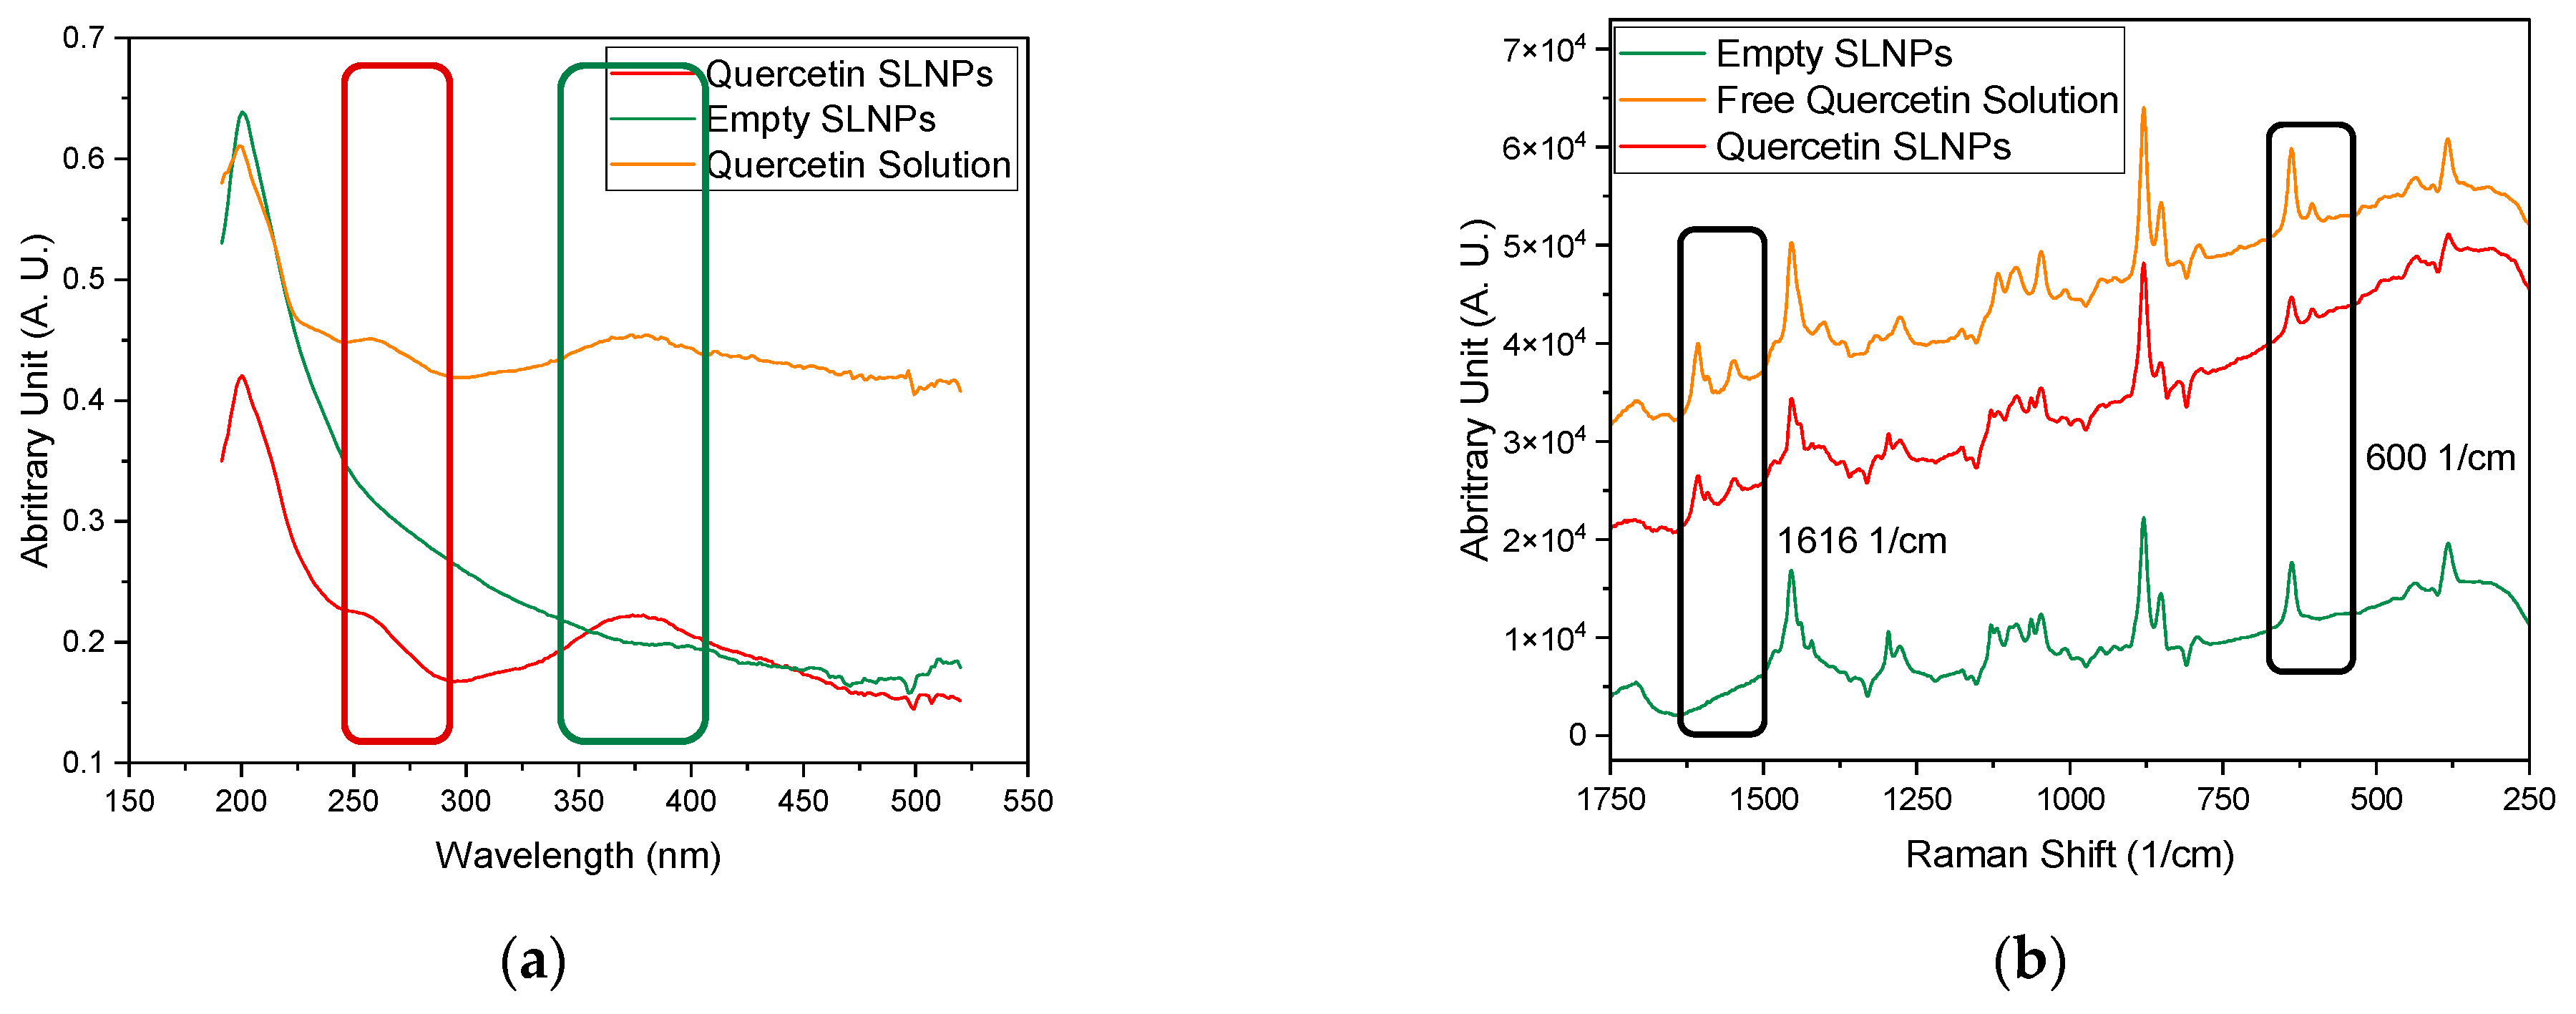
In order to monitor the encapsulation of quercetin during the process, DAD (Figure 3a) and Raman signals (Figure 3b) of the quercetin SLNPs, a quercetin solution, and empty SLNPs as a reference were examined in addition to MALS/DLS. In the DAD plot, two areas are relevant for the detection of quercetin, each of which can be assigned to a ring in the quercetin molecule and whose strength depends on the ionization of the quercetin molecule and, consequently, on the pH value. The first region is at approximately 250–280 nm (ring B, red box) and the second at approximately 340–400 nm (ring A, green box) [122]. Both the quercetin SLNPs and the quercetin solution show a peak for both rings, but as expected, the empty SLNPs show no peak. Since there is no significant difference in the intensity of the peaks between the quercetin SLNPs and the quercetin solution, it is not possible to differentiate between encapsulated and unencapsulated quercetin, although quercetin can be detected in the mixture.
Similar results were obtained for the recorded Raman spectra. Here, the peaks at 1616 cm−1 and 600 cm−1 (black boxes) are most relevant for the detection of quercetin [123,124]. In addition, when quercetin is encapsulated, the peaks at 1416 cm−1 and 1310 cm−1 are expected to decrease slightly compared to unencapsulated quercetin [123,124]. Although this is also evident in this study, the decrease is only minor and peaks from the empty SLNPs also occur here, making further measurements necessary to confirm this observation.
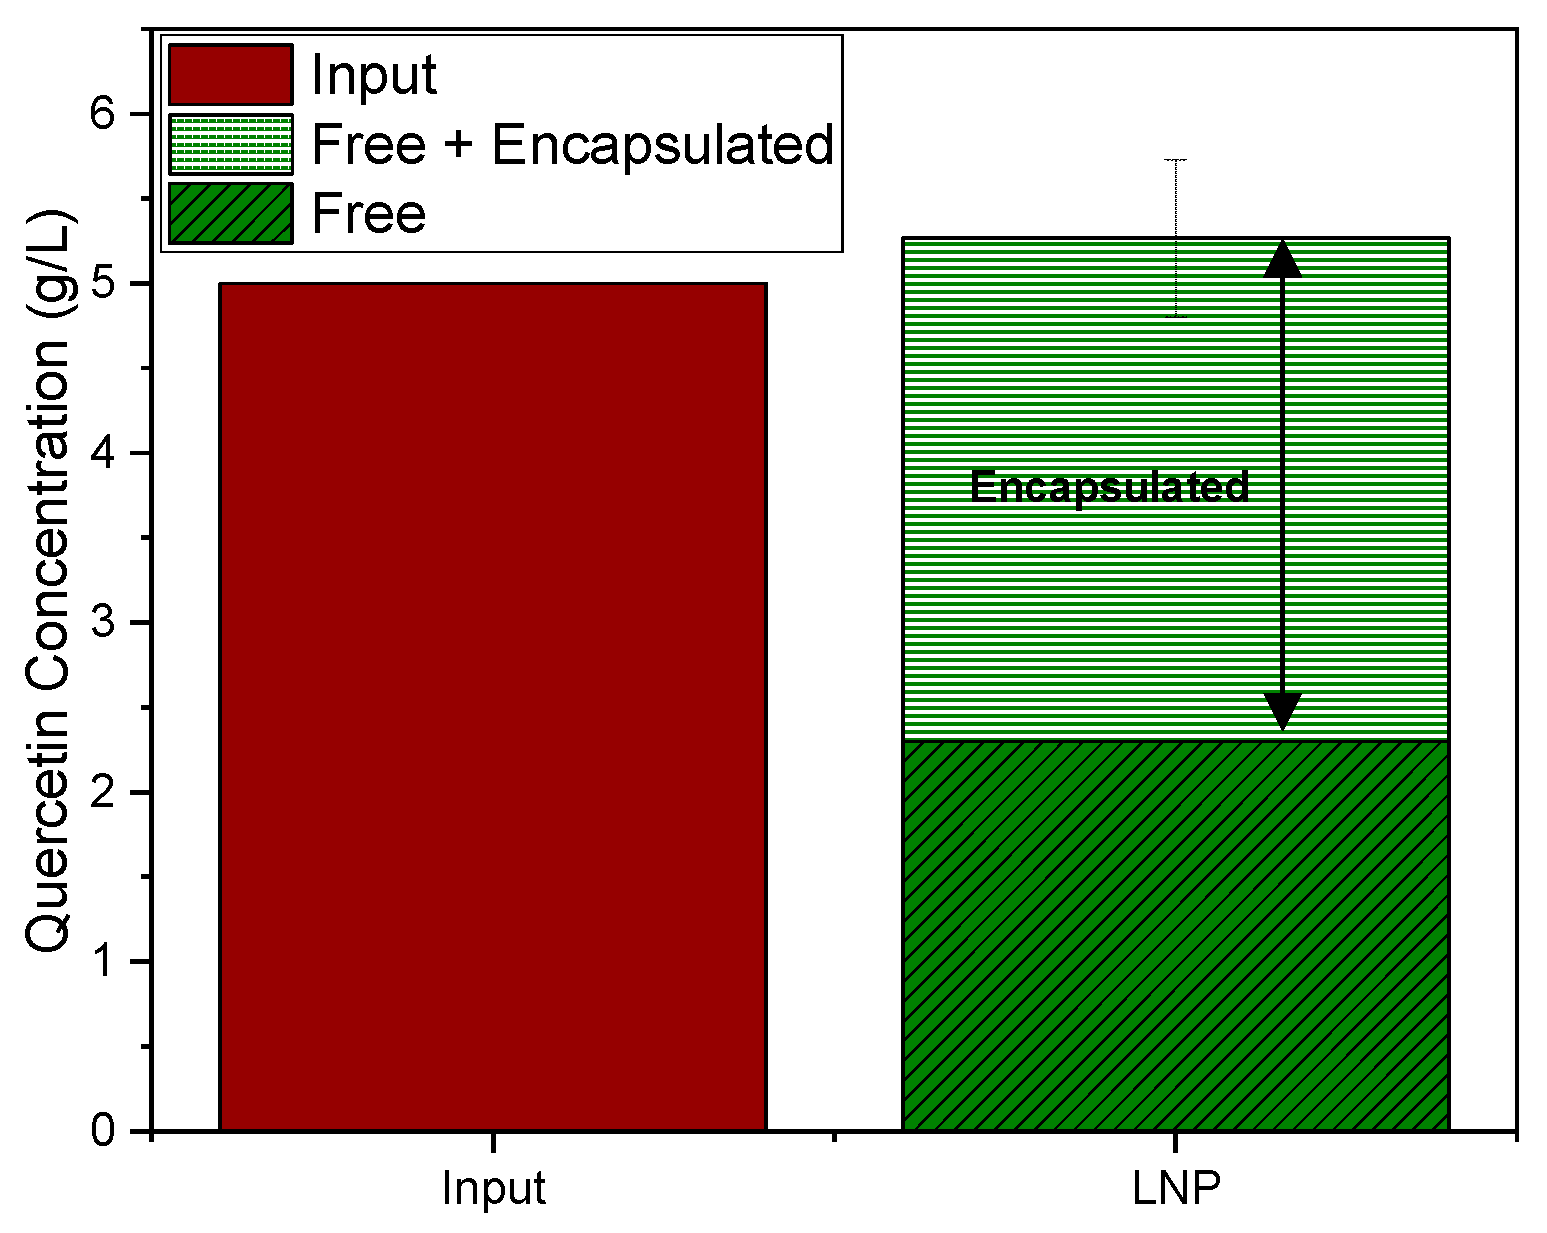
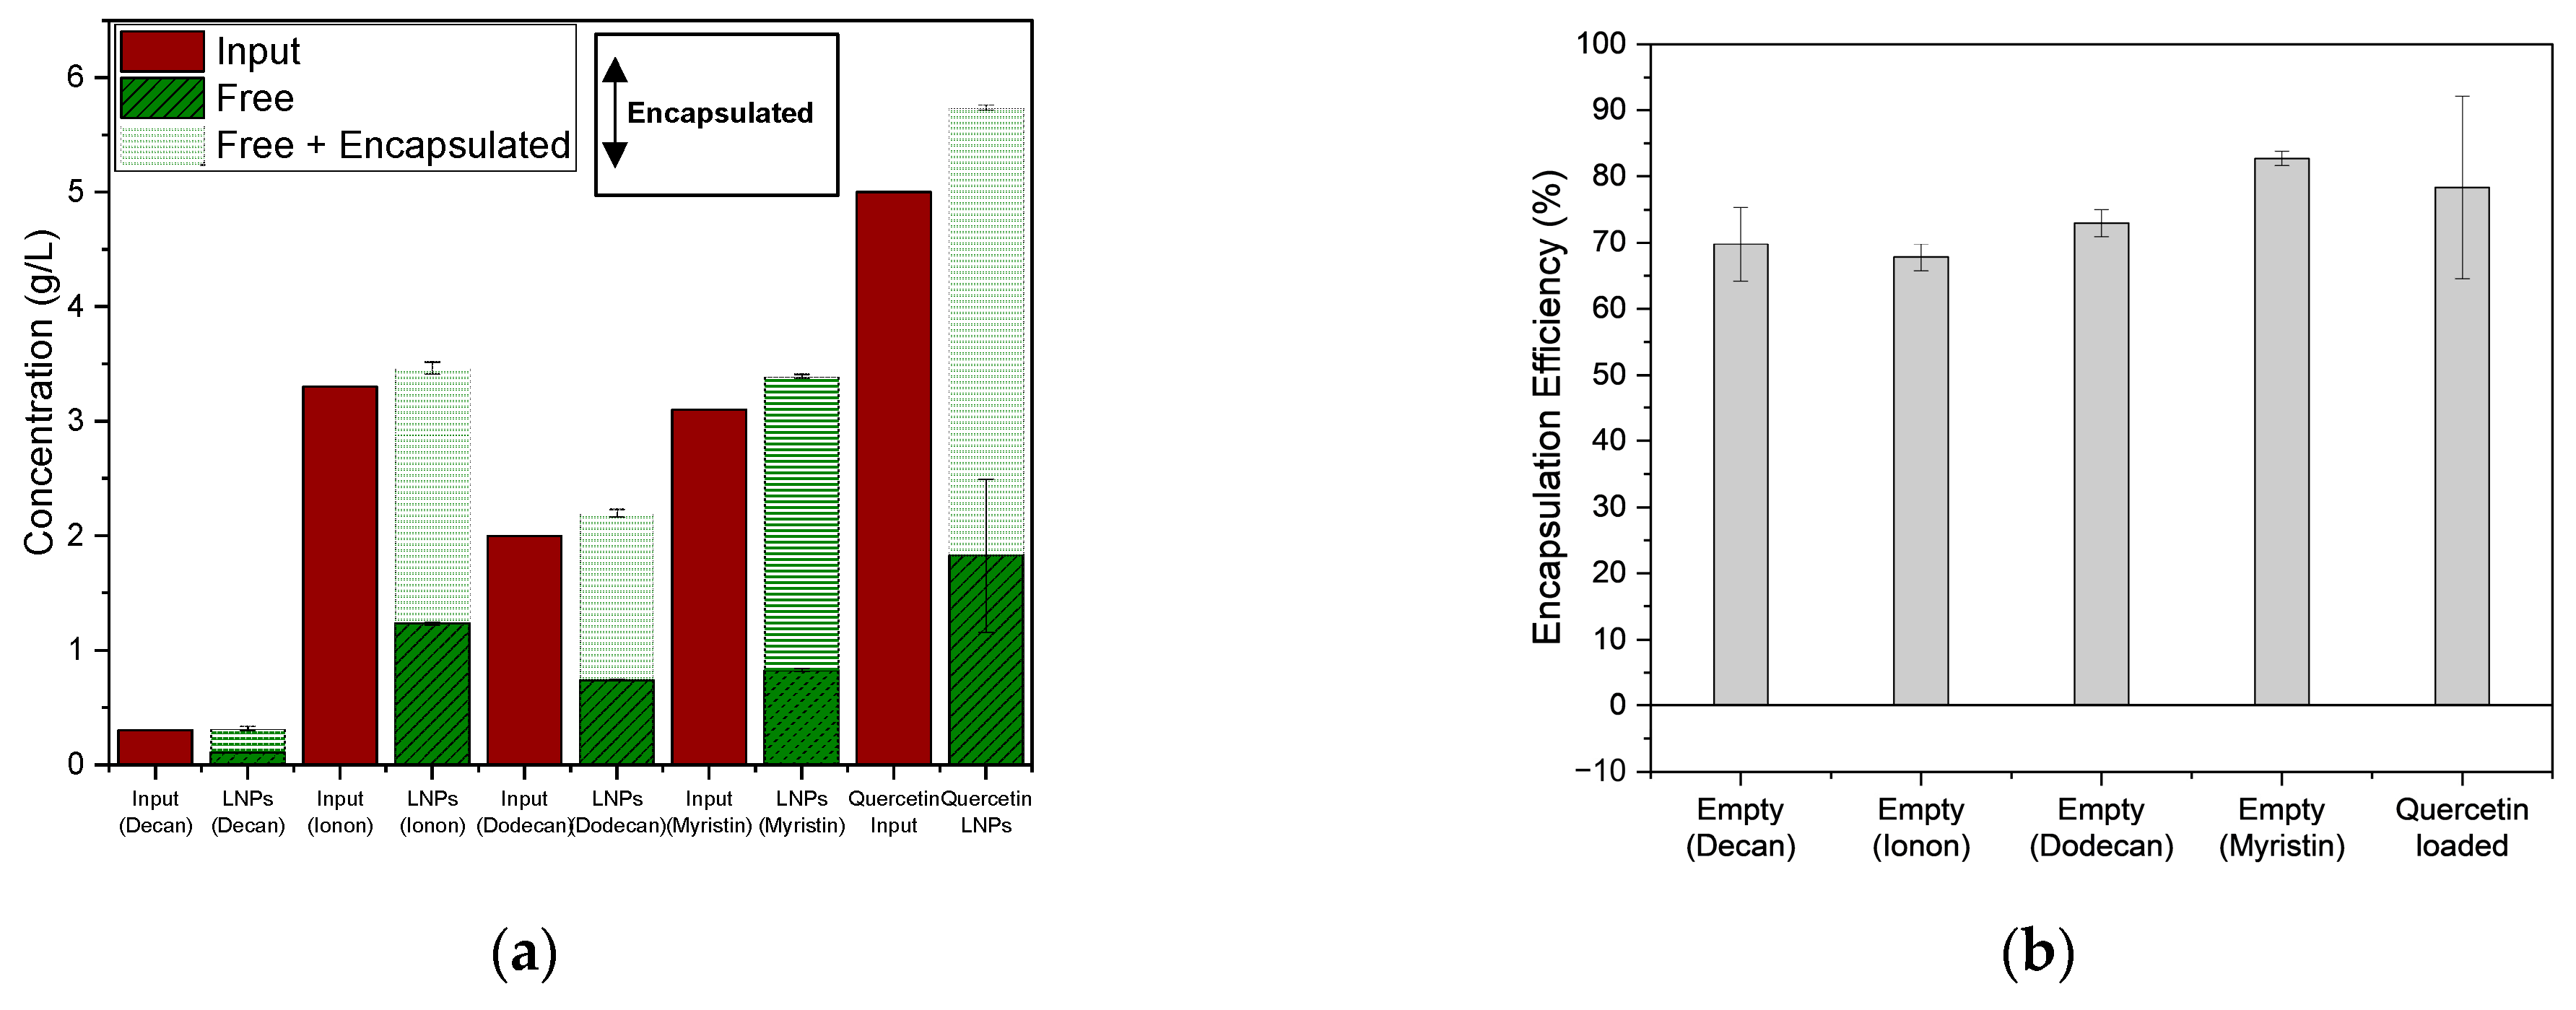
Since the pretreatment methods used in the literature, as discussed above, cannot separate the free quercetin crystals, the encapsulation efficiency is determined without further pretreatment in this study to ensure comparability. It is assumed that, analogous to the measurement of nucleic acid LNPs, in which Triton is added to disrupt the particles, the triple dilution and mixing with methanol additionally destroys the LNPs, resulting in the total amount of quercetin in the sample. The difference ultimately leads to the encapsulated amount of quercetin. As shown in Figure 4, the total amount of quercetin in the LNP solution can thus be found, of which 59.4 ± 9.2% is encapsulated. For quercetin SLNPs produced using the same method and the same quantities, Han et al. achieved an encapsulation efficiency of 46.2 ± 2.2% [3].

3.2. Encapsulation of Fragrances

To stabilize the irones in the iris butter, encapsulation is carried out using the same method as described above. However, instead of palmitic acid, the same amount of artificial iris butter is weighed in. Since this already contains 33% by weight of irone and other components that are not lipids, the ratio of lipid to iris butter shifts from 10:1 to 1.3:1. Nevertheless, taking into account the assumptions made above, an average of 70.2 ± 3.2% of the iris butter components can be encapsulated (see Figure 5a,b).
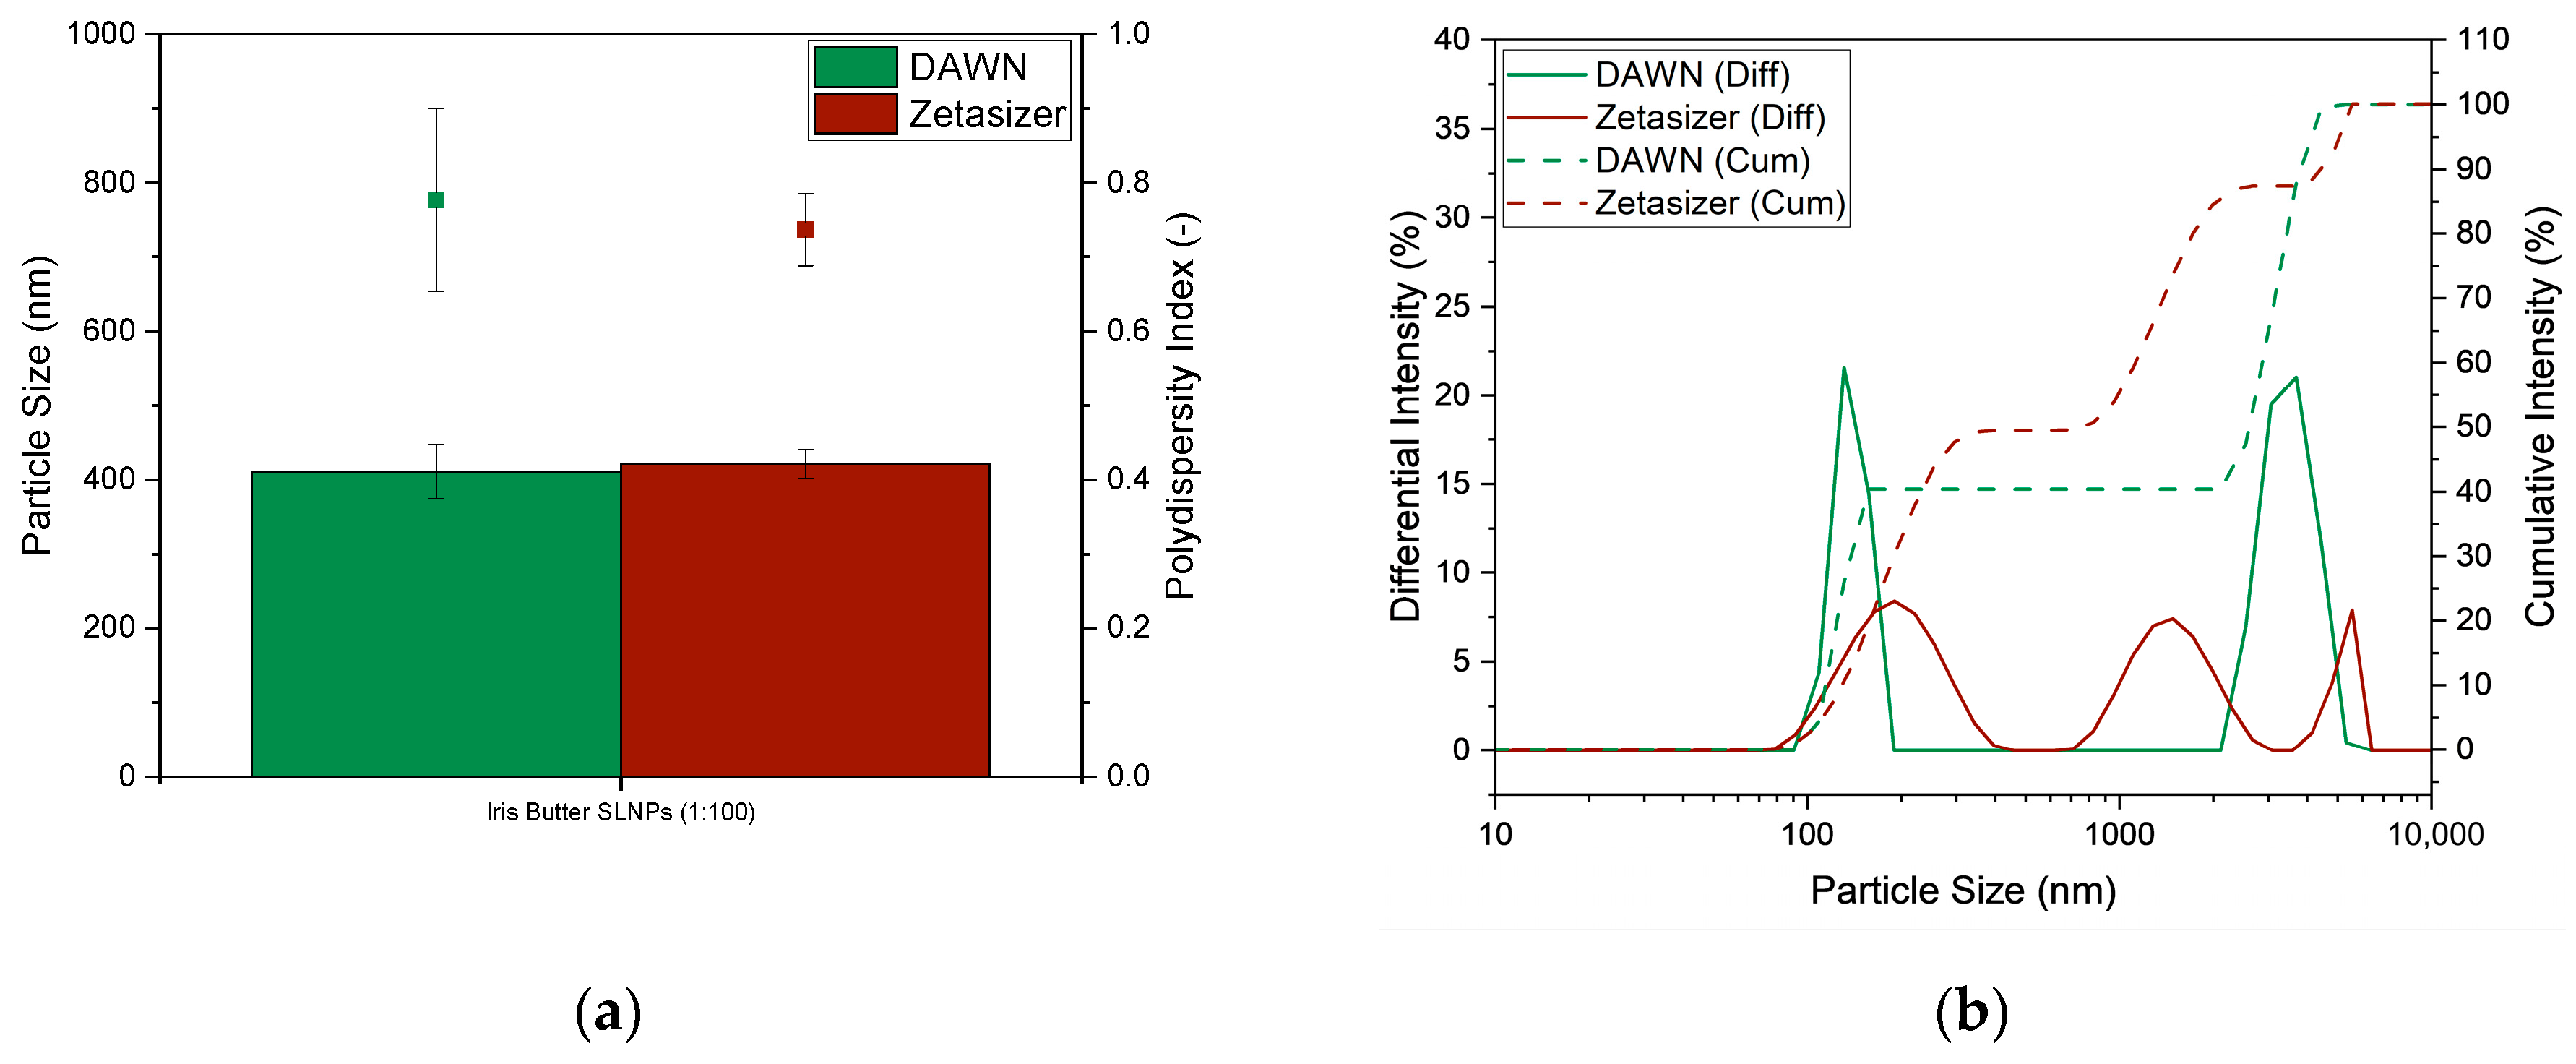
Particle analysis using the cumulants method results in a mean particle size of 411 ± 37 nm (DAWN) or 421 ± 20 nm (Zetasizer) and a PDI of 0.78 ± 0.12 (DAWN) or 0.67 ± 0.05 (Zetasizer). Based on the intensity distribution, the particle size of the LNPs is 150 nm according to DAWN and 190 nm according to Zetasizer. Both peaks start at approximately 90 nm. However, the distribution in the Zetasizer is broader (up to approximately 400 nm versus up to approximately 190 nm), but the intensity in the DAWN is greater (21.6% versus 8.4%) (Figure 6).

3.3. Use of Plant-Based Additives in the Encapsulation of Nucleic Acids

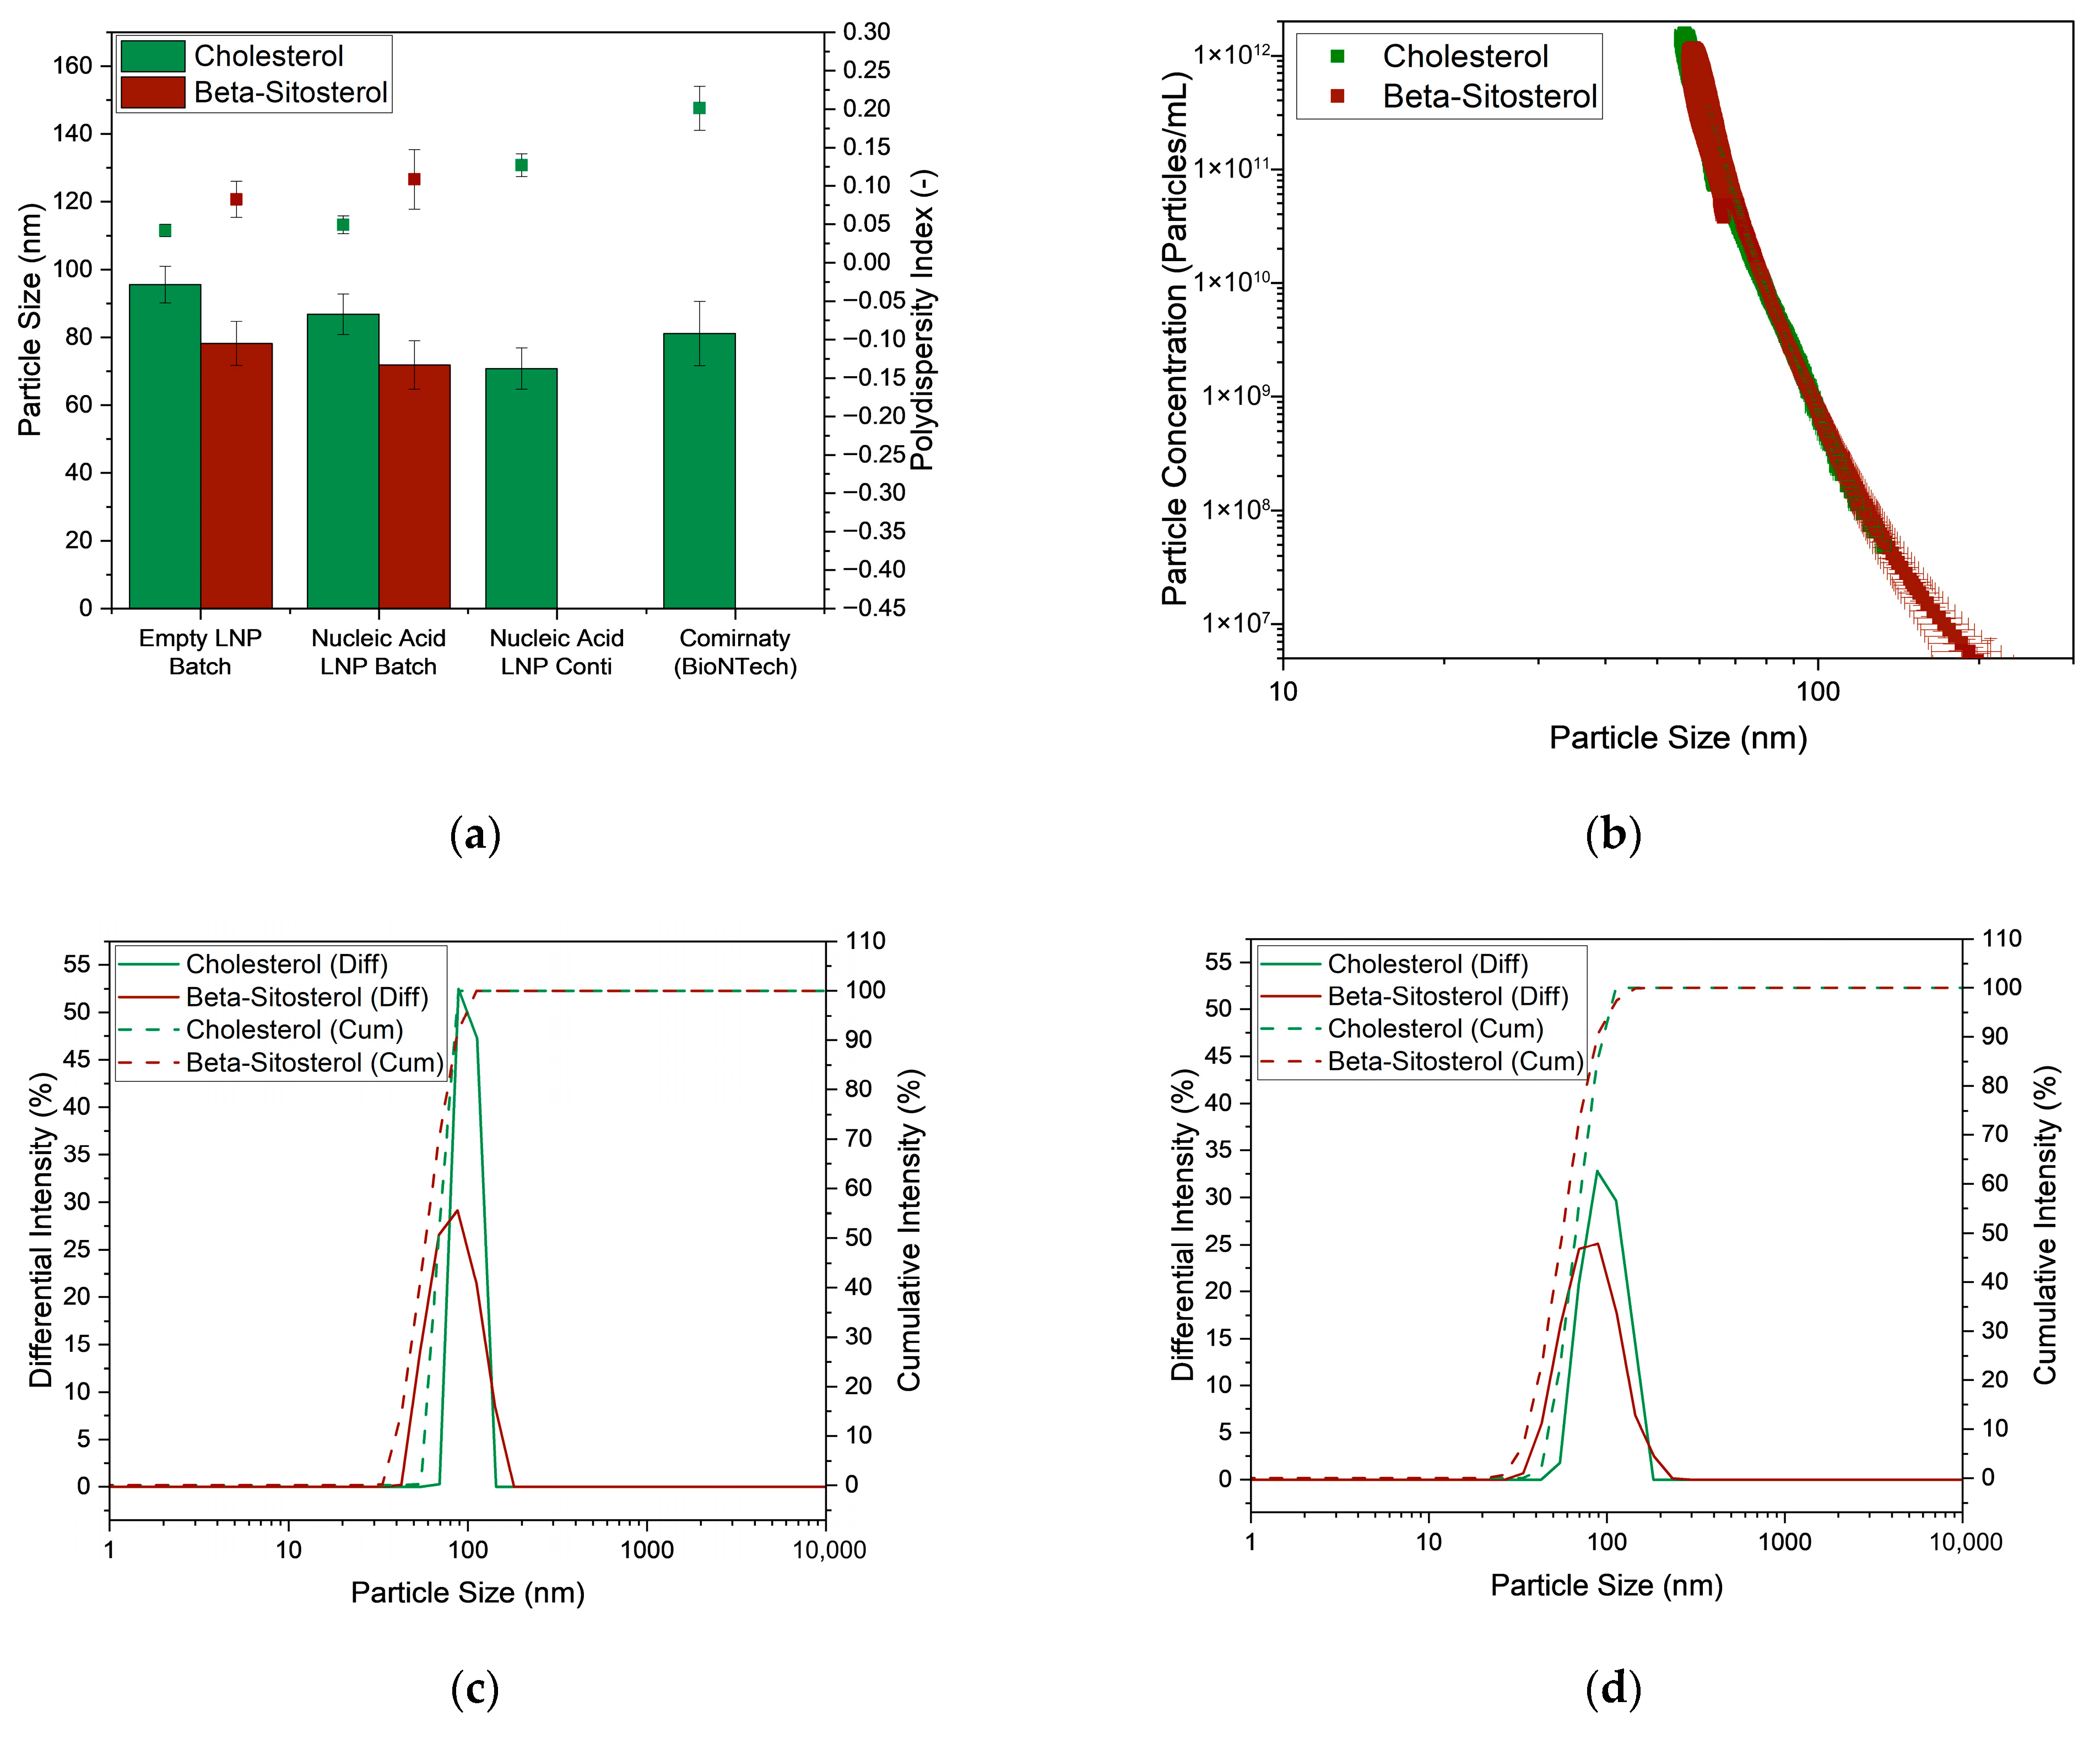
To prevent the degradation of nucleic acids during transport to the site of action, the nucleic acids are encapsulated in lipid nanoparticles, as in the example of the commercial COVID vaccine ComirnatyTM from Pfizer/BioNTech. As an alternative to the conventionally used cholesterol, the phytosterol β-sitosterol was used, which offers advantages in terms of biocompatibility with at least comparable efficacy. For this purpose, the lipids, which were dissolved in ethanol, were quickly mixed with the nucleic acids, which were present in an acidic buffer, using a pipette. In addition, a positive control without nucleic acids was prepared. Compared to the LNPs, which were produced with cholesterol by pipetting, the average particle size of the particles with β-sitosterol is approximately 15–17 nm smaller (positive control: 95.6 ± 5.4 nm vs. 78.2 ± 6.5 nm; with nucleic acids: 86.8 ± 6.0 nm vs. 71.8 ± 7.2 nm; see Figure 7a). Thus, the LNPs with nucleic acids are comparable in size to those produced continuously in a T-Mixer by Hengelbrock et al., which had a size of 70.8 nm [89]. The size of the LNPs is also below the regulatory limit of 100–200 nm [125] and within the particle size range of 66.0–93.4 nm documented in the literature for the ComirnatyTM vaccine [108,126,127,128,129,130,131].
In contrast, the polydispersity index of the phytosterol particles (empty: 0.08 ± 0.02; nucleic acids: 0.11 ± 0.04) is higher than that of the particles produced in batches with cholesterol (empty: 0.04 ± 0.01; nucleic acids: 0.05 ± 0.01). This is also shown in the intensity distributions of the positive control (Figure 7c) and the LNPs with nucleic acids (Figure 7d). The distributions of the phytosterol LNPs are wider than those of the cholesterol LNPs. Consequently, some particles are present that exceed the critical size of 100–200 nm. If the particle count is determined using dynamic light scattering and plotted against particle size, it becomes clear that the proportion of these particles is <<1% (see Figure 7b). In addition, the PDI of the nucleic acid LNPs is in the range of continuously produced LNPs (PDI of 0.13) and below the documented ComirnatyTM PDI of 0.2 ± 0.03 [108,126,127,128,130] and the maximum permissible PDI of 0.3 [125] and could be further reduced by more efficient mixing in the T-mixer [52,89,132]. The differences compared to commercial vaccine LNPs can probably be attributed to the timing of the measurements. Most measurements were performed on the (partially expired) final, refrigerated vaccine [126,127,128,130,131]. In these cases, a second species with a higher particle size (at 124 nm [128] or >5 µm [126,127]), which, although accounting for a small proportion of the number of particles (<1%) [126,128], is noticeable in the volume/mass or intensity distribution and thus leads to a higher PDI. In freshly manufactured LNPs, no second species is detectable in the particle size distribution, resulting in a PDI of less than 0.2 at a nucleic acid concentration of <0.5 g/L [108,129]. This suggests that aggregates form during storage, for example, which leads to a second peak in the particle size distribution.
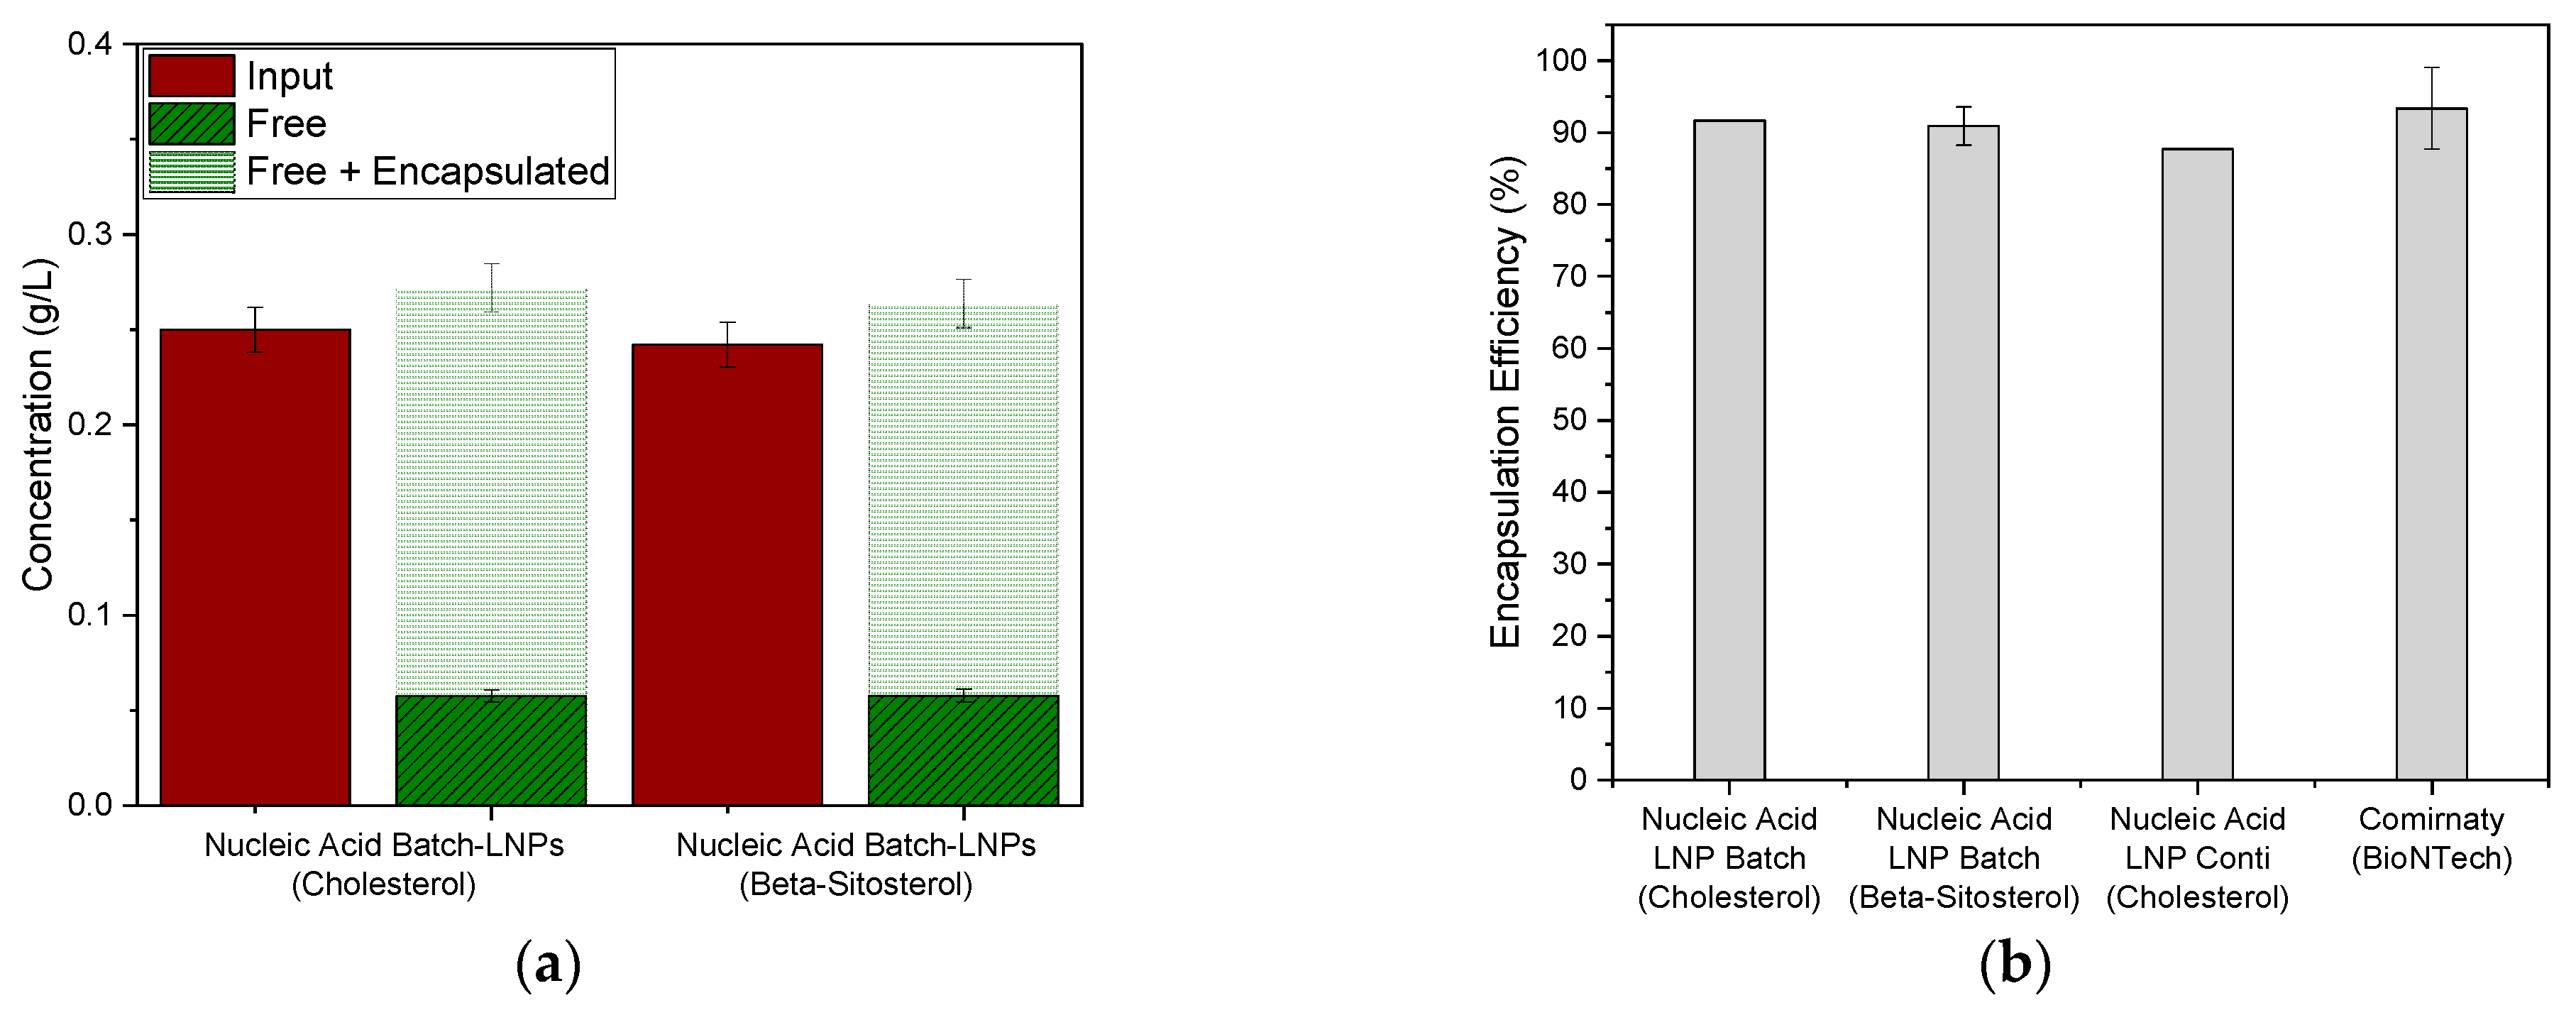
When β-sitosterol is used as a helper lipid instead of cholesterol, as expected, a comparably high encapsulation efficiency of 90.9 ± 2.7% is achieved with β-sitosterol compared to 91.6% (cholesterol; batch) and 87.7% (cholesterol; continuous; see Figure 8). This is also comparable to the EE of 93.4 ± 5.7% (83–98%) published in the literature for the coronavirus vaccine [108,127,129].

Population Balance Modeling

Population balances are used to reproduce the previously experimentally generated data on the continuous encapsulation of nucleic acids in lipid nanoparticles [89]. The process involved rapidly mixing the nucleic acids in acidic buffer with the lipids dissolved in ethanol in a T-mixer. To stabilize the LNPs produced, nine diafiltration volumes of buffer were exchanged to increase the pH to 7.4 and thus neutralize the ionizable lipid. Based on the model validation concept [133,134], one factor at a time studies (OFAT) were first used to identify the model and process parameters that have the greatest main effect on the target parameters and then, as described previously [61], evaluated using a failure mode effect (FMEA)-like analysis. Parameters that received a value of >2 were then examined for their interactions using multiple factors at a time (MFAT) studies. In order to evaluate the accuracy and precision of the model, a typical error of 5% [133,135] was taken into account for the determination of the model parameters in Monte Carlo simulations and compared with the experimental error. The mean particle size (Dmean) was chosen as the critical quality attribute and the encapsulation efficiency (EE) as the process attribute as target values for the evaluation of the parameter studies.
Model Parameters
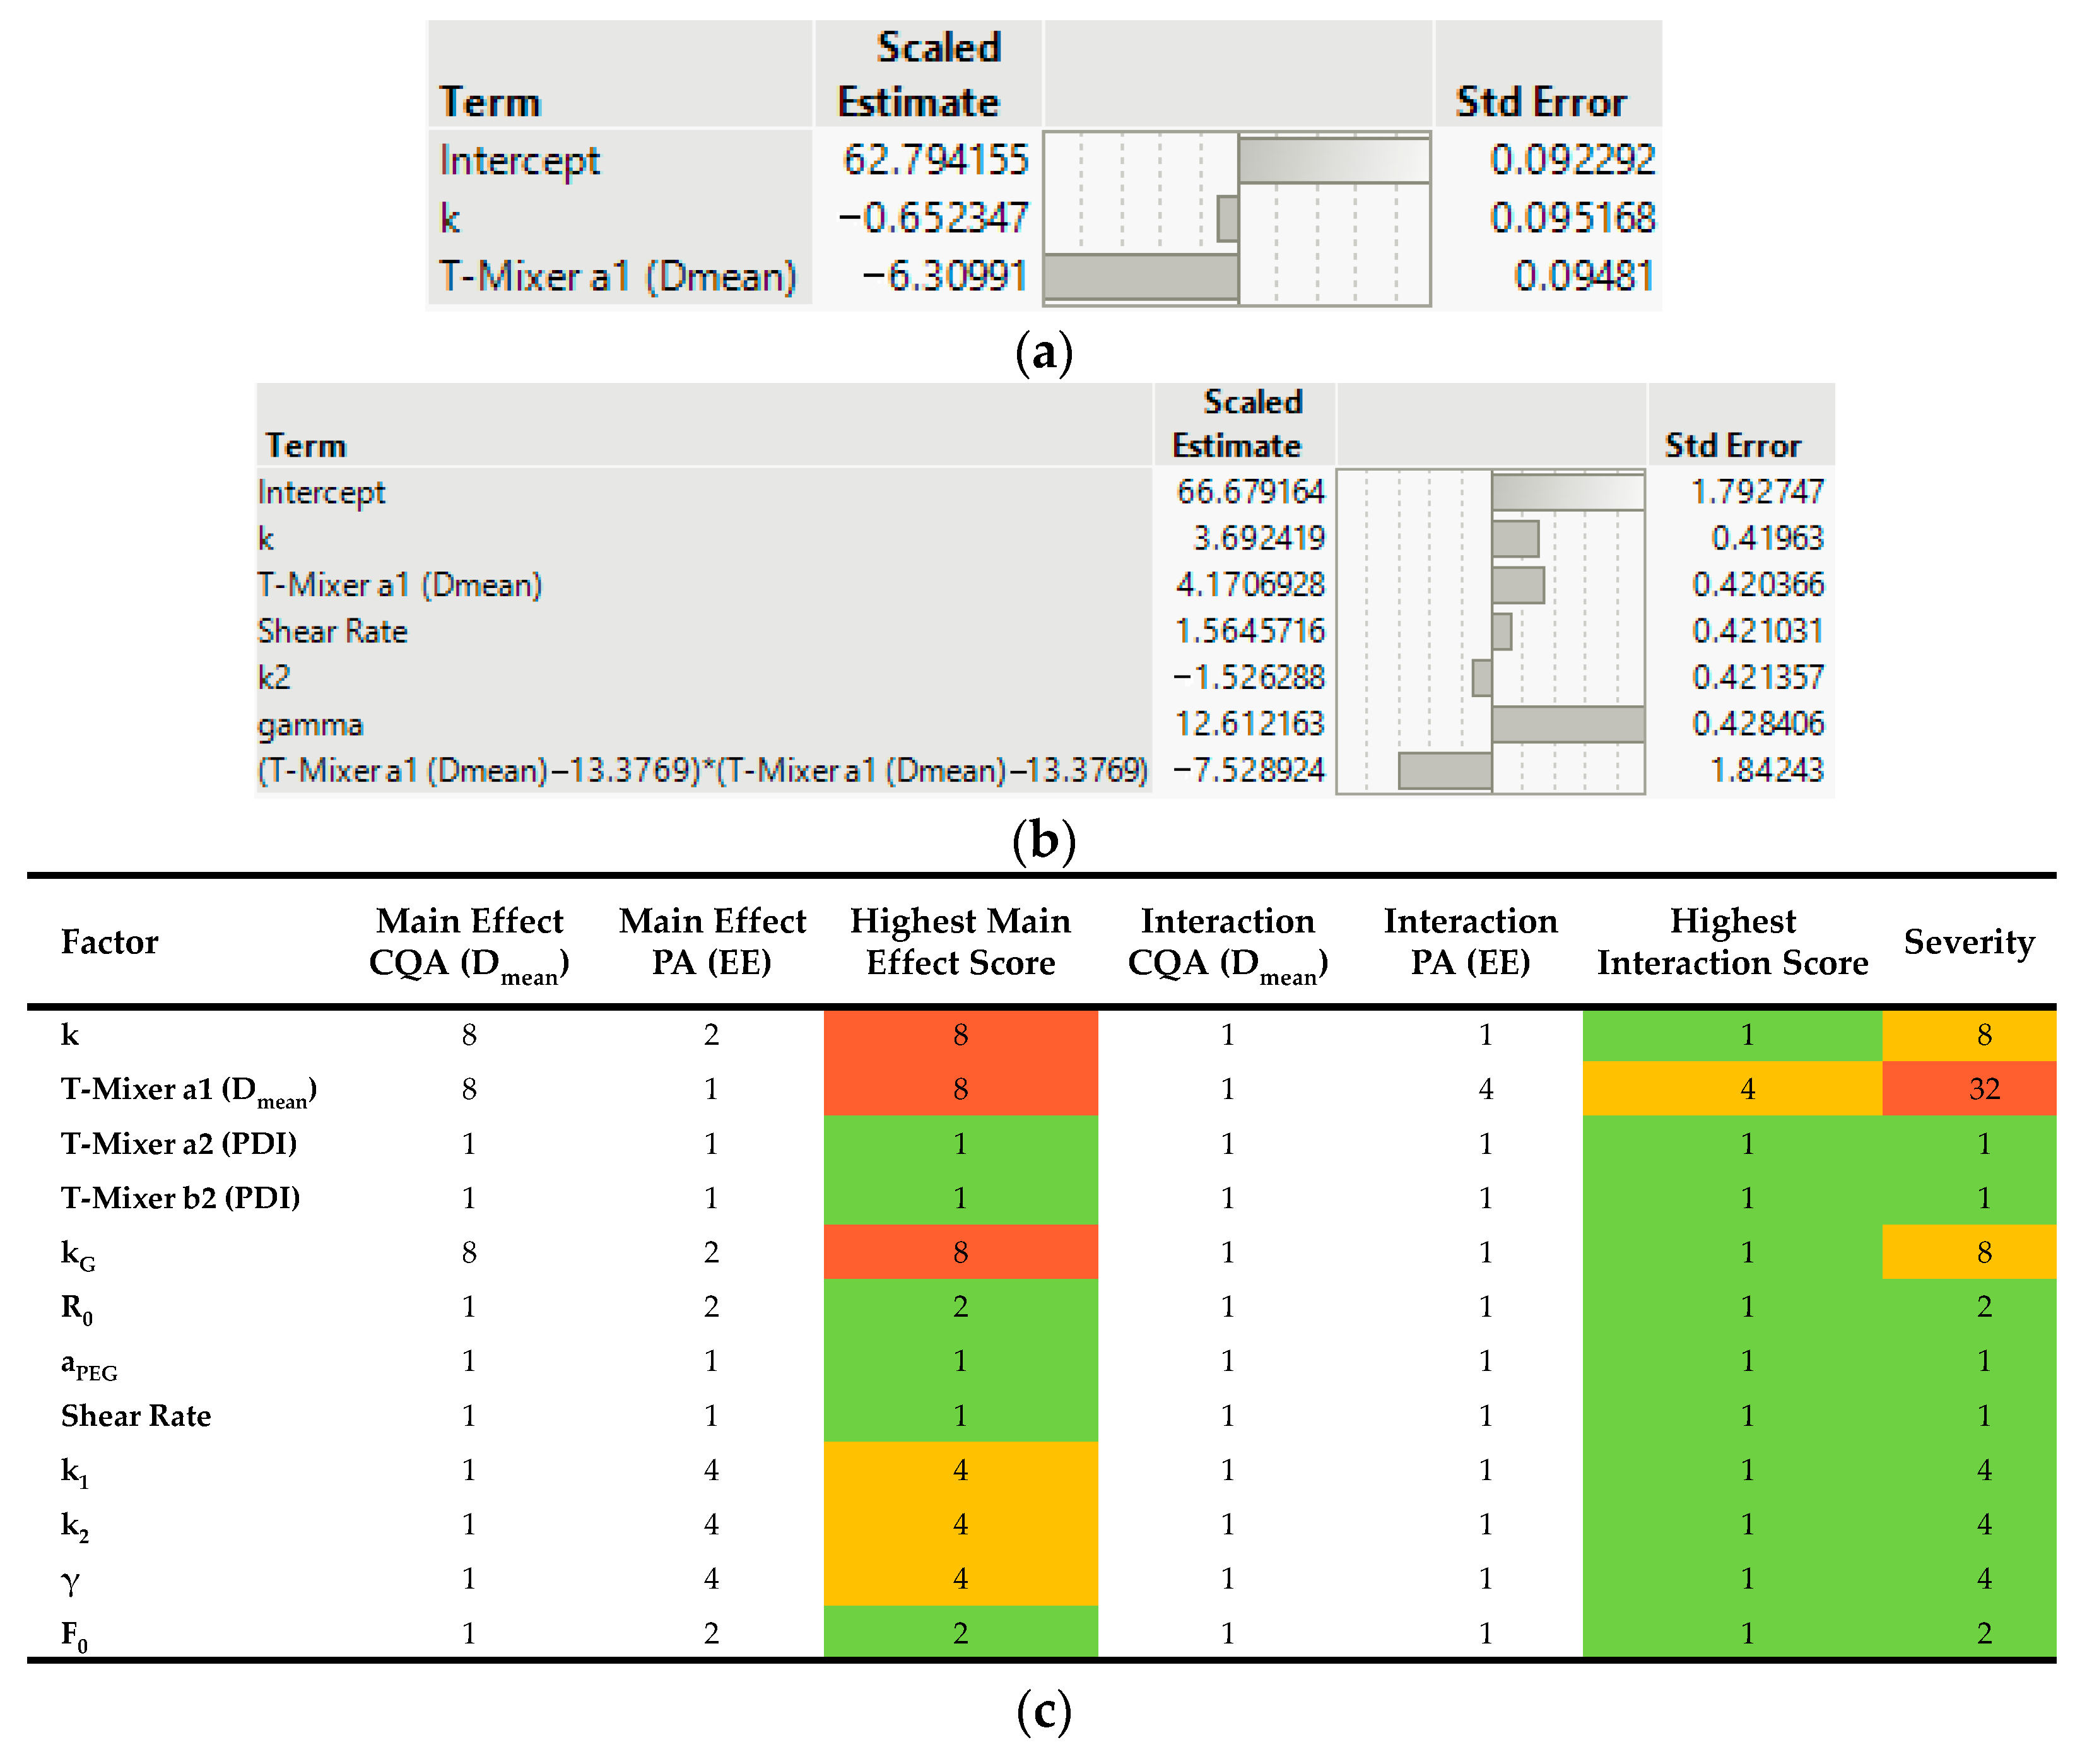
The results of the parameter studies, OFAT and MFAT, of the model parameters are shown in Figure 9. The reaction rate, the proportionality factor a1 for calculating the mean particle size of nucleation, and the growth rate were identified as having the greatest main effects on the mean particle size. The encapsulation efficiency is primarily influenced by the breakage parameters, which describe the effect of nucleic acid disintegration due to the shear influence in filtration. Based on the MFAT studies, the interactions of the parameters and their influence on the mean particle size (Figure 9a) and the encapsulation efficiency (Figure 9b) can be determined. The user-defined DoE, with D-optimality, was evaluated using JMP Pro 18 by gradually reducing the p-value. Consequently, all parameters shown are statistically significant. The quality of the regression can be rated as sufficiently good with R2 values of 0.98 (Dmean) and 0.96 (EE). The only significant interaction is the quadratic interaction of the proportionality factor a1, as all others are overlaid by the main effects. Since aPEG is included as a proportionality factor in the calculation of kPEG by dividing it by the PEG lipid concentration, it is not significant in the range investigated. Accordingly, as desired, the aggregation parameter depends only on the PEG lipid concentration (see parameter studies of the process parameters). Consequently, the most critical severity is at a1, and the reaction rate as well as growth rate also have increased severity.
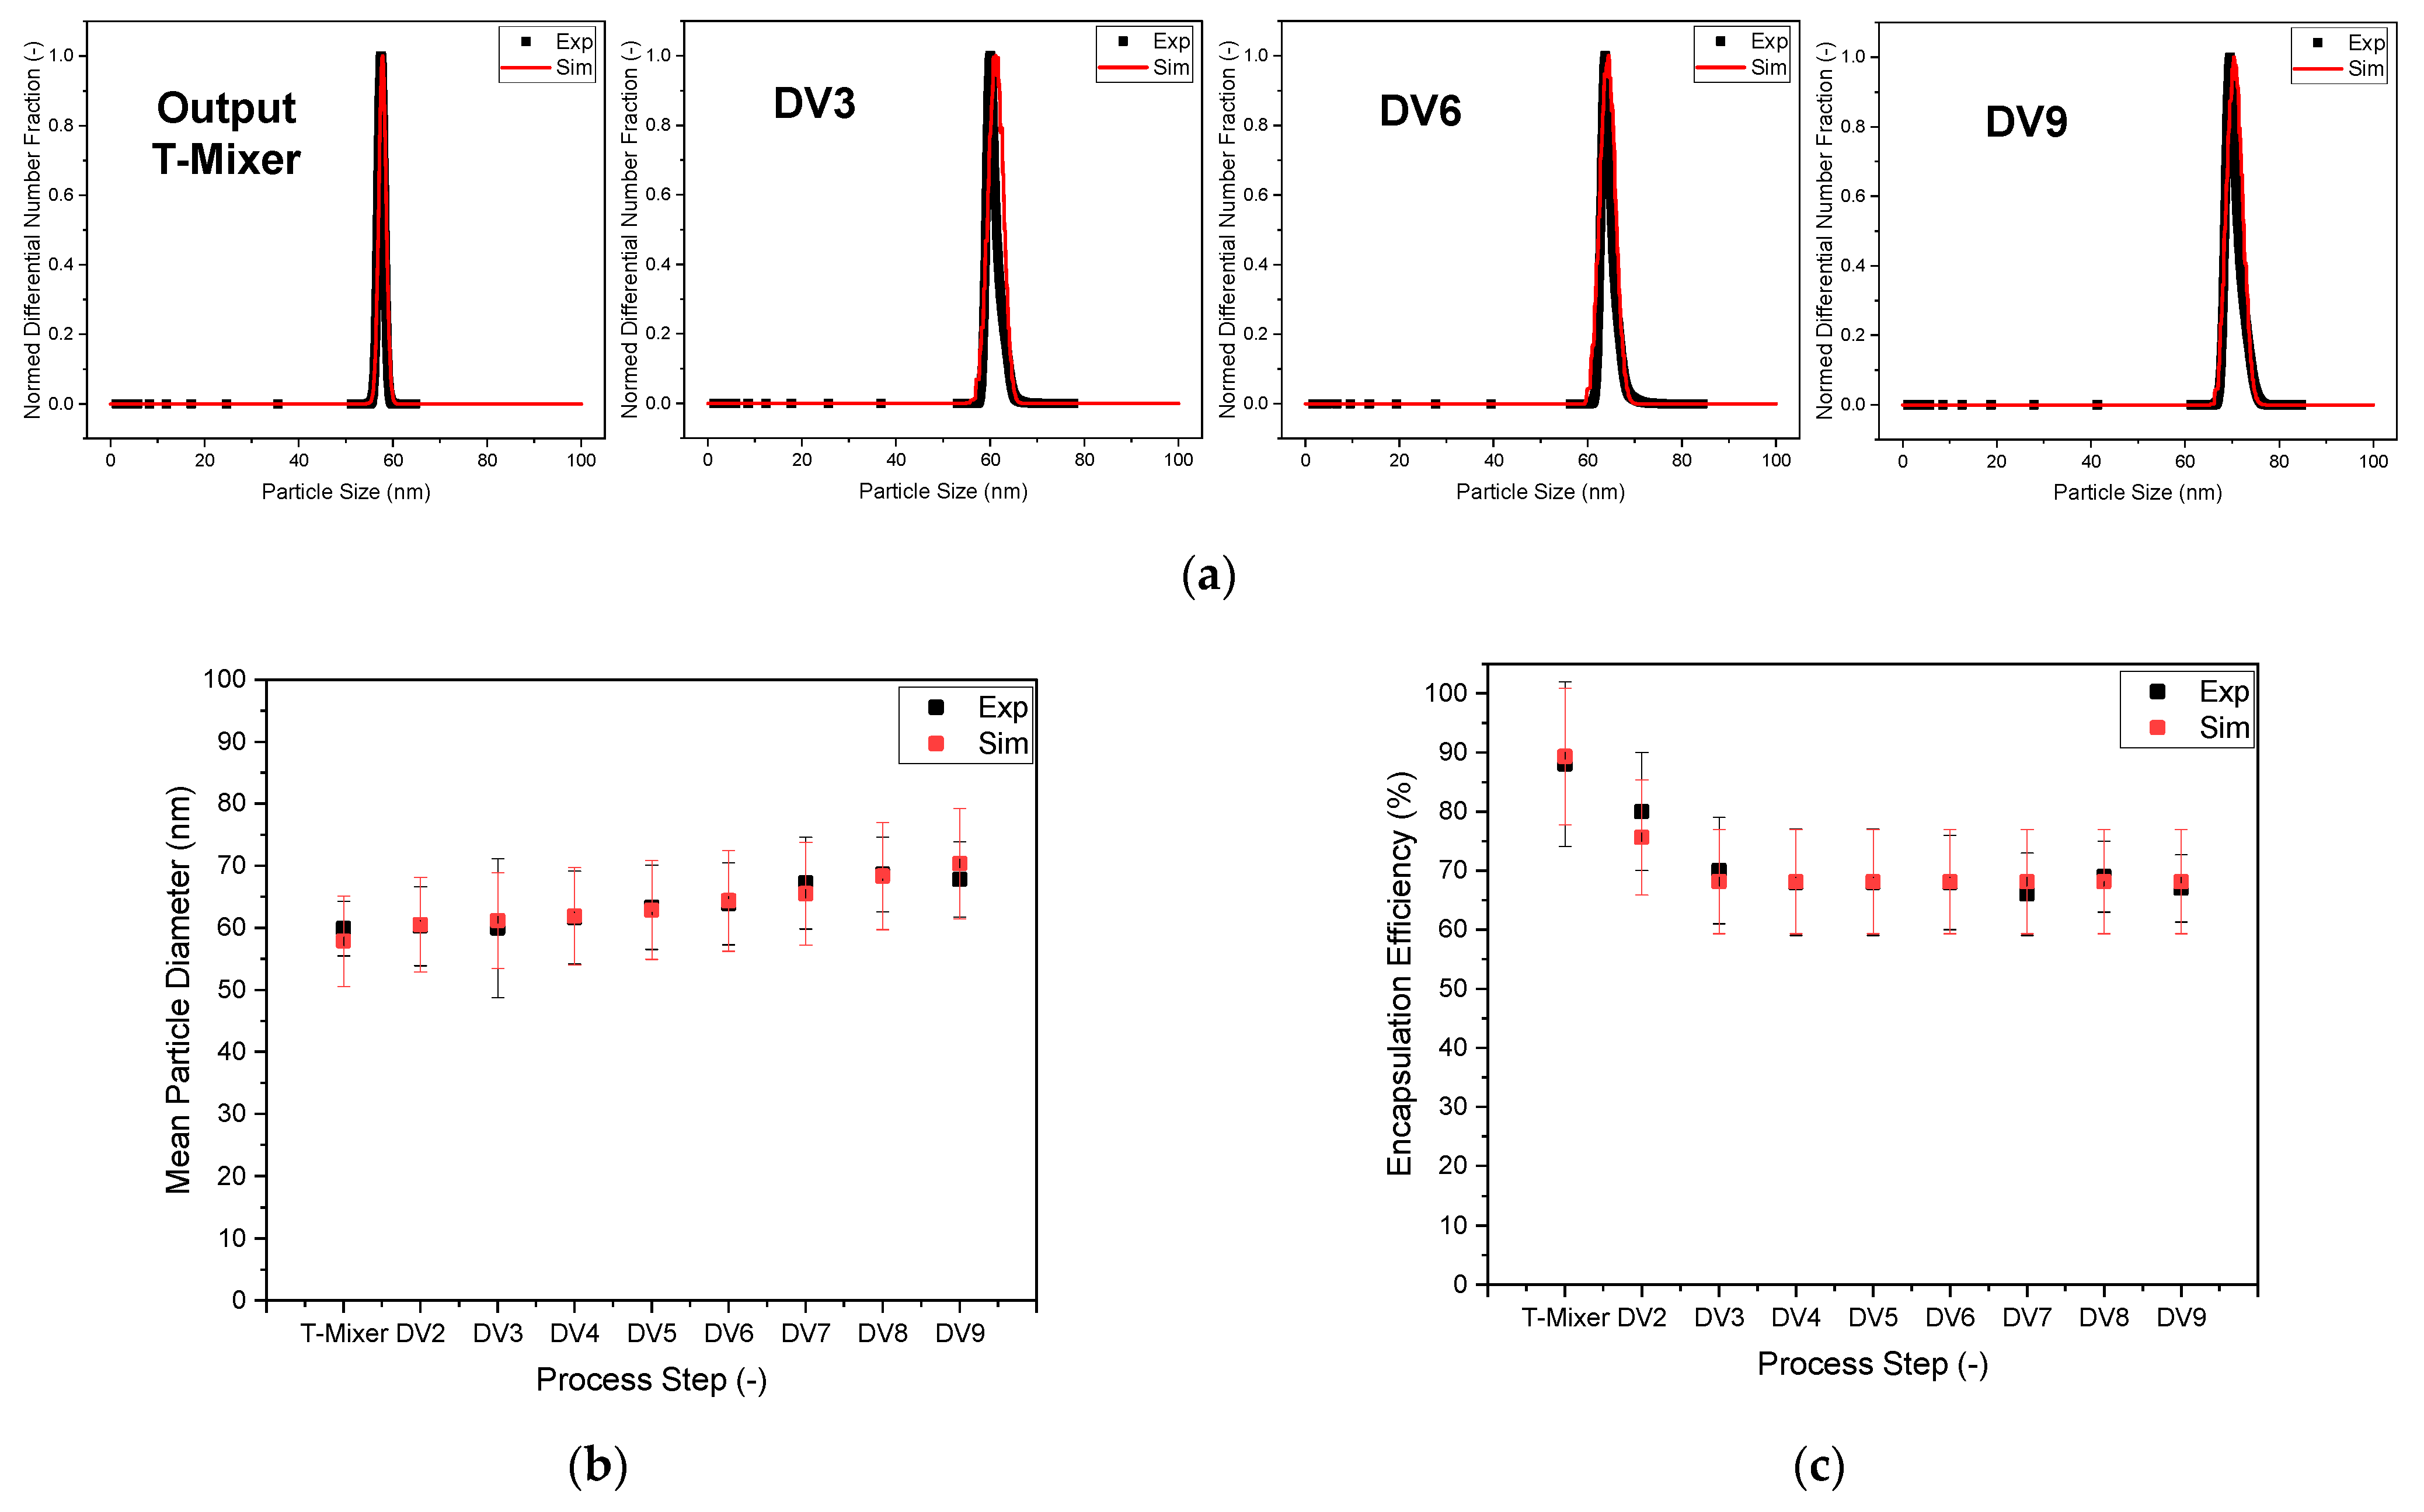
The assumed typical error of 5% in model parameter determination [133,135] is then used in the Monte Carlo simulations. With 30 simulations performed, in which the model parameter error was normally distributed and randomly combined, a t-test confidence interval of 95% with a confidence level of 99% is achieved. The particle size distributions generated by modeling the LNP formulation process using population balances correspond very well with the experimental data at different points within the process (after the T-mixer, and after the 3rd, 6th, and 9th diafiltration volumes; see Figure 10). This is also reflected in the results of the Monte Carlo simulations. The maximum deviation of the simulated mean particle size is 3.7%, and for the encapsulation efficiency 5.5%. When determining Dmean, the experimental error is 2.25–18.25% and the model error is 12.64%. For EE, the errors are 5.67–13.89% (experimental) and 7.89–11.57% (model). Consequently, in each case, the maximum model error for both target variables is lower than the maximum experimental error. This means that all requirements for the accuracy and precision of the model are met [133,134].
Process Parameters
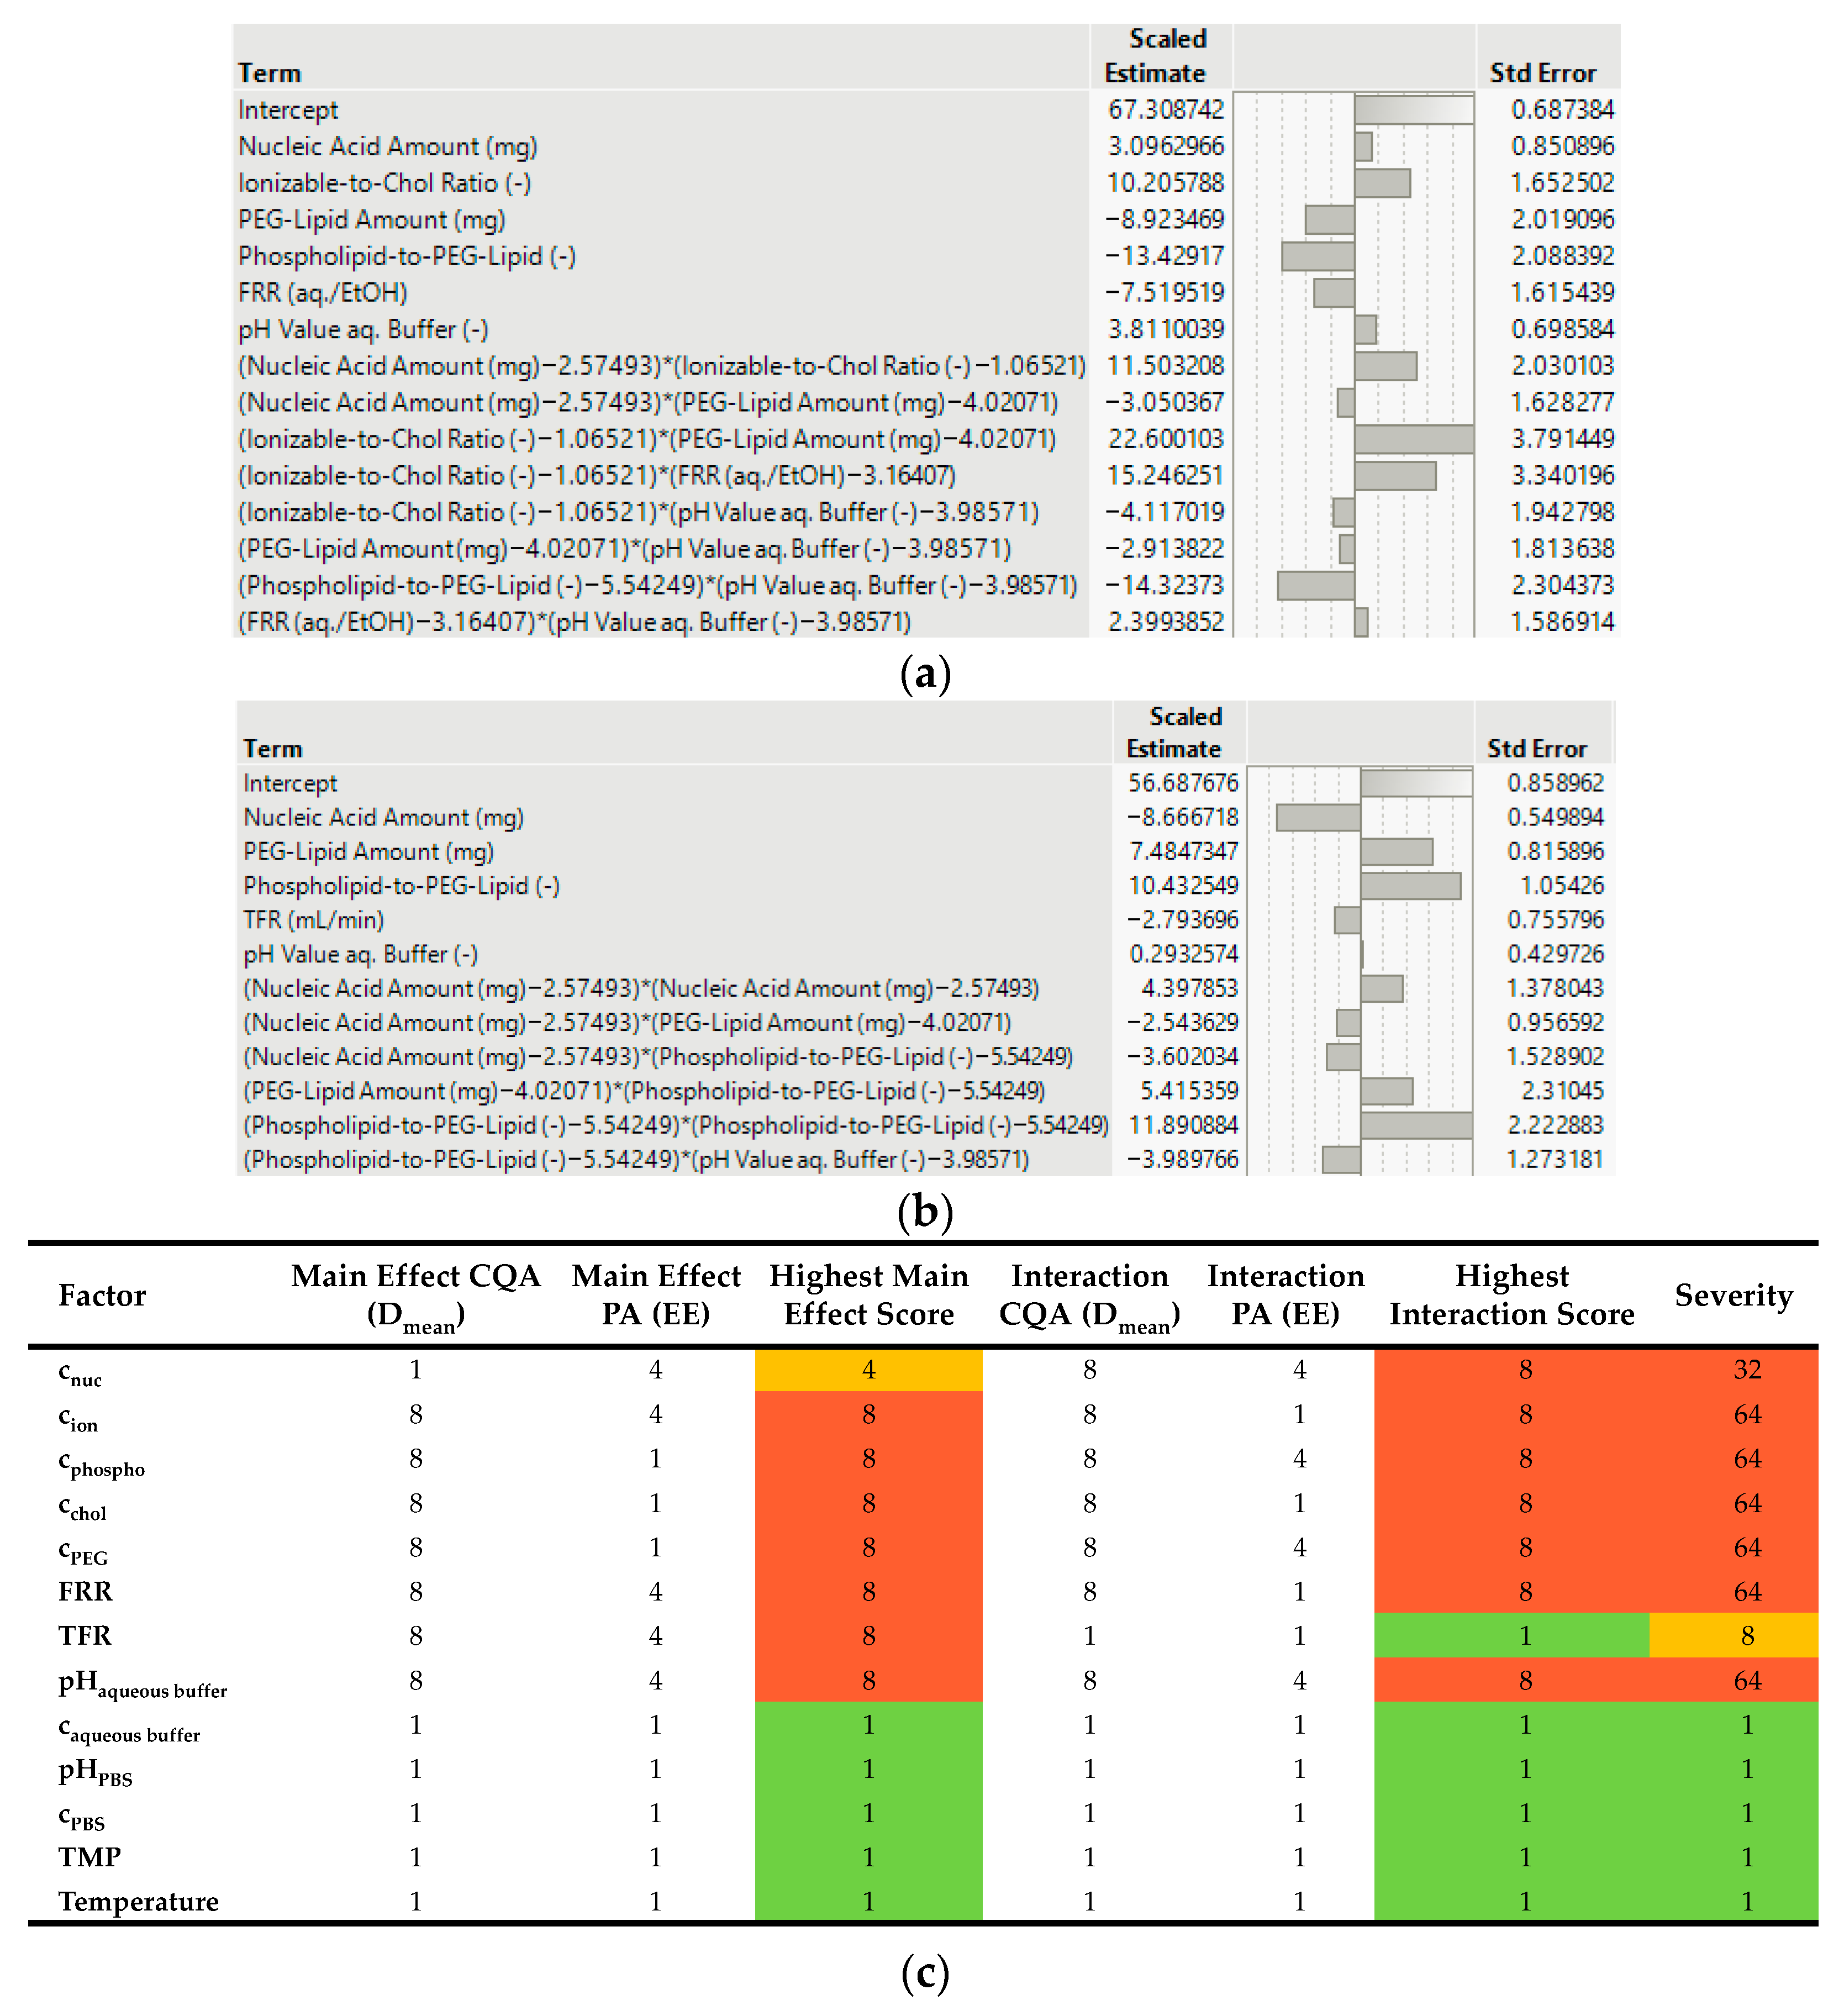
A similar approach was used to determine the influence of the process parameters on the target values and the results are shown in Figure 11. The error of the process parameters examined was selected as described earlier [61]. The greatest main effect, determined by OFAT simulations, on the average particle size is particularly influenced by the lipid concentrations used, the total flow rates, and the flow rate ratio, as well as the pH value of the aqueous buffer. The nucleic acid and lipid concentration of the ionizable lipid has the greatest effect on the encapsulation efficiency due to its large relative molar proportion in the LNPs of 0.46. In addition, the pH value of the aqueous buffer has a very strong influence on the EE because it is responsible for the ionization of the ionizable lipid and, consequently, for the lipids’ attachment to the nucleic acids.
The custom DoE, with I-optimality, can be used to determine not only the interactions but also the direction of the effects. To ensure comparability with the literature, the ratio of the amounts of ionizable lipid to cholesterol, the ratio of phospholipid to PEG lipid, and the N/P ratio are calculated. The interaction effects of the individual concentrations are derived based on the main effects of the parameters in the statistical analysis. For Dmean as the target variable, the effect direction agrees with the ratio of ionizable lipid to cholesterol, the amount of PEG lipid, the ratio of phospholipid to PEG lipid, and the flow rate ratio (FRR) of aqueous buffer to lipid solution with experimentally determined effects from the literature [60]. The total volume flow and the N/P ratio are not included in the effect summary in this study because, as in the literature, their effect is very small and, due to the stepwise reduction of the p-value in the analysis, they are not included in the statistical model. In addition, the order of effect strength differs from the literature, which is probably due to the different material systems used.
The largest effect interactions are comparable to the main effects for the critical quality attribute (CQA). Only the nucleic acid concentration, which is not significant on its own, has a strong influence on the average particle size when interacting with the other parameters. In addition, the interaction of the total flow rate is very low. Larger shifts in the effects can be observed for the PA, so that only the nucleic acid concentration and the pH value of the aqueous buffer have an unchanged strong influence on the encapsulation efficiency. All other strong main effects show little interaction. In contrast, the phospholipid and PEG lipid concentrations now show a strong interaction effect on the PA.

4. Technical Realization

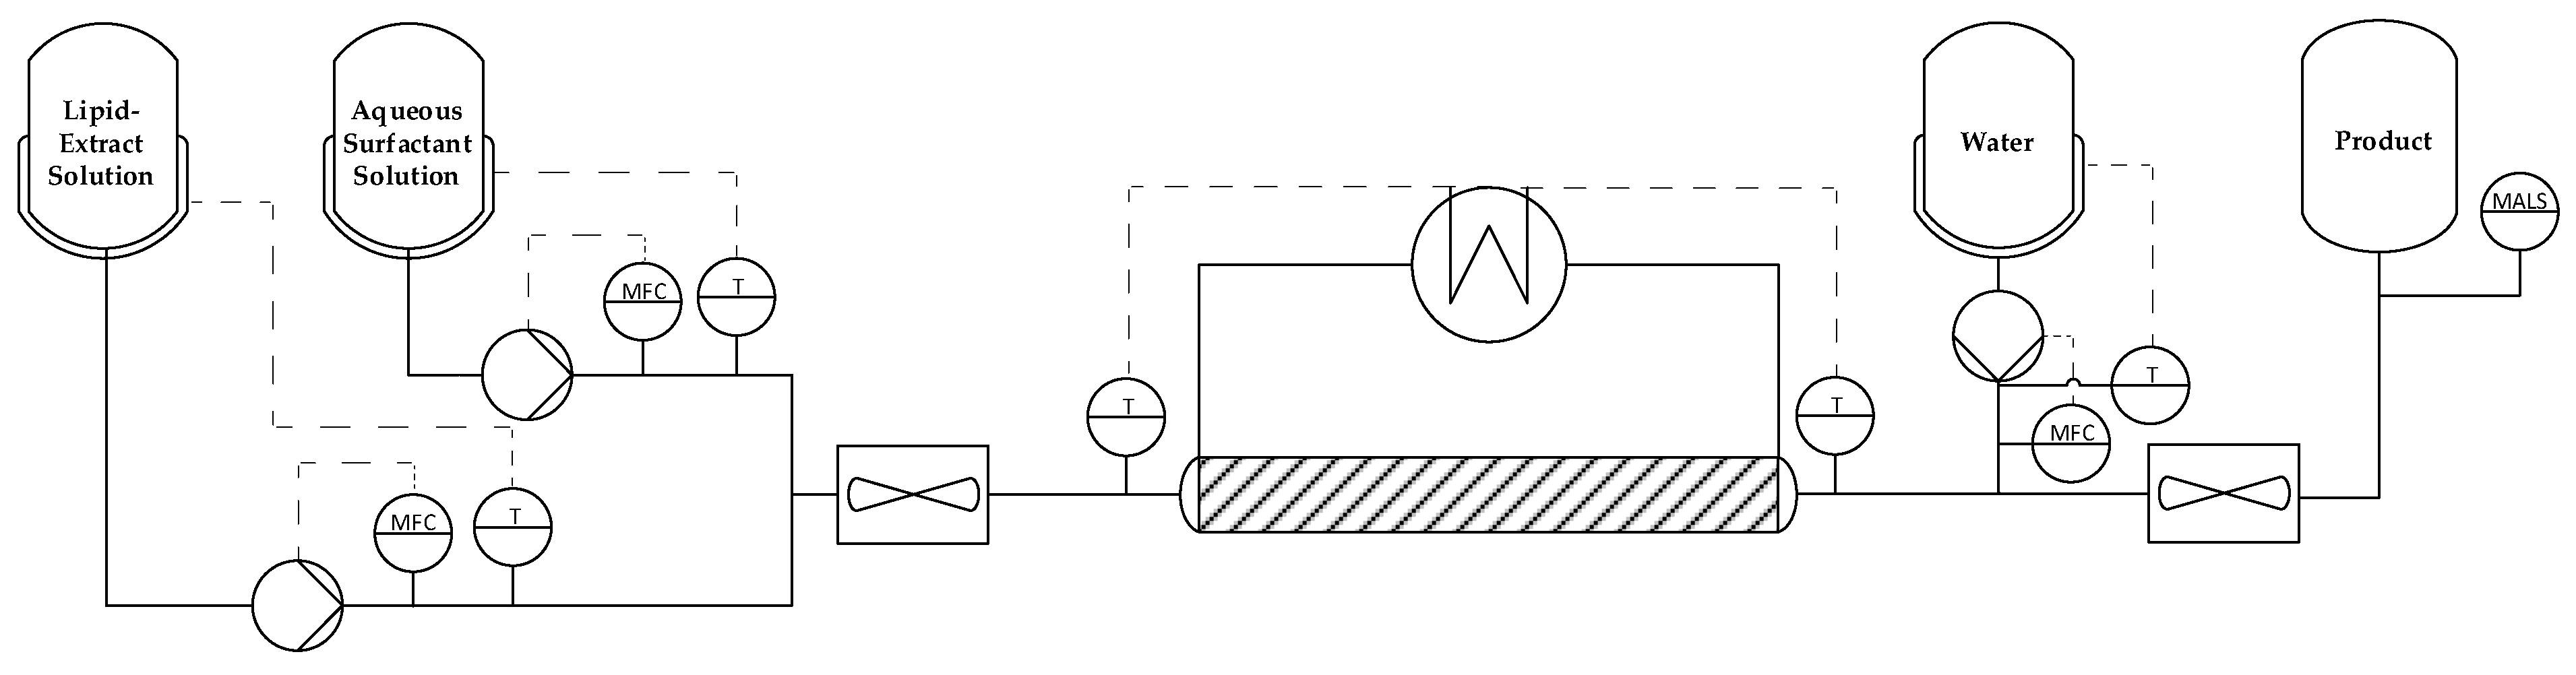
The flowsheet for the continuous encapsulation process is shown in Figure 12. The lipid–ethanol solution and the aqueous surfactant solution are prepared in heated tanks. Both solutions are heated to 70 °C and then pumped into the reactor in a ratio of 4.2:1 (lipid solution:aqueous surfactant solution) using a dynamic mixer. To prevent the lipid from solidifying, it is also heated to 70 °C. Since a homogeneous emulsion is required for the formulation of the extracts in LNPs, additional energy input, e.g., via ultrasound, is probably necessary. After the solution leaves the reactor, it is diluted five times with cold water at 4 °C to achieve rapid and efficient cooling of the emulsion, which leads to the formation of SLNPs. As shown above, the DAWN can be used inline to determine the particle size and distribution.
The starting point for the design of the plug flow reactor (PFR) is the annual production with a total process duration of 40 weeks for the respective component. Formulation should take place continuously over this entire period, considering both the encapsulation of the entire annual production and the encapsulation of 20% of the annual production. The resulting process parameters are shown in Table 1.

4.1. Encapsulation of Pesticides

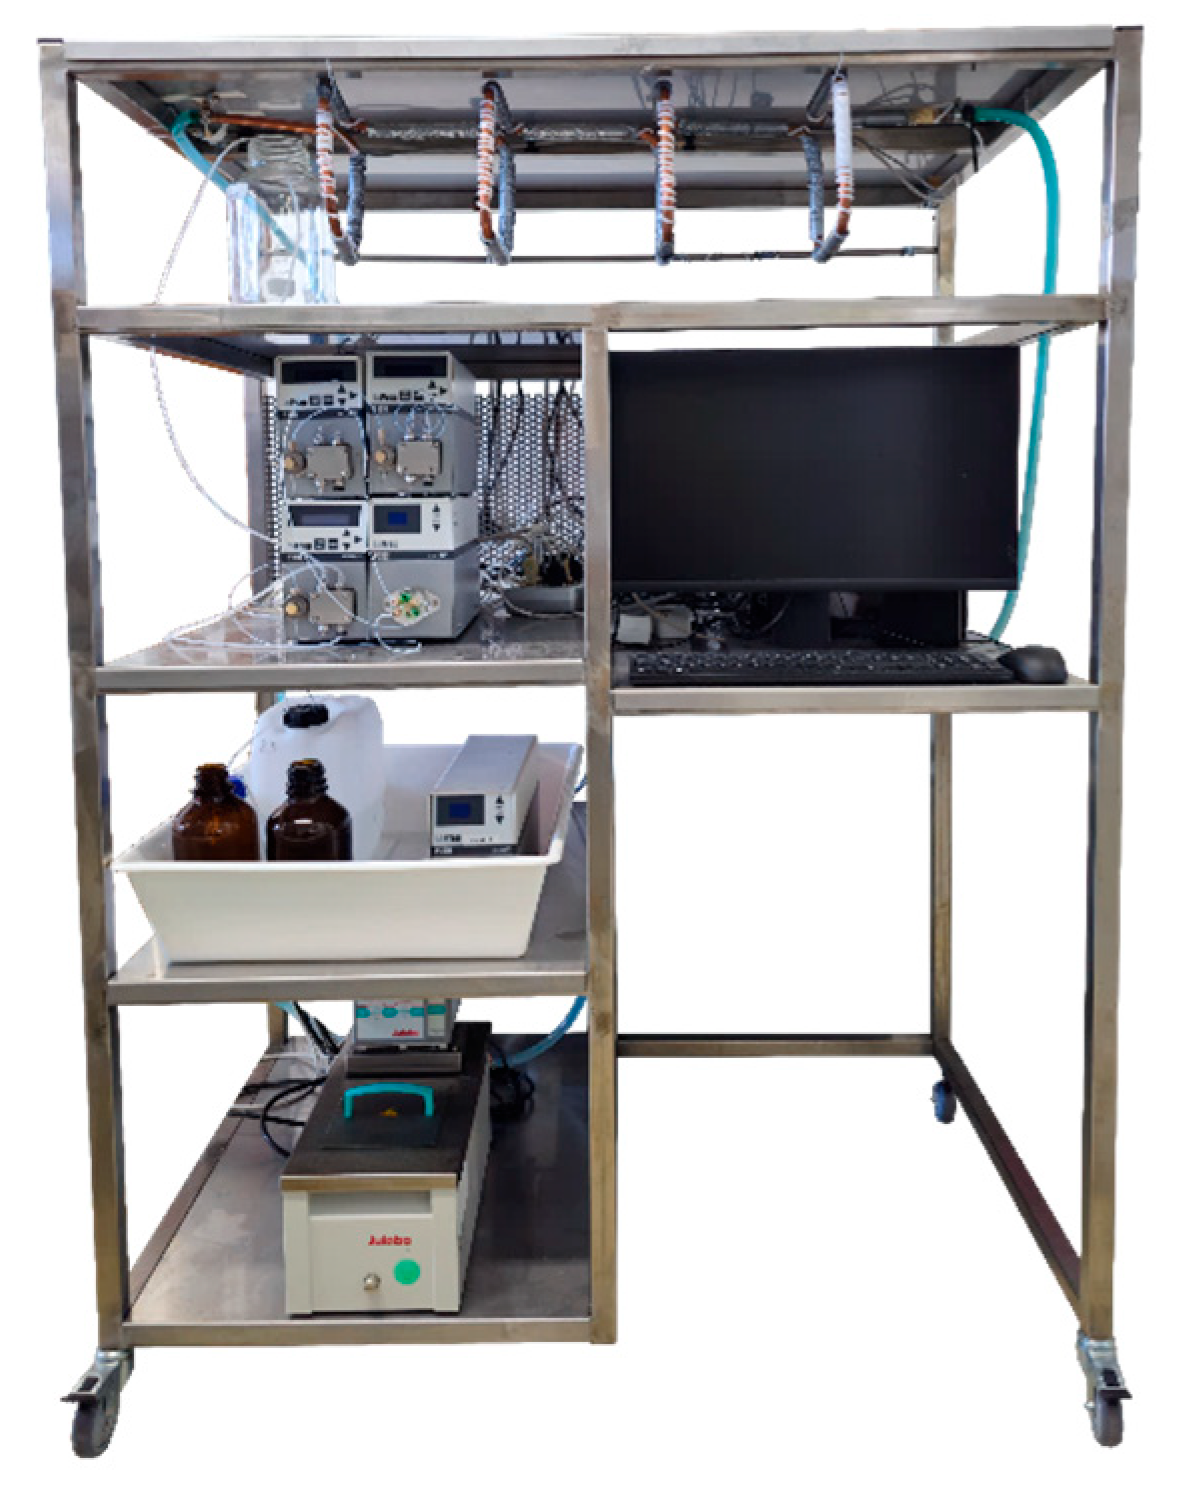
If the entire quantity of pesticides should be encapsulated, this corresponds to 1.6 tons of target component, resulting in a total volume of 320 m3 and a volume flow of 794 mL/min. For 20% of the annual production, the volume and flow rate are also reduced by 80%. The energy input should always take place for a duration of 16 min, that is equal to the residence time, which results in a required reactor volume of 12.7 L or 2.5 L. Due to the high volume/flow rate, the PTFE tubing with the largest inner diameter of 10 mm was selected from the standard range available. To encapsulate the total amount of pesticides, the reactor would have to be 162 m long. At 20%, this is reduced to 32 m. This is in the order of magnitude of the reactor used for continuous in vitro transcription [136,137], which is located on a stainless-steel platform to save space (see Figure 13).

4.2. Encapsulation of Fragrances

Since the production volume of irones is significantly lower, with 384 g in 40 weeks, the required flow rate of 0.06 mL/min (0.01 mL/min at 20% of the total volume) and the resulting reactor volume with iris butter of 0.92 mL and 0.19 mL, respectively, are also significantly smaller. With the smallest possible hose available, with an inner diameter of 0.25 mm, the required reactor length would be 18.8 m and 3.8 m, respectively. Due to the low flow rates, a very accurate pump is required that can reliably deliver these low flow rates consistently. It would, therefore, be worth considering running the process semi-continuously by collecting several batches and then carrying out the encapsulation over a shorter period of time.

4.3. Use of Plant-Based Additives in the Encapsulation of Nucleic Acids

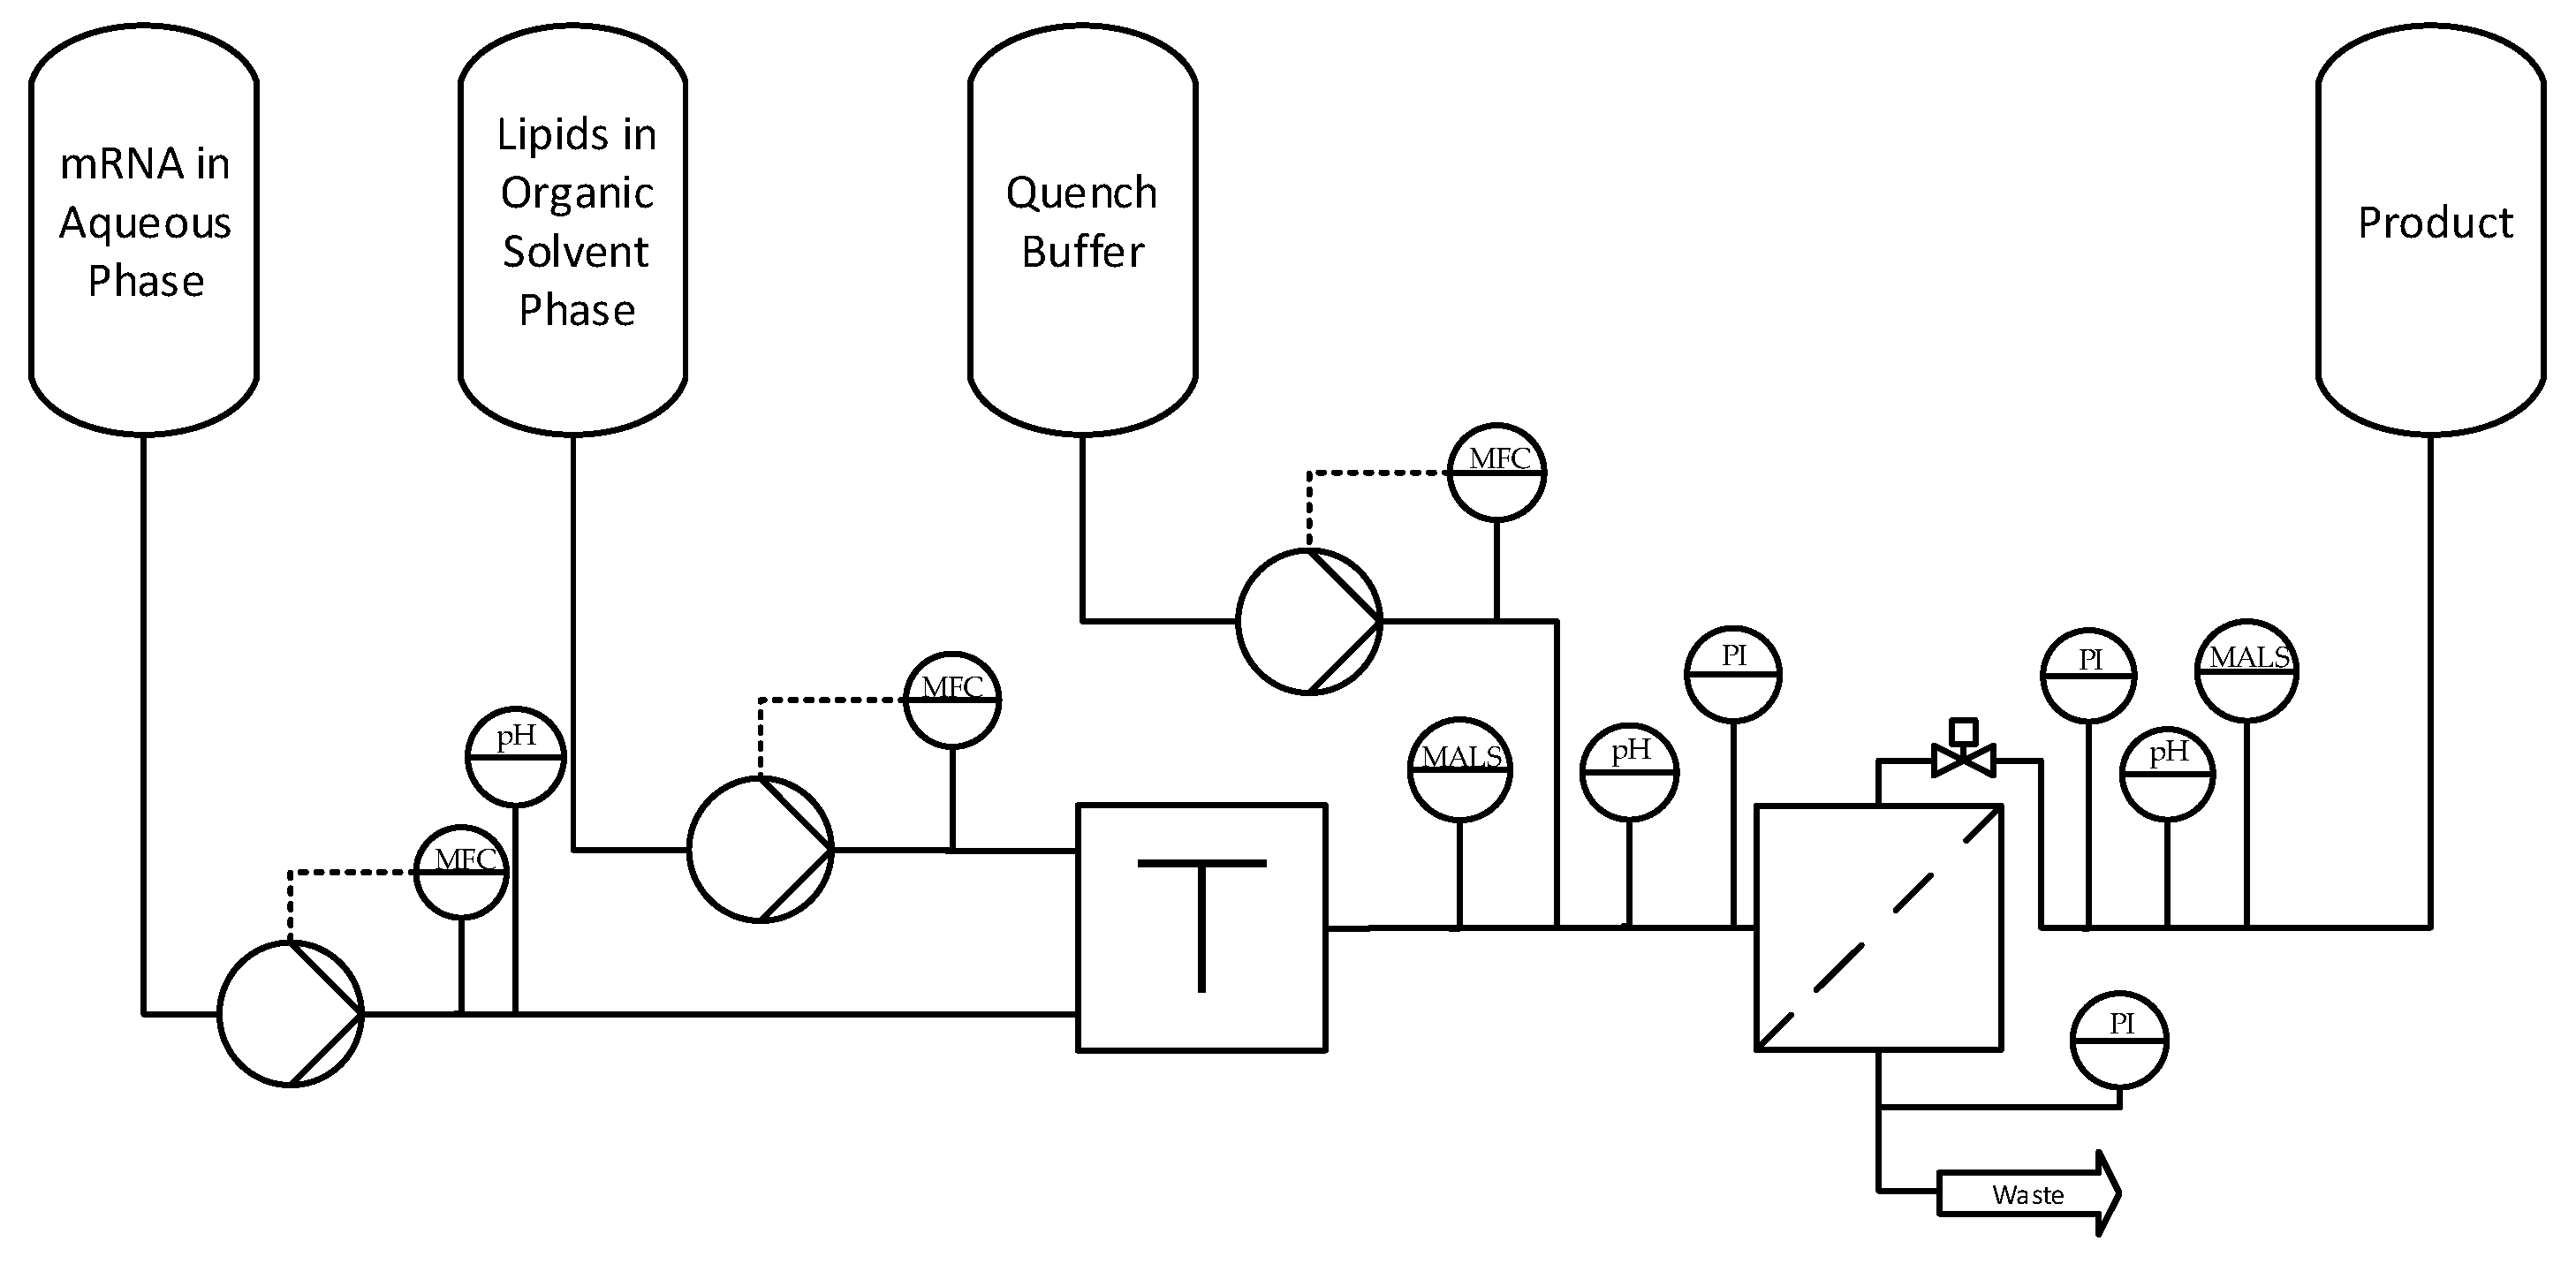
Figure 14 illustrates the flowsheet of the LNP formulation, which consists of two main steps: mixing within a T-mixer and subsequent quenching of the reaction through diafiltration. In the T-mixer, the aqueous nucleic-acid-containing phase is rapidly mixed with the organic lipid-containing solvent phase at a volumetric ratio of 1:3. To achieve a production output of 10 million doses within three days, the total volumetric flow rate must reach 694 mL/min. This corresponds to a nucleic acid solution flow of 521 mL/min in acidic buffer and a lipid–ethanol phase flow of 174 mL/min according to the specified mixing ratio. Each of the two solutions is supplied to the mixer via separate pumps, with volumetric flow rates controlled by individual mass flow controllers (MFCs). The aqueous buffer is maintained at a pH of 4, which leads to an approximate pH of 5.5 after mixing, below the pKa of the ionizable lipid [52], causing it to ionize and thus become positively charged. Consequently, monitoring of both the aqueous buffer pH and the pH at the mixer outlet is essential to ensure proper ionization of the ionizable lipid. In the subsequent step, the reaction is quenched by performing diafiltration using nine diafiltration volumes of PBS at a pH value of 7.4. The primary objective of this diafiltration is to raise the pH, thereby neutralizing the lipid and stopping the reaction to allow formation of LNPs with defined size characteristics. Additionally, diafiltration serves to remove the residual organic solvent phase. To achieve this, quench buffer is added via a pump with its flow rate regulated by an MFC to guarantee sufficient diafiltration volumes for effective pH adjustment and buffer exchange. Pressure sensors are installed along the feed, permeate, and retentate lines to maintain optimal transmembrane pressure throughout the process. During diafiltration, the continuous shear forces of the pump on the retentate side during the nine diafiltration volumes can sometimes cause particle destruction [89]. To prevent this and enable continuous formulation, diafiltration is performed using single-pass tangential flow filtration (SPTFF). Product properties such as LNP concentration, size, and size distribution are continuously determined during the process using MALS/DLS [61].
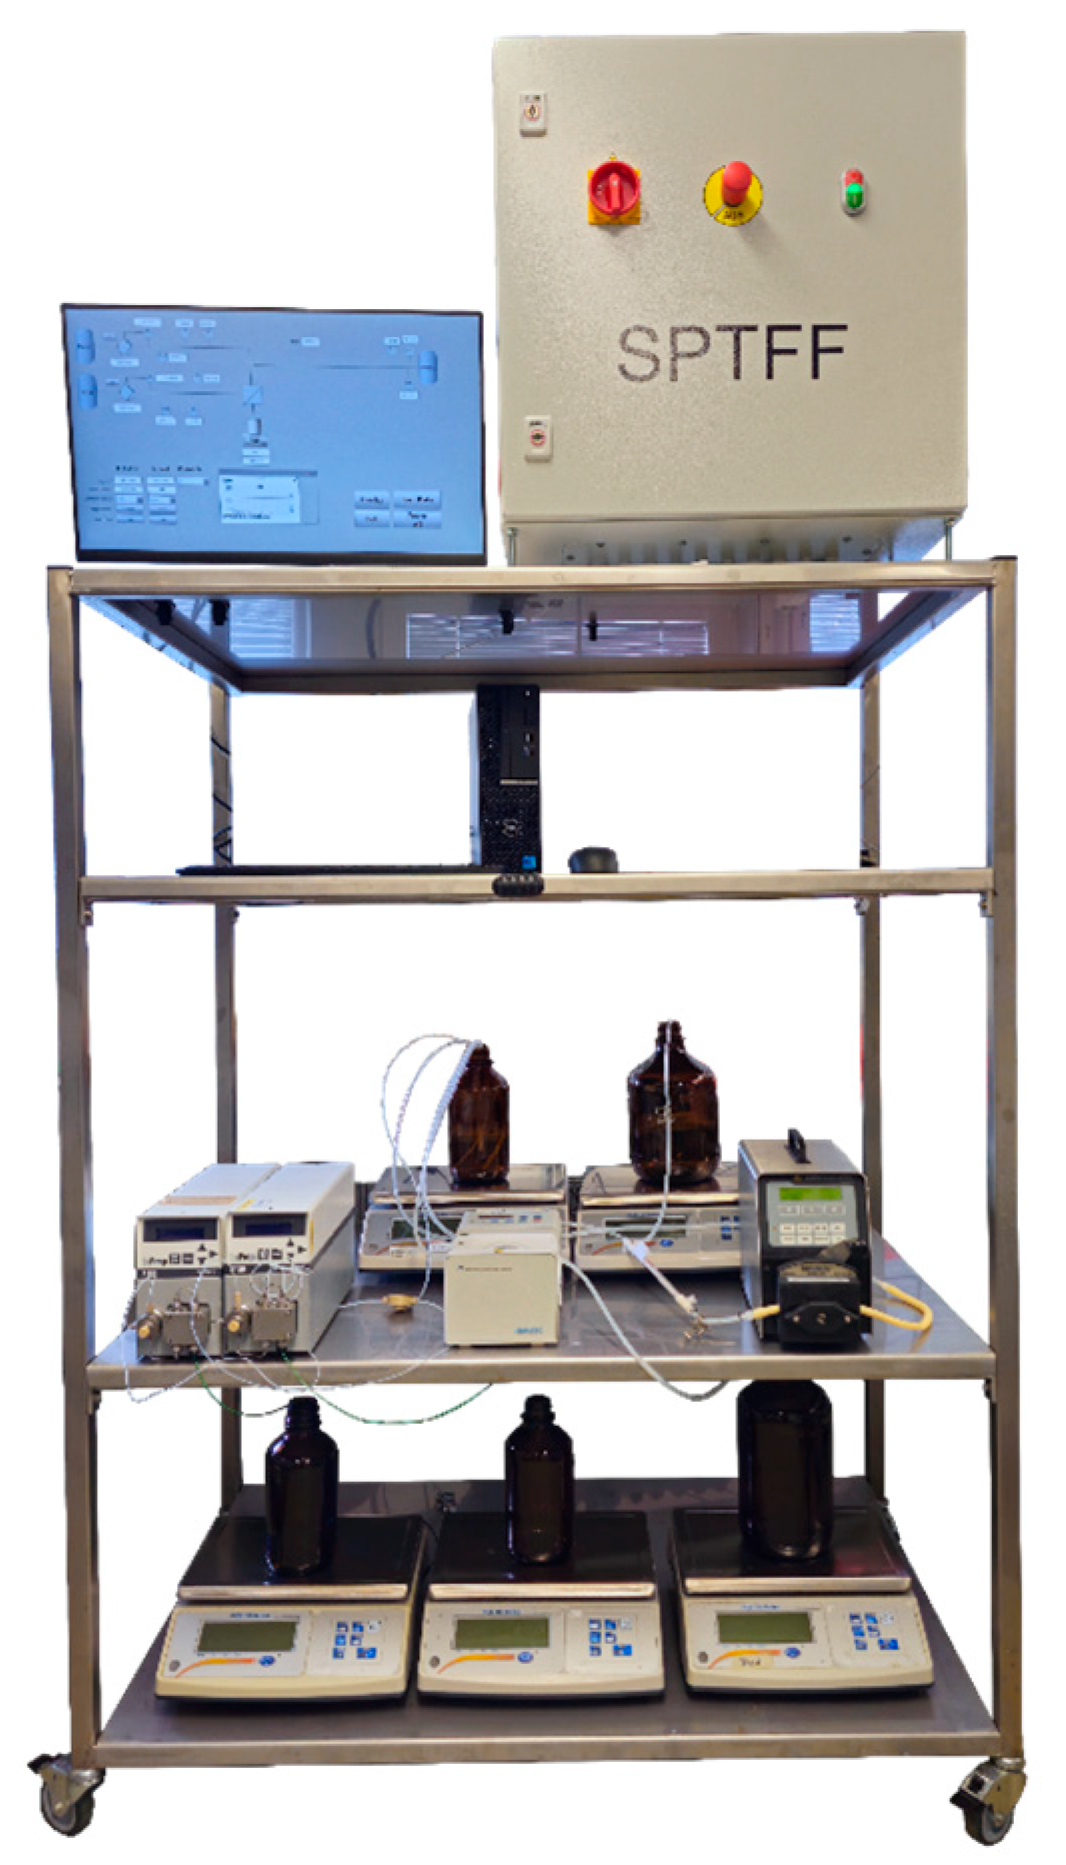
Like the PFR, the plant is mounted on a stainless-steel vehicle (see Figure 15) and thus takes up significantly less space than a batch reactor with a capacity of approximately 1.5 m3 connected to an SPTFF, which requires a buffer and waste tank with a capacity of approximately 13 m3 for the batch production of 10 million doses.

5. Discussion

5.1. Encapsulation of Pesticides

Phytoextracts offer several advantages as plant protection agents, cosmetics, and pharmaceutical ingredients due to their biological and environmental compatibility [1,2,3,4]. However, their poor water solubility and stability limit practical applications. Lipid nanoparticles provide a suitable encapsulation approach to address these issues. In this study, quercetin as a typical pesticide and irones from iris butter as cosmetic fragrance components were encapsulated via homogenization and ultrasound treatment. The observed encapsulation efficiency of 59.4 ± 9.2% of quercetin exceeds literature values using comparable methods (46.2 ± 2.2%) [3].
Particle size analysis comparing batch DLS (Malvern Zetasizer) and inline MALS/DLS (Wyatt DAWN) revealed bimodal size distributions. The larger peak corresponds to free quercetin crystals and solidified lipid, consistent with prior studies demonstrating pH- and temperature-dependent crystal formation in aqueous systems [112]. The main size fractions of quercetin SLNPs (approximately 275 nm in batch and approximately 233 nm inline) align well with literature data [3]. Due to the observed bimodal particle size distributions, conventional cumulant-based DLS evaluation methods are limited and must be interpreted with caution [121]. While inline MALS/DLS offers advanced real-time monitoring capabilities, its application to multimodal distributions requires rigorous calibration and signal validation to ensure reliable process control. These results confirm that MALS/DLS is applicable for real-time particle size and PDI monitoring during continuous manufacturing, supporting real-time release testing (RTRT) in the quality-by-design (QbD) framework.
A technical realization concept for continuous encapsulation based on the previously published scalable machine [136] was presented, with reactor volumes adapted for annual scaling (12.7 L or 2.5 L for 20% capacity). The compact design, integrating process analytical technology and automated control (e.g., Siemens S7), enables space-saving, scalable, and autonomous production.

5.2. Encapsulation of Fragrances

The cosmetic industry widely uses phytoextracts for their beneficial properties [1,2,5,12]. However, stabilization is critical to overcome poor water solubility. SLNPs not only increase solubility but contribute to skin hydration [3,20,21,22]. Irones from iris butter were successfully encapsulated by homogenization and ultrasound methods, achieving an EE of 70.2 ± 3.2% despite higher initial target component ratios.
Particle size distribution again showed bimodal behavior, with the main SLNP populations averaging 150 nm (DAWN) and 190 nm (Zetasizer), indicating comparable quality to pesticide SLNPs [3,18]. For continuous processing at relevant scales, the small reactor volumes (<1 mL) require high-precision pumps. Semi-continuous operation could offer a pragmatic solution to maintain advantages of continuous encapsulation while ensuring process robustness and reliable inline monitoring. It should be noted that inline analysis of particles with complex, multimodal size distributions presents challenges that necessitate careful calibration and data interpretation to avoid misclassification and ensure accurate process feedback.

5.3. Use of Plant-Based Additives in the Encapsulation of Nucleic Acids

mRNA therapeutics, exemplified by the ComirnatyTM vaccine, rely on LNPs to protect mRNA from degradation and enable efficient delivery [45,46,47]. Cholesterol, as the conventional helper lipid, is of animal origin and can cause undesirable immune reactions [52,53,54,55]. Phytosterols such as β-sitosterol are promising alternatives demonstrating comparable in vivo efficacy [54,55,56,57,58].
Batch LNPs formulated with β-sitosterol exhibited a mean particle diameter of 71.8 ± 7.2 nm, slightly smaller than cholesterol-based particles but within regulatory particle size limits (<100–200 nm) and similar to continuous T-Mixer-based LNP production and commercial vaccines [89,108,126,127,128,129,130,131]. While the phytosterol formulations showed broader size distributions (PDI 0.11 ± 0.04) compared to cholesterol LNPs (PDI 0.05 ± 0.01), they remained well within acceptance criteria. Continuous production is expected to further reduce particle size [52,89,132,138]. Encapsulation efficiencies exceeded 90%, meeting regulatory thresholds and published ranges of the ComirnatyTM vaccine [108,125,127,129].
Continuous operation using turbulent mixing in a T-mixer, with a Reynolds number of around 11,000, ensures robust particle size control, minimizing oversized particles. Inline MALS/DLS confirm quality in real-time, vital for continuous quality assurance [52,89,132,138].
A population balance model was developed to simulate nucleic acid encapsulation, particle size distribution evolution, and stabilization of the particles during diafiltration. Model parameters were selected based on experimental data and literature, with validation via sensitivity studies and Monte Carlo simulations confirming prediction accuracies within experimental error margins for mean particle diameter and encapsulation efficiency, consistent with the third milestone of the model validation workflow and QbD principles [133,134].
Key process parameters influencing critical quality attributes and process attributes were identified, including nucleic acid and lipid concentrations, aqueous buffer pH, and flow rates, guiding control strategy development [61]. The model supports process optimization, monitoring, and transition toward a digital twin capable of predictive process control to avoid out-of-specification (OOS) runs and lays the basis for autonomous operation.
Due to the fast mixing and reaction kinetics in the T-Mixer, which occur within milliseconds, the developed population balance model cannot be employed as a real-time digital twin for direct control of the T-Mixer. Nevertheless, the validated model offers significant benefits for process development and operation. Furthermore, the model incorporates assumptions regarding nucleation and breakage mechanisms, which, while sufficient for the current system, may require adjustment when applied to other material systems or process conditions, indicating paths for future refinement.
Analytical knowledge from preceding process steps enables preemptive adjustment of T-mixer settings before process start, thereby enhancing process robustness. Furthermore, the model’s high predictive accuracy and precision, confirmed through comprehensive validation techniques, including Monte Carlo simulations, allows extensive in silico optimization and sensitivity analysis. This reduces experimental efforts and accelerates development timelines while ensuring compliance with quality-by-design principles. Thus, the model functions as a valuable decision support and monitoring tool in an autonomous continuous manufacturing environment.
The model is particularly powerful in describing and controlling the diafiltration step. This step involves evolution of particle size distribution and encapsulation efficiency over longer residence times, enabling real-time, model-based monitoring and advanced process control. As a digital twin of the diafiltration step, the model facilitates dynamic prediction and optimization of process parameters, such as shear stress, flow rates, and buffer exchange volumes. These capabilities help to minimize particle breakage and maintain desired quality attributes. Consequently, model-supported control of diafiltration enables a fully autonomous and robust continuous process that reduces out-of-specification runs and ensures consistent product quality.

6. Conclusions

This study demonstrates the successful encapsulation of plant-derived active compounds and nucleic acids into lipid nanoparticles, maintaining critical quality attributes, such as particle size (<100–200 nm) and high encapsulation efficiency (>80%), in line with regulatory requirements for mRNA vaccines [125]. The application of β-sitosterol as a plant-based helper lipid achieved comparable results to commercial formulations, such as the ComirnatyTM mRNA vaccine [108,126,127,128,129,130,131].
By implementing continuous processing and advanced inline monitoring with MALS/DLS, the process footprint and costs of goods can be significantly decreased, while productivity can be further increased by 20% and process time reduced by a factor of two [139,140]. Importantly, the newly developed population balance process model, rigorously validated against experimental data, enables its use as a digital twin to support autonomous, model-based process control and optimization [61,133,134]. This continuous nucleic acid encapsulation process combined with the previously developed, fully continuous mRNA manufacturing platform capable of producing up to ten million doses in three days represents [61,89,136,137,141] industrial readiness under a rigorous quality-by-design framework. While formal regulatory approval and additional validations are ongoing, the presented data demonstrate a mature scalable production process aligned with practical manufacturing requirements.
These advancements provide a scalable and sustainable framework for lipid nanoparticle manufacturing applicable to agriculture, cosmetics, and pharmaceutical industries, representing an important step toward fully digitalized and autonomous production processes.

Author Contributions

Conceptualization, J.S.; software, process, analytics, and experiments, A.H. and A.S.; plant extract analytics, L.K.; population balance modeling, A.H. and A.S.; writing—original draft preparation, A.H., A.S., and J.S.; writing—review and editing, A.H., L.K., A.S., and J.S.; supervision, J.S.; project administration, J.S. All authors have read and agreed to the published version of the manuscript.

Funding

The authors want to gratefully acknowledge the Federal Ministry for Economic Affairs and Climate Action (BMWK, 03EN2067D), especially Michael Gahr (Projektträger FZ Jülich), for funding their scientific work.

Data Availability Statement

The original contributions presented in this study are included in the article. Further inquiries can be directed to the corresponding author.

Acknowledgments

The authors would like to thank the whole institute team and Michael Gahr from Projektträger FZ Jülich, and especially Annett Wollmann and Alfred Weber from the Institute of Particle Technology at Clausthal University of Technology, for the support and fruitful discussions on particle distribution analytics.

Conflicts of Interest

The authors declare no conflicts of interest.

References

  1. Yang, S.; Liu, L.; Han, J.; Tang, Y. Encapsulating Plant Ingredients for Dermocosmetic Application: An Updated Review of Delivery Systems and Characterization Techniques. Int. J. Cosmet. Sci. 2019, 42, 16–28. [Google Scholar] [CrossRef]
  2. Zillich, O.V.; Schweiggert-Weisz, U.; Eisner, P.; Kerscher, M. Polyphenols as Active Ingredients for Cosmetic Products. Int. J. Cosmet. Sci. 2015, 37, 455–464. [Google Scholar] [CrossRef]
  3. Han, S.B.; Kwon, S.S.; Jeong, Y.M.; Yu, E.R.; Park, S.N. Physical Characterization and in Vitro Skin Permeation of Solid Lipid Nanoparticles for Transdermal Delivery of Quercetin. Int. J. Cosmet. Sci. 2014, 36, 588–597. [Google Scholar] [CrossRef]
  4. Wang, J.; Hao, K.; Yu, F.; Shen, L.; Wang, F.; Yang, J.; Su, C. Field Application of Nanoliposomes Delivered Quercetin by Inhibiting Specific Hsp70 Gene Expression against Plant Virus Disease. J. Nanobiotechnol. 2022, 20, 16. [Google Scholar] [CrossRef]
  5. Basu, S.C.; Basu, M. Liposome Methods and Protocols; Humana Press: Totowa, NJ, USA, 2002; Volume 199. [Google Scholar]
  6. Silva, E.F.D.; Santos, F.A.L.D.; Pires, H.M.; Bastos, L.M.; Ribeiro, L.N.D.M. Lipid Nanoparticles Carrying Essential Oils for Multiple Applications as Antimicrobials. Pharmaceutics 2025, 17, 178. [Google Scholar] [CrossRef] [PubMed]
  7. Jacob, S.; Nair, A.B.; Shah, J.; Gupta, S.; Boddu, S.H.S.; Sreeharsha, N.; Joseph, A.; Shinu, P.; Morsy, M.A. Lipid Nanoparticles as a Promising Drug Delivery Carrier for Topical Ocular Therapy—An Overview on Recent Advances. Pharmaceutics 2022, 14, 533. [Google Scholar] [CrossRef] [PubMed]
  8. Alfutaimani, A.S.; Alharbi, N.K.; Alahmari, A.S.; Alqabbani, A.A.; Aldayel, A.M. Exploring the Landscape of Lipid Nanoparticles (LNPs): A Comprehensive Review of LNPs Types and Biological Sources of Lipids. Int. J. Pharm. X 2024, 8, 100305. [Google Scholar] [CrossRef]
  9. Müller, R.H.; Alexiev, U.; Sinambela, P.; Keck, C.M. Nanostructured Lipid Carriers (NLC): The Second Generation of Solid Lipid Nanoparticles. In Percutaneous Penetration Enhancers Chemical Methods in Penetration Enhancement; Dragicevic, N., Maibach, H.I., Eds.; Springer: Berlin/Heidelberg, Germany, 2016; pp. 161–185. [Google Scholar]
  10. Naseri, N.; Valizadeh, H.; Zakeri-Milani, P. Solid Lipid Nanoparticles and Nanostructured Lipid Carriers: Structure, Preparation and Application. Adv. Pharm. Bull. 2015, 5, 305–313. [Google Scholar] [CrossRef] [PubMed]
  11. Pink, D.L.; Loruthai, O.; Ziolek, R.M.; Wasutrasawat, P.; Terry, A.E.; Lawrence, M.J.; Lorenz, C.D. On the Structure of Solid Lipid Nanoparticles. Small 2019, 15, 1903156. [Google Scholar] [CrossRef]
  12. Pareek, A.; Kapoor, D.U.; Yadav, S.K.; Rashid, S.; Fareed, M.; Akhter, M.S.; Muteeb, G.; Gupta, M.M.; Prajapati, B.G. Advancing Lipid Nanoparticles: A Pioneering Technology in Cosmetic and Dermatological Treatments. Colloid Interface Sci. Commun. 2025, 64, 100814. [Google Scholar] [CrossRef]
  13. Bang, S.H.; Yu, Y.M.; Hwang, I.C.; Park, H.J. Formation of Size-Controlled Nano Carrier Systems by Self-Assembly. J. Microencapsul. 2009, 26, 722–733. [Google Scholar] [CrossRef] [PubMed]
  14. Xie, S.; Zhu, L.; Dong, Z.; Wang, Y.; Wang, X.; Zhou, W. Preparation and Evaluation of Ofloxacin-Loaded Palmitic Acid Solid Lipid Nanoparticles. Int. J. Nanomed. 2011, 6, 547–555. [Google Scholar] [CrossRef] [PubMed][Green Version]
  15. Irby, D.; Du, C.; Li, F. Lipid–Drug Conjugate for Enhancing Drug Delivery. Mol. Pharm. 2017, 14, 1325–1338. [Google Scholar] [CrossRef]
  16. Tahir, N.; Tahir Haseeb, M.; Madni, A.; Parveen, F.; Muzamil Khan, M.; Khan, S.; Jan, N.; Khan, A. Lipid Polymer Hybrid Nanoparticles: A Novel Approach for Drug Delivery. In Role of Novel Drug Delivery Vehicles in Nanobiomedicine; Tyagi, R.K., Garg, N., Shukla, R., Singh Bisen, P., Eds.; IntechOpen: London, UK, 2020. [Google Scholar]
  17. Mishra, V.; Bansal, K.K.; Verma, A.; Yadav, N.; Thakur, S.; Sudhakar, K.; Rosenholm, J.M. Solid Lipid Nanoparticles: Emerging Colloidal Nano Drug Delivery Systems. Pharmaceutics 2018, 10, 191. [Google Scholar] [CrossRef]
  18. Aldayel, A.M.; O’Mary, H.L.; Valdes, S.A.; Li, X.; Thakkar, S.G.; Mustafa, B.E.; Cui, Z. Lipid Nanoparticles with Minimum Burst Release of TNF-α siRNA Show Strong Activity against Rheumatoid Arthritis Unresponsive to Methotrexate. J. Control. Release 2018, 283, 280–289. [Google Scholar] [CrossRef]
  19. Bayón-Cordero, L.; Alkorta, I.; Arana, L. Application of Solid Lipid Nanoparticles to Improve the Efficiency of Anticancer Drugs. Nanomaterials 2019, 9, 474. [Google Scholar] [CrossRef]
  20. Benson, H. Transdermal Drug Delivery: Penetration Enhancement Techniques. Curr. Drug Deliv. 2005, 2, 23–33. [Google Scholar] [CrossRef] [PubMed]
  21. Bose, S.; Michniak-Kohn, B. Preparation and Characterization of Lipid Based Nanosystems for Topical Delivery of Quercetin. Eur. J. Pharm. Sci. 2013, 48, 442–452. [Google Scholar] [CrossRef]
  22. Tan, Q.; Liu, W.; Guo, C.; Zhai, G. Preparation and Evaluation of Quercetin-Loaded Lecithin-Chitosan Nanoparticles for Topical Delivery. Int. J. Nanomed. 2011, 6, 1621–1630. [Google Scholar] [CrossRef]
  23. Scioli Montoto, S.; Muraca, G.; Ruiz, M.E. Solid Lipid Nanoparticles for Drug Delivery: Pharmacological and Biopharmaceutical Aspects. Front. Mol. Biosci. 2020, 7, 587997. [Google Scholar] [CrossRef]
  24. Pereira, P.C.G.; Parente, C.E.T.; Carvalho, G.O.; Torres, J.P.M.; Meire, R.O.; Dorneles, P.R.; Malm, O. A Review on Pesticides in Flower Production: A Push to Reduce Human Exposure and Environmental Contamination. Environ. Pollut. 2021, 289, 117817. [Google Scholar] [CrossRef] [PubMed]
  25. Pathak, A.; Mandal, N.; Upadhyaya, D.C.; Joshi, N.; Upadhyaya, C.P. Lipid Nanoparticles: A Sustainable Solution for Crop Disease Management. Adv. Nat. Sci. Nanosci. Nanotechnol. 2024, 15, 033001. [Google Scholar] [CrossRef]
  26. Neem Foundation. Chemistry of Neem. Available online: https://neemfoundation.org/about-neem/chemistry-of-neem/ (accessed on 14 January 2025).
  27. Chopra, M.; Fitzsimons, P.E.E.; Strain, J.J.; Thurnham, D.I.; Howard, A.N. Nonalcoholic Red Wine Extract and Quercetin Inhibit LDL Oxidation without Affecting Plasma Antioxidant Vitamin and Carotenoid Concentrations. Clin. Chem. 2000, 46, 1162–1170. [Google Scholar] [CrossRef]
  28. Davis, J.M.; Murphy, E.A.; Carmichael, M.D.; Davis, B. Quercetin Increases Brain and Muscle Mitochondrial Biogenesis and Exercise Tolerance. Am. J. Physiol.-Regul. Integr. Comp. Physiol. 2009, 296, R1071–R1077. [Google Scholar] [CrossRef] [PubMed]
  29. Mlcek, J.; Jurikova, T.; Skrovankova, S.; Sochor, J. Quercetin and Its Anti-Allergic Immune Response. Molecules 2016, 21, 623. [Google Scholar] [CrossRef]
  30. Rietjens, I.M.C.M.; Boersma, M.G.; Van Der Woude, H.; Jeurissen, S.M.F.; Schutte, M.E.; Alink, G.M. Flavonoids and Alkenylbenzenes: Mechanisms of Mutagenic Action and Carcinogenic Risk. Mutat. Res./Fundam. Mol. Mech. Mutagen. 2005, 574, 124–138. [Google Scholar] [CrossRef]
  31. Stewart, L.K.; Soileau, J.L.; Ribnicky, D.; Wang, Z.Q.; Raskin, I.; Poulev, A.; Majewski, M.; Cefalu, W.T.; Gettys, T.W. Quercetin Transiently Increases Energy Expenditure but Persistently Decreases Circulating Markers of Inflammation in C57BL/6J Mice Fed a High-Fat Diet. Metabolism 2008, 57, S39–S46. [Google Scholar] [CrossRef]
  32. Ahmed, N.; Alam, M.; Saeed, M.; Ullah, H.; Iqbal, T.; Awadh Al-Mutairi, K.; Shahjeer, K.; Ullah, R.; Ahmed, S.; Abd Aleem Hassan Ahmed, N.; et al. Botanical Insecticides Are a Non-Toxic Alternative to Conventional Pesticides in the Control of Insects and Pests. In Global Decline of Insects; Abdel Farag El-Shafie, H., Ed.; IntechOpen: London, UK, 2022. [Google Scholar]
  33. Guerriero, G.; Sutera, F.M.; Hoffmann, J.; Leclercq, C.C.; Planchon, S.; Berni, R.; Hausman, J.-F.; Renaut, J.; Torabi-Pour, N.; Pennington, H.C.; et al. Nanoporous Quercetin-Loaded Silicon-Stabilized Hybrid Lipid Nanoparticles Alleviate Salt Stress in Tomato Plants. ACS Appl. Nano Mater. 2023, 6, 3647–3660. [Google Scholar] [CrossRef]
  34. Hikal, W.M.; Baeshen, R.S.; Said-Al Ahl, H.A.H. Botanical Insecticide as Simple Extractives for Pest Control. Cogent Biol. 2017, 3, 1404274. [Google Scholar] [CrossRef]
  35. Mathioudakis, M.; Livieratos, I. The Application of Quercetin to Study the Effect of Hsp70 Silencing on Plant Virus Infection in Nicotiana benthamiana Plants. Bio-Protoc. 2015, 5, e1675. [Google Scholar] [CrossRef]
  36. Saravanan, G. Plants and Phytochemical Activity as Botanical Pesticides for Sustainable Agricultural Crop Production in India-MiniReview. J. Agric. Food Res. 2022, 9, 100345. [Google Scholar] [CrossRef]
  37. Schnarr, L.; Segatto, M.L.; Olsson, O.; Zuin, V.G.; Kümmerer, K. Flavonoids as Biopesticides—Systematic Assessment of Sources, Structures, Activities and Environmental Fate. Sci. Total Environ. 2022, 824, 153781. [Google Scholar] [CrossRef] [PubMed]
  38. Shi, G.; Rao, L.; Yu, H.; Xiang, H.; Yang, H.; Ji, R. Stabilization and Encapsulation of Photosensitive Resveratrol within Yeast Cell. Int. J. Pharm. 2008, 349, 83–93. [Google Scholar] [CrossRef] [PubMed]
  39. Thiele, J.J.; Schroeter, C.; Hsieh, S.N.; Podda, M.; Packer, L. The Antioxidant Network of the Stratum Corneum. In Current Problems in Dermatology; Thiele, J., Elsner, P., Eds.; KARGER: Basel, Switzerland, 2000; Volume 29, pp. 26–42. [Google Scholar]
  40. Chariou, P.L.; Steinmetz, N.F. Delivery of Pesticides to Plant Parasitic Nematodes Using Tobacco Mild Green Mosaic Virus as a Nanocarrier. ACS Nano 2017, 11, 4719–4730. [Google Scholar] [CrossRef] [PubMed]
  41. Kah, M.; Kookana, R.S.; Gogos, A.; Bucheli, T.D. A Critical Evaluation of Nanopesticides and Nanofertilizers Against Their Conventional Analogues. Nat. Nanotechnol. 2018, 13, 677–684. [Google Scholar] [CrossRef]
  42. Assali, M.; Zaid, A.-N. Features, Applications, and Sustainability of Lipid Nanoparticles in Cosmeceuticals. Saudi Pharm. J. 2022, 30, 53–65. [Google Scholar] [CrossRef]
  43. Müller, R.H.; Mäder, K.; Gohla, S. Solid Lipid Nanoparticles (SLN) for Controlled Drug Delivery—A Review of the State of the Art. Eur. J. Pharm. Biopharm. 2000, 50, 161–177. [Google Scholar] [CrossRef]
  44. Lacatusu, I.; Niculae, G.; Badea, N.; Stan, R.; Popa, O.; Oprea, O.; Meghea, A. Design of Soft Lipid Nanocarriers Based on Bioactive Vegetable Oils with Multiple Health Benefits. Chem. Eng. J. 2014, 246, 311–321. [Google Scholar] [CrossRef]
  45. Liang, F.; Lindgren, G.; Lin, A.; Thompson, E.A.; Ols, S.; Röhss, J.; John, S.; Hassett, K.; Yuzhakov, O.; Bahl, K.; et al. Efficient Targeting and Activation of Antigen-Presenting Cells In Vivo after Modified mRNA Vaccine Administration in Rhesus Macaques. Mol. Ther. 2017, 25, 2635–2647. [Google Scholar] [CrossRef]
  46. Lindsay, K.E.; Bhosle, S.M.; Zurla, C.; Beyersdorf, J.; Rogers, K.A.; Vanover, D.; Xiao, P.; Araínga, M.; Shirreff, L.M.; Pitard, B.; et al. Visualization of Early Events in mRNA Vaccine Delivery in Non-Human Primates via PET–CT and Near-Infrared Imaging. Nat. Biomed. Eng. 2019, 3, 371–380. [Google Scholar] [CrossRef]
  47. Schoenmaker, L.; Witzigmann, D.; Kulkarni, J.A.; Verbeke, R.; Kersten, G.; Jiskoot, W.; Crommelin, D.J.A. mRNA-Lipid Nanoparticle COVID-19 Vaccines: Structure and Stability. Int. J. Pharm. 2021, 601, 120586. [Google Scholar] [CrossRef]
  48. Halloy, F.; Biscans, A.; Bujold, K.E.; Debacker, A.; Hill, A.C.; Lacroix, A.; Luige, O.; Strömberg, R.; Sundstrom, L.; Vogel, J.; et al. Innovative Developments and Emerging Technologies in RNA Therapeutics. RNA Biol. 2022, 19, 313–332. [Google Scholar] [CrossRef]
  49. Evers, M.J.W.; Kulkarni, J.A.; Van Der Meel, R.; Cullis, P.R.; Vader, P.; Schiffelers, R.M. State-of-the-Art Design and Rapid-Mixing Production Techniques of Lipid Nanoparticles for Nucleic Acid Delivery. Small Methods 2018, 2, 1700375. [Google Scholar] [CrossRef]
  50. Hassett, K.J.; Benenato, K.E.; Jacquinet, E.; Lee, A.; Woods, A.; Yuzhakov, O.; Himansu, S.; Deterling, J.; Geilich, B.M.; Ketova, T.; et al. Optimization of Lipid Nanoparticles for Intramuscular Administration of mRNA Vaccines. Mol. Ther.-Nucleic Acids 2019, 15, 1–11. [Google Scholar] [CrossRef] [PubMed]
  51. Reichmuth, A.M.; Oberli, M.A.; Jaklenec, A.; Langer, R.; Blankschtein, D. mRNA Vaccine Delivery Using Lipid Nanoparticles. Ther. Deliv. 2016, 7, 319–334. [Google Scholar] [CrossRef] [PubMed]
  52. Buschmann, M.D.; Carrasco, M.J.; Alishetty, S.; Paige, M.; Alameh, M.G.; Weissman, D. Nanomaterial Delivery Systems for mRNA Vaccines. Vaccines 2021, 9, 65. [Google Scholar] [CrossRef] [PubMed]
  53. Yanez Arteta, M.; Kjellman, T.; Bartesaghi, S.; Wallin, S.; Wu, X.; Kvist, A.J.; Dabkowska, A.; Székely, N.; Radulescu, A.; Bergenholtz, J.; et al. Successful Reprogramming of Cellular Protein Production through mRNA Delivered by Functionalized Lipid Nanoparticles. Proc. Natl. Acad. Sci. USA 2018, 115, E3351–E3360. [Google Scholar] [CrossRef]
  54. Chen, S.P.; Blakney, A.K. Immune Response to the Components of Lipid Nanoparticles for Ribonucleic Acid Therapeutics. Curr. Opin. Biotechnol. 2024, 85, 103049. [Google Scholar] [CrossRef]
  55. EVONIK PhytoChol®: Plant-Derived Cholesterol for mRNA Delivery, Gene Delivery and Cell Culture. Available online: https://healthcare.evonik.com/en/drugdelivery/mrna-and-gene-delivery/phytochol?at_medium=website&at_campaign=profile&at_channel=ddd#:~:text=Our%20plant-derived%20cholesterol%20PhytoChol%C2%AE%20provides%20you%20with%20a,needs%20of%20injectable%20and%20biopharmaceutical%20cell%20culture%20applications (accessed on 14 January 2025).
  56. Eygeris, Y.; Patel, S.; Jozic, A.; Sahay, G. Deconvoluting Lipid Nanoparticle Structure for Messenger RNA Delivery. Nano Lett. 2020, 20, 4543–4549. [Google Scholar] [CrossRef]
  57. Patel, S.; Ashwanikumar, N.; Robinson, E.; Xia, Y.; Mihai, C.; Griffith, J.P.; Hou, S.; Esposito, A.A.; Ketova, T.; Welsher, K.; et al. Naturally-Occurring Cholesterol Analogues in Lipid Nanoparticles Induce Polymorphic Shape and Enhance Intracellular Delivery of mRNA. Nat. Commun. 2020, 11, 983. [Google Scholar] [CrossRef]
  58. Medjmedj, A.; Ngalle-Loth, A.; Clemençon, R.; Hamacek, J.; Pichon, C.; Perche, F. In Cellulo and In Vivo Comparison of Cholesterol, Beta-Sitosterol and Dioleylphosphatidylethanolamine for Lipid Nanoparticle Formulation of mRNA. Nanomaterials 2022, 12, 2446. [Google Scholar] [CrossRef]
  59. Inguva, P.K.; Mukherjee, S.; Walker, P.J.; Kanso, M.A.; Wang, J.; Wu, Y.; Tenberg, V.; Santra, S.; Singh, S.; Kim, S.H.; et al. Mechanistic Modeling of Lipid Nanoparticle Formation for the Delivery of Nucleic Acid Therapeutics. Biotechnol. Adv. 2024, 84, 108643. [Google Scholar] [CrossRef] [PubMed]
  60. Maharjan, R.; Kim, K.H.; Lee, K.; Han, H.-K.; Jeong, S.H. Machine Learning-Driven Optimization of mRNA-Lipid Nanoparticle Vaccine Quality with XGBoost/Bayesian Method and Ensemble Model Approaches. J. Pharm. Anal. 2024, 14, 100996. [Google Scholar] [CrossRef]
  61. Schmidt, A.; Helgers, H.; Vetter, F.L.; Zobel-Roos, S.; Hengelbrock, A.; Strube, J. Process Automation and Control Strategy by Quality-by-Design in Total Continuous mRNA Manufacturing Platforms. Processes 2022, 10, 1783. [Google Scholar] [CrossRef]
  62. Shin, S.; Devos, C.; Udepurkar, A.P.; Inguva, P.K.; Myerson, A.S.; Braatz, R.D. Mechanistic Modeling of Lipid Nanoparticle (LNP) Precipitation via Population Balance Equations (PBEs). Chem. Eng. J. 2025, 523, 167786. [Google Scholar] [CrossRef]
  63. Martínez Rivas, C.J.; Tarhini, M.; Badri, W.; Miladi, K.; Greige-Gerges, H.; Nazari, Q.A.; Galindo Rodríguez, S.A.; Román, R.Á.; Fessi, H.; Elaissari, A. Nanoprecipitation Process: From Encapsulation to Drug Delivery. Int. J. Pharm. 2017, 532, 66–81. [Google Scholar] [CrossRef]
  64. Vetter, F.L.; Strube, J. Enabling Total Process Digital Twin in Sugar Refining through the Integration of Secondary Crystallization Influences. Processes 2022, 10, 373. [Google Scholar] [CrossRef]
  65. Mersmann, A.; Braun, B.; Lo, M. Prediction of crystallization coefficients of the Population Balance. Chem. Eng. Sci. 2002, 57, 4267–4275. [Google Scholar] [CrossRef]
  66. Schmok, K. Modelling of Mechanism of Agglomeration of KCl Crystallization. Cryst. Res. Technol. 1988, 23, 967–972. [Google Scholar] [CrossRef]
  67. Laloue, N.; Couenne, F.; Le Gorrec, Y.; Kohl, M.; Tanguy, D.; Tayakout-Fayolle, M. Dynamic Modeling of a Batch Crystallization Process: A Stochastic Approach for Agglomeration and Attrition Process. Chem. Eng. Sci. 2007, 62, 6604–6614. [Google Scholar] [CrossRef]
  68. Raponi, A.; Marchisio, D. Deep Learning for Kinetics Parameters Identification: A Novel Approach for Multi-Variate Optimization. Chem. Eng. J. 2024, 489, 151149. [Google Scholar] [CrossRef]
  69. Nagy, B.; Szilágyi, B.; Domokos, A.; Tacsi, K.; Pataki, H.; Marosi, G.; Nagy, Z.K.; Nagy, Z.K. Modeling of Pharmaceutical Filtration and Continuous Integrated Crystallization-Filtration Processes. Chem. Eng. J. 2021, 413, 127566. [Google Scholar] [CrossRef]
  70. Hanhoun, M.; Montastruc, L.; Azzaro-Pantel, C.; Biscans, B.; Frèche, M.; Pibouleau, L. Simultaneous Determination of Nucleation and Crystal Growth Kinetics of Struvite Using a Thermodynamic Modeling Approach. Chem. Eng. J. 2013, 215–216, 903–912. [Google Scholar] [CrossRef]
  71. Shahab, M.A.; Stover, N.M.; Al-Mahayni, H.; Srisuma, P.; Wang, J.; Shin, S.; Dighe, A.; Trout, B.L.; Myerson, A.S.; Braatz, R.D. End-to-End Digital Twin Software for Continuous mRNA Manufacturing. Int. J. Pharm. 2025, 126301. [Google Scholar] [CrossRef]
  72. Food and Drug Administration. Pfizer-BioNTech COVID-19 Vaccine EUA Letter of Authorization; Food and Drug Administration: Silver Spring, MD, USA, 2021.
  73. Ang, L.F.; Yam, M.F.; Fung, Y.T.T.; Kiang, P.K.; Darwin, Y. HPLC Method for Simultaneous Quantitative Detection of Quercetin and Curcuminoids in Traditional Chinese Medicines. J. Pharmacopunct. 2014, 17, 36–49. [Google Scholar] [CrossRef] [PubMed]
  74. Khan, M.A.; Zhou, C.; Zheng, P.; Zhao, M.; Liang, L. Improving Physicochemical Stability of Quercetin-Loaded Hollow Zein Particles with Chitosan/Pectin Complex Coating. Antioxidants 2021, 10, 1476. [Google Scholar] [CrossRef] [PubMed]
  75. Quagliarini, E.; Renzi, S.; Digiacomo, L.; Giulimondi, F.; Sartori, B.; Amenitsch, H.; Tassinari, V.; Masuelli, L.; Bei, R.; Cui, L.; et al. Microfluidic Formulation of DNA-Loaded Multicomponent Lipid Nanoparticles for Gene Delivery. Pharmaceutics 2021, 13, 1292. [Google Scholar] [CrossRef]
  76. Cui, L.; Renzi, S.; Quagliarini, E.; Digiacomo, L.; Amenitsch, H.; Masuelli, L.; Bei, R.; Ferri, G.; Cardarelli, F.; Wang, J.; et al. Efficient Delivery of DNA Using Lipid Nanoparticles. Pharmaceutics 2022, 14, 1698. [Google Scholar] [CrossRef]
  77. Gao, R.Y.; Riley, C.M.; Toth, E.; Blair, R.H.; Gerold, M.N.; McCormick, C.; Taylor, A.W.; Hu, T.; Rowlen, K.L.; Dawson, E.D. Rapid Identity and Quantity CQA Test for Multivalent mRNA Drug Product Formulations. Vaccines 2022, 10, 1704. [Google Scholar] [CrossRef] [PubMed]
  78. An, K.; Kurek, D.; Mahadeo, M.; Zhang, Y.; Thewalt, J.L.; Cullis, P.R.; Kulkarni, J.A. On the Influence of Nucleic Acid Backbone Modifications on Lipid Nanoparticle Morphology. Langmuir 2022, 38, 14036–14043. [Google Scholar] [CrossRef]
  79. Zhang, J.; Haas, R.M.; Leone, A.M. Polydispersity Characterization of Lipid Nanoparticles for siRNA Delivery Using Multiple Detection Size-Exclusion Chromatography. Anal. Chem. 2012, 84, 6088–6096. [Google Scholar] [CrossRef]
  80. Malburet, C.; Leclercq, L.; Cotte, J.-F.; Thiebaud, J.; Bazin, E.; Garinot, M.; Cottet, H. Size and Charge Characterization of Lipid Nanoparticles for mRNA Vaccines. Anal. Chem. 2022, 94, 4677–4685. [Google Scholar] [CrossRef]
  81. Provencher, S.W. Inverse Problems in Polymer Characterization: Direct Analysis of Polydispersity with Photon Correlation Spectroscopy. Makromol. Chem. 1979, 180, 201–209. [Google Scholar] [CrossRef]
  82. WYATT Technology. ASTRATM 8 Software User’s Guide—M1111 Rev. E; Wyatt Technology Corporation: Santa Barbara, CA, USA, 2024. [Google Scholar]
  83. Carrasco, M.J.; Alishetty, S.; Alameh, M.-G.; Said, H.; Wright, L.; Paige, M.; Soliman, O.; Weissman, D.; Cleveland, T.E.; Grishaev, A.; et al. Ionization and Structural Properties of mRNA Lipid Nanoparticles Influence Expression in Intramuscular and Intravascular Administration. Commun. Biol. 2021, 4, 956. [Google Scholar] [CrossRef]
  84. McMillan, C.; Druschitz, A.; Rumbelow, S.; Borah, A.; Binici, B.; Rattray, Z.; Perrie, Y. Tailoring Lipid Nanoparticle Dimensions through Manufacturing Processes. RSC Pharm. 2024, 1, 841–853. [Google Scholar] [CrossRef] [PubMed]
  85. Bhagavan, N.V. Medical Biochemistry, 4th ed.; Harcourt/Academic Press: San Diego, CA, USA, 2002. [Google Scholar]
  86. Drake, P.L.; Hartshorn, R.T.; McGinnis, J.; Sykes, A.G. pH Dependence of Rate Constants for Reactions of Cytochrome c with Inorganic Redox Partners and Mechanistic Implications. Inorg. Chem. 1989, 28, 1361–1366. [Google Scholar] [CrossRef]
  87. Avery, H.E. Basic Reaction Kinetics and Mechanisms; Macmillan: London, UK, 1974. [Google Scholar]
  88. Taylor, G.I. Dispersion of Soluble Matter in Solvent Flowing Slowly through a Tube. Proc. R. Soc. Lond. Ser. A Math. Phys. Sci. 1953, 219, 186–203. [Google Scholar] [CrossRef]
  89. Hengelbrock, A.; Schmidt, A.; Strube, J. Formulation of Nucleic Acids by Encapsulation in Lipid Nanoparticles for Continuous Production of mRNA. Processes 2023, 11, 1718. [Google Scholar] [CrossRef]
  90. Danckwerts, P.V. Continuous Flow Systems. Chem. Eng. Sci. 1953, 2, 1–13. [Google Scholar] [CrossRef]
  91. Kovo, A.S. Mathematical Modeling and Simulation of Dispersion in a Nonideal Plug Flow Reactor. J. Dispers. Sci. Technol. 2008, 29, 1129–1134. [Google Scholar] [CrossRef]
  92. Huter, M.J.; Jensch, C.; Strube, J. Model Validation and Process Design of Continuous Single Pass Tangential Flow Filtration Focusing on Continuous Bioprocessing for High Protein Concentrations. Processes 2019, 7, 781. [Google Scholar] [CrossRef]
  93. Huter, M.J.; Strube, J. Model-Based Design and Process Optimization of Continuous Single Pass Tangential Flow Filtration Focusing on Continuous Bioprocessing. Processes 2019, 7, 317. [Google Scholar] [CrossRef]
  94. Thiess, H.; Leuthold, M.; Grummert, U.; Strube, J. Module Design for Ultrafiltration in Biotechnology: Hydraulic Analysis and Statistical Modeling. J. Membr. Sci. 2017, 540, 440–453. [Google Scholar] [CrossRef]
  95. Michaels, A.S. New Separation Technique for the CPI. Chem. Eng. Prog. 1968, 64, 31–43. [Google Scholar]
  96. Schmidt, A.; Strube, J. Prozessintegration Mittels Validierter Digitaler Zwillinge von Flüssig-Flüssig-Extraktionsprozessen zur Gewinnung von Metallischen, Pflanzlichen und Biotechnologischen Wertkomponenten; Shaker Verlag: Clausthal-Zellerfeld, Germany, 2021. [Google Scholar]
  97. Omar, H.M.; Rohani, S. Crystal Population Balance Formulation and Solution Methods: A Review. Cryst. Growth Des. 2017, 17, 4028–4041. [Google Scholar] [CrossRef]
  98. Schwarzer, H.; Peukert, W. Combined Experimental/Numerical Study on the Precipitation of Nanoparticles. AIChE J. 2004, 50, 3234–3247. [Google Scholar] [CrossRef]
  99. Güldenpfennig, A.; Pflug, L.; Peukert, W. How to Estimate Material Parameters for Multiphase, Multicomponent Precipitation Modeling. Cryst. Growth Des. 2019, 19, 2785–2793. [Google Scholar] [CrossRef]
  100. Thanh, N.T.K.; Maclean, N.; Mahiddine, S. Mechanisms of Nucleation and Growth of Nanoparticles in Solution. Chem. Rev. 2014, 114, 7610–7630. [Google Scholar] [CrossRef]
  101. Sajjadi, S. Population Balance Modeling of Particle Size Distribution in Monomer-starved Semibatch Emulsion Polymerization. AIChE J. 2009, 55, 3191–3205. [Google Scholar] [CrossRef]
  102. Liu, H.; Li, J.; Sun, D.; Odoom-Wubah, T.; Huang, J.; Li, Q. Modeling of Silver Nanoparticle Formation in a Microreactor: Reaction Kinetics Coupled with Population Balance Model and Fluid Dynamics. Ind. Eng. Chem. Res. 2014, 53, 4263–4270. [Google Scholar] [CrossRef]
  103. Marchisio, D.L.; Vigil, R.D.; Fox, R.O. Quadrature Method of Moments for Aggregation–Breakage Processes. J. Colloid Interface Sci. 2003, 258, 322–334. [Google Scholar] [CrossRef] [PubMed]
  104. Yang, Y.; Corona, A.; Henson, M.A. Experimental Investigation and Population Balance Equation Modeling of Solid Lipid Nanoparticle Aggregation Dynamics. J. Colloid Interface Sci. 2012, 374, 297–307. [Google Scholar] [CrossRef]
  105. Schwarzer, H.-C.; Peukert, W. Prediction of Aggregation Kinetics Based on Surface Properties of Nanoparticles. Chem. Eng. Sci. 2005, 60, 11–25. [Google Scholar] [CrossRef]
  106. Traoré, N.E.; Schikarski, T.; Körner, A.; Cardenas Lopez, P.; Hartmann, L.; Fritsch, B.; Walter, J.; Hutzler, A.; Pflug, L.; Peukert, W. Mechanistic Insights into Silver-Gold Nanoalloy Formation by Two-Dimensional Population Balance Modeling. Chem. Eng. J. 2024, 483, 149429. [Google Scholar] [CrossRef]
  107. Casado, C.; Pinho, B.; Marugán, J.; Torrente-Murciano, L. Predicting the Size of Silver Nanoparticles Synthesised in Flow Reactors: Coupling Population Balance Models with Fluid Dynamic Simulations. Chem. Eng. J. 2024, 479, 147684. [Google Scholar] [CrossRef]
  108. Wang, T.; Yu, T.; Li, W.; Liu, Q.; Sung, T.-C.; Higuchi, A. Design and Lyophilization of mRNA-Encapsulating Lipid Nanoparticles. Int. J. Pharm. 2024, 662, 124514. [Google Scholar] [CrossRef]
  109. Zhang, W. Nanoparticle Aggregation: Principles and Modeling. In Nanomaterial; Capco, D.G., Chen, Y., Eds.; Advances in Experimental Medicine and Biology; Springer: Dordrecht, The Netherlands, 2014; Volume 811, pp. 19–43. [Google Scholar]
  110. Icardi, M.; Pasquale, N.D.; Crevacore, E.; Marchisio, D.; Babler, M.U. Population Balance Models for Particulate Flows in Porous Media: Breakage and Shear-Induced Events. Transp. Porous Med. 2023, 146, 197–222. [Google Scholar] [CrossRef]
  111. Li, S.; Hu, Y.; Li, A.; Lin, J.; Hsieh, K.; Schneiderman, Z.; Zhang, P.; Zhu, Y.; Qiu, C.; Kokkoli, E.; et al. Payload Distribution and Capacity of mRNA Lipid Nanoparticles. Nat. Commun. 2022, 13, 5561. [Google Scholar] [CrossRef]
  112. Bhatia, N.K.; Raj Tomar, V.; Ishika; Kishor, S.; Deep, S. Effect of pH and Temperature on Physicochemical Properties, Aggregation Behaviour and Degradation Kinetics of Quercetin and Baicalein in Nearly Aqueous Media. J. Mol. Liq. 2022, 366, 120236. [Google Scholar] [CrossRef]
  113. Son, H.-Y.; Lee, M.-S.; Chang, E.; Kim, S.-Y.; Kang, B.; Ko, H.; Kim, I.-H.; Zhong, Q.; Jo, Y.-H.; Kim, C.-T.; et al. Formulation and Characterization of Quercetin-Loaded Oil in Water Nanoemulsion and Evaluation of Hypocholesterolemic Activity in Rats. Nutrients 2019, 11, 244. [Google Scholar] [CrossRef] [PubMed]
  114. Priprem, A.; Watanatorn, J.; Sutthiparinyanont, S.; Phachonpai, W.; Muchimapura, S. Anxiety and Cognitive Effects of Quercetin Liposomes in Rats. Nanomed. Nanotechnol. Biol. Med. 2008, 4, 70–78. [Google Scholar] [CrossRef]
  115. Brookhaven Instruments. Data Analysis and Distribution Weighting: FAQ for DLS Users; Brookhaven Instruments: Nashua, NH, USA, 2020. [Google Scholar]
  116. MALVERN Instruments. Zetasizer Nano User Manual; MALVERN Instruments: Worcestershire, UK, 2013. [Google Scholar]
  117. Rayleigh, L. On the Diffraction of Light by Spheres of Small Relative Index. Proc. R. Soc. Lond. Ser. A Contain. Pap. Math. Phys. Character 1914, 90, 219–225. [Google Scholar]
  118. Dan Hirleman, E. Modeling of Multiple Scattering Effects in Fraunhofer Diffraction Particle Size Analysis. Part. Part. Syst. Charact. 1988, 5, 57–65. [Google Scholar] [CrossRef]
  119. De Boer, G.B.J.; De Weerd, C.; Thoenes, D.; Goossens, H.W.J. Laser Diffraction Spectrometry: Fraunhofer Diffraction Versus Mie Scattering. Part. Part. Syst. Charact. 1987, 4, 14–19. [Google Scholar] [CrossRef]
  120. SHIMADZU. Fraunhofer Diffraction Theory and Mie Scattering Theory. Available online: https://www.ssi.shimadzu.com/service-support/technical-support/analysis-basics/lesson13.html (accessed on 29 January 2025).
  121. MALVERN Instruments. Calculating Volume Distributions From Dynamic Light Scattering Data. Available online: https://www.materials-talks.com/wp-content/uploads/2017/01/FAQ-Calculating-volume-distributions-from-DLS-data.pdf (accessed on 18 December 2024).
  122. Ramli, N.A.; Ali, N.; Hamzah, S. Physicochemical Characterization of Quercetin-Loaded Liposomes Prepared by Sonication for Functional Food Application. J. Sustain. Sci. Manag. 2020, 15, 15–27. [Google Scholar] [CrossRef]
  123. Numata, Y.; Tanaka, H. Quantitative Analysis of Quercetin Using Raman Spectroscopy. Food Chem. 2011, 126, 751–755. [Google Scholar] [CrossRef]
  124. Sharma, S.; Thukral, R.; Singla, L.D.; Singla, N.; Choudhury, D. Quercetin-Loaded Solid Lipid Nanoparticles for Enhanced Anti-Helminthic Activity. Int. J. Pharm. 2025, 672, 125308. [Google Scholar] [CrossRef]
  125. Daniel, S.; Kis, Z.; Kontoravdi, C.; Shah, N. Quality by Design for Enabling RNA Platform Production Processes. Trends Biotechnol. 2022, 40, 1213–1228. [Google Scholar] [CrossRef] [PubMed]
  126. Hermosilla, J.; Alonso-García, A.; Salmerón-García, A.; Cabeza-Barrera, J.; Medina-Castillo, A.L.; Pérez-Robles, R.; Navas, N. Analysing the In-Use Stability of mRNA-LNP COVID-19 Vaccines ComirnatyTM (Pfizer) and SpikevaxTM (Moderna): A Comparative Study of the Particulate. Vaccines 2023, 11, 1635. [Google Scholar] [CrossRef]
  127. Kudsiova, L.; Lansley, A.; Scutt, G.; Allen, M.; Bowler, L.; Williams, S.; Lippett, S.; Stafford, S.; Tarzi, M.; Cross, M.; et al. Stability Testing of the Pfizer-BioNTech BNT162b2 COVID-19 Vaccine: A Translational Study in UK Vaccination Centres. BMJ Open Sci. 2021, 5, e100203. [Google Scholar] [CrossRef]
  128. Kurnik, M. Waters. Wyatt Technology Advanced Characterization of LNP- RNA Therapeutics via FFF-MALS and DLS Techniques. 2024. Available online: https://www.news-medical.net/whitepaper/20241120/Advanced-characterization-of-LNP-mRNA-therapeutics-via-FFF-MALS-and-DLS-techniques.aspx (accessed on 27 January 2025).
  129. Matthessen, R.; Van Pottelberge, R.; Goffin, B.; De Winter, G. Impact of Mixing and Shaking on mRNA-LNP Drug Product Quality Characteristics. Sci. Rep. 2024, 14, 19590. [Google Scholar] [CrossRef] [PubMed]
  130. Szebeni, J.; Kiss, B.; Bozó, T.; Turjeman, K.; Levi-Kalisman, Y.; Barenholz, Y.; Kellermayer, M. Insights into the Structure of Comirnaty COVID-19 Vaccine: A Theory on Soft, Partially Bilayer-Covered Nanoparticles with Hydrogen Bond-Stabilized mRNA–Lipid Complexes. ACS Nano 2023, 17, 13147–13157. [Google Scholar] [CrossRef]
  131. Thaller, A.; Schmauder, L.; Frieß, W.; Winter, G.; Menzen, T.; Hawe, A.; Richter, K. SV-AUC as a Stability-Indicating Method for the Characterization of mRNA-LNPs. Eur. J. Pharm. Biopharm. 2023, 182, 152–156. [Google Scholar] [CrossRef]
  132. Kulkarni, J.A.; Darjuan, M.M.; Mercer, J.E.; Chen, S.; Van Der Meel, R.; Thewalt, J.L.; Tam, Y.Y.C.; Cullis, P.R. On the Formation and Morphology of Lipid Nanoparticles Containing Ionizable Cationic Lipids and siRNA. ACS Nano 2018, 12, 4787–4795. [Google Scholar] [CrossRef]
  133. Sixt, M.; Uhlenbrock, L.; Strube, J. Toward a Distinct and Quantitative Validation Method for Predictive Process Modelling—On the Example of Solid-Liquid Extraction Processes of Complex Plant Extracts. Processes 2018, 6, 66. [Google Scholar] [CrossRef]
  134. Uhl, A.; Schmidt, A.; Hlawitschka, M.W.; Strube, J. Autonomous Liquid–Liquid Extraction Operation in Biologics Manufacturing with Aid of a Digital Twin Including Process Analytical Technology. Processes 2023, 11, 553. [Google Scholar] [CrossRef]
  135. Helgers, H.; Hengelbrock, A.; Schmidt, A.; Strube, J. Digital Twins for Continuous mRNA Production. Processes 2021, 9, 1967. [Google Scholar] [CrossRef]
  136. Hengelbrock, A.; Schmidt, A.; Helgers, H.; Vetter, F.L.; Strube, J. Scalable mRNA Machine for Regulatory Approval of Variable Scale between 1000 Clinical Doses to 10 Million Manufacturing Scale Doses. Processes 2023, 11, 745. [Google Scholar] [CrossRef]
  137. Hengelbrock, A.; Schmidt, A.; Strube, J. Digital Twin Fundamentals of mRNA In Vitro Transcription in Variable Scale Toward Autonomous Operation. ACS Omega 2024, 9, 8204–8220. [Google Scholar] [CrossRef]
  138. Kulkarni, J.A.; Tam, Y.Y.C.; Chen, S.; Tam, Y.K.; Zaifman, J.; Cullis, P.R.; Biswas, S. Rapid Synthesis of Lipid Nanoparticles Containing Hydrophobic Inorganic Nanoparticles. Nanoscale 2017, 9, 13600–13609. [Google Scholar] [CrossRef]
  139. Schmidt, A.; Helgers, H.; Vetter, F.L.; Juckers, A.; Strube, J. Fast and Flexible mRNA Vaccine Manufacturing as a Solution to Pandemic Situations by Adopting Chemical Engineering Good Practice—Continuous Autonomous Operation in Stainless Steel Equipment Concepts. Processes 2021, 9, 1874. [Google Scholar] [CrossRef]
  140. Hengelbrock, A.; Helgers, H.; Schmidt, A.; Vetter, F.L.; Juckers, A.; Rosengarten, J.F.; Stitz, J.; Strube, J. Digital Twin for HIV-Gag VLP Production in HEK293 Cells. Processes 2022, 10, 866. [Google Scholar] [CrossRef]
  141. Vetter, F.L.; Zobel-Roos, S.; Mota, J.P.B.; Nilsson, B.; Schmidt, A.; Strube, J. Toward Autonomous Production of mRNA-Therapeutics in the Light of Advanced Process Control and Traditional Control Strategies for Chromatography. Processes 2022, 10, 1868. [Google Scholar] [CrossRef]
Figure 1. Mass balance space of the LNP formulation, consisting of the T-mixer and the membrane for diafiltration, as well as the general mass balance equation.
Processes 14 01351 g001
Figure 2. Results of particle analysis of empty and quercetin-loaded particles, determined using dynamic light scattering with Zetasizer (red) and DAWN (green). (a) Mean particle size (bars) and polydispersity index (dots) determined using the cumulants method. (b) Differential (solid line) and cumulative (dashed line) particle size distribution of the positive control and (c) with quercetin.
Processes 14 01351 g002
Figure 3. (a) DAD signal (raw and derived) with highlighted regions of interest based on ionization of the quercetin molecule (ring A: green box, ring B: red box); (b) Raman signal (raw) of empty (green line) and quercetin SLNPs (red line) and quercetin solution (orange line) with highlighted regions of interest (black boxes).
Processes 14 01351 g003
Figure 4. Quercetin concentration input (red bar) and measured quercetin concentration (dilution taken into account) of the untreated sample (dark green hatched bar) and sample diluted with methanol (light green bar).
Processes 14 01351 g004
Figure 5. (a) Concentrations of iris butter components as input (red bar) and their measured concentrations (dilution excluded) in the untreated sample (dark green hatched bar) and in the sample diluted with ethanol (light green bar). (b) Resulting encapsulation efficiency of the iris butter components.
Processes 14 01351 g005
Figure 6. Results of particle analysis of the generated particles, determined using dynamic light scattering with Zetasizer (red) and DAWN (green). (a) Mean particle size (bars) and polydispersity index (dots) determined using the cumulants method. (b) Differential (solid line) and cumulative (dashed line) particle size distribution.
Processes 14 01351 g006
Figure 7. Results of particle analysis of empty particles and particles loaded with nucleic acids using the helper lipid cholesterol (green; produced in batches or continuously in a T-mixer compared to the commercial ComirnatyTM vaccine from Pfizer/BioNTech) and β-sitosterol (red; produced in batches), determined using dynamic light scattering with the DAWN. (a) Mean particle size (bars) and polydispersity index (dots) determined using the cumulants method. (b) Particle concentration determined by dynamic light scattering over particle size. (c) Differential (solid line) and cumulative (dashed line) particle size distribution of the positive control and (d) with nucleic acids.
Processes 14 01351 g007
Figure 8. (a) Concentrations of nucleic acids as input (red bar) and their measured concentrations (dilution excluded) in the untreated sample (dark green hatched bar) and the sample treated with Triton-X (light green bar). (b) Resulting encapsulation efficiency of nucleic acids in the LNPs produced using the helper lipid cholesterol (produced in batches or continuously in a T-mixer compared to the commercial ComirnatyTM vaccine from Pfizer/BioNTech) and β-sitosterol (produced in batch mode).
Processes 14 01351 g008
Figure 9. Effect strength and direction of model parameters from statistical analysis of the DoE for the target values (a) mean particle diameter (Dmean) and (b) encapsulation efficiency (EE). (c) FMEA-like analysis of main effects, based on OFAT studies, and interaction score, based on MFAT studies on the target values (mean particle diameter as CQA: critical quality attribute and encapsulation efficiency as PA: process attribute) with rating of resulting severity score. Green: no impact. Orange: Minor impact. Red: major impact.
Processes 14 01351 g009
Figure 10. Simulation vs. experimental results. (a) Particle size distributions after T-Mixer, DV3, DV6, and DV9. (b) Mean particle size after every process step. (c) Encapsulation efficiency after every process step.
Processes 14 01351 g010
Figure 11. Effect strength and direction of process parameters from statistical analysis of the DoE for the target values (a) mean particle diameter and (b) encapsulation efficiency (EE). (c) FMEA-like analysis of main effects, based on OFAT studies, and interaction score, based on MFAT studies on the target values (mean particle diameter as CQA: critical quality attribute and encapsulation efficiency as PA: process attribute) with rating of resulting severity score. Green: no impact. Orange: Minor impact. Red: major impact.
Processes 14 01351 g011
Figure 12. Flowsheet of the plug flow reactor for the continuous encapsulation of plant extracts.
Processes 14 01351 g012
Figure 13. PFR including periphery on a stainless-steel platform for the continuous formulation of pesticides and plant extracts for fragrances.
Processes 14 01351 g013
Figure 14. Flowsheet of the continuous formulation of nucleic acids in LNPs in a T-mixer followed by diafiltration.
Processes 14 01351 g014
Figure 15. T-mixer including periphery on a stainless-steel platform for the continuous encapsulation of nucleic acids in lipid nanoparticles.
Processes 14 01351 g015
Table 1. Process parameters for the encapsulation of pesticides and fragrances.
Process ParameterPesticides (Total)Pesticides (20%)Fragrances (Total)Fragrances (20%)
Total Amount of Target Component1.6 t320 kg384 g77 g
Process Duration (w)40404040
Total Volume320 m364 m323.3 L4.7 L
Flow Rate (mL/min)7941590.060.01
Residence Time (min)16161616
Reactor Volume12.7 L2.5 L0.92 mL0.19 mL
Reactor Dimensions
(Di × L, mm × m)
10 × 16210 × 32.20.25 × 18.80.25 × 3.8
Disclaimer/Publisher’s Note: The statements, opinions and data contained in all publications are solely those of the individual author(s) and contributor(s) and not of MDPI and/or the editor(s). MDPI and/or the editor(s) disclaim responsibility for any injury to people or property resulting from any ideas, methods, instructions or products referred to in the content.