


Abstract
In ultra-deep drilling environments, downhole measurement tools often fail or cannot be deployed due to extreme high-temperature and high-pressure (HPHT) conditions. Consequently, mud-logging data become one of the few reliable real-time information sources for evaluating drilling performance and identifying abnormal conditions. This study proposes a data-driven framework for automatic identification of drilling operation statuses using machine learning, with a particular focus on ultra-deep and HPHT wells. A support vector machine (SVM)-based classification workflow was established to recognize nine representative drilling operation statuses from mud-logging data. Through systematic model optimization, the proposed method achieved a classification accuracy of 91.33%. By incorporating a sliding window-based time-series optimization strategy, the overall accuracy was further improved to 95.22%, while the recognition accuracy of HPHT-related operations increased from 77.67% to 89.33%. These results demonstrate that the optimized model possesses strong adaptability and stability under extreme HPHT conditions. This study specifically targets HPHT environments with limited downhole data and incorporates time-series optimization to enhance model robustness. The proposed framework provides a reliable approach with potential for generalization for intelligent operation recognition in ultra-deep drilling, supporting real-time decision-making and improving operational safety and efficiency in challenging environments.
1. Introduction
Drilling operations are one of the most critical and cost-intensive stages in oil and gas development, especially in ultra-deep and high-pressure high-temperature (HPHT) wells [1]. The complexity of subsurface formations and the extreme environmental conditions make the detection of abnormal drilling statuses particularly challenging. In HPHT wells, downhole tools and sensors often fail due to temperature and pressure limitations, which can lead to electronic component degradation, material fatigue, and signal instability, resulting in the loss of essential real-time measurements [1]. However, surface logging data, such as mud logging, torque, hook load, and rate of penetration (ROP), are still continuously available. These data provide valuable insights for identifying drilling operation status and detecting anomalies that can compromise safety and efficiency [2,3]. As global energy exploration moves toward deeper reservoirs and more complex formations, accurate recognition of drilling operational states becomes indispensable for preventing downhole incidents, minimizing non-productive time (NPT), and optimizing drilling performance [4,5].
Over the past two decades, researchers have developed various techniques to improve the interpretation of drilling operation statuses. Traditional methods relied heavily on manual interpretation of surface data and crew experience [6], which led to subjective bias and delayed responses to abnormal conditions. Studies reported that handling abnormal drilling events—such as stuck pipe, lost circulation, or bit balling—can account for 6–8% of total construction time and significantly increase drilling costs [7,8]. To mitigate these risks, early works focused on specific indicators such as torque fluctuation, mud pit volume changes, or ROP variations to infer the operation status [9,10]. For example, Deen and Wedel [11] demonstrated that torsional impact tools could reduce stick-slip and enhance ROP. Despite these advances, these physics-based or empirical approaches often lack robustness when applied to complex, time-varying systems encountered in HPHT wells. In addition, many downhole tools cannot be deployed under ultra-deep, high-temperature environments, leaving a monitoring gap that conventional methods cannot fill [1,12].
The rapid development of machine learning (ML) and data-driven algorithms has introduced new opportunities for automated and intelligent drilling operation monitoring [13,14,15]. Numerous studies have explored ML-based classification models such as support vector machines (SVM) [16], random forest (RF), and deep learning architectures [15,17] to automatically identify drilling conditions, detect anomalies, and optimize real-time decision-making. Ensemble learning and hybrid models have also shown promise in reducing false positives and handling the nonlinear characteristics of drilling data [2,3]. More recently, attention-based recurrent neural networks and bidirectional LSTM models have demonstrated superior performance in ROP prediction and anomaly detection in ultra-deep operations [8,18]. However, most existing research focuses on conventional drilling environments and lacks adaptation to the unique conditions of HPHT and ultra-deep wells, where missing sensor data, transient thermal effects, and drilling fluid degradation introduce new data challenges [1,12]. In addition, most existing ML-based approaches rely on relatively complete downhole measurements or focus on single-task predictions (e.g., ROP or temperature) and have not fully addressed the challenge of comprehensive drilling operation status identification using only surface logging data under HPHT conditions.
In HPHT drilling environments, downhole temperatures can exceed 150–200 °C and pressures may surpass 100 MPa, significantly increasing the failure risk of downhole tools and sensors. Field experience indicates that non-productive time (NPT) associated with tool failures and abnormal operations can account for a considerable portion of total drilling time, leading to substantial economic losses. Therefore, accurate and timely identification of drilling operation statuses is critical for improving operational efficiency and ensuring safety in HPHT wells. In recent years, increasing attention has been devoted to intelligent drilling condition identification and related applications. Recent studies have explored various data-driven approaches, including machine learning and hybrid physics-informed methods. For example, machine learning models have been successfully applied to real-time formation recognition using drilling data, demonstrating the capability of extracting geological and operational information directly from surface measurements [19]. In HPHT environments, physics-informed neural networks have been developed to predict downhole temperature profiles with high accuracy, highlighting the importance of integrating physical constraints into data-driven models [20]. In addition, machine learning techniques have been used for predictive maintenance of critical components in HPHT wells, reducing operational risks and downtime [21]. Despite these advances, most existing studies focus on specific tasks such as parameter prediction or equipment monitoring, and their applicability to comprehensive drilling operation status identification under extreme HPHT conditions remains limited.
To address these gaps, particularly the limitations of existing approaches in handling incomplete downhole data and noisy time-series signals in HPHT environments, this study proposes an enhanced ML-based workflow for automated identification of drilling operation statuses in HPHT and ultra-deep wells. In this framework, surface logging data—particularly from mud logging systems—are used as primary input, given their availability under extreme conditions. Specifically, the main contributions of this study are threefold: (1) a surface-data-driven framework for drilling operation status identification under HPHT conditions with limited downhole measurements; (2) the integration of a sliding window-based time-series optimization strategy to mitigate noise-induced pseudo-fluctuations; and (3) a systematic evaluation of model performance for both conventional and HPHT-specific operational states. Nine operational states, including both conventional and HPHT-specific abnormal conditions (e.g., thermal-induced tool failure, pressure-driven circulation loss), are classified using optimized support vector machine models. Support Vector Machine (SVM) was selected in this study due to its strong generalization capability and robustness under limited data conditions, while maintaining computational efficiency for real-time applications. Model parameters such as window length and step size are systematically tuned to maximize prediction accuracy and robustness. The proposed method extends ML-based drilling status identification approaches by explicitly addressing HPHT-specific challenges, including limited downhole measurements and strong time-series noise, thereby improving the reliability of operation recognition in extreme drilling environments.
2. Materials and Methods
2.1. Support Vector Machine (SVM)
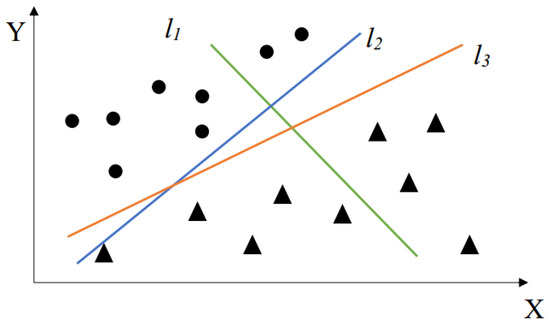
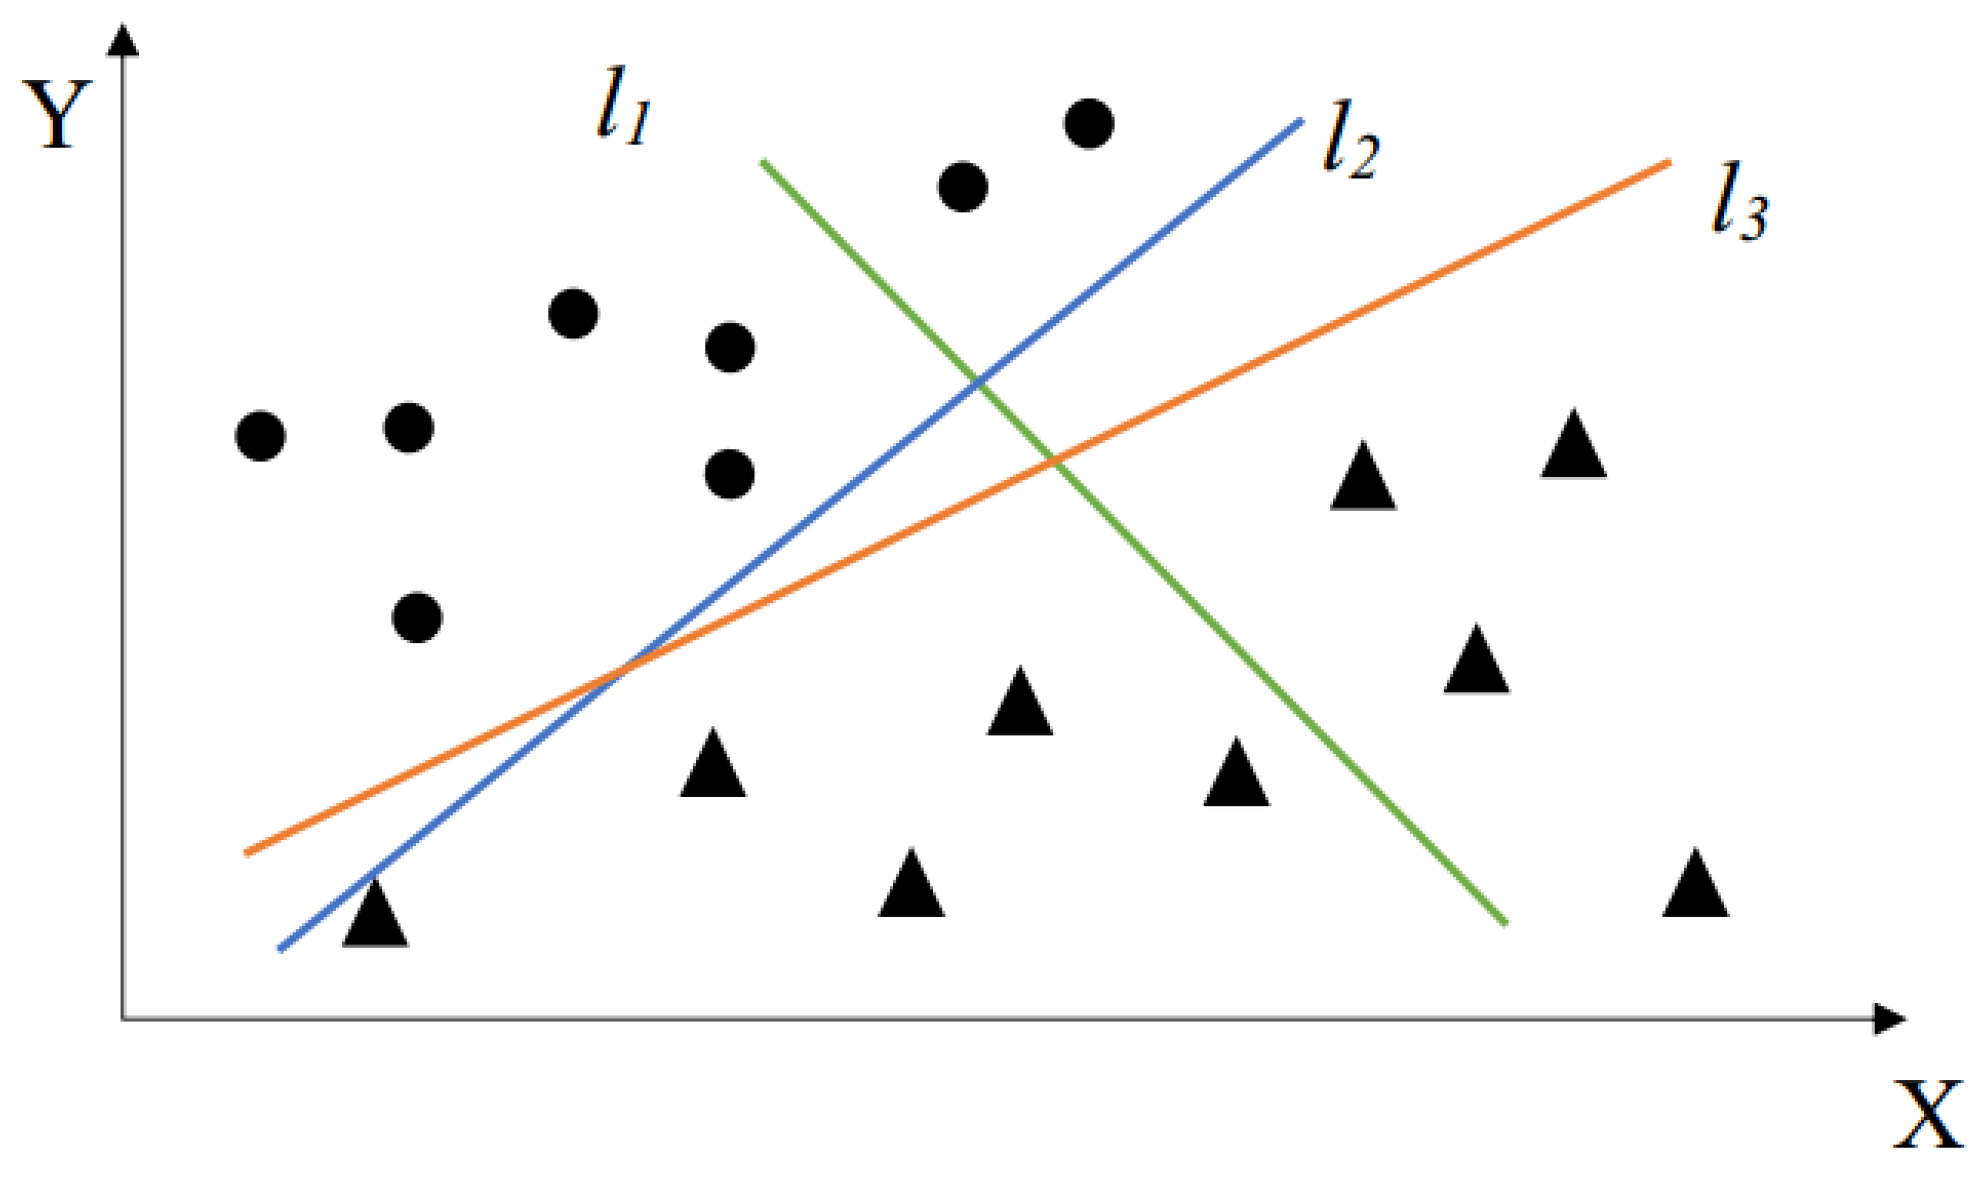
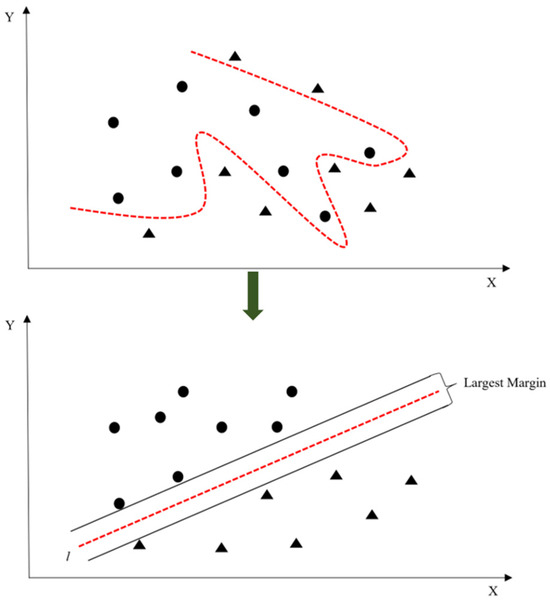
Support Vector Machine (SVM, [22]) is a supervised learning algorithm widely used for classification and nonlinear regression tasks in machine learning (ML). In this study, SVM is adopted as the primary classification model due to its robustness to noise and its ability to achieve stable performance on small- to medium-sized datasets, making it suitable for the available drilling data. The fundamental concept of SVM is to construct an optimal hyperplane, defined as the decision boundary that maximizes the margin between different classes by maximizing the distance to the nearest data points (support vectors) in the feature space, thereby improving classification robustness and generalization performance (Figure 1).
Figure 1.
An example of SVM (l1 cannot distinguish between two types of data; the distance between circles and triangles is not the largest according to l2; the distance is the largest according to l3, adapted from [22]).
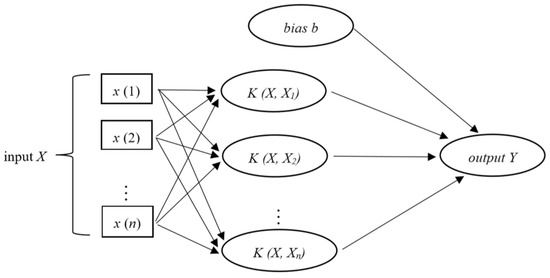
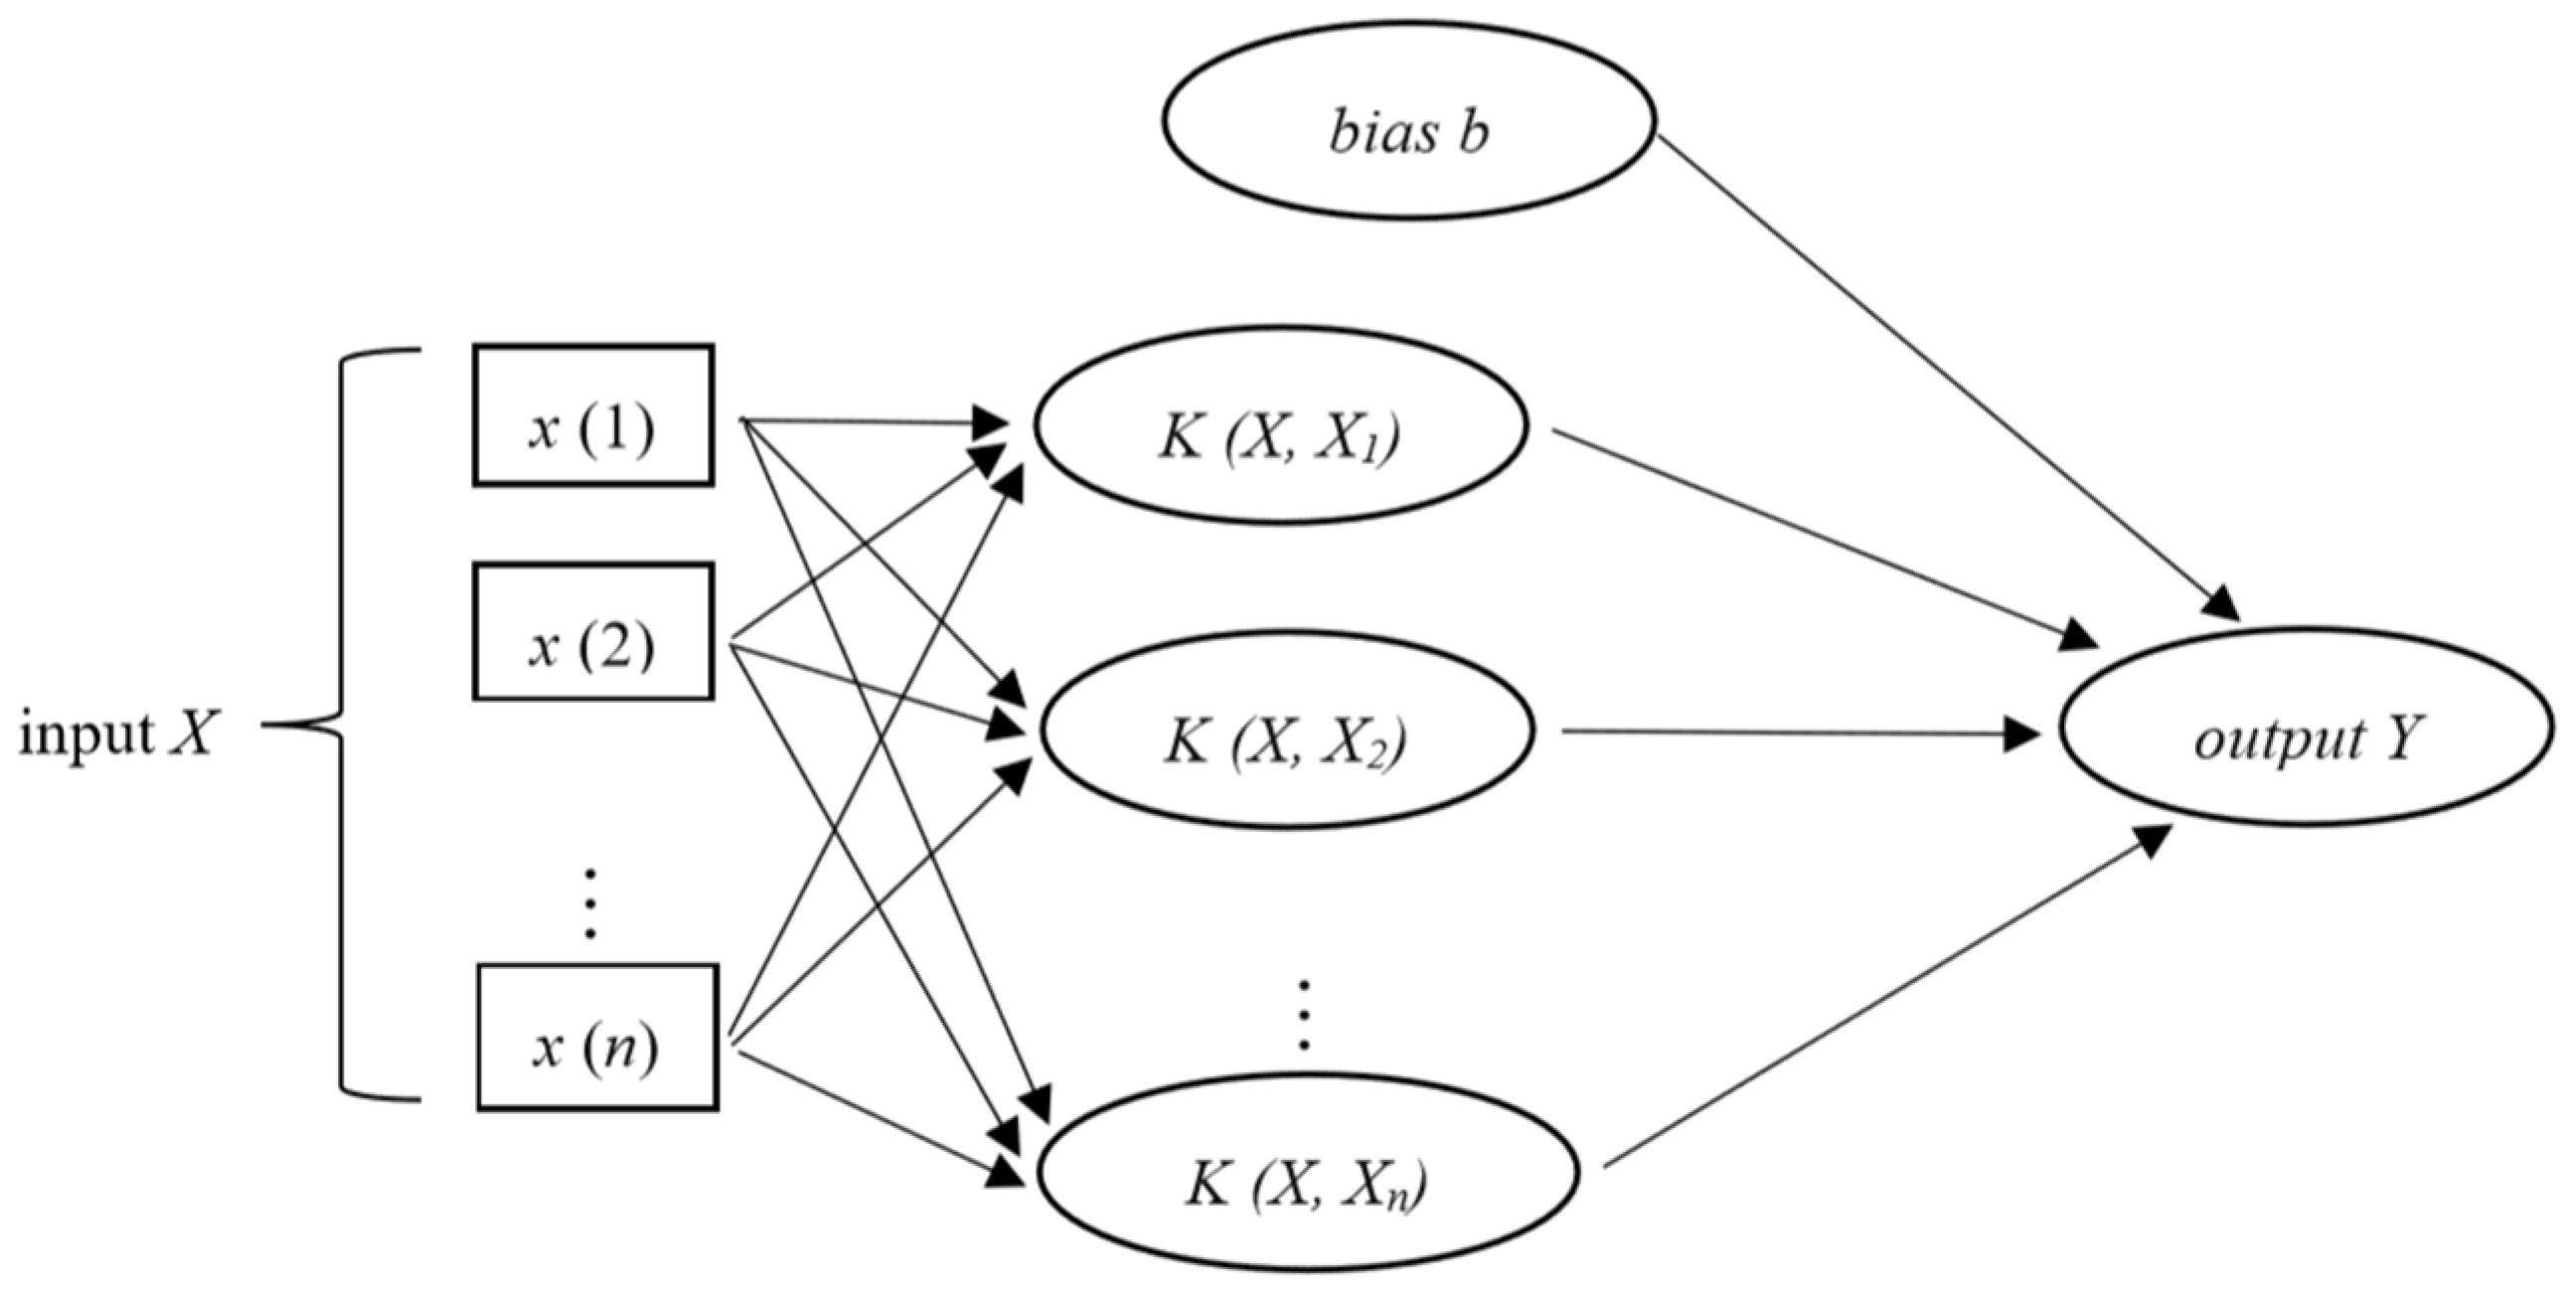
A schematic illustration of the SVM framework is presented in Figure 2. The input vector X represents drilling parameters such as hook load (HL), weight on bit (WOB), and rotation per minute (RPM). The kernel function k and bias b are key parameters obtained during model training, while Y denotes the drilling operation status label. In this study, X corresponds to the real-time logging data collected from drilling operations, and the trained SVM classifier is used to distinguish various operational states automatically. Unlike stochastic learning algorithms such as neural networks, the SVM model used in this study is deterministic given a fixed training dataset and parameter set, ensuring consistent training results without variability across repeated runs.
Figure 2.
The algorithm structure of SVM (adapted from [22]).
2.2. Nonlinear Classification
In 1992, Boser, Guyon, and Vapnik [23] introduced the concept of nonlinear classification by applying kernel functions to transform input data into a higher-dimensional feature space, enabling the separation of nonlinearly separable data. The most commonly used kernel functions are listed below (where t denotes kernel type):
- Linear kernel function: , t = 0;
- Polynomial kernel function: , t = 1;
- Radial basis kernel function: , t = 2;
- Sigmoid kernel function: , for some (not every) and , t = 3.
The kernel function effectively maps input data into a high-dimensional feature space, converting nonlinear classification problems into linear ones (Figure 3). In this work, the RBF kernel was adopted due to its superior performance in handling the complex nonlinearities of drilling log data.
Figure 3.
Kernel Machine (adapted from [23]).
2.3. Pre-Processing
Data pre-processing is a crucial step in improving model generalization and accuracy. It includes outlier detection, missing data imputation, and data normalization. Since drilling data often exhibit large variability and non-stationary behavior, normalization ensures that all variables contribute equally to the model optimization [24].
The normalization process scales all features within a consistent range using the following equations [24]:
For [0, 1] normalization: ;
For [−1, 1] normalization: .
This transformation confines data values within the defined range, improving both numerical stability and model convergence.
2.4. Cross-Validation
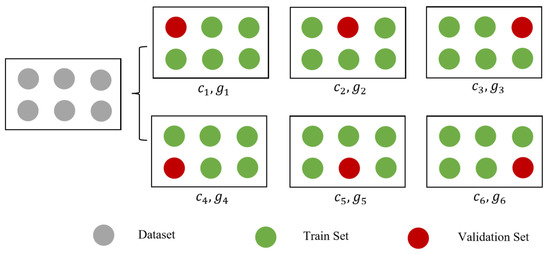
To prevent overfitting and improve generalization, k-fold cross-validation (CV) was employed to optimize SVM parameters [25]. The dataset was divided into k partitions; in each iteration, one subset was used as the validation set while the remaining subsets were used for training. The average classification accuracy across all k runs was used as the final performance metric. The use of six-fold cross-validation ensures that the model performance is evaluated across different data partitions, reducing the influence of data variability and providing a more reliable estimate of the model’s generalization capability.
As shown in Figure 4, a six-fold CV was applied in this study. The final model corresponds to the set of parameters (C, the penalty parameter of the SVM, and γ, the kernel coefficient of the radial basis function) that achieved the highest validation accuracy among all folds. In this study, a grid search strategy was adopted to optimize the key SVM hyperparameters, including the penalty factor C and the kernel parameter γ. The parameter C was selected from a predefined range (e.g., 2−5 to 210), while γ was selected from a similar exponential range. For each combination of (C, γ), six-fold cross-validation was performed, and the parameter set achieving the highest average validation accuracy was selected as the optimal configuration. It should be noted that the current study is based on data from a single well. Although k-fold cross-validation improves the robustness of the model within the dataset, it does not fully capture the variability across different wells or fields, especially under HPHT conditions. Future work will focus on incorporating cross-well datasets to further evaluate the generalization capability of the proposed method. All data processing and model implementation in this study were conducted using MATLAB R2023b (MathWorks, Natick, MA, USA).
Figure 4.
The example of CV (adapted from [25]).
2.5. Data
The dataset used in this research originates from real mud-logging and surface sensor data collected from deep and ultra-deep drilling wells. The HPHT well sections considered in this study are located in deepwater formations in the South China Sea, characterized by complex geological conditions and strong heterogeneity. The well depths are around 4000 m, with bottomhole temperatures close to 180 °C and formation pressure coefficients up to 2.28. These extreme thermodynamic and pressure environments significantly increase the risk of tool failure, drilling fluid degradation, and operational instability, posing substantial challenges for reliable drilling status identification. The key parameters include the following eight drilling-related parameters: Hook Load (HL), Rate of Penetration (ROP), Weight on Bit (WOB), Hook Height (HH), Rotation per Minute (RPM), Torque (TQ), Mud Flow (Q), and Standpipe Pressure (SPP). These parameters were selected based on their physical relevance to drilling operations and their widespread availability in surface logging systems. Specifically, they represent key aspects of drilling dynamics, including mechanical loading (WOB, HL), rotational behavior (RPM, TQ), hydraulic conditions (Q, SPP), and operational state indicators (ROP, HH). These variables are widely recognized as sensitive indicators of drilling condition changes and are commonly used in both field monitoring and data-driven modeling studies. Therefore, they provide a comprehensive and reliable feature set for drilling operation status identification. A total of 33,151 data samples were obtained after preprocessing, including noise filtering and removal of abnormal values. These data points were labeled into nine drilling operation statuses.
These parameters were employed to identify nine representative drilling operation statuses, which comprise six conventional operations and three HPHT-specific abnormal conditions, namely HPHT Circulation Instability (HPHT-CI), Annular Pressure Build-up (APB), and Tool Downhole Thermal Failure (TDF). The inclusion of HPHT conditions reflects the complex, nonlinear, and safety-critical nature of modern deepwater drilling environments (Table 1).
Table 1.
Descriptions of conventional and HPHT drilling operation statuses used for model training.
The distribution of different operation statuses is moderately imbalanced, with sample sizes ranging from 1224 to 7430 across categories. This imbalance reflects the practical characteristics of real drilling operations, where certain states occur more frequently than others. To evaluate the model performance, the dataset was randomly divided into training and testing sets with a ratio of 70% to 30%, respectively. This split ensures that sufficient data are available for model training while maintaining an independent dataset for unbiased evaluation.
The inclusion of HPHT operation statuses enables the SVM-based classification model to handle extreme thermodynamic and mechanical variations, enhancing its robustness in both conventional and ultra-deep drilling scenarios. These HPHT data records were verified with surface logging systems and downhole telemetry to ensure accuracy and consistency across different drilling intervals.
Drilling operations in HPHT environments are governed by thermohydromechanical coupling processes. Variations in temperature and pressure affect drilling fluid properties and mechanical responses, which are reflected in measurable parameters such as standpipe pressure, torque, and rate of penetration. Therefore, although the proposed method is data-driven, it is based on physically meaningful features. Recent studies have highlighted the importance of these coupled processes in HPHT wells [26].
3. Model Development
To achieve higher prediction accuracy in identifying drilling operation statuses, the parameters of the SVM algorithm were carefully optimized. The overall modeling process includes three main steps: normalization method selection, model parameter tuning, and model development.
3.1. Selection of Normalization Method
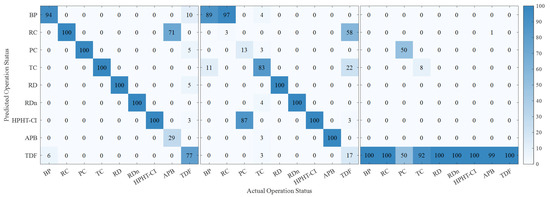
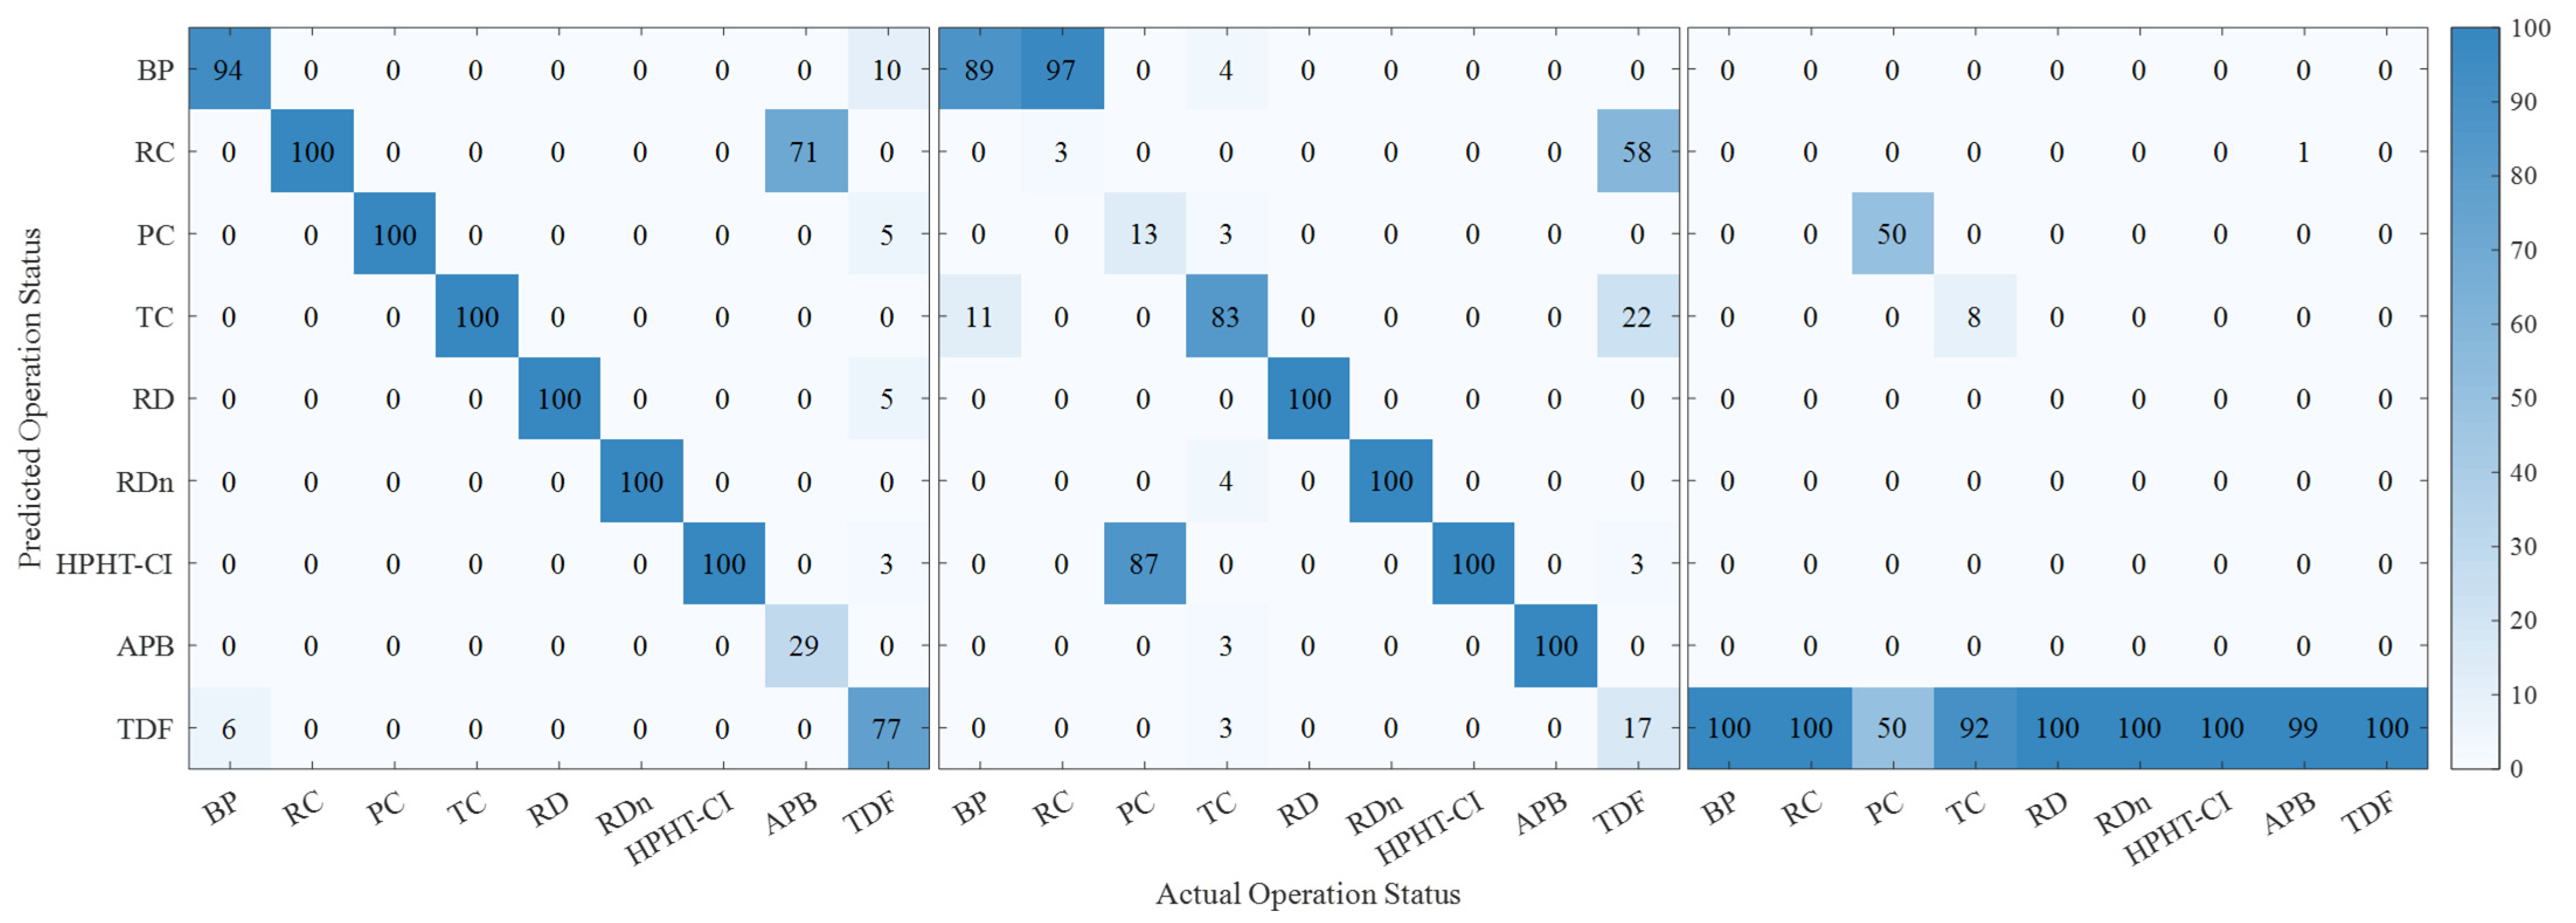
Two normalization approaches, namely the [0, 1] normalization and the [−1, 1] normalization, were evaluated to determine the optimal data scaling strategy. The comparative results are shown in Figure 5, where the blue circles represent the actual test set classifications and the red points represent the predicted results.
Figure 5.
Confusion matrix illustrating the classification performance of the SVM model for nine drilling operation statuses under (left) [0, 1] normalization; (middle) [−1, 1] normalization; and (right) without normalization. Results are based on model parameters s = 0 and t = 2, as discussed in Section 3.2. Abbreviations correspond to Table 1.
The classification accuracies on the test set for the three normalization methods are as follows: 88.89% for [0, 1] normalization, 67.22% for [−1, 1] normalization, and 17.56% without normalization. The [0, 1] normalization achieved the highest accuracy, indicating its superior capability in stabilizing feature scaling and improving convergence performance. This is because scaling features to a consistent range helps reduce the dominance of variables with large magnitudes and improves the effectiveness of the SVM decision boundary. Therefore, the [0, 1] normalization method was adopted in this study for data preprocessing.
3.2. Selection of Model Parameters
Beyond data normalization, tuning the SVM parameters is essential to enhance model robustness. Two key parameters were examined:
- s: SVM type parameter (0 = C-SVM, 1 = ν-SVM);
- t: Kernel type parameter (0 = linear, 1 = polynomial, 2 = Gaussian radial basis, 3 = sigmoid).
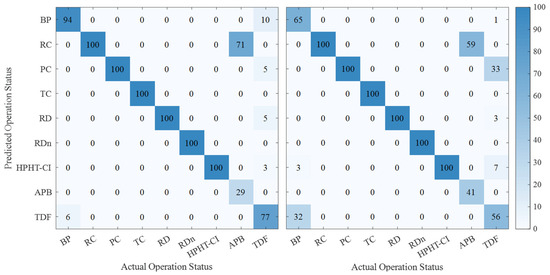
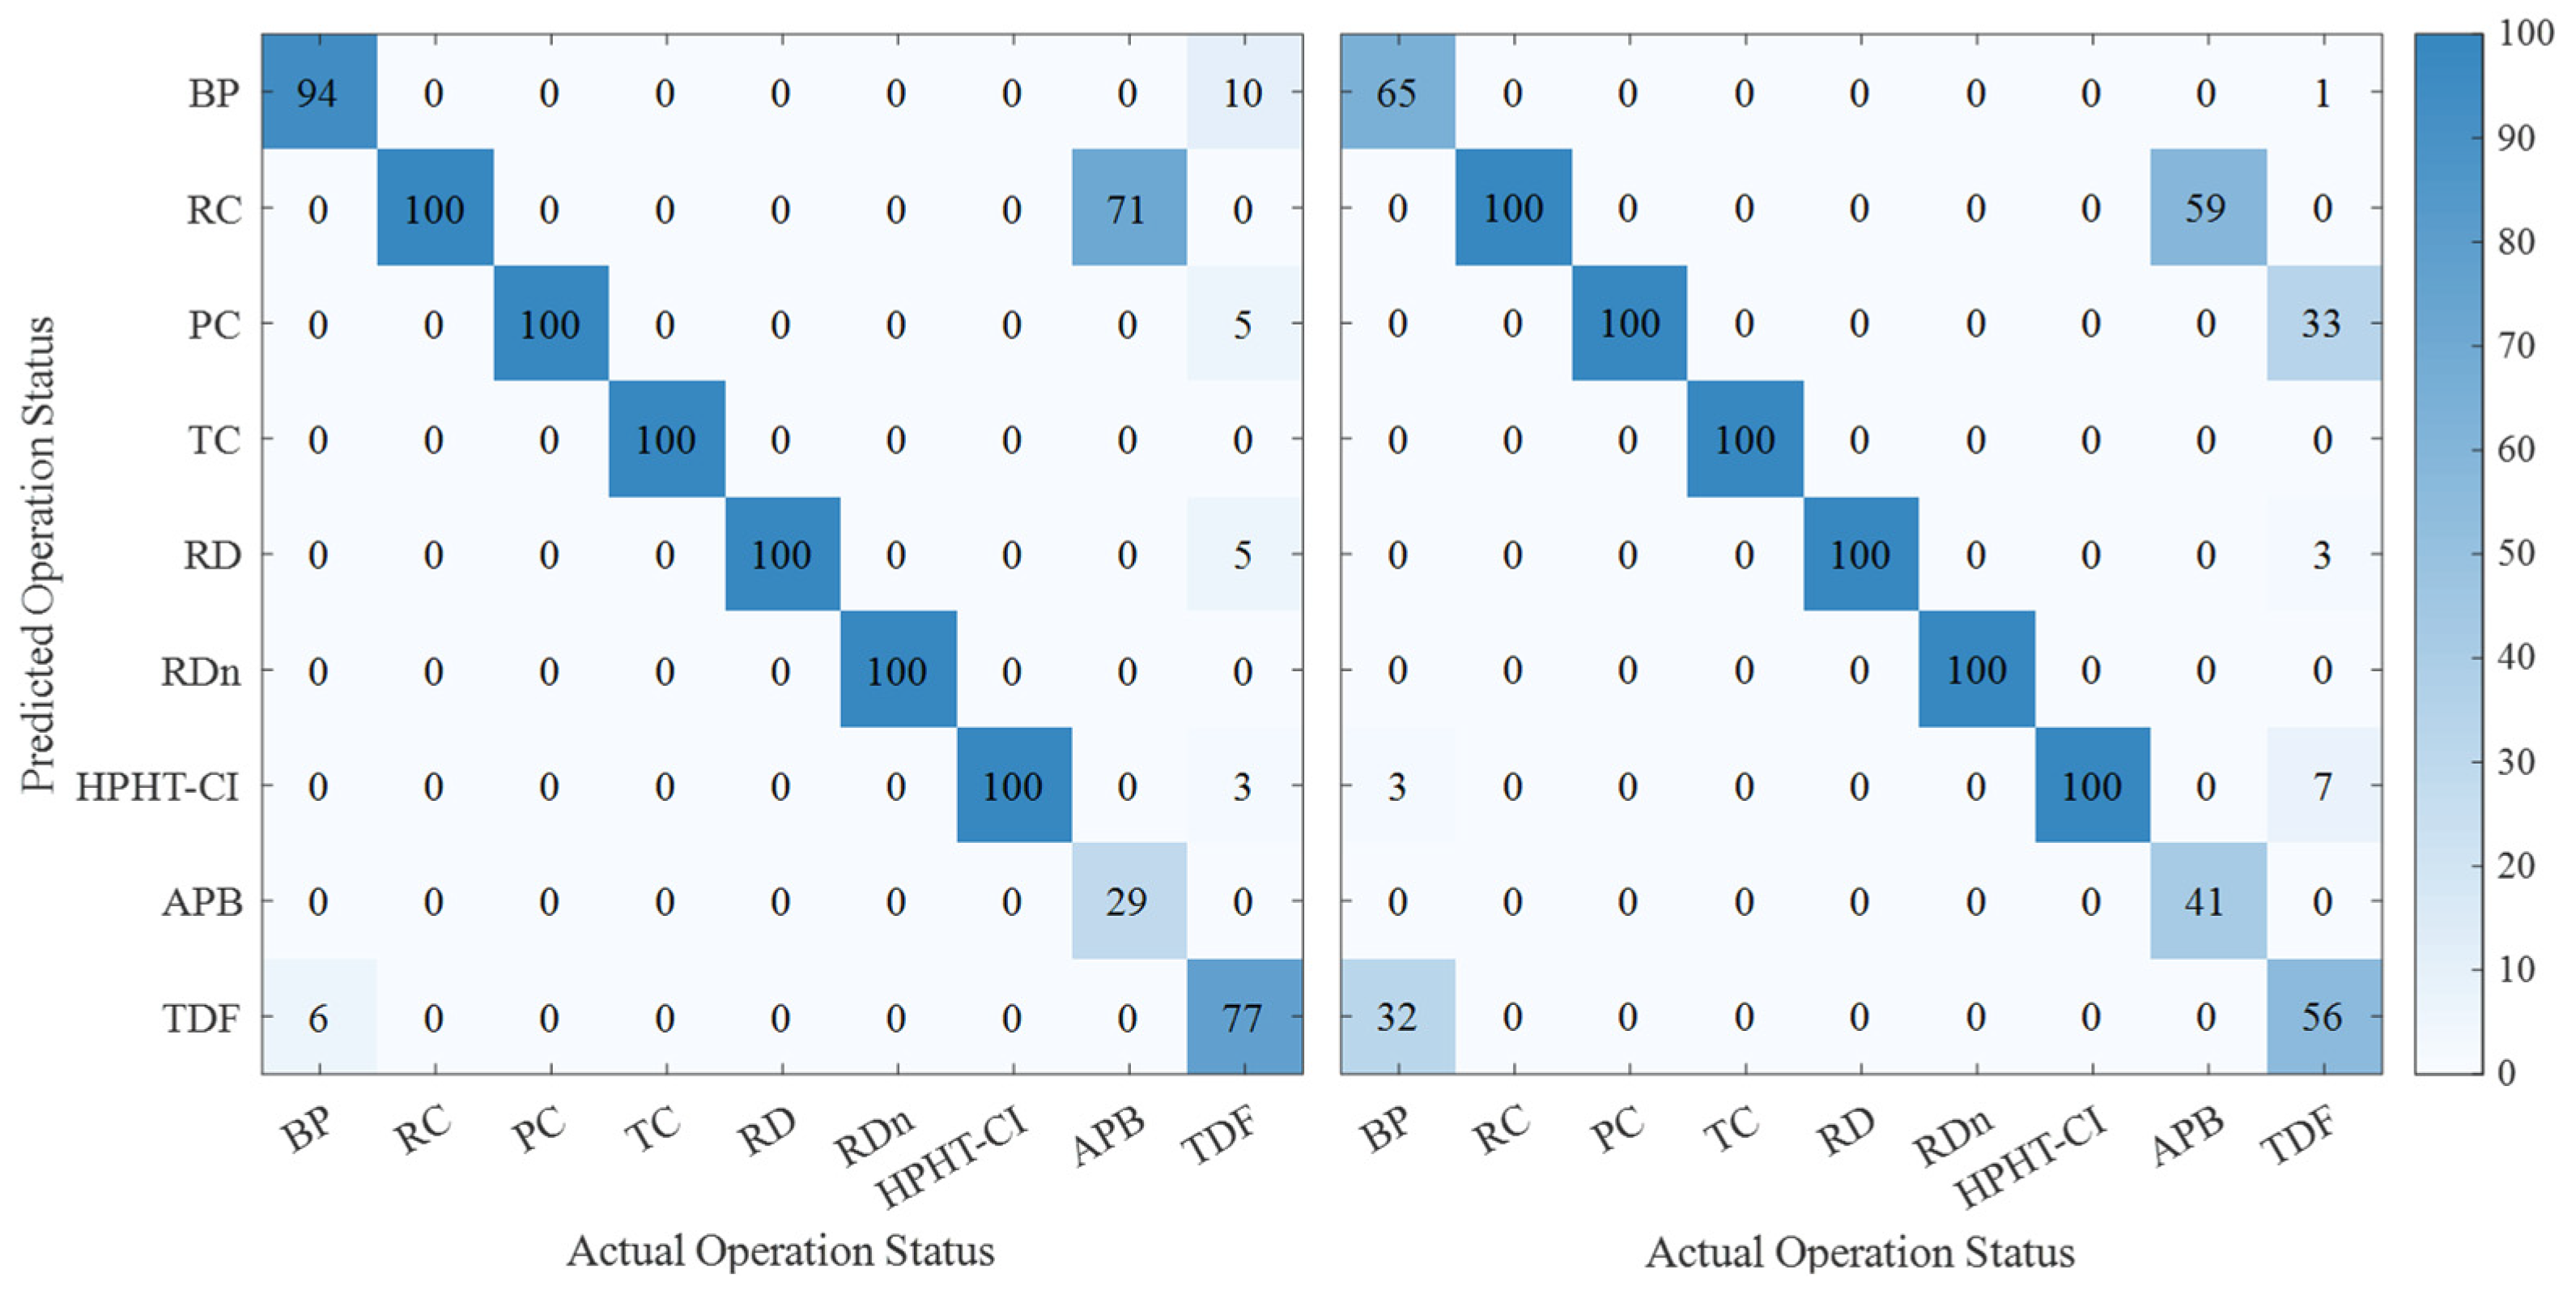
The effect of the parameter s on model performance is illustrated in Figure 6.
Figure 6.
Confusion matrix illustrating the classification performance of the SVM model for nine drilling operation statuses under (left) s = 0; (right) s = 1. Results are based on [0, 1] normalization and t = 2. Abbreviations correspond to Table 1.
The model achieved accuracies of 88.89% and 84.67% for s = 0 and s = 1, respectively. Hence, the C-SVM (s = 0) was selected as the optimal model type due to its better generalization capability.
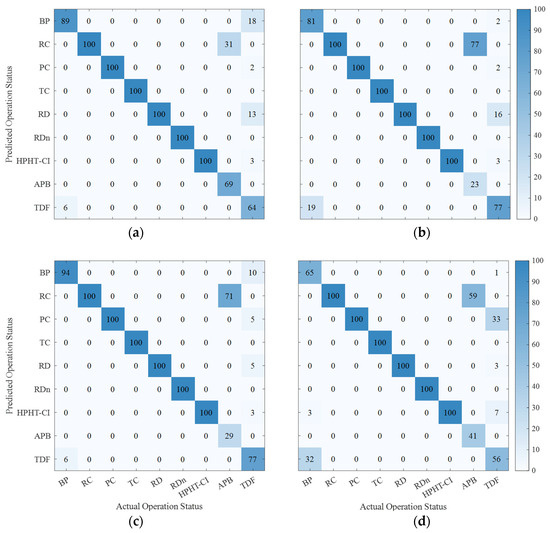
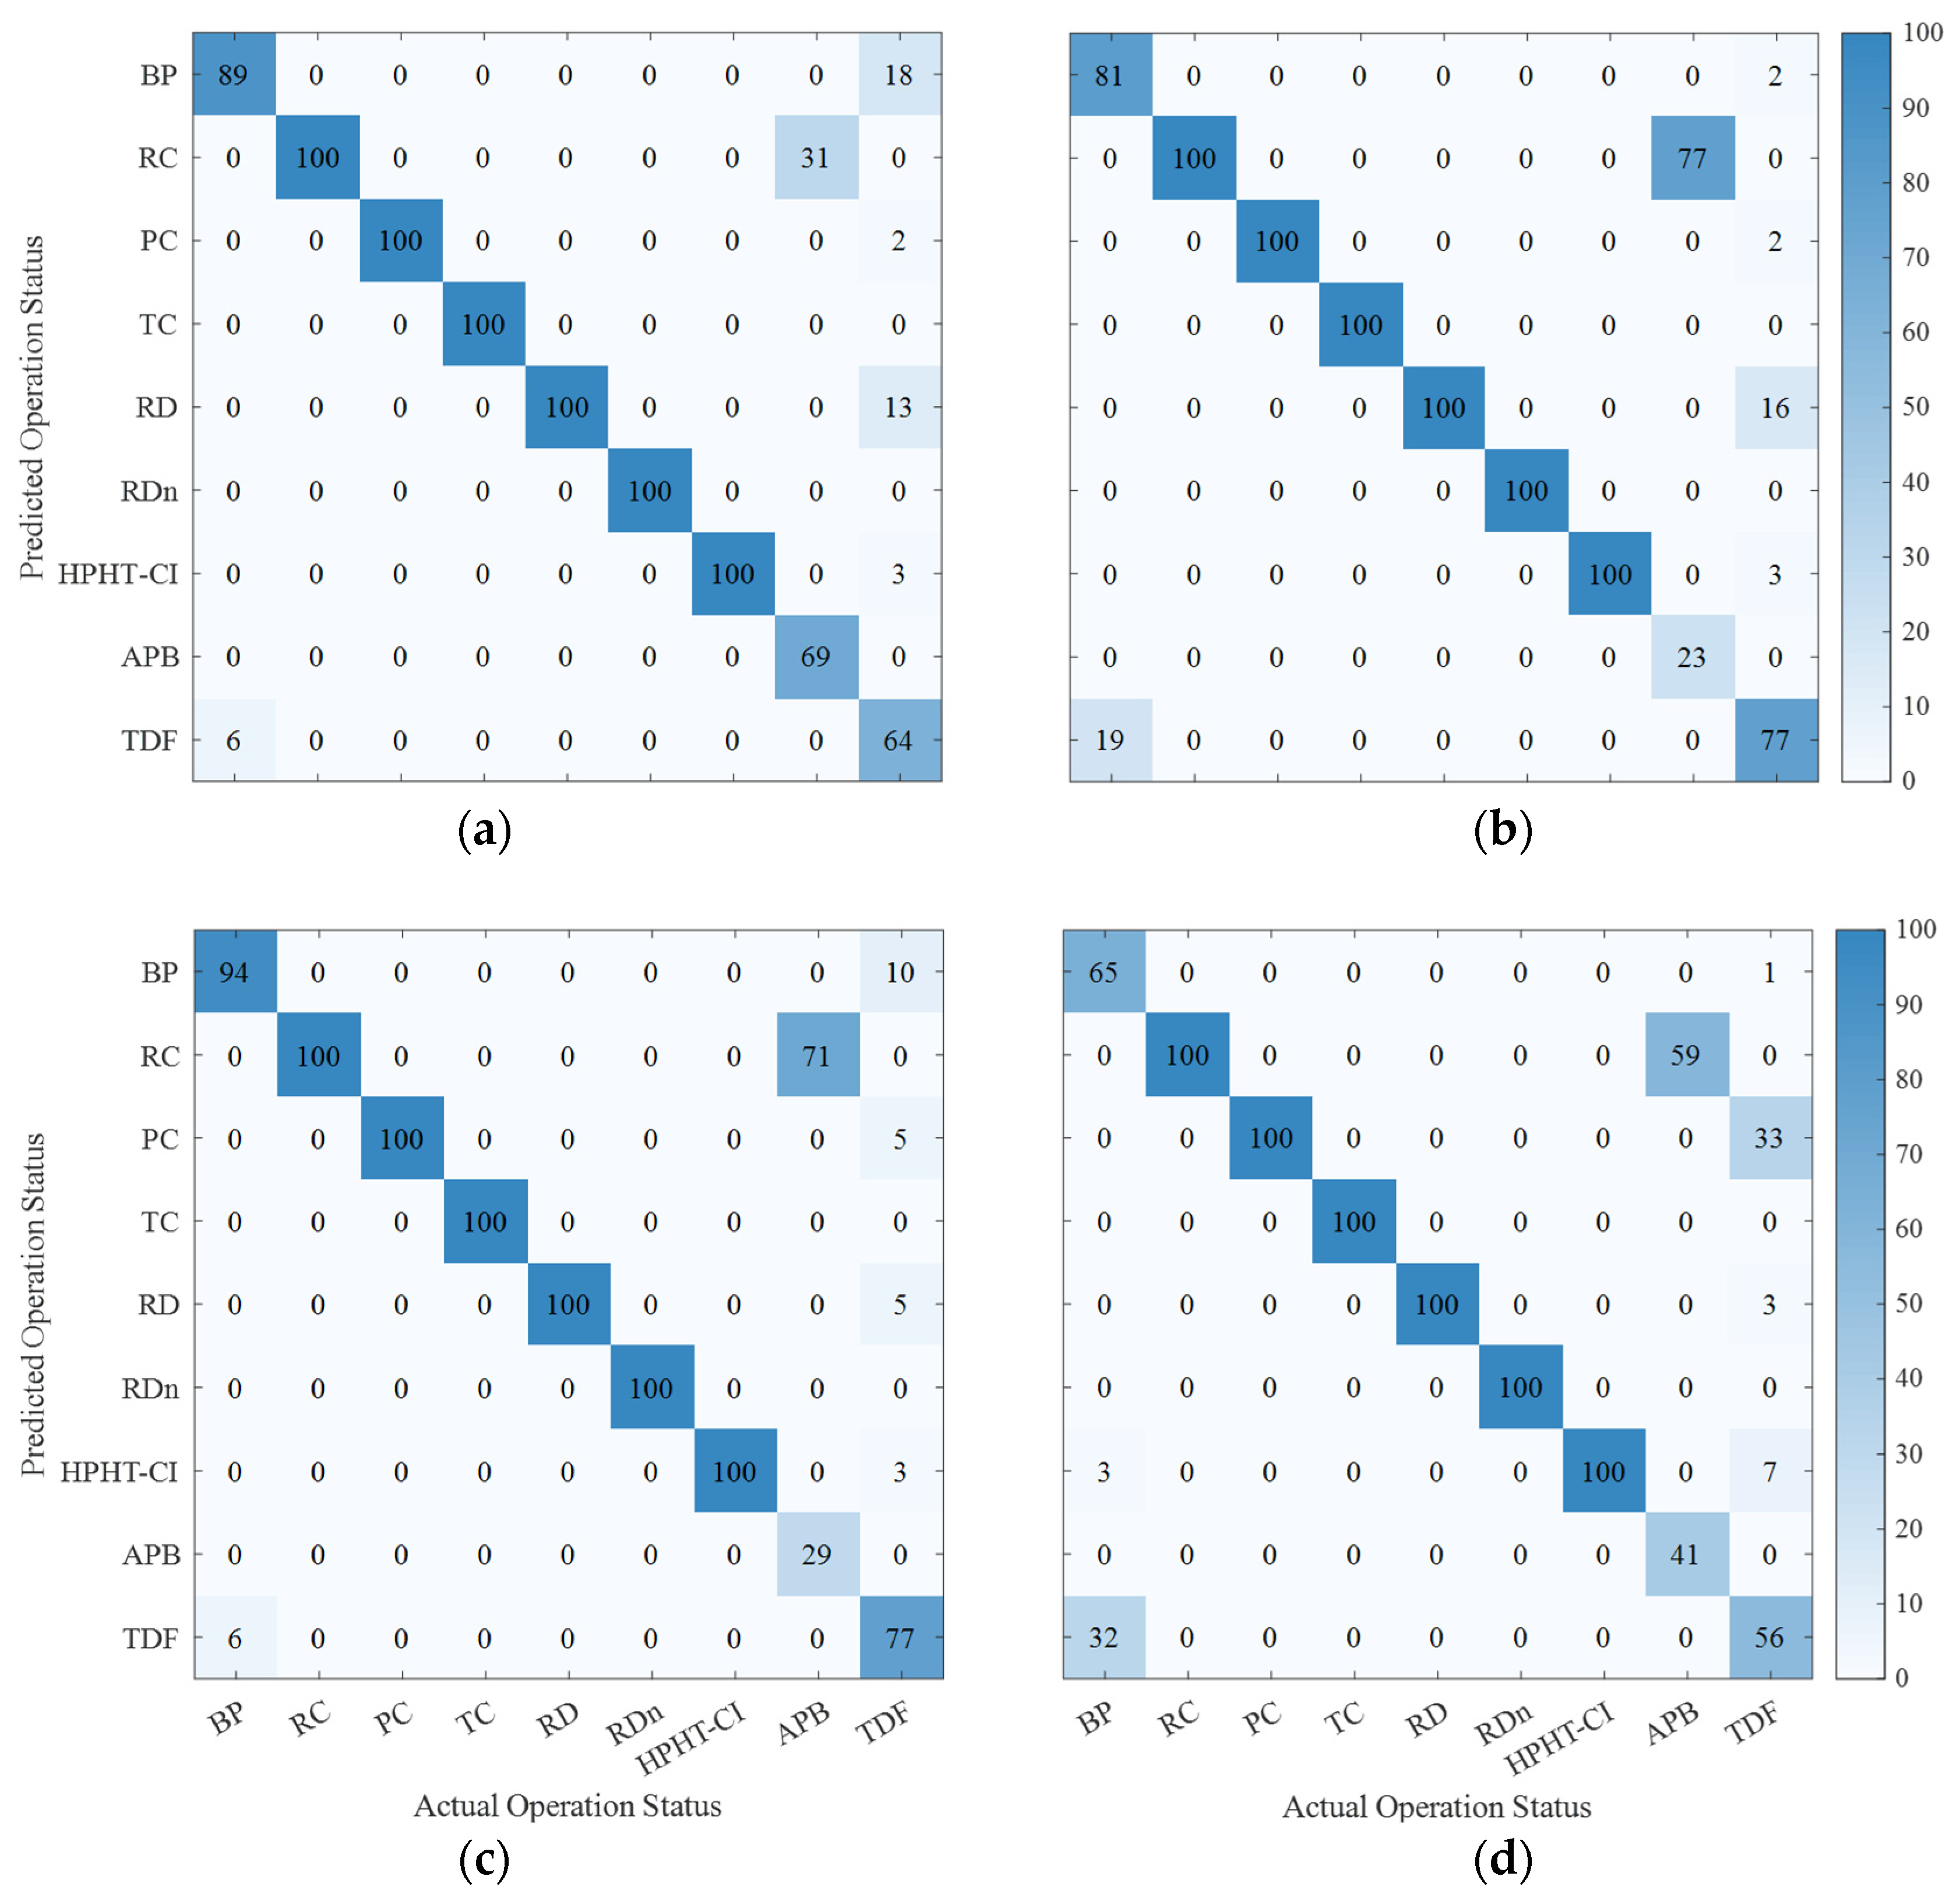
The influence of kernel type t is shown in Figure 7.
Figure 7.
Confusion matrix illustrating the classification performance of the SVM model for nine drilling operation statuses under (a) t = 0; (b) t = 1; (c) t = 2; (d) t = 3. Results are based on [0, 1] normalization and s = 0. The abbreviations correspond to those defined in Table 1.
The corresponding accuracies were 91.33% (linear), 86.78% (polynomial), 88.89% (RBF), and 31.67% (sigmoid). Therefore, the linear kernel function (t = 0) was adopted as the final kernel for this study.
3.3. Model Development and Validation
A total of 9000 data samples were used for model construction. Among them, 8100 samples were used for training, and 900 samples were used for model validation. Each data instance contained a feature vector composed of the main drilling parameters (e.g., Hook Load, Weight on Bit, Torque, Rate of Penetration, etc.) and a corresponding operation status label. The overall identification accuracy reached 91.33% (822 out of 900 samples). The model demonstrates strong recognition capability.
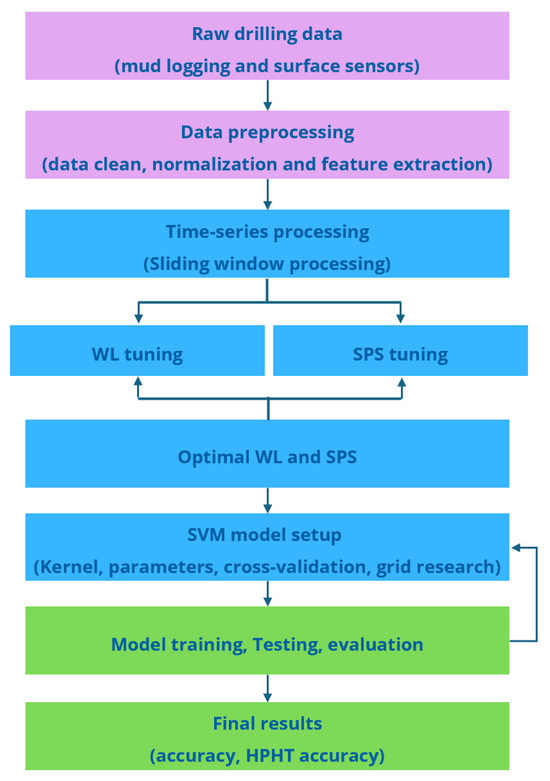
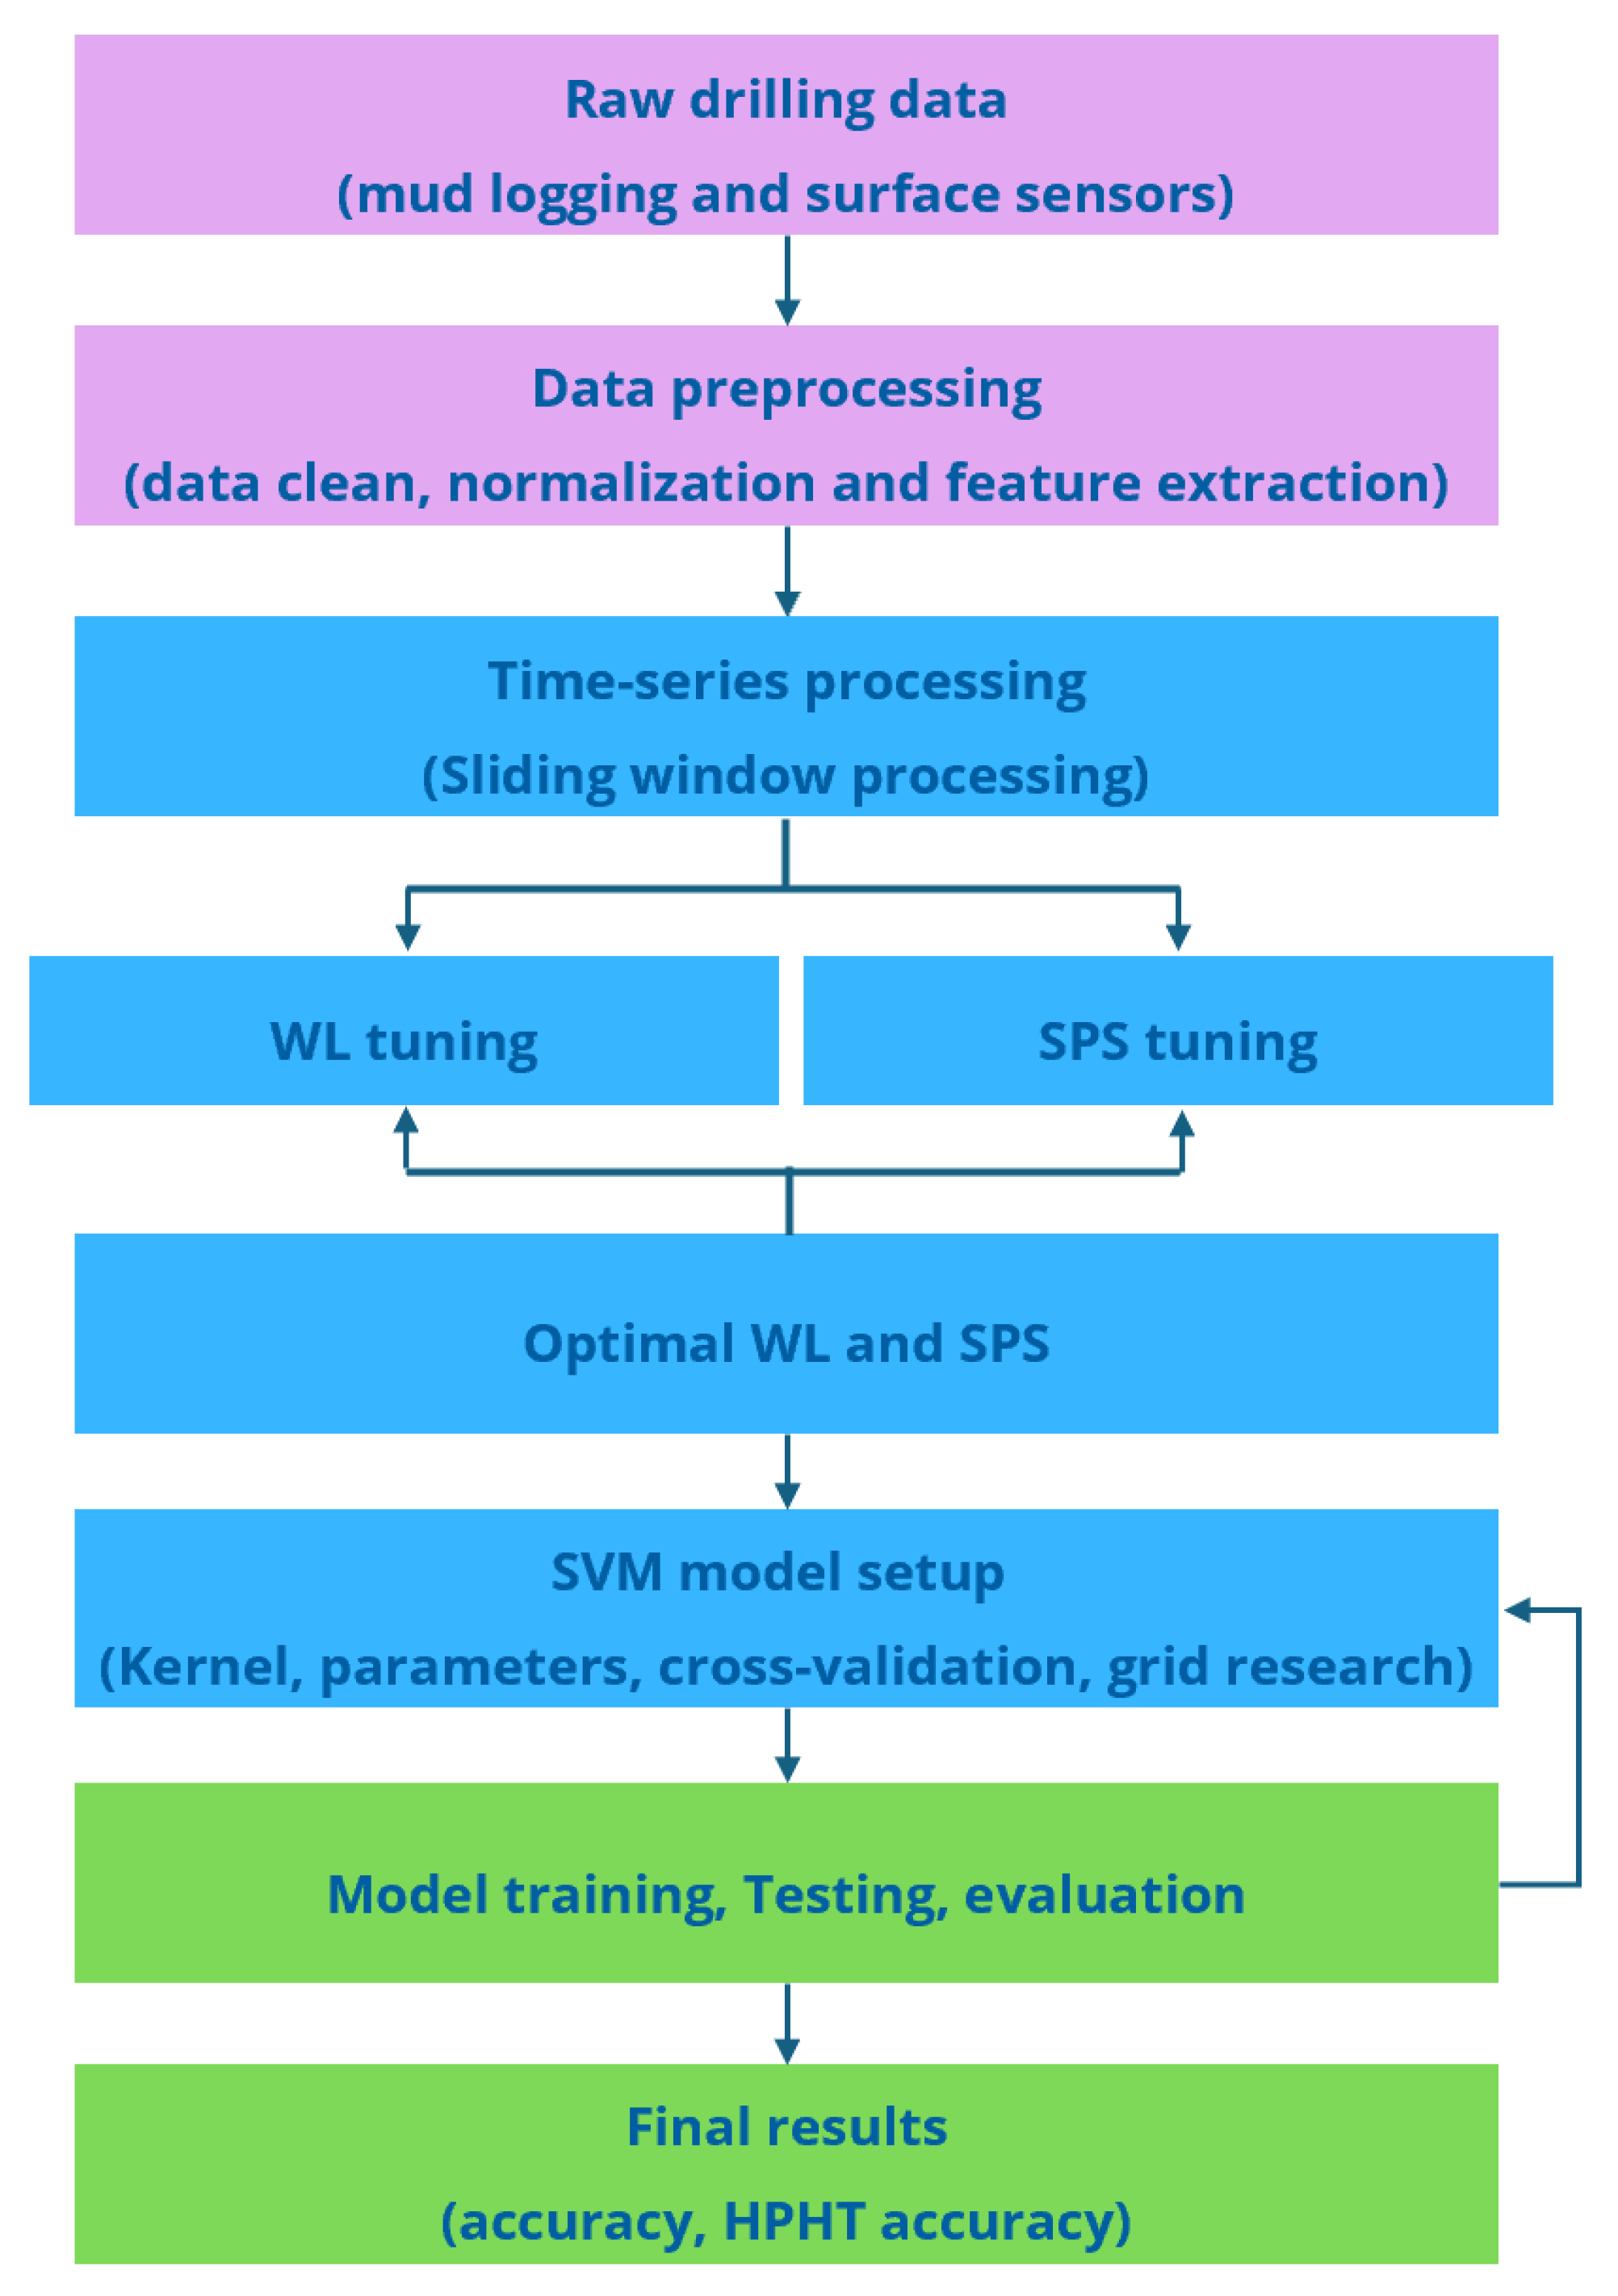
After normalization and iterative model training, the SVM classifier output the predicted operation status for each test sample. Model accuracy was assessed by comparing predicted labels with the actual operation records. The overall workflow of the SVM-based recognition process is summarized in Figure 8. The workflow has been reorganized into a modular structure to clearly illustrate the data processing, model optimization, and time-series enhancement steps, with particular emphasis on the proposed sliding window-based optimization strategy.
Figure 8.
Flowchart of the SVM-based drilling operation recognition process.
4. Optimization of the Time Series for Operation Status Identification
In the study of drilling operation status identification, two key factors are crucial to achieving higher classification accuracy:
- (1)
- optimization of the model architecture;
- (2)
- effective processing of input time-series data.
Although these aspects have been discussed in the previous sections, a persistent challenge remains—how to distinguish between fluctuations in parameters caused by random data noise (“false status changes”) and actual variations that indicate a true change in drilling operation. Traditionally, the identification of drilling operation status relied heavily on human expertise and manual interpretation of parameter trends, which inevitably introduces subjectivity, inconsistency, and uncertainty.
From the observation of the dataset used in this study, the sampling interval is 6 s, meaning that each drilling parameter (such as standpipe pressure, torque, and hook load) is recorded every six seconds. When fluctuations occur between two adjacent sampling points, conventional programming or machine learning methods tend to misinterpret these as transitions between operation statuses. However, in actual drilling processes, operational changes cannot occur so frequently or instantaneously. This discrepancy leads to false identifications and reduced reliability of the classification model.
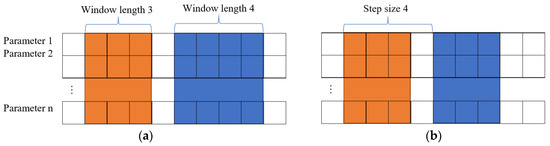
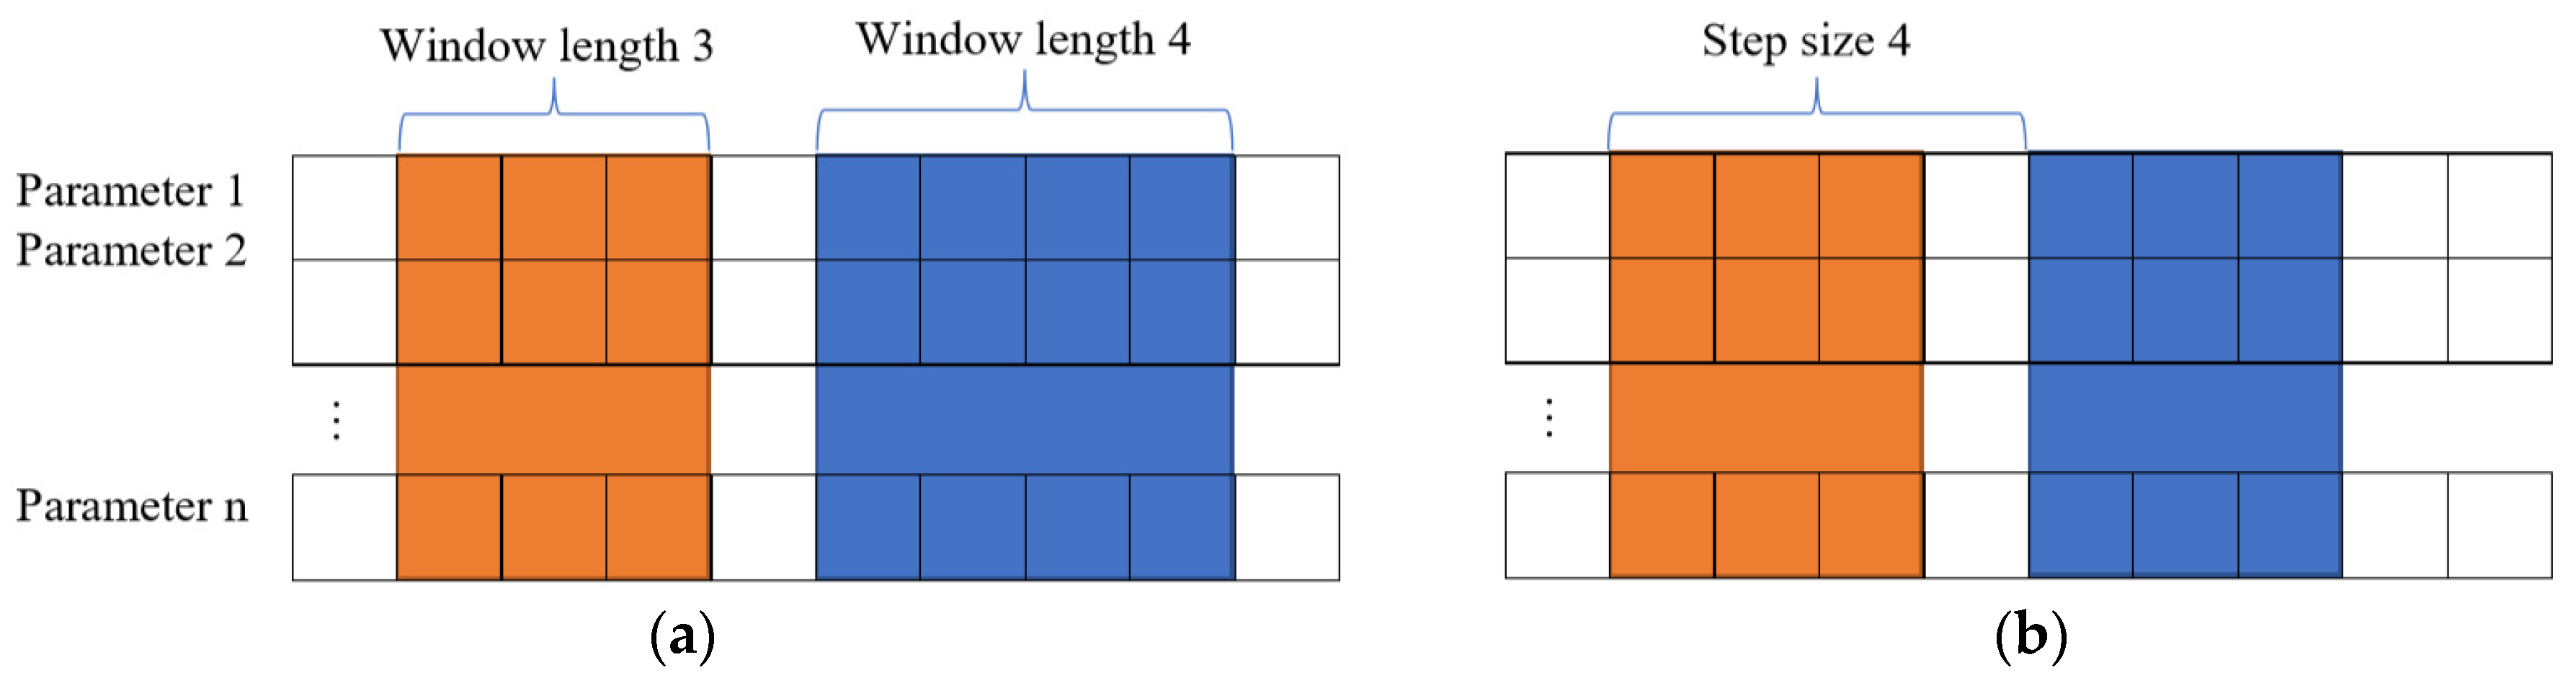
To overcome this problem, a time-domain optimization strategy based on the Sliding Window (SW) method was introduced. The sliding window method is introduced to address the mismatch between high-frequency data sampling and the actual time scale of drilling operations. By aggregating consecutive samples, it suppresses short-term fluctuations and highlights sustained trends, thereby reducing false identification of operation status transitions. This is particularly important in drilling processes, where operational changes occur over a finite duration rather than instantaneously. This provides a practical and effective solution for improving the reliability of operation status identification in HPHT drilling environments. The sliding window aggregates consecutive parameter values within a defined time frame, allowing the model to capture the dynamic trend of the operation instead of transient noise. The number of sampling points included in the window is defined as the Window Length (WL), while the distance the window moves each time is termed the Step Size (SPS). Figure 9 shows the example of WL and SPS.
Figure 9.
The example of (a) window length (WL) and (b) step size (SPS).
To examine the influence of WL and SPS on classification accuracy, a series of controlled experiments were performed. In the first group of tests, SPS was fixed at 1, and WL varied from 1 to 6. The results of these six cases are summarized in Table 2.
Table 2.
Identification accuracy under different window length (WL) values.
The results show that classification accuracy initially increases with WL, reaching the maximum when WL = 4, after which it gradually decreases or stabilizes as WL continues to grow. Meanwhile, computational time rises proportionally with the increase in WL. Therefore, considering both accuracy and efficiency, WL = 4 is identified as the optimal window length, achieving the maximum classification accuracy of 95.22%. The sampling interval in this study is 6 s; therefore, WL = 4 corresponds to a time span of 24 s. This time scale is consistent with the typical duration of drilling operation transitions, which generally occur over tens of seconds rather than instantaneously. As a result, the selected window length effectively captures meaningful operational changes while filtering out short-term fluctuations caused by noise.
After determining the optimal WL, the Step Size (SPS) was further analyzed to improve temporal sensitivity. The SPS was set to 1, 2, 3, and 4, respectively, while keeping WL constant at 4. The results of the four tests are summarized in Table 3.
Table 3.
Identification accuracy under different step size (SPS) values.
As seen in Table 3, increasing the step size (SPS) leads to a significant decrease in classification accuracy, and classification accuracy decreases as SPS increases, indicating that smaller step sizes are more effective in capturing true operational transitions. Therefore, SPS = 1 was selected as the optimal configuration. This corresponds to updating the window every 6 s, ensuring high temporal resolution and enabling the model to capture gradual transitions in drilling operation states effectively.
The key model parameters and their corresponding optimization ranges and final selected values are summarized in Table 4 to improve clarity and reproducibility.
Table 4.
Summary of model optimization parameters.
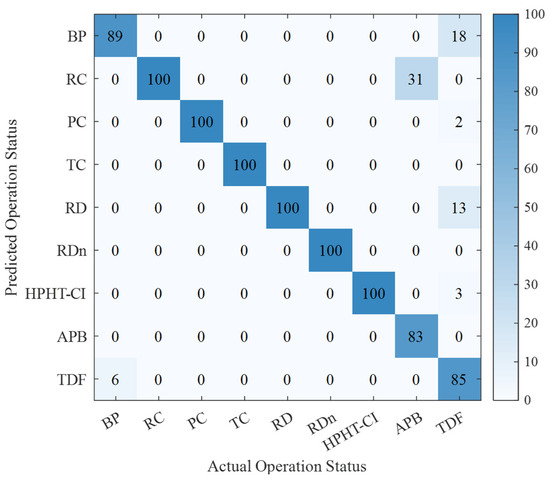
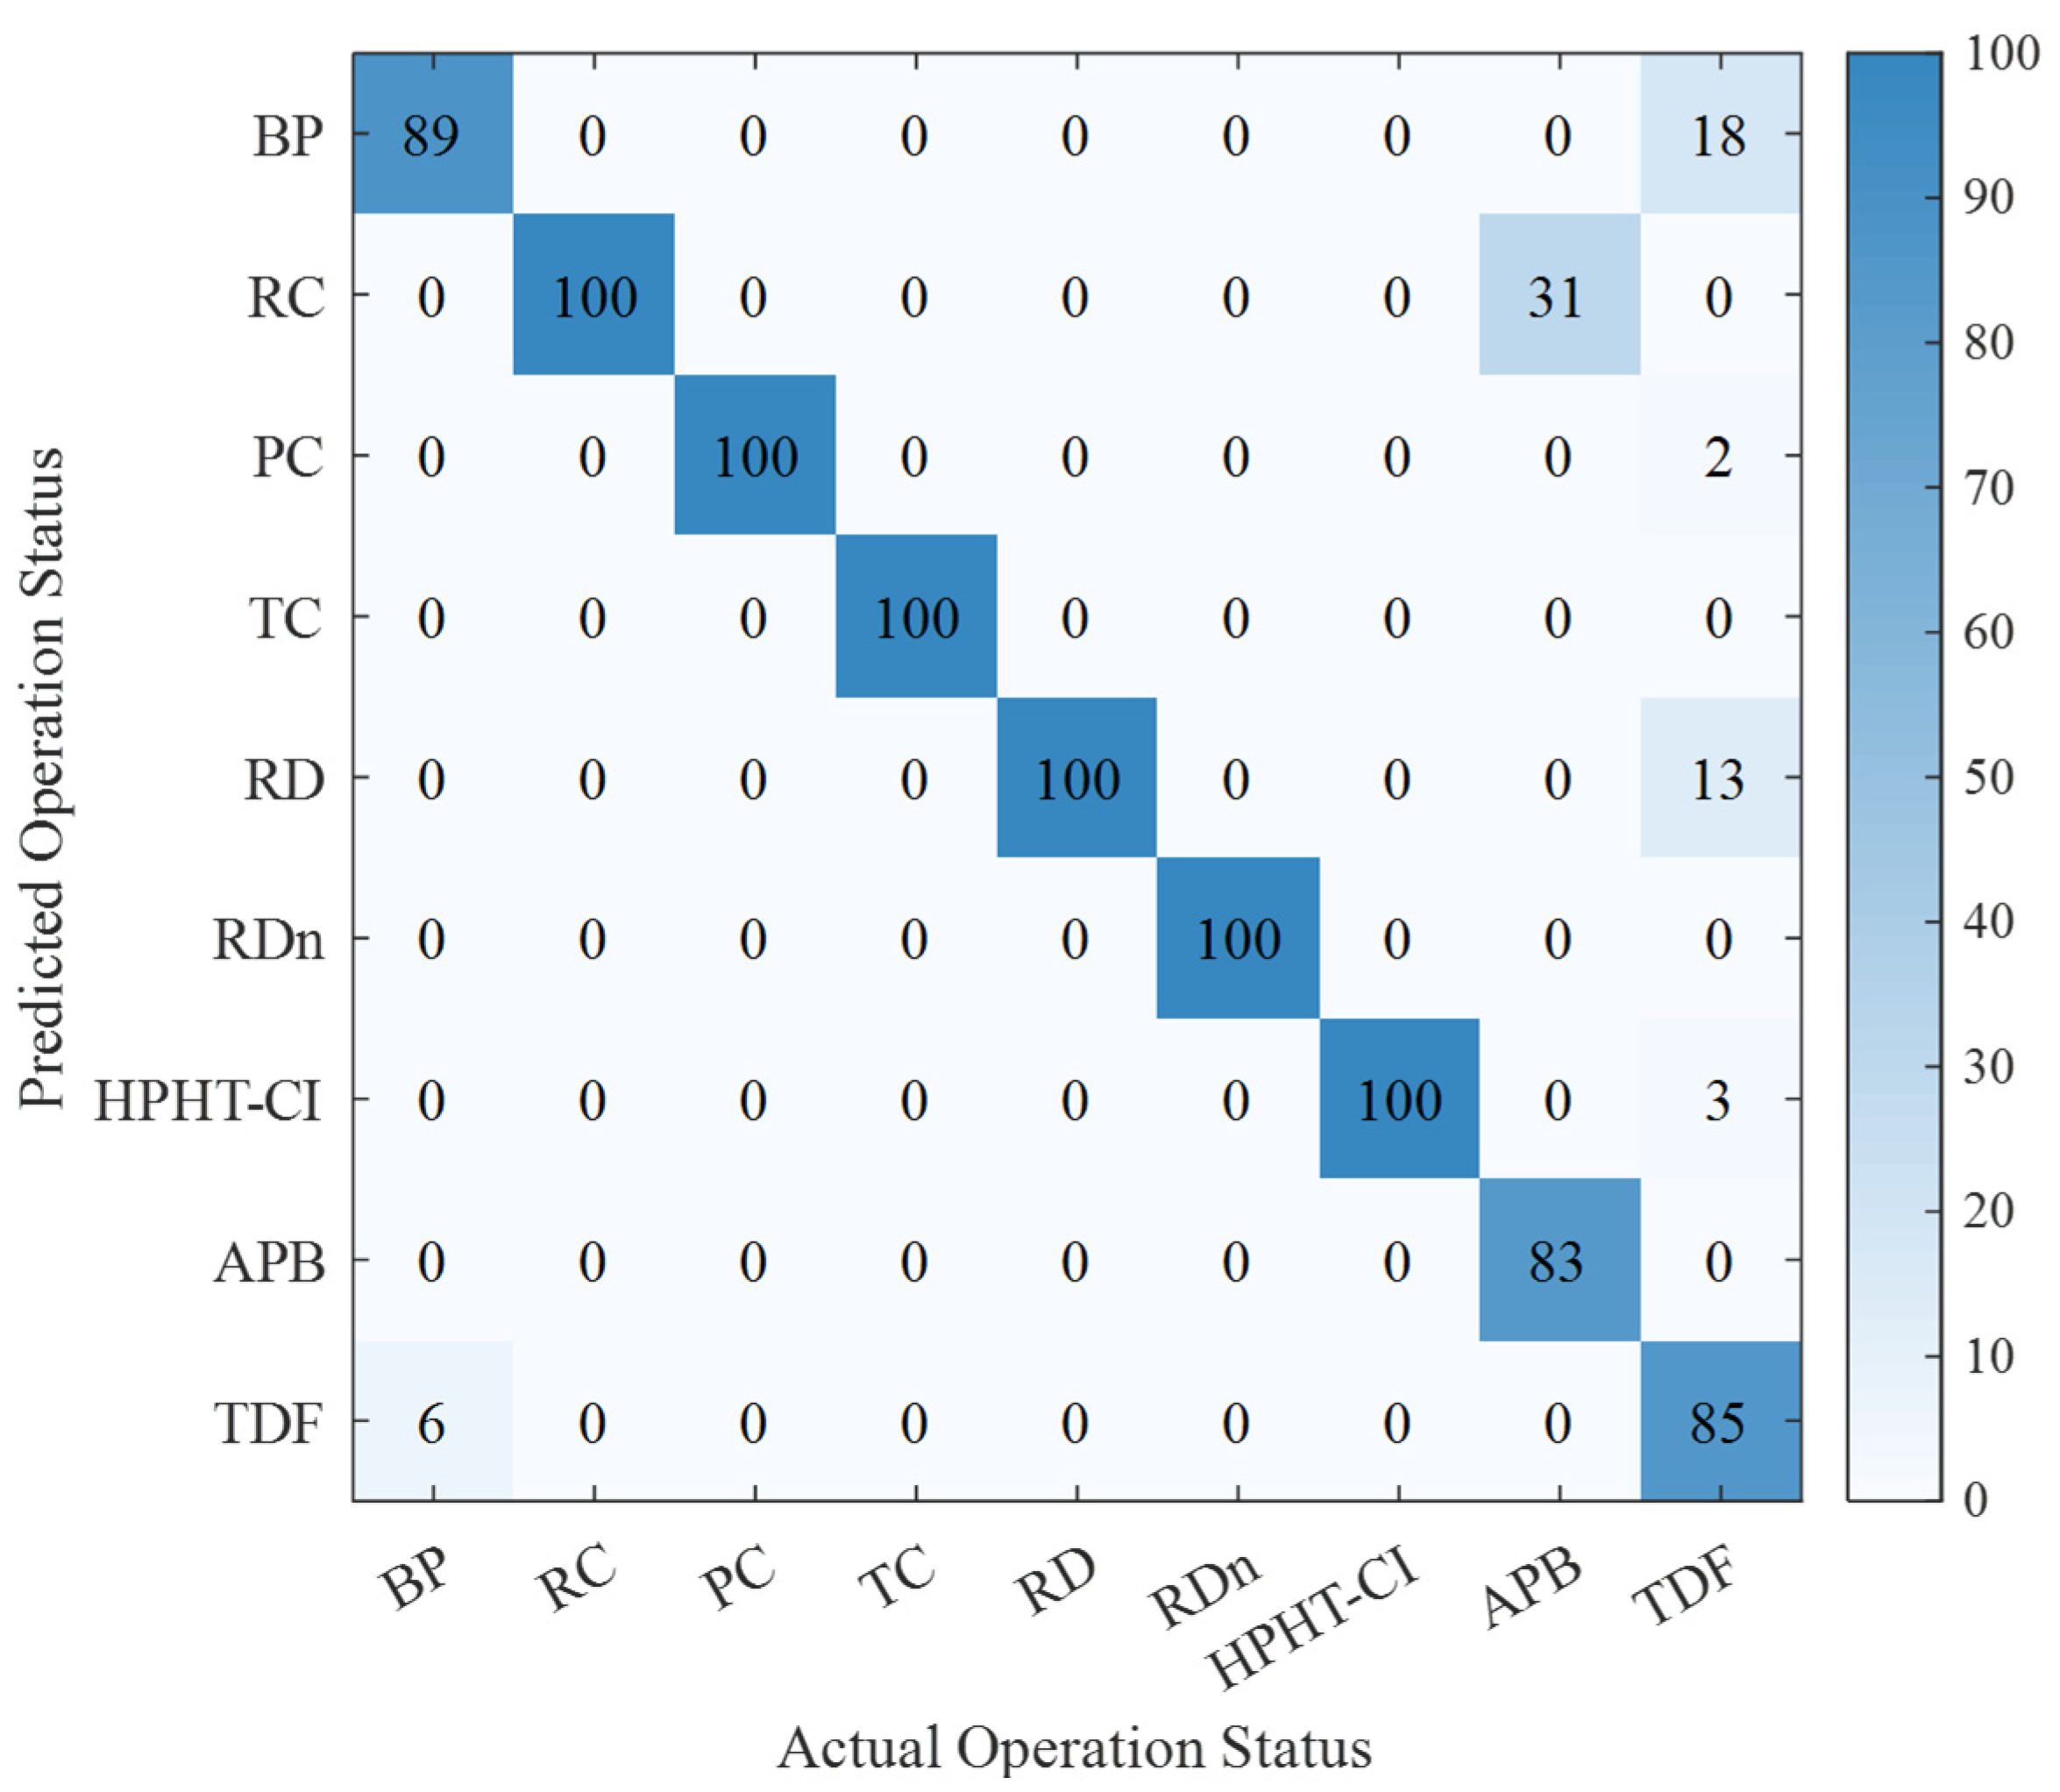
The final classification results are illustrated in Figure 10. The results demonstrate that incorporating WL and SPS optimization significantly improved the overall prediction accuracy—from 91.33% to 95.22%—particularly enhancing the recognition precision of ultra-deep and HPHT (High-Pressure High-Temperature) operation conditions (from 77.67% to 89.33%). This confirms that the proposed time-domain optimization method effectively filters out noise-induced fluctuations and enhances the robustness of operational state recognition under complex drilling environments. The final overall classification accuracy reaches 95.22%, while the classification accuracy for HPHT-related conditions reaches 89.33%.
Figure 10.
Confusion matrix illustrating the classification performance of the SVM model for nine drilling operation statuses under optimal parameters (WL = 4, SPS = 1). The abbreviations correspond to those defined in Table 1.
5. Conclusions
This study developed an optimized Support Vector Machine (SVM)-based framework for accurately identifying drilling operation statuses under ultra-deepwater high-pressure and high-temperature (HPHT) conditions. The model effectively addresses the challenge of distinguishing true operational transitions from pseudo-fluctuations caused by random noise or sensor instability in complex offshore drilling environments.
Through comprehensive parameter optimization, it was determined that the combination of the [0, 1] normalization method, C-SVM model type, and linear kernel function yields the highest recognition accuracy of 91.33%. This configuration improves the model’s generalization performance and stability within the studied dataset, enabling it to effectively capture nonlinear variations in drilling parameters caused by HPHT conditions. By improving the accuracy and timeliness of drilling operation status identification, the proposed method contributes to reducing non-productive time (NPT), which can lead to lower operational costs, improved drilling efficiency, and enhanced safety by enabling faster detection of abnormal conditions.
To further improve temporal recognition performance, a sliding window (WL) and step size (SPS) optimization strategy was introduced. Results demonstrated that with WL = 4 and SPS = 1, the model achieved an overall identification accuracy of 95.22%, compared to the baseline of 91.33%. Moreover, for HPHT-related operations—characterized by strong thermal–pressure coupling and signal volatility—the classification accuracy improved remarkably from 77.67% to 89.33%, highlighting the enhanced adaptability of the optimized model to extreme environmental conditions.
These findings indicate that temporal optimization and parameter tuning play a crucial role in improving the robustness and reliability of data-driven recognition models for offshore drilling. The improved SVM-based framework reduces human-induced uncertainty, improves real-time recognition efficiency, and provides a valuable technical reference for intelligent monitoring and decision support in HPHT drilling operations. Future work will focus on integrating deep learning architectures and multi-source data fusion to achieve adaptive recognition and prediction in more dynamic ultra-deepwater drilling environments.
Author Contributions
Conceptualization, Y.Z. and T.S.; methodology, Y.Z.; software, Y.Z.; validation, Y.Z., Y.C. and W.W.; formal analysis, Y.Z.; resources, T.S.; data curation, Y.Z.; writing—original draft preparation, Y.Z.; writing—review and editing, Y.Z., T.S., Y.C. and W.W.; visualization, T.S., Y.C. and W.W.; funding acquisition, Y.Z. All authors have read and agreed to the published version of the manuscript.
Funding
Supported by Science Foundation of China University of Petroleum, Beijing (No. 2462025YJRC039).
Data Availability Statement
The original contributions presented in this study are included in the article. Further inquiries can be directed to the corresponding author.
Conflicts of Interest
Author Wenxing Wang was employed by the CNOOC International Limited. The remaining author declares that the research was conducted in the absence of any commercial or financial relationships that could be construed as a potential conflict of interest.
Abbreviations
The following abbreviations are used in this manuscript:
| SVM | Support vector machine |
| ML | Machine learning |
| CV | Cross-validation |
| HL | Hook Load |
| ROP | Rate of Penetration |
| WOB | Weight on Bit |
| HH | Hook Height |
| RPM | Rotation per Minute |
| TQ | Torque |
| Q | Mud Flow |
| SPP | Standpipe Pressure |
| SW | Sliding window |
| WL | Window length |
| SPS | Step size |
References
- The Defining Series: HPHT Wells. Available online: https://www.slb.com/resource-library/oilfield-review/defining-series/defining-hpht (accessed on 10 February 2026).
- Gao, Y.; Yu, X.; Su, Y.; Yin, Z.; Wang, X.; Li, S. Intelligent Identification Method for Drilling Conditions Based on Stacking Model Fusion. Energies 2023, 16, 883. [Google Scholar] [CrossRef] [Scilit]
- Yang, X.; Zhang, Y.; Zhou, D.; Ji, Y.; Song, X.; Li, D.; Zhu, Z.; Wang, Z.; Liu, Z. Drilling Conditions Classification Based on Improved Stacking Ensemble Learning. Energies 2023, 16, 5747. [Google Scholar] [CrossRef] [Scilit]
- Zhong, R.; Salehi, C.; Johnson, R. Machine Learning for Drilling Applications: A Review. J. Nat. Gas Sci. Eng. 2022, 108, 104807. [Google Scholar] [CrossRef] [Scilit]
- Anifowose, F.; Mezghani, M.; Badawood, S.; Ismail, J. Contributions of Machine Learning to Quantitative and Real-Time Mud Gas Data Analysis: A Critical Review. Appl. Comput. Geosci. 2022, 16, 100095. [Google Scholar] [CrossRef] [Scilit]
- Lashari, S.E.Z.; Takbiri-Borujeni, A.; Fathi, E.; Sun, T.; Rahmani, R.; Khazaeli, M. Drilling Performance Monitoring and Optimization: A Data-Driven Approach. J. Petrol. Explor. Prod. Technol. 2019, 9, 2747–2756. [Google Scholar] [CrossRef] [Scilit]
- Hegde, C.; Millwater, H.; Gray, K. Classification of Drilling Stick Slip Severity Using Machine Learning. J. Pet. Sci. Eng. 2019, 179, 1023–1036. [Google Scholar] [CrossRef] [Scilit]
- Xiong, M.; Zheng, S.; Liu, W.; Cheng, R.; Wang, L.; Zhang, H.; Wang, G. A Rate of Penetration (ROP) Prediction Method Based on Improved Dung Beetle Optimization Algorithm and BiLSTM-SA. Sci. Rep. 2024, 14, 25856. [Google Scholar] [CrossRef] [Scilit] [PubMed]
- Alavi Nezhad Khalil Abad, S.V.; Hazbeh, O.; Rajabi, M.; Tabasi, S.; Lajmorak, S.; Ghorbani, H.; Radwan, A.E.; Mudabbir, M. Determination of the Rate of Penetration by Robust Machine Learning Algorithms Based on Drilling Parameters. ACS Omega 2023, 8, 46390–46398. [Google Scholar] [CrossRef] [Scilit] [PubMed]
- Huang, Z.; Zhu, L.; Wang, C.; Zhang, C.; Li, Q.; Jia, Y.; Wang, L. Intelligent Prediction of Rate of Penetration Using Mechanism-Data Fusion and Transfer Learning. Processes 2024, 12, 2133. [Google Scholar] [CrossRef] [Scilit]
- Deen, A.; Wedel, R.; Nayan, A.; Mathison, S.; Hightower, G. Application of a Torsional Impact Hammer to Improve Drilling Efficiency. In SPE Annual Technical Conference and Exhibition; SPE: Denver, CO, USA, 2011; p. SPE-147193-MS. [Google Scholar]
- Phi, T.; Elgaddafi, R.; Al Ramadan, M.; Ahmed, R.; Teodoriu, C. Well Integrity Issues: Extreme High-Pressure High-Temperature Wells and Geothermal Wells a Review. In SPE Thermal Well Integrity and Design Symposium; SPE: Banff, AB, Canada, 2019; p. D031S007R001. [Google Scholar]
- Fernandes, W.; Komati, K.S.; Assis De Souza Gazolli, K. Anomaly Detection in Oil-Producing Wells: A Comparative Study of One-Class Classifiers in a Multivariate Time Series Dataset. J. Petrol. Explor. Prod. Technol. 2024, 14, 343–363. [Google Scholar] [CrossRef] [Scilit]
- Ibrahim, A.F.; Ahmed, A.; Elkatatny, S. Applications of Different Classification Machine Learning Techniques to Predict Formation Tops and Lithology While Drilling. ACS Omega 2023, 8, 42152–42163. [Google Scholar] [CrossRef] [Scilit] [PubMed]
- Magana-Mora, A.; AlJubran, M.; Ramasamy, J.; AlBassam, M.; Gooneratne, C.; Gonzalez, M.; Thiel, T.; Deffenbaugh, M. Machine-Learning for the Prediction of Lost Circulation Events—Time Series Analysis and Model Evaluation. In SPE Middle East Oil & Gas Show and Conference; SPE: Sanabis, Bahrain, 2021; p. D021S001R002. [Google Scholar]
- Wang, J.; Xiang, Z.; Cheng, X.; Zhou, J.; Li, W. Tool Wear State Identification Based on SVM Optimized by the Improved Northern Goshawk Optimization. Sensors 2023, 23, 8591. [Google Scholar] [CrossRef] [Scilit] [PubMed]
- Kizayev, T.; Irawan, S.; Khan, J.A.; Khan, S.A.; Cai, B.; Zeb, N.; Wayo, D.D.K. Factors Affecting Drilling Incidents: Prediction of Suck Pipe by XGBoost Model. Energy Rep. 2023, 9, 270–279. [Google Scholar] [CrossRef] [Scilit]
- Shokry, A.; Elkatatny, S.; Abdulraheem, A. Real-Time Rate of Penetration Prediction for Motorized Bottom Hole Assembly Using Machine Learning Methods. Sci. Rep. 2023, 13, 14496. [Google Scholar] [CrossRef] [Scilit] [PubMed]
- Zagré, G.E.; Gamache, M.; Labib, R.; Shlenchak, V. Machine learning algorithms for real-time coal recognition using monitor-while-drilling data. Int. J. Min. Reclam. Environ. 2024, 38, 27–52. [Google Scholar] [CrossRef] [Scilit]
- Hiba, M.; Zerpa, L.E.; Khaled, M.S. A Hybrid Physics-Informed Machine Learning Framework for Proactive Downhole Temperature Management in HPHT and Geothermal Drilling. In IADC/SPE International Drilling Conference and Exhibition; SPE: Galveston, TX, USA, 2026. [Google Scholar] [CrossRef] [Scilit]
- Alfrayan, D.W.; Almulla, N.A.; Isawi, W.A.; Alali, M.B. Predicting Choke Valve Erosion in HPHT Gas Wells Using Machine Learning. In Abu Dhabi International Petroleum Exhibition and Conference (ADIPEC); SPE: Abu Dhabi, United Arab Emirates, 2025. [Google Scholar] [CrossRef] [Scilit]
- Hearst, M.A.; Dumais, S.T.; Osuna, E.; Platt, J.; Scholkopf, B. Support Vector Machines. IEEE Intell. Syst. Their Appl. 1998, 13, 18–28. [Google Scholar] [CrossRef] [Scilit]
- Boser, B.E.; Guyon, I.M.; Vapnik, V.N. A Training Algorithm for Optimal Margin Classifiers; Association for Computing Machinery: New York, NY, USA, 1992. [Google Scholar] [CrossRef] [Scilit]
- Fu, Z.; Robles-Kelly, A.; Zhou, J. Mixing Linear SVMs for Nonlinear Classification. IEEE Trans. Neural Netw. 2010, 21, 1963–1975. [Google Scholar] [CrossRef] [Scilit] [PubMed]
- Ansari, A.; Fathi, E.; Belyadi, F.; Takbiri-Borujeni, A.; Belyadi, H. Data-Based Smart Model for Real Time Liquid Loading Diagnostics in Marcellus Shale via Machine Learning. In SPE Canada Unconventional Resources Conference; SPE: Calgary, AB, Canada, 2018; p. D021S007R001. [Google Scholar]
- Li, Z.; Zhang, C.; Fan, Z.; Qiu, Y.; Li, X.; Zhao, L. Analytical Solutions for Transient Response of a Semi-Permeable Wellbore Subjected to Non-Hydrostatic in Situ Stresses and Convective Boundary Conditions within a Transversely Isotropic Thermoporoelastic Medium. Geomech. Energy Environ. 2026, 45, 100801. [Google Scholar] [CrossRef] [Scilit]

Disclaimer/Publisher’s Note: The statements, opinions and data contained in all publications are solely those of the individual author(s) and contributor(s) and not of MDPI and/or the editor(s). MDPI and/or the editor(s) disclaim responsibility for any injury to people or property resulting from any ideas, methods, instructions or products referred to in the content. |
© 2026 by the authors. Licensee MDPI, Basel, Switzerland. This article is an open access article distributed under the terms and conditions of the Creative Commons Attribution (CC BY) license.