Article

Microwave Irradiation: Effects on Particle Size Distribution, Rheological and Fluorescent Characteristics of Wine

1
School of Medical Technology and Engineering, Henan University of Science and Technology, Luoyang 471023, China
2
Guangdong 3SBio Pharmaceutical Co., Ltd., Dongguan 523808, China
3
College of Food and Bioengineering, Henan University of Science and Technology, Luoyang 471023, China
*
Author to whom correspondence should be addressed.
Processes 2026, 14(6), 934; https://doi.org/10.3390/pr14060934
Submission received: 11 January 2026 / Revised: 5 February 2026 / Accepted: 11 February 2026 / Published: 16 March 2026
(This article belongs to the Section Food Process Engineering)

Abstract

This study investigated the effects of microwave irradiation on the particle size distribution, rheological properties, fluorescent characteristics, and sensory characteristics of wine. Wine samples were treated under varying microwave power (100–500 W), temperature (20–60 °C), and time (1–5 min). Results indicated that microwave treatment modified the particle size distribution, especially the proportion of particles in the range of 0.3–0.5 μm, which increased with microwave power, temperature, and time. Rheological analysis indicated that the behaviour followed the Power-law model, with all samples exhibiting expansion fluid properties (n > 1). Fitting with the Casson model revealed that microwave treatment increased the yield stress (τ0) and viscosity coefficient (K), with optimal improvements observed at 300 W, 30 °C, and 3 min (τ0 = 0.7769 Pa, K = 2.9367 × 10⁻³ Pa s0.5). These changes contributed to enhanced leg phenomenon and thickening effect. Furthermore, microwave treatment elevated the fluorescence intensity of wine, indicating accelerated formation of fluorescent substances. Sensory evaluation demonstrated that microwave treatment, particularly at 400 W, 40 °C, and 3 min, significantly improved colour, clarity, and mouthfeel while reducing astringency and bitterness. In conclusion, microwave treatment effectively modifies the sensory characteristics of wine, offering a viable technological approach to accelerate wine ageing and supporting its potential application in winemaking.

1. Introduction

The sensory characteristics of red wine are one of the important indexes to measure the quality of red wine, which directly affect the quality of red wine [1]. The drinking quality of fresh wine is poor; it tastes raw, astringent, and rough. Consumers prefer aged red wines that are stable in colour, rich in aroma, and soft in taste [2]. Ageing in oak barrels is a traditional ageing method that has been used for over 2000 years [3]. However, oak barrel ageing has notable disadvantages, including being time-consuming, costly, and labour-intensive; needing to employ a large number of oak barrels; and exhibiting potentially undesirable microbial contamination [4]. In response, to overcome the above shortcomings, some ageing technologies have been developed to produce higher quality wine in a short ageing time; these technologies include micro-oxygenation, ultrasonic waves, high pressure, electric fields, gamma rays, and nanogold photocatalysis [5,6]. These methods aimed to speed up reactions between the compounds in wine to produce a stable solution similar to a wine naturally aged for many years. Given its advantages in cost, efficiency, speed, and pasteurization capability [7], microwave technology has been widely applied in wine-making. Microwave technology has been used to increase the content of phenolic compounds in grape juice and reduce the endogenous yeast population [8], improve the floral and fruity aroma profile [9], and enhance the overall quality of wine [10,11]. Recently, our research group conducted a series of studies to examine how microwave treatment alters the compositional and sensory profiles of wine, utilizing the CMCC-MI system [12]. Studies found that microwave technology could induce the formation of 1-hydroxyethyl radicals [13], make wine change colour rapidly [14], affect the content and structure of phenolic compounds in wine [12], promote the production of xanthylium cation pigments in wine [15], and change protein structural characteristics [16]. All these results suggest that microwave irradiation altered red wine properties, yet the reported changes focused on its chemical properties.
Visual appearance and taste are key indicators for evaluating the quality of red wine, directly influencing consumers’ drinking experience and thus serving as critical criteria for assessing product processing and development [17]. Previous studies predominantly focused on the effects of microwave treatment on the visual properties of wine, while its impact on taste characteristics has been less explored. Previous research indicated a significant correlation between the osmotic pressure and viscosity of wine, suggesting that rheological parameters, such as viscosity, likely contribute to shaping the mouthfeel of the wine [18]. Furthermore, particle size distribution was another important factor influencing wine taste. Therefore, this study investigated the effects of microwave treatment on the particle size distribution, rheological properties, and fluorescence spectrum of red wine, aiming to reveal the underlying mechanisms behind changes in the sensory attributes of wine induced by microwave treatment from a physical perspective.

2. Materials and Methods

2.1. Materials and Reagents

The Cabernet Gernischt dry red wine, with 12% (v/v) alcohol content in 2021 and used throughout the experiment, was provided by Kaiyuan Winery (Luoyang, China) from Cabernet Sauvignon grapes. The (+)-catechin (≥98.0%) standard was purchased from Zhiyuan Chemical Reagent Co., Ltd. (Tianjin, China). Methanol (≥99.9%) and 3,4-dihydroxybenzoic acid (≥98.0%) were purchased from Deen Chemical Reagent Co., Ltd. (Tianjin, China). All chemical reagents used were analytical grade.

2.2. Microwave Treatment

A closed microwave irradiation system with magnetic stirring and temperature-controlled cooling (CMCC-MI system) was employed in the following experiments [15]. For each experiment set, 50 mL of red wine was placed into a 100 mL two-layer cylindrical cup, which was then positioned in the same position within the microwave chamber. The minimum and maximum output power of the microwave reactor in the CMCC-MI system were 100 and 900 W, respectively. Based on previously reported experimental conditions concerning the influence on the physicochemical properties of wine under microwave irradiation [12,13,14,15,16] and in order to reasonably control the experimental conditions of wine, the microwave power was set to 100, 200, 300, 400, and 500 W, and the other working conditions were fixed at 3 min and 30 ± 1.5 °C; microwave temperature was set to 20, 30, 40, 50, and 60 °C, and the other working conditions were fixed at 300 W and 3 min; microwave time was set to 1, 2, 3, 4, and 5 min, the other working conditions were fixed at 300 W and 30 ± 1.5 °C. Each sample analysis was repeated three times.

2.3. Determination of Particle Size Distribution

In this study, red wine was diluted at a 1:500 ratio in an aqueous solution of 12% (v/v) ethanol, then filtered with a 0.22 μm organic filter membrane. The determination of particle size distribution was performed using a nanoparticle size and zeta potential analyzer (BeNano 90 Zeta, Dandong BetterSize Instrument Co., Ltd., Dandong, China). The refractive index of the sample was 1.52, the material absorptivity was 0.1, and the refractive index of water as a dispersion medium was 1.333. The detection angle was 90°, the balancing time was 120 s, and the number of sub-tests was 60. All infused wine samples were automatically tested at set intervals. The data regarding particle size distribution was recorded.

2.4. Determination of Rheological Properties

The rheological behaviour of untreated and microwave-treated red wine was measured using a DHR 2 rheometer (TA instruments-Waters LLC, New Castle, DE, USA). The plate (diameter 40 mm) was used for testing, the distance was 1 mm, and the shear rate of the measuring system was gradually increased from 10 s−1 to 1000 s−1 at 25 °C. The relationship between shear rate (γ) and shear stress (τ) could be obtained. After drawing τ versus γ, Power-law linear regression was performed to get the n value:
τ = K·γn
In the Power-law model, the unit of τ (yield stress) is Pa, the unit of γ is s−1, n is the rheological constant, and K is the viscosity coefficient with the unit of Pa·sn.
Casson’s equation was used to perform linear regression to obtain the values of τ0 and K:
τ =   τ 0 +   K · γ
In the Casson model, the unit of τ is Pa, τ0 is the yield stress (Pa), the unit of γ is s−1, and the unit of K is the Casson constant (g/cm·s)1/2.

2.5. Fluorescence Spectroscopy

Endogenous fluorescence spectroscopy was performed with slight modifications to a previously published method [10]. Both untreated and microwave-treated red wines were scanned for fluorescence spectra with a Cary Eclipse Fluorescence Spectrophotometer (Agilent Technologies, Palo Alto, CA, USA). For a blank control, 12% (v/v) ethanol solution was used. The excitation wavelength was set at 340 nm, with an emission scan from 350 to 650 nm. For sample measurement, the red wine samples were diluted (1:10) in 12% (v/v) ethanol solution because the fluorescence quenching phenomenon occurred when red wine was at a higher concentration [19].

2.6. Determination of Total Flavan-3-Ols Content

Following the p-(dimethylamino) cinnamaldehyde (p-DMACA) method [20], total flavan-3-ols in red wine were quantified. A 1 mL sample of red wine was taken and placed in a 10 mL test tube. To this, 0.2 mL of glycerol and 5 mL of p-DMACA reagent were added, with the volume set to 10 mL with methanol. The absorbance value was measured at 640 nm after 7 min against a methanol blank. The p-DMACA reagent was prepared before use, containing 1% (w/v) p-DMACA and 2.4 mol/L hydrochloric acid. Quantification was based on a (+)-catechin standard curve, with results in mg/mL flavan-3-ol equivalents.

2.7. Sensory Evaluation

The sensory evaluation of wine mainly focuses on mouthfeel and visual characteristics. Wine samples were evaluated by 12 wine assessors (6 females and 6 males, aged between 25 and 45 years old). Sensory evaluation was conducted in a separate tasting room at a temperature of 18–20 °C. The wine samples were placed in 30 mL taster glasses, and salt-free cookies and water were provided to clean the palate. The sensory evaluation included quality, taste, astringency, bitterness, colour, and clarity. Each sensory category was recorded using an unstructured linear 10 cm scale, ranging from 0 (not detectable) to 10 (extremely intense).

2.8. Statistical Treatment of Data

Data are reported as mean ± SD of triplicate measurements. Origin 2018 was used for plotting, and SPSS 22.0 for statistical analysis, including one-way ANOVA to determine significance.

3. Results and Discussion

3.1. Microwave Power on Particle Size Distribution

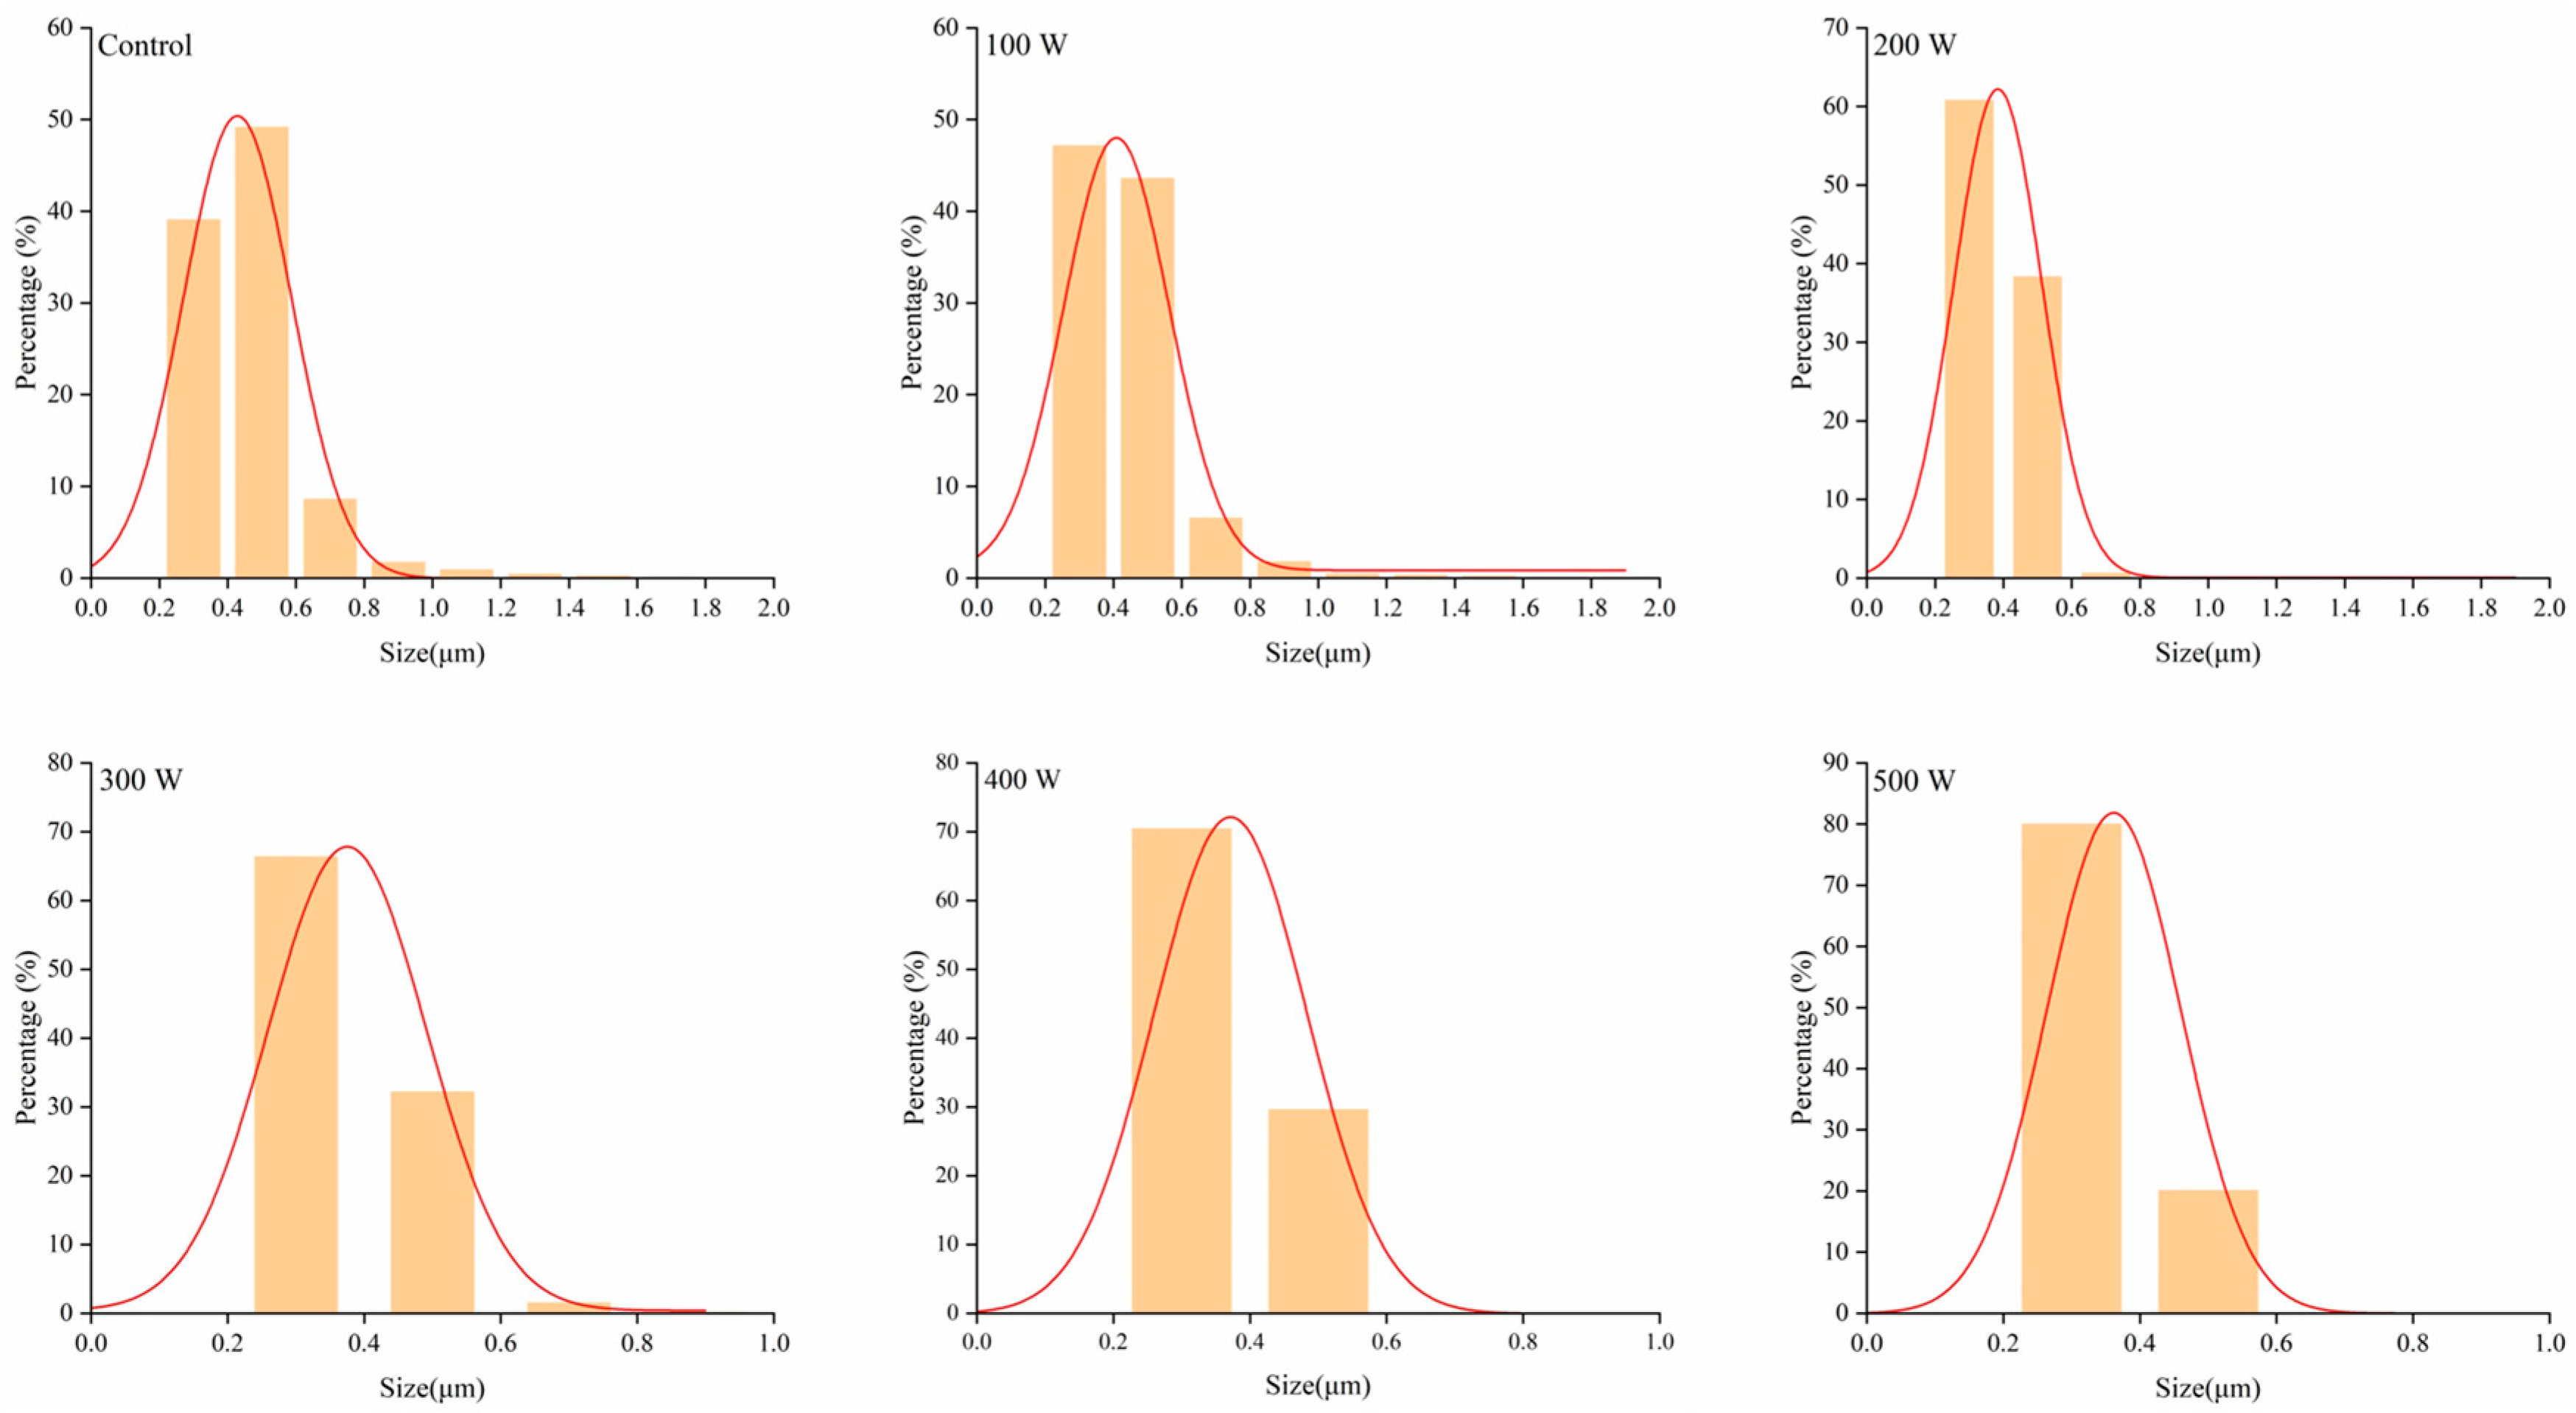
The particle size distribution without treatment and under different microwave powers is shown in Figure 1, from which it can be seen that different microwave powers did affect the particle size distribution of red wine. In general, the particle size distribution of all samples was recorded in three intervals: 0.3–0.5 μm, 0.5–1.0 μm, and 1.0–2.0 μm, among which 0.3–0.5 μm had the largest proportion. With the change in microwave power, the particle size distribution changed because of the different energy intensities transmitted from microwave irradiation. With the increase in microwave power, the proportion of particle size of 0.3–0.5 μm also increased gradually, and the proportions of particle sizes of 0.5–1.0 μm and 1.0–2.0 μm decreased gradually; the particle size distribution at 1.0–2.0 μm even disappeared from 300 W to 500 W. This might be due to the enhancement of the thermal motion of polar molecules under high-frequency electromagnetic fields with increasing of microwave intensity, resulting in a rapid rise in thermal energy [21]. The enhanced motion and friction of polar molecules in the high-frequency electromagnetic field fractured intermolecular covalent or noncovalent bonds, thereby separating small particles from big particles through the fracture of intermolecular covalent or noncovalent bonds, and the breakdown of larger particles into smaller ones was accompanied by the generation of free radicals [22]. The results showed that big particles degraded to small particles at higher microwave power, owing to the enhanced friction between polar molecules at higher power. Free radicals intensity increased progressively with microwave power [12], which might have accelerated the polymerization reactions of small active compounds. In other words, the change in the particle size distribution was caused by different microwave powers, and a series of free radical chain reactions among the components and changes to rheological properties in red wine were also caused by different microwave powers. The L* value could be increased with microwave technology [13], which could explain how microwave technology made the particle size distribution more uniform and improved the clarity of red wine.

3.2. Microwave Temperature on Particle Size Distribution

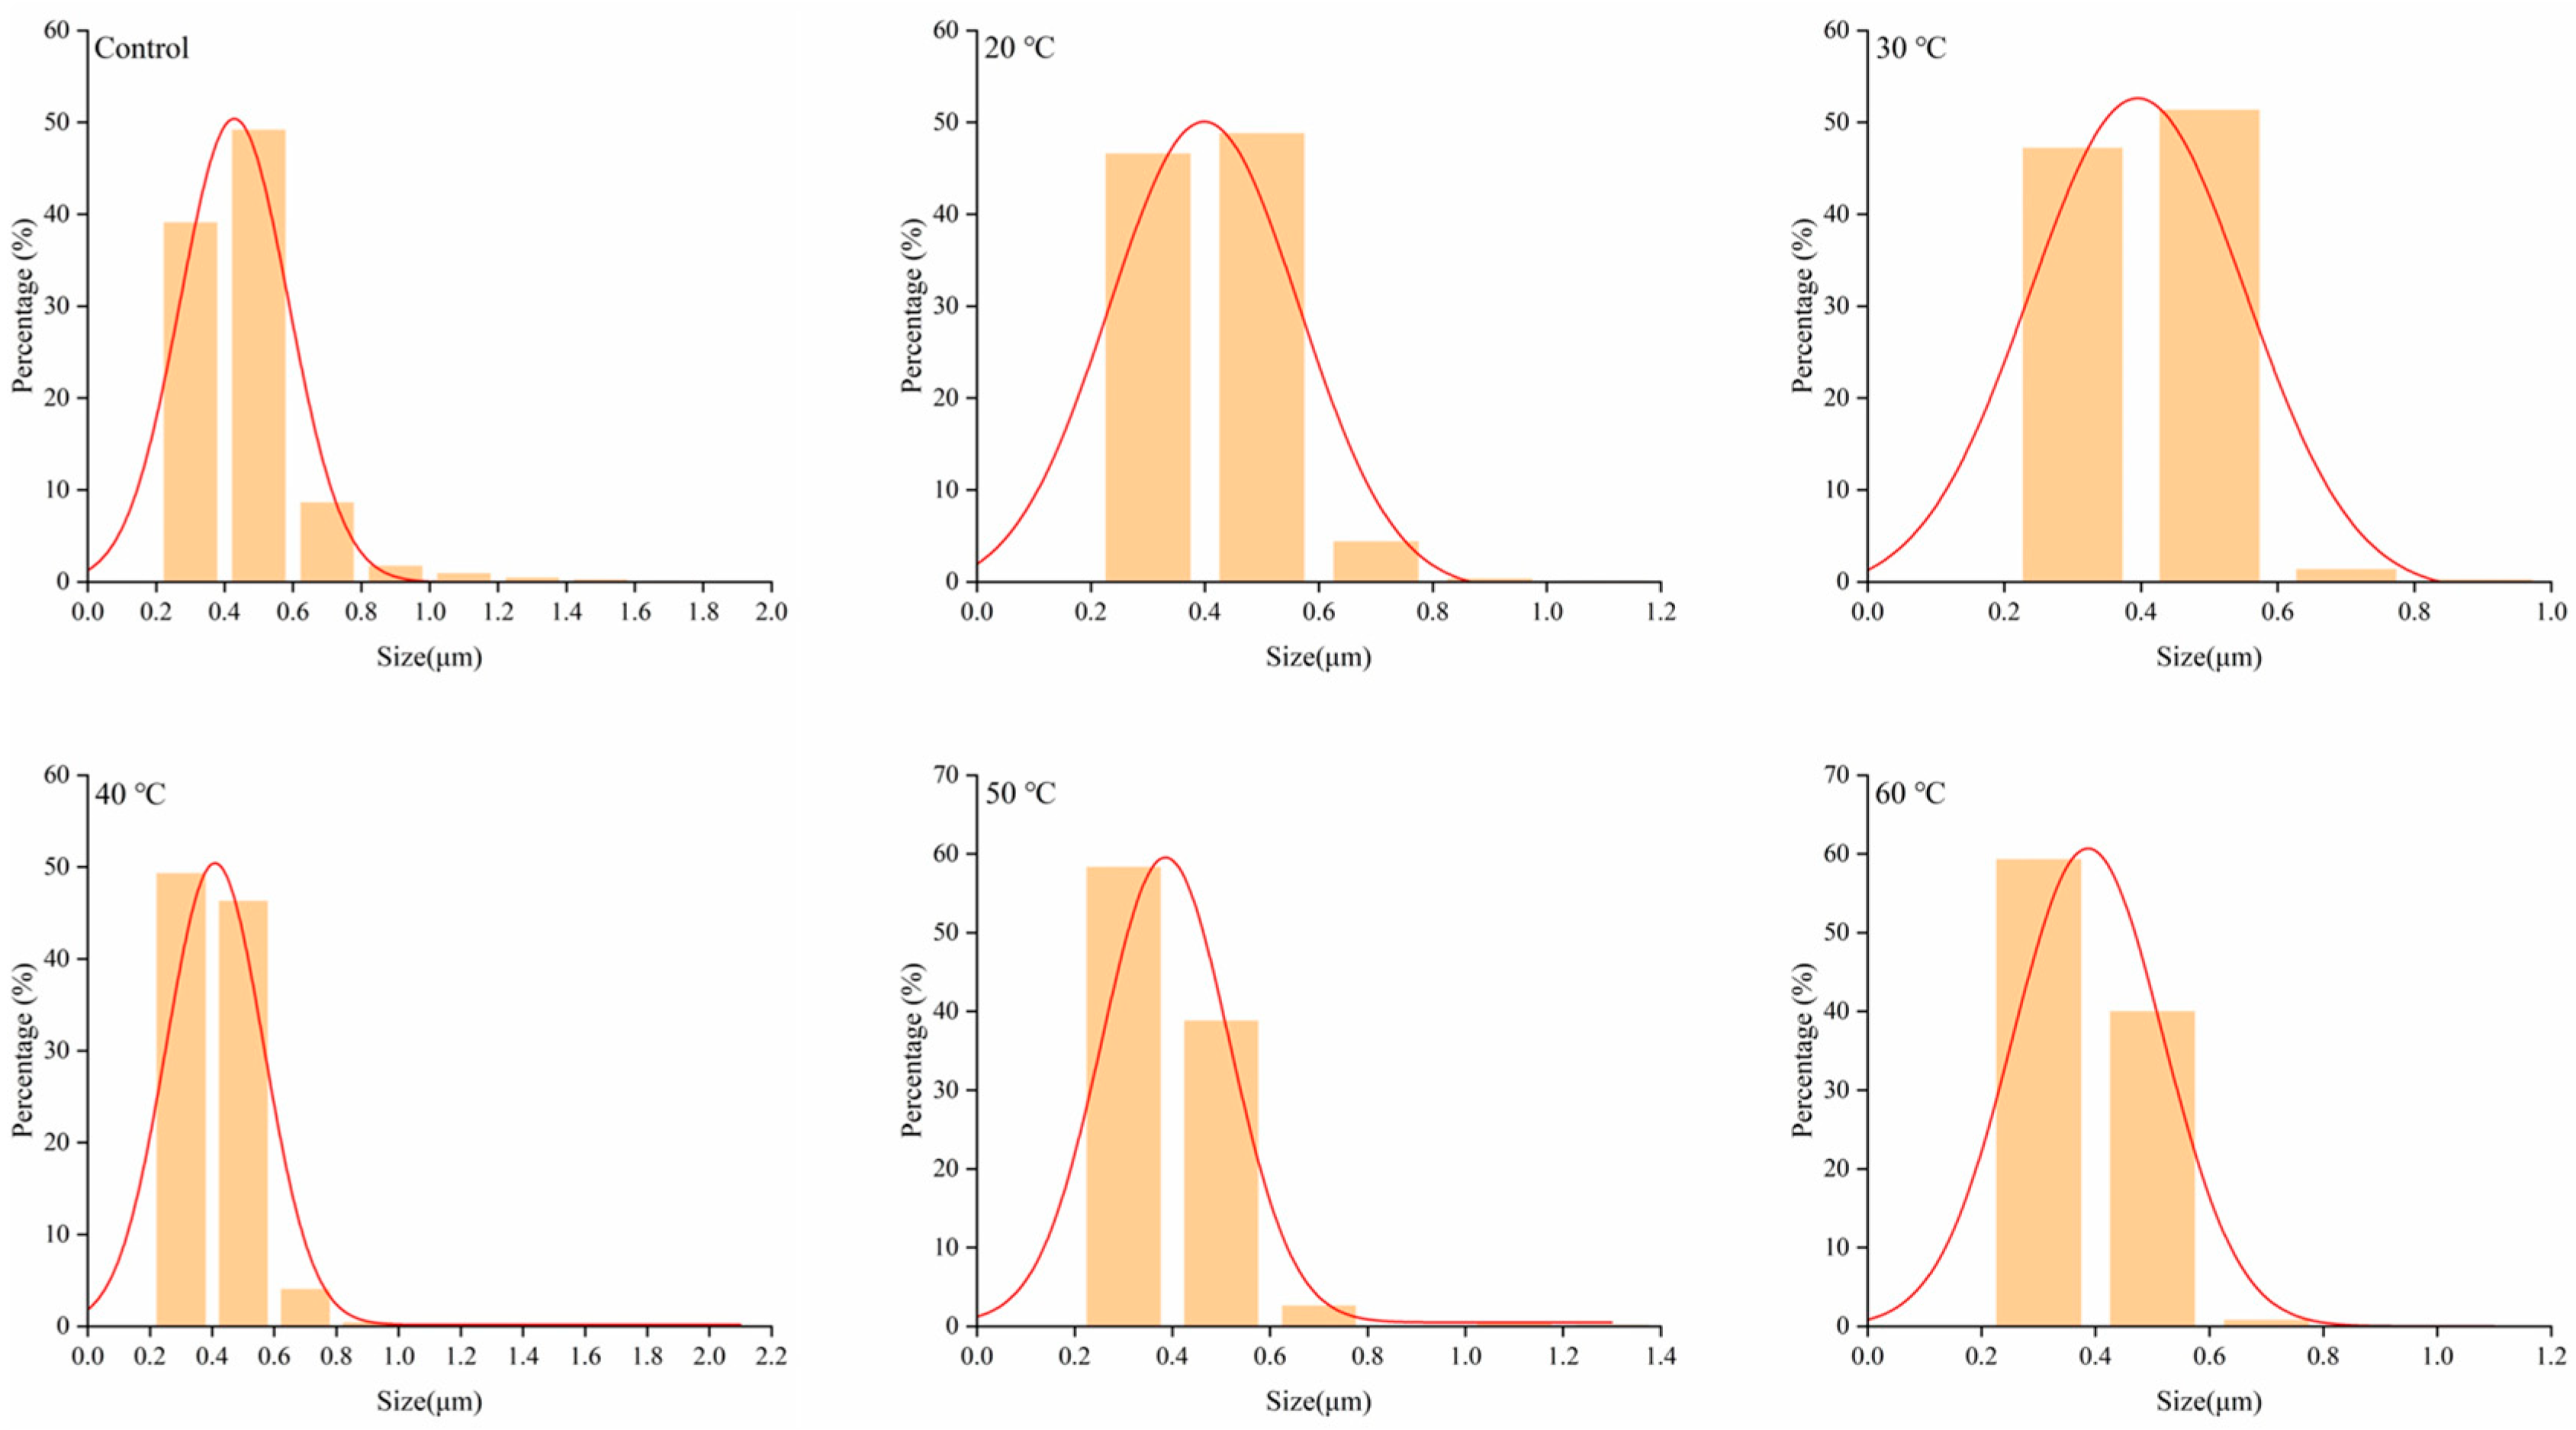
The particle size distribution of all red wine samples under different microwave temperatures is shown in Figure 2, from which it can be seen that the particle size distribution was affected by different microwave temperatures. The particle size distributions were 0.3–0.5 μm, 0.5–1.0 μm, and 1.0–2.0 μm, and 0.3–0.5 μm took the largest proportion. The red wine particle size distribution changed with increasing microwave temperatures between 20 °C and 60 °C. There were still three particle size ranges, except that the 2.0–10.0 μm particle size increased by 0.02% at 40 °C, and the particles in the ranges of 0.5–1.0 μm and 1.0–2.0 μm decreased gradually from 20 °C to 30 °C. The particles in the range of 0.3–0.5 μm increased gradually from 40 °C to 60 °C, and the particles in the range of 1.0–2.0 μm had no significant change. Microwave temperature was a complicated factor affecting the particle size distribution; temperature not only affected the strength of molecular motion, but also affected the intensity of free radicals [12]. In Figure 2, the particle size distribution of the samples treated by microwave at 40 °C changed drastically; this phenomenon could perhaps be the reason for the double influence under microwave irradiation on the intensity of free radicals and the friction between polar molecules. Furthermore, the particle size distribution of wine treated at a lower temperature was significantly different from that of untreated wine. At the same time, considering the influence on red wine’s physicochemical properties under microwave temperature [13], it was suggested that red wine was treated at a lower temperature.

3.3. Microwave Time on Particle Size Distribution

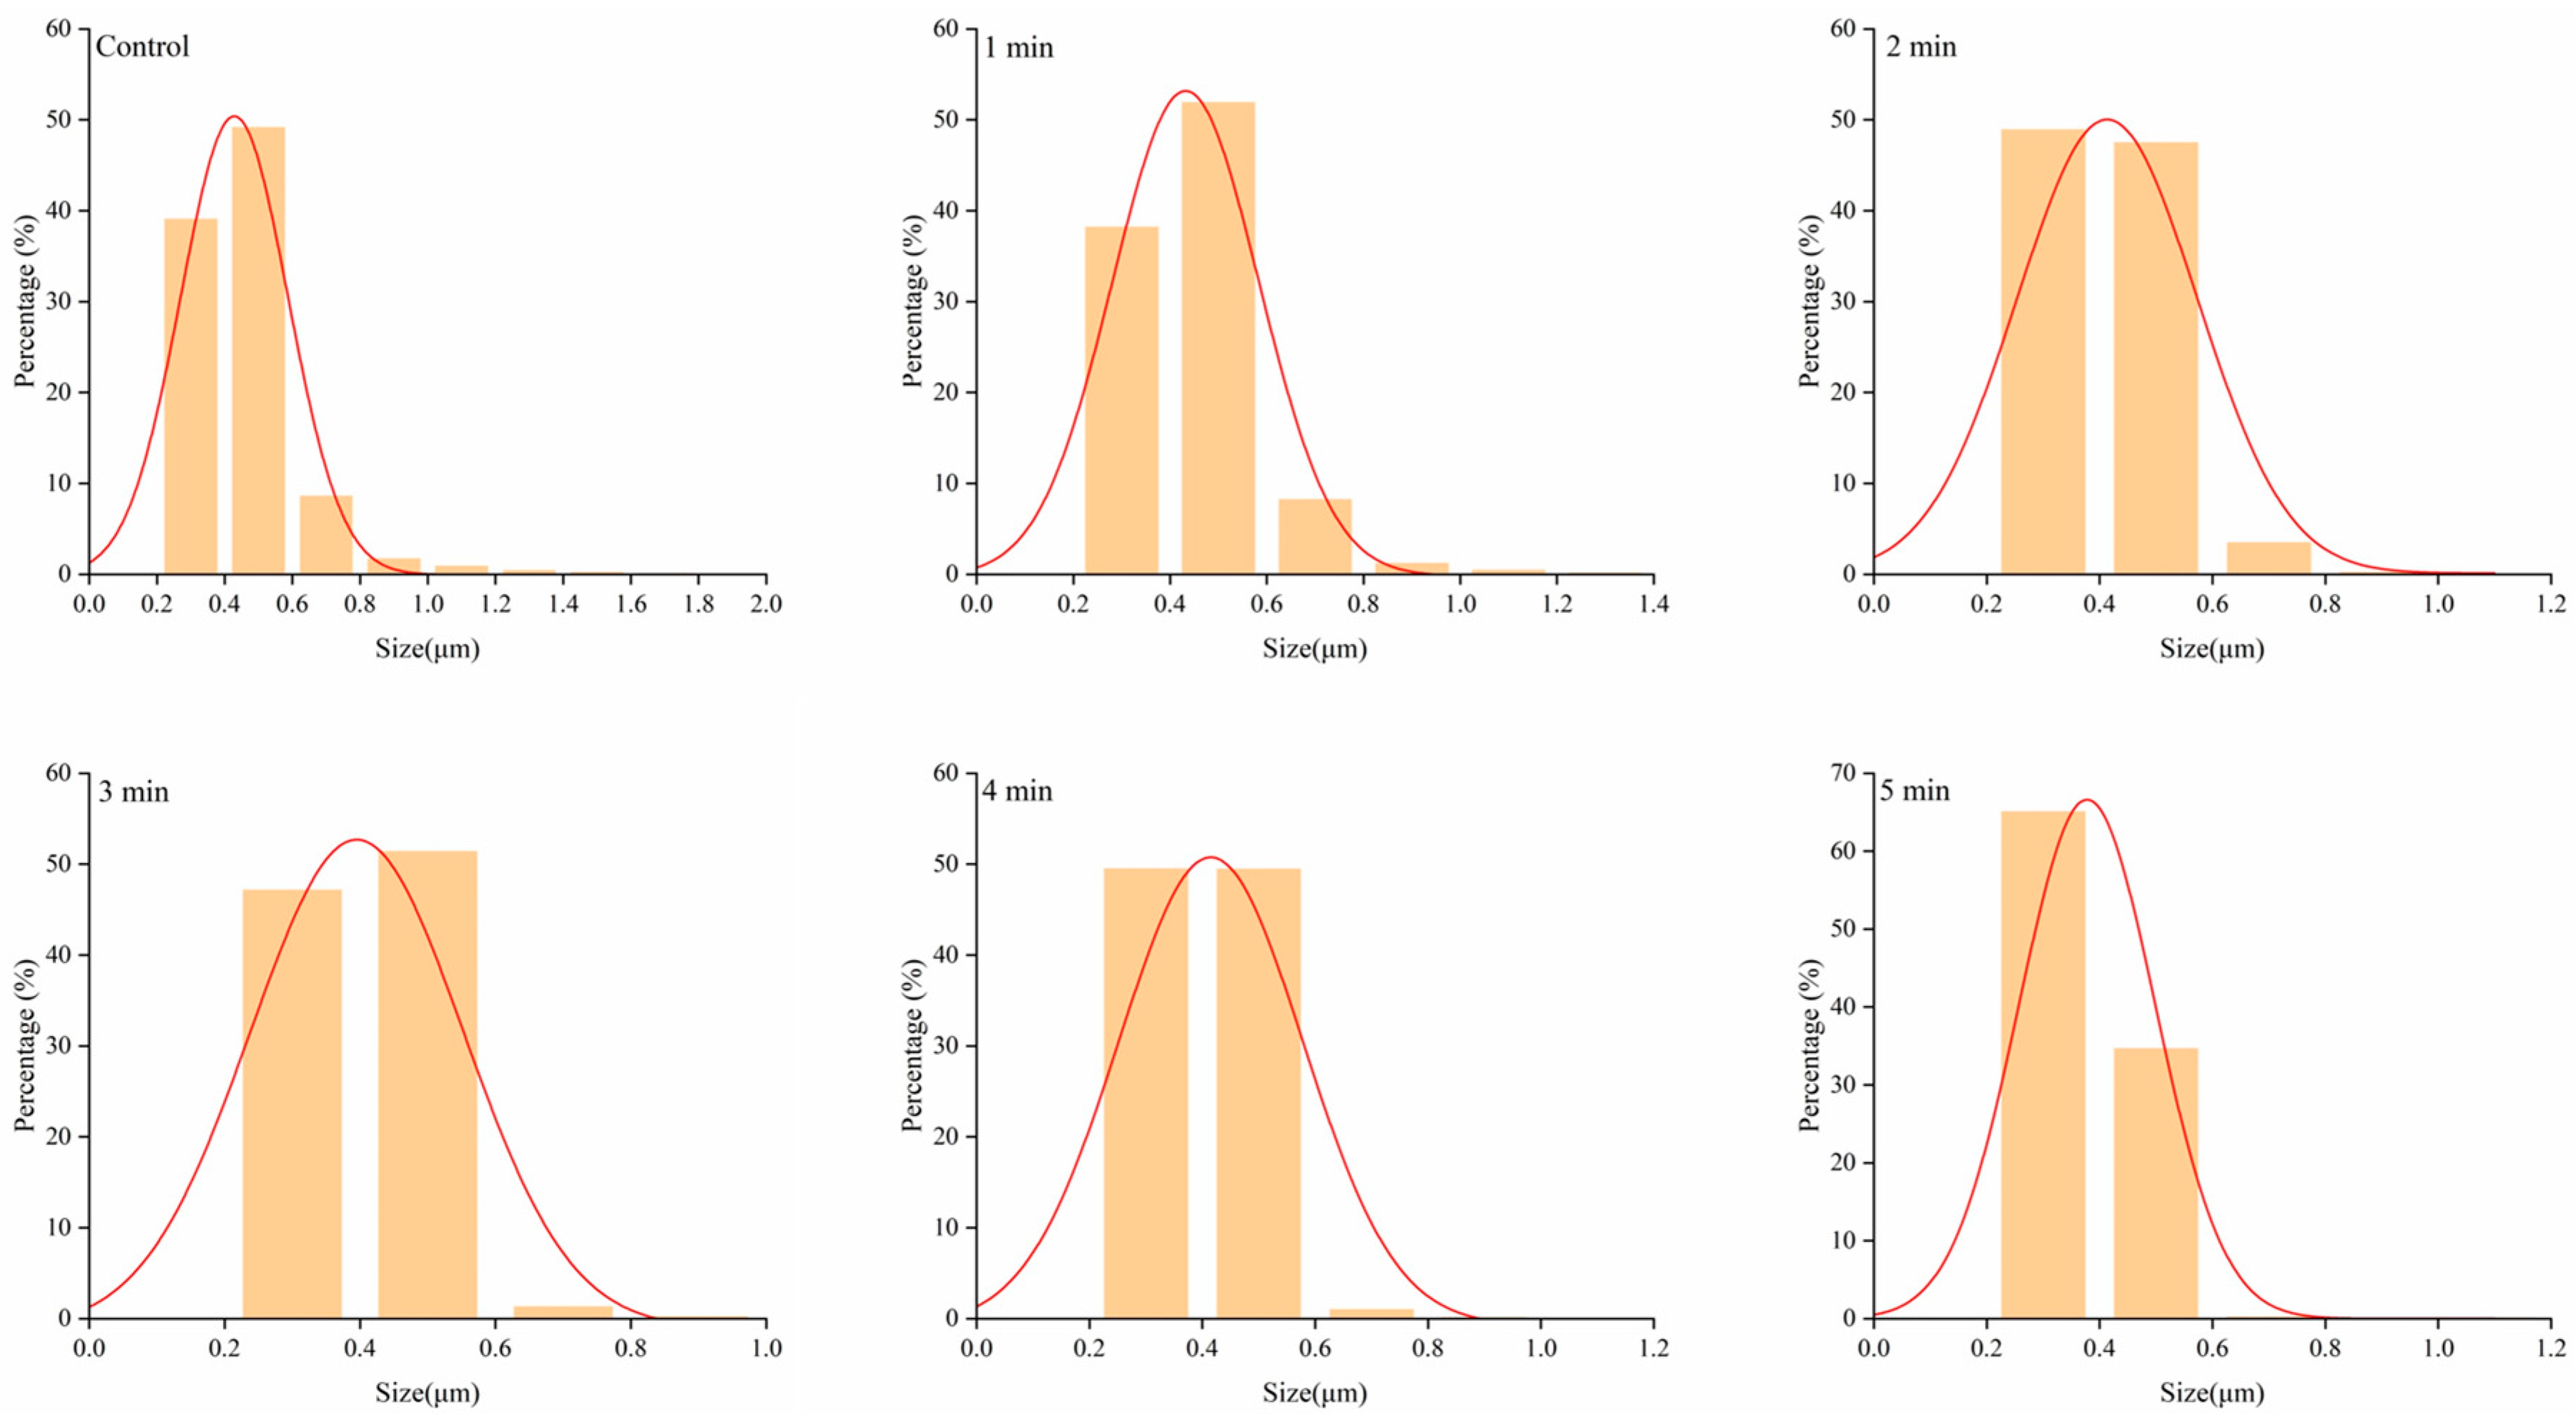
Figure 3 shows the particle size distribution under different microwave treatment times. Compared with the untreated microwave red wine, the particle size distribution of red wine after different microwave time treatments was still divided into three ranges: 0.3–0.5 μm, 0.5–1.0 μm, and 1.0–2.0 μm. In general, with the extension of microwave time, the proportion of larger particles gradually decreased, while the proportion of smaller particles gradually increased. The result showed that more big particles degraded into small ones with increasing microwave time, which might be attributed to the enhanced motion and friction of polar molecules within high-frequency electromagnetic fields [22]. This effect intensified with prolonged microwave time. From the results demonstrating changes in the particle size distribution of red wine caused by different microwave times, it could be concluded that the microwave-induced free radicals might accelerate the polymerization reactions of active compounds, thereby altering red wine particle size distribution. It could be seen from the results that longer microwave treatment times could make the particle size distribution of red wine more uniform, not only increasing the proportion of small particles and changing red wine’s rheological properties, but also consistent with the reported improvement of the clarity of red wine under different microwave treatment times [13].

3.4. Rheological Characteristics of Untreated and Microwave-Treated Red Wine

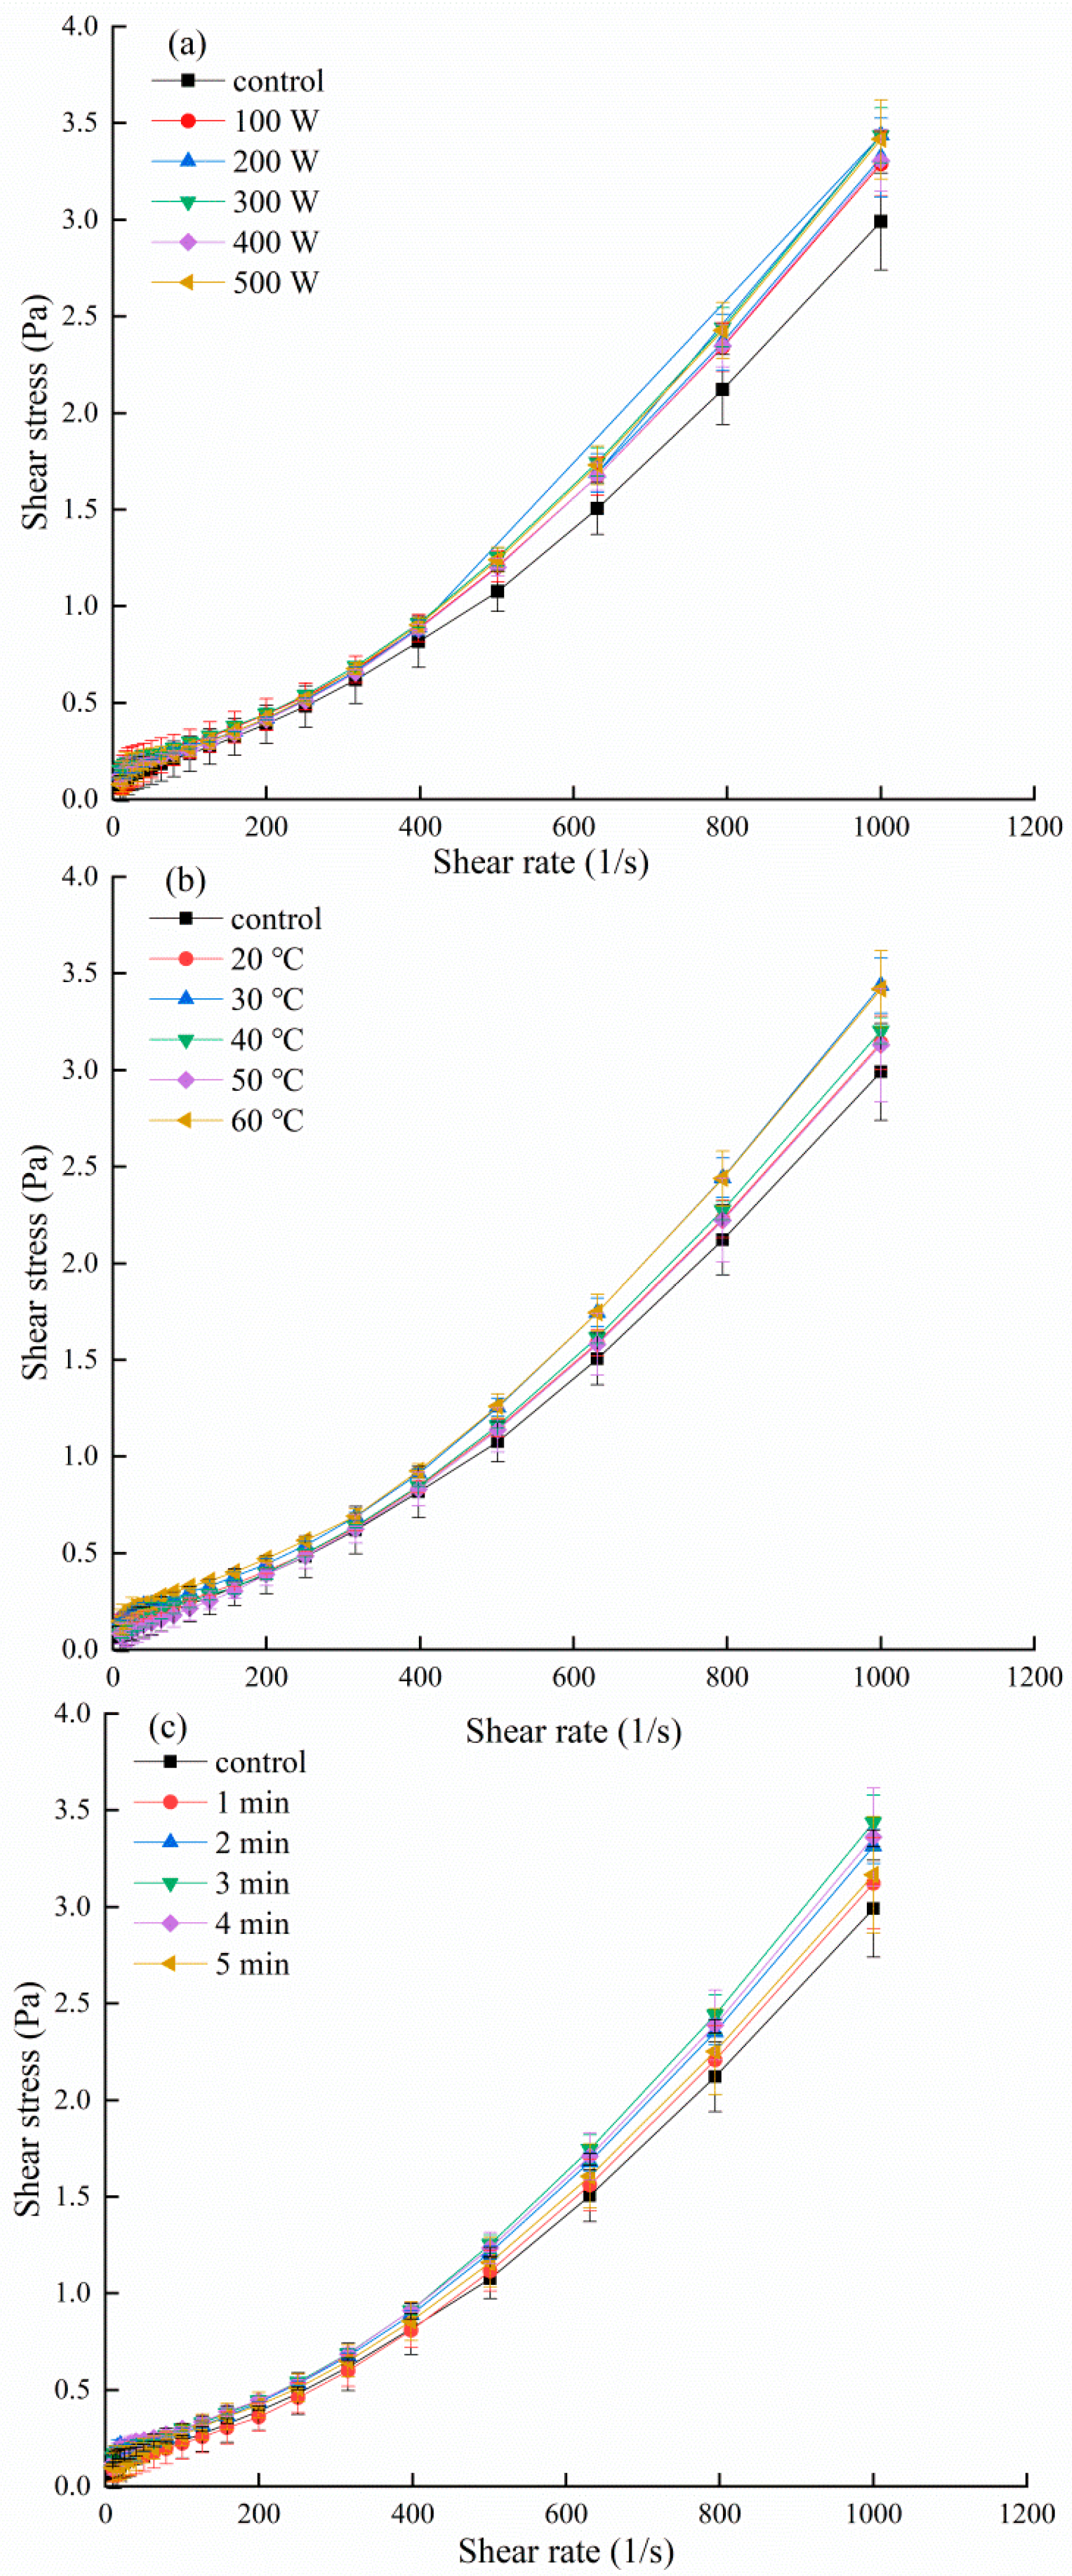
In Figure 4a–c, the rheological characteristics of red wine were indeed affected, alongside different microwave powers, temperatures, and times. According to the relationship between shear rate (γ) and shear stress (τ), fluids can be divided into Newtonian and non-Newtonian fluids [18,23]. According to the results of the rheological curve, the shear rate and shear stress of red wine in the untreated samples and the microwave-treated samples were not linear, which shows that red wine under different conditions was a non-Newtonian fluid. The shear stress of red wine quickly increased with the increase in shear rate, which could indicate that microwave treatment could not change the fluid characteristics of red wine. Usually, the rheological type was determined by fitting the data to the Power-law model. n is the rheological constant, which indicates the degree of deviation of the fluid from Newtonian fluid. Generally speaking, Newtonian fluid is characterized by (n = 1) and pseudoplastic fluid is characterized by (n < 1), with the degree of thinning increasing as n decreases, whereas expansion or shear-thickening fluid is characterized by (n > 1); the higher the value of n, the less dependent the viscosity is on the change in shear rate [24].
Table 1 shows the relevant parameters of the rheological characteristics of red wine obtained by fitting the Power-law equation. All regression coefficient (R2) were in the range of 0.9724 to 0.9908, indicating that the Power-law model had good correlation with the rheological curve. The rheological constants of all red wine samples were greater than 1, indicating microwave irradiation could change the rheological characteristic constant but did not change the rheological type of red wine. From the change in n value, it could be seen that the particles dispersed in red wine underwent complex movements and the interaction between the molecules [22]. Perhaps microwave irradiation resulted in changes to the stretching or conformational deformation of the molecules and particles, thereby modifying red wine rheological characteristics.
After a long period of natural ageing, the thickening and leg phenomenon of wine could be improved, thereby enhancing the quality of the wine [25]. Table 2 further shows the relevant parameters of the rheological characteristics of red wine obtained by fitting the Casson equation. All regression coefficient (R2) exceeded 0.99, demonstrating that the Casson model had a good correlation with the rheological curve. Among them, τ0 is the yield stress, which is the force required when the fluid begins to flow. Thus, a high τ0 means that it is harder for the fluid to start flowing (requiring more force), while conversely, a low τ0 means it flows more easily. In the comparison of microwave-treated and untreated red wines, the yield stress was changed under microwave irradiation, and the yield stress of microwave-treated red wines was higher than that of untreated red wines. The viscosity coefficient K represents the viscosity of red wine; a larger K imparts a more pronounced thickening effect. In other words, the legs of red wine could be scientifically computed; the larger the K value, the more obvious the leg phenomenon, relating to the improvement of wine quality. Under different microwave treatment conditions, the viscosity coefficient among the samples was slightly increased. Microwave treatment theoretically enhanced the leg phenomenon through analysis of the theoretical K value, which further indicated that microwave treatment could improve the sensory quality of red wine. Under microwave treatment conditions of 300 W, 30 °C, and 3 min, theoretically, thickening and leg phenomenon could be improved.
By enhancing the rotation of polar molecules, microwave irradiation disrupted the stability of weak hydrogen bonds, resulting in the fracture of hydrogen bonds between weak polar molecules [26,27]. The occurrence of more chemical and physical reactions in red wine, which might disturb the original arrangement of particles, results in changes in the yield stress and viscosity coefficient of red wine.
In summary, microwave irradiation could impact the rheological constant, yield stress, and viscosity coefficient of red wine. On the one hand, this might be due to the change in the original arrangement of particles in red wine caused by motion and friction of polar molecules under high-frequency electromagnetic fields, resulting in increasing of viscosity coefficient of the red wine. On the other hand, the particle distribution of red wine got more uniform after microwave treatment, which in turn induced structural modifications that altered the rheological coefficient. Finally, the synthesis effect under different microwave powers, temperatures, and times could also cause polymerization reactions of molecules, thus affecting the red wine rheological coefficient.

3.5. Influence of Fluorescence Intensity in Red Wine by Microwave Treatment

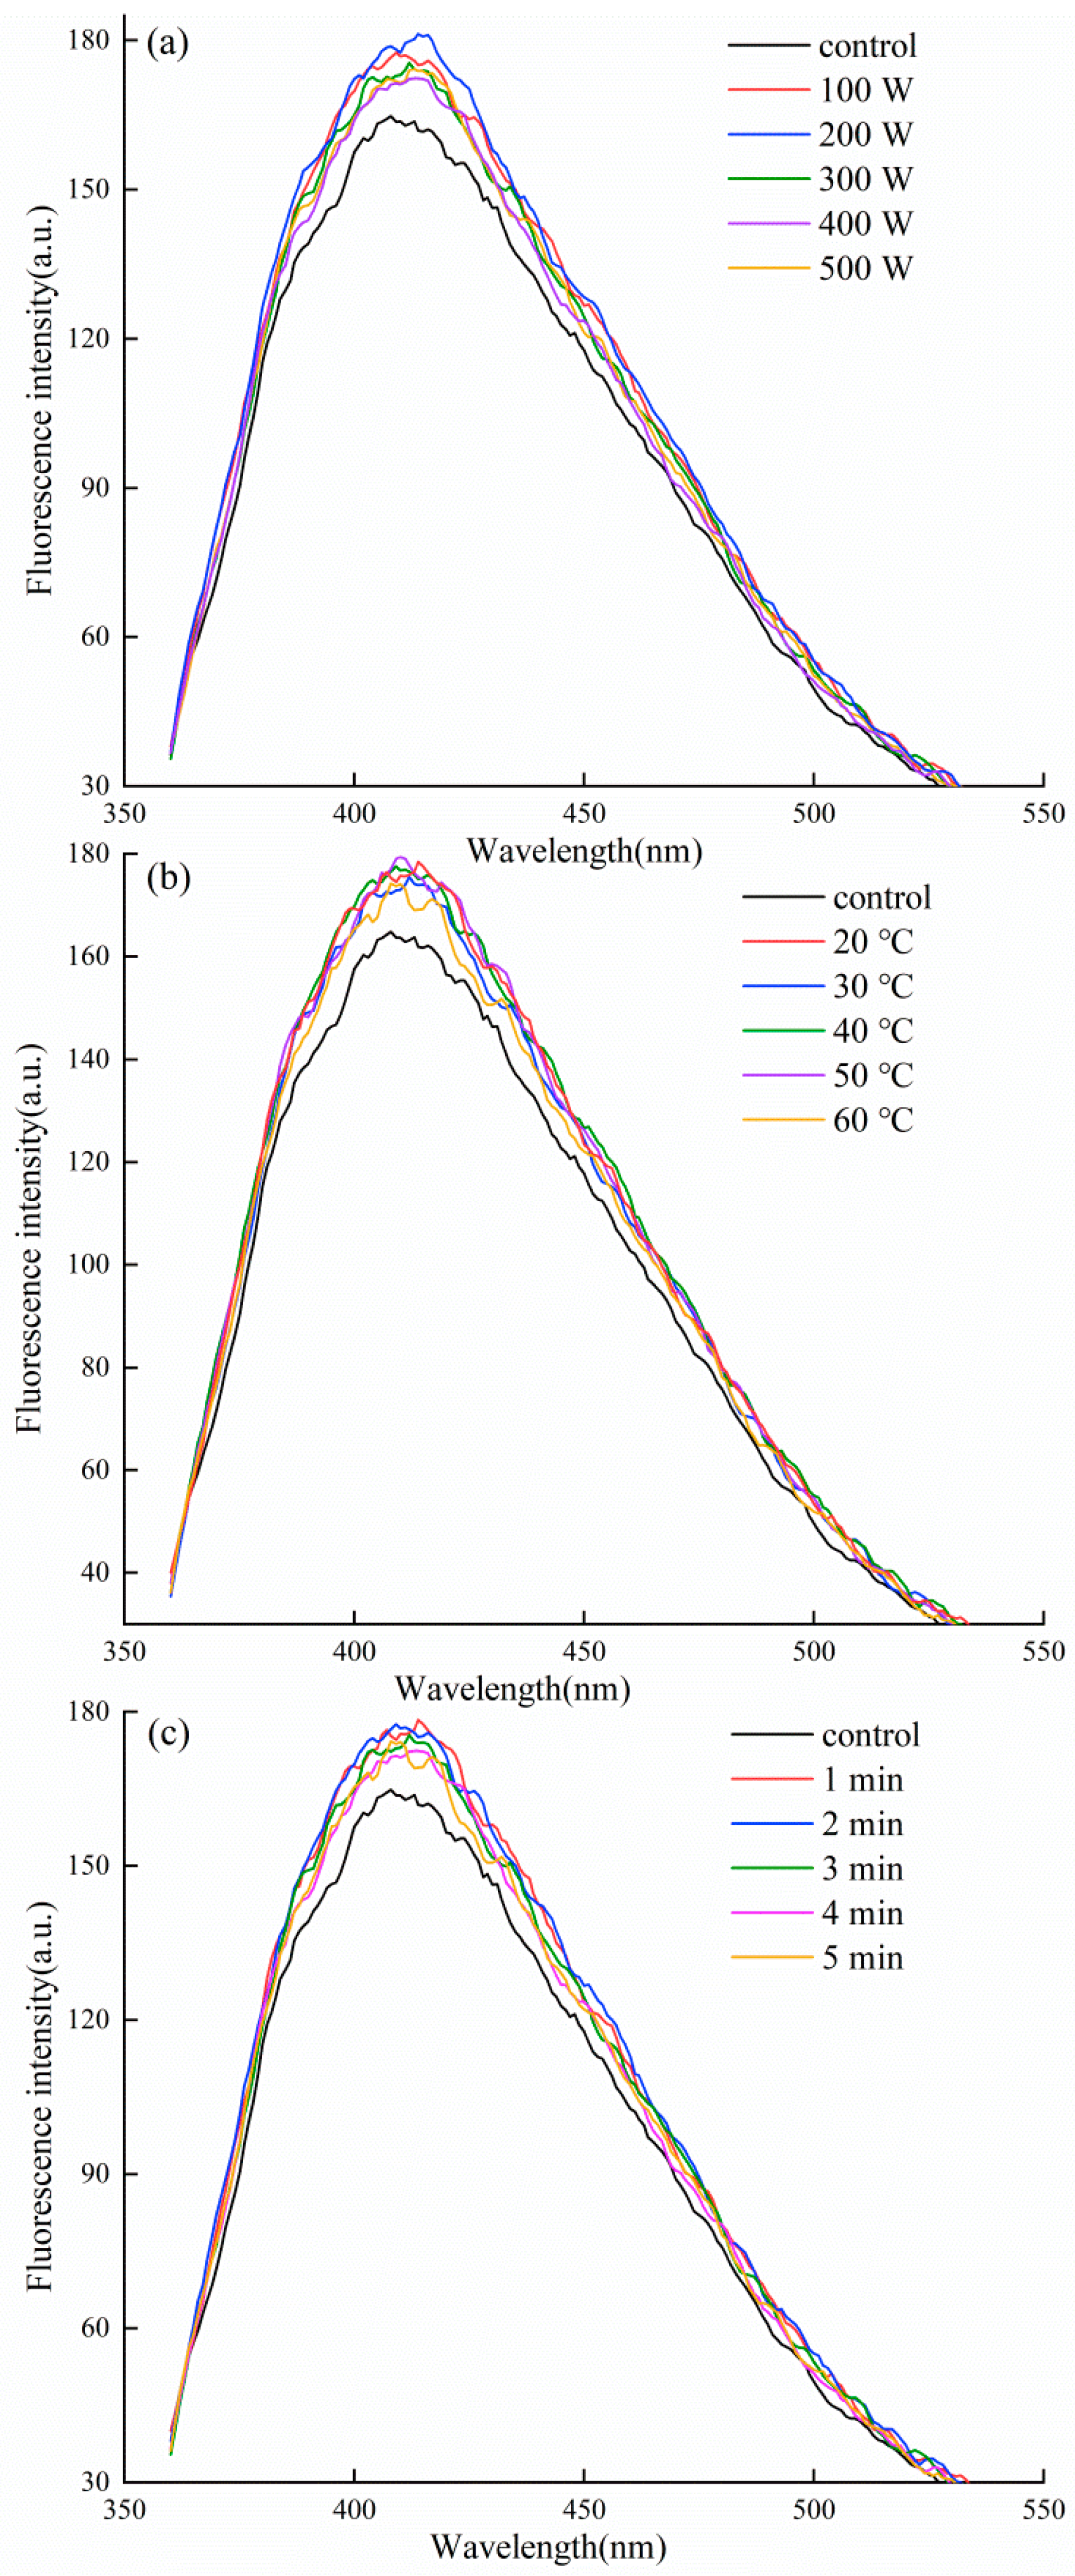
The age of the wine could be determined by analysis of fluorescence characteristics. The fluorescence intensity increased with the improvement of wine quality [26], and the fluorescence intensity of red wine was enhanced with the extension of ageing time [27]. Apart from alcohols, aldehydes, acids, and esters, other fluorescent molecules present in wine were amino acids and vitamins [28]. The fluorescence spectrum could be considered as a fingerprint of the red wine sample. As shown in Figure 5, the fluorescence spectra of untreated and microwave-treated red wine were similar, which showed that microwave-treated red wine could only change the fluorescence intensity, but not the spectral characteristics. The fluorescence intensity of red wine treated by microwave irradiation was higher than that of untreated red wine, which showed that microwave technology improved the red wine quality to a certain extent.
The fluorescence intensity of red wine initially increased and then decreased with the increase in microwave output power from 100 W to 500 W, and the fluorescence intensity of red wine was the highest at 200 W. The results showed that the lower microwave power was beneficial in improving the quality of red wine. The effect on fluorescence characteristics was studied at microwave temperatures of 20, 30, 40, 50, and 60 °C, with other parameters fixed at 300 W and 3 min. The fluorescence intensity of red wine treated with different microwave temperatures was higher than that of untreated red wine; this phenomenon showed that different microwave temperature treatments improved red wine quality, and microwave technology could shorten ageing time from the view of microwave temperature. The effect of microwave time from 1 to 5 min on the fluorescence intensity of red wine was studied at 300 W and 30 ± 1.5 °C. The fluorescence intensity of red wine treated with different microwave times was significantly higher than that of untreated red wine, and the fluorescence intensity of red wine gradually decreased with the increase in microwave treatment time, indicating that short-time microwave treatment improved the quality of red wine, and the result was instructive for microwave ageing technology.

3.6. Influence of Flavan-3-Ols in Red Wine by Microwave Treatment

The structure type of flavan-3-ols affected the mouthfeel of red wine. Flavan-3-ols are a typical polyphenolic compound with the characteristic of fluorescence absorption [29]. The content of flavan-3-ols was related to fluorescence spectroscopy at λexc/em 340/420 [26], which might be due to extending the carbon chain and enhancing the hydrophobicity during the polymerization of flavan-3-ols, thus increasing the intensity of fluorescence [30]. Although the fluorescence properties of red wine were influenced by multiple factors, flavan-3-ols represented a typical polyphenolic compound with intrinsic fluorescent characteristics. Determining flavan-3-ols content might provide insights into the mechanism responsible for the change in the fluorescence intensity by microwave treatment in red wine. Table 1 shows that microwave treatment (varying power, temperature, and time) reduced the flavan-3-ol content of red wine relative to the untreated control. Interestingly, it was contrary to the observed increase in fluorescence intensity in red wine under microwave irradiation, which may be due to the fact that the flavan-3-ols (such as catechin, epicatechin, gallocatechin, and epigallocatechin) in red wine would easily polymerize with anthocyanins or themselves to form dimers or polymers [31], or due to more free radicals induced by microwave irradiation [12]. The enhancement of fluorescence intensity under microwave irradiation is shown in Figure 5, which might be related to the extension of the carbon chain and the enhancement of hydrophobicity during oxidative polymerization of flavan-3-ols indicated in Table 1. In addition to flavan-3-ols, the increase in fluorescence intensity in red wine under microwave radiation was also related to the changes in other fluorescent substances. Therefore, the mechanism for the increased fluorescence intensity in red wine after microwave treatment remained unclear and required further study.

3.7. Sensory Evaluation

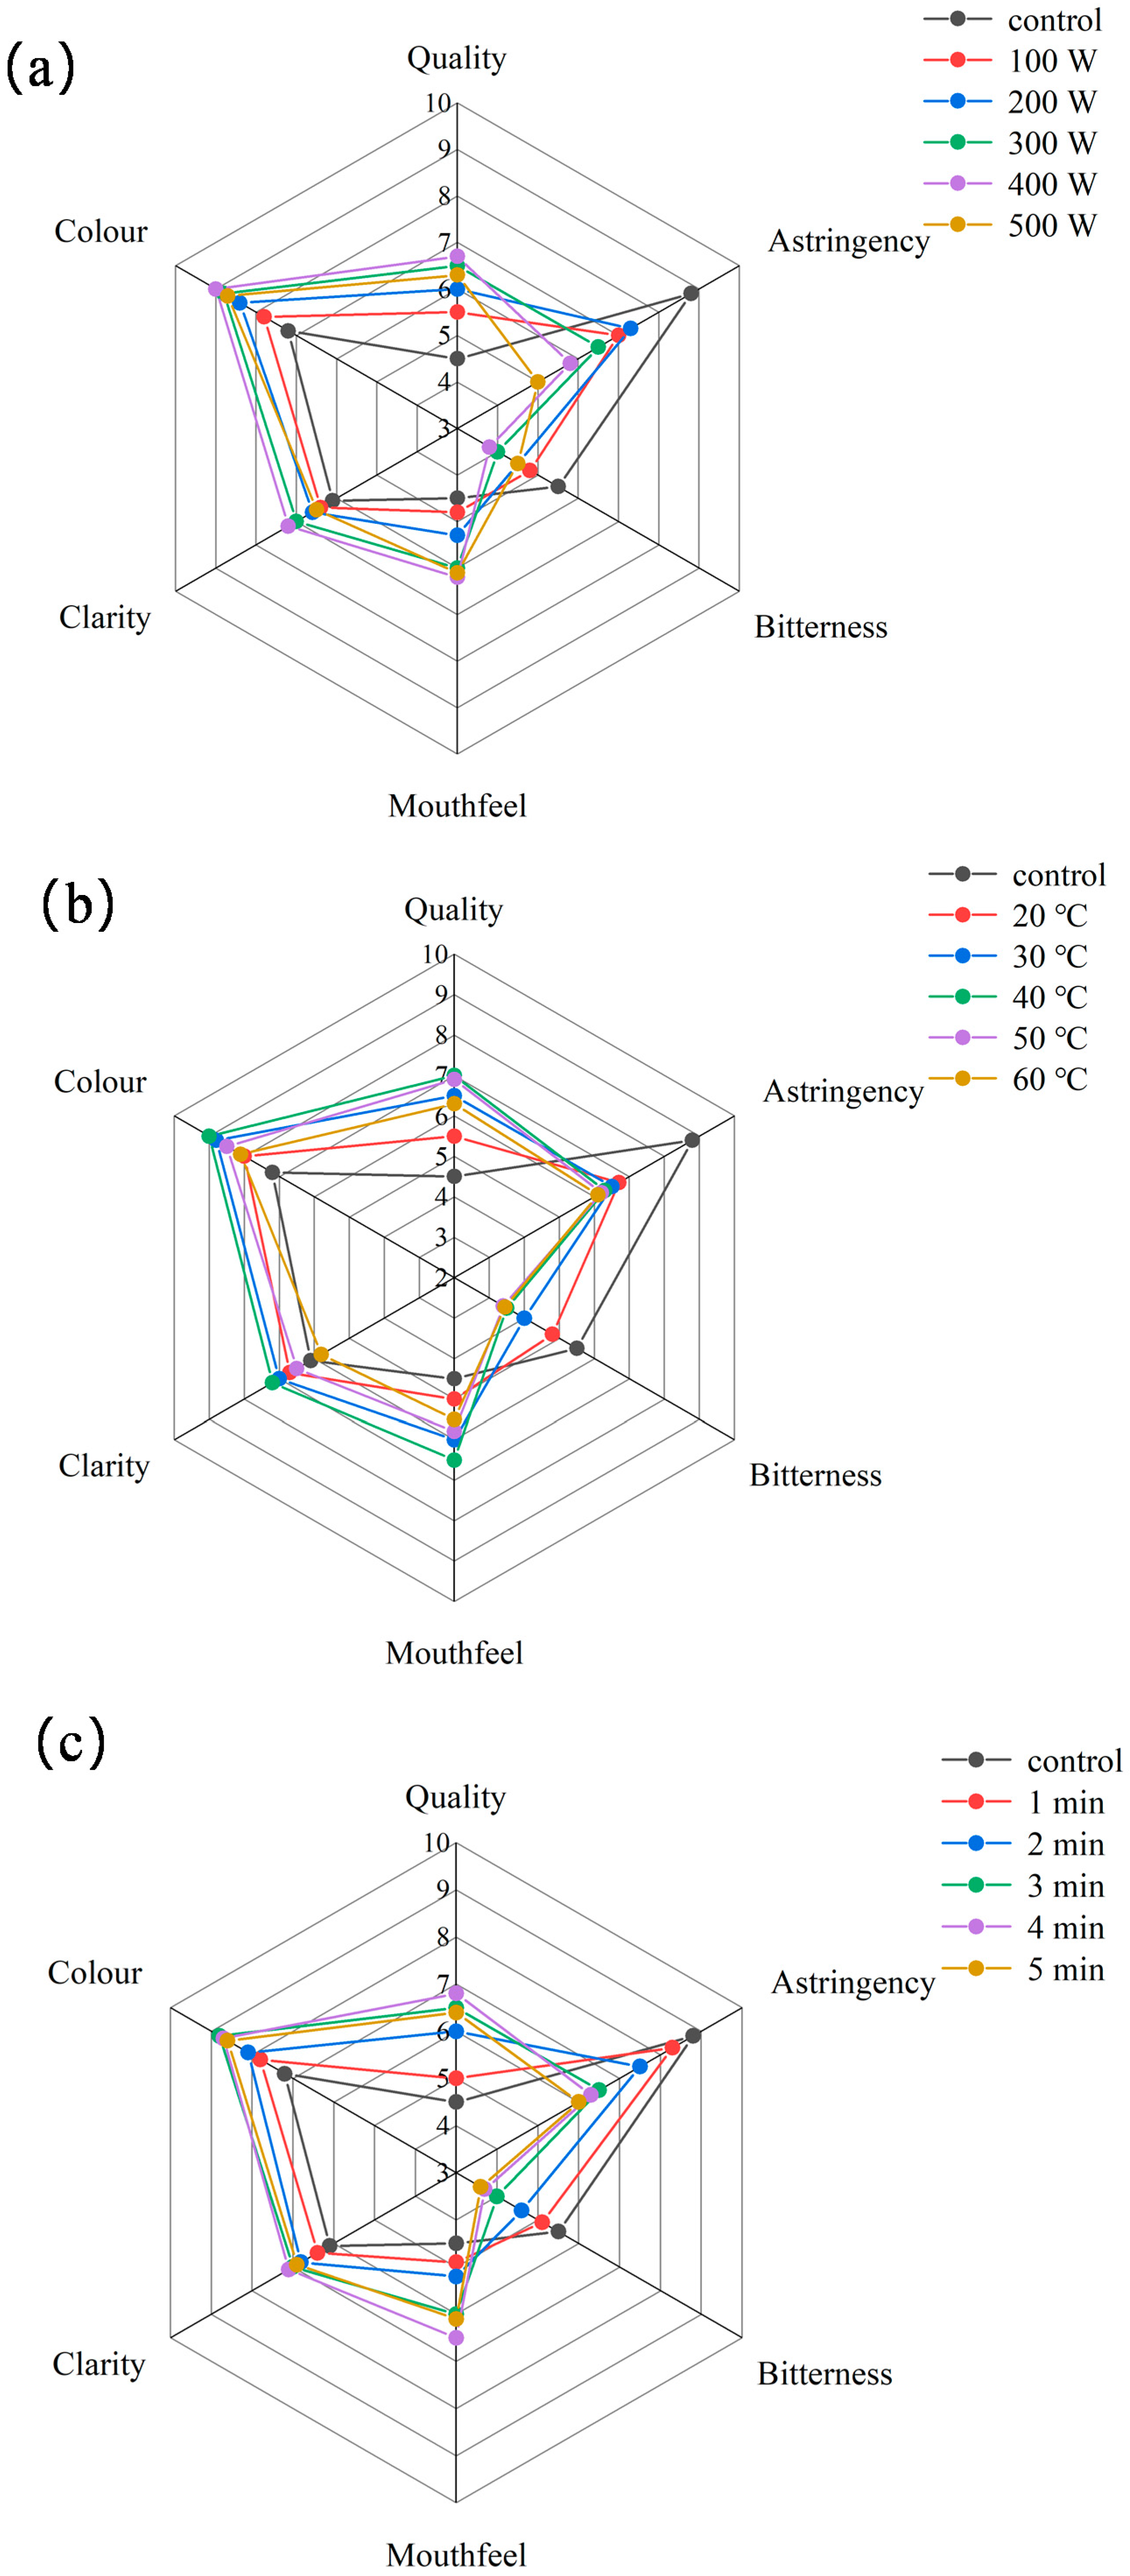
Figure 6 showed the sensory evaluation of all wine samples (different microwave power, microwave temperature, microwave time) by 12 professionally trained assessors, with sensory scores ranging from 4.1 to 8.9, which showed that there were differences in the degree of sensory characteristics in different-treated wines, especially between the control wine and microwave-treated wine. Different microwave power, temperature, and time could improve wine quality, colour, clarity, and mouthfeel characteristics, especially at a microwave power of 400 W, microwave temperature of 40 °C, and microwave time of 3 min. The present study demonstrated that different microwave treatment conditions could reduce the astringency and bitterness characteristics of wine. This might be attributed to microwave irradiation promoting reactions or transformations of components responsible for astringency and bitterness [13], while also altering the binding capacity of tannins with proteins [16], thereby modifying the astringency characteristic. Furthermore, microwave treatment might facilitate the polymerization or conversion of pigment components [15], consequently enhancing the colour expression of wine. This experiment revealed that microwave treatment exerted regulatory effects on the astringency, mouthfeel, clarity, and colour attributes of wine by influencing its particle size distribution, rheological properties, fluorescence spectrum, and flavan-3-ol content. The findings preliminarily indicated that microwave treatment represented an effective technique for improving the sensory quality of wine, particularly in optimizing colour, clarity, and mouthfeel characteristics, demonstrating potential for application in the industrial production of wine.

4. Conclusions

In this study, red wine was treated with different microwave powers (100–500 W), temperatures (20–60 °C), and times (1–5 min) to systematically investigate their effects on particle size distribution, the rheological characteristics, fluorescence spectrum, and sensory characteristics. Through the friction effects and oxidative polymerization by microwave irradiation, microwave treatment changed particle size distribution, leading to form a more stable and uniform solution. This change might enhance the visual impact and mouthfeel of wine. Microwave technology might improve the leg phenomenon and thickening effect by changing the rheological constant, yield stress, and viscosity coefficient. Under different microwave conditions, the fluorescence intensity of wine increased due to the oxidative polymerization of fluorescent substances, such as the polymerization of flavan-3-ols. Microwave treatment had a positive effect on wine sensory characteristics; however, the mechanism of change in sensory characteristics in wine storage has not yet been studied. The findings of this study provided experimental evidence and technical references for the potential application of microwave technology in wine production. Furthermore, future efforts could focus on optimizing microwave parameters and conducting pilot-scale trials to promote the industrial implementation of this technique.

Author Contributions

Conceptualization, J.-F.Y.; formal analysis, X.-L.Y. and J.-F.Y.; methodology, X.-L.Y.; software, Z.-Y.C.; validation, X.-W.Y.; investigation, X.-L.Y.; resources, W.-T.D.; data curation, Z.-Y.C.; writing—original draft, X.-L.Y. and Z.-Y.C.; writing—review and editing, J.-F.Y.; visualization, K.S. and D.-Z.L. All authors have read and agreed to the published version of the manuscript.

Funding

This research received no external funding.

Institutional Review Board Statement

Ethical oversight for the sensory evaluation was provided by the School of Medical Technology and Engineering at Henan University of Science and Technology. Written informed consent was obtained from all participants after a comprehensive explanation of the study. The experiments, classified as low-risk due to their non-invasive nature, were conducted in accordance with ethical standards. Although this classification did not necessitate a formal approval number, all procedures followed ethical guidelines under the school’s supervision.

Informed Consent Statement

Informed consent was obtained from all subjects involved in the study.

Data Availability Statement

The original contributions presented in this study are included in the article. Further inquiries can be directed to the corresponding author.

Conflicts of Interest

Author Z.-Y.C. was employed by the company Guangdong 3SBio Pharmaceutical Co., Ltd. The remaining authors declare that the research was conducted in the absence of any commercial or financial relationships that could be construed as potential conflicts of interest.

Abbreviations

The following abbreviations are used in this manuscript:
CMCC-MIclosed microwave irradiation system with magnetic stirring and temperature-controlled cooling
γshear rate
τshear stress
nrheological constant
Kviscosity coefficient

References

  1. Sánchez-Córdoba, C.; Durán-Guerrero, E.; Castro, R. Olfactometric and sensory evaluation of red wines subjected to ultrasound or microwaves during their maceration or ageing stages. LWT-Food Sci. Technol. 2021, 144, 111228. [Google Scholar] [CrossRef]
  2. Carpena, M.; Pereira, A.G.; Prieto, M.A.; Simal-Gandara, J. Wine aging technology: Fundamental role of wood barrels. Foods 2020, 9, 1160. [Google Scholar] [CrossRef]
  3. Jackson, R.S. Postfermentation treatments and related topics. Wine Sci. 2008, 2, 418–519. [Google Scholar] [CrossRef]
  4. García Martín, J.F.; Sun, D.W. Ultrasound and electric fields as novel techniques for assisting the wine ageing process: The state-of-the-art research. Trends Food Sci. Technol. 2013, 33, 40–53. [Google Scholar] [CrossRef]
  5. Celotti, E.; Stante, S.; Ferraretto, P.; Román, T.; Nicolini, G.; Natolino, A. High power ultrasound treatments of red young wines: Effect on anthocyanins and phenolic stability indices. Foods 2020, 9, 1344. [Google Scholar] [CrossRef]
  6. Tao, Y.; García, J.F.; Sun, D.W. Advances in wine aging technologies for enhancing wine quality and accelerating wine aging process. Crit. Rev. Food Sci. 2014, 54, 817–835. [Google Scholar] [CrossRef] [PubMed]
  7. Guo, Q.S.; Sun, D.W.; Cheng, J.H.; Han, Z. Microwave processing techniques and their recent applications in the food industry. Trends Food Sci. Technol. 2017, 67, 236–247. [Google Scholar] [CrossRef]
  8. Carew, A.L.; Sparrow, A.M.; Curtin, C.D.; Close, D.C.; Dambergs, R.G. Microwave maceration of Pinot Noir grape must: Sanitation and extraction effects and wine phenolics outcomes. Food Bioprocess Technol. 2014, 7, 954–963. [Google Scholar] [CrossRef]
  9. Carew, A.L.; Connew, S.; Close, D.C.; Dambergs, R.G. Microwave maceration for control of laccase and enhanced phenolic. In Proceedings of the Outcomes in Shiraz Wine 15th Australian Wine Industry Technical Conference 2013, Sydney, Australia, 16 July 2013. [Google Scholar]
  10. Sádecká, J.; Jakubíková, M. Varietal classification of white wines by fluorescence spectroscopy. J. Food Sci. Technol. 2020, 57, 2545–2553. [Google Scholar] [CrossRef]
  11. Zheng, X.Z.; Liu, C.H.; Huo, J.W.; Li, C. Effect of the microwave irradiated treatment on the wine sensory properties. Int. J. Food Eng. 2011, 7, 71–78. [Google Scholar] [CrossRef]
  12. Yuan, J.F.; Wang, T.T.; Wang, D.H.; Zhou, G.H.; Zou, G.X.; Wang, Y.; Gong, M.G.; Zhang, B. Effect of microwave on changes of gallic acid and resveratrol in a model extraction solution. Food Bioprocess Technol. 2020, 13, 1246–1254. [Google Scholar] [CrossRef]
  13. Yuan, J.F.; Chen, Z.Y.; Wang, D.H.; Gong, M.G.; Qiu, Z.J. Microwave-induced free radicals production in red wine and model wine by electron paramagnetic resonance spin trapping. J. Food Process. Preserv. 2021, 45, e15407. [Google Scholar] [CrossRef]
  14. Yuan, J.F.; Lai, Y.T.; Chen, Z.Y.; Song, H.X.; Zhang, J.; Wang, D.H.; Gong, M.G.; Sun, J.R. Microwave Irradiation: Effects on the Change of Colour Characteristics and Main Phenolic Compounds of Cabernet Gernischt Dry Red Wine during Storage. Foods 2022, 11, 1778. [Google Scholar] [CrossRef]
  15. Yuan, J.F.; Chen, Z.Y.; Lai, Y.T.; Qiu, Z.J.; Wang, D.H.; Zhao, J.F.; Sun, J.R.; Li, X. Microwave irradiation: The influence on the production of xanthylium cation pigments in model wine. Food Bioprocess Technol. 2022, 15, 2210–2225. [Google Scholar] [CrossRef]
  16. Duan, W.T.; Yuan, J.F.; Wang, L.J.; Sun, M.X.; Yang, X.W.; Qiu, Z.J. Microwave-assisted extraction enhances the epicatechin and bovine serum albumin the interaction by inducing protein conformational changes. Food Chem. 2026, 505, 148055. [Google Scholar] [CrossRef]
  17. Zheng, X.H.; Zhang, M.; Fang, Z.X.; Liu, Y.P. Effects of low frequency ultrasonic treatment on the maturation of steeped greengage wine. Food Chem. 2014, 162, 264–269. [Google Scholar] [CrossRef]
  18. Xu, B.W.; Shen, Y.; Zhang, Q.A.; Zhao, W.Q.; Yi, X. Effect of ultrasound irradiation on the particle size distribution and rheological properties of red wine. CyTA-J. Food 2019, 17, 180–188. [Google Scholar] [CrossRef]
  19. Xu, J.G.; Wang, Z.B. Fluorescence Analysis Methods, 3rd ed.; Beijing Science Press: Beijing, China, 2006. [Google Scholar]
  20. Ivanova, V.; Stefova, M.; Vojnoski, B.; Dörnyei, A.; Márk, L.; Dimovska, V.; Stafilov, T.; Kilár, F. Identification of polyphenolic compounds in red and white grape varieties grown in R. Macedonia and changes of their content during ripening. Food Res. Int. 2011, 44, 2851–2860. [Google Scholar] [CrossRef]
  21. Chandrasekaran, S.; Ramanathan, S.; Basak, T. Microwave food processing-A review. Food Res. Int. 2013, 52, 243–261. [Google Scholar] [CrossRef]
  22. Thostenson, E.T.; Chou, T.W. Microwave processing: Fundamentals and applications. Compos. Part A-Appl. Sci. 1999, 30, 1055–1071. [Google Scholar] [CrossRef]
  23. Košmerl, T.; Abramovič, H.; Klofutar, C. The rheological properties of Slovenian wines. J. Food Eng. 2000, 46, 165–171. [Google Scholar] [CrossRef]
  24. Staroszczyk, H.; Fiedorowicz, M.; Opalińska-Piskorz, J.; Tylingo, R. Rheology of potato starch chemically modified with microwave-assisted reactions. LWT-Food Sci. Technol. 2013, 53, 249–254. [Google Scholar] [CrossRef]
  25. Airado-Rodríguez, D.; Durán-Merás, I.; Galeano-Díaz, T.; Wold, J.P. Front-face fluorescence spectroscopy: A new tool for control in the wine industry. J. Food Compos. Anal. 2011, 24, 257–264. [Google Scholar] [CrossRef]
  26. Airado-Rodríguez, D.; Galeano-Díaz, T.; Durán-Merás, I.; Wold, J.P. Usefulness of fluorescence excitation-emission matrices in combination with PARAFAC, as fingerprints of red wines. J. Agric. Food Chem. 2009, 57, 1711–1720. [Google Scholar] [CrossRef]
  27. Dufour, É.; Letort, A.; Laguet, A.; Lebecque, A.; Serra, J.N. Investigation of variety, typicality and vintage of French and German wines using front-face fluorescence spectroscopy. Anal. Chim. Acta 2006, 563, 292–299. [Google Scholar] [CrossRef]
  28. Hoenicke, K.; Simat, T.J.; Steinhart, H.; Kohler, H.J.; Schwab, A. Determination of free and conjugated indole-3-acetic acid, tryptophan, and tryptophan metabolites in grape must and wine. J. Agric. Food Chem. 2001, 49, 5494–5501. [Google Scholar] [CrossRef] [PubMed]
  29. Lei, X.Q.; Zhu, Y.Y.; Wang, X.Y.; Zhao, P.T.; Liu, P.; Zhang, Q.T.; Chen, T.G.; Yuan, H.H.; Guo, Y.R. Wine polysaccharides modulating astringency through the interference on interaction of flavan-3-ols and BSA in model wine. Int. J. Biol. Macromol. 2019, 139, 896–903. [Google Scholar] [CrossRef] [PubMed]
  30. Zhang, H.J.; Tao, F.R.; Cui, Y.Z.; Xu, Z. The aggregation induced fluorescence effect enhanced by a reasonable length of carbon chain. J. Mol. Liq. 2020, 302, 112550. [Google Scholar] [CrossRef]
  31. González-Manzano, S.; Dueñas, M.; Rivas-Gonzalo, J.C.; Escribano-Bailón, M.T.; Santos-Buelga, C. Studies on the copigmentation between anthocyanins and flavan-3-ols and their influence in the colour expression of red wine. Food Chem. 2008, 114, 649–656. [Google Scholar] [CrossRef]
Figure 1. Influence of microwave power on red wine particle size distribution.
Processes 14 00934 g001
Figure 2. Influence of microwave temperature on red wine particle size distribution.
Processes 14 00934 g002
Figure 3. Influence of microwave time on red wine particle size distribution.
Processes 14 00934 g003
Figure 4. Rheological curves of red wine treated with different microwave conditions (a) different microwave power treatments of red wine; (b) different microwave temperature treatments of red wine; (c) different microwave time treatments of red wine.
Processes 14 00934 g004
Figure 5. Fluorescence spectrum of untreated and microwave-treated red wine (a) different microwave power treatments of red wine; (b) different microwave temperature treatments of red wine; (c) different microwave time treatments of red wine.
Processes 14 00934 g005
Figure 6. Sensory evaluation graphics of wine at different microwave powers (a), temperatures (b), and times (c).
Processes 14 00934 g006
Table 1. Fitting results of rheological curves to the Power-law Model and flavan-3-ols concentration in red wine.
ParametersRheological
Constant n
Regression
Coefficient R2
Flavan-3-Ols
Concentration
(mg/mL)
Microwave powerUntreated1.3029 bc0.98590.4240 a
100 W1.2711 d0.97770.3264 b
200 W1.2941 c0.98020.2951 c
300 W1.2804 d0.97580.2553 e
400 W1.3053 b0.97950.2364 f
500 W1.3177 a0.98320.2714 d
Microwave temperatureUntreated1.3029 c0.98590.4240 a
20 °C1.2884 d0.97890.2857 c
30 °C1.2804 d0.97580.2553 d
40 °C1.3193 b0.98680.3264 b
50 °C1.3435 a0.99080.2468 e
60 °C1.2406 e0.97240.2344 f
Microwave timeUntreated1.3029 ab0.98590.4240 a
1 min1.3598 a0.98460.3027 b
2 min1.2755 b0.97580.2819 c
3 min1.2804 b0.97580.2553 d
4 min1.2588 b0.97490.2497 e
5 min1.2849 b0.98430.2809 c
The same lowercase letters signified no significant difference (p > 0.05).
Table 2. Fitting of red wine rheological properties to the Casson Model.
ParametersYield
Stress τ0 (Pa)
Viscosity Coefficient K (Pa s0.5) × 10−3Regression
Coefficient R2
Microwave powerUntreated0.6556 e2.8200 e0.9979
100 W0.7427 b2.8933 d0.9983
200 W0.7383 bc2.9167 c0.9992
300 W0.7769 a2.9367 b0.9993
400 W0.7308 c2.9167 c0.9991
500 W0.7141 d2.9967 a0.9980
Microwave temperatureUntreated0.6556 e2.8200 d0.9979
20 °C0.7283 c2.8200 d0.9995
30 °C0.7769 b2.9367 a0.9993
40 °C0.6775 d2.9200 b0.9989
50 °C0.6609 e2.9333 a0.9980
60 °C0.8073 a2.8933 c0.9981
Microwave timeUntreated0.6556 d2.8200 d0.9979
1 min0.6617 d2.9067 b0.9989
2 min0.7657 b2.8767 c0.9990
3 min0.7769 a2.9367 a0.9993
4 min0.7817 a2.8833 c0.9984
5 min0.7028 c2.8733 c0.9984
The same lowercase letter signified no significant difference (p > 0.05).
Disclaimer/Publisher’s Note: The statements, opinions and data contained in all publications are solely those of the individual author(s) and contributor(s) and not of MDPI and/or the editor(s). MDPI and/or the editor(s) disclaim responsibility for any injury to people or property resulting from any ideas, methods, instructions or products referred to in the content.