1. Introduction
Heavy oil and bitumen reservoirs constitute a significant portion of the world’s remaining petroleum resources, accounting for over half of global oil reserves and presenting both a major challenge and opportunity for the energy sector due to their high viscosity and low mobility. Thermal enhanced oil recovery (EOR) processes dominate the commercial development of heavy oil, as they introduce external heat to reduce oil viscosity and improve flowability in situ. The most commonly used thermal methods include cyclic steam stimulation (CSS), steam flooding, and steam-assisted gravity drainage (SAGD) systems [
1].
Steam flooding, by contrast, maintains a continuous steam front that pushes heated oil toward production wells, resulting in higher sweep efficiency in certain reservoir types. Steam-assisted gravity drainage (SAGD) represents another advanced thermal recovery technique, typically implemented using pairs of horizontal wells, in which steam injected into the upper well continuously heats the reservoir and allows gravity to assist mobilized oil toward the lower production well. SAGD can achieve significantly higher recovery factors (often above 60–70% of the oil in place) than cyclic steam processes and has been widely deployed in large oil sands projects [
2]. Although cyclic steam stimulation has been widely used in field operations, the recovery effects often deteriorate after multiple cycles, leading to diminished incremental oil production. Therefore, numerous studies have focused on optimizing CSS parameters, integrating steam additives, and combining CSS with other EOR methods to improve long-term efficiency [
3]. However, interactions between high-temperature fluids and reservoir rocks during cyclic stimulation induce significant alterations in reservoir porosity and permeability [
4], which not only affect stimulation efficiency but also determine long-term reservoir development strategies [
5]. For instance, understanding that the underwater distributary channel facies experiences faster property changes during early stimulation cycles may justify prioritizing these zones for initial development or adjusting steam injection parameters to avoid premature breakthrough. Consequently, investigating reservoir property variation patterns during cyclic steam stimulation is crucial for optimizing development strategies and improving recovery efficiency [
6]. To systematically elucidate the underlying mechanisms and achieve accurate prediction, an integrated methodology combining microscopic mechanisms and macroscopic characterization is essential [
7]. This can be achieved by coupling laboratory-scale mechanistic understanding with reservoir-scale macroscopic characterization through a multi-scale approach, thereby overcoming the limitations of single-scale investigation methods [
8]. Such an integrated research framework not only addresses the shortcomings of conventional approaches but also provides more reliable scientific guidance for reservoir development.
At the microscopic scale, core flooding experiments are widely employed to simulate rock property variations under reservoir conditions, capable of revealing mechanisms including pore structure alteration, mineral dissolution, and fluid–rock interactions [
9]. However, experimental results often fail to adequately represent the heterogeneity and complexity of actual reservoirs, particularly for reservoir characteristics controlled by depositional environments and sedimentary facies [
10]. On the other hand, 3D geological modeling using software such as Petrel can characterize reservoir heterogeneity and predict property variations at macroscopic scales [
11], though such models typically rely on simplified assumptions and lack support from microscopic mechanisms provided by experimental studies [
12]. Although previous studies have attempted to combine laboratory experiments with reservoir-scale modeling, most of them rely on either static pre- and post-stimulation comparisons or simplified parameter transfer between scales. The temporal resolution mismatch between laboratory observations and field-scale modeling remains insufficiently addressed. Reservoir models are typically constructed based on limited well data from several discrete stimulation stages, which cannot capture the continuous evolution of reservoir properties across multiple steam stimulation cycles. Meanwhile, laboratory experiments can provide detailed cycle-by-cycle variation data, but these results are rarely used to bridge intermediate stages in reservoir-scale simulations [
13].
Therefore, a time-resolved, facies-controlled micro–macro integration framework that bridges laboratory-scale cycle evolution with field-scale geological modeling has yet to be established. To address these limitations, this study innovatively establishes a “micro–macro” multi-scale coupled research framework. In this study, a 3D geological model was constructed using real field data to ensure macroscopic reliability, while 1D experiments provide high-resolution cycle-dependent property evolution data. The two approaches complement each other: The 3D model validates the macroscopic trend observed in laboratory experiments, and the experimental results fill the intermediate-cycle gaps that cannot be resolved by field data alone. This approach simultaneously captures pore-scale mechanistic details and reservoir-scale heterogeneity, fully revealing the patterns of reservoir property changes. First, 1D core steam stimulation cycle experiments quantitatively characterize the microscopic property variation patterns of two typical delta-front sedimentary rhythms (uniform rhythm and coarsening-upward rhythm) during stimulation [
14]. Second, dynamic 3D geological modeling based on Petrel software accurately depicts the macroscopic property variation characteristics of these two sedimentary rhythms [
15]. Finally, through dynamic interaction between experimental data and models, the mechanistic rules obtained at microscopic scales are embedded into macroscopic simulation processes, significantly improving the reliability of prediction results [
16]. This multi-scale research method not only overcomes the limitations of traditional single-scale approaches but also reveals the fundamental patterns of reservoir property variations. The study provides theoretical support for parameter optimization of multi-cycle steam stimulation cycle technology and offers significant reference value for guiding the development of similar heavy oil reservoirs.
2. Materials and Methods
2.1. Experimental Materials
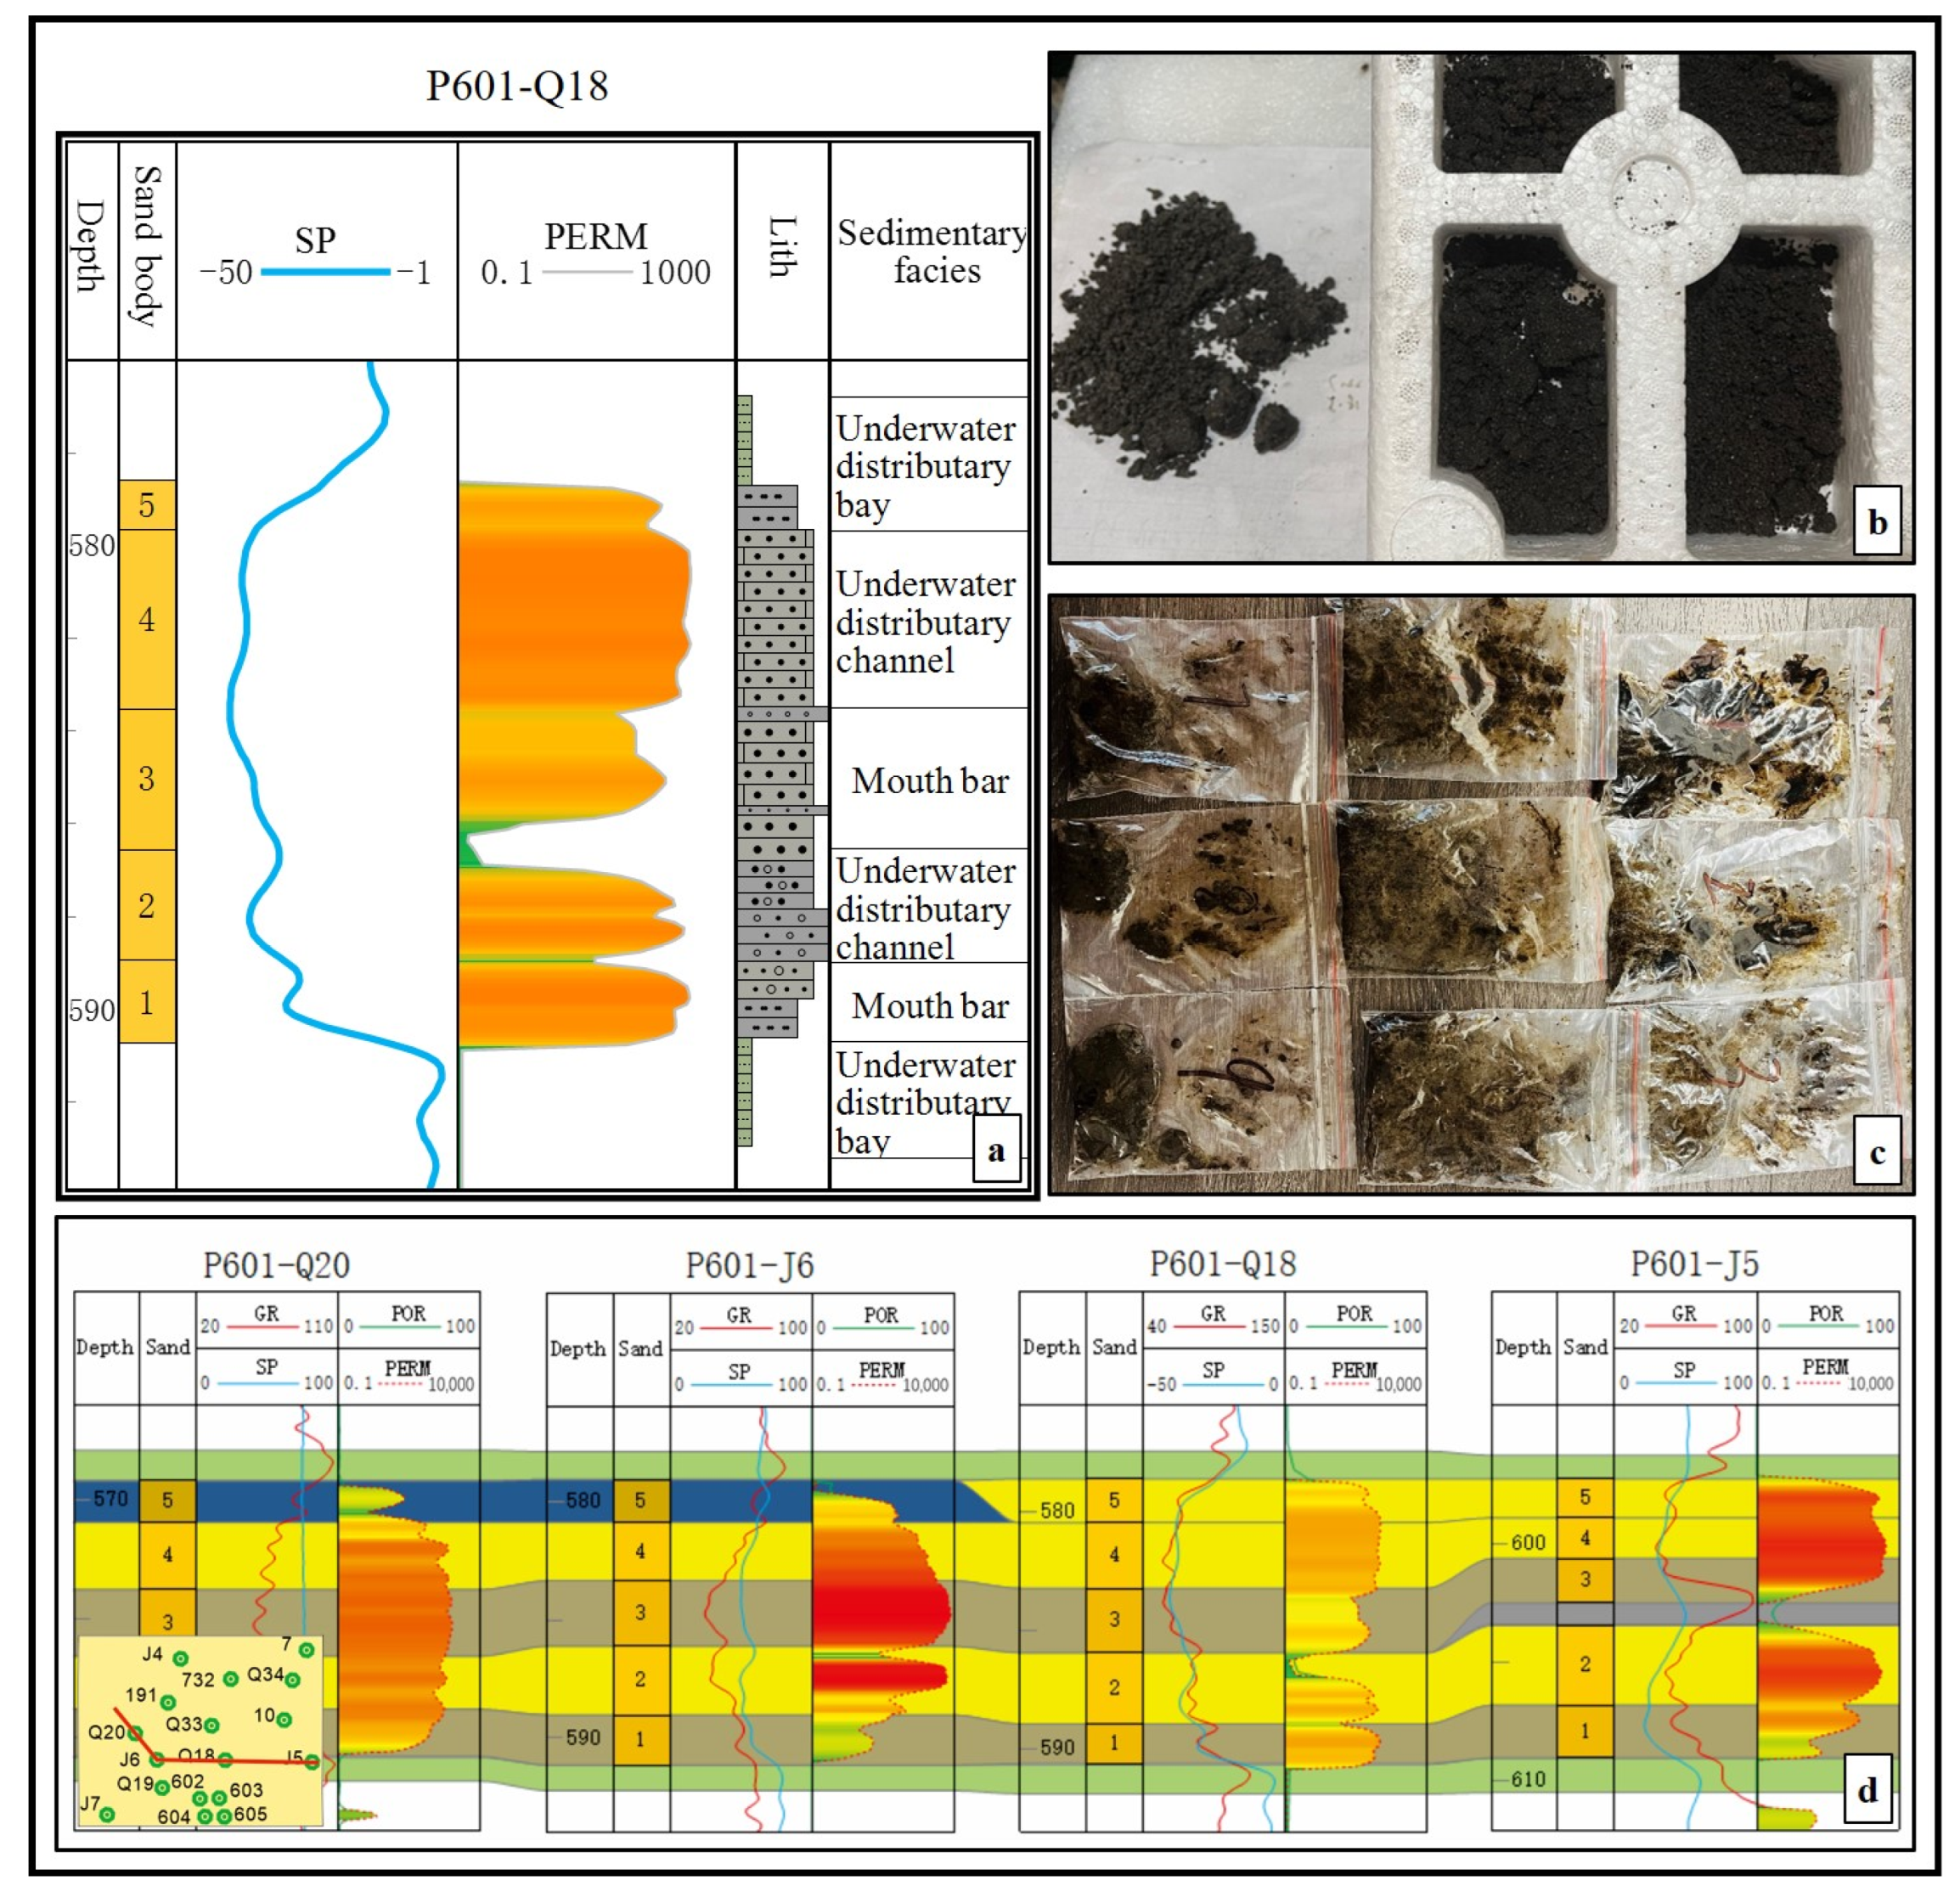
Core samples for the 1D steam stimulation cycle experiments were obtained from natural sandstone cores in shallow wells within the South P601 block. The grain-size distribution included six classes: fine gravel, coarse sand, Medium Sand, Fine Sand, silt, and Clay Minerals, with Medium Sand being the dominant fraction. The samples primarily contained Quartz, feldspar, and Clay Minerals. Due to the unconsolidated nature of the formation cores, sandpack preparation was used for sample pretreatment [
17]. Based on the sedimentary facies and rhythmic sequences in the study area, two sandpack models were prepared [
18]: one simulating the uniform rhythm of the underwater distributary channel facies, featuring a constant grain-size distribution from top to bottom, the other simulating the coarsening-upward rhythm of the mouth bar facies, exhibiting a systematic increase in grain-size from bottom to top (
Figure 1) [
18]. The uniform rhythm sandpack was uniformly packed with Medium Sand from Well Q18 (
Figure 1a), while the coarsening-upward rhythm sandpack was sequentially packed with six grain-size classes (fine gravel, coarse sand, Medium Sand, Fine Sand, silt, and Clay Minerals) from top to bottom using material from Well Q20 (
Figure 1b). The heavy oil samples were collected from shallow wells in the Shawan Formation reservoir of the South P601 block, with a density of 0.953 g/cm
3. The degassed oil viscosity was 57,211 mPa·s at 34 °C and 9860 mPa·s at 50 °C. Formation water was prepared to match the in situ CaCl
2-type formation water, with a total salinity of 34,911 mg/L and a chloride ion content of 21,308 mg/L. Steam and nitrogen were mixed according to the actual production ratio from the oilfield.
It should be noted that the sand-packed models were constructed using authentic reservoir sandstone samples obtained from the P601 South Block. Therefore, the pore structure characteristics, grain sorting, and cementation features of the experimental materials are directly derived from the target reservoir, ensuring geological consistency at the material level.
Nevertheless, we acknowledge that artificial sand-packed models inherently exhibit a higher degree of structural homogeneity compared to natural reservoirs, where heterogeneity occurs at multiple scales. The objective of this study is not to replicate the full spatial complexity of the reservoir, but to isolate and investigate the dominant sedimentary rhythm patterns (e.g., uniform rhythm and coarsening-upward rhythm) under controlled conditions. The sand-packed models are therefore designed to represent idealized end-member rhythm configurations rather than the complete heterogeneity spectrum of the field reservoir.
Consequently, while the experimental results effectively capture the mechanism associated with specific sedimentary rhythm types, deviations may exist when extrapolating to highly heterogeneous field conditions. This limitation should be considered when applying the findings to reservoir-scale predictions.
3D dynamic modeling experiments were conducted using Petrel software (Petrel 2022) to establish reservoir models for different periods [
19]. The seismic data were obtained from the Shawan Formation reservoir in the southern P601 block, while the well logging data incorporated various well types (vertical wells, shallow wells, deviated wells, and monitoring wells) with different drilling and production dates as well as varying steam stimulation cycles between 2009 and 2023, including nine conventional well logging curves, porosity–permeability–saturation curves from log reinterpretation, and rock volume curves. Additionally, cutting log data along with various temperature–pressure tests and laboratory analysis data of core samples were also included.
2.2. Apparatus
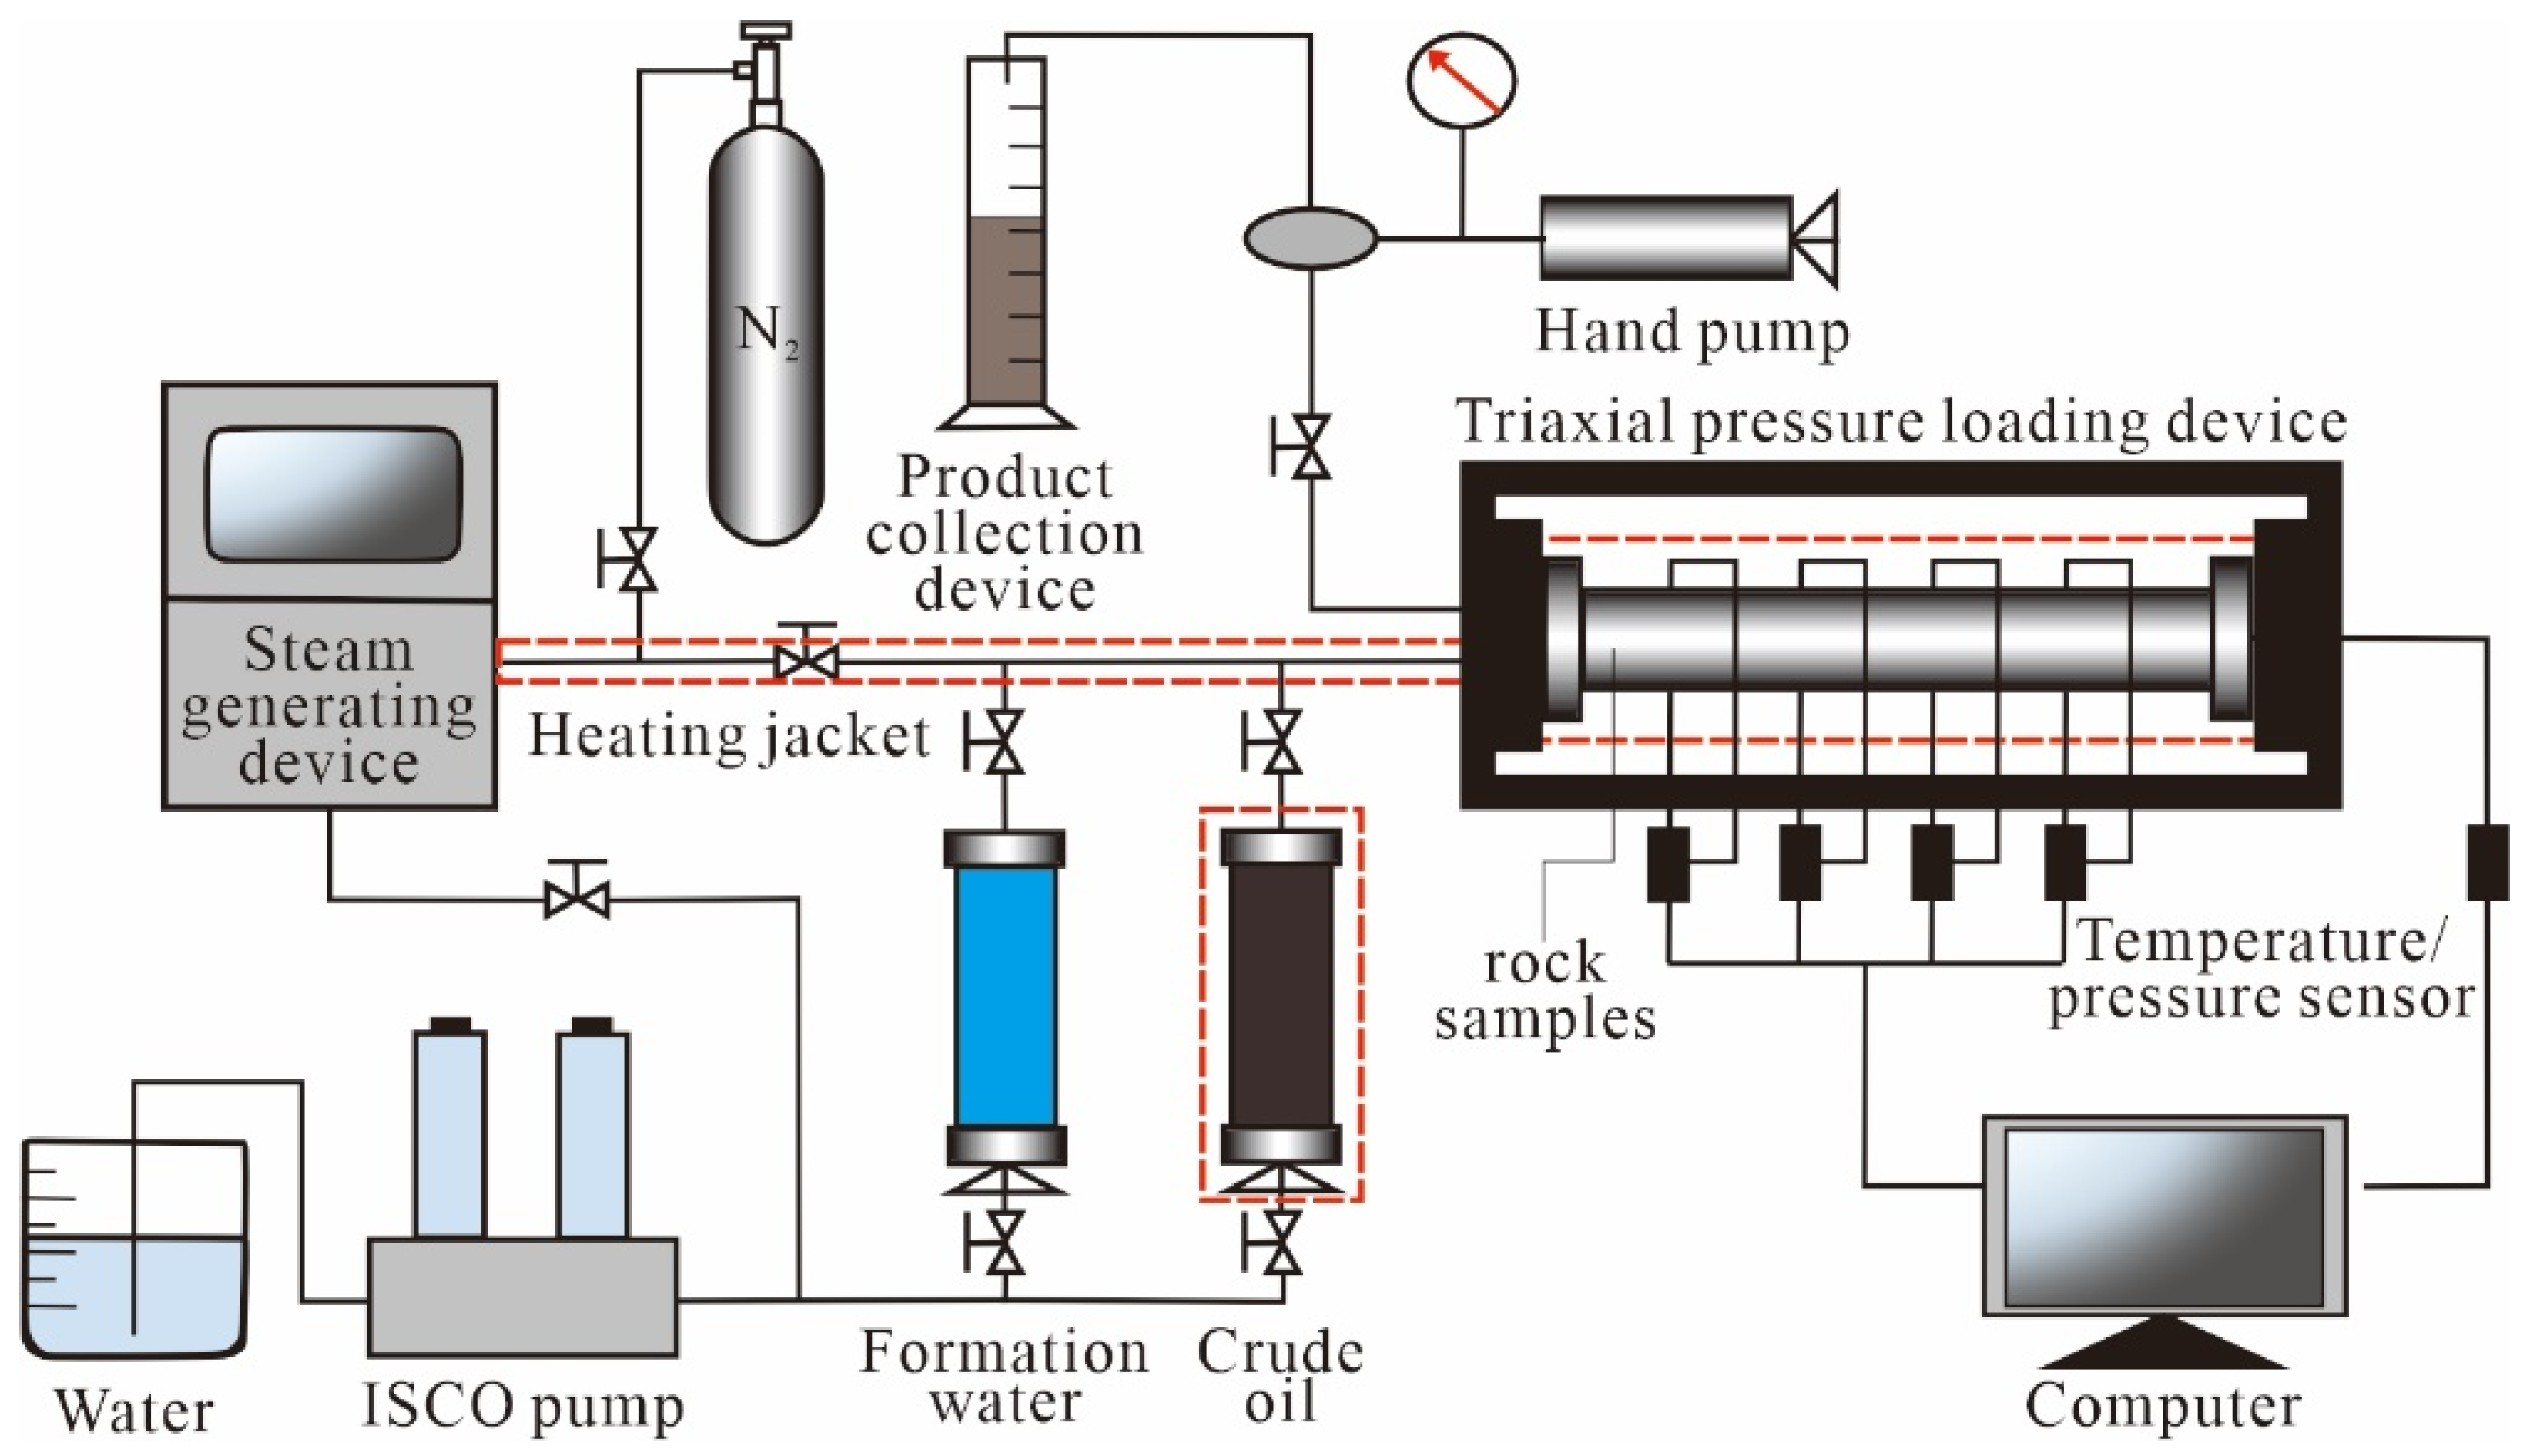
The experimental apparatus for 1D steam stimulation cycles comprised a steam generating device, nitrogen cylinder, hand pump, graduated cylinder, heating jacket, triaxial pressure loading device, temperature/pressure sensor, sandpack model, pressure gauge, ISCO pump, and electronic balance (
Figure 2).
For 3D dynamic modeling experiments, Resform software (Resform GeoOffice3.5) was employed for stratigraphic division and correlation, with Petrel software (Petrel 2022) being utilized to construct various geological models.
2.3. Experimental Parameters
2.3.1. Sandpack Parameters
To simulate the sedimentary facies rhythm characteristics of the original formation, two sandpacks were packed with different sand samples, and their parameters were recorded (
Table 1). Porosity and permeability were measured as described in
Section 2.4.1. Sandpack 1 was uniformly packed with Medium Sand sandstone samples from Well P601-Q18 to simulate the underwater distributary channel facies formation dominated by uniform rhythm. Sandpack 2 was sequentially packed from top to bottom with six grain-size classes (fine gravel, coarse sand, Medium Sand, Fine Sand, silt, and Clay Minerals) from Well P601-Q20 to simulate the mouth bar facies formation, characterized by a coarsening-upward rhythm.
The parameters of the experimental sandpacks are listed in
Table 1, where L is the length, D is the diameter, φ is the porosity, K is the permeability (μm
2), and T is the injection temperature.
2.3.2. Gas Injection Parameter Calculation
In field practice, the standard practice involves first injecting 3 × 10
4 m
3 of nitrogen followed by 2.1 × 10
3 tons of steam in each cycle, with gas injection pressure and duration varying according to operational conditions. To simulate actual field production scenarios, this experiment considers only the gas injection volume while disregarding injection pressure and duration [
5]. To ensure complete gas injection, the actual injected gas volume was determined based on pressure gauge readings from the sandpack. Based on the oilfield’s gas injection ratio, the injection volumes are converted to pressure values for the two-stage sandpack injection. This equation is derived from Boyle’s law, ensuring the field gas-to-steam volume ratio (100:7) is maintained within the fixed pore volume of the sandpack:
where P
1 is the pressure after nitrogen injection (MPa), and P
2 is the pressure after steam injection (MPa).
2.4. Experimental Procedures
2.4.1. 1D Steam Stimulation Experiments
The experimental procedure consisted of seven sequential steps: (1) packing sand samples into the sandpack and measuring the initial weight (M1); (2) conducting oil saturation by injecting crude oil at 0.2 mL/min until oil breakthrough at the outlet, then recording the saturated weight (M2) to calculate pore volume (M2–M1), followed by permeability measurement through continuous oil injection until approximately 10 pore volumes were displaced while recording stabilized pressure to determine oil-phase permeability; (3) injecting nitrogen at 1 MPa followed by steam at 3.33 MPa; (4) maintaining 1 h well soaking; (5) initiating production post-soaking by gradually releasing pressure through the inlet valve until reaching the preset backpressure with no fluid outflow. The volume of produced solids and semi-solids was determined from the total produced fluid. This volume is equated to the increase in pore space, allowing for the calculation of porosity change. Then, backpressure is applied at the outlet while injecting hot water to record pressure differential and flow rate data for permeability calculation. No confining pressure was applied during the permeability measurements, and all experiments were conducted under laboratory ambient pressure conditions; (6) repeating the complete stimulation cycle until meeting experimental design requirements; (7) processing all experimental data to calculate porosity, permeability and related parameters.
2.4.2. 3D Dynamic Modeling Experiments
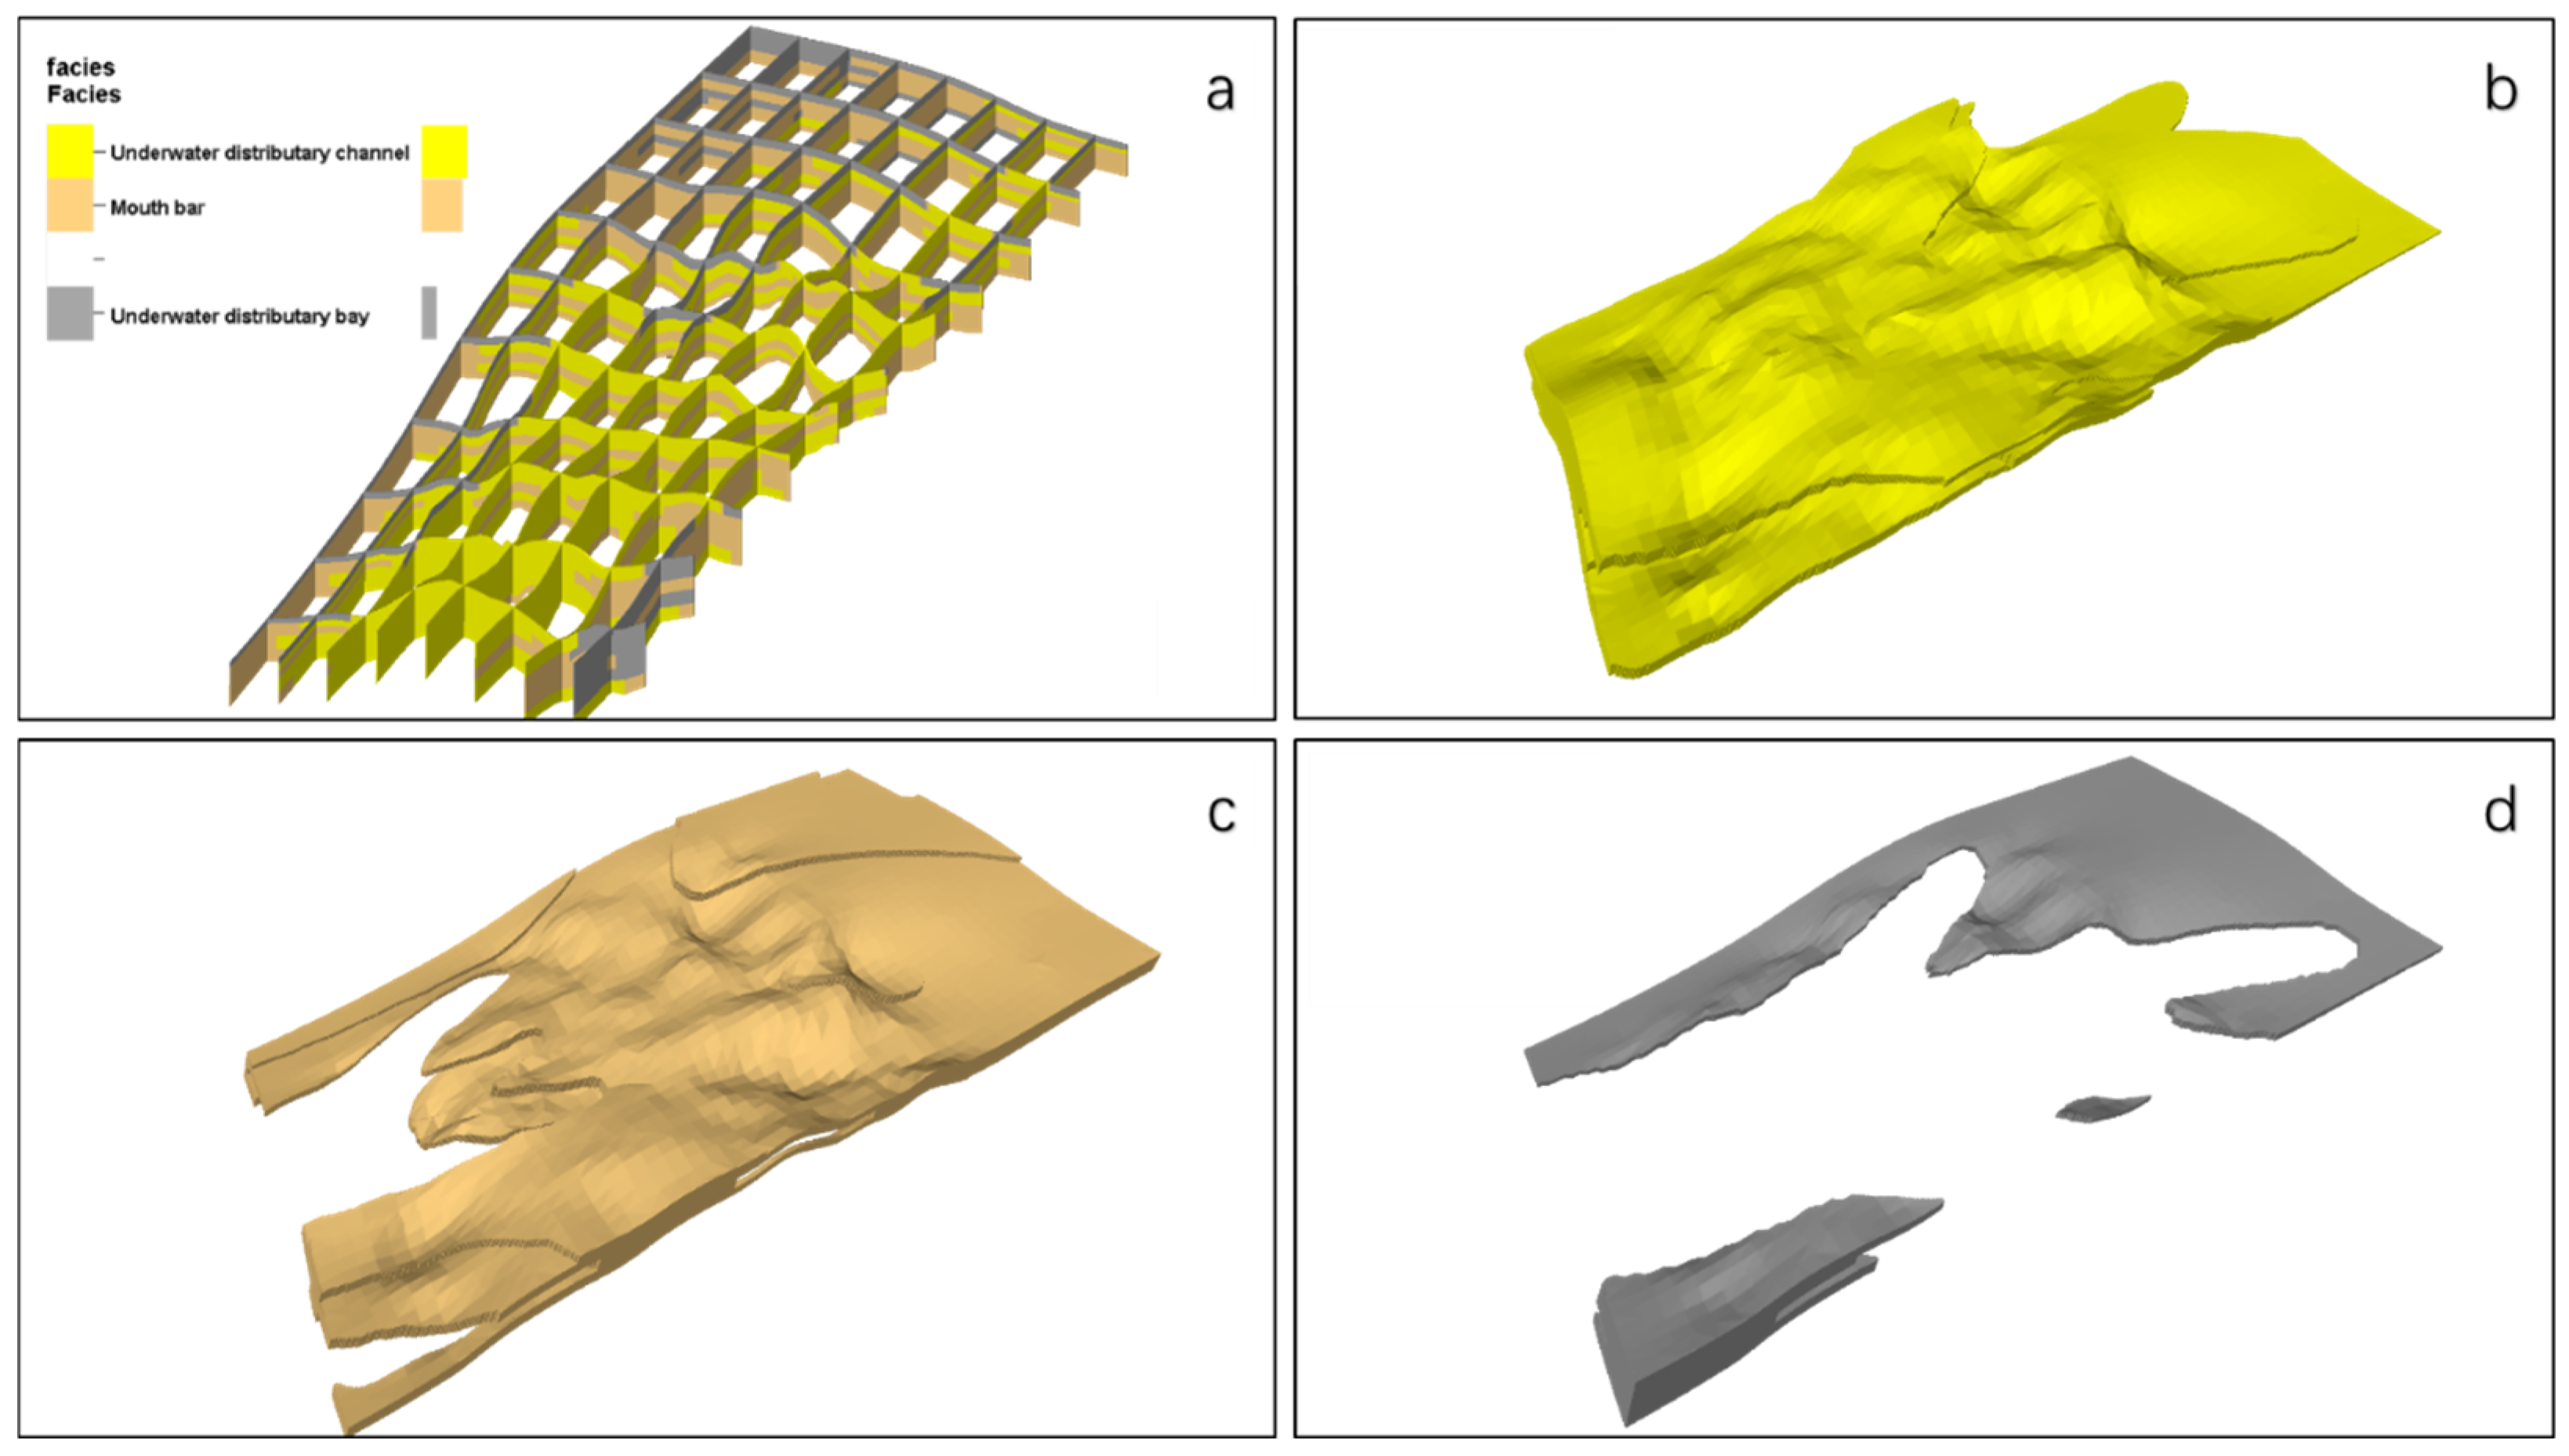
The experimental procedure comprised four key steps: (1) stratigraphic division and correlation, where target formations were divided into five sand bodies through well–seismic integration using logging and seismic data; (2) lithofacies and sedimentary microfacies classification, further distinguishing the underwater distributary channel, underwater distributary bay, and mouth bar microfacies within the delta-front subfacies; (3) the construction of static 3D models by importing well–seismic data into Petrel to establish structural and sedimentary facies models, followed by porosity and permeability modeling constrained by the facies model; and (4) dynamic variation characterization through establishing multiple-stage porosity–permeability models based on pre- and post-stimulation well data, enabling analysis of property variation patterns across different sedimentary facies at various stages. Model dimensions: 3920 m (I-direction) × 5510 m (J-direction) × 214 m (K-direction). Grid dimensions: 392 cells (I) × 551 cells (J) × 50 layers (K).
4. Discussion
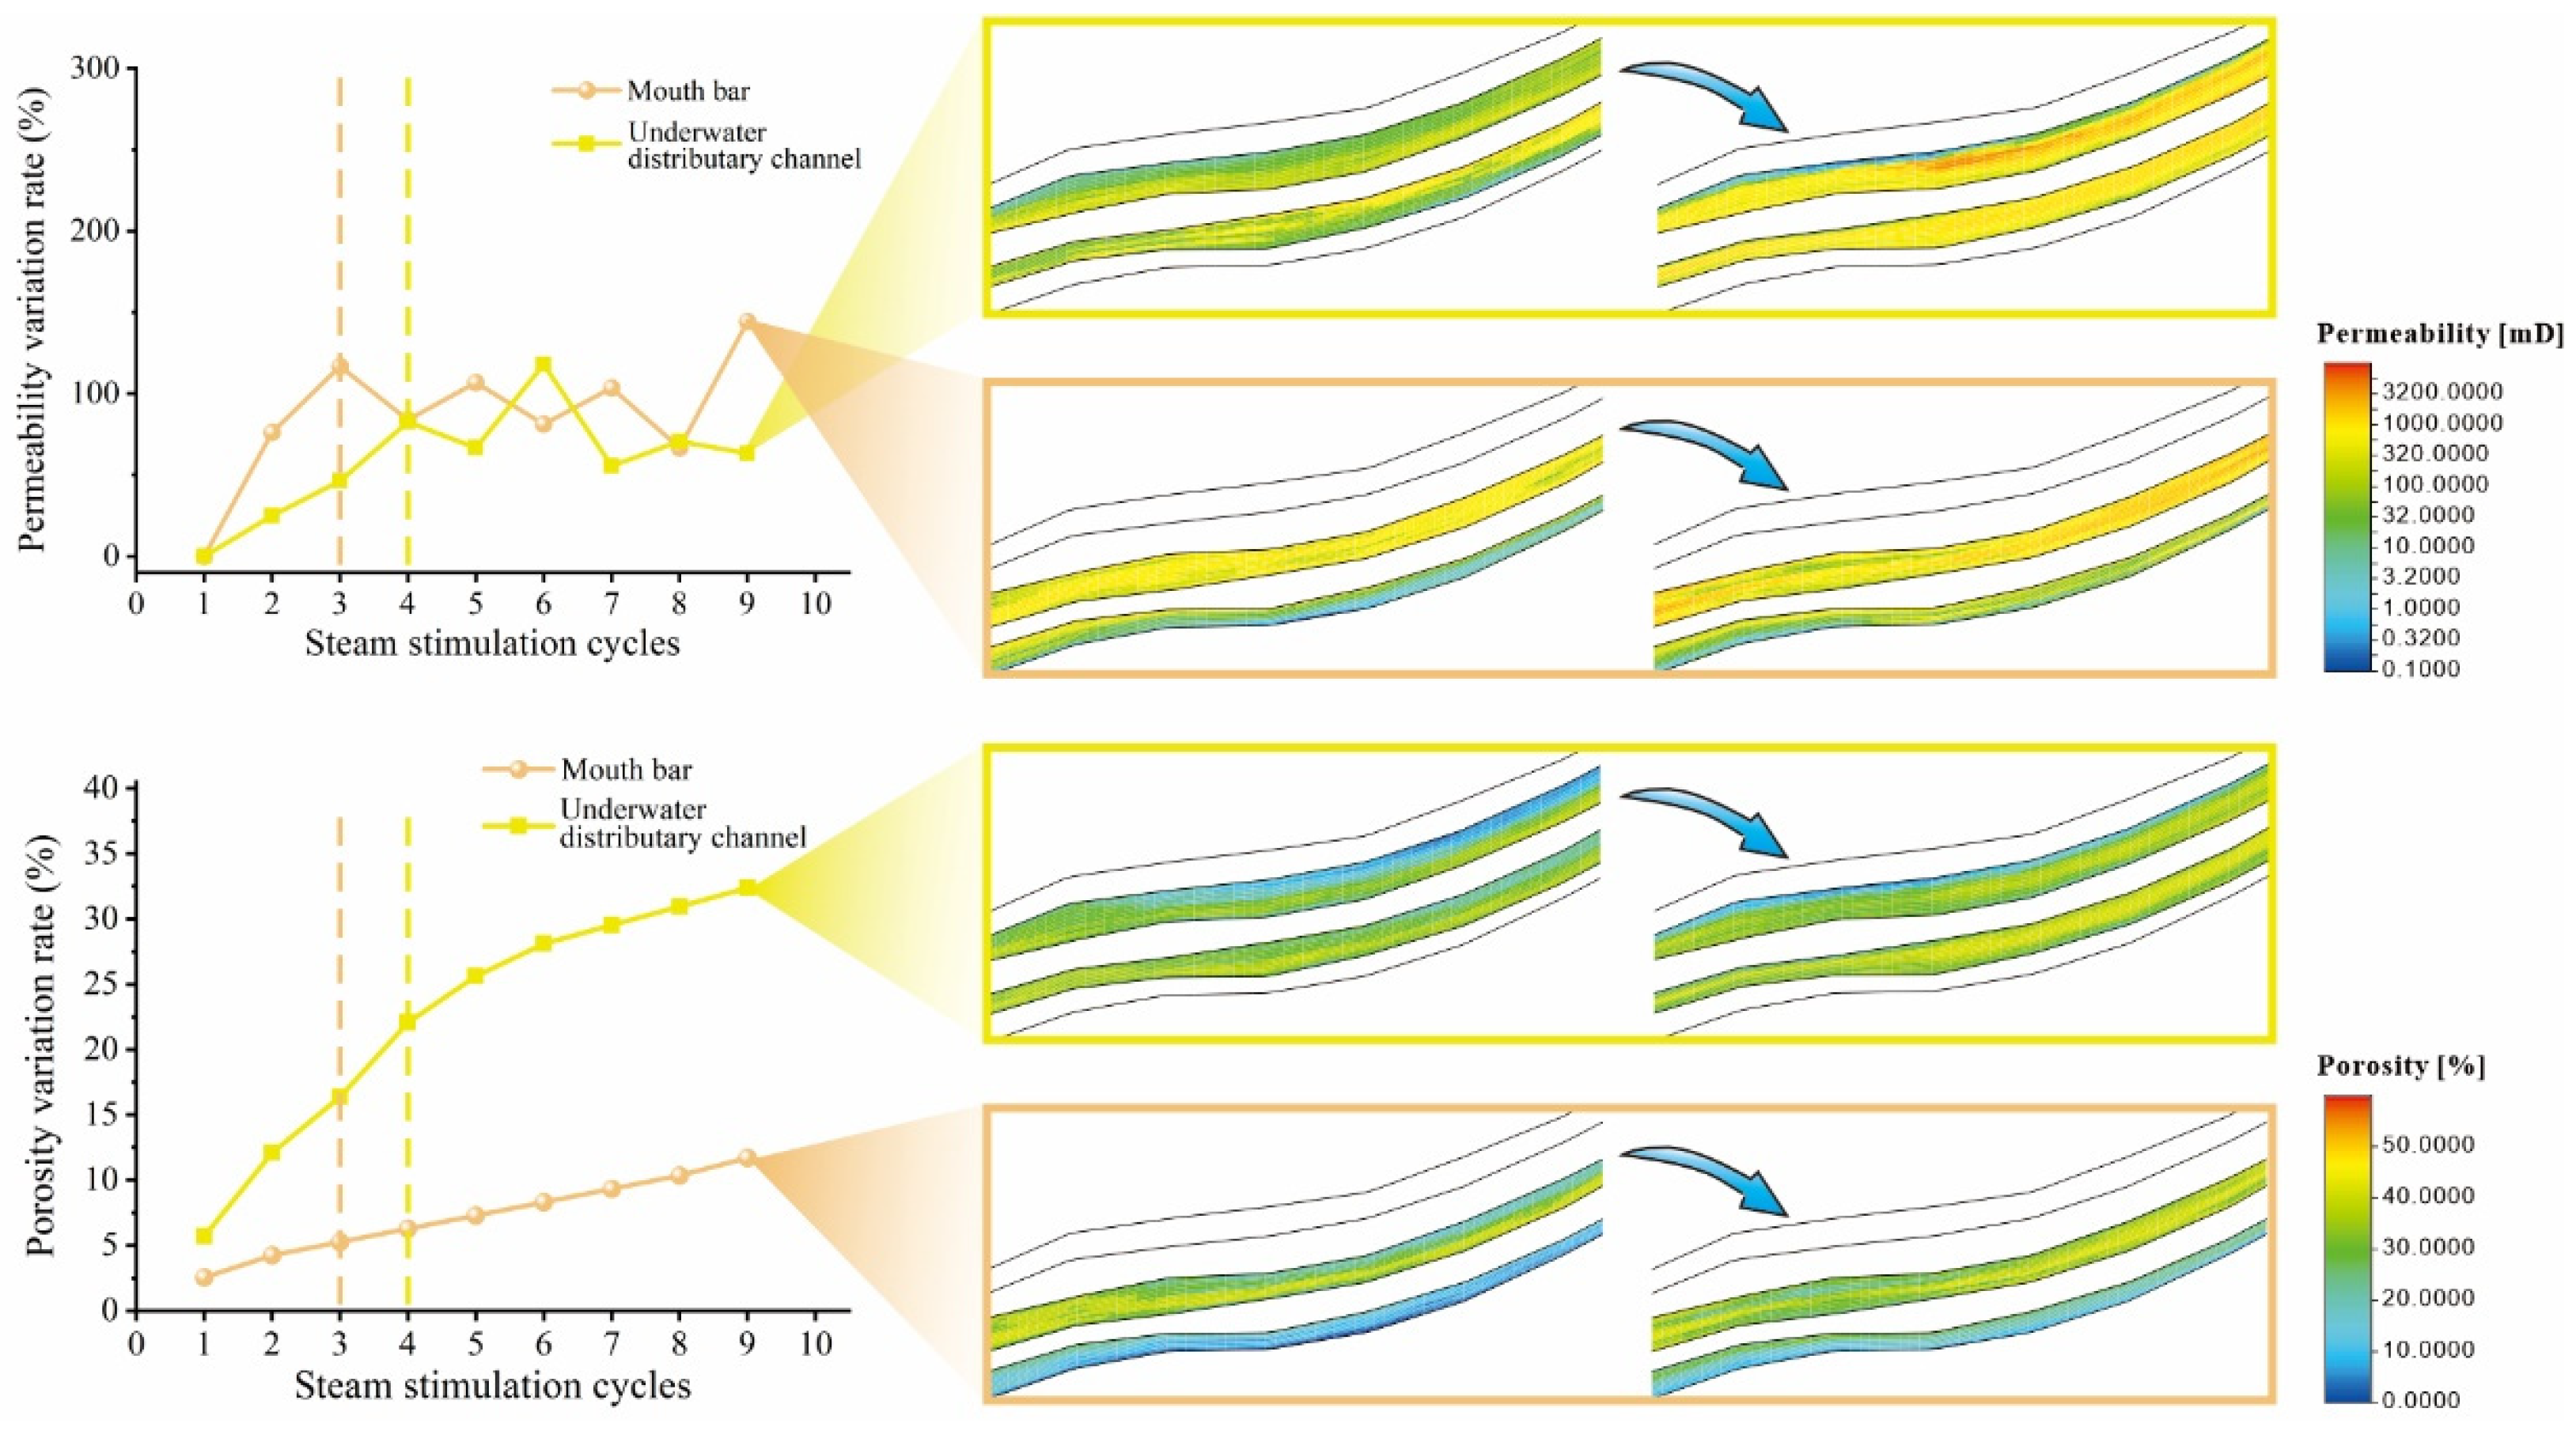
Through comprehensive analysis of property variations during multiple steam stimulation cycles, the process can be divided into two distinct periods: the early period (cycles 1–9) and the late period (cycles 10–30). The division between the early and late stages was not determined by a fixed number of steam stimulation cycles. Instead, it was identified based on the inflection characteristics of the permeability and porosity growth curves. For both the underwater distributary channel and mouth bar reservoirs, a pronounced transition in the evolution pattern occurs around cycle 9, where the rapid fluctuation or accelerated growth phase shifts to a relatively stable or high-value plateau stage. Therefore, cycle 9 represents a common turning point in the dynamic response, and it is used as a representative boundary between the early and late stages.
The permeability and porosity evolution curves were collectively divided into four phases based on slope variation and fluctuation characteristics, rather than fixed cycle numbers.
The evolution curves were divided into four phases based on their characteristics: (1) Phase I is characterized by a rapid increase with a steep slope, indicating a sharp enhancement in both permeability and porosity growth rates. (2) Phase II exhibits a relatively moderate increase in porosity accompanied by a low-value fluctuating platform in permeability. (3) Phase III represents a continued but decelerating increase in porosity together with a high-value fluctuating platform in permeability. (4) Phase IV corresponds to a near-stable state, where porosity approaches a plateau and permeability shows an abrupt decline followed by stabilization.
It should be noted that the exact transition cycles differ between rhythmic types (e.g., 4-9-13 for the distributary channel and 3-9-20 for the mouth bar). This variation reflects lithological heterogeneity and differential thermal sensitivity, rather than a simple cycle-based segmentation. 1D experiments and 3D dynamic modeling demonstrated overall improvements in porosity and permeability, showing highly consistent results. However, localized porosity reduction observed in the porosity models differed from the 1D experimental results. The localized porosity and permeability reductions observed in the 3D model primarily occur within clay-rich interbeds and at channel termini. These zones are not representative of the rhythmic sandstone bodies investigated in the 1D core experiments, but instead correspond to mud-dominated or clay-enriched lithofacies in which sandstone is not the dominant framework component. In such clay-rich intervals, water-sensitivity effects become more pronounced during steam injection. Specifically, clay hydration and swelling can reduce effective pore throat radii, while particle migration induced by high-temperature fluid flow may block pore channels. These processes can locally decrease permeability despite the overall thermal enhancement of the reservoir. Additionally, the channel termini typically exhibit higher mud content and poorer sorting, which further increases susceptibility to water-sensitive damage.
In contrast, the 1D experiments were conducted on relatively homogeneous rhythmic sandstone samples, where the framework is dominated by sand-sized grains and clay content is comparatively lower. Therefore, the apparent discrepancy between the 3D and 1D results reflects lithological heterogeneity and scale-dependent responses rather than contradictory mechanisms. Water-sensitivity effects are spatially localized and mainly associated with mud-rich interbeds, whereas the rhythmic sandstone bodies exhibit net property enhancement under multi-cycle steam stimulation.
4.1. Enhanced Porosity–Permeability Performance in Underwater Distributary Channel Microfacies During Early Steam Stimulation Cycles
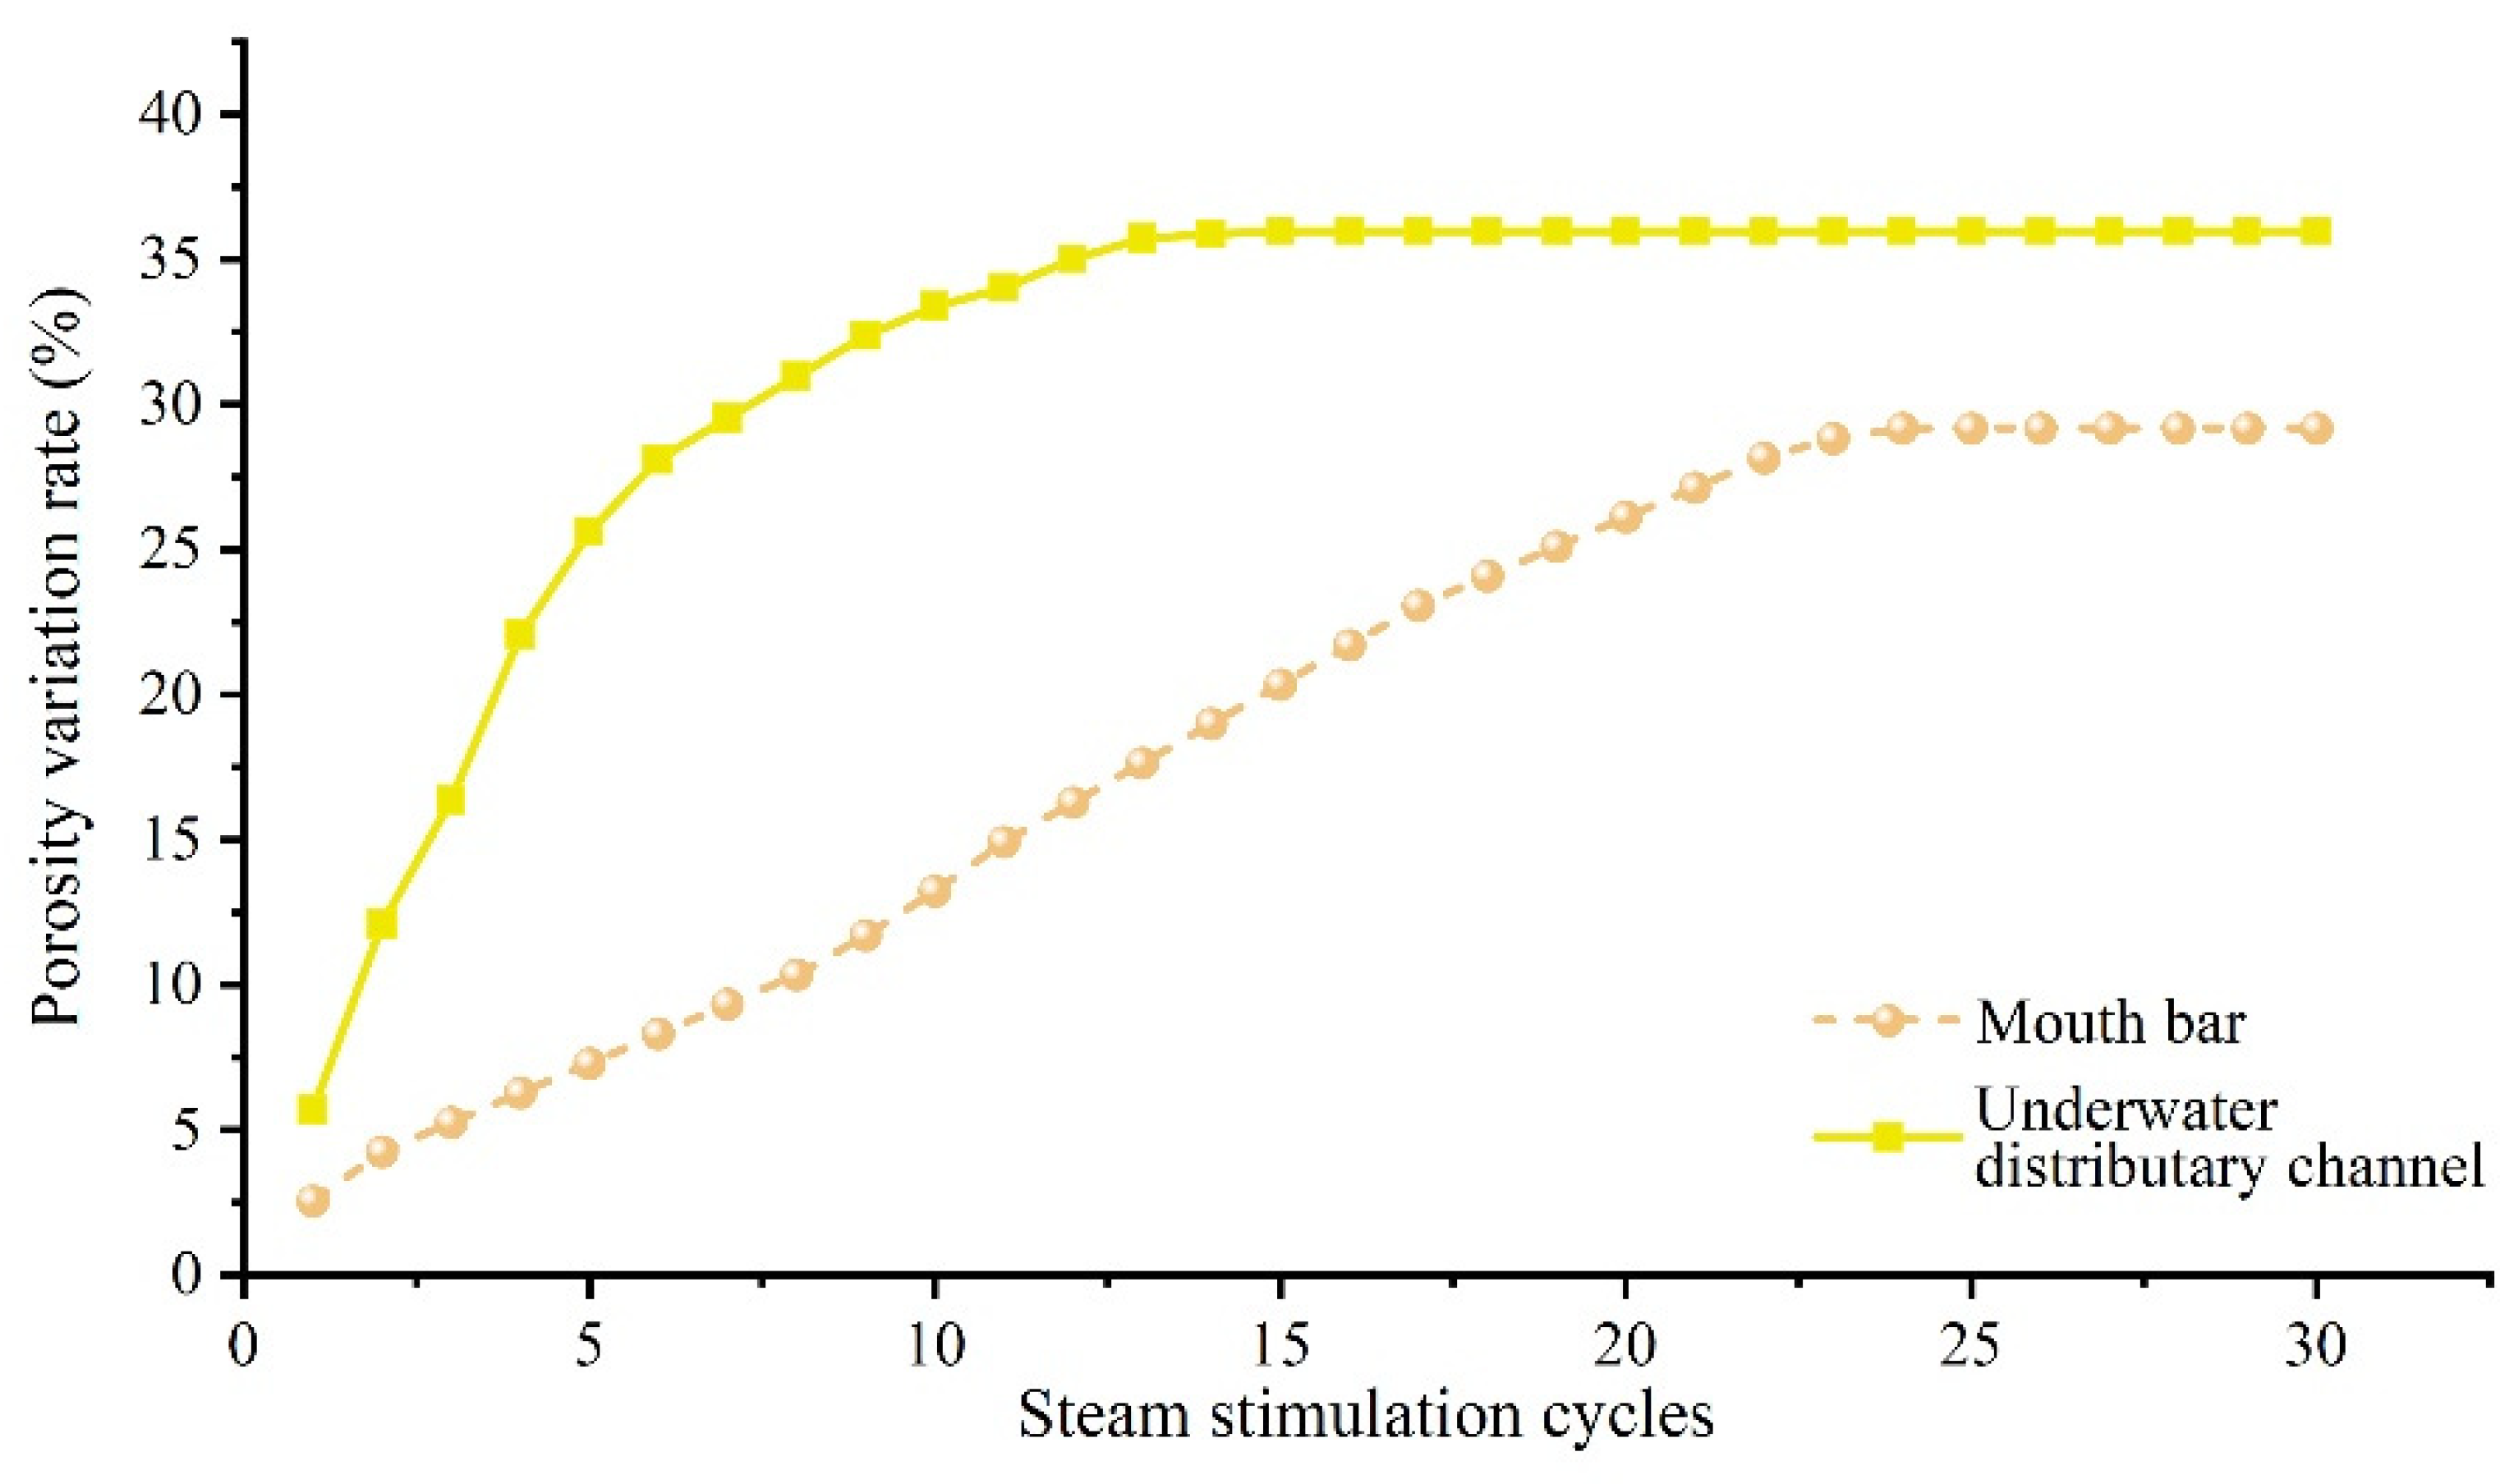
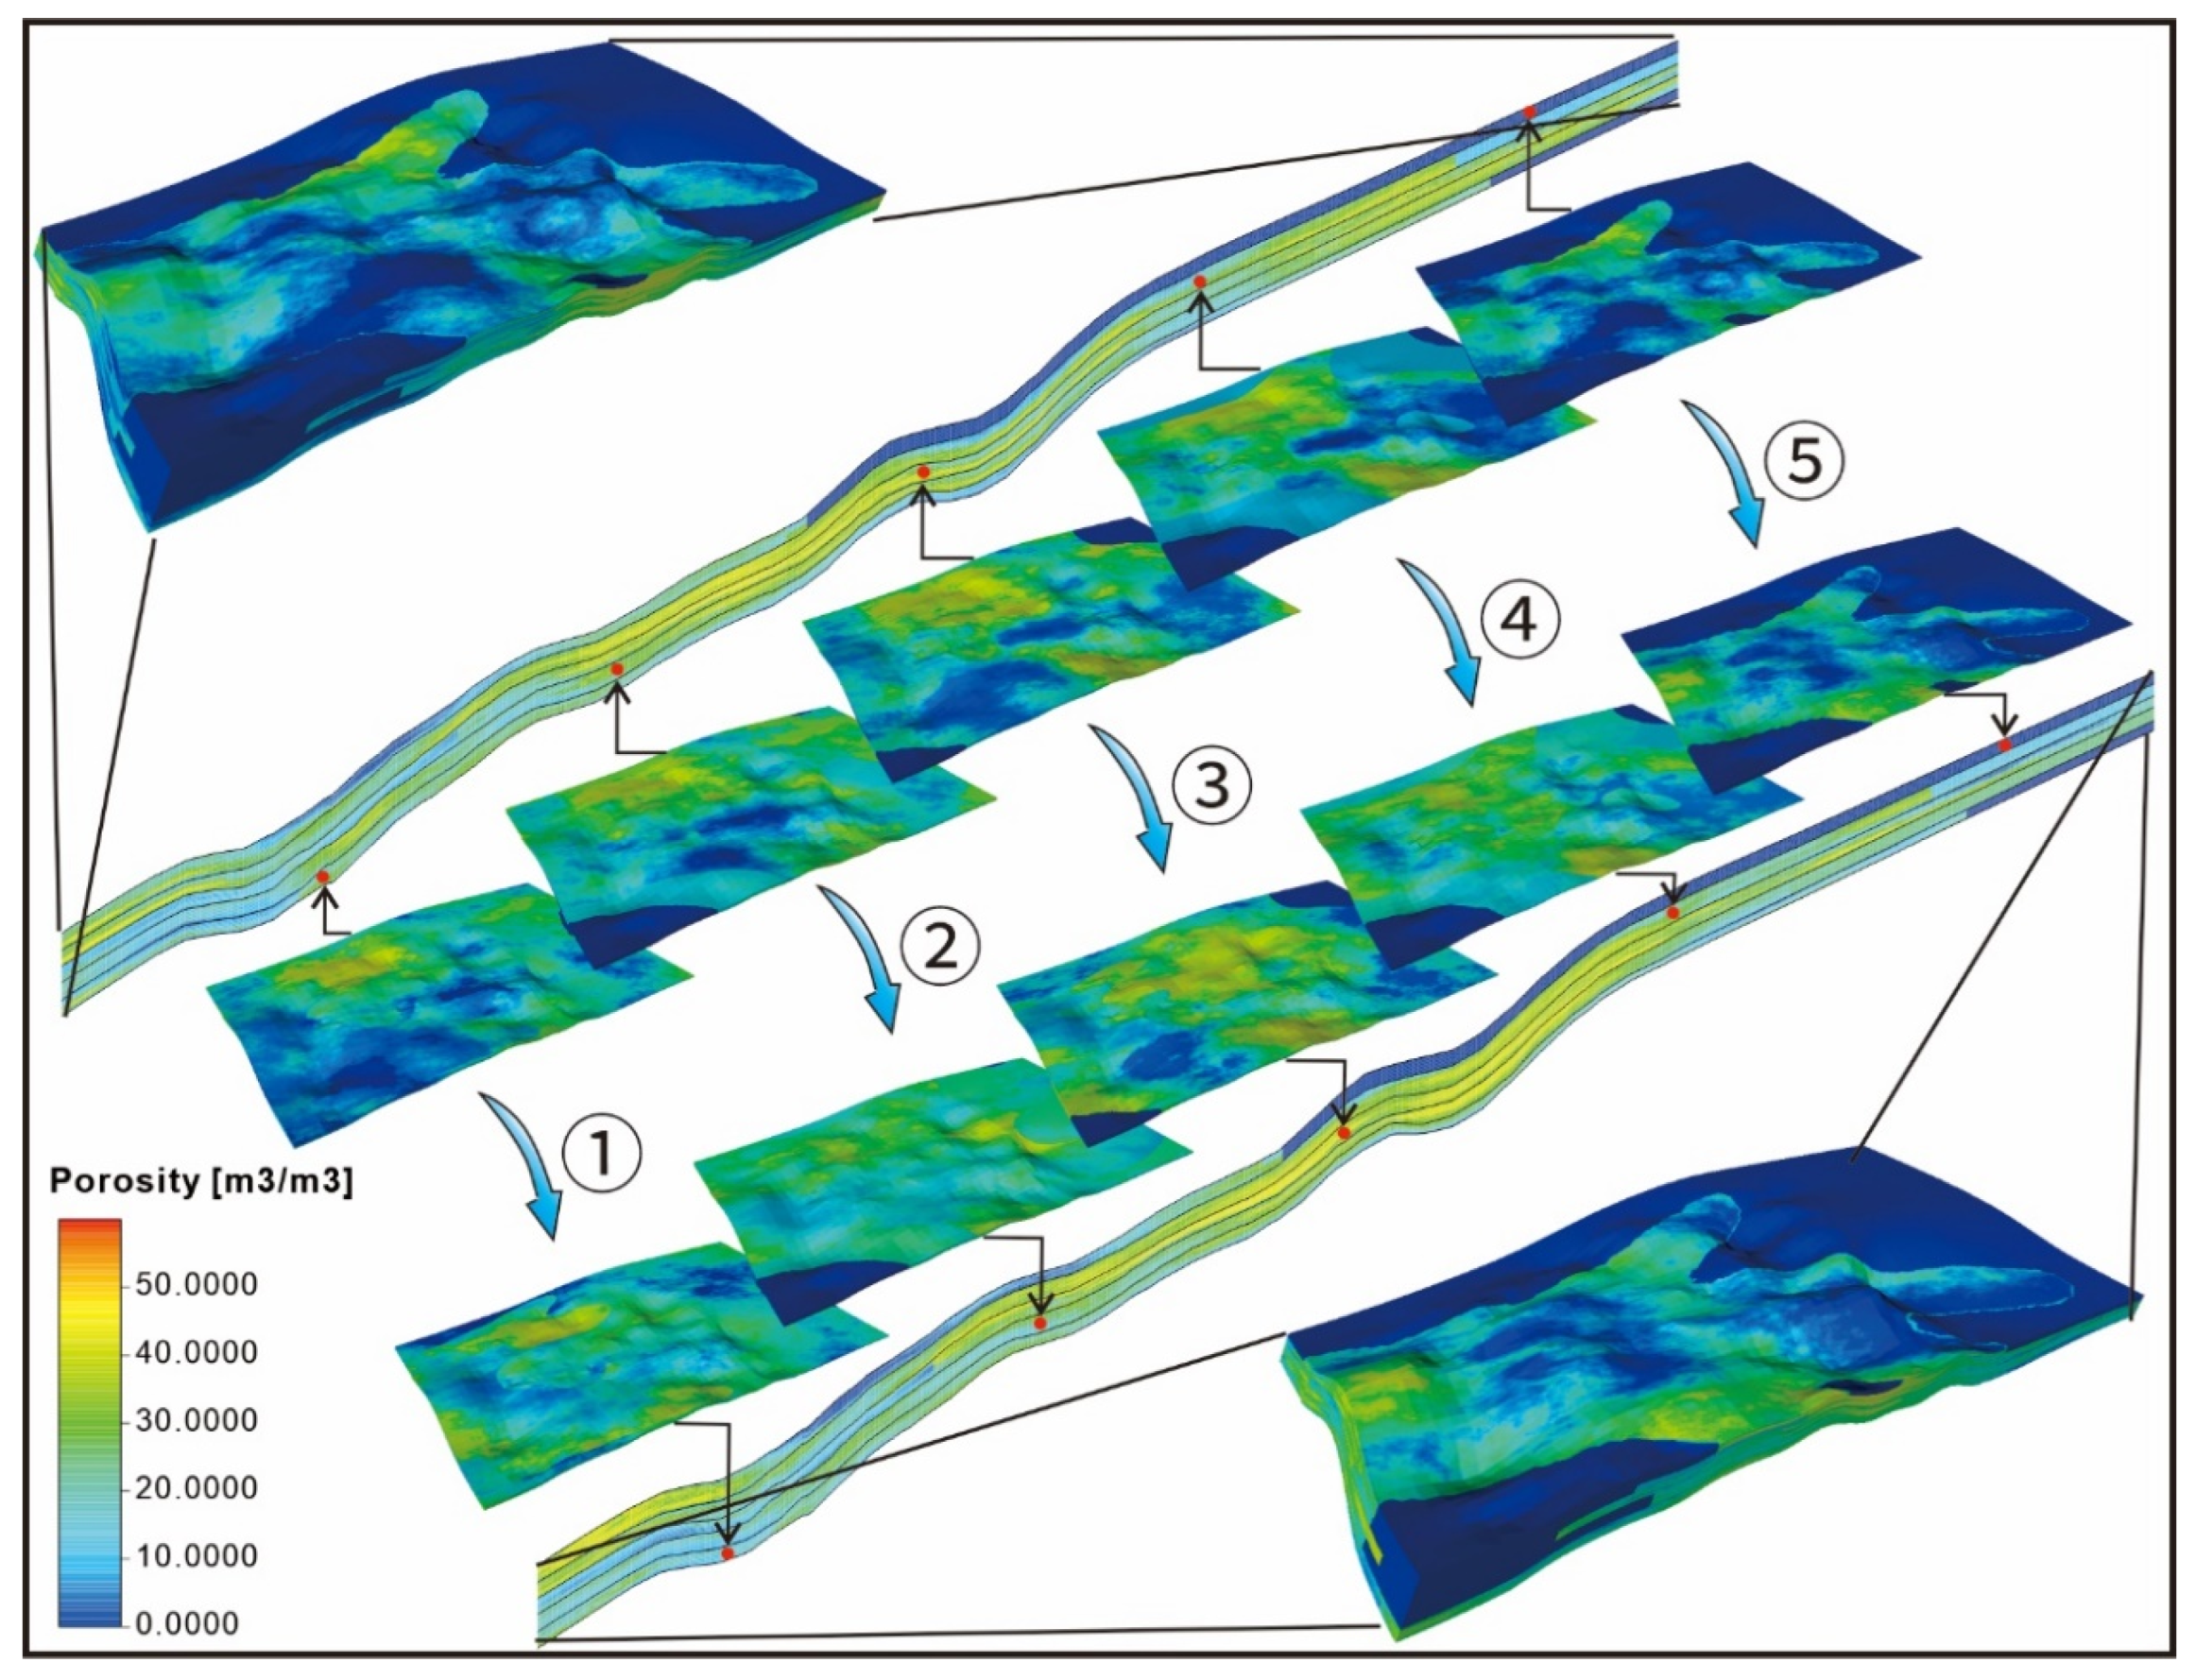
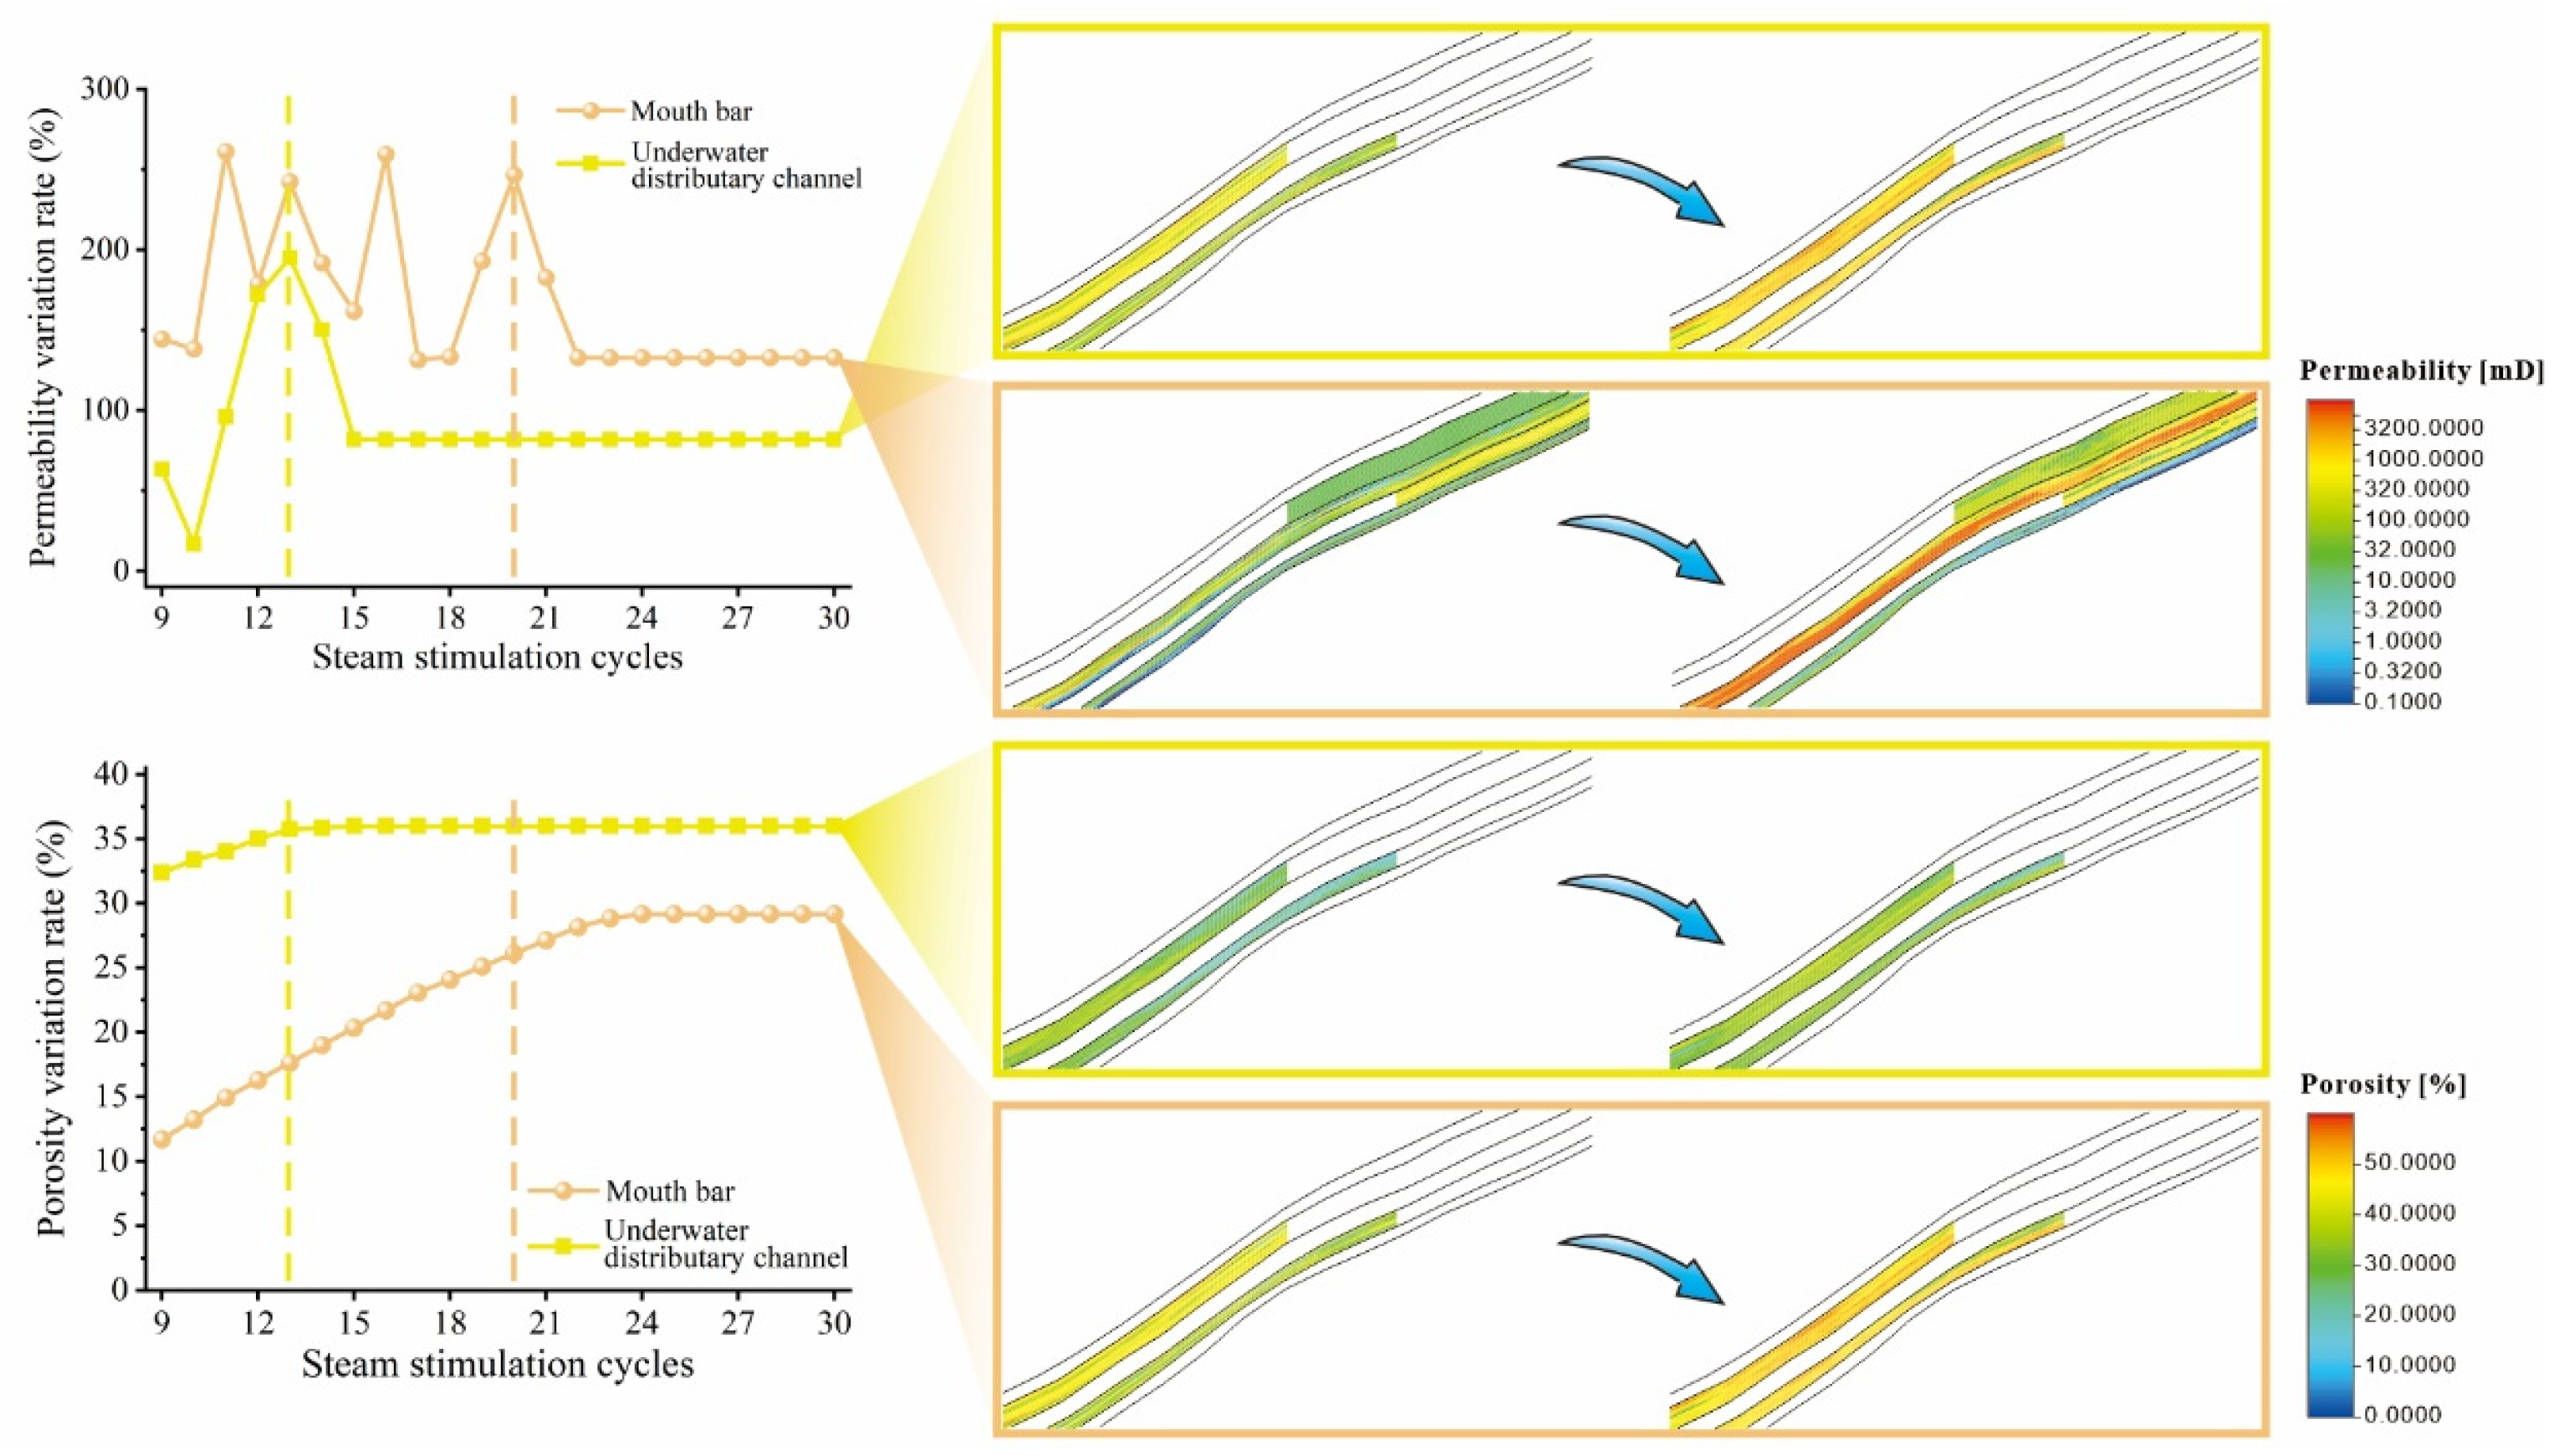
During the early period, both 1D experiments and 3D dynamic modeling demonstrated overall improvements in porosity and permeability, showing highly consistent results (
Figure 8). However, localized porosity reduction observed in the porosity models differed from the 1D experimental results.
This period was characterized by permeability variation rate progression through Phase 1 and Phase 2. The underwater distributary channel microfacies consistently showed higher porosity variation rates and greater cumulative increases than the mouth bar microfacies. Post-stimulation analysis revealed increased values in both porosity and permeability models, with Sand Bodies 2 and 4 of the underwater distributary channel exhibiting greater enhancement than Sand Bodies 1 and 3 of the mouth bar.
During this period, the primary components affected by steam stimulation were Clay Minerals and some Fine Sand particles. The mouth bar reservoir exhibits a high-porosity, high-permeability zone at its top, with porosity and permeability gradually decreasing from top to bottom. In contrast, the underwater distributary channel reservoir represents a homogeneous high-porosity, high-permeability formation without rhythmic variations [
21]. These distinct sedimentary facies result in different impacts on steam’s swept zone, advancement velocity, stimulation intensity (effectiveness), and rock–steam interactions [
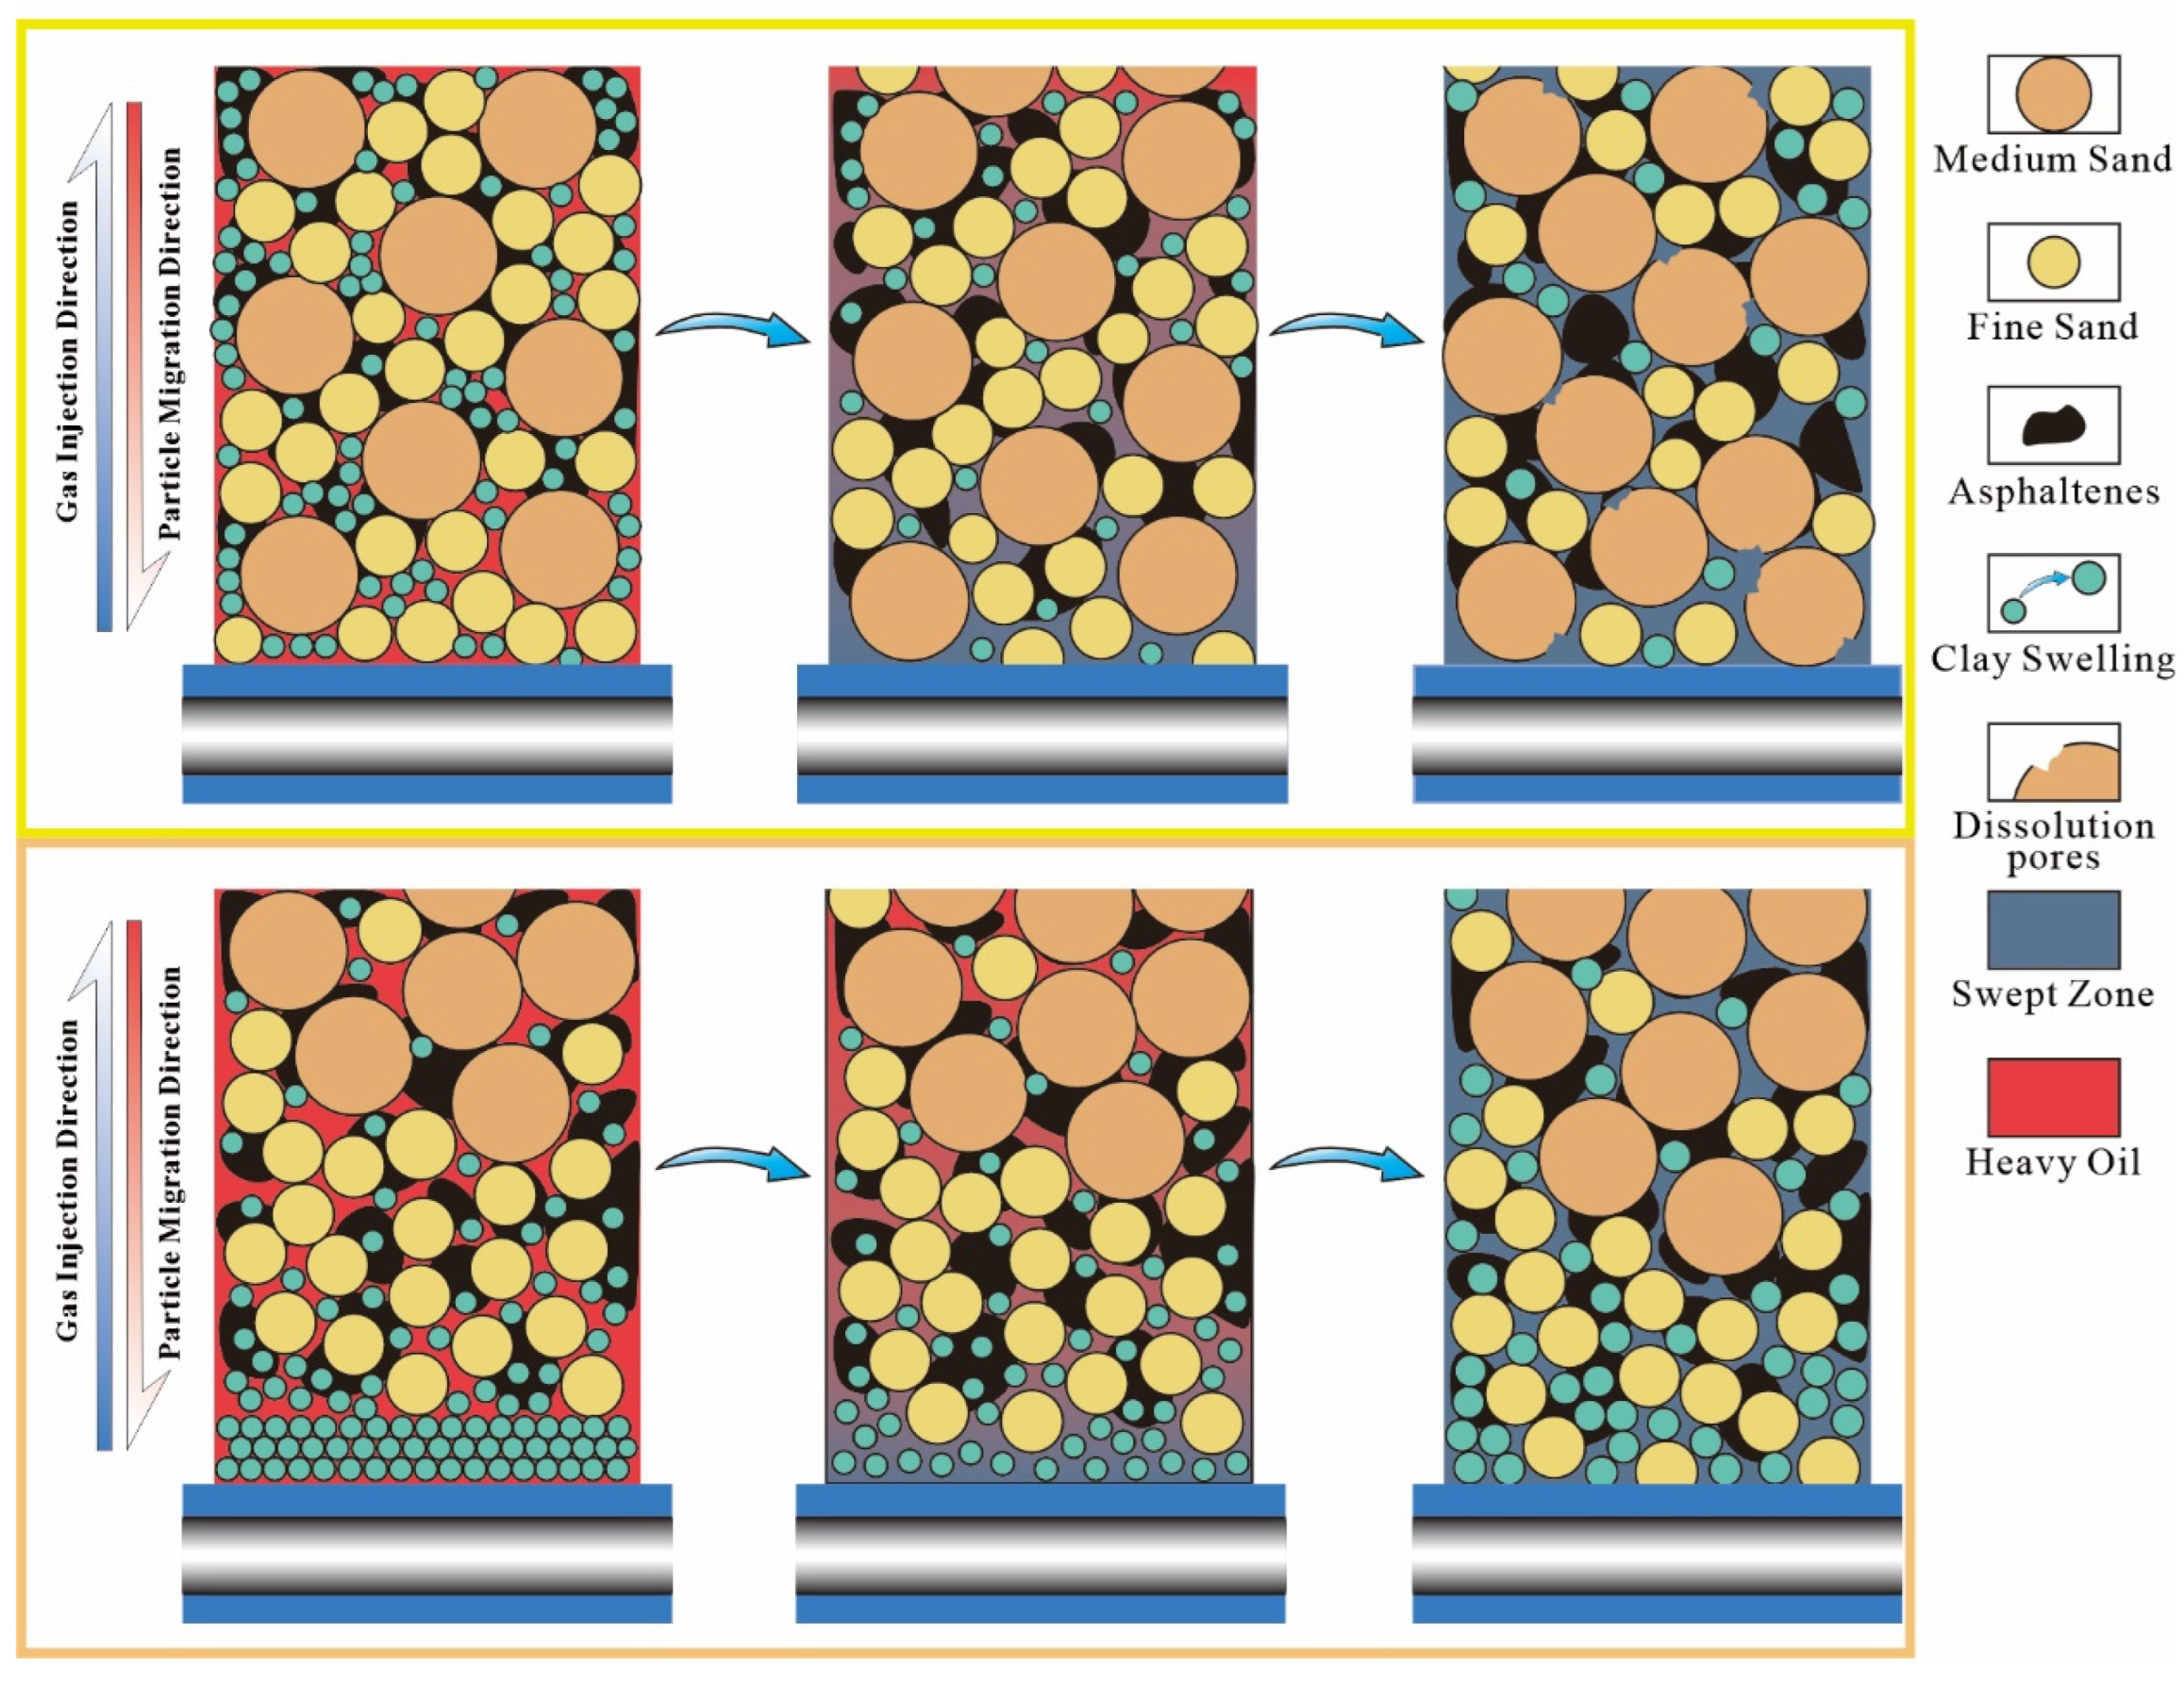
22]. The mouth bar reservoir demonstrates a reduced swept zone, slower steam advancement velocity, and slightly lower stimulation intensity (effectiveness) due to its finer-grained base with lower porosity/permeability that impedes upward steam migration. Conversely, the underwater distributary channel reservoir shows a greater swept zone, faster advancement velocity, and slightly higher stimulation intensity (effectiveness), owing to its uniform grain-size distribution and non-rhythmic porosity/permeability characteristics that facilitate upward steam movement. Under steam stimulation, this period involves the dissolution of Clay Minerals and cementing materials, accompanied by the mobilization of some Fine Sand particles through steam flushing. Simultaneously, Clay Minerals undergo hydration-induced expansion under steam influence (
Figure 9) [
23].
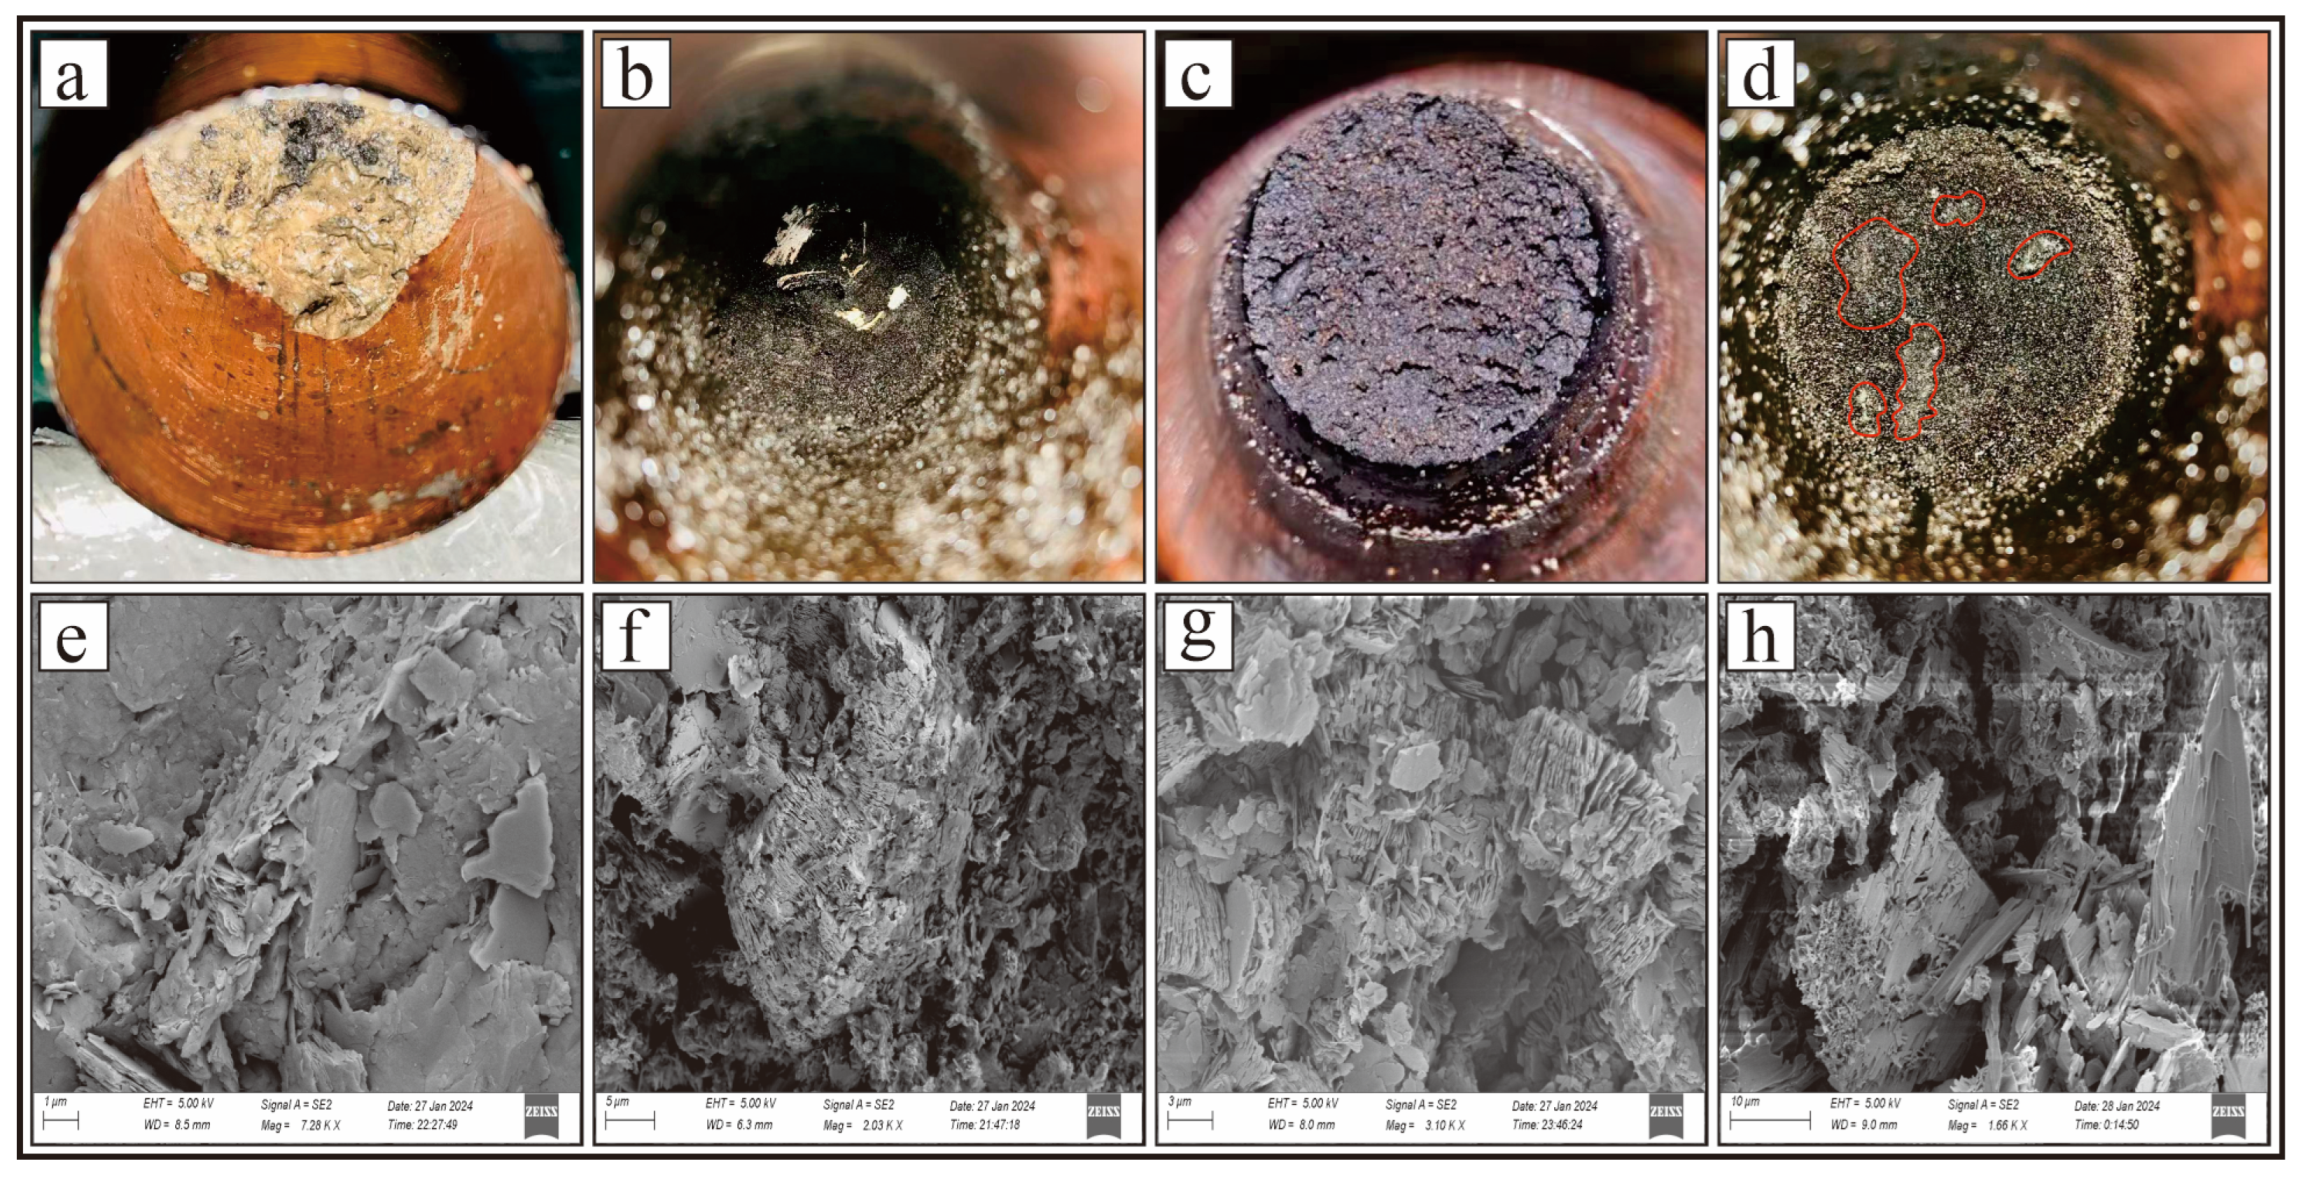
When steam injection begins affecting the channel and bar formations, the Clay Minerals and cementing materials nearest to the wellbore undergo dissolution. During the subsequent well soaking and production periods, these dissolved materials, along with some mobile Fine Sand particles, are flushed out by the steam (
Figure 10, panels a and b) [
24]. This outflow enlarges the reservoir’s pore spaces and connected pore throats, facilitating fluid flow through the formation (
Figure 10, panel e). The homogeneous underwater distributary channel formation exhibits more uniform and extensive steam effects with higher efficiency in removing Clay Minerals and mobile Fine Sand particles, resulting in faster and better improvement in pore space size and connectivity. By contrast, the inverse-rhythm mouth bar formation, influenced by its grain-size distribution, makes steam penetration through the denser muddy layers at the base more difficult, leading to a smaller swept zone and limited impact on the Fine Sand particles in the upper sections with consequently slower and less significant pore space development, while steam disperses the compacted muddy particles at the base to enhance overall formation permeability [
25].
To provide quantitative support for the proposed mineralogical mechanisms, X-ray diffraction (XRD) analyses were conducted on samples before and after steam stimulation. The results show that the Clay Mineral content decreased significantly from 22% before stimulation to 11% after stimulation, representing a reduction of approximately 50%. In contrast, Quartz content increased from 52% to 60%, while feldspar contents increased from 24% to 26%. The marked reduction in Clay Minerals provides direct quantitative evidence for clay dissolution and migration during steam stimulation.
With increasing steam stimulation cycles, although Clay Minerals and Fine Sand particles are flushed out of the formation during each production period, the migration of Asphaltenes leads to pore throat blockage while Clay Minerals undergo hydration-induced expansion under steam influence (
Figure 10, panels f and g) [
26]. This results in simultaneous occurrences of both pore space enlargement and reduction, with pore connectivity fluctuating between improvement and deterioration. At this stage, both the underwater distributary channel and mouth bar formations within the swept zone have been effectively stimulated, demonstrating comparable stimulation effects, including the outflow of Fine Sand particles from the mouth bar. The formations are simultaneously influenced by Fine Sand particle migration, Clay Minerals expansion, and Asphaltene-induced pore throat blockage, causing similar alterations in pore spaces and pore throats in both sedimentary facies.
4.2. Enhanced Porosity–Permeability Performance in Mouth Bar Microfacies During Late Steam Stimulation Cycles
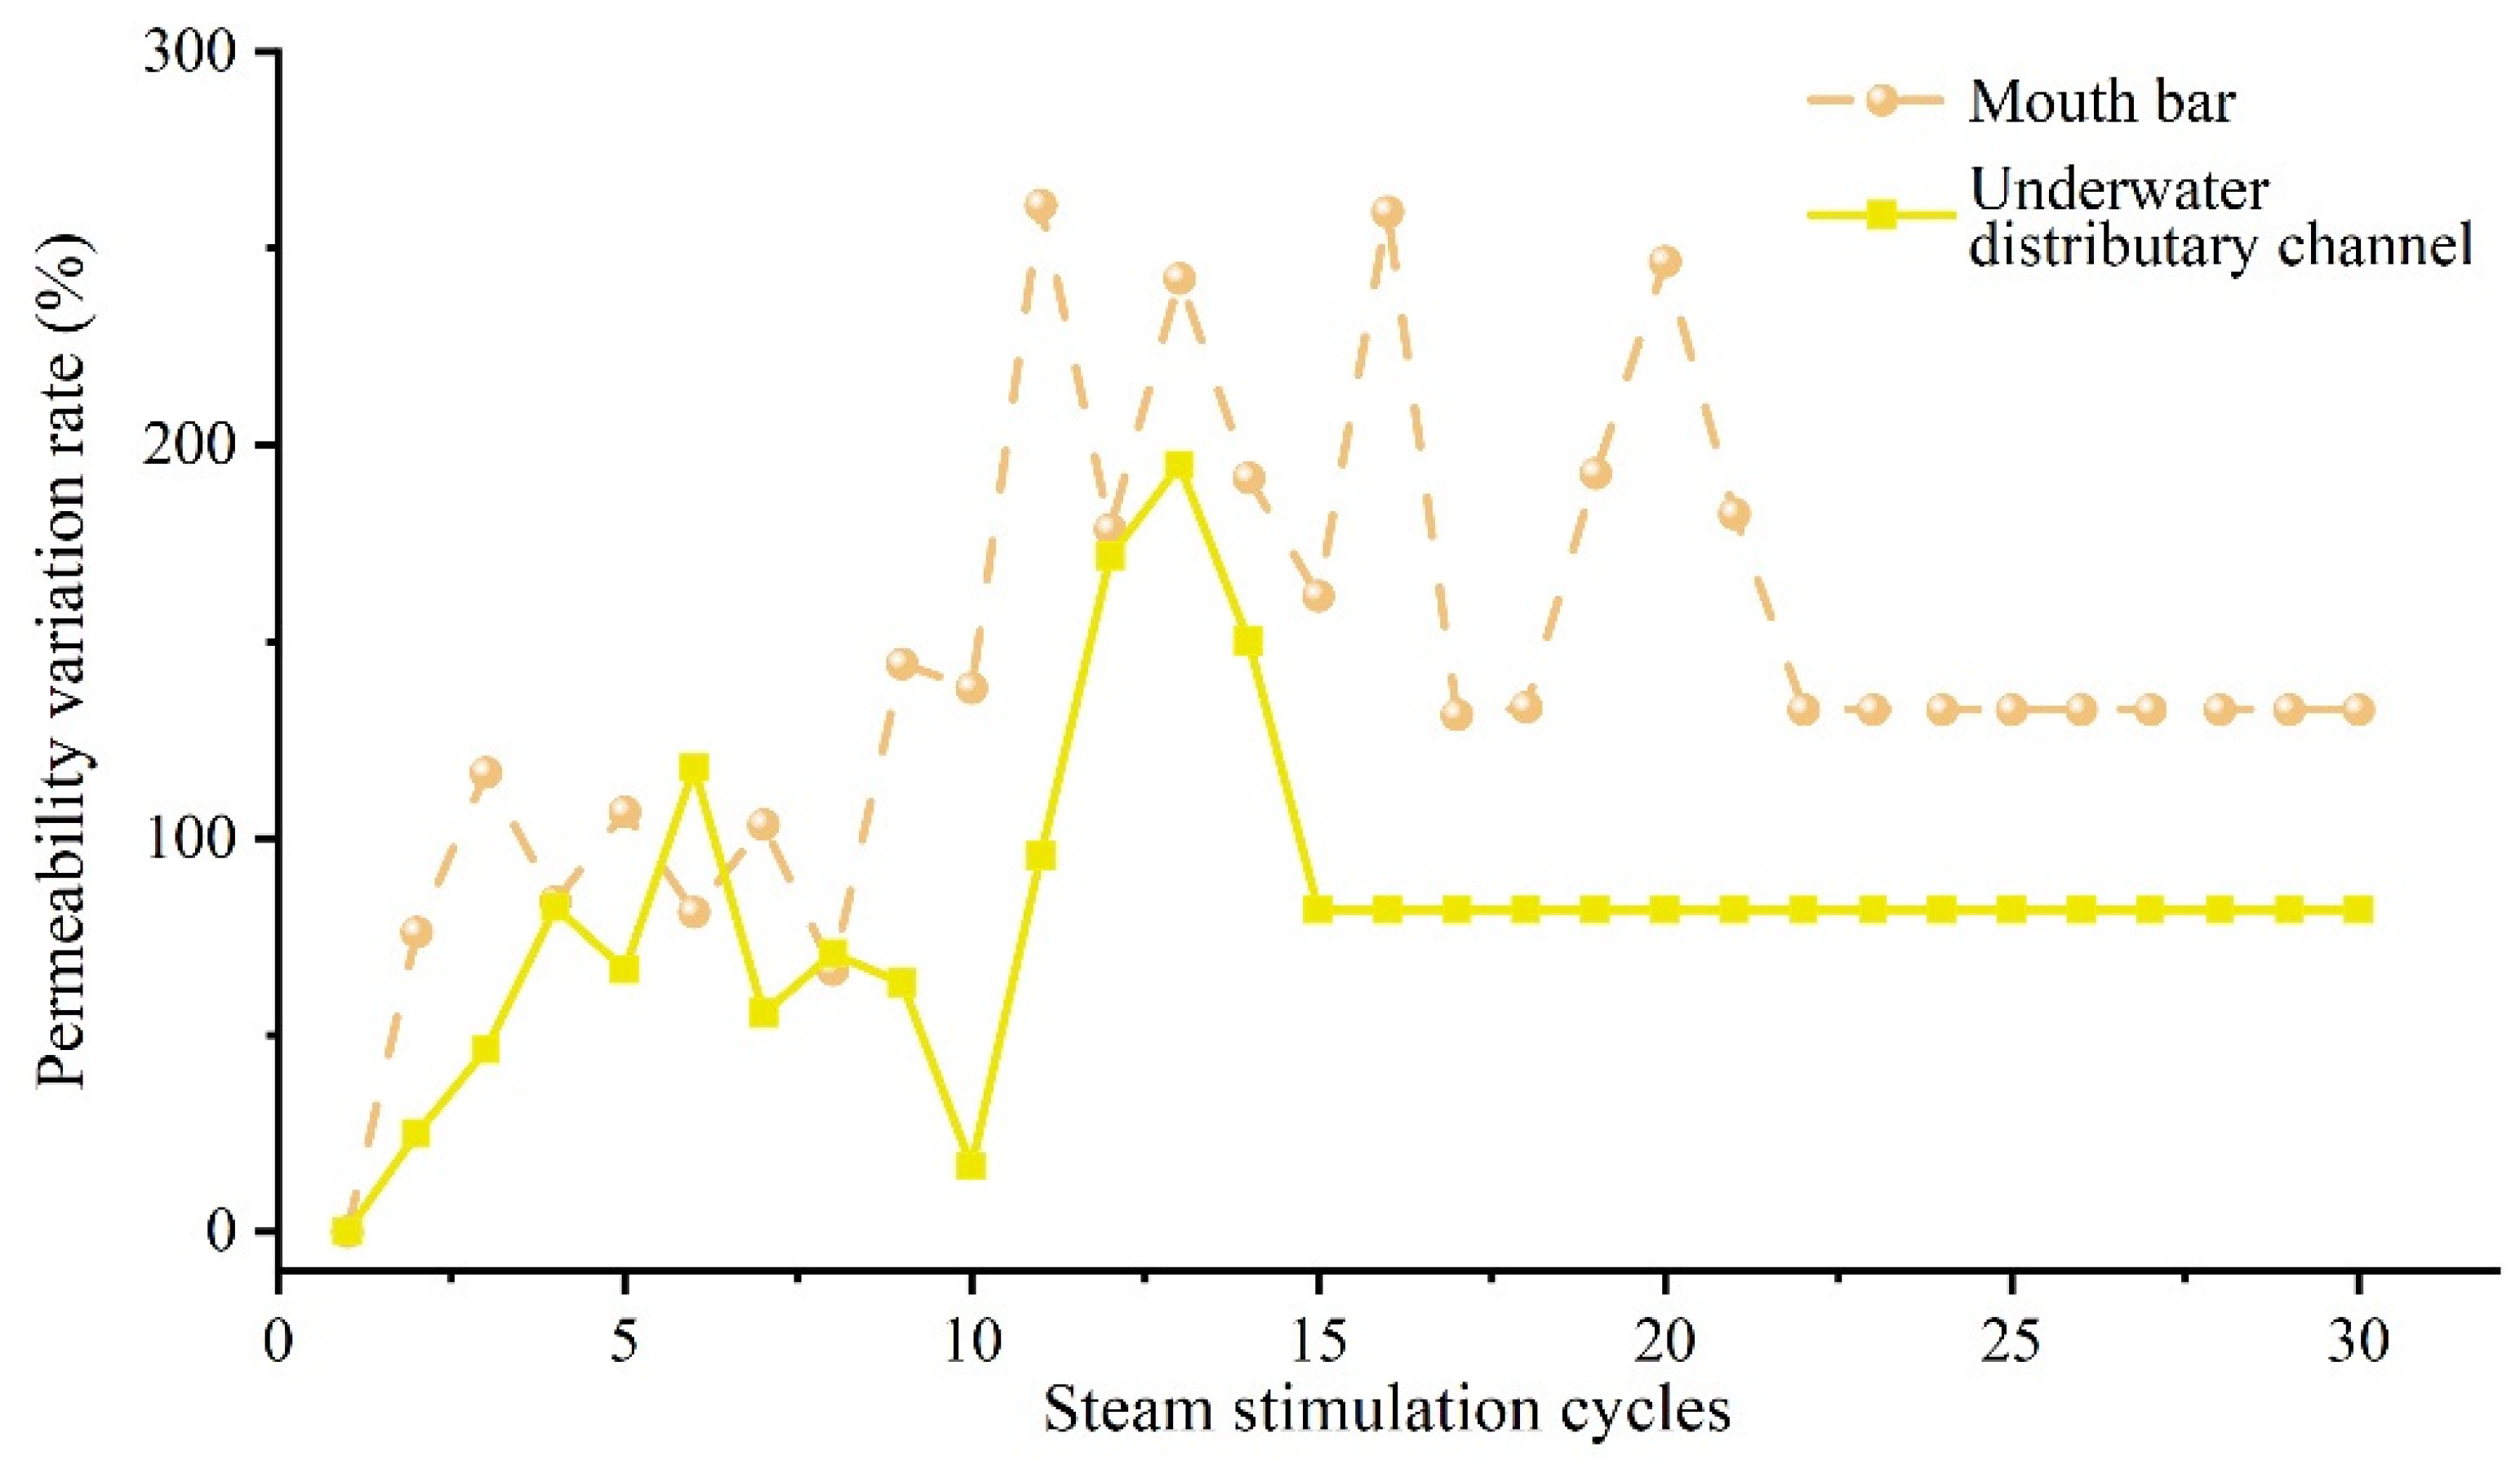
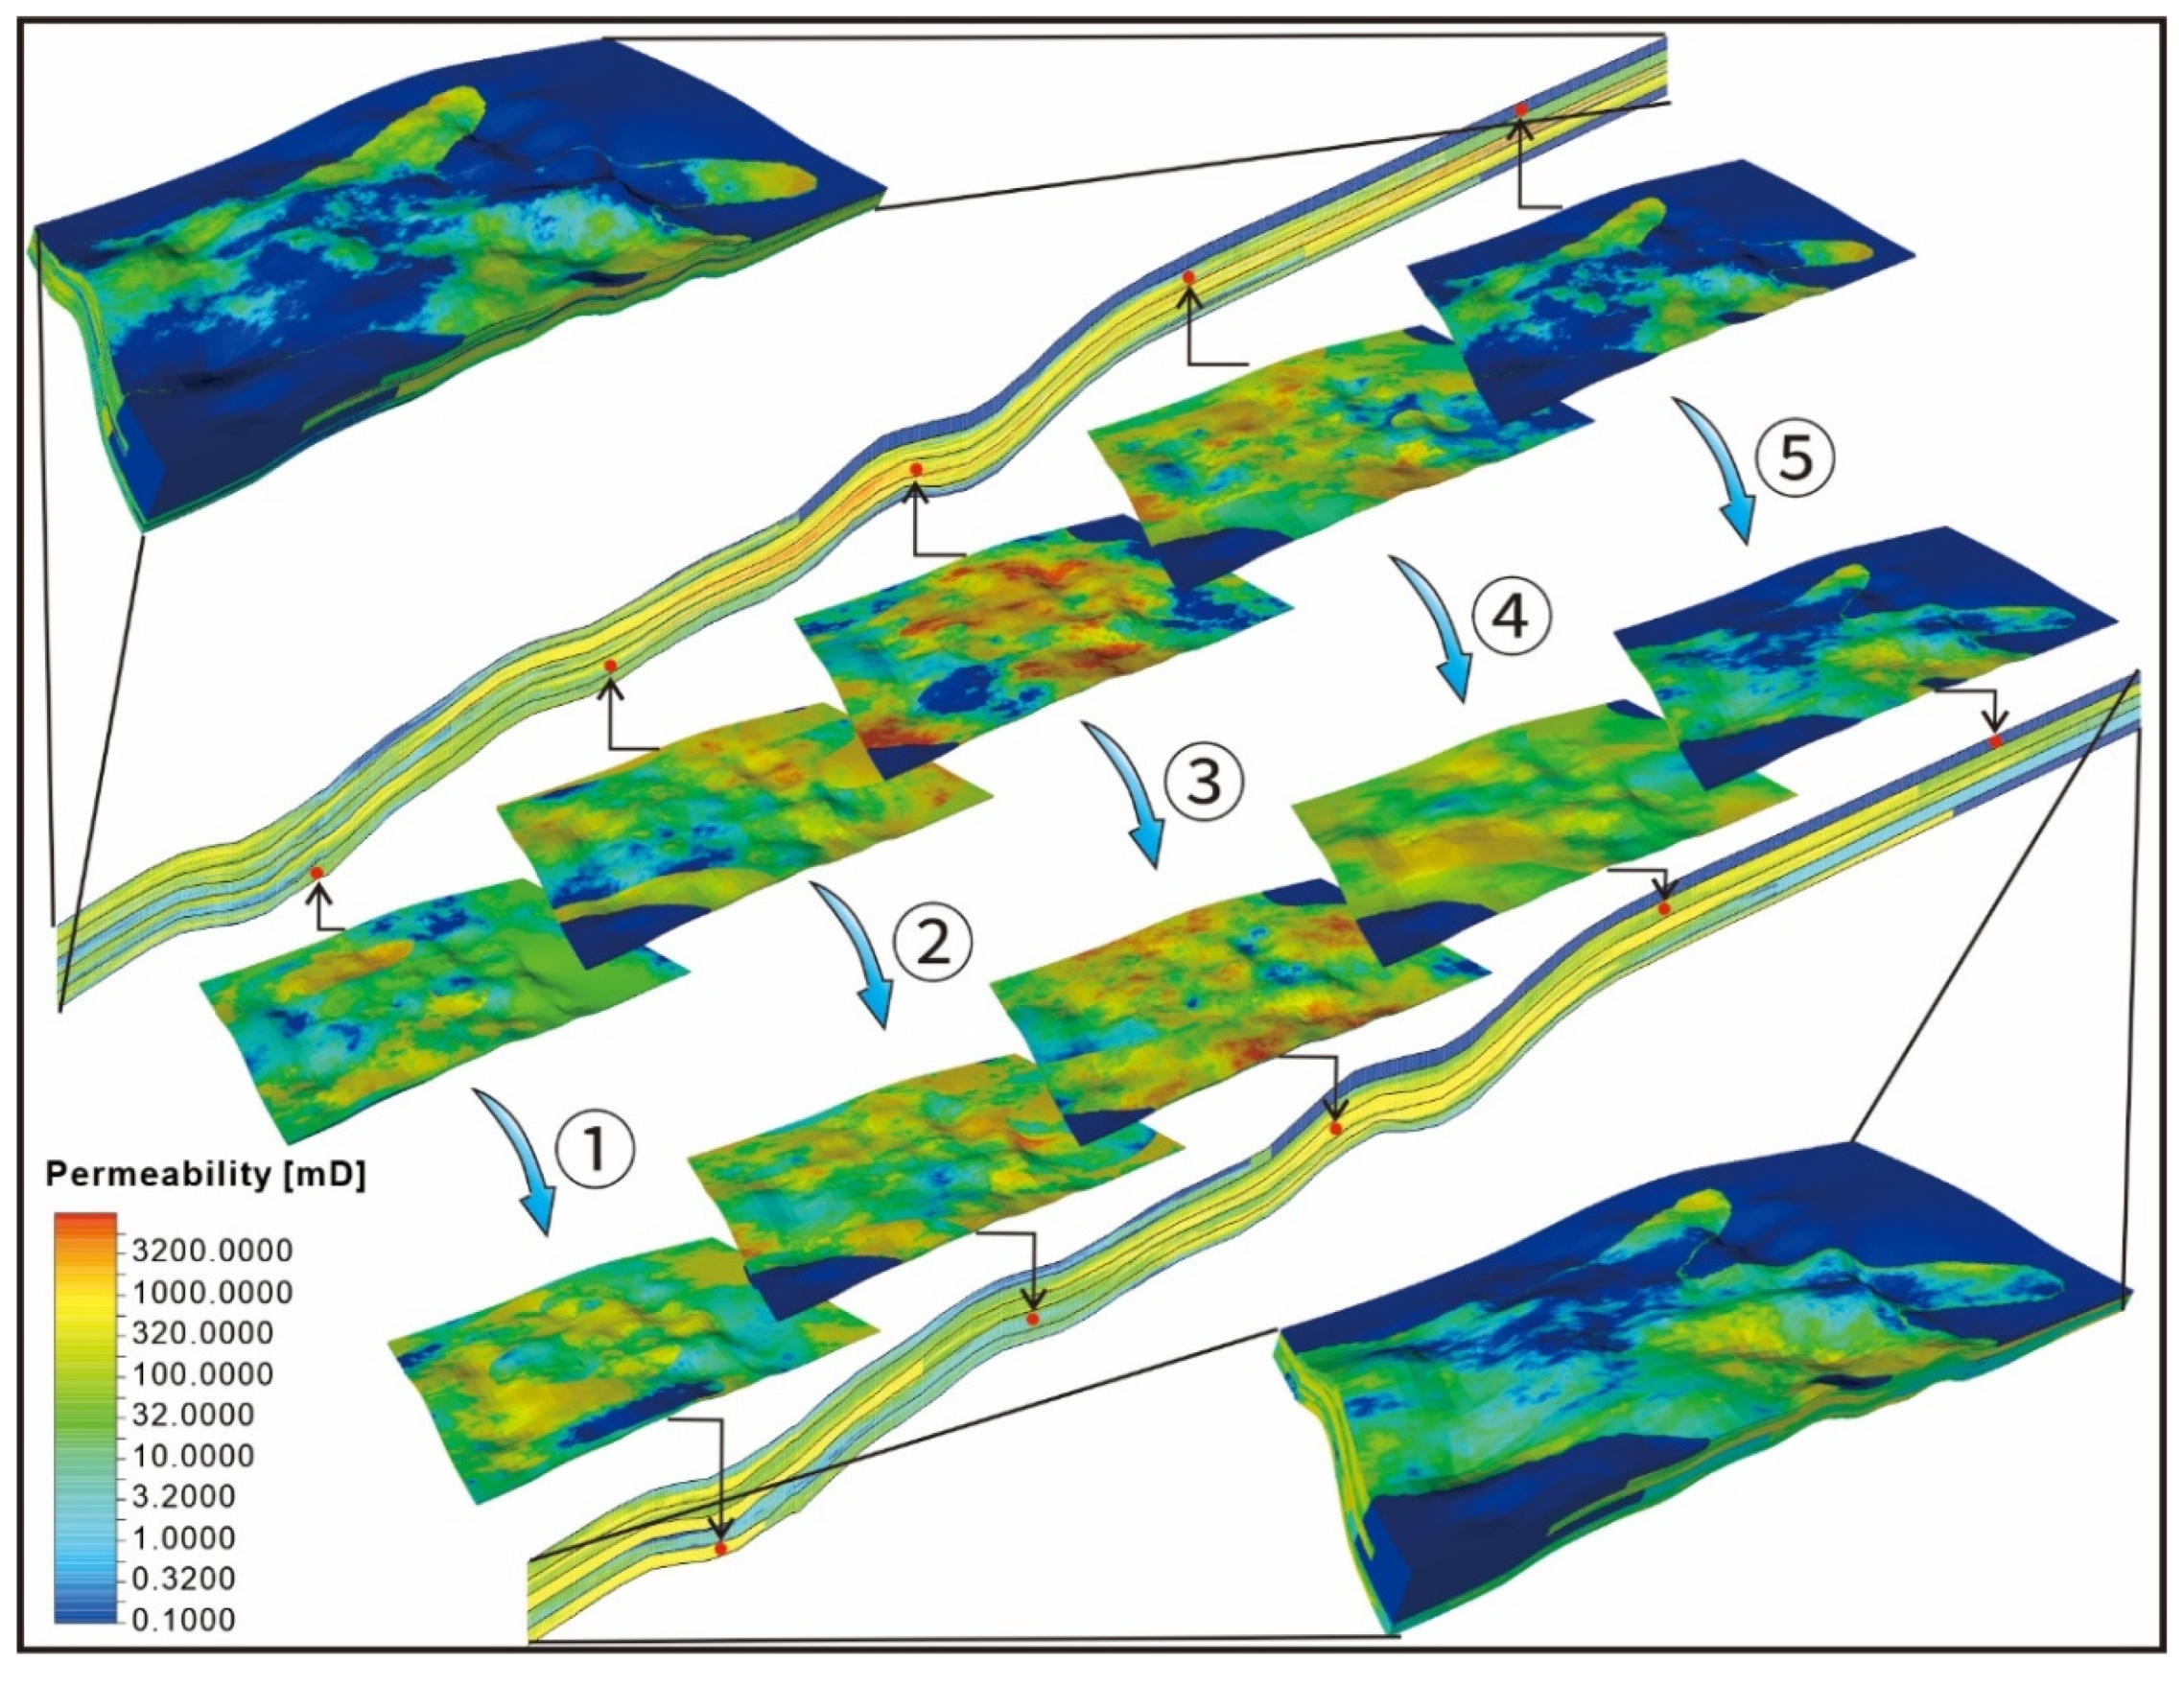
During the late-stage steam stimulation cycles, both 1D experiments and 3D dynamic modeling consistently demonstrated improved porosity and permeability characteristics, showing remarkable agreement in results (
Figure 11). However, localized porosity reduction observed in the porosity models differed from the 1D experimental findings.
This period was characterized by permeability variation rate progression through Phase 3 and Phase 4. While the underwater distributary channel microfacies maintained higher porosity variation rates and greater cumulative increases than the mouth bar microfacies, the mouth bar exhibited more significant enhancement effects during this late stage. Post-stimulation analysis revealed increased values in both porosity and permeability models, with Sand Bodies 2 and 4 of the underwater distributary channel showing greater improvement than Sand Bodies 1 and 3 of the mouth bar.
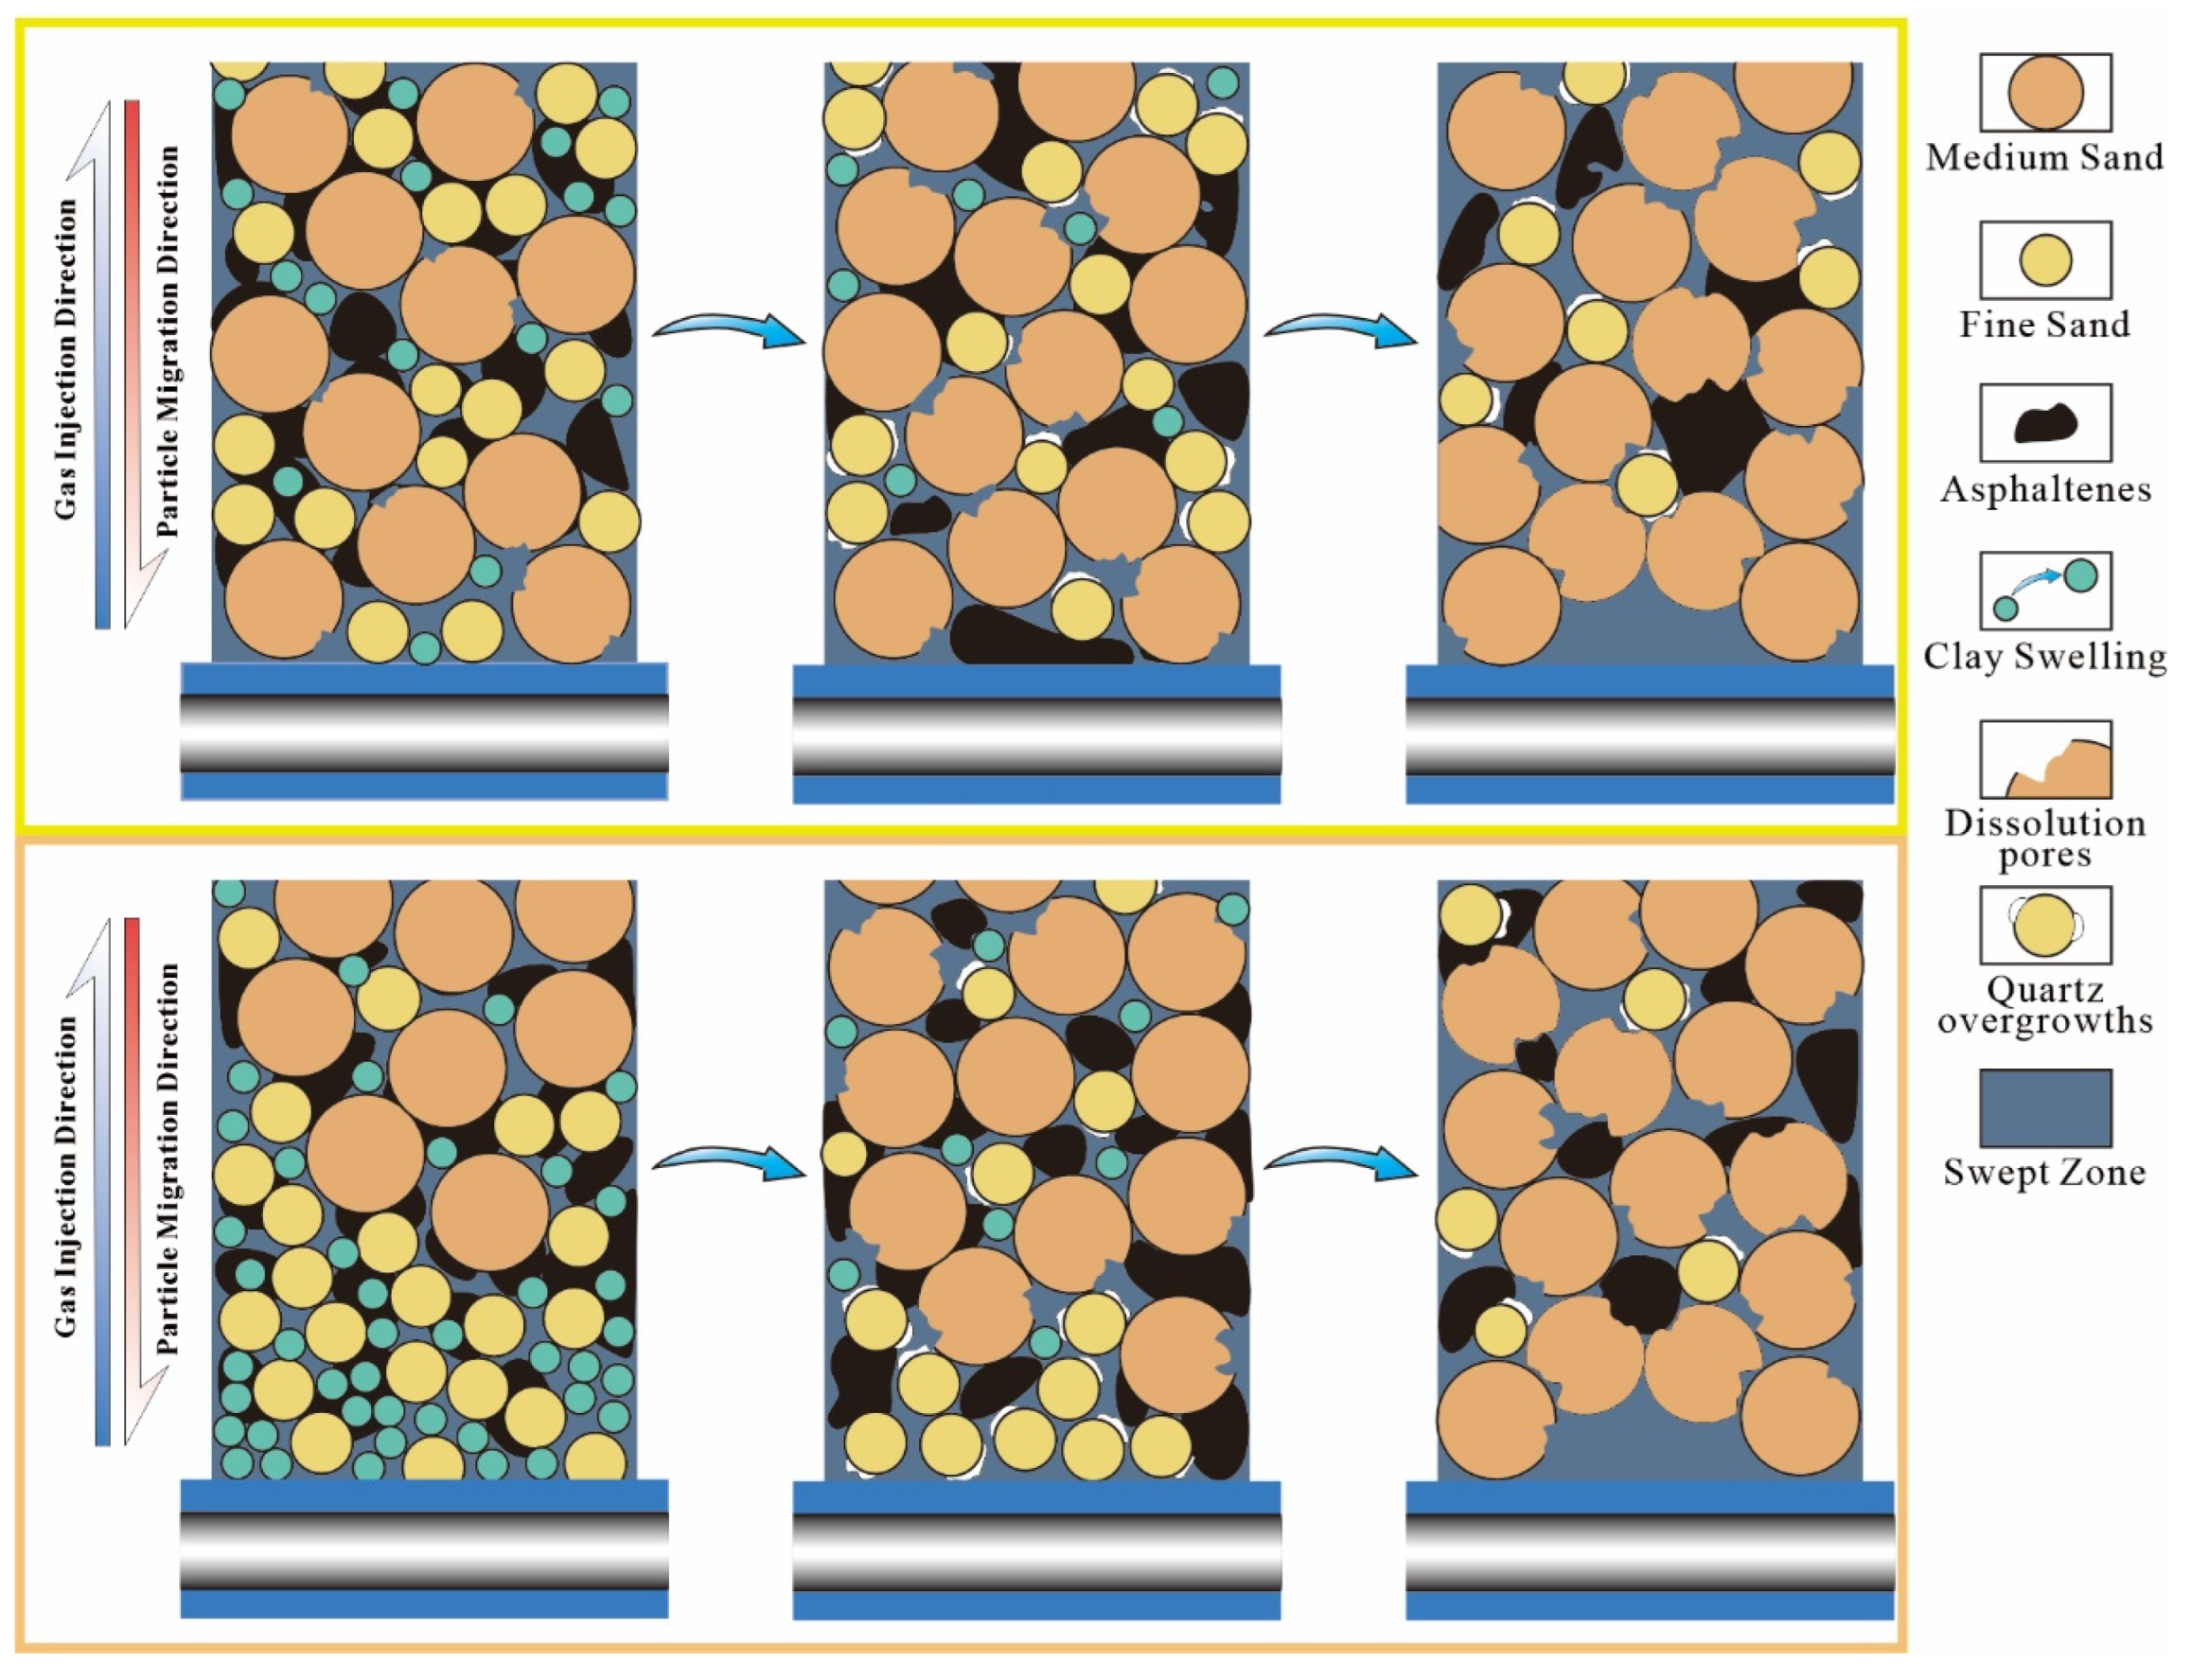
During this period of steam stimulation cycles, the primary affected particles were Fine Sand and Medium Sand grains (
Figure 10, panels c and d). These two distinct sedimentary facies significantly influenced steam advancement velocity, stimulation intensity (effectiveness), and rock–steam interaction patterns. The mouth bar reservoir, characterized by finer-grained basal layers with lower porosity and permeability that hinder upward steam migration, exhibited slower steam advancement velocity and relatively lower stimulation intensity (effectiveness). Conversely, the underwater distributary channel reservoir, featuring homogeneous grain-size distribution and non-rhythmic porosity/permeability characteristics that facilitate steam movement, demonstrated faster steam advancement velocity and relatively higher stimulation intensity (effectiveness). Under steam stimulation effects, this period witnessed the mobilization of Fine Sand and Medium Sand particles, feldspar dissolution, and the formation of Quartz overgrowths and zeolites (
Figure 12).
During this period of steam stimulation cycles, the underwater distributary channel and mouth bar formations expelled most of the Clay Minerals and partial Fine Sand particles from the formation, subsequently mobilizing and producing Asphaltenes from heavy oil along with additional Fine Sand particles [
27]. While the migration of Fine Sand and Asphaltenes enlarges pore spaces and improves connectivity, Asphaltene movement simultaneously causes pore throat blockage, reducing flow efficiency. This stage also involves mineral alteration processes including feldspar dissolution, Quartz overgrowths formation, and zeolite generation [
28]. The Medium Sand, with its larger grain-size and well-connected interparticle pores, facilitates fluid penetration and the dissolution of feldspar and other minerals. The resulting dissolution pores from feldspar dissolution enhance pore space and connectivity (
Figure 10, panel h). When the dissolved solutions flow through Fine Sand layers, the narrow pores more readily reach critical SiO
2 supersaturation, promoting preferential silica precipitation. Furthermore, the high specific surface area of Fine Sand provides abundant nucleation sites for Quartz precipitation, leading to Quartz overgrowths formation on Fine Sand surfaces. However, these Quartz overgrowths may obstruct pore throats, consequently impairing flow efficiency [
29].
At this stage, the finer-grained Fine Sand at the base of the mouth bar has not been completely expelled. When Asphaltenes pass through these narrow pore throats, they tend to become trapped, keeping the mouth bar in a cyclical process of “migration–clogging–migration” of Asphaltenes. This results in pore spaces and connectivity alternating between improvement and deterioration. Concurrently, feldspar dissolution, Quartz overgrowths, and zeolite formation further prolong this process [
30]. In contrast, the underwater distributary channel, with more uniform sand grain-size distribution and higher migration efficiency, has already expelled most Fine Sand and Asphaltenes. During this period, the primary processes occurring are feldspar dissolution, Quartz overgrowths, and zeolite formation.
As steam stimulation cycles continue to increase, Fine Sand particles have been flushed out, and steam begins to mobilize larger grains. During movement or under stress, these larger particles form arch-shaped structures due to geometric arrangement or mutual interaction, leading to bridging phenomena that clog flow channels. Simultaneously, Asphaltene particles entangle near the wellbore [
31]. These factors collectively hinder particle outflow, preventing further pore space enlargement and causing a sudden decline in pore connectivity.
4.3. Practical Applications and Improvement Directions of This Study
In practical oilfield development, this study’s 3D dynamic geological modeling extends the petrophysical variation patterns obtained from 1D core experiments to the entire field scale, achieving cross-scale coupling from centimeter-scale cores to kilometer-scale reservoirs. This multi-scale integration bridges microscopic experimental data with macroscopic reservoir simulation, enabling precise laboratory-derived patterns to guide field-wide development optimization. The detailed 1D steam stimulation experiments reveal transitional characteristics difficult to capture through single-scale approaches. By applying the “steam stimulation cycles–petrophysical parameters” correlation curves from 1D experiments to 3D model grid cells’ porosity and permeability variations, we can determine specific zones’ stimulation phases and predict subsequent reservoir property evolution based on experimental patterns.
In addition to its practical application value, the sedimentary facies control patterns identified in this study show both consistency and distinctiveness when compared with previous investigations of heavy oil reservoirs undergoing cyclic steam stimulation. Many studies have reported that reservoir properties generally exhibit an initial enhancement followed by stabilization during multi-cycle steam injection, which is consistent with the overall evolution pattern observed in this work [
22].
However, compared with relatively homogeneous sandstone reservoirs reported in some heavy oilfields, this study highlights a more pronounced facies-dependent differentiation in property evolution. The underwater distributary channel demonstrates earlier and stronger permeability enhancement than the mouth bar deposits, indicating that internal architectural heterogeneity exerts significant control on stimulation efficiency. This suggests that sedimentary facies architecture should be explicitly incorporated into cyclic steam stimulation optimization strategies in heterogeneous heavy oil reservoirs.
Potential discrepancies among different reservoirs can be attributed to variations in lithological composition, Clay Mineral distribution, reservoir thickness, injection parameters, and thermal–hydraulic coupling conditions. In particular, clay-rich intervals may exhibit stronger water-sensitivity effects, leading to localized permeability reduction, whereas sand-dominated facies tend to show net property enhancement. Therefore, the applicability of the facies control model proposed in this study should be evaluated in the context of specific reservoir architecture and mineral composition.
This study still has room for improvement in experimental methodology, mainly reflected in the following aspects: First, the current experimental design does not fully consider the swelling and transformation processes of Clay Minerals at the microscopic scale; second, the experimental scheme fails to systematically incorporate the dynamic effects of pressure and temperature fields [
32]. These limitations result in significant discrepancies between the localized porosity reduction observed in 3D dynamic modeling experiments and the continuous porosity increase seen in 1D experiments. The existing 1D experiments calculate porosity changes solely based on produced material volume from sandpack models, whereas in actual formations, the combined effects of porosity changes induced by Clay Minerals swelling or mineral transformation, along with property alterations caused by pressure and temperature field variations, may far exceed those attributable solely to produced materials. The initial nitrogen injection may create a gas-rich zone, potentially improving initial steam injectivity and affecting early-stage chamber development, a phenomenon warranting further study. A limitation of the current experimental design is the lack of internal temperature profiling, which precludes direct mapping of the steam front. Future work employing distributed temperature sensors would provide valuable spatial data to further validate the inferred advancement patterns. This finding provides clear direction for future experimental improvements, suggesting the incorporation of mineral composition analysis and pressure–temperature coupling tests to establish a more comprehensive porosity evaluation system for more accurate characterization of true reservoir property changes during steam stimulation cycles.
5. Conclusions
The combination of 1D physical simulation and 3D dynamic modeling analysis reveals transitional characteristics that are difficult to capture using conventional single-scale methods, while enabling multi-scale analysis of the heterogeneity evolution in reservoirs after multiple steam stimulation cycles. The 3D dynamic model allows the extension of variation patterns obtained from 1D experiments to the entire field scale. In this study, we observed an overall increasing trend in porosity and permeability after multiple cycles of steam stimulation across the reservoir. However, it is important to highlight that localized reductions in porosity and permeability were observed in certain areas of the reservoir, particularly in zones with higher clay content or more complex sedimentary structures. These reductions indicate spatial heterogeneity within the reservoir, which was influenced by variations in sedimentary facies and stratigraphic characteristics.
The two microfacies exhibit distinct variation characteristics during different stimulation periods. In the early period (cycles 1–9) of steam stimulation cycles, the underwater distributary channel microfacies demonstrates faster property changes with greater cumulative increases in both porosity and permeability. As the number of cycles increases, the variation rates of porosity and permeability gradually decrease until stabilizing after 15 steam stimulation cycles. During the late period (cycles 10–30), the mouth bar microfacies shows more rapid property changes with larger cumulative gains in porosity and permeability. Similarly, with increasing cycles, the variation rates progressively decline until stabilizing after 25 steam stimulation cycles.




 ,
,