


Abstract
Asbestos-containing materials (ACMs) are among the most common types of hazardous building materials. Usually, ACMs are identified by laboratory methods, which can slow down and complicate the processes of demolition and refurbishment of old buildings. The hypothesis applied in this study is that ACMs, both in friable and non-friable forms, can be reliably identified in situ using a handheld Raman spectrometer (HHRS). A HHRS equipped with two temperature-controlled diode lasers (785 nm and 852 nm) was used. Two groups of ACMs were examined: one, consisting of ACMs with a known type of asbestos, previously determined by standardised tests used for the HHRS method’s validation, and the second, consisting of presumed ACMs, where HHRS was used for the identification of asbestos. Additional testing according to ISO 22262-1 was applied. The impact of several factors on the asbestos identification was evaluated. The results confirm that the identification by HHRS of all main types of asbestos minerals is possible with a certain level of probability, regardless of whether the fibres are in an unbound form (fabrics, ropes, wools) or bound within cementitious or polymer composites. Some processing (scaling, smoothing) of the reference spectra should be applied to increase the percentage of asbestos minerals’ identification. In conclusion, it has been proven that the majority of ACM in buildings may be identified in situ by HHRS in a rapid manner, thus accelerating the pre-demolition/pre-renovation audit (PDA/PRA), avoiding risks to demolition/refurbishment workers’ health due to asbestos unawareness, as well as preventing the contamination of other CDW and environmental pollution.
1. Introduction
ACMs are among the most common types of hazardous CDW [1,2]. Asbestos fibres possess high mechanical strength and are also excellent insulators–they are resistant to heat, fire, and chemicals, and do not conduct electricity [3]. Due to their favourable properties and the simplicity of their application technology, they have been widely used across various industries, including electrical, automotive, and construction. Six types of asbestos minerals were used in various materials for construction purposes—actinolite, amosite, anthophyllite, chrysotile, crocidolite, and tremolite. In the early 20th century, asbestos cement was invented, and between the 1940s and 1980s, asbestos was incorporated into many other building materials, including products for thermal insulation, electrical insulation, and fire protection [4]. More than 3000 asbestos-containing products are known (boards, pipes, tanks, couplings, tiles, plasters, insulation materials, ropes, blankets, felts, waddings/wools, cardboards, fibreboards, paints, putties, decorative items, etc.) [5].
Asbestos is an extremely hazardous substance, classified as a Category 1A carcinogen under Regulation (EC) No 1272/2008 [6]. The most dangerous types are considered to be crocidolite (blue asbestos) and amosite (brown asbestos) [3,7,8]. Unlike other fibres commonly used in construction (e.g., glass fibres), asbestos fibres do not decompose within the human body, leading to their accumulation in lung tissue. This is a major cause of severe diseases such as asbestosis, bronchial carcinoma, and mesothelioma [7,8].
The first country to introduce restrictions on the use of all forms of asbestos, as early as 1985, was Denmark. In the European Union, asbestos has been completely banned for extraction, trade, and use as of 1 January 2005 [4,9,10], and in most countries, including Bulgaria, the ban has been in force from this date [4]. Therefore, in most European countries, asbestos-related problems—both from an environmental perspective and in terms of occupational health and safety—may arise during the demolition or renovation of buildings constructed before 2005. The risk is particularly high in older buildings where construction and technical documentation is missing, and where a wide range of ACMs may have been incorporated.
In all renovation and/or demolition activities involving such buildings, a PDA/PRA is required to identify ACM and other hazardous and/or contaminated construction materials. The level of engagement for PDA/PRA varies: from “required” (e.g., Denmark, France) to “voluntary or required only in some regions” (e.g., Spain, Italy) and to “not occurring” (e.g., Portugal, Croatia) [11]. In Bulgaria, PDA is “envisaged as a procedure,” but it has no mandatory scope or standardised actions, nor a reliable mechanism to monitor its thoroughness and effectiveness, while PRA is practically not applied. A crucial component of PDA/PRA is the identification of materials containing hazardous substances or mixtures [12], which includes asbestos. On the other hand, the identification of asbestos prior to construction activities is mandatory in accordance with [13]. The common practice for identifying ACM is a visual assessment aimed at recognising typical ACM, such as corrugated Eternit boards and pipes. However, there are applications unfamiliar to the broader construction community where asbestos fibres may remain undetected, for example, decorative panels, asbestos cardboard, asbestos fabrics used as underlays for flooring, asbestos packing, and particularly, cement coatings on pipelines. Identification of insulation materials containing asbestos is not always straightforward. Asbestos fibres are microscopic and cannot be observed with the naked eye. Consequently, asbestos-containing materials often remain unidentified [12,14]. Standardised methods for determining ACM [15,16] involve sampling and laboratory testing, which compromise the integrity of the ACM. From a human health risk perspective, ACM can be classified as (a) bonded, where asbestos fibres are embedded in a matrix (cement-based or polymeric), and (b) unbonded, for example, asbestos wool or asbestos ropes, along with their friability—the ability of the material to release asbestos fibres under mechanical stress [15,16]. Friable materials are characterised by a weak bond between the fibres and the matrix, which leads to easy dispersal even under minimal mechanical action, making this subgroup particularly hazardous to human health. Non-friable materials are characterised by a strong bond between the asbestos fibres and the binding matrix (e.g., cementitious, bituminous, or polymeric), which significantly reduces the likelihood of fibre release under normal service conditions. However, during sampling, even non-friable products pose a potential hazard, especially if handled improperly (e.g., cutting, drilling, or surface grinding) and/or without appropriate protective equipment [17].
Laboratory methods for identifying ACMs and confirming their presence can delay and complicate refurbishment or demolition processes. Consequently, some ACM may be overlooked, neglected, and/or improperly handled due to negligence or carelessness. If ACMs are not identified, conditions arise for asbestos contamination of other CDW, as well as of refurbishment/demolition sites and CDW management facilities, thereby multiplying the harmful effects of asbestos fibres. Rapid, in situ, non-destructive identification would allow better planning of refurbishment or demolition activities, appropriate handling of hazardous CDW, and the implementation of necessary personal protective equipment (PPE) and respiratory protective equipment (RPE) [18].
In situ methods are already widely applied during PDA/PRA in existing buildings [11,12]. Some popular in situ techniques, such as handheld X-ray fluorescent spectrometry (HHXRF) [11], which is suitable for detecting heavy metals [19], prove to be unsuitable for identifying ACM, since the chemical elements characteristic of asbestos (Ca, Mg, Fe, Si, Na, O, H) [20] are also present in a variety of other construction materials.
Raman spectroscopy stands out as a particularly promising analytical technique for the rapid and effective identification of CDW, as it is non-destructive and allows for fast results while demonstrating a high degree of reliability [21,22]. Raman spectroscopy has been applied in the analysis of both historical and modern construction materials [23]. Some studies discuss the influence of external factors, such as temperature and pressure, on Raman spectra [24]; however, in [25], a HHRS was used for in situ detection of asbestos in a former chrysotile quarry to prevent risks associated with the extraction of other serpentine-group minerals and during future nickel ore exploitation, enabling rapid safety-related decisions. According to [25], the use of a handheld Raman analyser can be considered an effective approach for in situ identification of asbestos minerals, even in strongly disaggregated and altered samples. In another study, a handheld Raman spectrometer was successfully used to identify chrysotile asbestos fibres in Eternit samples [26]. For the purposes of PRA/PDA, the main goal is to establish the presence or absence of ACM.
The present study examines the possibilities and challenges of using a handheld Raman analyser for in situ identification of various forms of asbestos in both friable and non-friable ACM, as early as the pre-demolition stage of buildings and facilities, within the framework of a PRA/PDA. It proposes a methodology for application and provides an assessment of the method’s reliability.
2. Materials and Methods
2.1. Challenges in Asbestos Identification
2.1.1. Types of Asbestos Minerals
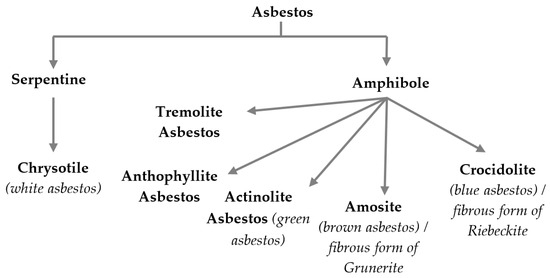
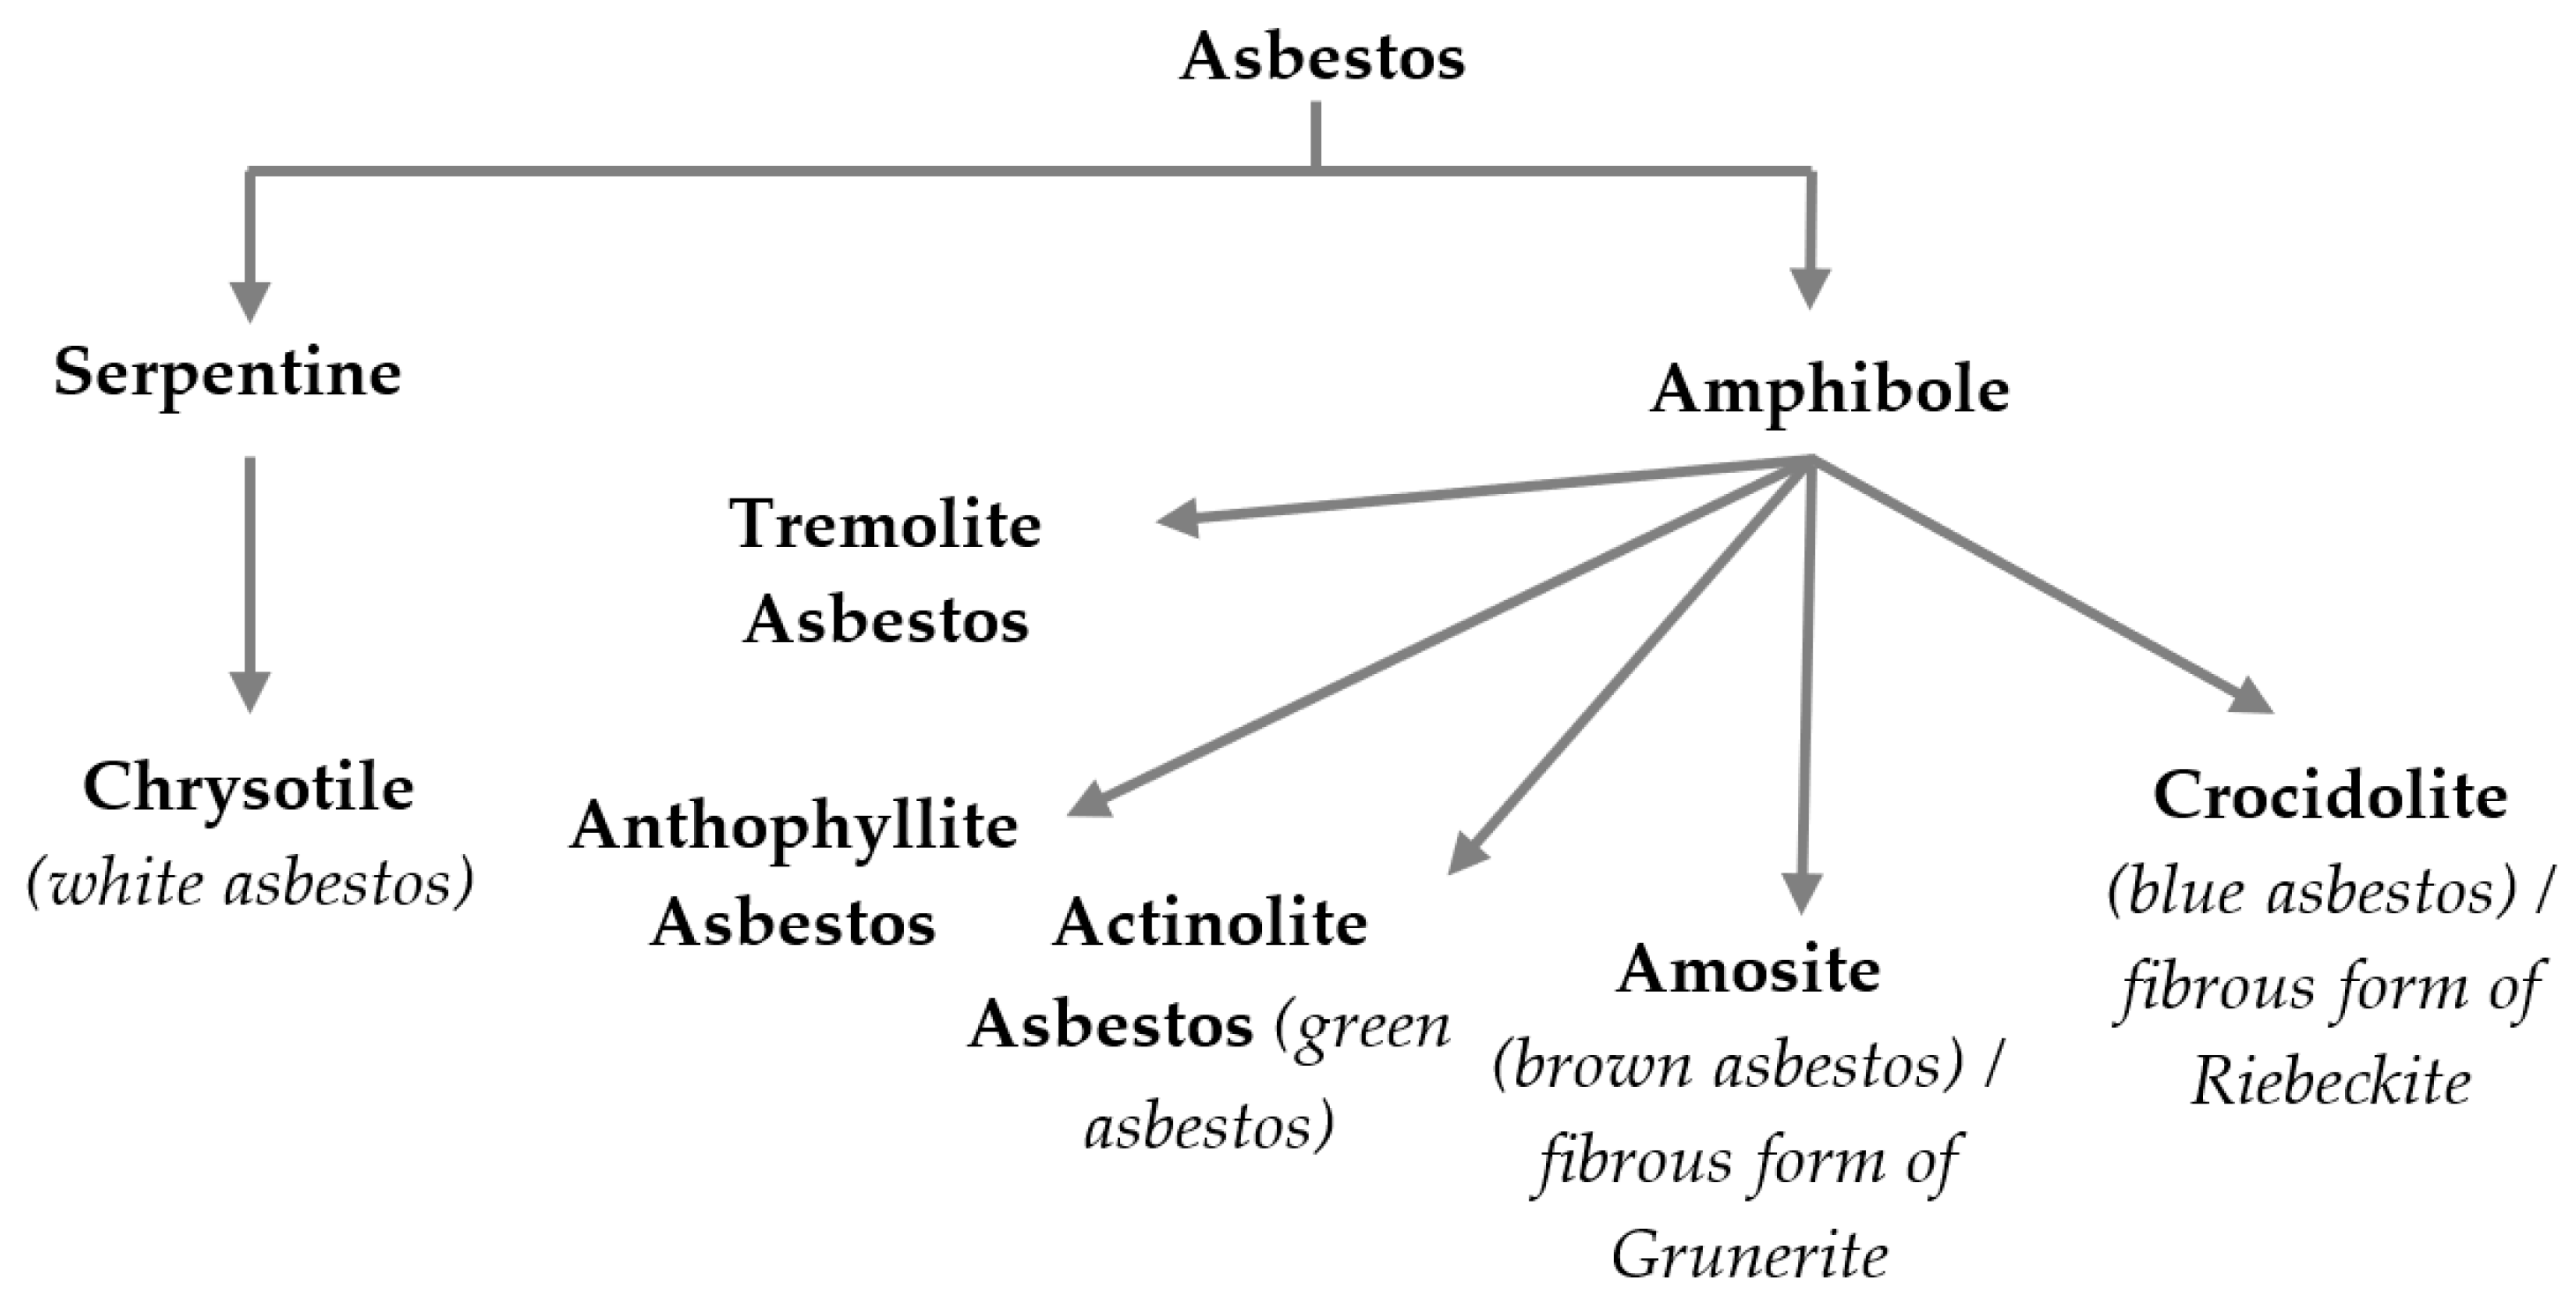
As mentioned before, the term “asbestos” does not refer to one single mineral, but rather to a group of six different minerals with a similar crystalline structure, characterised by fibre lengths exceeding 5 μm and a length-to-diameter ratio of at least 3:1 [27]. Most of these minerals are magnesium silicates, divided into two main groups: serpentine and amphibole (Figure 1).
Figure 1.
Types of asbestos mineral forms, a diagram modified from [27,28].
Serpentine asbestos, which includes the mineral chrysotile, is characterised by relatively long and flexible crystalline fibres, which explains its widespread use. The amphibole asbestos group comprises the minerals amosite (the fibrous form of grunerite), crocidolite (the fibrous form of riebeckite), as well as the fibrous forms of tremolite, anthophyllite, and actinolite.
2.1.2. Methods for Asbestos Identification
The mineral composition of substances in crystalline form is commonly determined using X-ray diffraction (XRD). However, since asbestos and non-asbestos forms of amphibole and serpentine minerals have the same crystal structure, XRD cannot distinguish between them. The difference between fibrous (asbestos) and non-fibrous morphologies lies in the crystal habit, which must be identified by microscopic techniques such as polarised light microscopy (PLM) or electron microscopy [29].
The ISO 22262:2012 standard [15] regulates sampling procedures as well as analytical methods for the qualitative identification of asbestos in ACM. The main analytical methods specified in the standard are PLM, scanning electron microscopy (SEM), and transmission electron microscopy (TEM).
Part 2 of the same standard, ISO 22262-2:2014 [16], is used for the quantitative analysis of asbestos in vermiculite, other industrial minerals and commercial products that incorporate these minerals, including construction materials.
2.1.3. Capabilities and Limitations of Using Raman Spectroscopy for Asbestos Identification
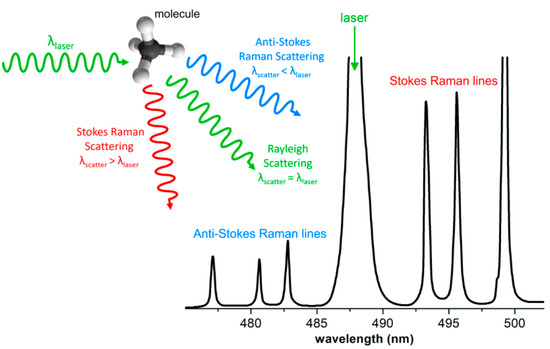
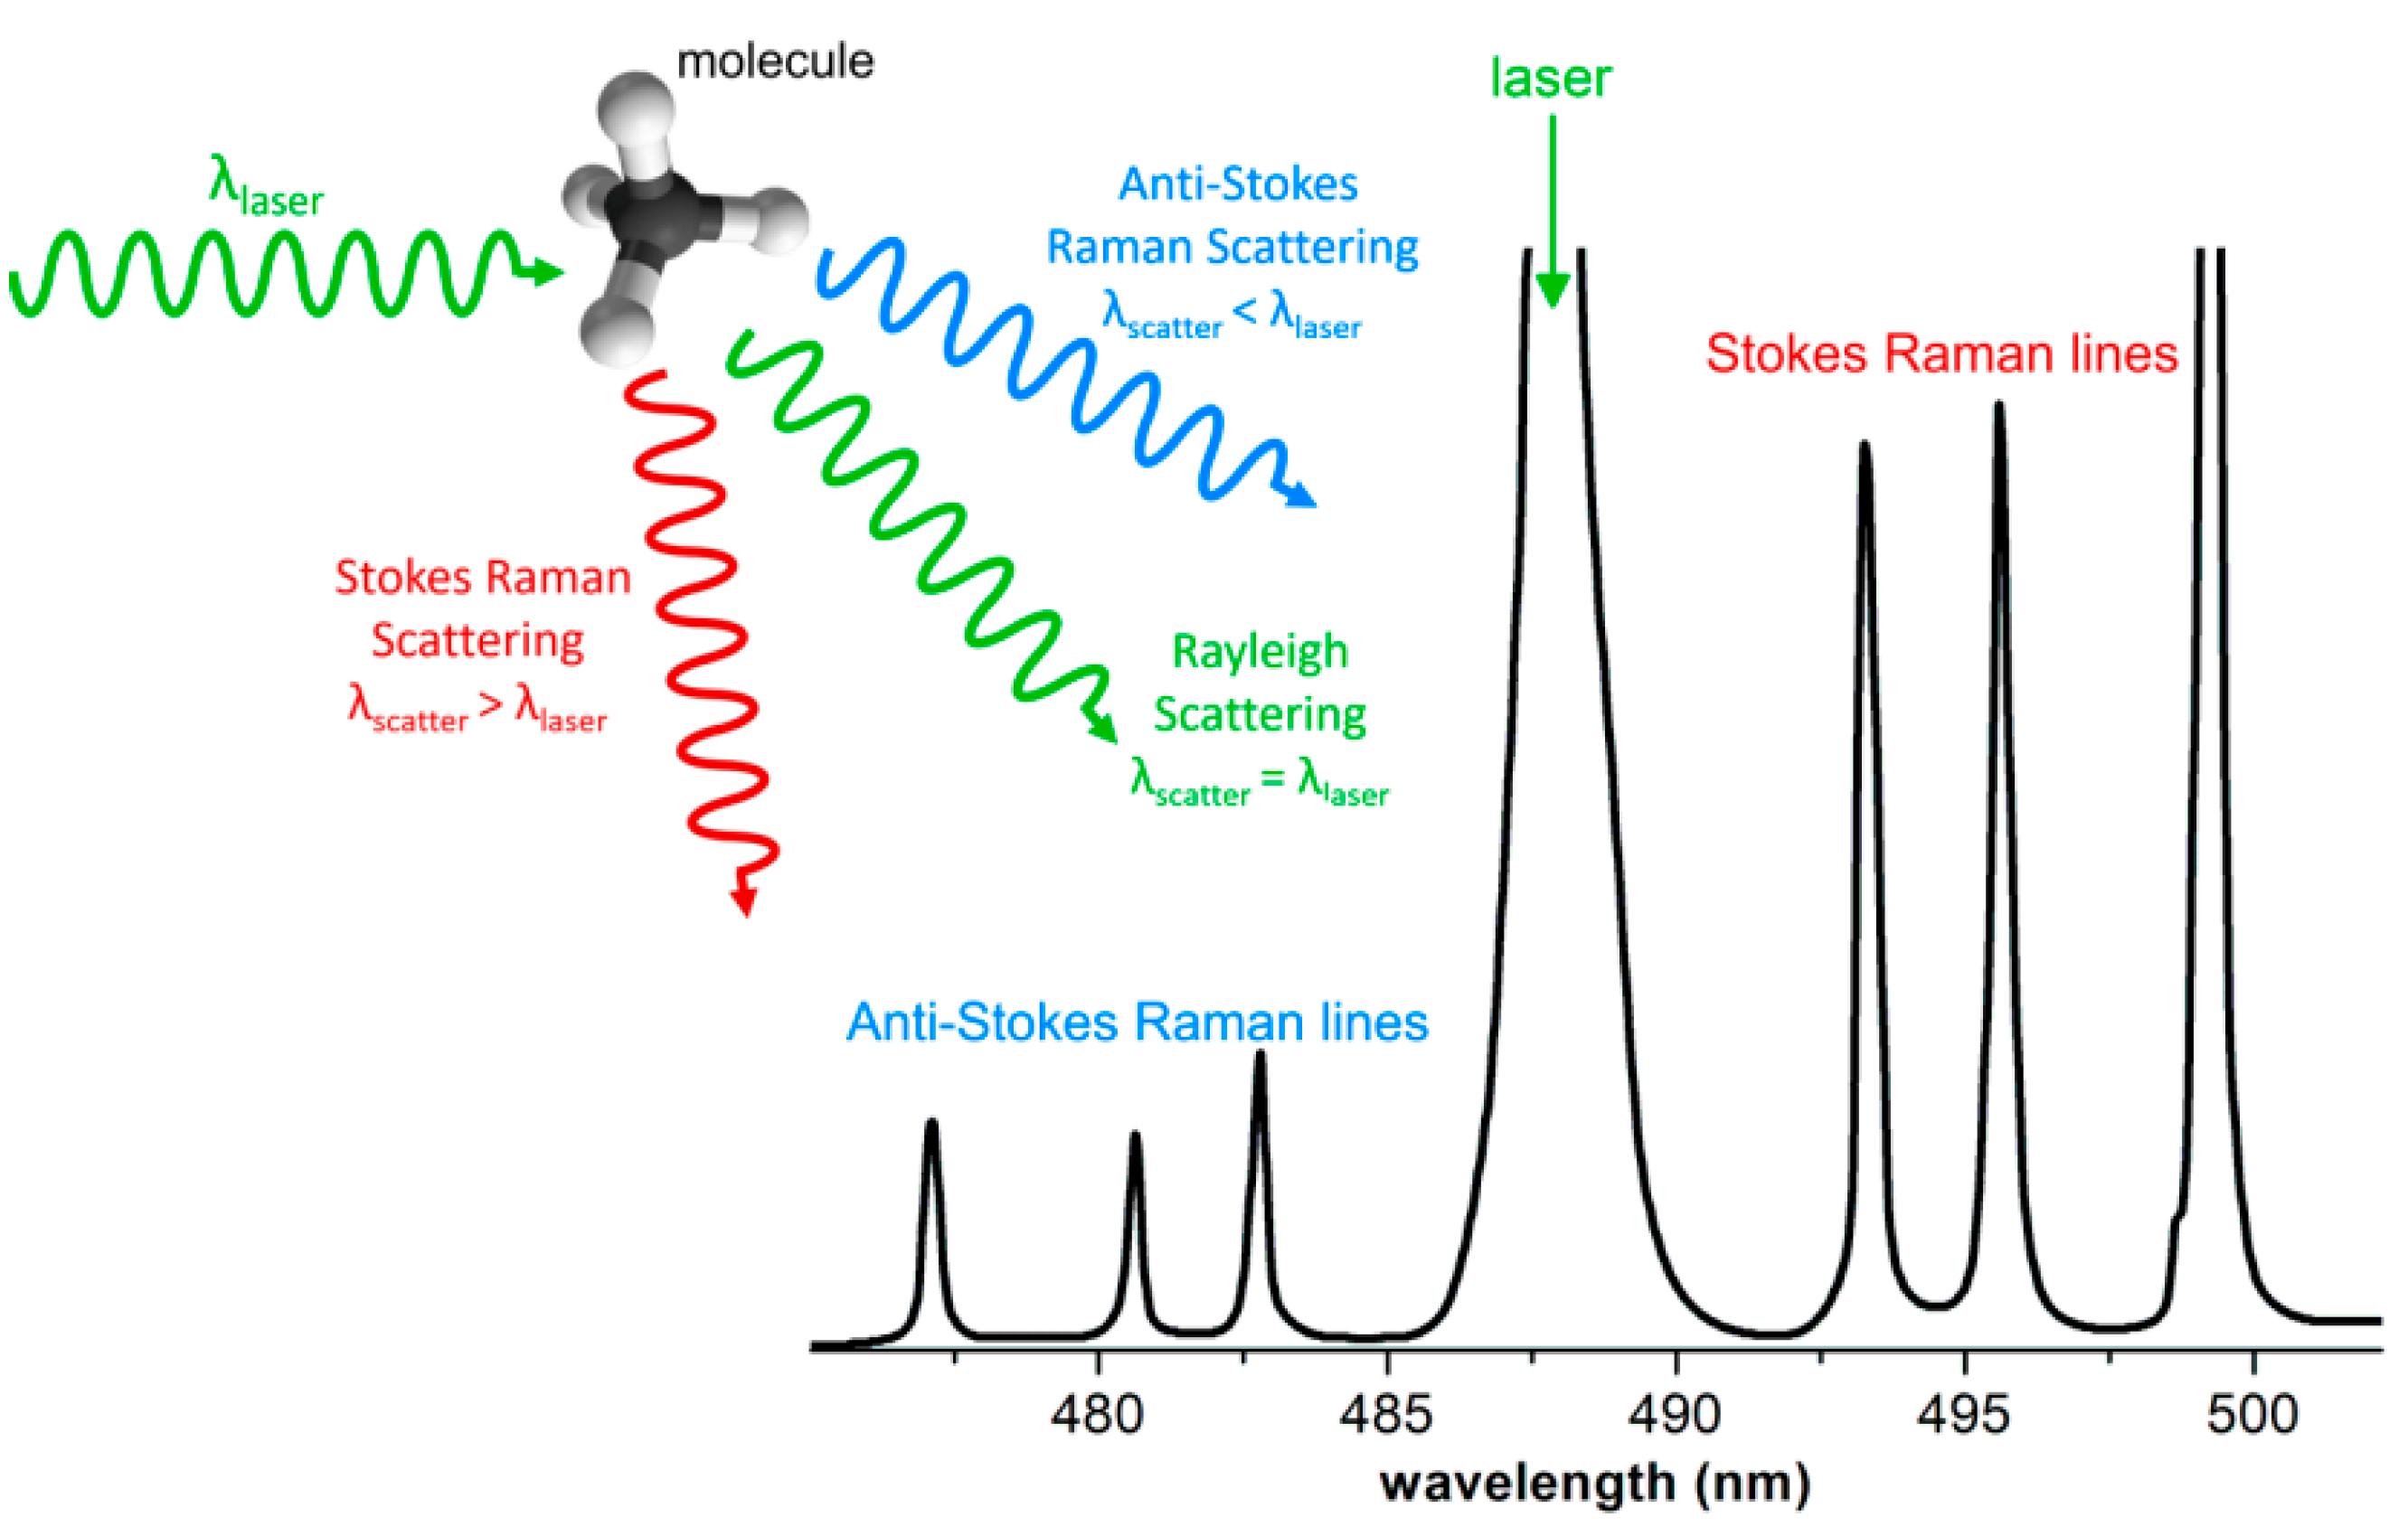
In the Raman spectroscopy of materials, a sample is usually exposed to a laser beam. The working principle of the Raman technique is illustrated in Figure 2. The electromagnetic radiation is transmitted, absorbed, or scattered by the material under investigation. When the radiation is scattered, it usually undergoes common Rayleigh scattering, in which the energy/wavelength remains unchanged. A small fraction of the scattered radiation, however, experiences a shift relative to the incident radiation, known as Raman scattering. Raman lines appear in pairs: Stokes lines and anti-Stokes lines. Stokes lines have a lower energy (longer wavelength) than the initial radiation, while anti-Stokes lines have a higher energy (shorter wavelength). The energy shift is called the Raman shift and is measured in wavenumbers (cm−1), usually recorded only from the Stokes lines [30]. Raman shifts are independent of the source wavelength and are characteristic of the specific substance or molecule.
Figure 2.
Scheme of Raman scattering, according to [30].
The most characteristic and important region of the Raman spectrum for identification purposes is referred to as the “fingerprint” of the substance [23,31]. The Raman spectrum of a material depends on the masses of the constituent atoms, their distances, and their spatial arrangements, and therefore provides a characteristic “fingerprint” of the molecular or crystalline structure. It is possible to unambiguously identify chemical compounds, including their polymorphic forms, by comparing the “fingerprints” of the spectra of a “sample under investigation” with reference spectra in terms of Raman band positions and shapes [23].
According to [32], Raman bands measured with handheld Raman spectrometers are located at wavenumber positions with an accuracy of ±3 cm−1 relative to reference values from the literature. This identification accuracy can reach ±0.3 cm−1 when using a well-calibrated benchtop Raman spectrometer [33]. A primary limitation of this technique in material analysis is the presence of fluorescence and/or background artifacts; however, filters can be used to remove these unwanted effects. Lasers with longer wavelengths reduce the likelihood of fluorescence in most materials, but the higher power required is more readily achieved at shorter wavelengths [22], which necessitates selecting an appropriate spectrometer depending on the materials under investigation. The importance of proper instrument selection is illustrated by comparative studies in [34].
It is considered that handheld Raman spectrometers equipped with 785 nm diode lasers can successfully detect most mineral classes, although there are limitations associated with black and dark green minerals. In dark green minerals, the main issue is the presence of a strong fluorescence emission background, which completely masks the Raman signatures, as well as absorption of the red laser radiation. In black minerals, regardless of their structure, Raman spectra are difficult to obtain [32].
For reliable results with Raman spectroscopy, a database of well-defined reference spectra is required, against which the acquired spectrum of the specific material can be compared [25,35]. The most significant challenge in identifying specific asbestos minerals is the presence of non-fibrous mineral forms with the same composition, which for Raman spectroscopy has nearly identical fingerprints, except in the OH-stretching region (3500–3800 cm−1) [36]. The literature provides data on characteristic Raman shifts (cm−1) for different forms of asbestos, which also allows for manual analysis of the spectra. Table 1 presents data from two sources [20,36].
Table 1.
Forms of asbestos and their Raman shifts (cm−1).
The potential heterogeneity of the material under investigation also complicates the detection of asbestos fibres in another matrix, as the individual Raman spectrum will depend on which part of the material is in the laser focus [37]. For this reason, several spectra must be acquired and analysed over a limited area of the material. Consequently, standardised asbestos identification methods require a minimum sample area or volume. If, based on visual assessment, the ACM can be considered homogeneous, the minimum sample should have a surface area greater than 1 cm2 for thin products (e.g., asbestos–cement boards) or a volume greater than 1 cm3 for thicker products. For ACMs with more complex structures, such as sprayed fireproofing, the standard recommends a minimum sample volume of 10 cm3, while for loose-fill materials (e.g., vermiculite), the sample volume may reach 1000 cm3 [15].
2.1.4. Need for a Preliminary Desk Study of ACM
The availability of preliminary data on buildings and asbestos-containing products can provide useful guidance when selecting the surfaces to be examined, for instance, the area and the number of spectra per unit area. In residential buildings, composite ACM with a low to moderate asbestos fibre content (up to approximately 25%) and non-friable structures are most commonly used; these include reinforced cement boards, bituminous waterproofing products, Eternit pipes, and floor coverings (e.g., vinyl tiles, PVC tiles, etc.) [38]. In contrast, in the industrial sector, asbestos is most widely used in thermal insulation and fire protection coatings, which often fall into the category of friable materials with high asbestos contents (up to 100%), such as sprayed coatings, thermal insulation, asbestos boards such as millboard, etc. [39,40,41].
According to [15], for each product type, the typical asbestos type and mass fraction are indicated: for the production of asbestos–cement corrugated sheets, 10% to 12% of chrysotile asbestos was usually used, and sometimes also, with some manufactures, less than 5% crocidolite in addition to chrysotile; wall and ceiling plasters used for interior wall and ceiling coatings, with or without aggregate, might contain up to approximately 3% of chrysotile mass fraction, but generally locally mixed and inhomogeneous; chrysotile of ca. 50% and sometimes amosite of ca. 35% might be present in asbestos-containing lightweight building boards or fire-resistant panels.
Many countries maintain a so-called asbestos profile, describing the characteristic types and applications of ACM within the country [42,43,44,45]. These profiles often include information on the predominant type of asbestos used, national asbestos production, and domestic ACM manufacturing. According to data from the National Centre of Public Health and Analyses in Bulgaria (NCPHA), for the period of 1960–1995, the asbestos mined within the country was of the amphibole type (mainly anthophyllite and tremolite) [42], whereas the most widely used asbestos, chrysotile, was imported [7,42]. By 1980, the chrysotile asbestos used in the country accounted for 80% of total asbestos consumption, while the locally produced anthophyllite and tremolite represented 17.5%. By 1993, this proportion had increased further, with locally produced asbestos constituting only about 5% [42]. This trend is confirmed by [15], which summarises that chrysotile accounted for 95% of asbestos consumption.
Sometimes, the presence of coatings on ACMs prevents the identification of asbestos fibres. Removing the coating by scraping, grinding and/or peeling, which may pose a risk of asbestos fibre release, necessitates the use of appropriate measures: PPE and RPE [13,18,46] as well as measures for dust reduction during decontamination or sampling of ACMs. In cases where asbestos fibres are deeply dispersed within the material and not accessible on the surface, controlled mechanical processing of the material is required to enable safe access to the fibres. The most effective approach for this involves the use of wet treatment (amended-water method) [47,48] and a needle gun with an integrated vacuum shroud [49], which allows loosening of the surface layer without releasing hazardous asbestos fibres into the air.
2.2. Approach
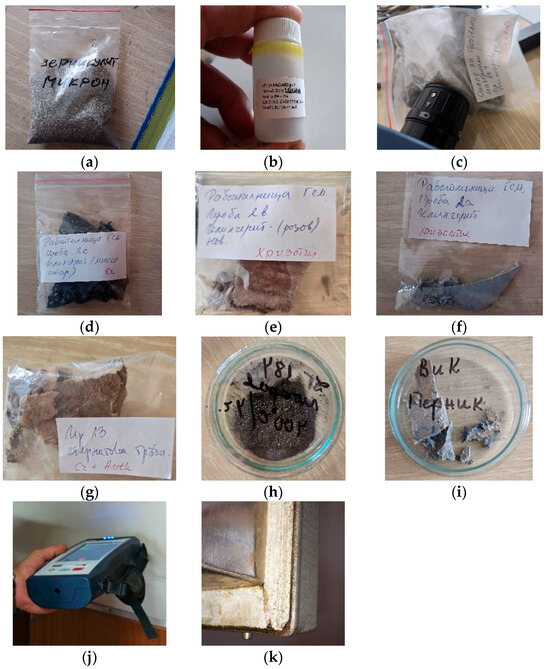
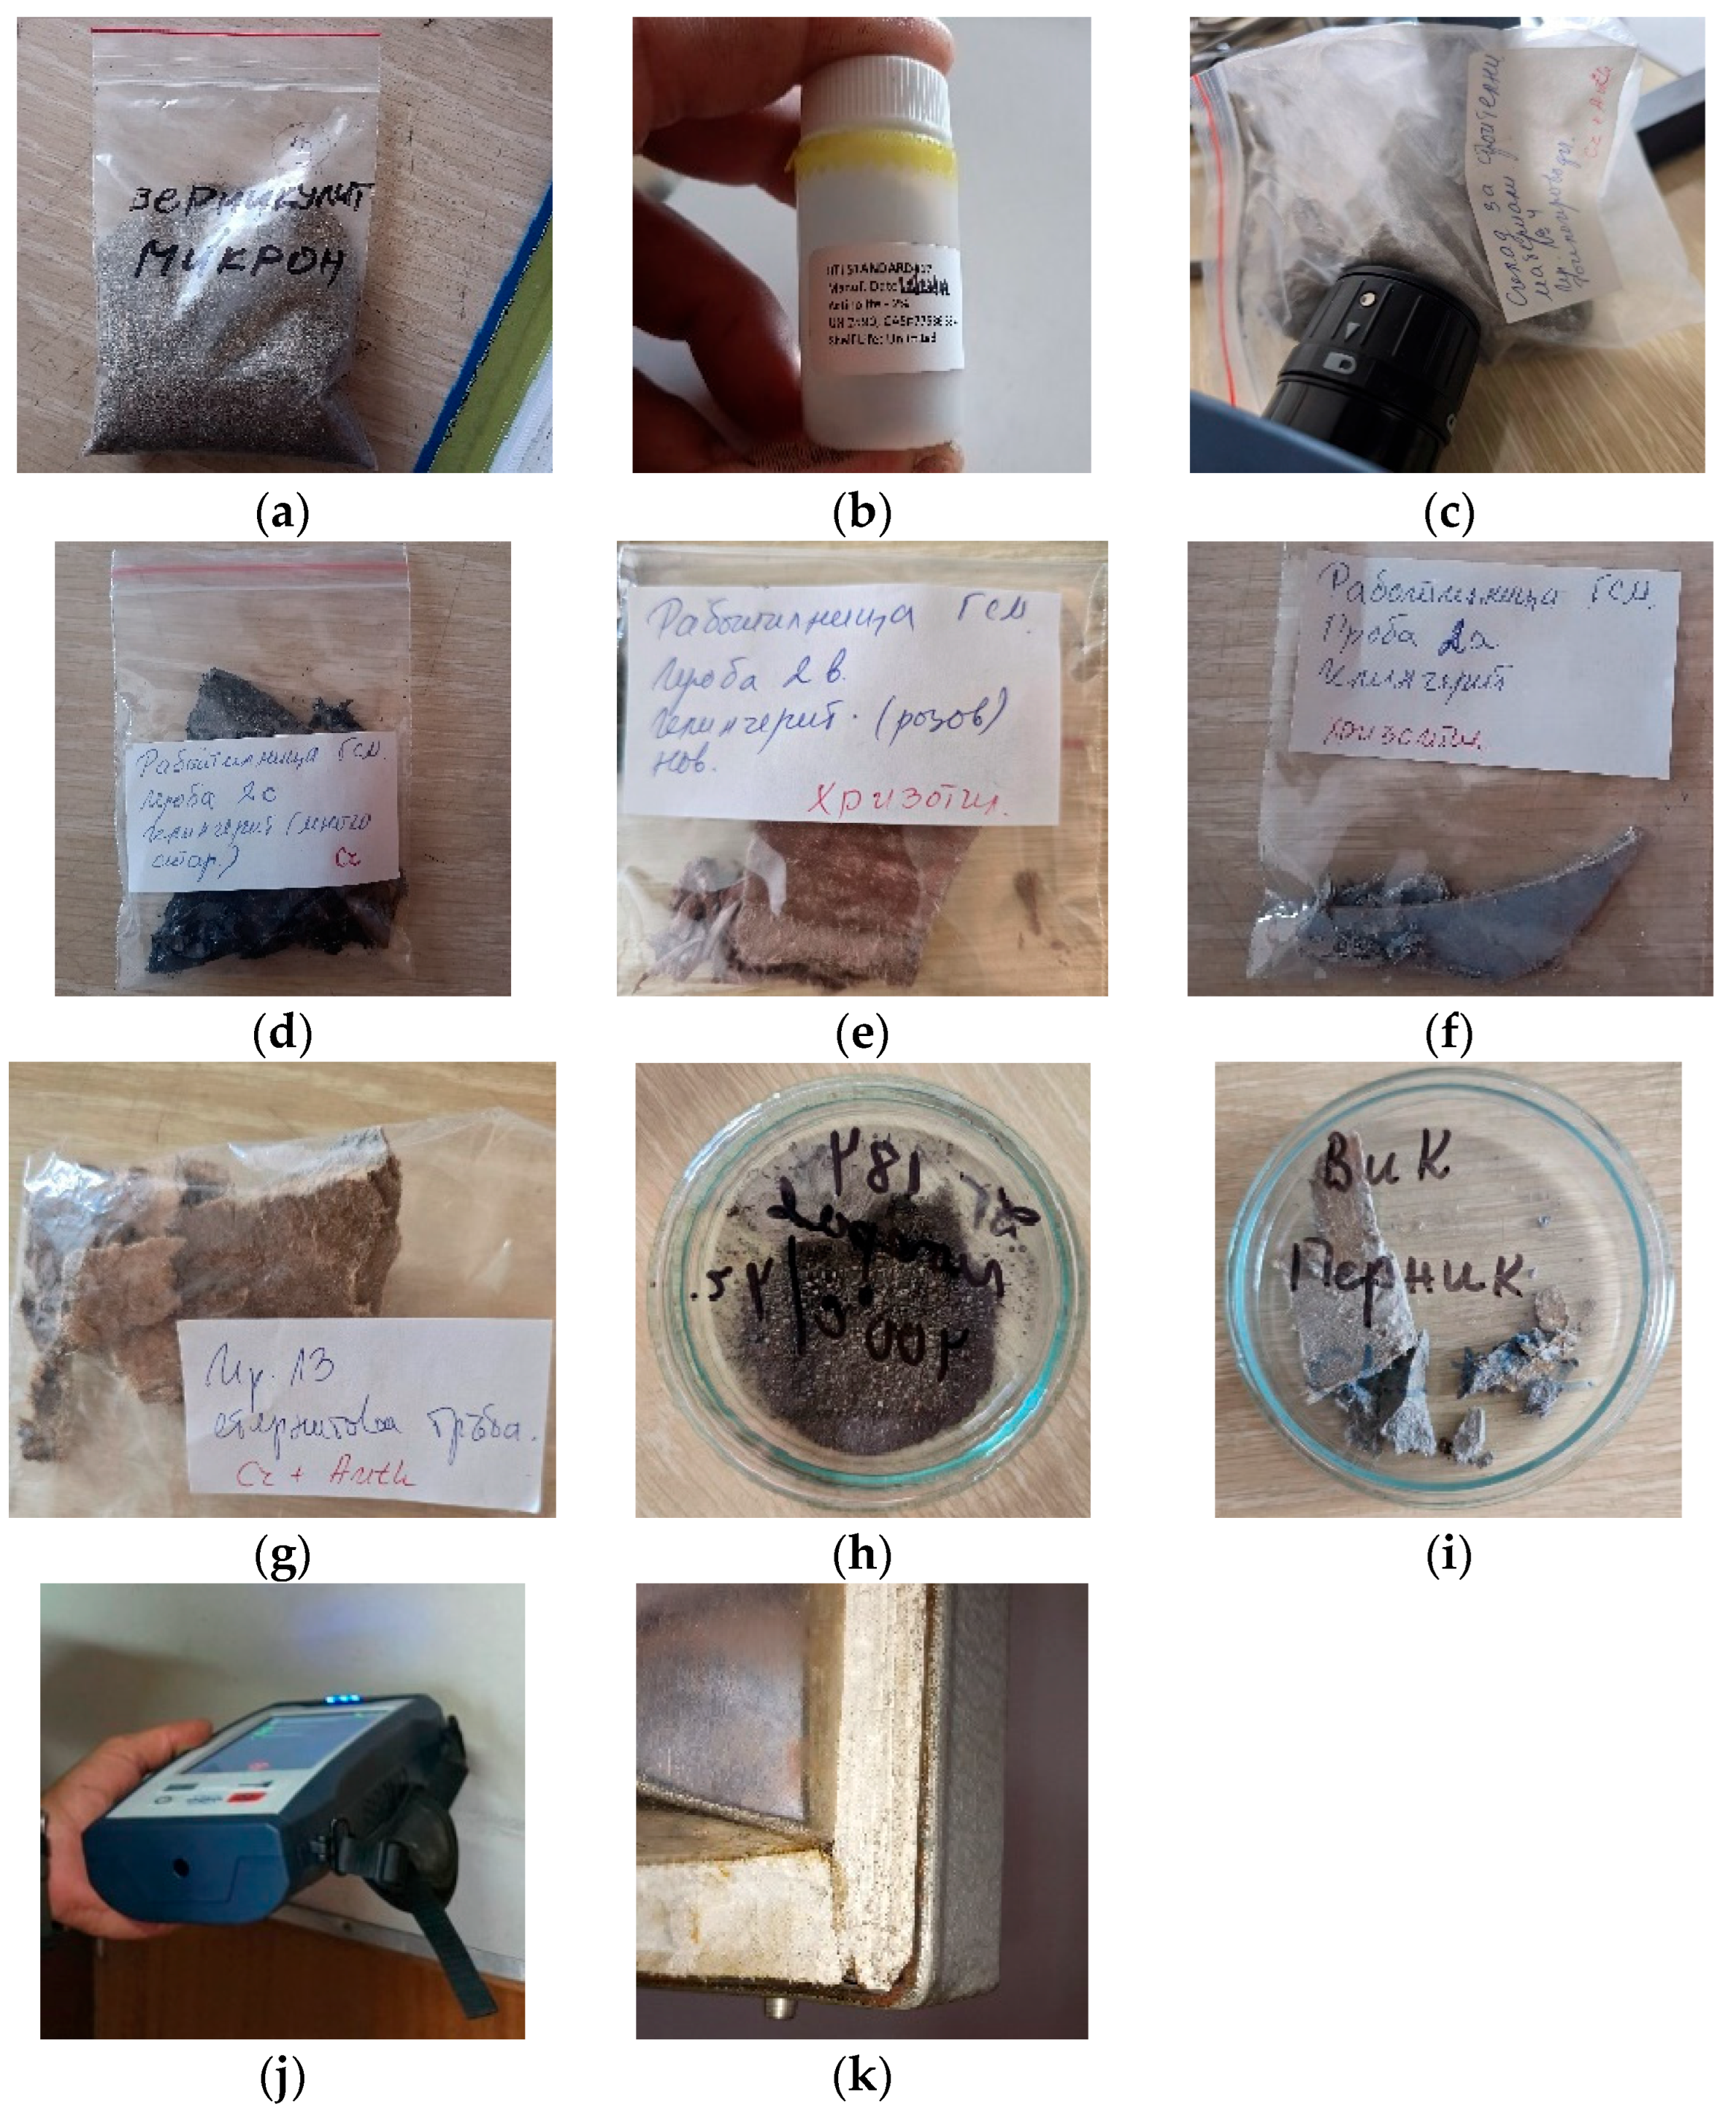
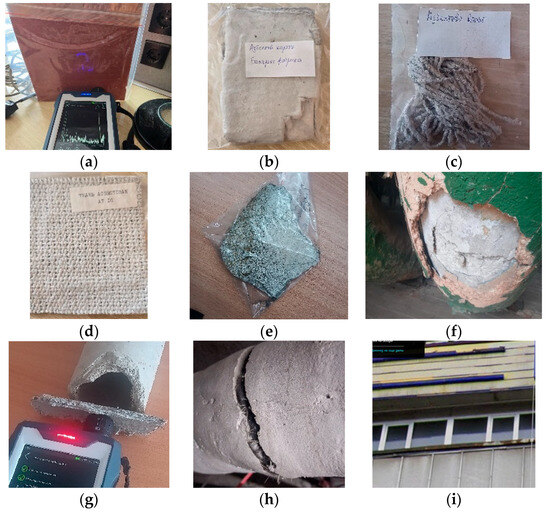
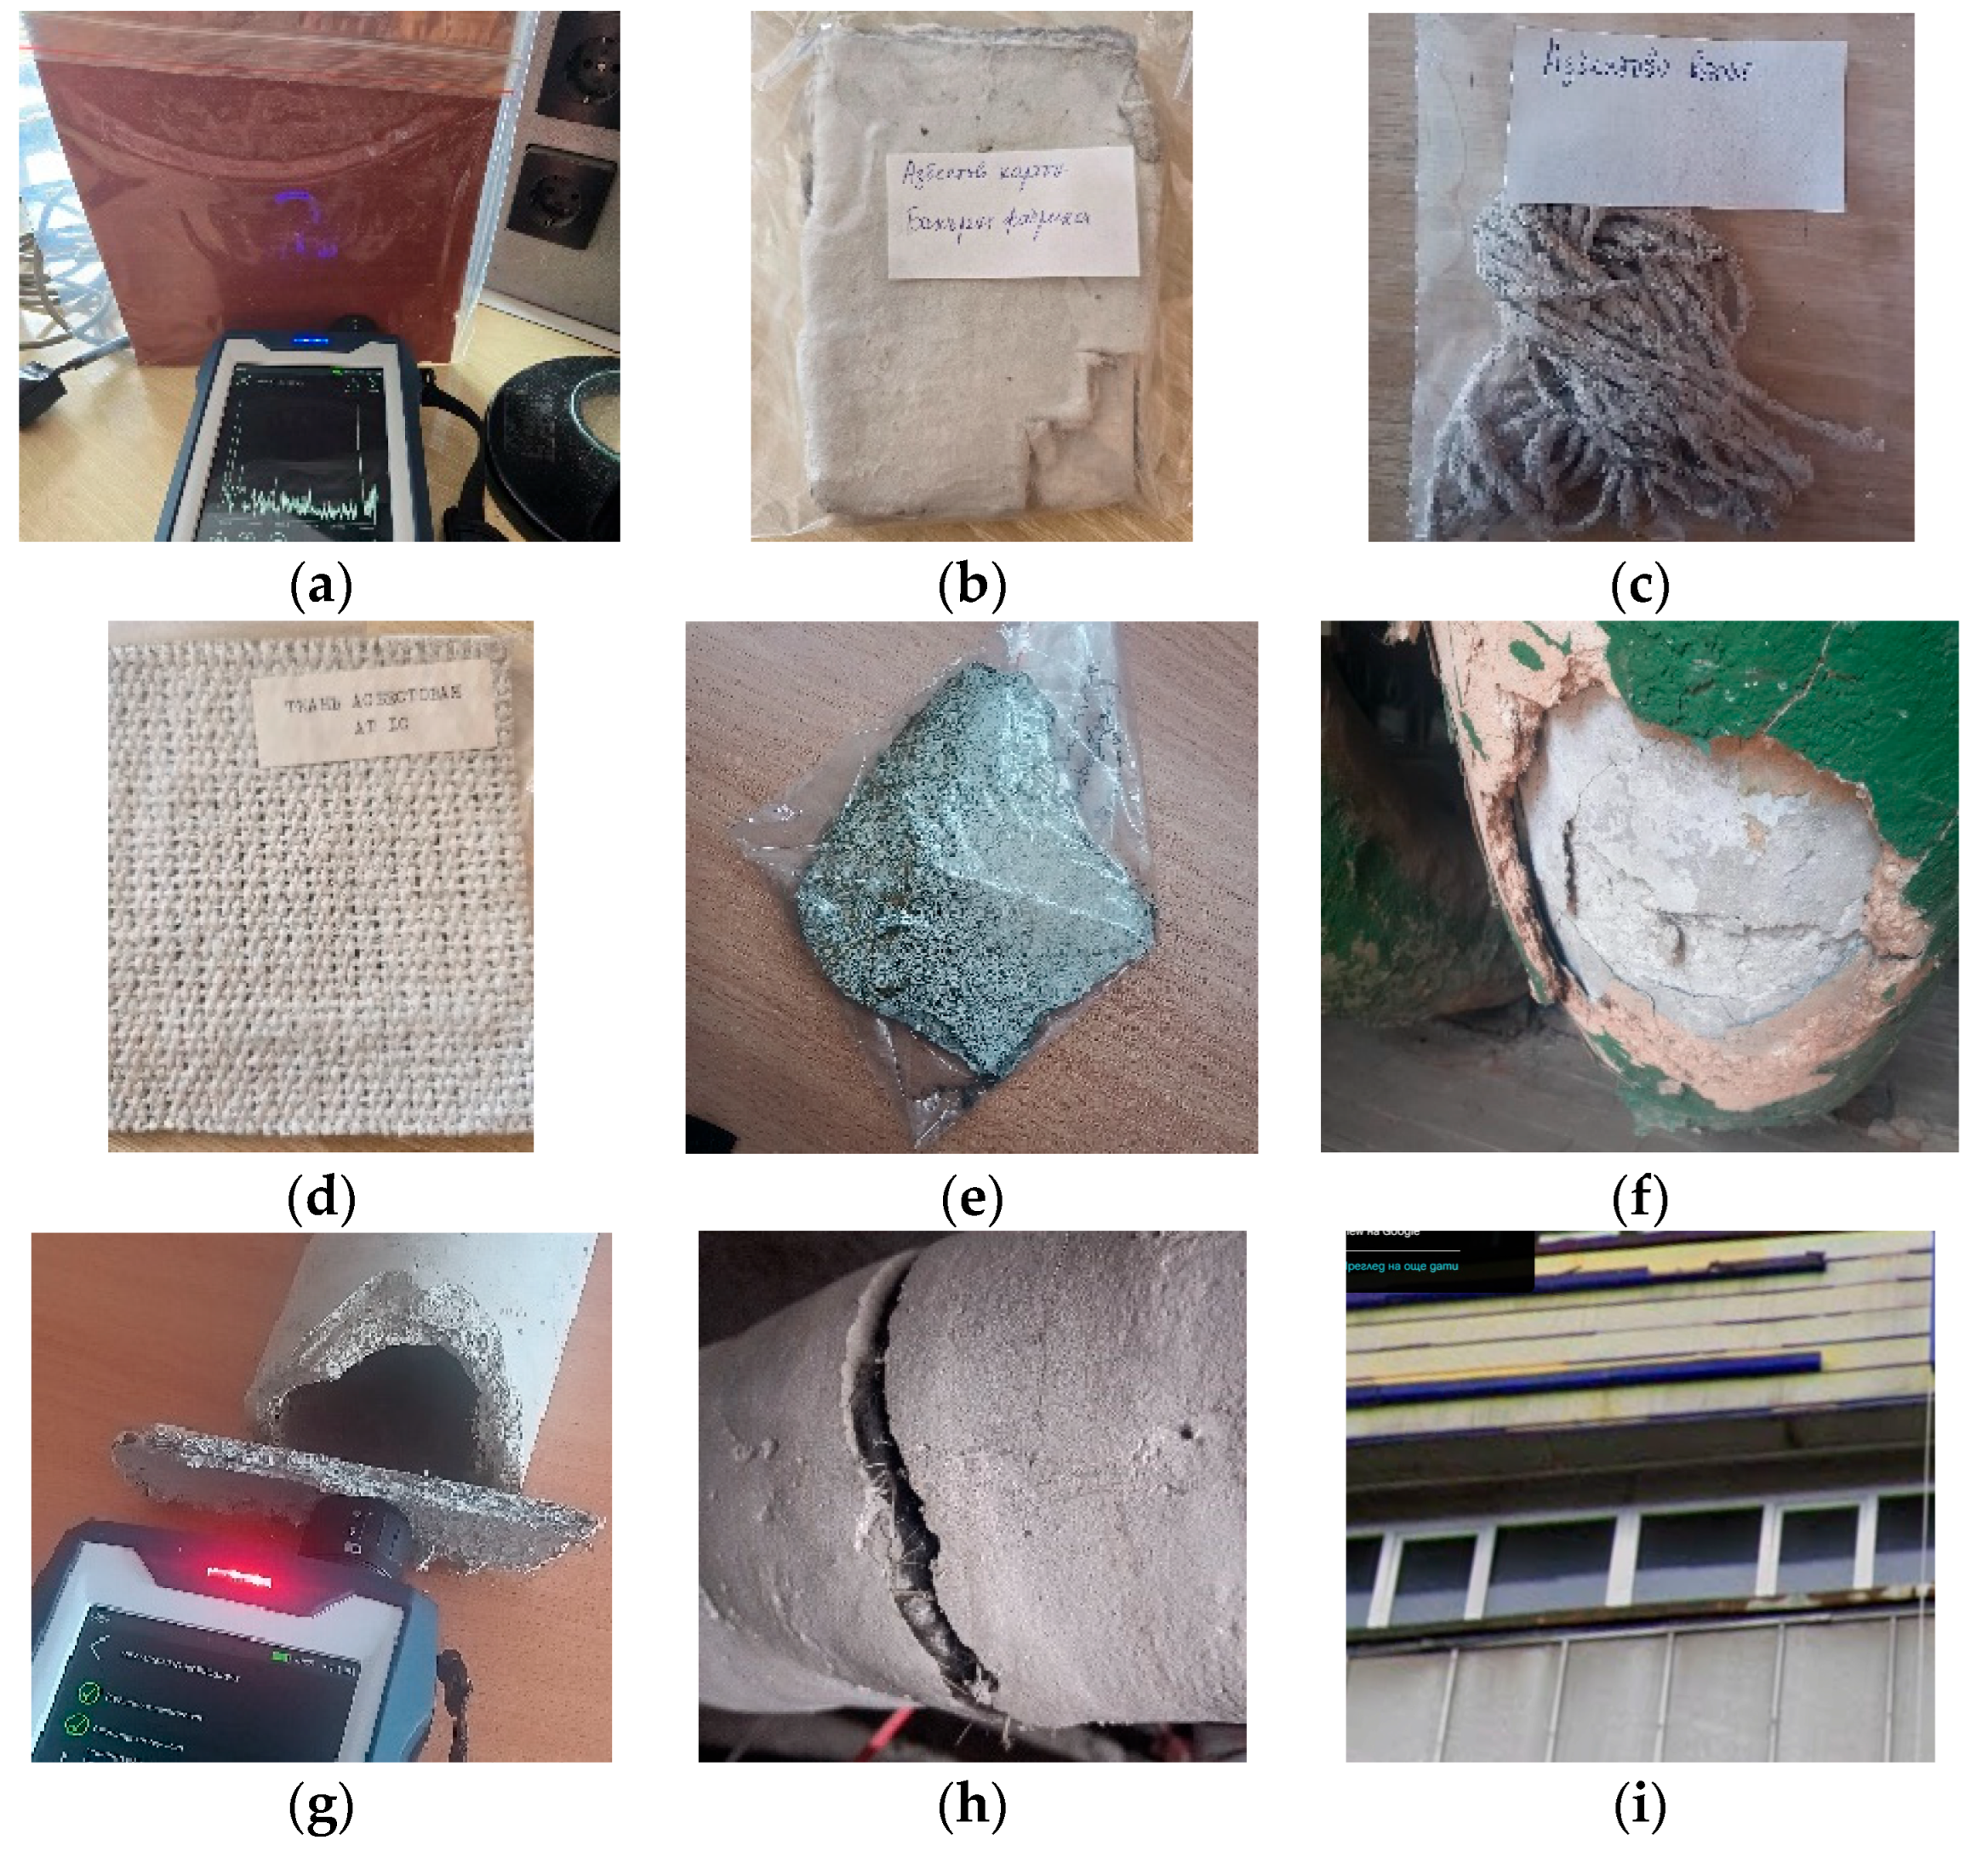
The hypothesis applied in this study is that ACMs, both in friable and non-friable forms, can be reliably identified in situ using a handheld Raman spectrometer. To test this hypothesis, two groups of ACMs were examined (Figure 3 and Figure 4).
Figure 3.
Samples of ACMs used in the verification procedure: (a) vermiculite in bulk; (b) vermiculite with actinolite; (c) heat pipe insulation; (d) klingerite 1; (e) klingerite 2; (f) klingerite 3; (g) Eternit pipe 1; (h) bitumen insulation felt (pre-treated); (i) pipeline joint sealing; (j) cardboard insulation (painted surface); (k) laboratory furnace insulation.
Figure 4.
Samples of ACMs used for identification procedure: (a) klingerite 4; (b) non-woven textile; (c) rope; (d) woven textile; (e) corrugated cement-based roof sheet; (f) pipeline coating mortar 1; (g) Eternit pipe 2; (h) pipeline coating mortar 2; (i) cement-based plate for external cladding.
- The first group consists of ACMs with a known type of asbestos fibre, previously determined by standardised methods based on reference samples [15,16]. The aim is to verify whether the handheld Raman spectrometer can confirm or reject the presence of asbestos fibres, and to what extent the fibre types determined by the two methods are identical, i.e., HHRS serves for verification.
- The second group consists of presumed ACMs, with an assumed type and quantity of asbestos fibres (e.g., based on literature data for analogous products). In this case, the aim is to identify the presence of asbestos fibres and determine their type, i.e., the HHRS is used for identification. To verify the reliability of the results, testing was also performed according to the standard methodology in one of the accredited laboratories in Bulgaria, following ISO 22262-1:2012 [15] and applying PLM, with relevant sampling carried out for that purpose.
The first group of materials (Figure 3) was provided by the NCPHA. Some of the test samples had been subjected to preliminary treatment (dissolution or combustion of the matrix).
The second group of materials (Figure 4) was examined on site, or test samples were taken from them. Each sample covered an area of at least 5 × 5 cm2 across the full thickness of the material. The samples were obtained from crushed fragments or by cutting with a sharp knife or scalpel from edges, corners, or other suitable parts of the products. Appropriate measures were applied to eliminate any health risks.
A more detailed description of the investigated ACMs of both groups is presented in Tables 2 and 3 in Section 3.
2.3. Description of the Raman Spectrometer and the Software Used
A BRAVO handheld Raman spectrometer (Bruker Optics GmbH & Co. KG, Ettlingen, Germany) was used. It is equipped with two temperature-controlled diode lasers (DuoLaser™, 785 and 852 nm, Bruker Optics GmbH & Co. KG, Ettlingen, Germany), comprising Bragg-grating optical feedback. Both laser beams impinge on the sample sequentially in every measurement, and they are detected using different areas of the charge-coupled device, providing a 10–12 cm−1 spectral resolution. Data can be acquired from 300 to 2200 cm−1 and from 1200 to 3200 cm−1, exploiting, respectively, the 852 nm and the 785 nm lasers. The spot size is about 100 ÷ 500 μm2 (0.1 ÷ 0.5 mm2) [50,51]. In [52], where different types of portable Raman spectrometers were compared, the capabilities of Bruker’s BRAVO handheld Raman spectrometer were also examined. It was established that they allow the recording of excellent-quality Raman spectra, with band positions and intensities comparable with laboratory dispersive microspectrometers. According to [25], a device with such a laser spot size is considered large, and due to the absence of a fixed position during measurement, the actual spatial resolution is in the order of a cubic millimetre. This enables the analysis of composite materials but constrains the examination of very small objects.
The analysis of the Raman spectra was conducted using OPUS Spectroscopy Software, (Version 8.7.31., 2021, Bruker Optics GmbH & Co. KG, Ettlingen, Germany), in combination with three independent reference libraries with more than 75 spectra of asbestos minerals. The software provides a comprehensive set of processing tools (e.g., spectral shortening and smoothing), automated mineral identification through comparison with reference spectral libraries, semi-quantitative analysis, and visualisation of spectral data.
2.4. Methodology of This Study
When developing the methodology, several factors were taken into account, including the expected (or presumed) concentration of asbestos fibres and their distribution within the overall sample volume.
Two main types of samples were distinguished in the study—those with high and those with low asbestos fibre contents, using a conventional threshold of 5%, which is comparable to that reported in [15,16]. For materials with an assumed high asbestos fibre content (e.g., cardboard, insulation, klingerite, non-woven textile, rope, woven textile), the probability that a single “measurement” would capture a fibre is high due to the elevated concentration and even distribution of fibres. Therefore, for this type of ACM, a scanning methodology was applied, performing at least three measurements evenly distributed across the surface of a 5 × 5 cm sample. Conversely, for ACMs in which asbestos fibres constitute only one component within a matrix of another material (e.g., cementitious coatings and mortars), the likelihood that the instrument’s laser beam will capture a fibre is significantly lower. This requires an increased number of measurements to ensure the statistical reliability of the results. For this type of material, at least six measurements were performed, evenly distributed across the surface of a 5 × 5 cm sample [15,16,35,53].
The recorded spectra were analysed in the range from 300 cm−1 to 1500 cm−1, since the “fingerprint” of asbestos is located there and represents the most important part of the spectrum for identification purposes [31]. In this way, only the characteristic vibrational peaks of asbestos minerals, Si-O (silicon-oxygen) and M-O (metal-oxygen) bonds, were covered. Given the operational range of the HHRS (300–3200 cm−1), the signals above 3200 cm−1, characteristic of OH groups [36], remain beyond the instrument’s detection range; therefore, the analysis focuses primarily on the lower-frequency interval. A similar approach was applied in [54].
The analysis of the spectra was conducted using three independent reference libraries. The first library was manually compiled by recording spectral data from samples (a total of 29) of asbestos minerals with a known composition, provided by the Museum of Mineralogy, Petrology and Mineral Resources at Sofia University (SU) [55]. The second reference library was created by recording pure forms of the main types of asbestos minerals (a total of seven), in accordance with the Institute of Occupational Medicine (IOM) Asbestos Reference Standards [56], provided by the NCPHA [57] and used for the identification of asbestos fibres by PLM. To improve comparability, smoothing was applied to the first two libraries using nine points (number of smoothing points = 9). This software option reduces the noise, providing a clearer visualisation of the characteristic vibrational peaks, while, at the same time, not compromising the spectral resolution and not suppressing real “narrow” signals [58,59,60]. The third library is the online RRUFF database, containing Raman spectra of a total of 41 asbestos minerals [61]. The matching of the potentially asbestos-containing samples to the reference databases was performed using the standard search algorithm of the OPUS software, with the setting “spectrum to be searched contains multiple components”. Each of the measurements was examined separately. The spectra of the potentially asbestos-containing samples were not manipulated (e.g., added, subtracted or otherwise processed).
Due to the fluctuation in the positions of the vibrational peaks related to the spectral accuracy of measurement (±3 cm−1) [32], an additional manual analysis of the results was carried out by comparing the peak values of the measured spectra with those from the literature data [20,36]. The application of this approach allows for more precise identification of the asbestos minerals.
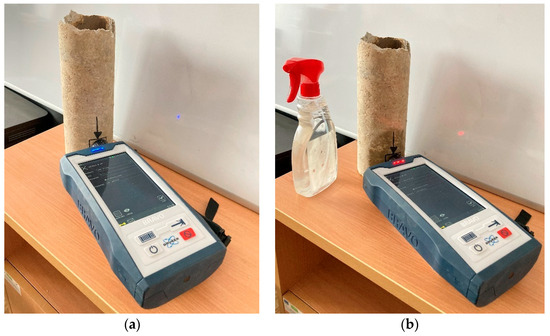
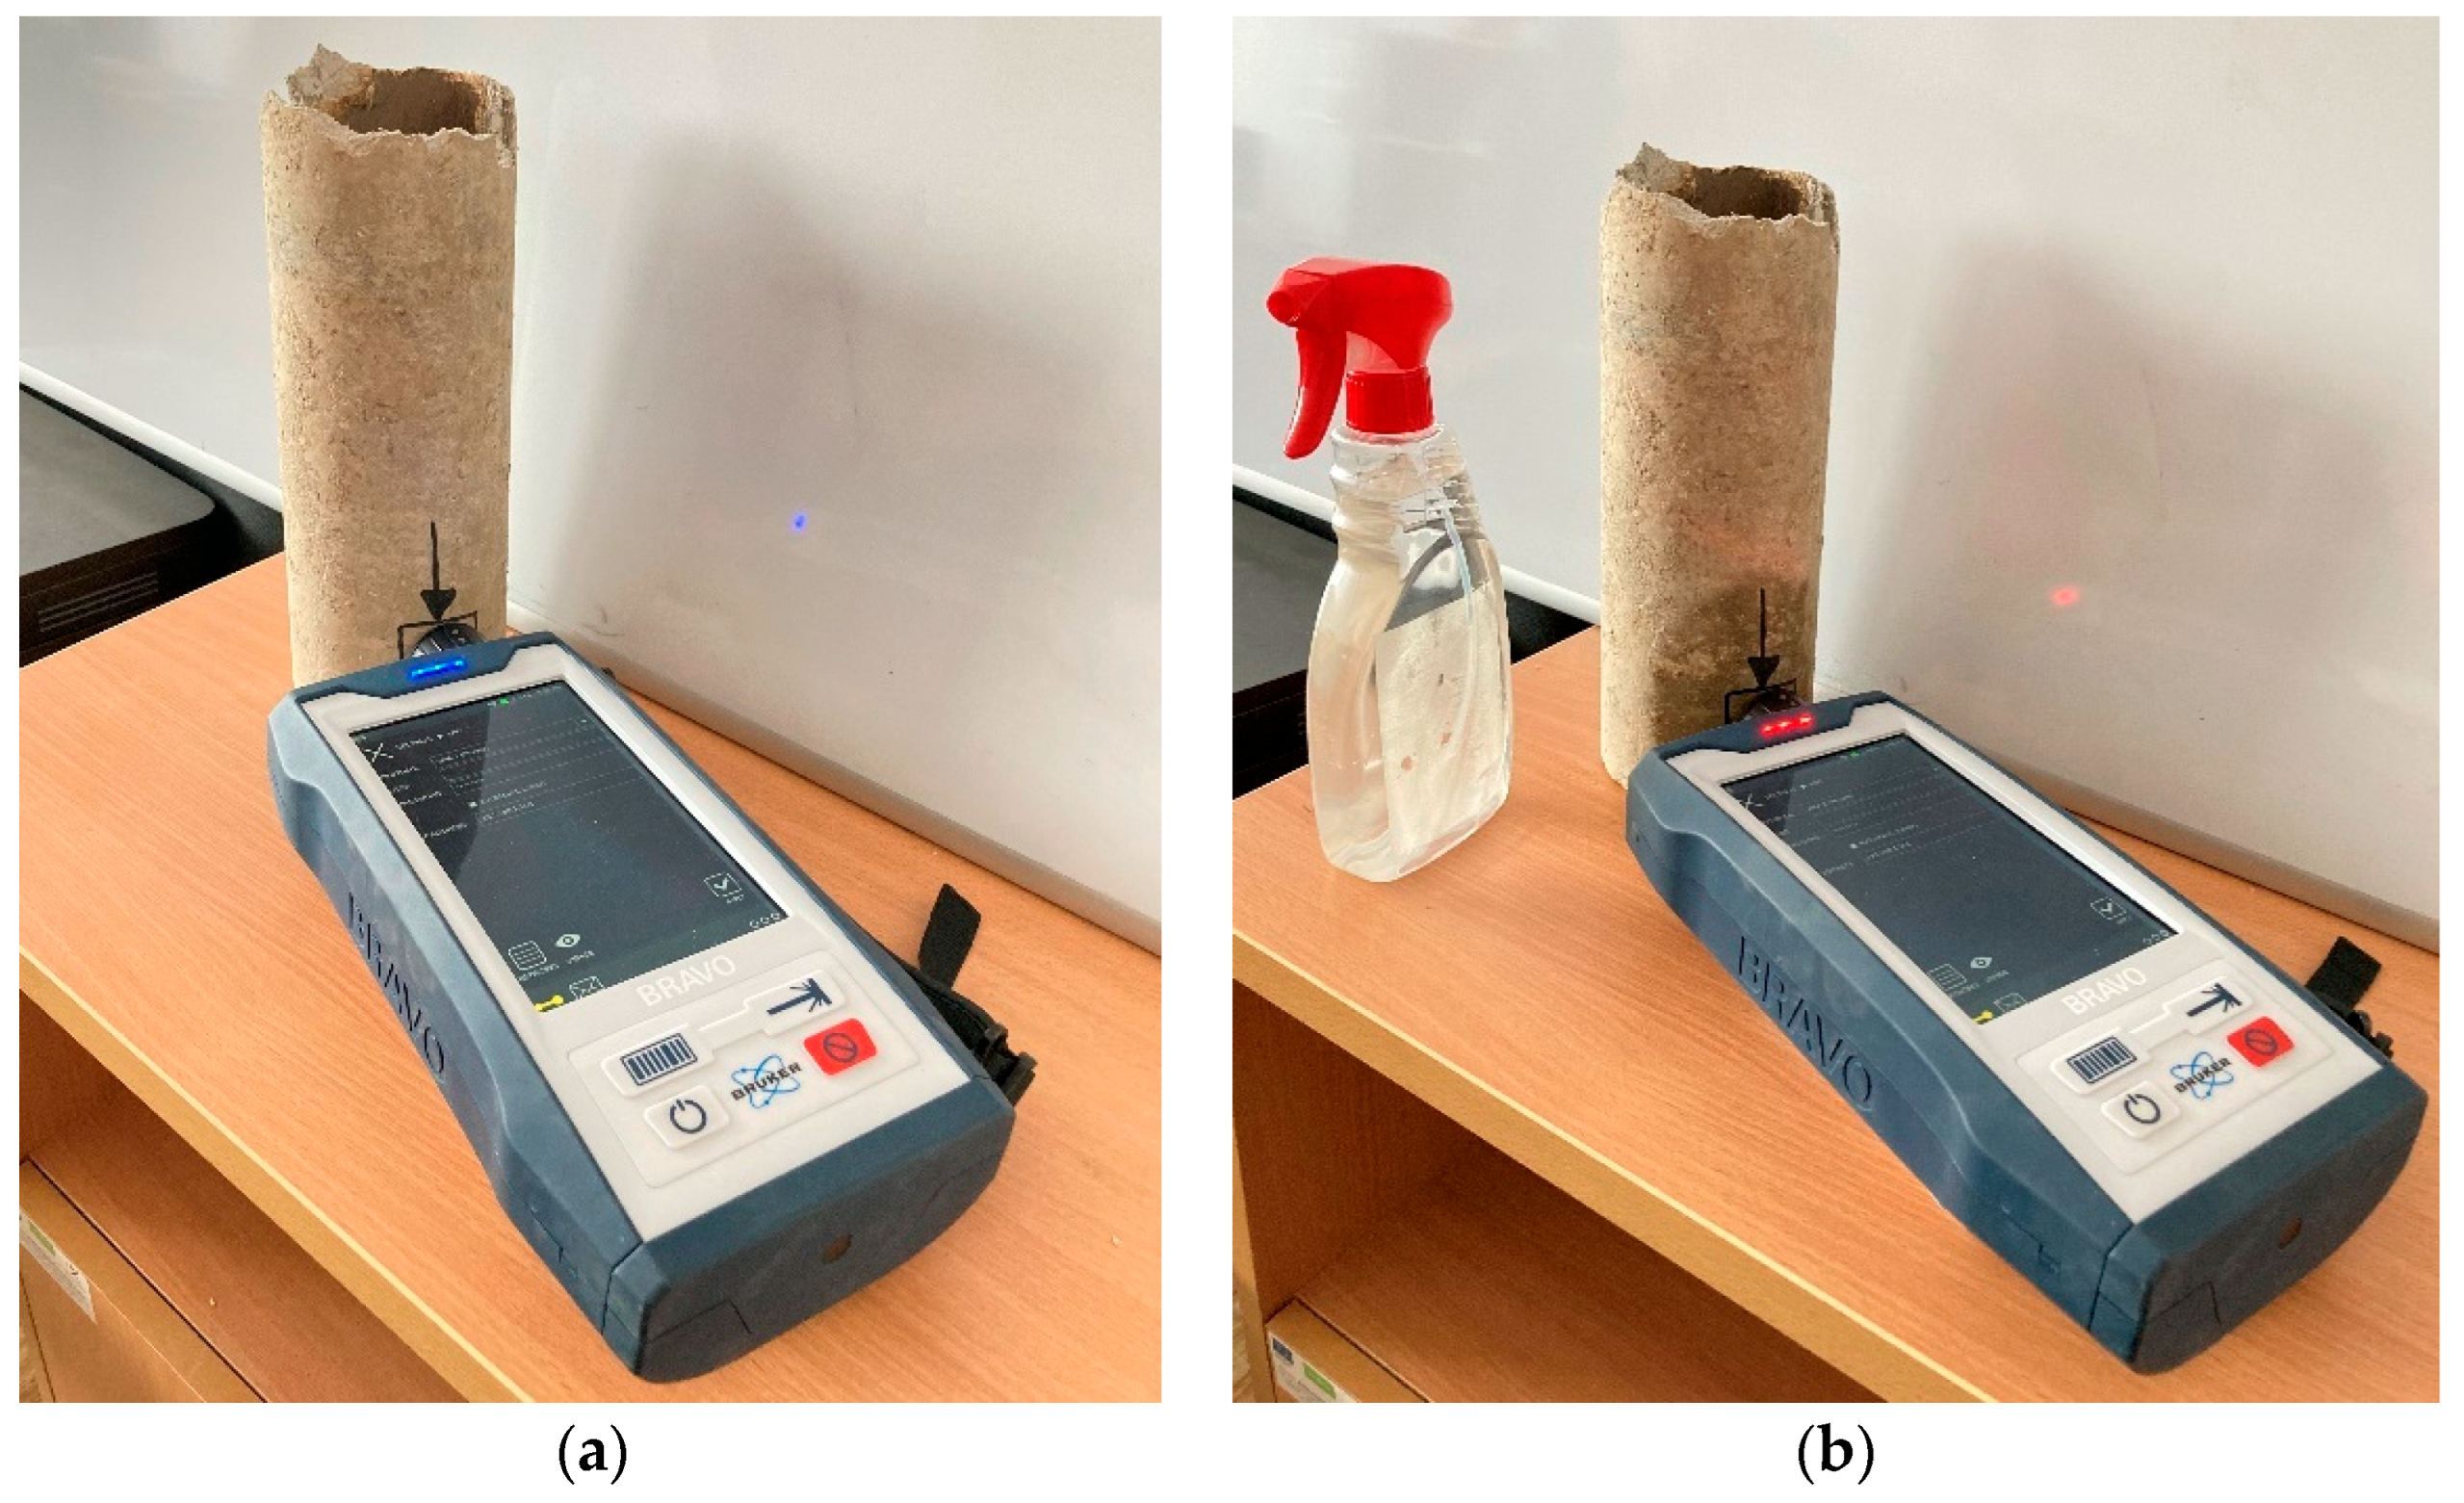
One of the dust reduction methods applied when removing coatings from ACM, as well as during the dismantling of ACM and the sampling, is thorough in moisturising the surface [47,48] to prevent the release of asbestos dust. For this reason, in order to determine whether the additional moisture would interfere with the identification of asbestos, two tests were performed on one sample (Eternit pipe, sample No. 18)—one on a dry surface and another on a moist surface (Figure 5).
Figure 5.
Study of the effect of moisture on ACM (Eternit pipe 2) identification using HHRS: (a) dry sample, (b) moistened sample.
3. Results and Discussion
3.1. Verification Tests for Asbestos in ACM
The summarised results from the analysed spectra of ACM samples with known asbestos fibre types, intended for verification of the HHRS analyses, are presented in Table 2. The HHRS confirmed the presence of asbestos in all samples examined. It should be noted that the obtained values have a probabilistic nature and should not be interpreted as quantitative indicators of the asbestos content. The identity percentage is influenced by the similarity in the mineral compositions of the different asbestos forms.
Table 2.
Results from the verification tests.
The known forms of asbestos identified in these ACMs using the standard method with PLM [15] have been largely confirmed. For two of the examined ACMs, however, more significant differences were observed:
- For sample No. 1 (vermiculite in bulk), the standard tests according to [15] identified tremolite, whereas the Raman analysis, depending on the spectral library used, identified three other forms (anthophyllite, chrysotile and actinolite—Table 2), but not tremolite. The reason may lie in the mixed deposits of anthophyllite and tremolite found in Bulgaria [42]. When using the RRUFF spectral database, the presence of grunerite was detected, which could indicate another asbestos form—amosite. The discrepancy in the identification of the various asbestos minerals is likely also due to the dark green colour of sample No. 1, which leads to a fluorescence emission background that completely masks the Raman signatures [32].
- For sample No. 15 (pipeline joint sealing), the anthophyllite form of asbestos was confirmed using the SU database, but in addition, crocidolite was also identified. Crocidolite was, in fact, the most distinct asbestos form according to the IOM database. The IOM database also indicated the presence of amosite and chrysotile, though with a relatively low identity percentage.
3.2. Need for Processing of the Reference Spectra
The data in Table 2 results from an additional processing of the reference Raman spectra, needed to eliminate the influence of fluorescence and the “noise” in the spectrograms caused by the other components of the ACM.
Since, for most minerals, including asbestos minerals, the “fingerprint” lies in the low-frequency range (300–1500 cm−1), the reference spectra from the databases shall be shortened so that the identification focuses on the low-frequency range (300–1500 cm−1). For example, for sample No. 8 (Eternit pipe), when performing an automatic search within a wide range (300–3200 cm−1), the degree of match (identification) was reported as 0%, i.e., no asbestos was detected. When the analysis was limited to the 300–1500 cm−1 range, a 68.5% match was established with one of the SU tremolite samples, a 67.1% match with one of the SU chrysotile samples, and a 58.8% match with one of the IOM chrysotile samples.
To reduce fluorescence and/or background artifacts arising during measurement, the “Smooth” function of the software was applied to the reference spectra during analysis, which eliminates minor Raman shifts caused by fluorescence (reducing the noise). However, excessive “smoothing” of the spectrum may lead to the elimination of characteristic Raman frequencies of the analysed material. Therefore, such spectral processing should be performed by an experienced researcher.
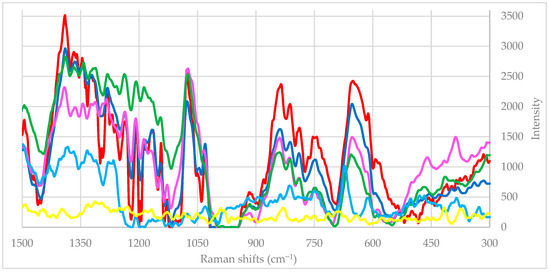
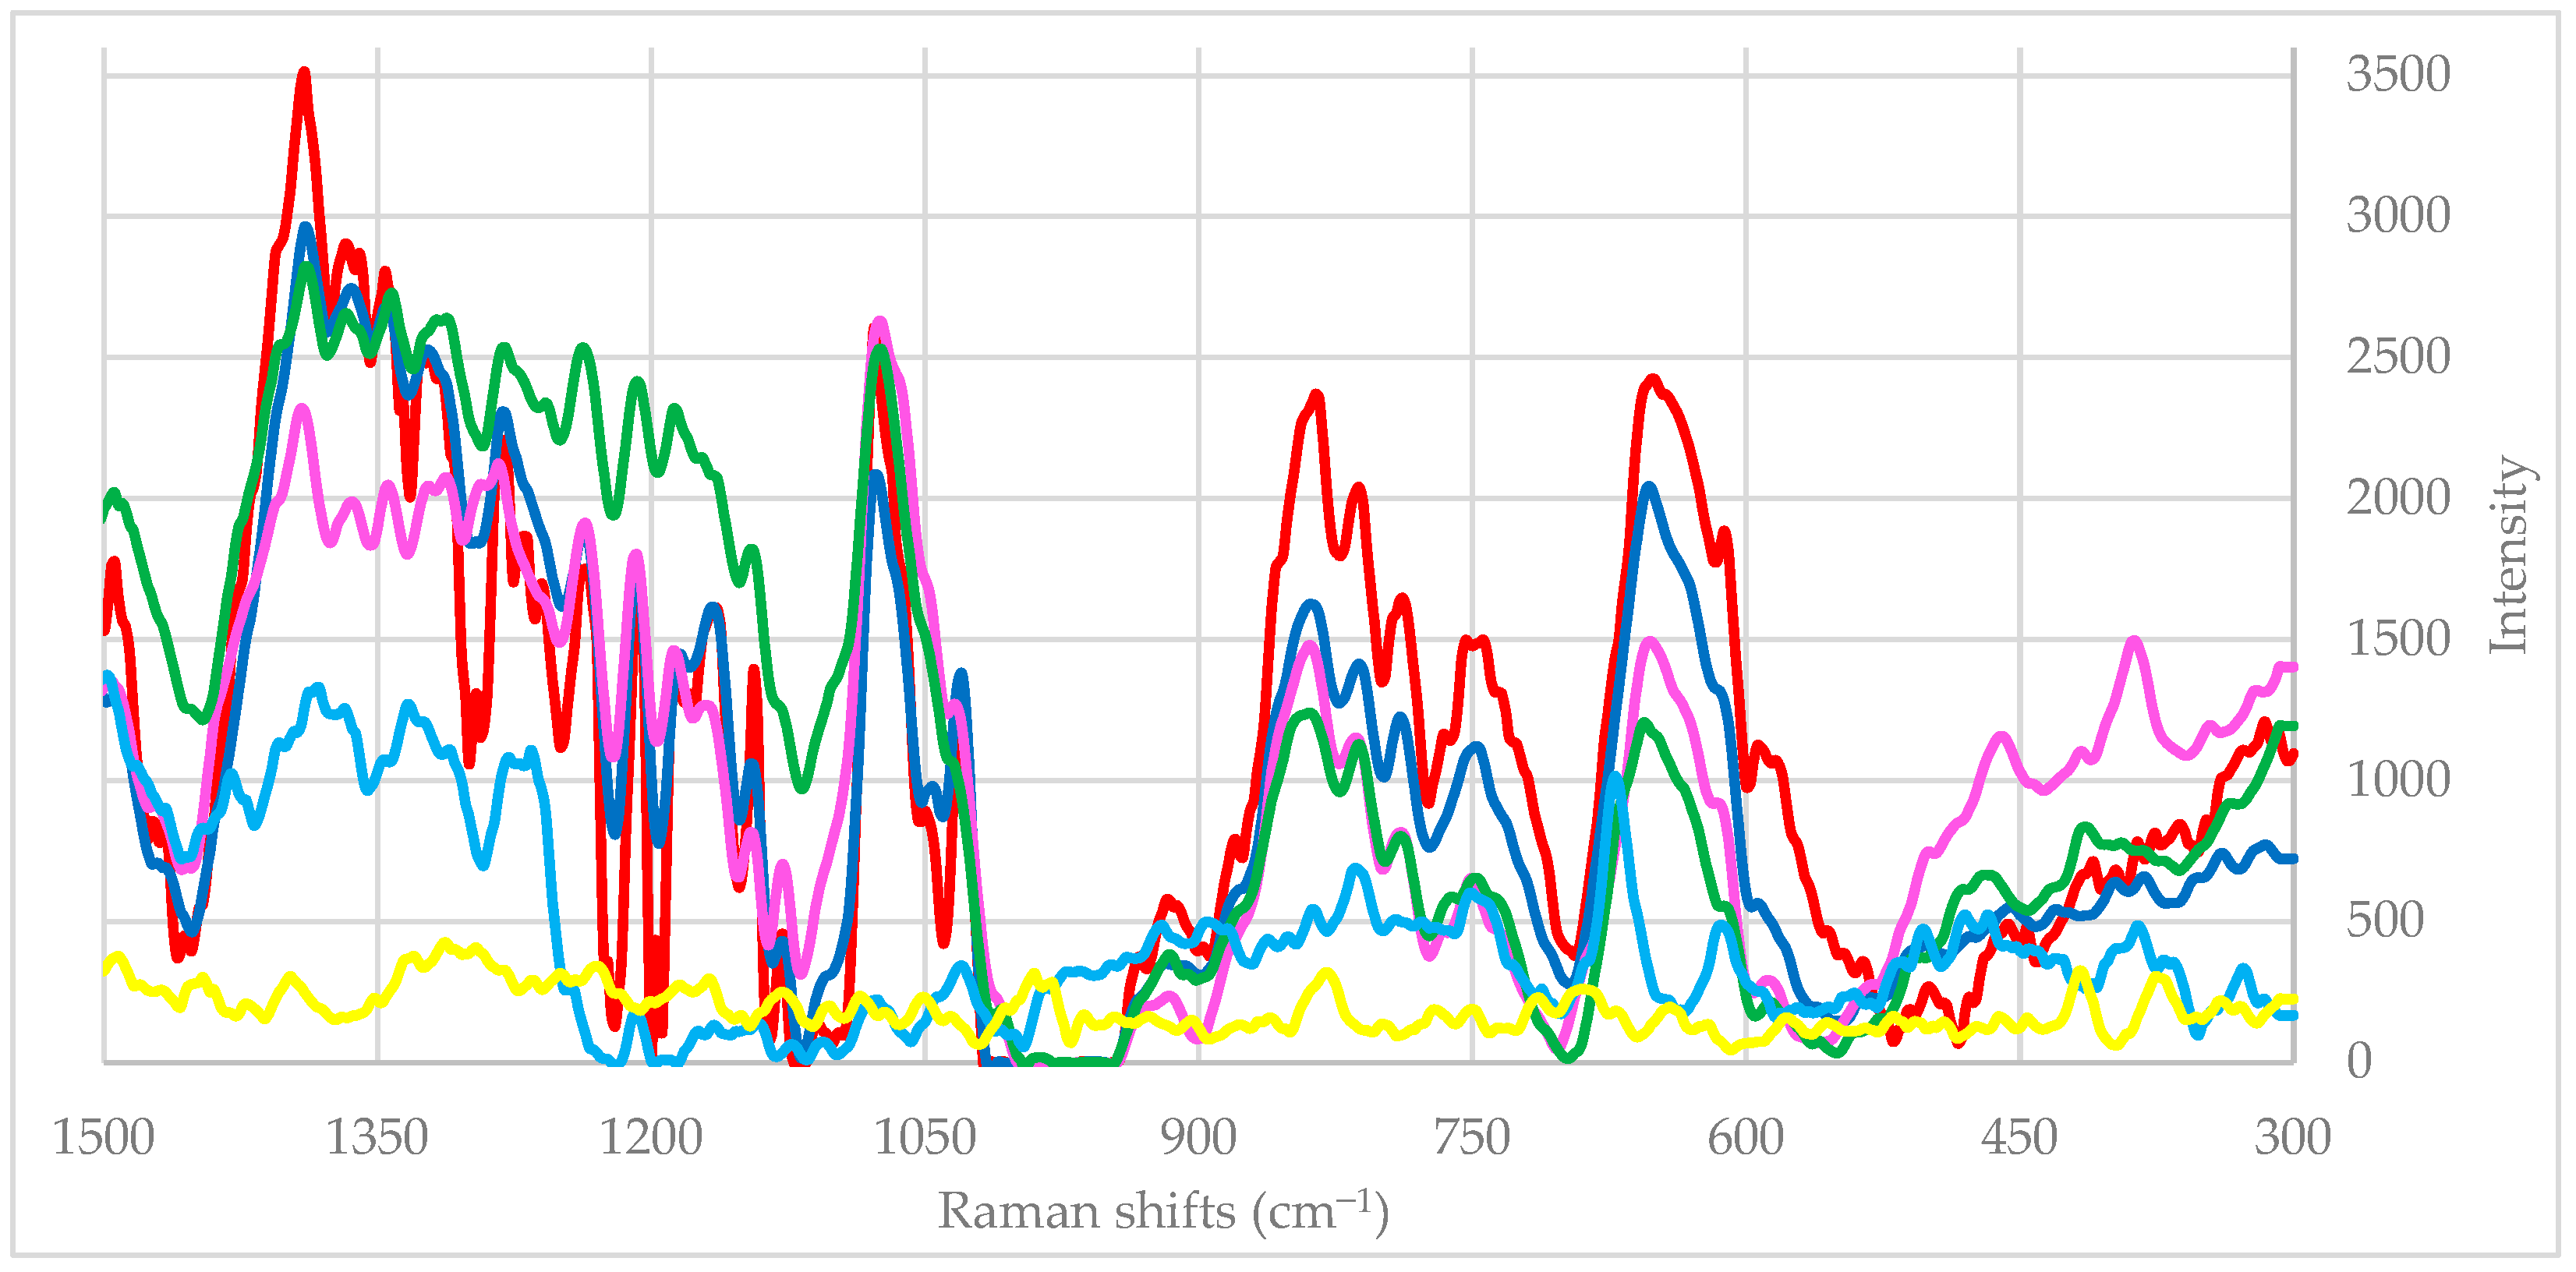
When the two spectral processing interventions are combined—focusing on the low-frequency range (300–1500 cm−1) and applying the “Smooth” function to the Raman spectra of the reference libraries—the identity percentage for chrysotile asbestos increases to 84.4% for one of the SU database samples and to 74.4% for one of the IOM database samples. The identity percentage for the other asbestos minerals also increases (Figure 6).
Figure 6.
Effect of the combined processing of reference spectra (shortening and smoothing) on the identification of asbestos forms. Raman spectrum of sample No. 8 (in red); 84.4% match with one of the SU chrysotile samples (in blue); 74.5% match with one of the chrysotile samples from the IOM database (in pink); 70.4% match with one of the SU tremolite samples (in green); 34.9% match with another SU tremolite sample (in sky blue); 31.6% match with one of the SU anthophyllite samples (in yellow).
Consequently, the described approach—automatic analysis of the recorded but appropriately shortened spectrum, using processed (shortened and smoothed) reference spectra—is suitable for in situ detection of asbestos in construction materials. Further desktop processing of the spectra (e.g., noise filtering and baseline correction), including that of the analysed material, may improve the reliability of identifying the most probable asbestos form.
3.3. Influence of the Reference Database on the Identification of Asbestos Varieties
It has been established that the reference database containing spectral records of asbestos minerals/forms plays a crucial role in asbestos identification. Minerals from the asbestos group are not usually found in nature in a pure form and without impurities, as chemical substitutions and additional mineral inclusions are common phenomena. [28,62]. For this reason, using a database composed solely of pure asbestos minerals does not always yield the highest match (see Table 2). For example, in the case of sample No. 8 (Eternit pipe), the highest identity percentage for chrysotile asbestos was obtained when using the SU database [55], which includes spectra of minerals from various asbestos deposits. In contrast, when the IOM library containing pure asbestos forms was used [56], the identity percentage for chrysotile asbestos was lower (74.5%), though still sufficiently high. The SU database also detected the second asbestos mineral type (anthophyllite), which had been identified by the standard method [15] using PLM. However, when the SU database was applied, tremolite was also detected with a probability of around 70%, suggesting that the fibres likely originated from a deposit containing a mixed form of anthophyllite and tremolite. This is, in fact, logical bearing in mind that the production of Eternit pipes in Bulgaria involved the use of asbestos from Bulgarian deposits (anthophyllite and tremolite), from which the reference spectra in the SU library were obtained, together with imported chrysotile asbestos. It is surprising that the third library–the RRUFF database—did not identify the presence of asbestos fibres in sample No. 8, despite containing spectra of 41 asbestos minerals from around the world. The reason for this is likely complex: on the one hand, the reference spectra also reflect the impurities within the asbestos minerals, which can significantly influence the results; on the other hand, sample No. 8 is a cement-based composite, and the other materials in the sample (cement, sand, additives) also mask the asbestos presence. Using the RRUFF library, the presence of asbestos was established only in its unbound forms in the ACM (samples No. 1, No. 2, and No. 17), with a more reliable identification of the asbestos mineral type (over 30% match) observed only for chrysotile asbestos (sample No. 17).
3.4. Manual Identification of Asbestos in ACM
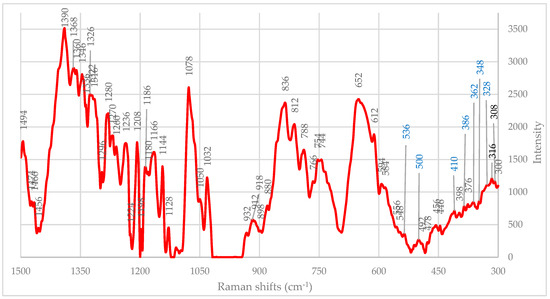
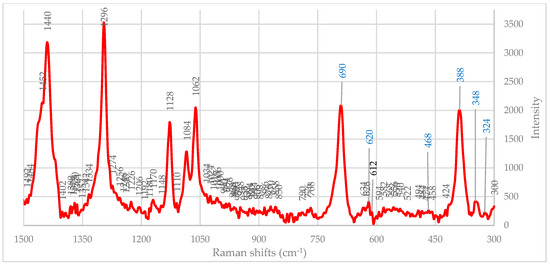
During the in situ identification of ACM using HHRS, manual (non-automatic) detection of ACM is also possible. This is illustrated by the analysis of the spectra of samples No. 8 (Figure 7) and No. 9 (Figure 8), in which characteristic Raman shifts were identified according to literature data [20,36]. The analysis took into account the wavenumber position accuracy of ±3 cm−1 as per [32].
Figure 7.
Raman band (cm−1) of sample No. 8 (Eternit pipe 1). The matches with asbestos Raman shifts of chrysotile and anthophyllite are marked with the figures in blue.
Figure 8.
Raman shift band (cm−1) of sample No. 9 (non-woven asbestos textile). The matches with chrysotile asbestos are marked with the figures in blue.
In sample No. 8, peaks of chrysotile and anthophyllite were detected (Figure 7), similar to the results obtained through an automatic software search and analytical examination using the standard methodology [15]. However, the composite nature of the sample masks the remaining characteristic peaks of chrysotile and anthophyllite.
In sample No. 9, all six peaks of asbestos minerals belong to the chrysotile (Figure 8). The high level of detectability is due to the composition of this ACM—this non-woven textile is made mainly of chrysotile asbestos with a few other substances.
3.5. Influence of Moisture on Asbestos Identification
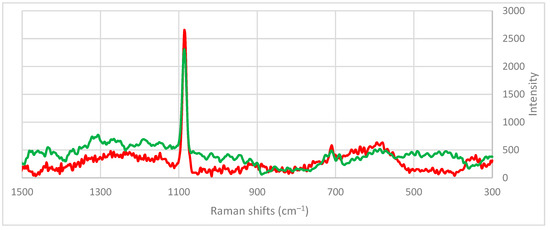
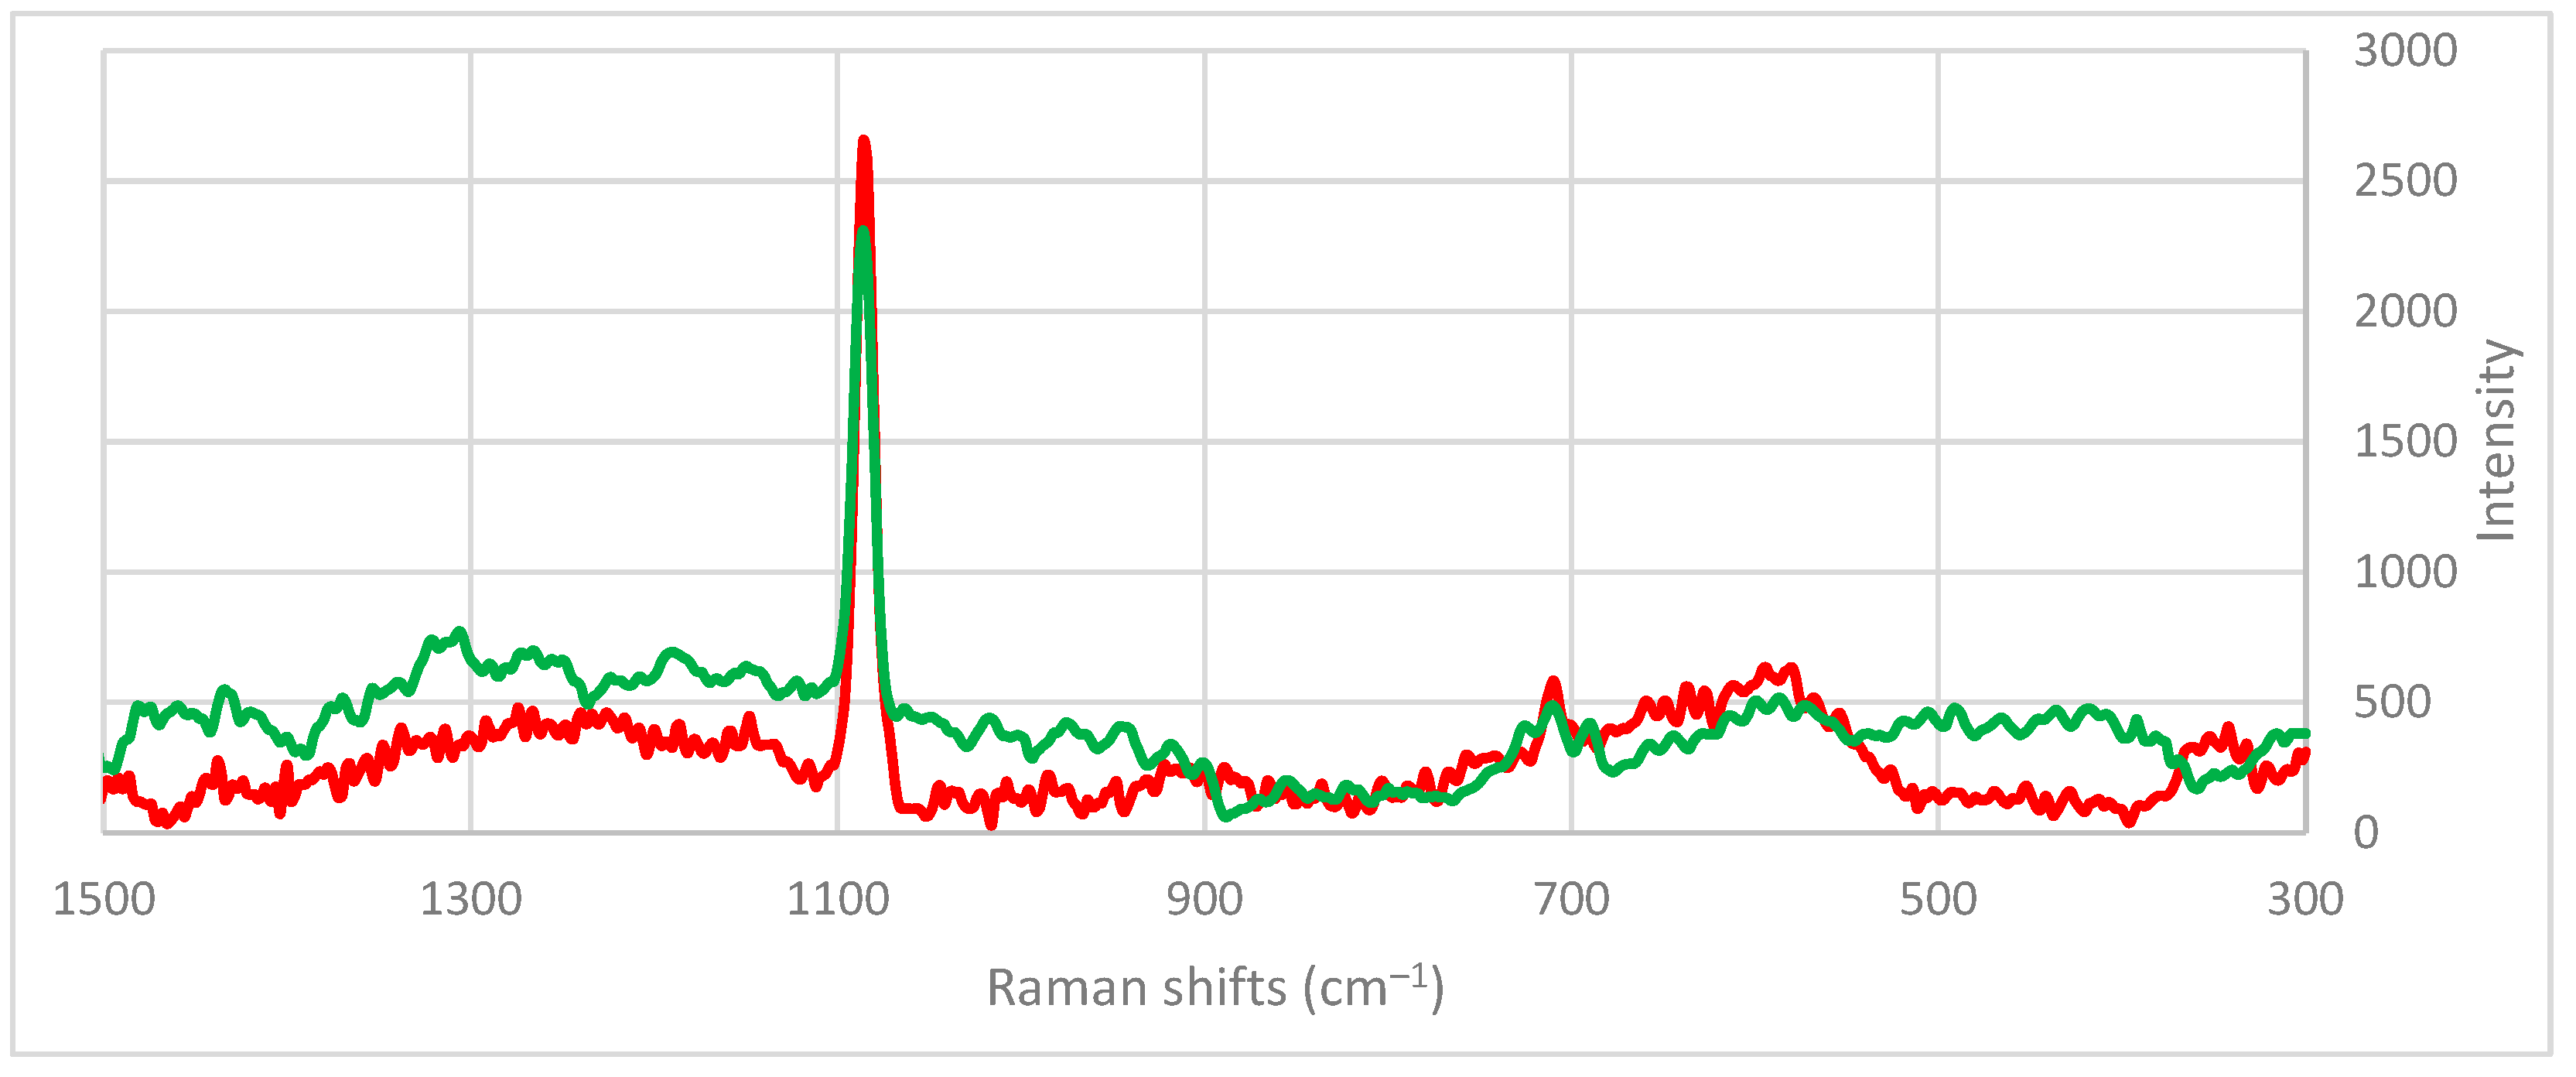
When comparing the two graphs, corresponding to the spectrum of air-dry sample No. 18 and to the spectrum of moist sample No. 18, no change was recorded in the type of Raman band across the entire measured range (300 cm−1 to 3200 cm−1), and no additional peaks attributable to moistening were observed. The reason is that water (moisture in the ACM) is characterised by Raman shifts at 3260 cm−1 and 3355 cm−1 [63], which lie outside the range of the Raman spectrometer used and are also beyond the “fingerprint” region of asbestos minerals. Water would affect the sample only if it chemically interacted with the primary mineral and became incorporated into its molecular structure.
After submitting both spectra to the asbestos identification procedures, matching of ca. 40% with one of the SU database chrysotile samples was established for both air-dry and moistened samples—Figure 9 and Figure 10 respectively.
Figure 9.
Asbestos identification in the air-dry sample No. 18 (in red), a 43.3% match with one of the SU chrysotile samples (in green).
Figure 10.
Asbestos identification in the wet sample No. 18 (in red): 40.8% match with one of the SU chrysotile samples (in green).
Hence, moistening does not affect the identification of asbestos minerals and can be applied as a measure to prevent the dispersion of asbestos fibres during the removal of coatings from ACMs.
3.6. Tests for the Identification of ACMs
The results of the measurements carried out on samples with a potential asbestos content are presented in Table 3.
Table 3.
Results of the identification tests.
Asbestos was found in all materials analysed, regardless of the morphology and degree of asbestos bonding. Chrysotile was the predominant asbestos type identified with HHRS when comparisons were made using the reference spectra from the SU and IOM databases.
The chrysotile type of asbestos was confirmed by laboratory analyses using PLM, carried out in accordance with the standardised methodology described in [15], apart from the pipeline coating mortar 1 (sample No. 13), in which only anthophyllite was identified by PLM.
Two more types of asbestos (anthophyllite and tremolite) were detected by both HHRS and PLM methods in Eternit pipe 2 (sample No. 18) and the cement-based cladding plate (sample No. 20).
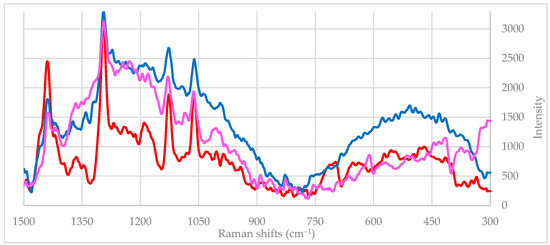
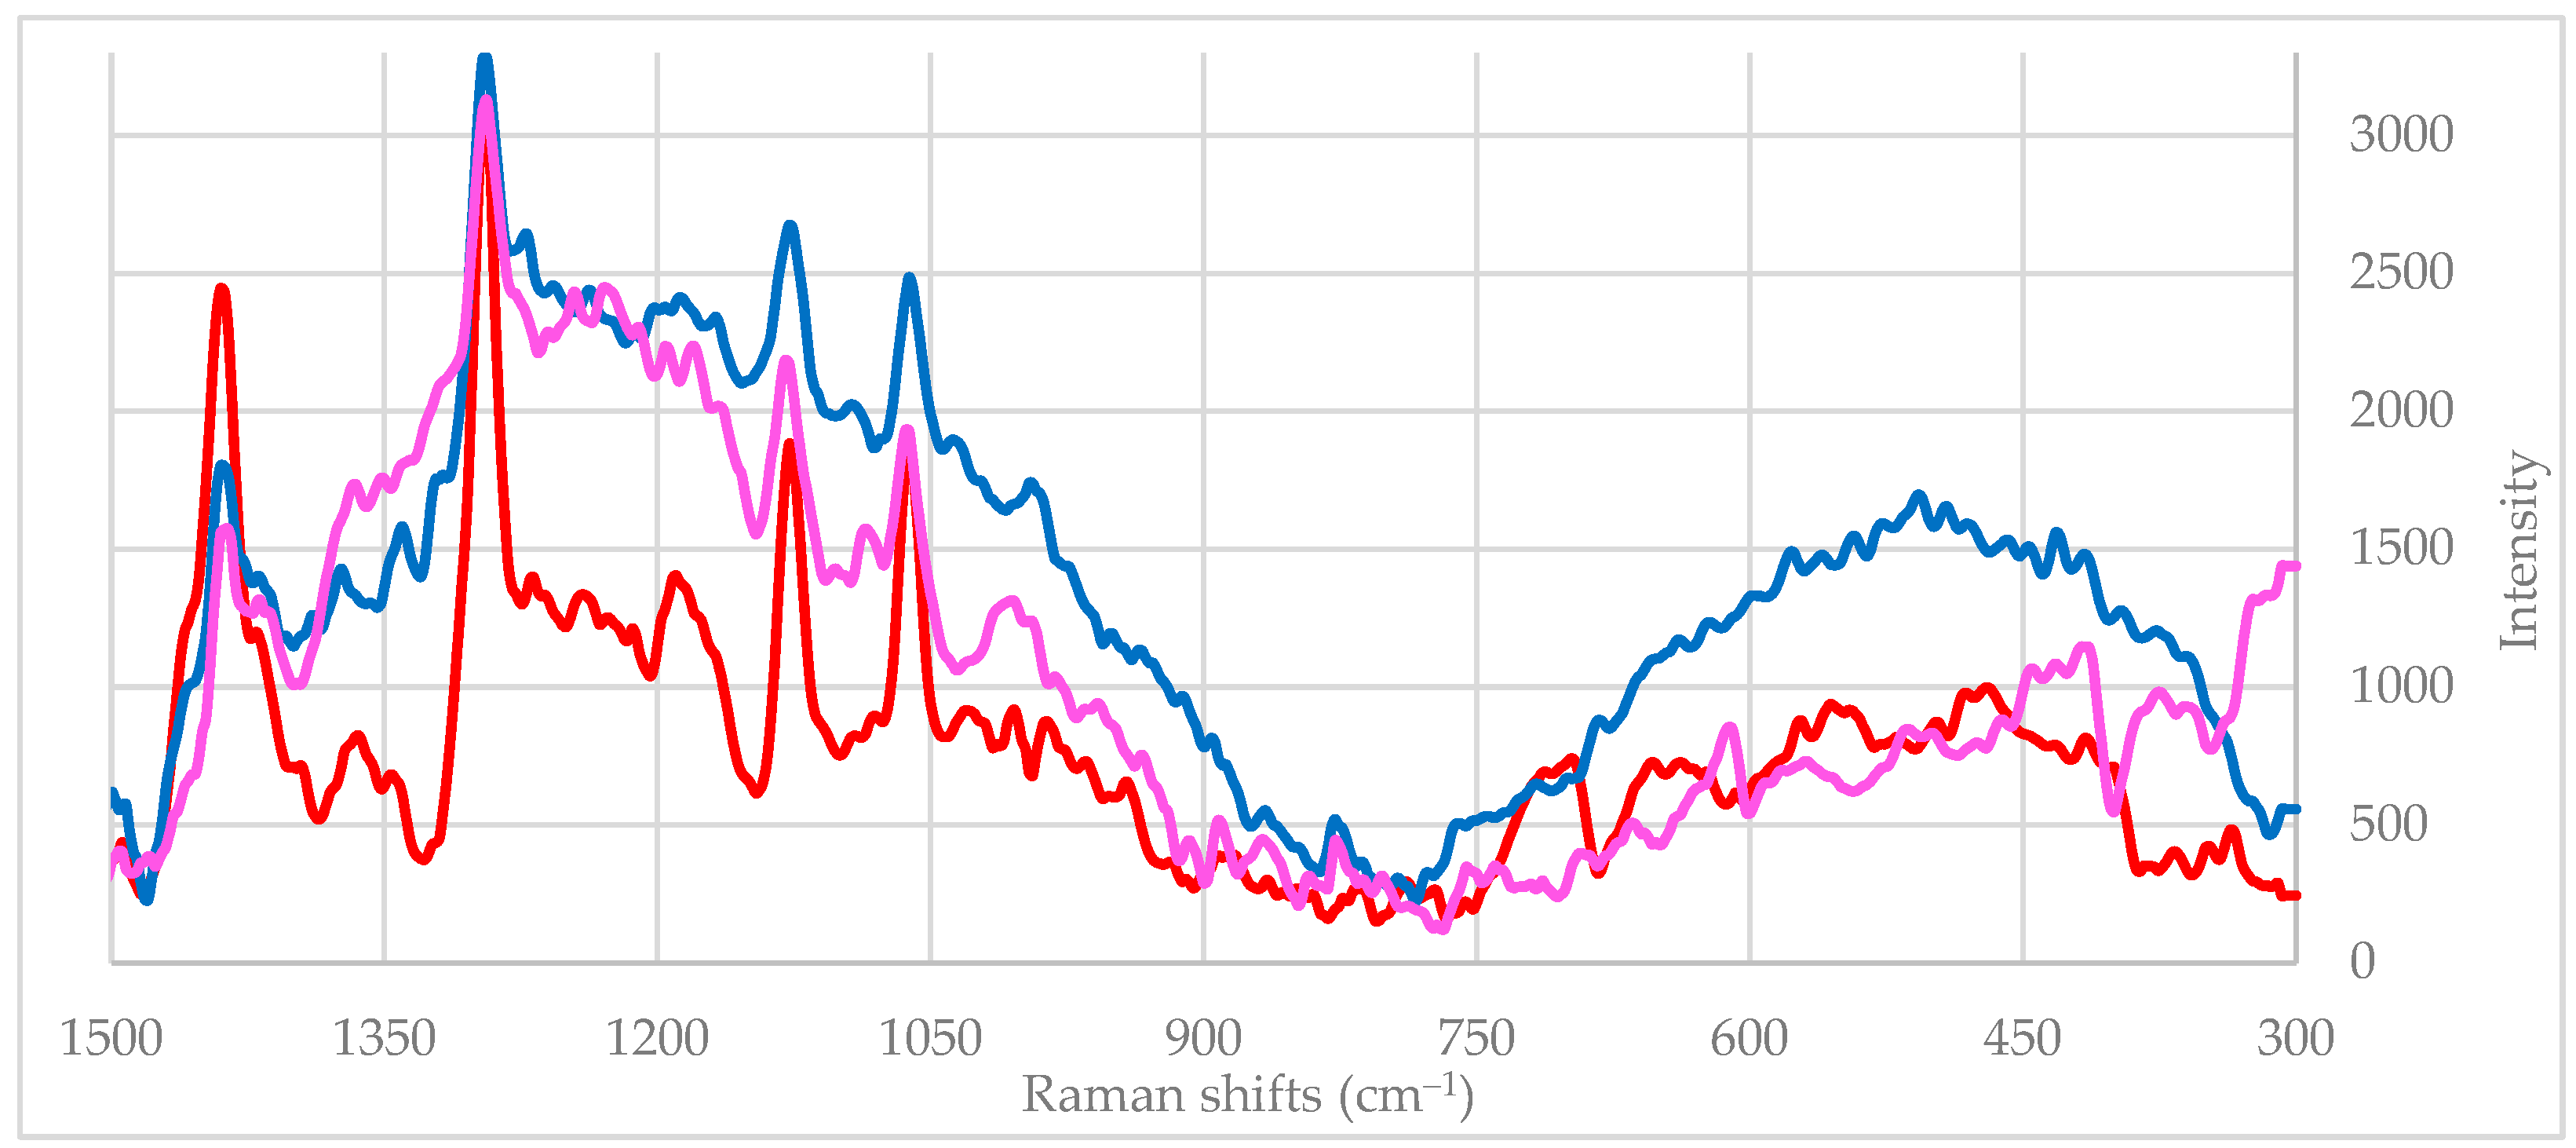
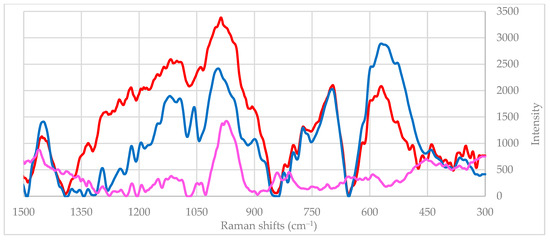
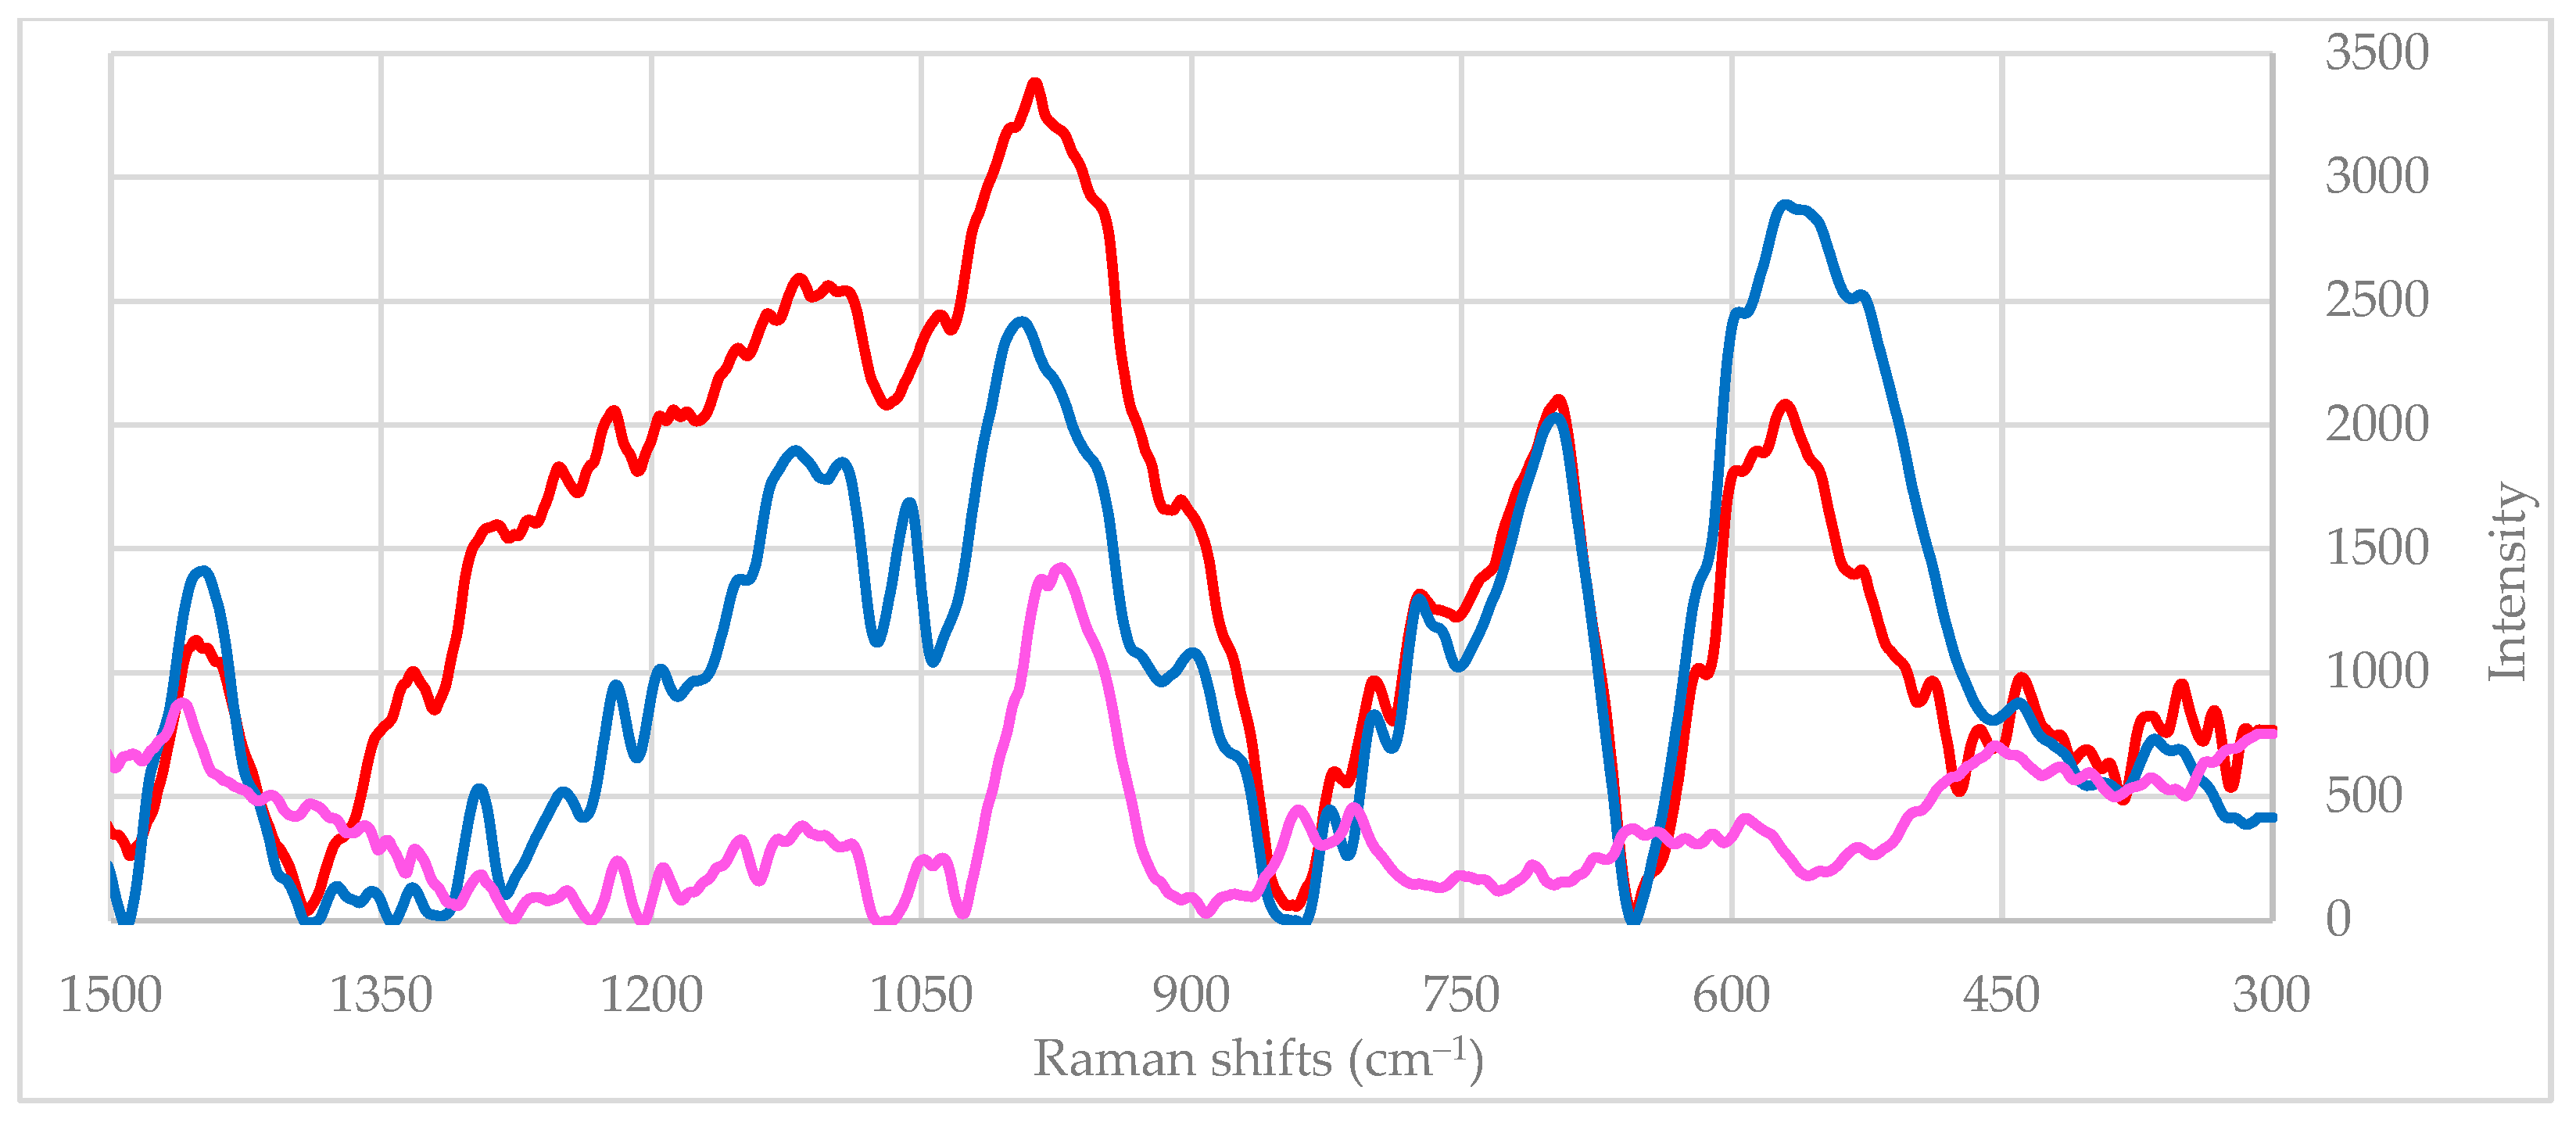
The spectra of ACM containing asbestos in the unbound form (e.g., woven and non-woven textile and rope) exhibit clearly defined peaks, as shown in Figure 8, whereas those of bound forms (klingerite and cement-based ACMs) display less distinct peaks in the asbestos fingerprint region (Figure 11 and Figure 12).
Figure 11.
Spectrum of ACM in a polymer matrix (klingerite) within the range of 300–1500 cm−1: sample No. 5 (in red); sample No. 4 (in blue); sample No. 6 (in pink).
Figure 12.
Raman spectra of asbestos-cement samples within the range of 300–1500 cm−1: sample No. 18 (in red); sample No. 3 (in blue); No. 15 (in pink).
For ACMs with asbestos in an unbound form (samples No. 9, No. 10, and No. 11), the identity percentages of their spectra with those of pure chrysotile from the IOM database exceeded 90% (Table 3). A lower identity percentage (ranging from 22 to 68%) was obtained when using the SU database, since, as mentioned earlier, its reference spectra represent natural minerals rather than pure asbestos forms.
The asbestos type identity percentage in some of composite materials such as klingerite (sample No. 5) and cement-based coating mortar 1 (sample No. 13) was determined as relatively low—between 20% and 30% (Table 3), depending on the database used. The lower identity percentage was due to the fact that, when recording the spectrum of a composite material, the resulting Raman spectra reflected all components with their characteristic Raman shifts, which automatically lead to a lower percentage of identity between the reference asbestos mineral and the investigated material.
However, for other cement-based ACMs, the identity percentage of the asbestos minerals was much higher, i.e., the signal was not as heavily masked by the cement–sand matrix—for the corrugated cement-based roof sheet (sample No. 12), the match for chrysotile exceeds 50% with minerals from both databases, while for the cementitious mortar used for a pipeline coating (sample No. 19), it reaches as high as 74% (Table 3).
4. Conclusions
The review of literature data and the conducted experimental programme confirmed the possibility of detecting ACM in situ rapidly and safely using a portable Raman spectrometer, without the need for prior sampling.
A removal of surface coatings from a potential ACM is required. The moisture does not affect the quality of the measurement.
The method is not applicable to bitumen-based materials, as well as to ACM with a black or dark green colour, because Raman spectra are difficult to obtain or there is a strong fluorescence emission background.
For ACMs with potentially lower asbestos fibre contents within a matrix, it is necessary to record and analyse a higher number of spectra from a larger surface area (e.g., 5 cm × 5 cm, at least six measurements). Individual analysis of each spectrum shall be performed.
The “fingerprint” of asbestos minerals is situated mainly in the range from 300 cm−1 to 1500 cm−1. The method allows the recognition and, to some extent, the differentiation of all main types of asbestos minerals, regardless of whether the fibres are in an unbound form (fabrics, ropes, wools) or bound within cementitious or polymer composites. However, the analysis of the Raman spectrum of an investigated material indicates the probability of the presence of certain types of asbestos (identity percentage), without providing a quantitative assessment of the asbestos fibre content in the ACM.
An identity percentage above 35% for a given asbestos mineral can be regarded as a highly reliable confirmation of the presence of that mineral in the sample, whereas values below this threshold suggest the need for additional identification through laboratory methods such as PLM, SEM, XRD, etc.
It is recommended that HHRS in situ be used together with a portable computer equipped with appropriate software for spectral comparison with the widest possible database of Raman spectra of asbestos minerals. Additionally, a manual analysis of the results may also be carried out by comparing the peak values of the measured spectra with those from the literature data.
There is a need to develop a reference database encompassing the ACMs commonly used in construction, which would enhance both the accuracy and efficiency of in situ identification using a HHRS. It could be recommended to create unified, publicly accessible European databases containing RAMAN spectral data verified in accordance with the standard methodology [15]. These data should be provided in a compatible format suitable for processing by the most commonly used spectral analysis software. Such an approach would contribute significantly to harmonising ACM identification procedures, reducing the risk of asbestos exposure, and improving the management of construction and demolition waste, without the risk of contamination of the waste itself or pollution of the environment.
In conclusion, it has been proven that the majority of ACMs in buildings may be identified in situ by HHRS in a rapid manner, thus accelerating the PDA/PRA, avoiding risks to demolition/refurbishment workers’ health due to asbestos unawareness, as well as preventing the contamination of other CDW and environmental pollution.
Author Contributions
Conceptualisation, R.Z.; methodology, R.Z.; software, D.E. and N.D.; validation, R.Z. and D.E.; formal analysis, D.E. and N.D.; investigation, D.E. and N.D.; resources, R.Z., D.E. and N.D.; data curation, D.E. and N.D.; writing—D.E. and N.D.; writing—review and editing, R.Z.; visualisation, D.E. and N.D.; supervision, R.Z.; project administration, R.Z.; funding acquisition, R.Z. All authors have read and agreed to the published version of the manuscript.
Funding
This research was funded by the Grant Project MOBICCON-PRO (MOBile and Innovative Circularity for CONstruction PROducts) project, co-funded by the European Union’s Horizon Europe programme under grant agreement ID 101091679. The APC was funded by the same Grant Project ID 101091679.
Data Availability Statement
The original contributions presented in this study are included in the article. Further inquiries can be directed to the corresponding author.
Acknowledgments
This research was supported by the MOBile and Innovative Circularity for CONstruction PROducts (MOBICCON-PRO) project, co-funded by the European Union’s Horizon Europe programme under grant agreement ID 101091679. The studies were conducted with a handheld Raman spectrometer, purchased under project BG05M2OP001-1.002-0019 for the needs of the Center of Competence “Clean and Circle”. The authors would like to express their gratitude to Savina Dimitrova from the NCPHA for sharing her expertise in the field and for providing valuable information and sample materials. The authors would also like to express their gratitude to Iliyan Iliev from Infolab Ltd. for the training on operating the HHRS and for his valuable guidance in the processing of the Raman spectra.
Conflicts of Interest
The authors declare no conflicts of interest.
Abbreviations
The following abbreviations are used in this manuscript:
| ACM | Asbestos-containing material |
| HHRS | Handheld Raman spectrometer |
| CDW | Construction and demolition waste |
| PDA | Pre-demolition audit |
| PRA | Pre-renovation audit |
| PPE | Personal protective equipment |
| RPE | Respiratory protective equipment |
| HHXRF | Handheld X-ray fluorescent spectrometer |
| XRD | X-ray diffraction |
| PLM | Polarised light microscopy |
| SEM | Scanning electron microscopy |
| TEM | Transmission electron microscopy |
| NCPHA | National Centre of Public Health and Analyses in Bulgaria |
| IOM | The Institute of Occupational Medicine |
| Si-O | Silicon–oxygen |
| M-O | Metal–oxygen |
| SU | The Museum of Mineralogy, Petrology and Mineral Resources at Sofia University |
References
- Butkevics, J.; Atstaja, D. Diversion of Asbestos-Containing Waste from Landfilling: Opportunities and Challenges. Sustainability 2025, 17, 4529. [Google Scholar] [CrossRef] [Scilit]
- Gualtieri, A.F. Recycling asbestos-containing material (ACM) from construction and demolition waste (CDW). In Handbook of Recycled Concrete and Demolition Waste; Pacheco-Torgal, F., Tam, V.W.Y., Labrincha, J.A., Ding, Y., de Brito, J., Eds.; Woodhead Publishing: Cambridge, UK, 2013; pp. 500–525. [Google Scholar] [CrossRef] [Scilit]
- European Commission. Health and Safety: Asbestos—SAMANCTA. Available online: https://ec.europa.eu/taxation_customs/dds2/SAMANCTA/BG/Safety/Asbestos_BG.htm (accessed on 17 January 2026).
- Monier, V.; Hestin, M.; Trarieux, M.; Mimid, S.; Domröse, L.; Van Acoleyen, M.; Hjerp, P.; Mudgal, S. Service Contract on Management of Construction and Demolition Waste—SR1, A Project Under the Framework Contract ENV.G.4/FRA/2008/0112, 2011, Feb. 2011. Available online: https://www.btbab.com/wp-content/uploads/documentos/legislacion/UE-BIO_Construction_and_demolition_waste_final_report_09022011.pdf (accessed on 17 January 2026).
- Dimitrova, S. Recommendations for Protecting the Health of Workers Exposed to Asbestos, National Center for Public Health and Analysis. Available online: https://ncpha.government.bg/uploads/pages/3001/Azbestos-Prot_Workers.pdf (accessed on 17 January 2026).
- Official Journal of the European Union. Regulation (EC) No 1272/2008 of the European Parliament and of the Council of 16 December 2008 on Classification, Labelling and Packaging of Substances and Mixtures, Amending and Repealing Directives 67/548/EEC and 1999/45/EC, and Amending Regulation (EC) No 1907/2006. December 2008. Available online: https://eur-lex.europa.eu/legal-content/EN/TXT/PDF/?uri=CELEX:32008R1272 (accessed on 17 January 2026).
- Zaharieva, R.; Kancheva, Y. Hazardous Construction Waste—Types and Sources. Annu. Univ. Archit. Civ. Eng. Geod. Sofia 2020, 53, 441–456. [Google Scholar]
- Ulewicz, M. Asbestos Materials Management in The Aspect of Energy Renovation of Buildings in EU Countries. Hum.-Tech. Facil.-Environ. 2024, 6, 118–128. [Google Scholar] [CrossRef] [Scilit]
- Official Journal of the European Union. Directive 2003/18/EC of the European Parliament and of the Council of 27 March 2003 Amending Council Directive 83/477/EEC on the Protection of Workers from the Risks Related to Exposure to Asbestos at Work (Text with EEA Relevance). April 2003. Available online: https://eur-lex.europa.eu/LexUriServ/LexUriServ.do?uri=OJ:L:2003:097:0048:0052:EN:PDF (accessed on 17 January 2026).
- European Parliament and the Council of The European Union. Regulation (EC) No 1907/2006 of The European Parliament and of The Council—Concerning the Registration, Evaluation, Authorisation and Restriction of Chemicals (REACH). December 2006. Available online: https://eur-lex.europa.eu/legal-content/EN/TXT/PDF/?uri=CELEX:32006R1907 (accessed on 17 January 2026).
- Zaharieva, R.; Kancheva, Y.; Evlogiev, D.; Dinov, N. Pre-demolition audit as a tool for appropriate CDW management—A case study of a public building. E3S Web Conf. 2024, 550, 01045. [Google Scholar] [CrossRef] [Scilit]
- European Commission. EU Construction & Demolition Waste Management Protocol Including Guidelines for Pre-Demolition and Pre-Renovation Audits of Construction Works—Updated Edition 2024. Available online: https://op.europa.eu/ga/publication-detail/-/publication/d63d5a8f-64e8-11ef-a8ba-01aa75ed71a1/language-en (accessed on 17 January 2026).
- Ministry of Labor and Social Policy and the Ministry of Health of the Republic of Bulgaria. Ordinance No.9 of 4 August 2006 on the Protection of Workers from Risks Associated with Exposure to Asbestos at Work. Available online: https://ncpha.government.bg/uploads/za%20nas/struktura/Naredba9-azbest.pdf (accessed on 17 January 2026).
- Winmar Nelson. Spoiler Alert: You Can’t Visually Identify Asbestos in Materials. Available online: https://winmarnelson.com/spoiler-alert-you-cant-visually-identify-asbestos-in-materials/ (accessed on 13 February 2026).
- ISO 22262-1:2012; Air Quality—Bulk Materials—Part 1: Sampling and Qualitative Determination of Asbestos in Commercial Bulk Materials. International Organization for Standardization: Geneva, Switzerland, 2012. Available online: https://www.iso.org/standard/40834.html (accessed on 17 January 2026).
- ISO 22262-2:2014; Air Quality—Bulk Materials—Part 2: Quantitative Determination of Asbestos by Gravimetric and Microscopical Methods. International Organization for Standardization: Geneva, Switzerland, 2014. Available online: https://www.iso.org/standard/56773.html (accessed on 17 January 2026).
- U.S. Department of Labor. 1926.1101 App H—Substance Technical Information for Asbestos—Non-Mandatory | Occupational Safety and Health Administration. Available online: https://www.osha.gov/laws-regs/regulations/standardnumber/1926/1926.1101AppH (accessed on 17 January 2026).
- Health and Safety Executive. Asbestos—GUIDANCE and Information. Available online: https://www.hse.gov.uk/asbestos/index.htm (accessed on 17 January 2026).
- Zaharieva, R.; Kancheva, Y.; Kamenov, K.; Tomov, V.; Lyubomirova, V. Challenges in Using Handheld XRFs for In Situ Estimation of Lead Contamination in Buildings. Processes 2022, 10, 839. [Google Scholar] [CrossRef] [Scilit]
- Chukanov, N.V.; Vigasina, M.F. Vibrational (Infrared and Raman) Spectra of Minerals and Related Compounds; Springer: Cham, Switzerland, 2020. [Google Scholar] [CrossRef] [Scilit]
- Torres-Carrasco, M.; del Campo, A.; de la Rubia, M.A.; Reyes, E.; Moragues, A.; Fernández, J.F. New insights in weathering analysis of anhydrous cements by using high spectral and spatial resolution Confocal Raman Microscopy. Cem. Concr. Res. 2017, 100, 119–128. [Google Scholar] [CrossRef] [Scilit]
- Marín-Cortés, S.; Fernández-Álvarez, M.; Enríquez, E.; Fernández, J.F. Experimental characterization data on aggregates from construction and demolition wastes for the assistance in sorting and recycling practices. Constr. Build. Mater 2024, 435, 136798. [Google Scholar] [CrossRef] [Scilit]
- Schmid, T.; Dariz, P. Chemical imaging of historical mortars by Raman microscopy. Constr. Build. Mater 2016, 114, 506–516. [Google Scholar] [CrossRef] [Scilit]
- Lucazeau, G. Effect of pressure and temperature on Raman spectra of solids: Anharmonicity. J. Raman Spectrosc. 2003, 34, 478–496. [Google Scholar] [CrossRef] [Scilit]
- Petriglieri, J.R.; Bersani, D.; Laporte-Magoni, C.; Tribaudino, M.; Cavallo, A.; Salvioli-Mariani, E.; Turci, F. Portable Raman Spectrometer for In Situ Analysis of Asbestos and Fibrous Minerals. Appl. Sci. 2021, 11, 287. [Google Scholar] [CrossRef] [Scilit]
- Bloise, A.; Miriello, D. Distinguishing asbestos cement from fiber-reinforced cement through portable µ-Raman spectroscopy and portable X-ray fluorescence. Environ. Monit. Assess. 2022, 194, 679. [Google Scholar] [CrossRef] [Scilit]
- Sporn, T.A. The Mineralogy of Asbestos. In Pathology of Asbestos-Associated Diseases, 3rd ed.; Oury, T.D., Sporn, T.A., Roggli, V.L., Eds.; Springer: Berlin/Heidelberg, Germany, 2014; pp. 1–10. [Google Scholar] [CrossRef] [Scilit]
- Virta, R.L. Mineral Commodity Profiles-Asbestos; Circular 1255-KK; U.S. Geological Survey (USGS): Reston, VA, USA, 2005. [CrossRef] [Scilit]
- ISO 22262-3:2016; Air Quality—Bulk Materials—Part 3: Quantitative Determination of Asbestos by X-ray Diffraction Method. International Organization for Standardization: Geneva, Switzerland, 2016. Available online: https://www.iso.org/obp/ui/en/#iso:std:iso:22262:-3:ed-1:v1:en (accessed on 17 January 2026).
- University of Tartu. Instrumental Analysis of Cultural Heritage Objects with Raman Spectroscopy. Available online: https://sisu.ut.ee/heritage-analysis/32-raman-spectroscopy/ (accessed on 17 January 2026).
- Anton Paar. Basics of Raman Spectroscopy. Available online: https://wiki.anton-paar.com/hu-hu/a-raman-spektroszkopia-alapjai/ (accessed on 17 January 2026).
- Jehlička, J.; Culka, A.; Vandenabeele, P.; Edwards, H.G.M. Critical evaluation of a handheld Raman spectrometer with near infrared (785 nm) excitation for field identification of minerals. Spectrochim. Acta A Mol. Biomol. Spectrosc. 2011, 80, 36–40. [Google Scholar] [CrossRef] [Scilit]
- Liu, D.; Hennelly, B.M. Wavenumber Calibration Protocol for Raman Spectrometers Using Physical Modelling and a Fast Search Algorithm. Appl. Spectrosc. 2024, 78, 790–805. [Google Scholar] [CrossRef] [Scilit]
- Jehlička, J.; Culka, A. Critical evaluation of portable Raman spectrometers: From rock outcrops and planetary analogs to cultural heritage—A review. Anal. Chim. Acta 2022, 1209, 339027. [Google Scholar] [CrossRef] [Scilit] [PubMed]
- Rinaudo, C.; Gastaldi, D.; Belluso, E.; Capella, S. Application of Raman Spectroscopy on asbestos fibre identification. Neues Jahrb. Für Mineral. Abh. 2005, 182, 31–36. [Google Scholar] [CrossRef] [Scilit]
- Bard, D.; Yarwood, J.; Tylee, B. Asbestos fibre identification by Raman microspectroscopy. J. Raman Spectrosc. 1997, 28, 803–809. [Google Scholar] [CrossRef] [Scilit]
- Marín-Cortés, S.; Fernández-Álvarez, M.; Moure, A.; Fernández, J.F.; Enríquez, E. Chemometric-driven quantification of construction and demolition waste using Raman spectroscopy and SWIR: Enhancing sustainability in the ceramic sector. Resour. Conserv. Recycl. 2023, 199, 107259. [Google Scholar] [CrossRef] [Scilit]
- Stone Asbestos Ltd. Asbestos Containing Materials (ACMs). Available online: https://www.stoneasbestos.co.uk/asbestos/asbestos-containing-materials-acms (accessed on 17 January 2026).
- Occupational Safety and Health Administration. Asbestos—Overview. Available online: https://www.osha.gov/asbestos (accessed on 17 January 2026).
- World Health Organization (WHO). Elimination of Asbestos-Related Diseases. Available online: https://www.who.int/publications/i/item/WHO-FWC-PHE-EPE-14.01 (accessed on 17 January 2026).
- Asbestos Disease Support Society (ADSS). Asbestos Containing Materials. Available online: https://adss.org.au/asbestos-containing-materials/ (accessed on 13 February 2026).
- Vangelova, K.; Dimitrova, S.; Dimitrova, I. National Asbestos Profile of Bulgaria, 2015; National Center of Public Health and Analyses: Sofia, Bulgaria, 2015. Available online: https://ncpha.government.bg/uploads/pages/3001/National%20Asbestos%20Profile_Bulgaria_2015-bg.pdf (accessed on 17 January 2026).
- Fonseca, A.S.; Jørgensen, A.K.; Larsen, B.X.; Moser-Johansen, M.; Flachs, E.M.; Ebbehøj, N.E.; Bønløkke, J.H.; Østergaard, T.O.; Bælum, J.; Sherson, D.L.; et al. Historical Asbestos Measurements in Denmark—A National Database. Int. J. Environ. Res. Public Health 2022, 19, 643. [Google Scholar] [CrossRef] [Scilit]
- International Ban Asbestos Secretariat. Asbestos Profile: Belgium. Available online: https://www.ibasecretariat.org/prof_belgium.php (accessed on 17 January 2026).
- International Ban Asbestos Secretariat. Asbestos Profile: France. Available online: https://www.ibasecretariat.org/prof_france.php (accessed on 17 January 2026).
- European Parliament and Council of the European Union. Directive 2009/148/EC of the European Parliament and of the Council of 30 November 2009 on the protection of workers from the risks related to exposure to asbestos at work. Off. J. Eur. Union 2009, L 330, 28–36. [Google Scholar]
- Sawyer, R.N.; Rohl, A.N.; Langer, A.M. Airborne fiber control in buildings during asbestos material removal by amended water methodology. Environ. Res. 1985, 36, 46–55. [Google Scholar] [CrossRef] [Scilit] [PubMed]
- Occupational Safety and Health Administration. Significant Changes in the Asbestos Standard for Construction (29 CFR 1926.1101). Available online: https://www.osha.gov/training/library/asbestos/construction (accessed on 17 January 2026).
- CS Unitec. CS Unitec 2BPG TVS Needle Scaler with Integrated Vacuum Shroud. Available online: https://abrafast.com/product/cs-unitec-2bpg-tvs-needle-scaler-w-integrated-vacuum-shroud/ (accessed on 17 January 2026).
- Innocenti, S.; Balbas, D.Q.; Pezzati, L.; Fontana, R.; Striova, J. Portable Sequentially Shifted Excitation Raman Spectroscopy to Examine Historic Powders Enclosed in Glass Vials. Sensors 2022, 22, 3560. [Google Scholar] [CrossRef] [Scilit]
- Bruker Optik GmbH. Spettrometro Raman Portatile BRAVO. Available online: https://www.bruker.com/it/products-and-solutions/raman-spectroscopy/raman-spectrometers/bravo-handheld-raman-spectrometer.html (accessed on 17 January 2026).
- Jehlička, J.; Culka, A.; Bersani, D.; Vandenabeele, P. Comparison of seven portable Raman spectrometers: Beryl as a case study. J. Raman Spectrosc. 2017, 48, 1289–1299. [Google Scholar] [CrossRef] [Scilit]
- Dimitrova, S.; Mavrodieva, E.; Lukanova, R. Testing Materials for Asbestos Content; National Center of Public Health and Analyses: Sofia, Bulgaria, 2013. Available online: https://ncpha.government.bg/uploads/pages/3001/asbestos1.pdf (accessed on 17 January 2026).
- International Union of Pure and Applied Chemistry. Fingerprint Region; in *Compendium of Chemical Terminology* (IUPAC Gold Book), Online Version 5.0.0, 2025. Available online: https://goldbook.iupac.org/terms/view/08604 (accessed on 17 January 2026).
- Museum of Mineralogy, Petrology and Mineral Resources—Sofia University St. Kliment Ohridski (MMPMR SU). Available online: https://www.uni-sofia.bg/index.php/eng/the_university/other_structures/museums2/museum_of_mineralogy_petrology_and_mineral_resources (accessed on 17 January 2026).
- Asbestos Proficiency Testing—The Institute of Occupational Medicine (IOM). Available online: https://www.iom-world.org/lab-services/asbestos-proficiency-testing/ (accessed on 17 January 2026).
- Testing Center Health—Ministry of Health, National Center of Public Health and Analyses. Available online: https://ncpha.government.bg/index/106-ic-zdrave.html (accessed on 17 January 2026).
- Savitzky, A.; Golay, M.J.E. Smoothing and Differentiation of Data by Simplified Least Squares Procedures. Anal. Chem. 1964, 36, 1627–1639. [Google Scholar] [CrossRef] [Scilit]
- Schafer, R.W. What is a savitzky-golay filter? IEEE Signal Process. Mag. 2011, 28, 111–117. [Google Scholar] [CrossRef] [Scilit]
- Thermo Fisher Scientific. Reduce Noise by Smoothing Spectra—OMNIC Paradigm User Guide. Available online: https://knowledge1.thermofisher.com/Molecular_Spectroscopy/Molecular_Spectroscopy_Software/OMNIC_Family/OMNIC_Paradigm_Software/OMNIC_Paradigm_Operator_Manuals/Latest_OMNIC_Paradigm_User_Guide/Reduce_noise_by_smoothing_spectra (accessed on 17 January 2026).
- RRUFF Project. Database of Raman Spectroscopy, X-ray Diffraction and Chemistry of Minerals. Available online: https://www.rruff.net/ (accessed on 13 February 2026).
- U.S. Geological Survey. World Trade Center Asbestos Primer—Asbestos; Open-File Report 01-0429; U.S. Department of the Interior: Reston, VA, USA. Available online: https://pubs.usgs.gov/of/2001/ofr-01-0429/asbestos.html (accessed on 17 January 2026).
- Tang, J.; Wang, Z. Hydrated Electron Dynamics and Stimulated Raman Scattering in Water Induced by Ultrashort Laser Pulses. Molecules 2024, 29, 1245. [Google Scholar] [CrossRef] [Scilit] [PubMed]

Disclaimer/Publisher’s Note: The statements, opinions and data contained in all publications are solely those of the individual author(s) and contributor(s) and not of MDPI and/or the editor(s). MDPI and/or the editor(s) disclaim responsibility for any injury to people or property resulting from any ideas, methods, instructions or products referred to in the content. |
© 2026 by the authors. Licensee MDPI, Basel, Switzerland. This article is an open access article distributed under the terms and conditions of the Creative Commons Attribution (CC BY) license.