1. Introduction
During Cold Heavy Oil Production with Sands (CHOPS), the simultaneous production of oil and sand creates highly permeable flow pathways, commonly referred to as wormholes [
1,
2,
3]. These pathways enhance near-well connectivity, enabling rapid pressure depletion and oil production during the primary stage [
4,
5]. However, after CHOPS, the dominance of wormholes causes pressure depletion to concentrate along the established high-permeability network, while pressure gradients propagate less effectively into the surrounding reservoir. As a result, although wormholes improve local flow efficiency, large portions of the reservoir outside the wormhole network experience weak pressure communication, leading to poor sweeping efficiency and leaving significant volumes of oil trapped in low-connectivity regions. Consequently, effective post-CHOPS recovery strategies are required to mobilize oil beyond the dominant flow paths [
6,
7,
8]. The post-CHOPS reservoir environment, therefore, presents a distinct enhanced oil recovery (EOR) challenge, as conventional displacement methods are often ineffective due to rapid breakthrough and preferential flow through wormhole-dominated pathways [
9,
10,
11]. Cyclic Solvent Injection (CSI) has been suggested as a feasible post-CHOPS recovery approach as it provides an additional driving force beyond simple pressure depletion and does not depend on continuous displacement through the reservoir [
2,
12,
13].
The reservoir’s structural characteristics, particularly wormhole configurations, play a crucial role in determining recovery efficiency. Chang and Ivory conduct a field-scale CSI simulation, proposing multiple post-CHOPS wormhole configurations that dilate near-wellbore zones, create effective high-permeability corridors, and form spoke-like wormholes with and without branching to represent reservoir access and conformance. The results show that alternative wormhole networks yield markedly different solvent contact and, therefore, divergent CSI predictions. Configurations with greater extent and branching enhance contact area and sweep, supporting stronger cycle-to-cycle recovery, whereas simplified high-k or purely dilated zones tend to localize flow near the well and under-spoke regions, dampening performance. These results demonstrate that the wormhole configuration is significant in influencing non-equilibrium mass-transfer kinetics in CSI outcomes [
14]. Rangriz Shokri and Babadagli propose a field-scale CHOPS/post-CHOPS modeling system that combines non-equilibrium foamy oil kinetics with realistic, upscaled wormhole geometries. Using laboratory-based scaling, they assess different wormhole representations and find that wormhole coverage and geometry influence injectivity and solvent access; importantly, they also suggest that hot fluids and solvents can improve recovery beyond the wormhole domain when the upscaled geometry is accurately modeled [
15]. To assess the effect of wormholes on hybrid steam-solvent injection in post-CHOPS reservoirs, Zhao and Yang carried out a simulation study. To study the wormhole network, a dual-permeability model was created. According to their findings, wormholes significantly improved solvent injectivity and enabled deeper reservoir penetration. Consequently, this increased the oil-swelling effect and the solvent–oil contact area, which improved the recovery factor [
16]. The role of wormhole configuration in the CSI process was investigated by David and Torabi, who examined several geometrical arrangements, including single linear, single-branched, and double-branched wormholes, using a two-dimensional rectangular sand-packed model. Their results demonstrated a systematic increase in recovery factor with increasing wormhole complexity, achieved either through branch development or the formation of multiple wormholes. This improvement was attributed to the enlargement of the effective oil–solvent contact area, which enhanced solvent penetration and oil mobilization during cyclic injection [
17]. The impact of wormhole orientation and symmetry during CSI was further examined by Palizdan et al. Through a comparative analysis of symmetric and asymmetric wormhole configurations, it was shown that although the presence of wormholes generally increases oil–solvent contact area and promotes oil recovery, the spatial orientation of the wormhole network plays a critical role in governing flow distribution. Certain asymmetric configurations were found to restrict pressure communication and limit oil production, indicating that wormhole geometry can, under specific conditions, adversely affect recovery efficiency [
18].
Sahni et al. presented a framework for interpreting heavy-oil solution-gas-drive behavior using dimensionless scaling, mechanistic modeling, and CT-monitored depletion experiments. Their results showed that most laboratory tests exhibit nonequilibrium behavior controlled by oil viscosity and pressure-decline rate, with higher depletion rates generating more nucleation sites and bubbles. They also proposed a first-order correlation for critical gas saturation and demonstrated that dispersed gas flow is characterized by very low gas mobility. Field analysis indicated that such dispersed-gas flow is most likely to occur near the wellbore or along high-permeability pathways such as wormholes, highlighting the importance of proper scaling from laboratory to reservoir conditions [
19]. Bennion et al. show that the pressure-depletion rate strongly governs foamy oil behavior: faster drawdown promotes microbubble formation below
Pb and yields >30% core-scale primary recovery. Field pilots with progressive-cavity pumps lifted well rates from approximately 1–2 to 30 m
3/d (10–35% sand cuts), consistent with CHOPS mechanisms [
20]. Sheikha and Pooladi-Darvish used controlled sandpack experiments to examine the independent effects of pressure-decline rate and pressure gradient on solution-gas-drive behavior in heavy oil. Their findings demonstrated that while increasing the pressure-decline rate by an order of magnitude had just a slight impact on recovery, oil recovery was primarily controlled by the pressure gradient. Reduced gas mobility, perhaps due to bubble breakup and limited coalescence during flow toward the production outlet, was associated with higher recovery at higher-pressure gradients. They concluded that early-time gas supersaturation and bubble nucleation are less significant in regulating oil-displacement efficiency than pressure-gradient-dependent gas mobility [
21]. Hong and Zeng investigated how pressure depletion rate influences gas–oil flow behavior during cyclic solvent injection using a combination of laboratory-scale CSI experiments and numerical history matching. Their study showed that higher depletion rates alter the critical gas saturation and promote stronger foamy oil mobility by enhancing interaction between free gas in the solvent chamber and dispersed gas bubbles. At sufficiently rapid pressure decline, free gas was observed to remain mobile even when dispersed bubbles were largely immobile, leading to gas–oil flow characteristics that differ from those reported for conventional heavy-oil solution gas drive [
6]. Zhou et al. experimentally investigated foamy-oil behavior in a heavy-oil–methane system under non-equilibrium pressure depletion, demonstrating that gas evolution occurs through sequential transformation from solution gas to dispersed and free gas rather than instantaneous liberation. Their results showed that higher pressure-depletion rates significantly reduced the pseudo-bubble-point pressure and prolonged the foamy oil regime, indicating strong sensitivity of foamy oil stability to depletion strategy. By applying kinetic analysis, they further quantified gas-phase transfer rates and established a linear relationship between free-gas evolution and the square root of time, providing a mechanistic framework for analyzing pressure-controlled foamy oil behavior relevant to cyclic solvent-based recovery processes [
22]. Sun et al. conducted a comprehensive experimental and modeling investigation of foamy solution gas drive in heavy-oil systems, demonstrating that foamy oil behavior is significantly influenced by the rate of pressure depletion and the kinetics of non-equilibrium gas evolution. Their findings indicated that elevated depletion rates produce increased supersaturation, activate additional gas-nucleation sites, enhance critical gas saturation, and impede gas mobility, resulting in improved oil recovery and more consistent gas–oil ratio behavior. Using a three-dimensional kinetic model, they identified the depletion rate, pressure-gradient scale, and critical gas saturation as the primary controlling parameters, while oil viscosity and solution GOR were deemed secondary, establishing a mechanistic framework directly relevant to cyclic pressure-depletion processes in solvent-based recovery [
23]. Jia et al. presented a novel method to examine the effect of the pressure-depletion rate on the cyclic solvent injection (CSI) process. Three steps make up this approach, known as pressure pulsing CSI (pp-CSI): (1) lowering the pressure to start foaming oil, (2) raising the pressure again, and (3) keeping the pressure between the injector and producer at a certain level. According to the findings, the output rate was 4.37 times that of traditional CSI, and the recovery factor increased by 17% [
24].
Despite extensive investigation of cyclic solvent injection (CSI) in wormhole-dominated systems, wormholes are commonly treated as static features, while pressure-depletion strategies are typically applied at fixed rates throughout the process. Such assumptions overlook the dynamic interaction between wormhole extent and recovery behavior as CSI progresses over multiple cycles. In this study, wormhole extent is quantified using the wormhole coverage (ϕ wh), defined as the fraction of the reservoir area occupied by wormholes. The influence of ϕ wh on solvent penetration, oil mobilization, and the system’s response to cycle-dependent pressure-depletion strategies remains insufficiently understood, limiting the development of depletion strategies that reflect evolving reservoir conditions. Addressing this gap requires linking pressure depletion rate to the evolving connectivity imposed by wormhole length, rather than treating it as an independent operational parameter.
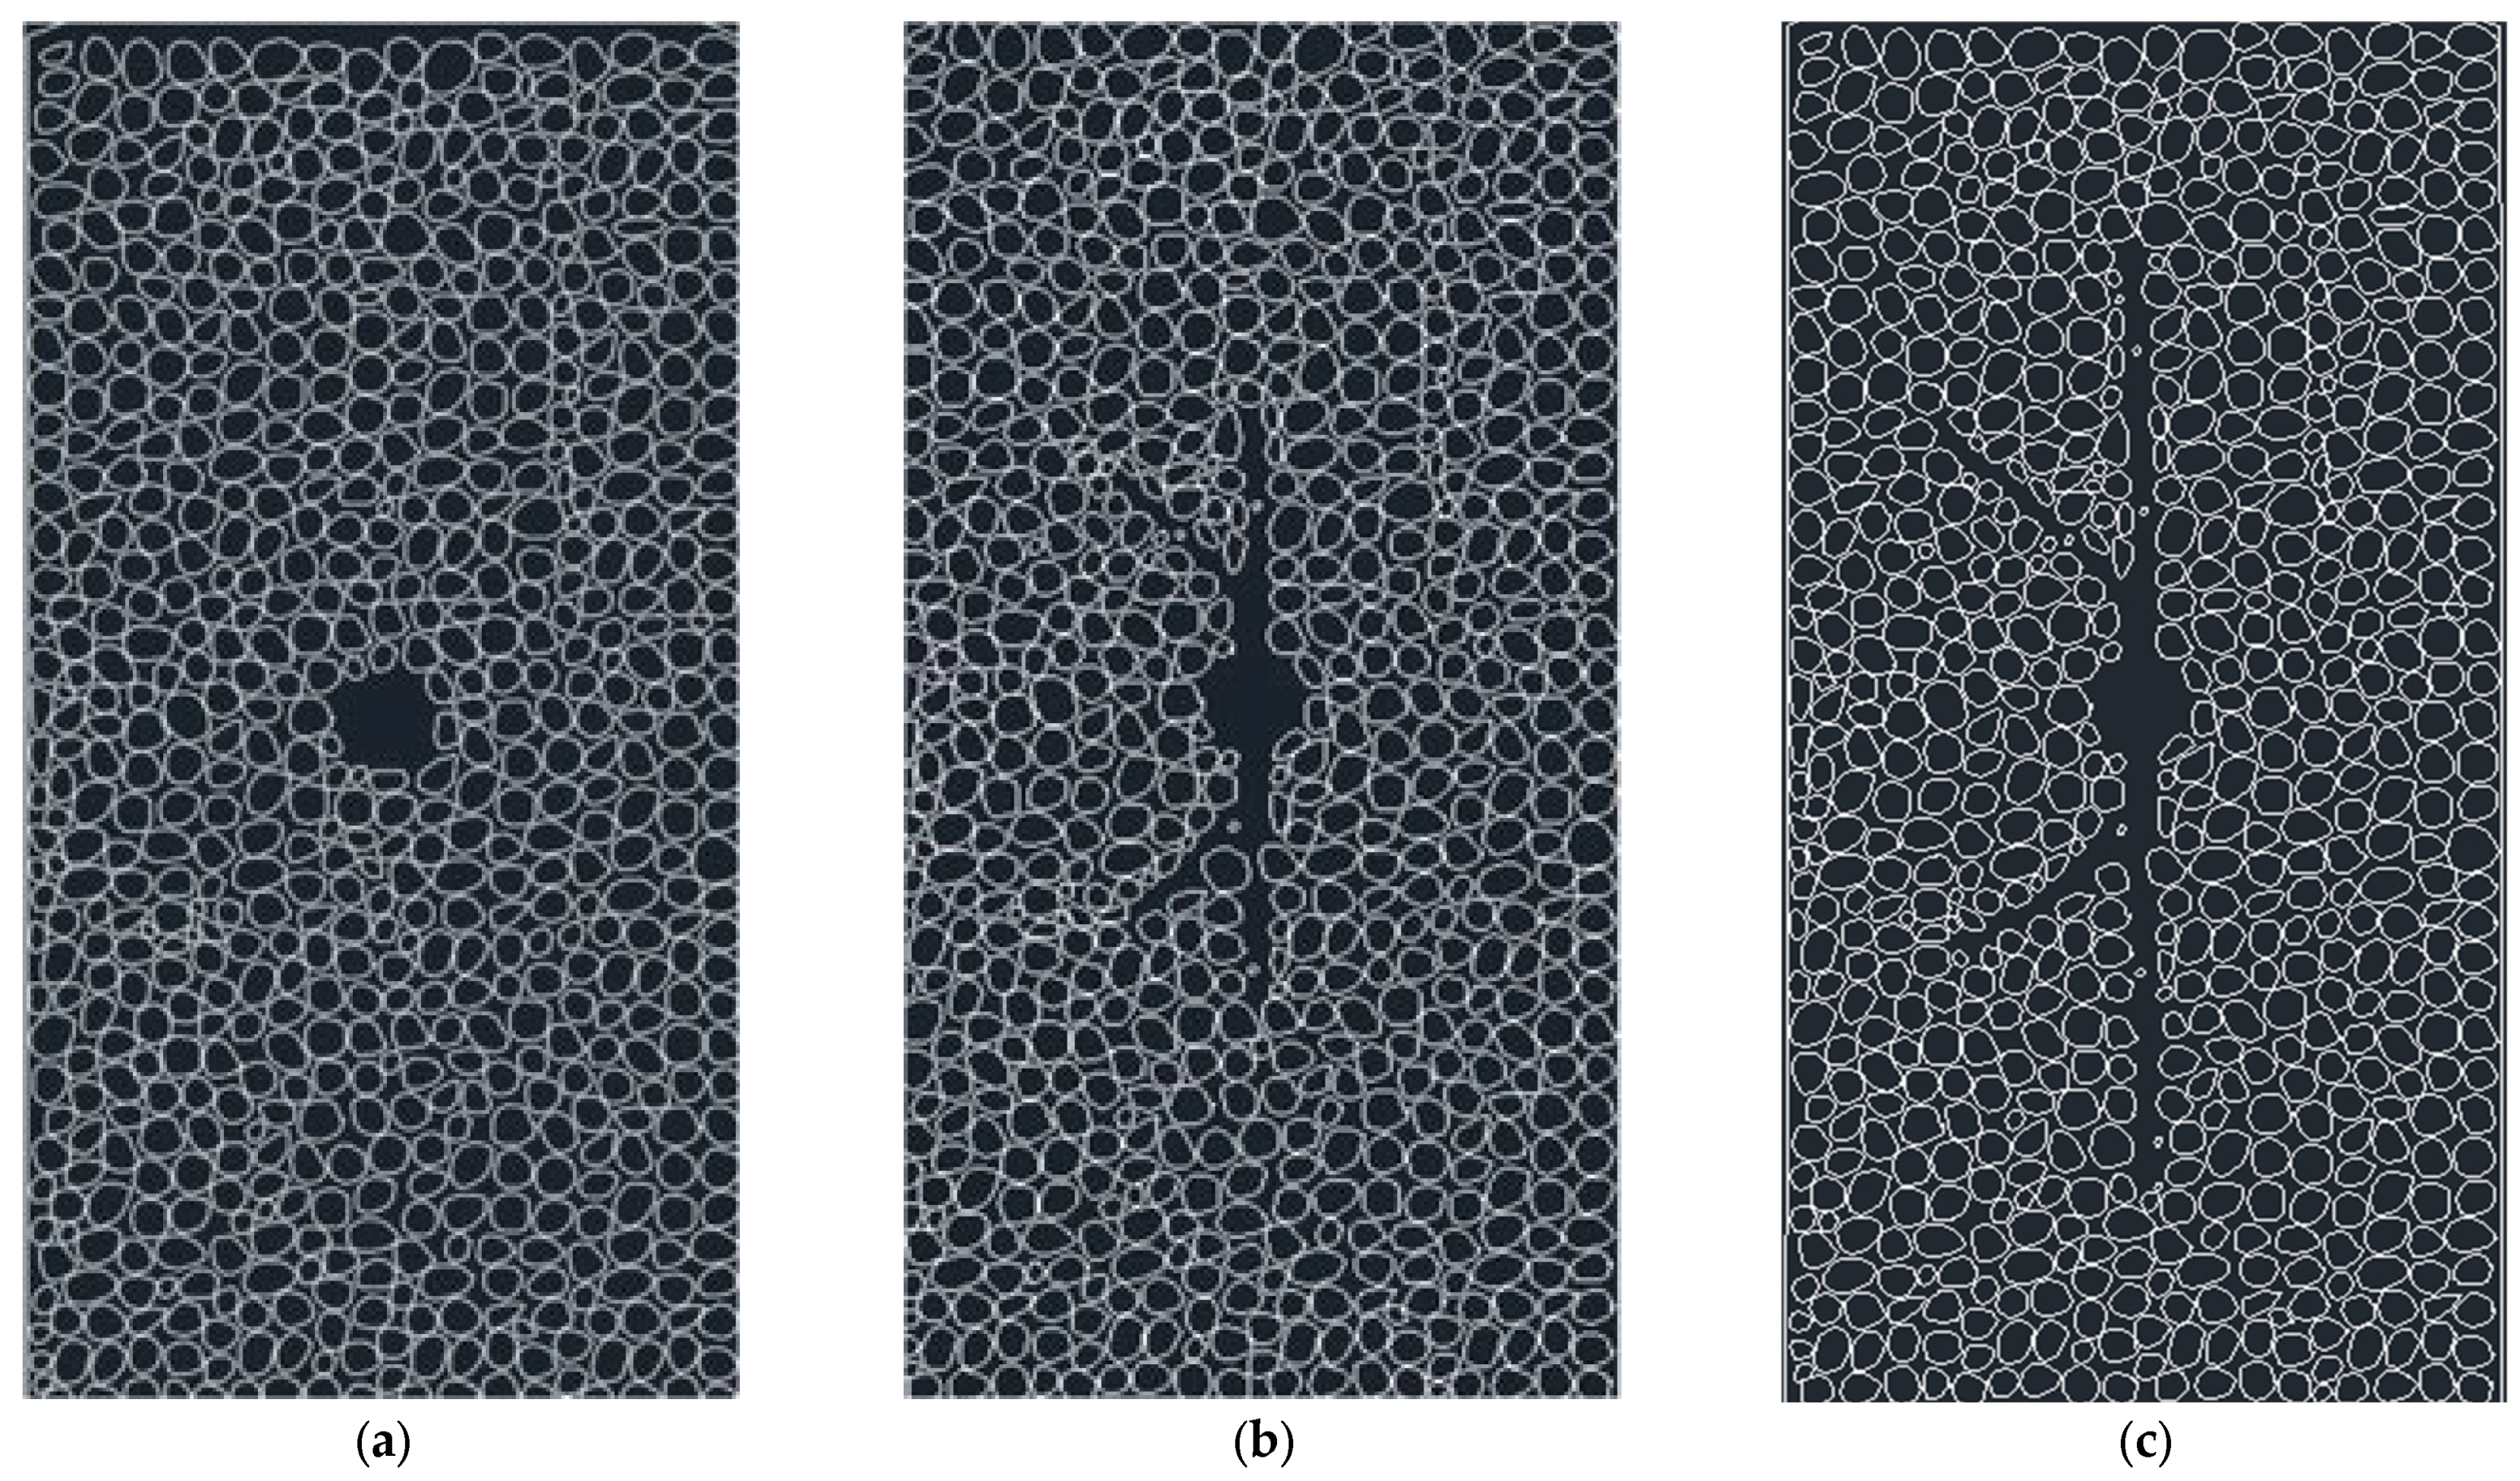
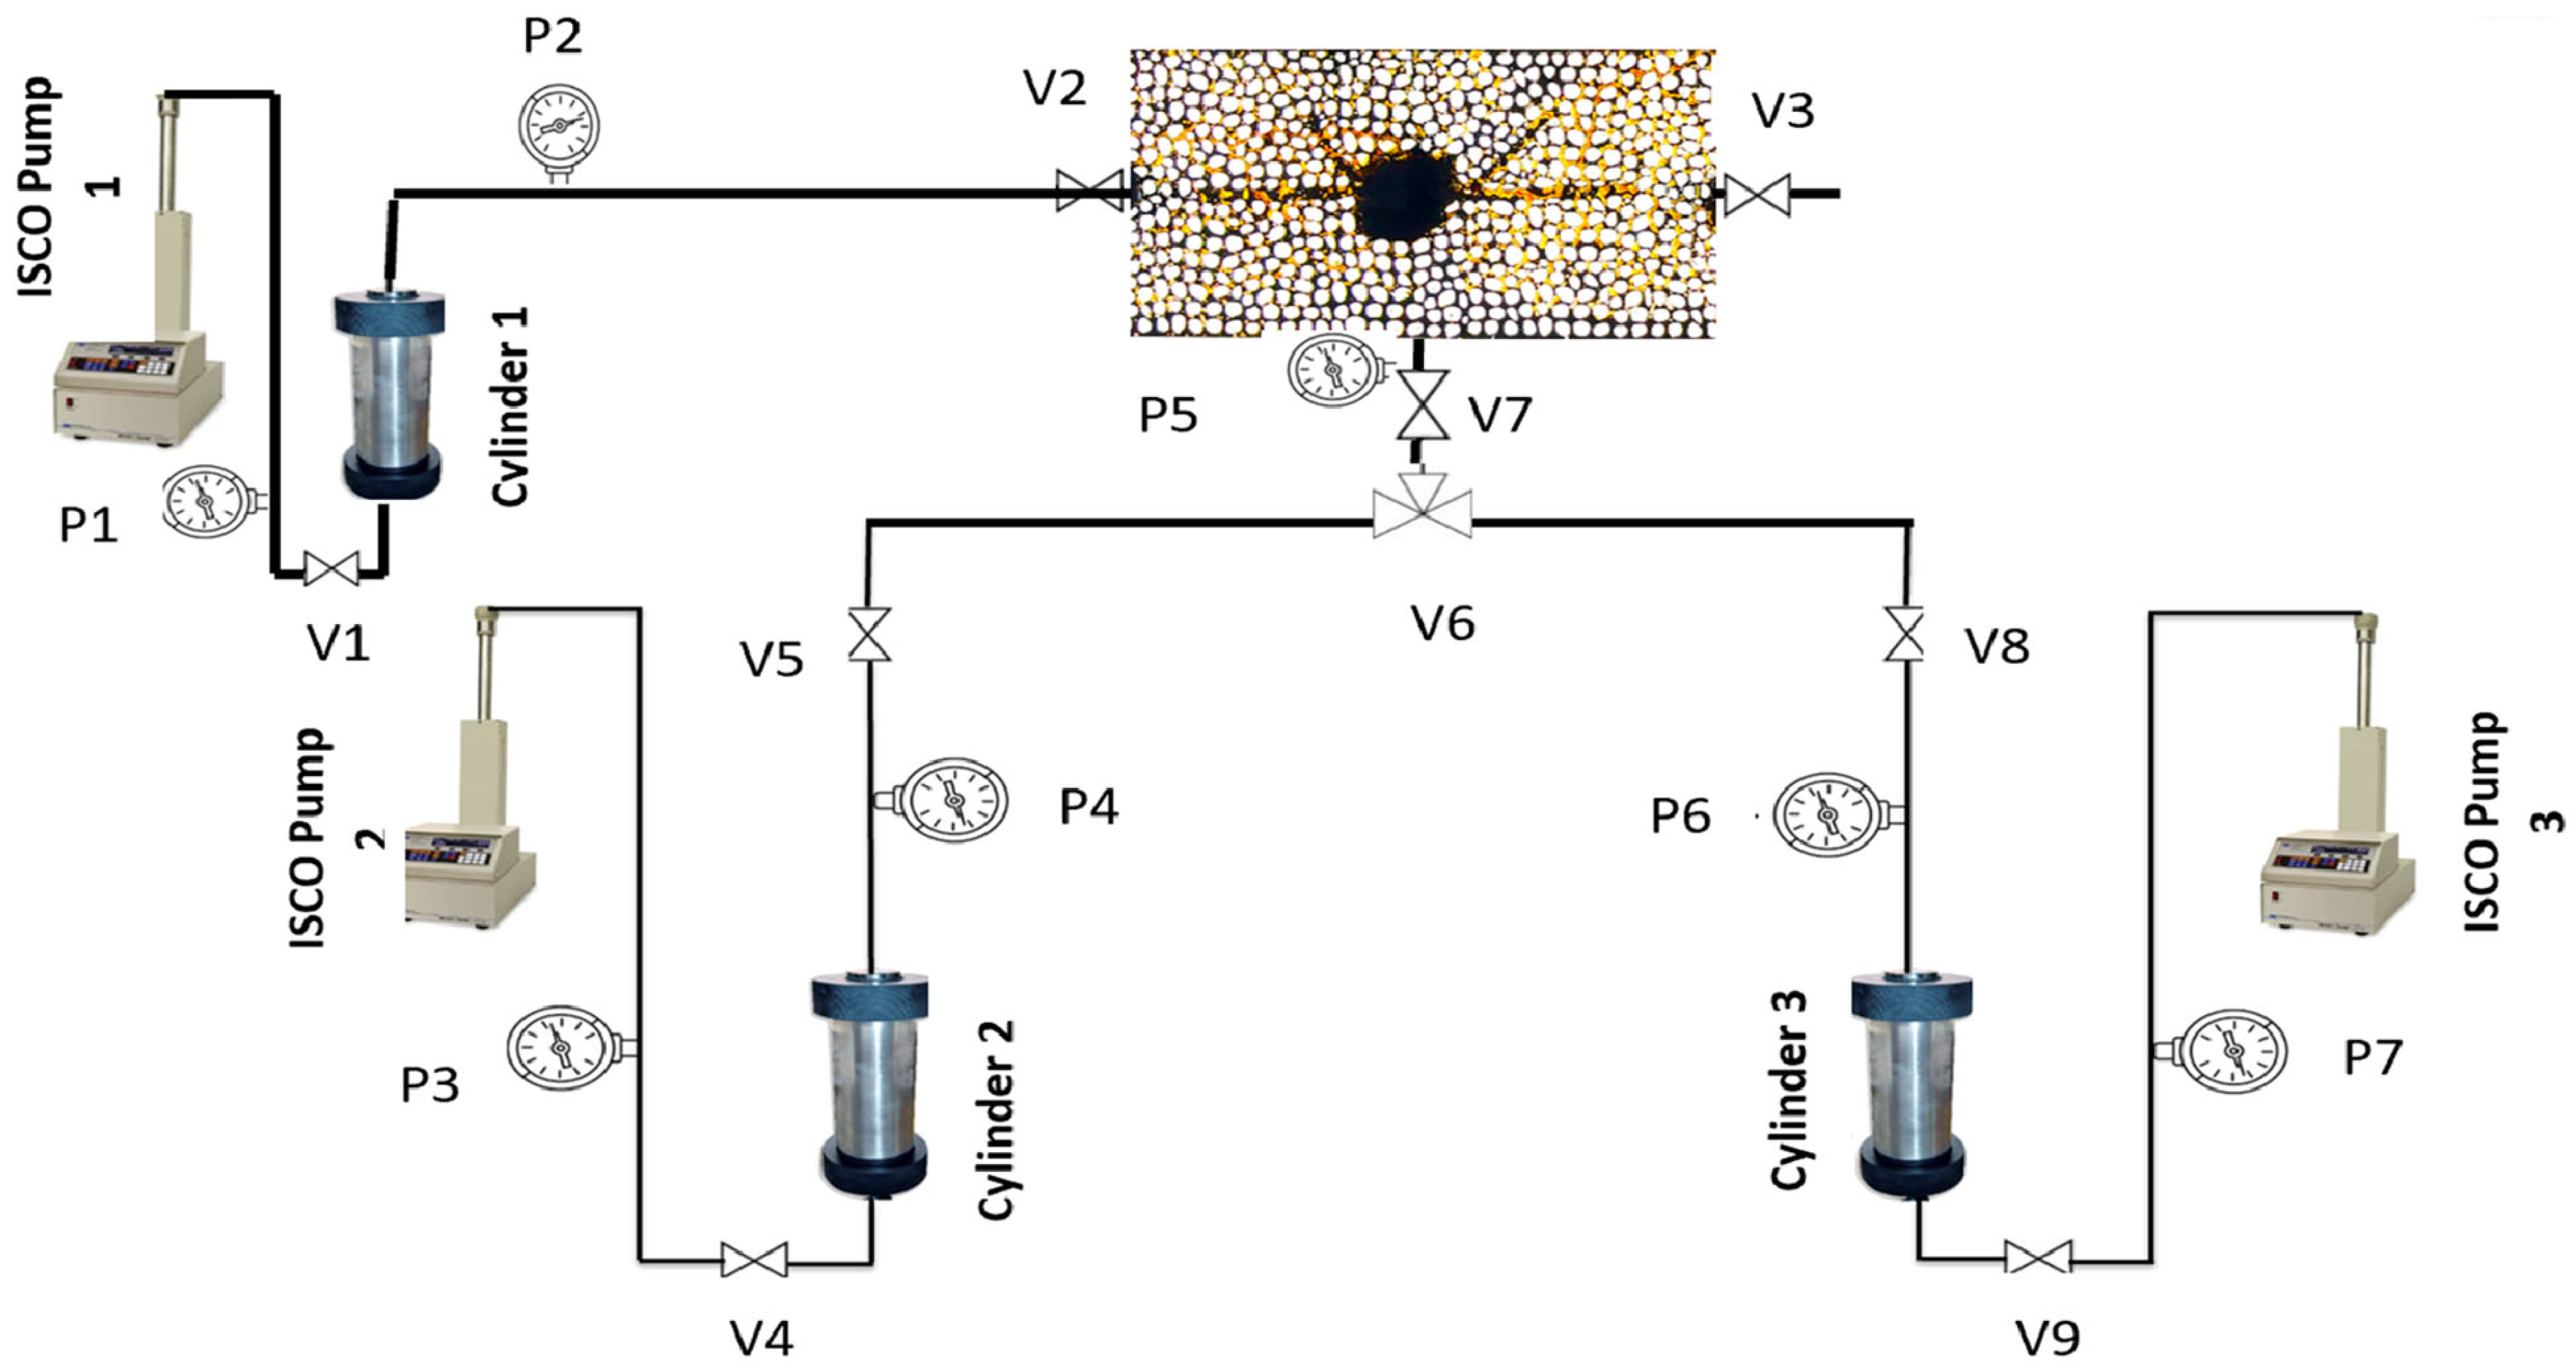
To further investigate the effect of wormhole characteristics on the performance of the CSI process, the present study focuses on how wormhole length governs the sensitivity of oil recovery to pressure-depletion strategies across successive cycles. Microfluidic experiments were conducted using symmetric micromodels with systematically varied wormhole lengths to isolate the role of geometric extent on solvent penetration, oil mobilization, and foamy oil activation during the CSI process. Both fixed and incremental pressure-depletion schemes were applied to capture cycle-dependent operational effects. Through combined macroscopic recovery analysis and microscopic flow observations of gas nucleation behavior, this study identifies the conditions under which increasing wormhole coverage amplifies the impact of pressure-depletion rate in wormhole-dominated post-CHOPS systems. By explicitly linking wormhole length to the evolution of recovery mechanisms across cycles, this work addresses a key gap in CSI understanding and provides new insight into pressure-depletion optimization in wormhole-dominated reservoirs.
3. Results
3.1. Effect of Wormhole Coverage on Oil Production During the CSI Process
To investigate the effect of wormhole length and its coverage on oil production during the CSI process, three experiments (Test 1, 2, and 3) were conducted using different microfluidic configurations: a basic micromodel (ϕ wh = 0%); a micromodel with short branch wormholes with the wormhole fraction of approximately ϕ wh = 3.1%, and a micromodel with long branch wormholes ϕ wh = 5.1%. The results were analyzed from a macroscopic perspective by comparing oil production patterns and recovery factors over three CSI cycles.
3.1.1. Cycle 1
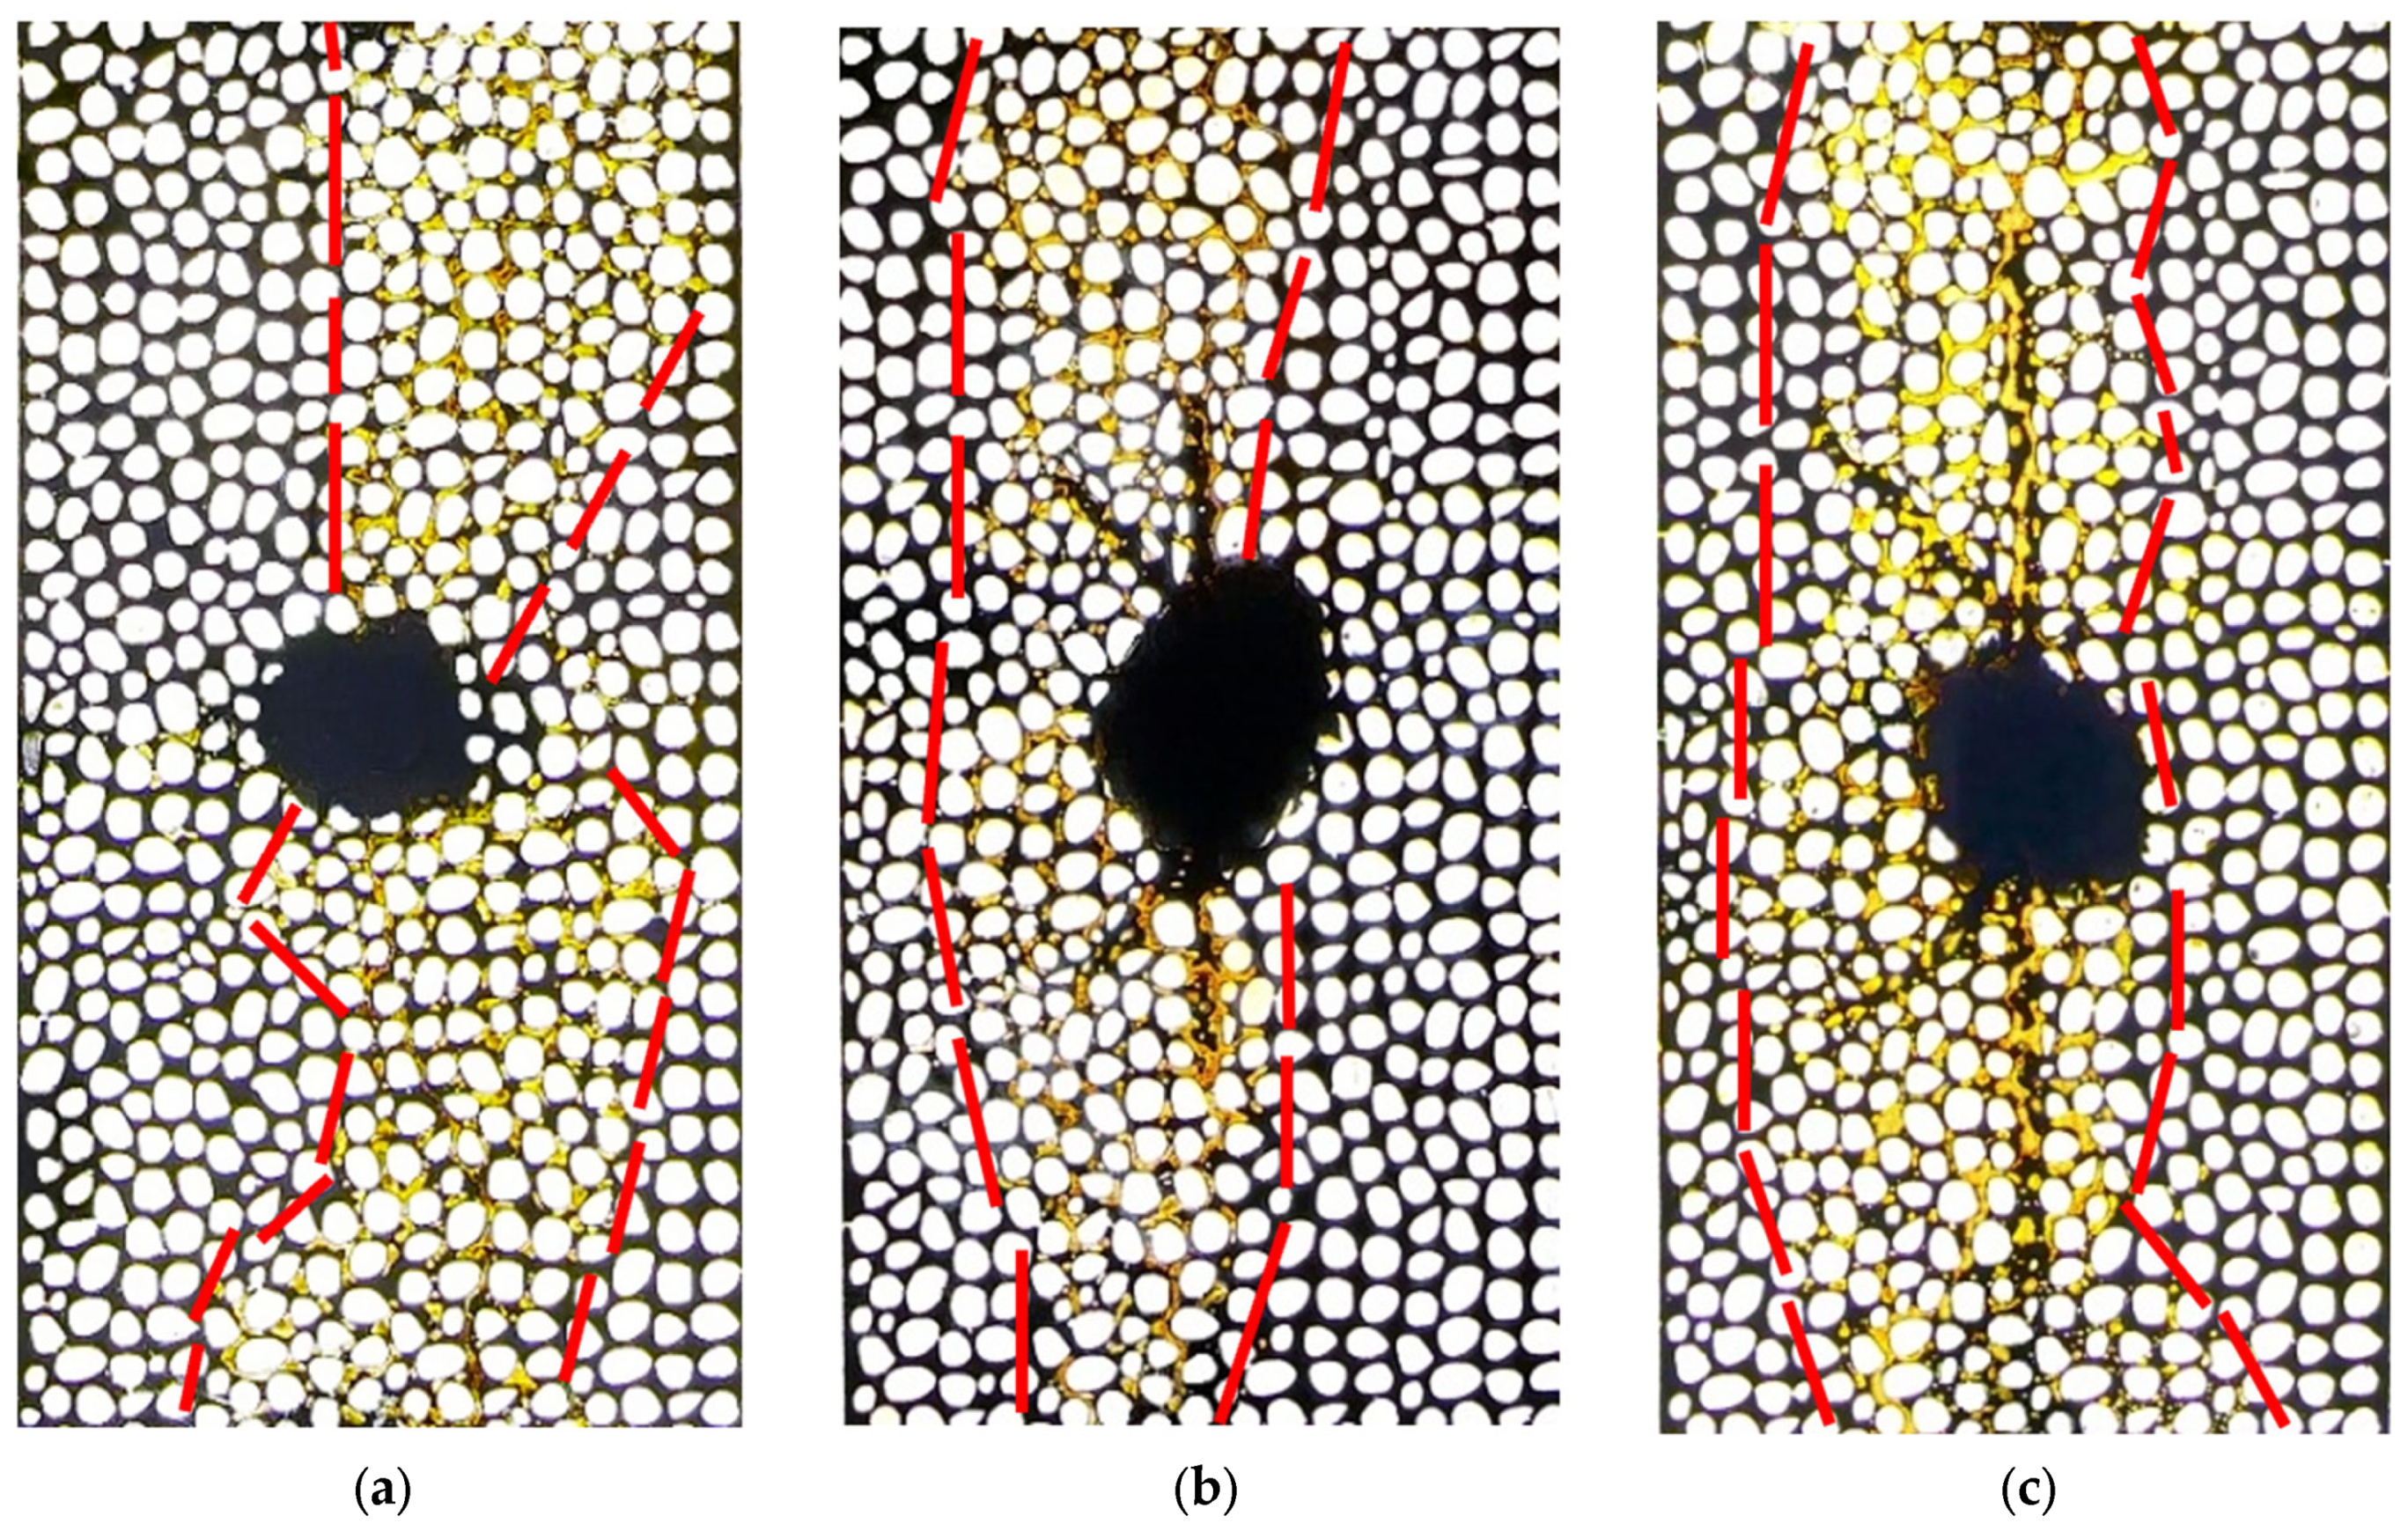
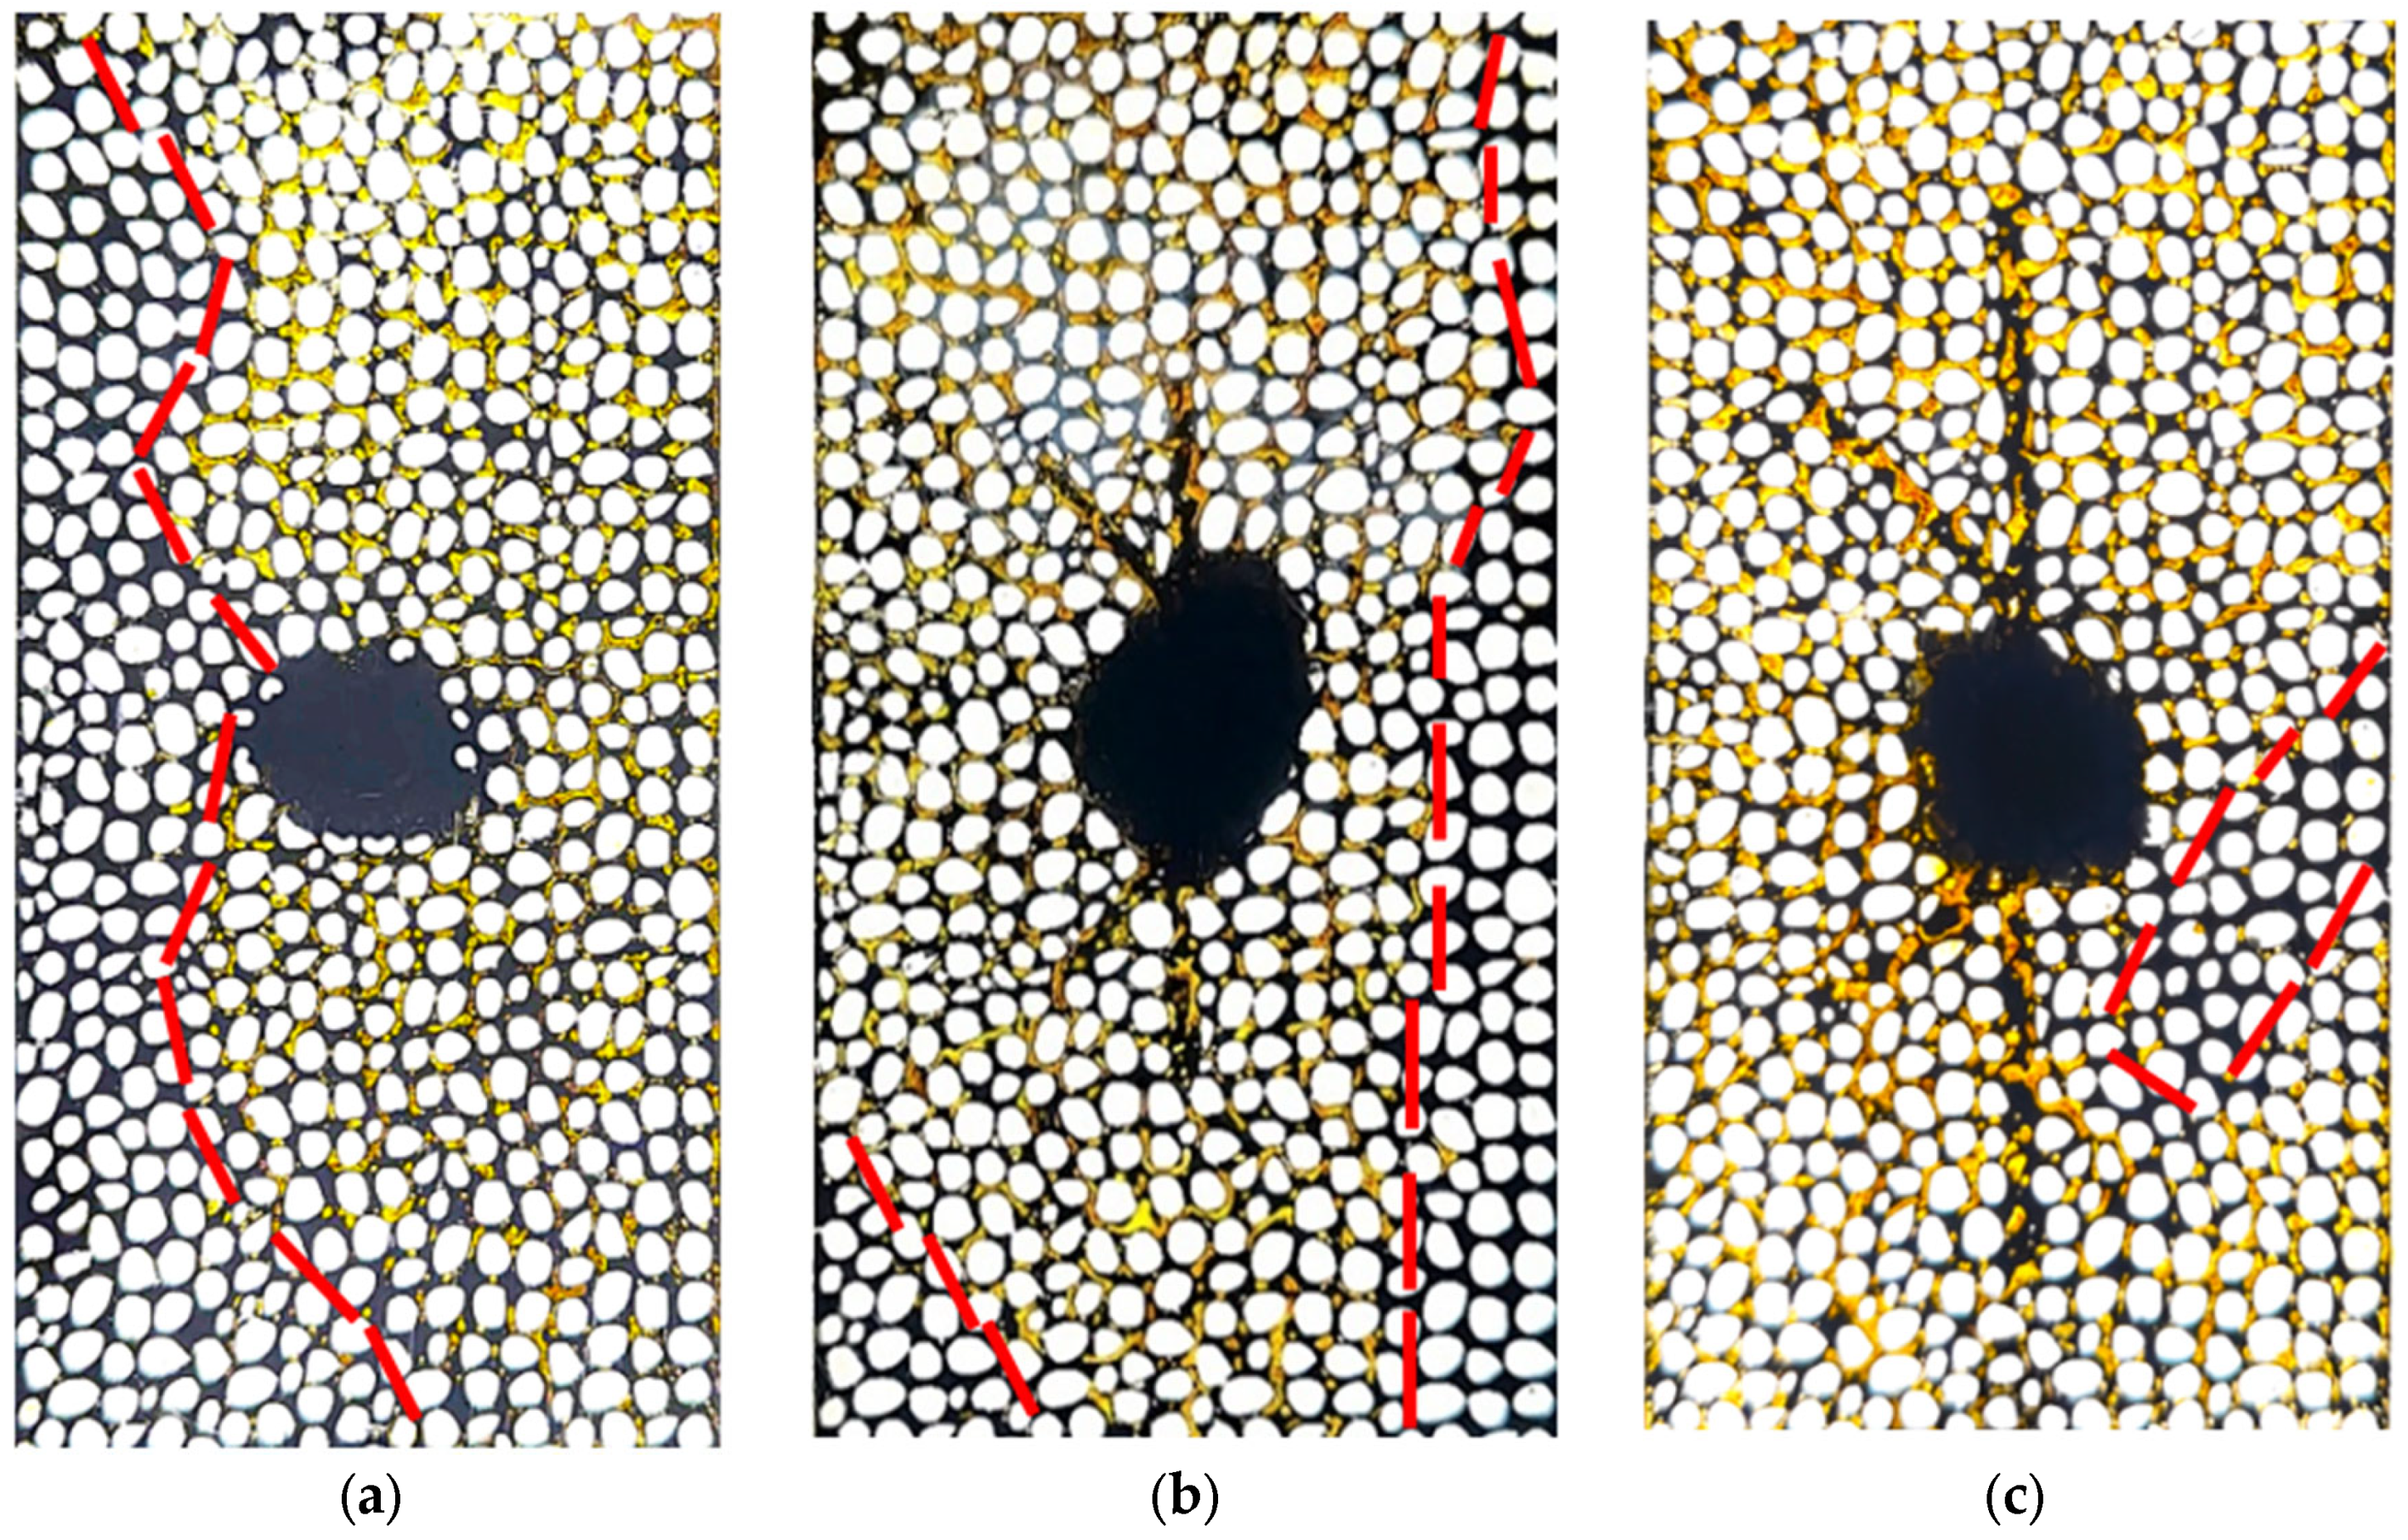
Figure 3 illustrates the macroscopic oil production behavior after the first CSI cycle for the three micromodel configurations. In the basic micromodel with zero wormhole coverage area (Test 1,
Figure 3a), oil production occurred symmetrically from both the upper and lower sides of the central production well. In the micromodel with short branch wormholes (Test 2,
Figure 3b), oil production was predominantly concentrated along the wormhole paths on both sides of the well, indicating that the wormholes acted as preferential flow channels during the early stage of production. Among the three configurations, the micromodel with long-branch wormholes (Test 3,
Figure 3c) exhibited the most effective production behavior. In this configuration, oil was mainly produced from regions surrounding the extended wormhole branches, demonstrating that increased wormhole coverage enhances preferential flow and promotes earlier oil mobilization during the first cycle.
3.1.2. Cycle 2
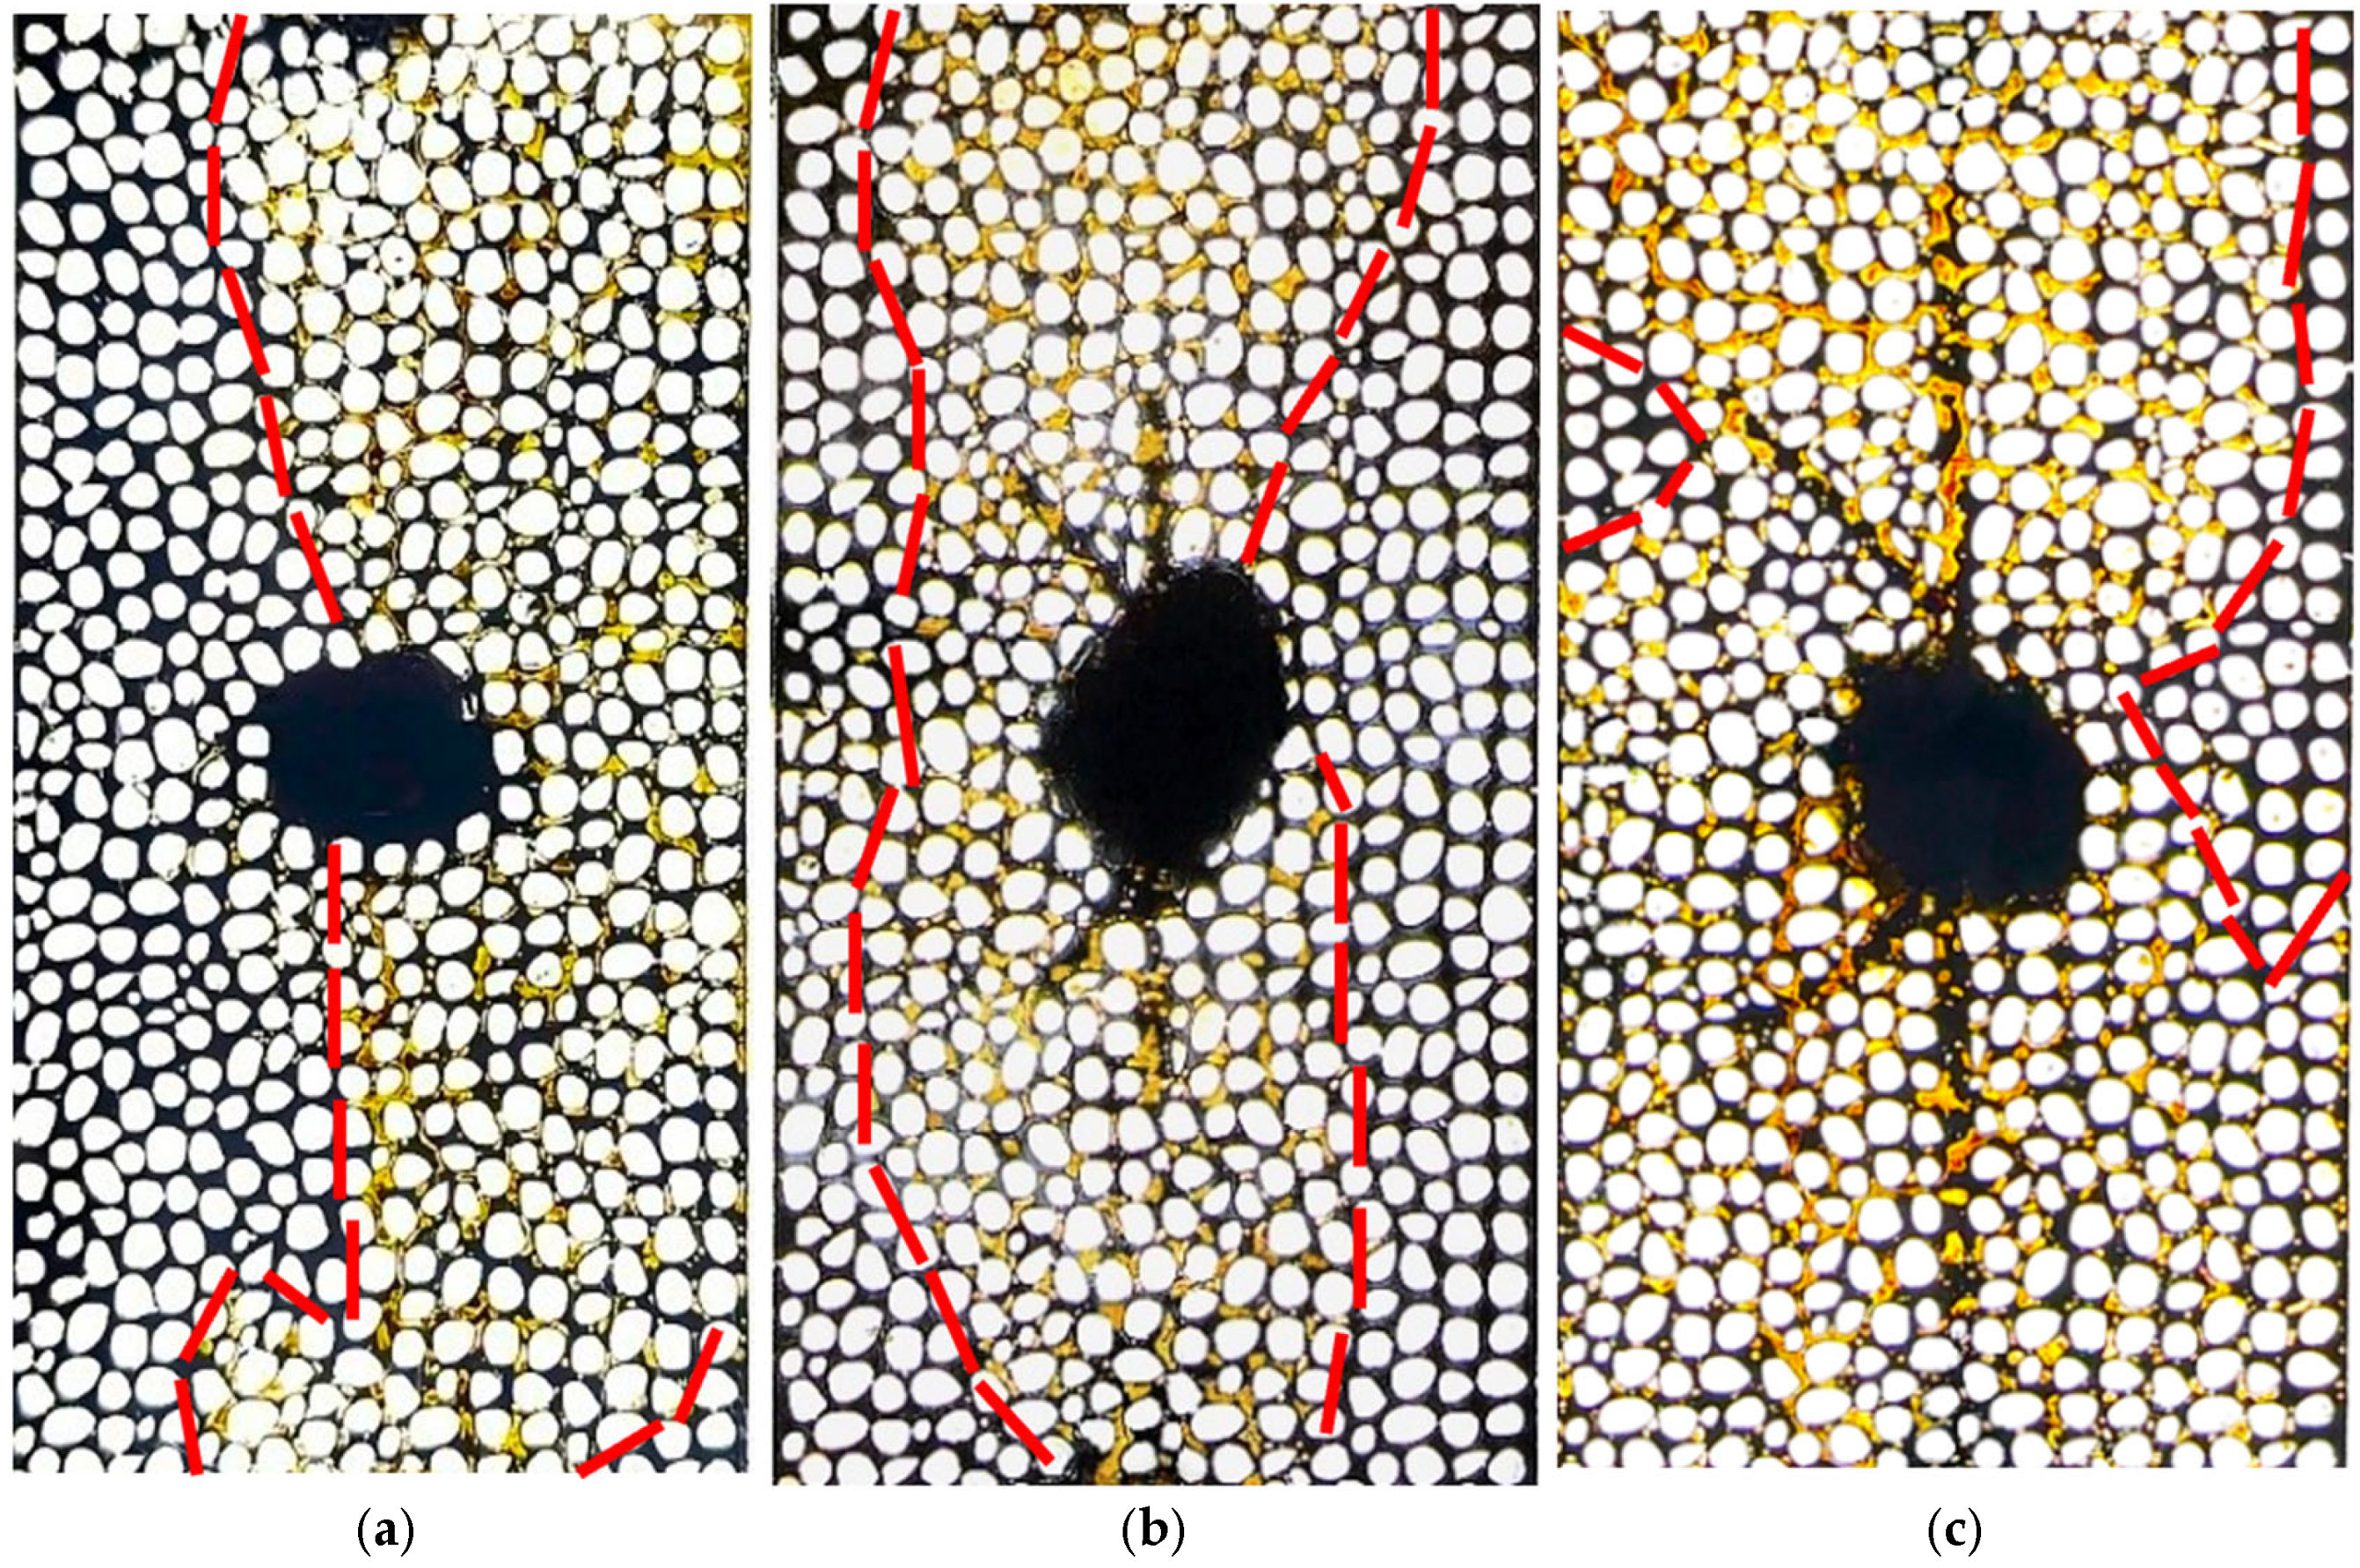
As the experiment progressed into the second CSI cycle, the oil-produced region expanded relative to the first cycle across all three micromodel configurations, as shown in
Figure 4. This expansion reflects increased solvent penetration into the porous medium following the initial cycle.
In the basic micromodel (
Figure 4a), oil production continued to develop outward from the central well, following the solvent diffusion pattern observed previously. In contrast, for the micromodels with short and long wormholes (
Figure 4b,c), the expansion of the produced-oil region was more pronounced around the wormhole pathways. This behavior suggests that increasing wormhole coverage led to more efficient solvent redistribution and enhanced oil mobilization in regions adjacent to the high-permeability channels during the second cycle.
3.1.3. Cycle 3
By the third CSI cycle, the influence of wormhole length and coverage on oil production became more evident, as illustrated in
Figure 5. In the basic micromodel (
Figure 5a), oil production showed limited expansion compared to the previous cycle, indicating reduced effectiveness of additional cycles in the absence of wormholes.
In contrast, micromodels containing wormholes continued to grow the produced-oil region. In particular, the micromodel with the highest wormhole coverage (
Figure 5c) demonstrated oil production extending beyond the immediate vicinity of the wormhole branches. This observation suggests improved solvent access to regions farther from the production well. This behavior indicates that longer wormholes enhanced connectivity within the porous network, allowing solvent to penetrate a wider area during later cycles and leading to higher overall oil recovery.
Overall, macroscopic visual observations from microfluidic experiments demonstrate the critical role of longer branch wormholes in enhancing oil production across multiple CSI cycles, emphasizing the importance of wormhole geometry on recovery performance.
In the basic microfluidic system with a uniform structure and no wormholes, the injected solvent diffused randomly during the injection stage, and oil production followed the solvent diffusion paths. This behavior is consistent with observations discussed in detail in our previously published work [
18].
Micromodels containing short and long branch wormholes, however, exhibited a different production response. During injection, the solvent preferentially migrated through the highly permeable wormhole channels, where flow resistance was lower. As a result, oil production in the first cycle was primarily concentrated along the wormhole pathways, with this localization becoming more pronounced as wormhole coverage increased.
In subsequent cycles, the influence of the wormhole coverage became more pronounced. After the first cycle, oil depletion along the wormhole pathways created additional space for solvent penetration, improving diffusion efficiency, solvent access, and contact area within these high-permeability regions. As wormhole coverage increased from ϕ wh = 3.1% to 5.1%, this effect intensified, leading to improved sweep efficiency around the wormhole vicinity during the second cycle. While the basic micromodel showed only limited improvement in oil recovery by the third cycle, the micromodels with wormholes continued to exhibit enhanced recovery. Longer wormholes facilitated oil mobilization both near their branches and in more distant regions, enabling the recovery of oil that would otherwise remain trapped in the absence of preferential flow pathways.
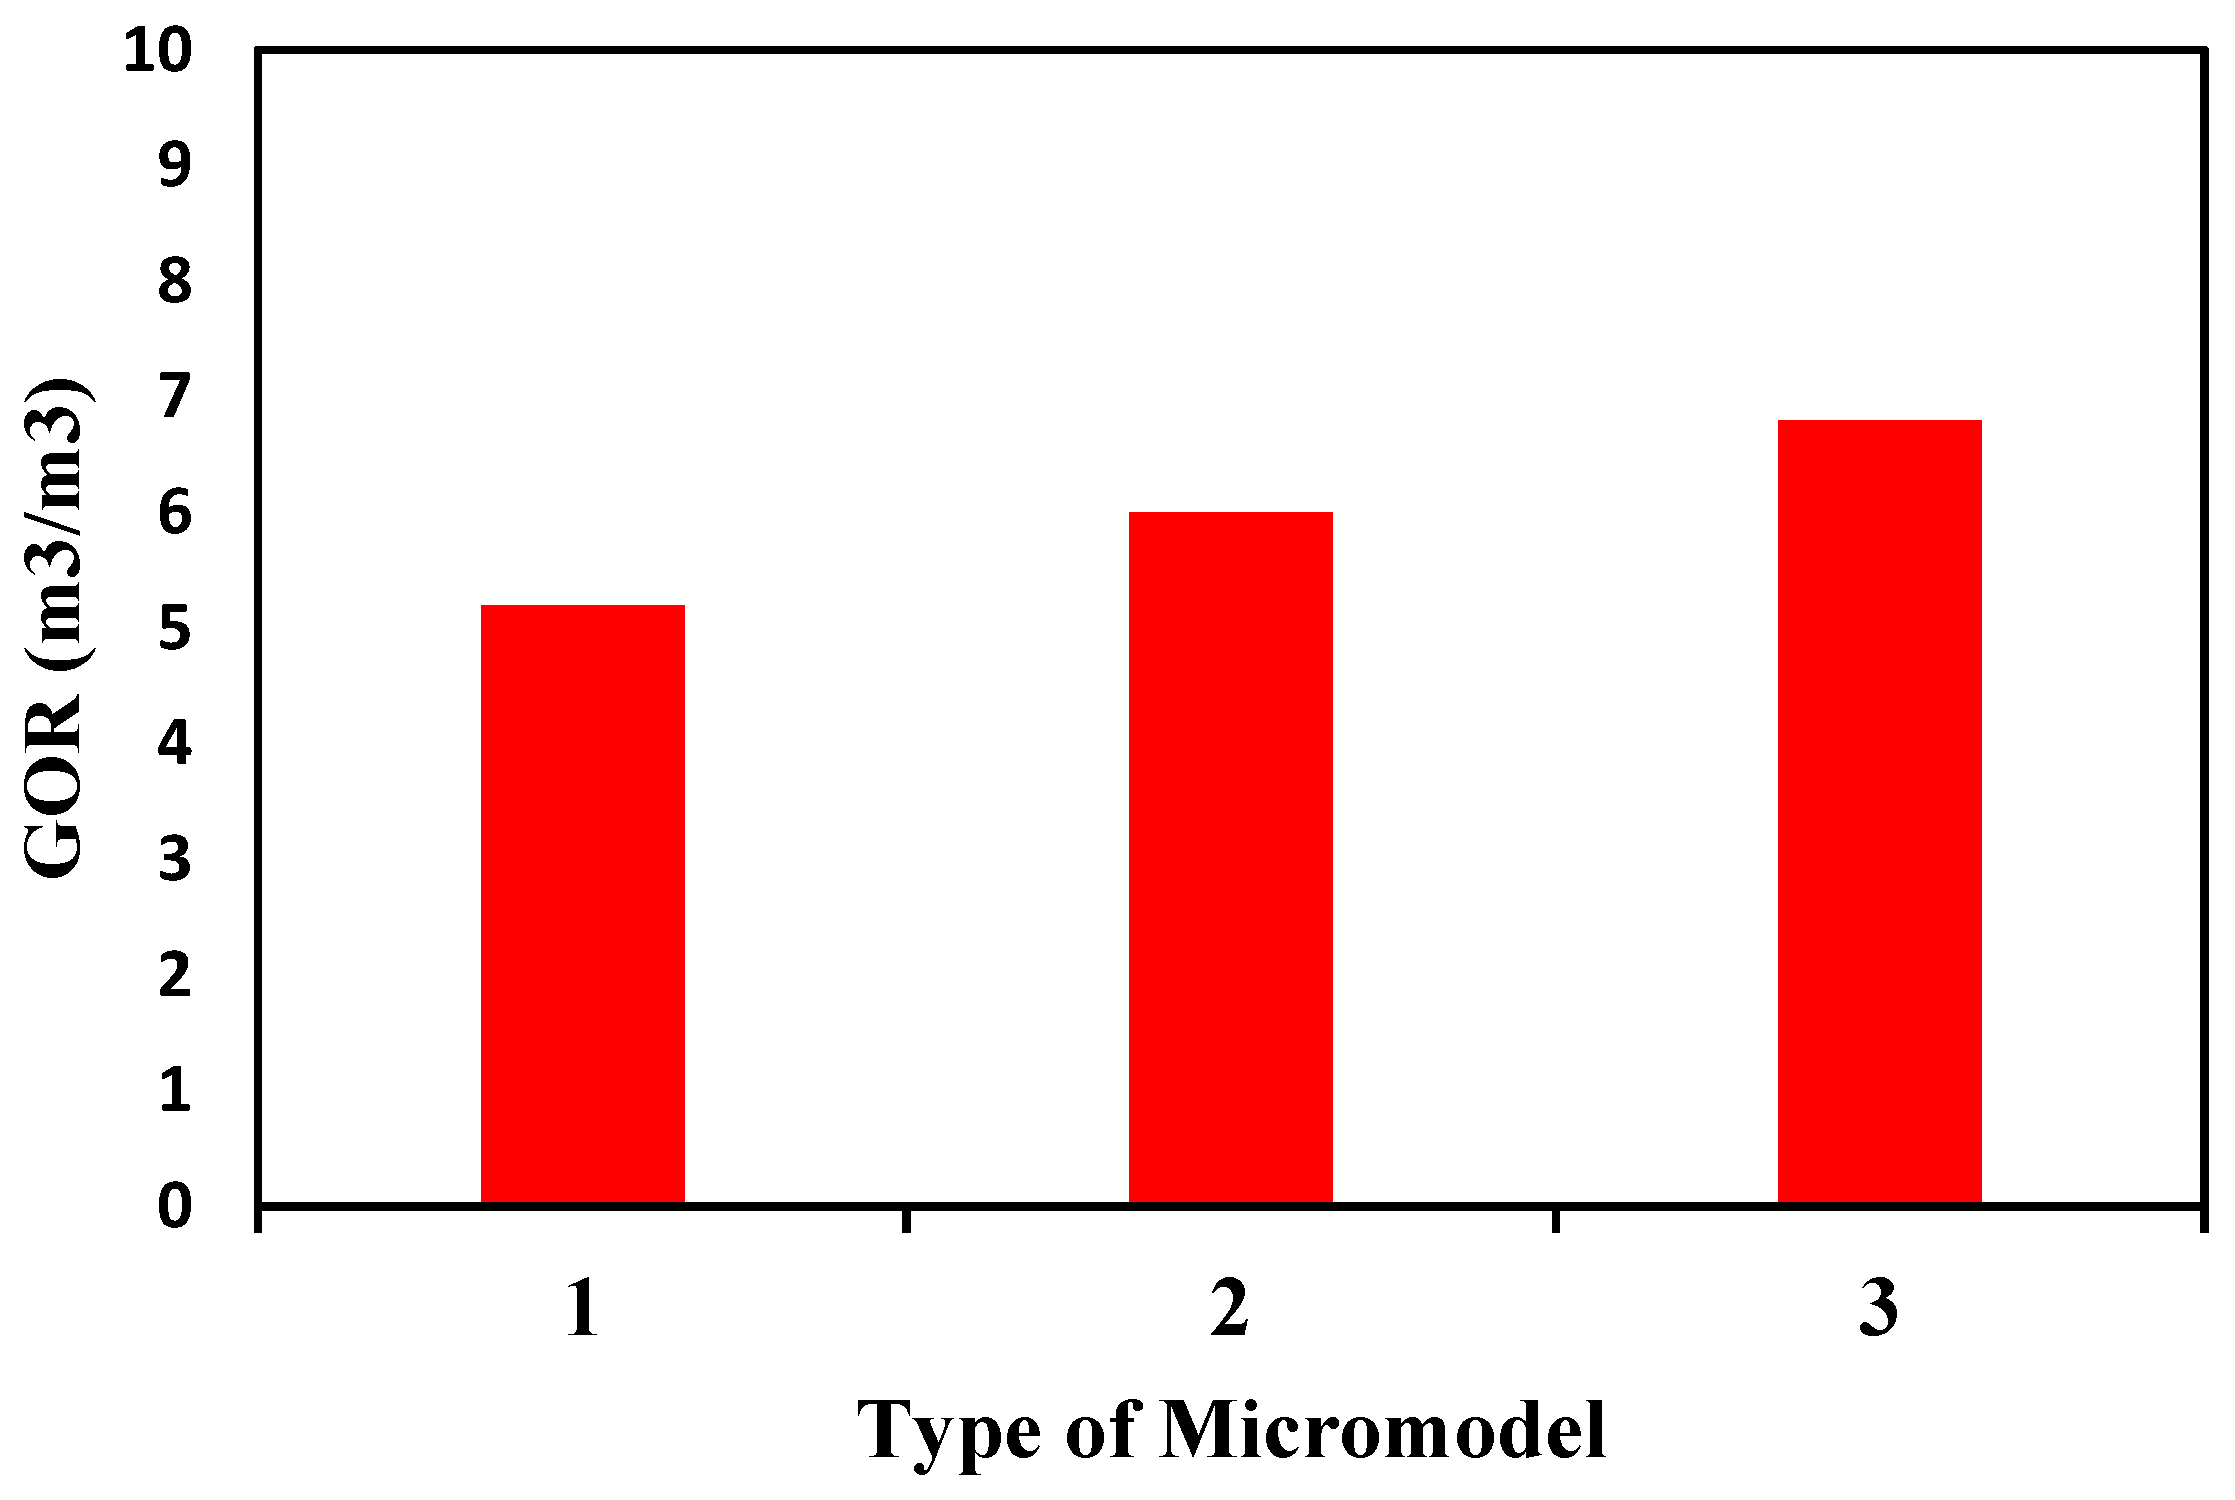
The increase in dissolved GOR with increasing wormhole coverage (
Figure 6) is attributed to enhanced solvent connectivity within the pore network, leading to improved gas–oil interaction in the connected regions. This enhanced interaction promotes foamy oil formation and increases the overall oil recovery factor.
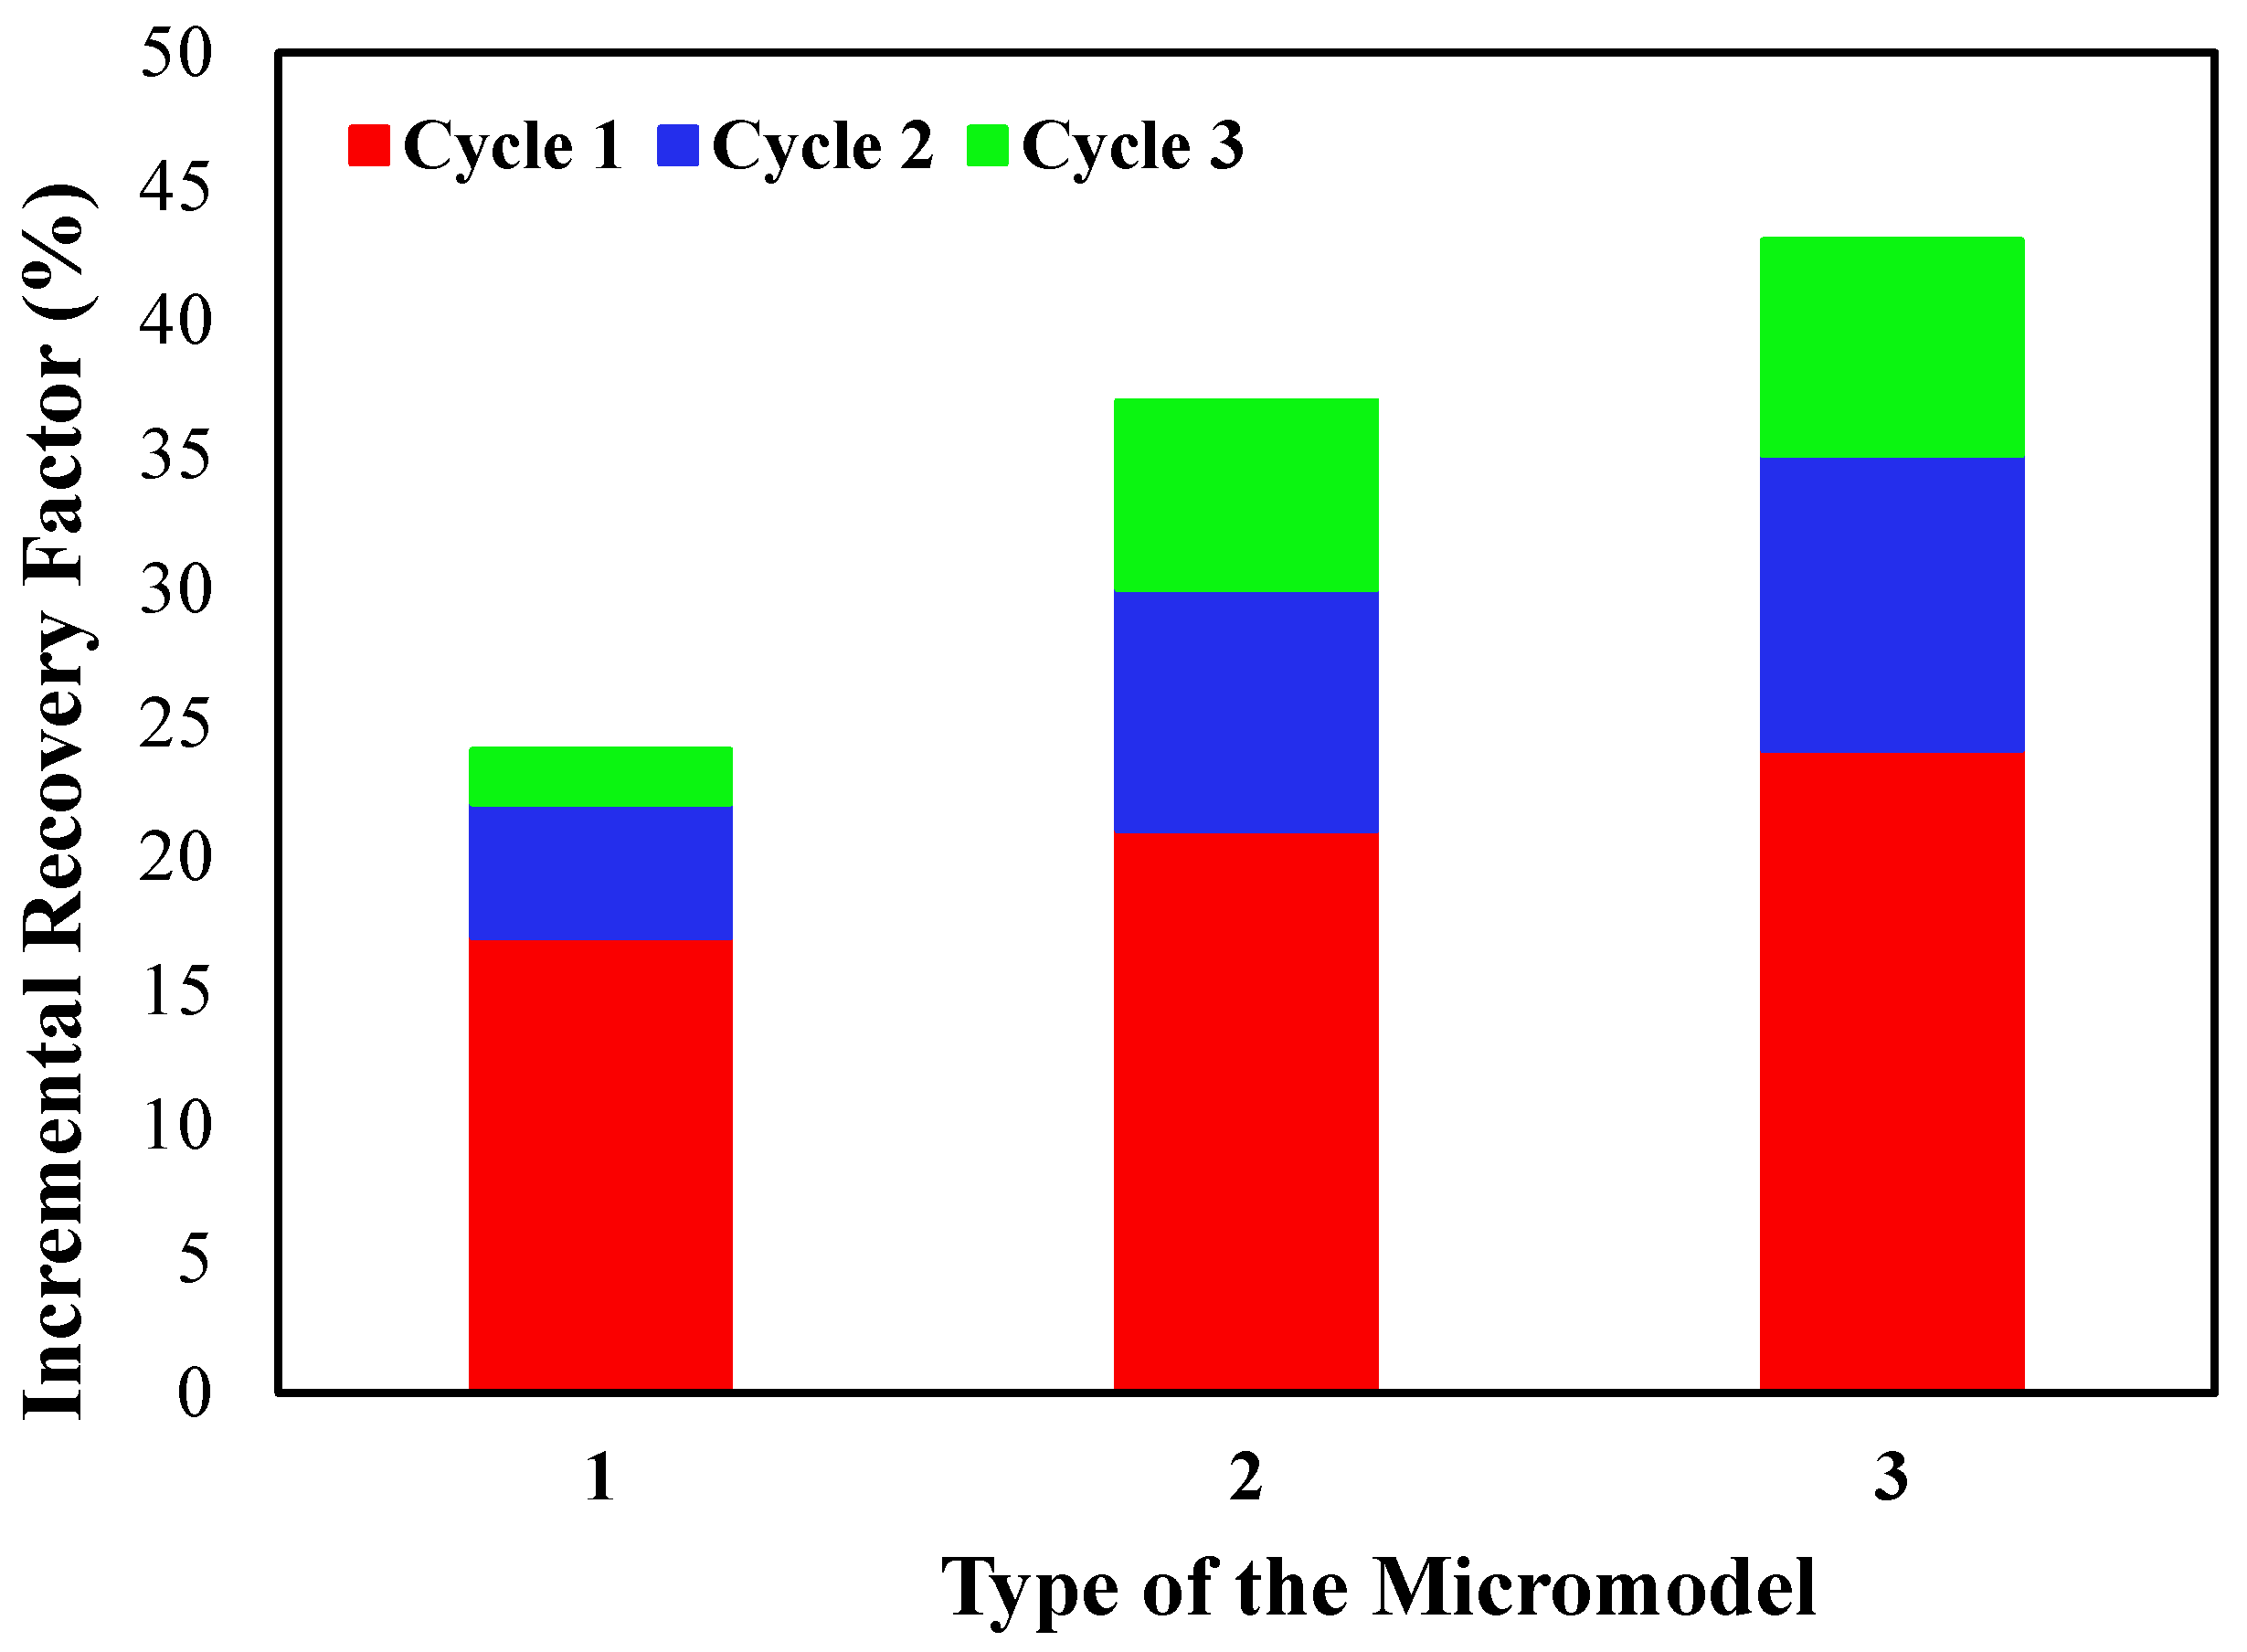
The bar chart in
Figure 7, depicting the recovery factors of the three microfluidic systems across three cycles, reveals an important fact: the recovery factors remain comparable across all three systems initially. With values of 17% for Micromodel 1 and 20.5% and 22% for Micromodels 2 and 3, respectively. However, as the number of cycles increases from one to two, and then to three, the difference in recovery factors becomes more pronounced. This gap peaked after the third cycle, demonstrating the effects of wormhole coverage on oil recovery across multiple cycles. This is because, in the first cycle, the micromodel was completely saturated with oil, leaving little room for solvent injection (the solvent-injection step). As a result, the wormhole’s contribution to oil production was found to be minimal in the first cycle. However, the dissolved gas–oil ratio (GOR) rose in successive cycles, highlighting the wormhole’s role in increasing oil output.
These results show that wormhole length and coverage strongly influence the extent of oil production during the CSI process. Longer wormholes enhance reservoir connectivity and solvent access as cycles progress, increasing the volume of the pore space that can effectively respond to pressure changes. As a result, while the fundamental recovery mechanisms remain the same, the impact of pressure-depletion strategies becomes increasingly dependent on wormhole length.
3.2. Effect of Pressure Depletion Rate on Oil Behavior During the CSI Process
This section examines the effect of pressure depletion rate on oil production behavior during the CSI process in the presence of extended wormhole networks. Rather than treating pressure-depletion rate as an independent operational parameter, the analysis focuses on how depletion-driven recovery mechanisms are conditioned by wormhole length and the associated reservoir connectivity. Experiments were conducted using the micromodel with the longest wormhole configuration to isolate the influence of depletion rate under conditions of enhanced solvent access and pressure communication. The discussion integrates macroscopic recovery trends with pore-scale observations to clarify how pressure depletion becomes increasingly effective as wormhole-controlled connectivity evolves over successive cycles.
3.2.1. Macroscopic Behavior
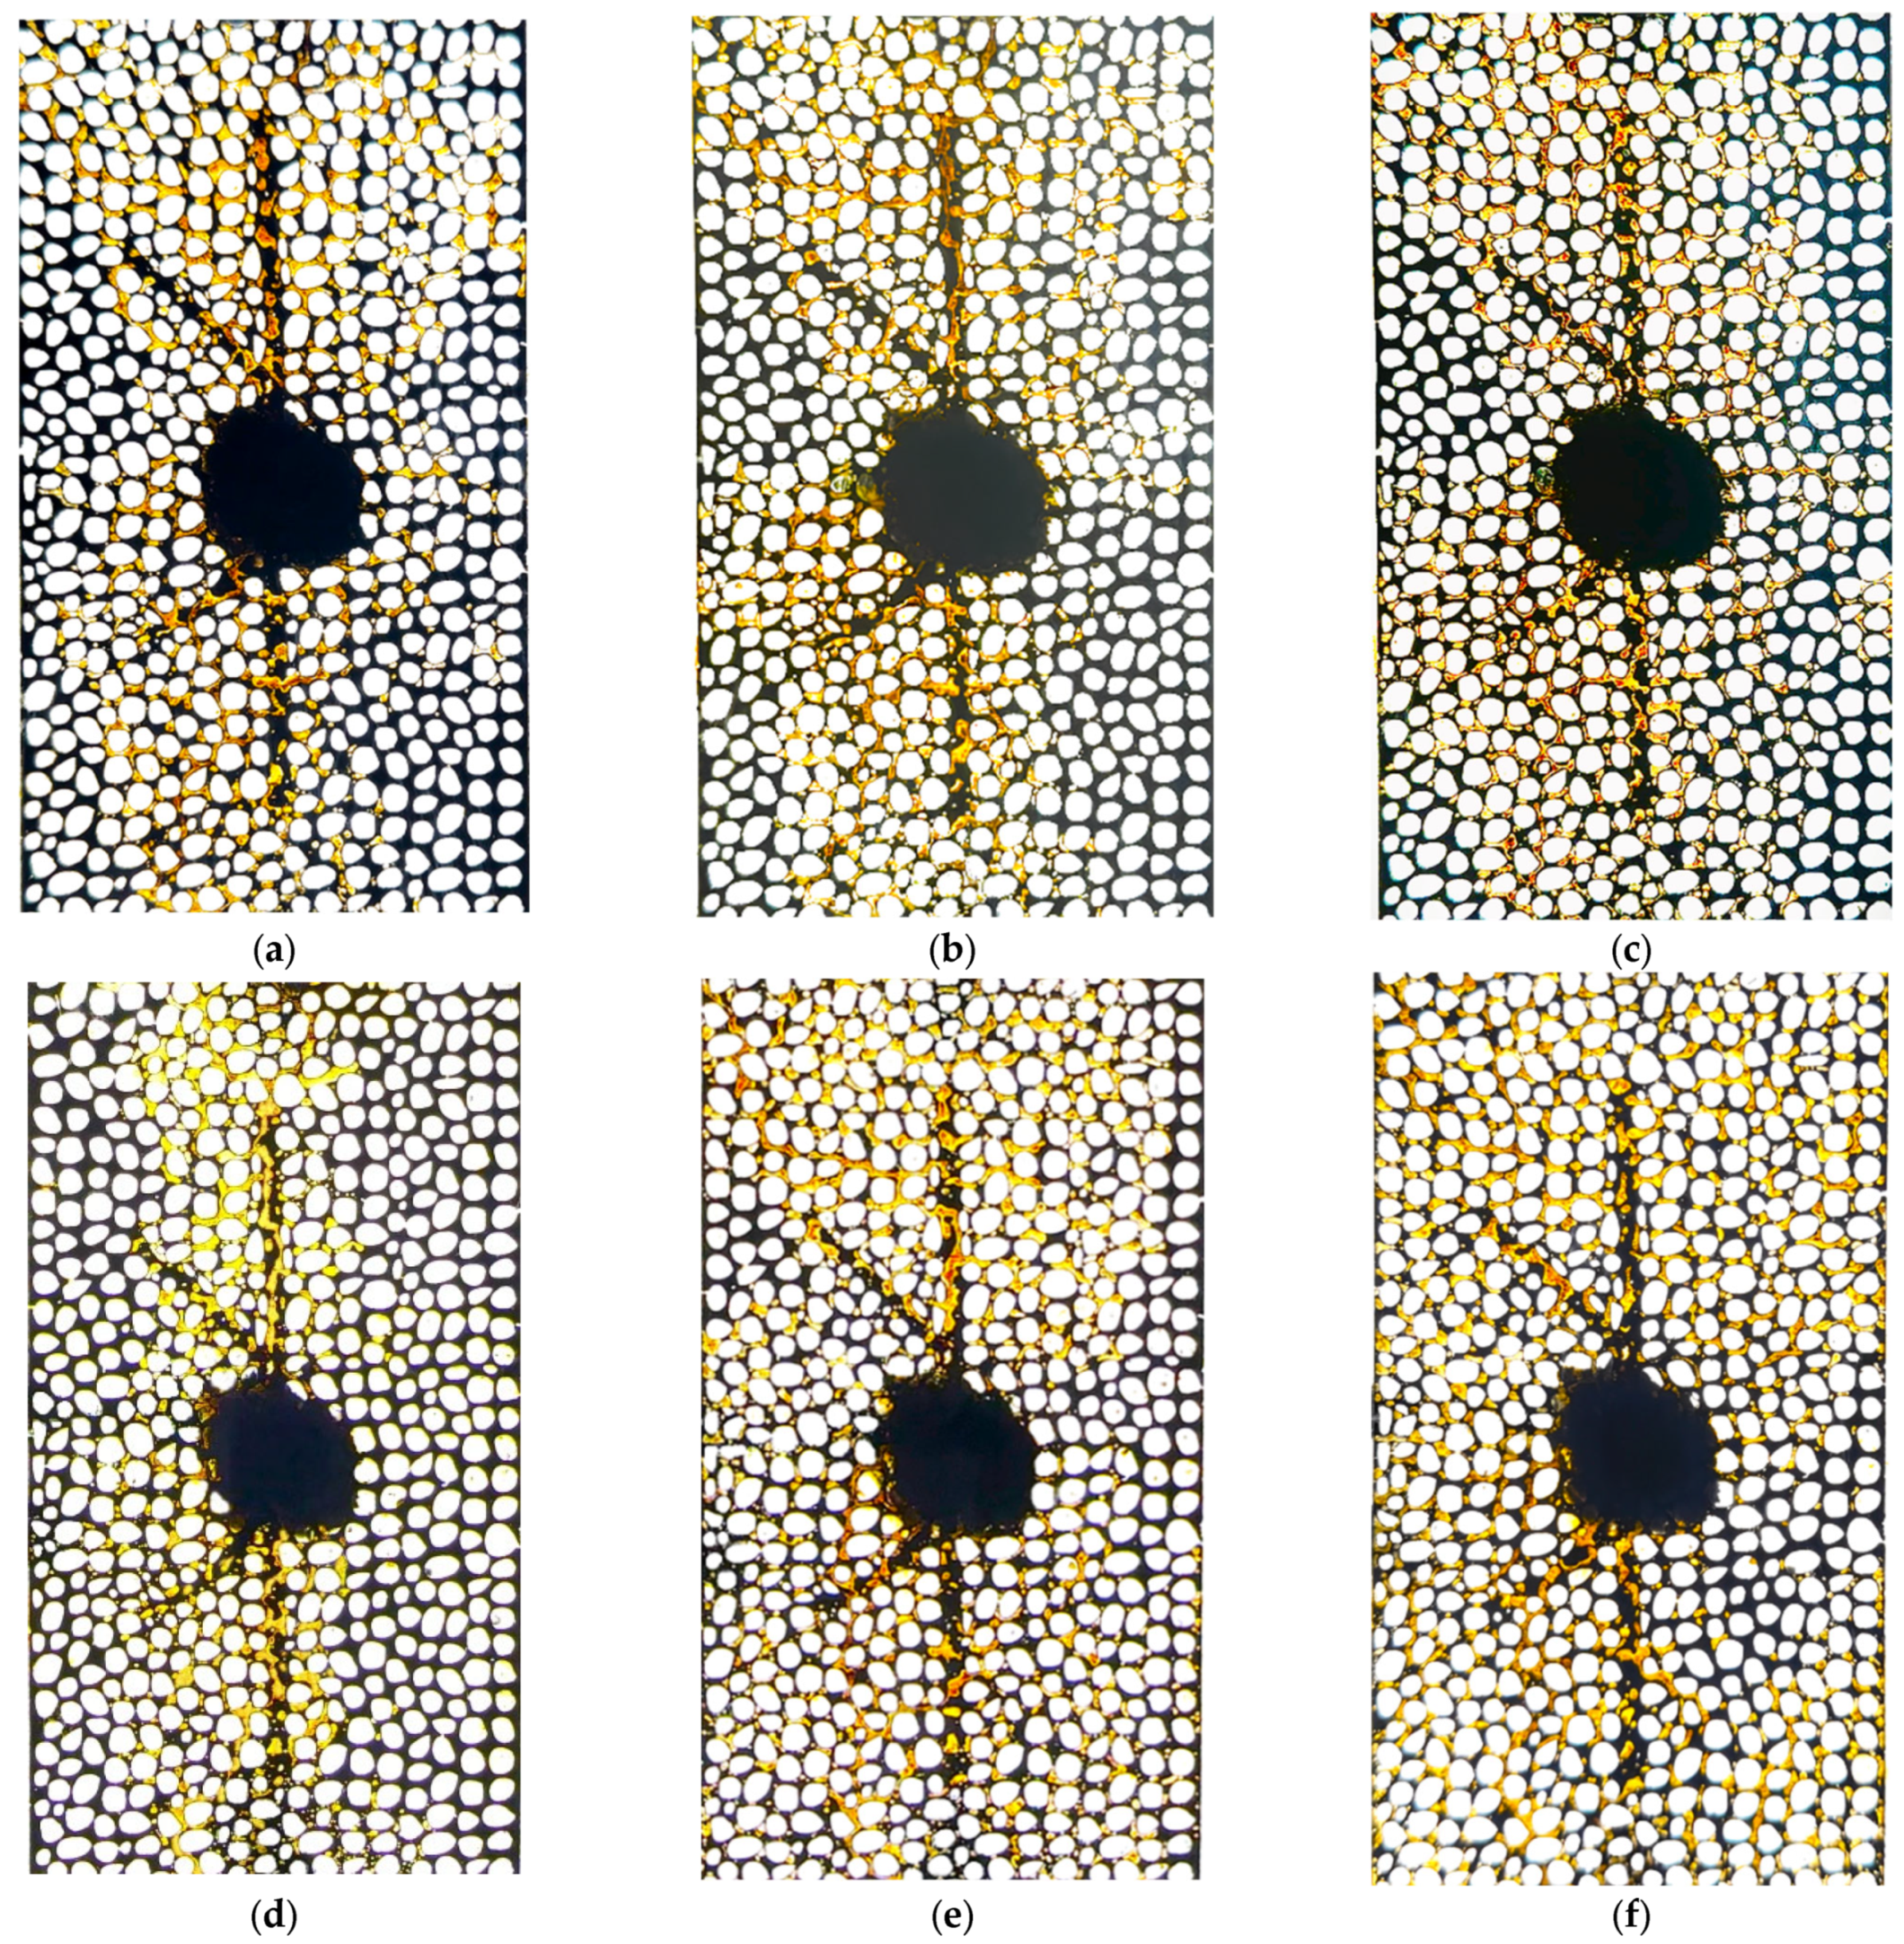
Figure 8 compares macroscopic oil production at two fixed pressure-depletion rates, of 4 kPa/min and 12 kPa/min, using Micromodel 3 with long-branch wormholes.
At the lower depletion rate of 4 kPa/min, oil production during the first cycle was relatively extensive and occurred mainly along the high-permeability wormhole pathway (
Figure 8a). As the experiment proceeded into the second and third cycles, oil production gradually expanded beyond the initially produced region, as shown in
Figure 8b,c. In contrast, oil production during the first cycle at the higher depletion rate of 12 kPa/min was more limited (
Figure 8d). However, oil recovery increased markedly in the subsequent cycles, with a clear expansion of the produced-oil region during the second and third cycles (
Figure 8e,f).
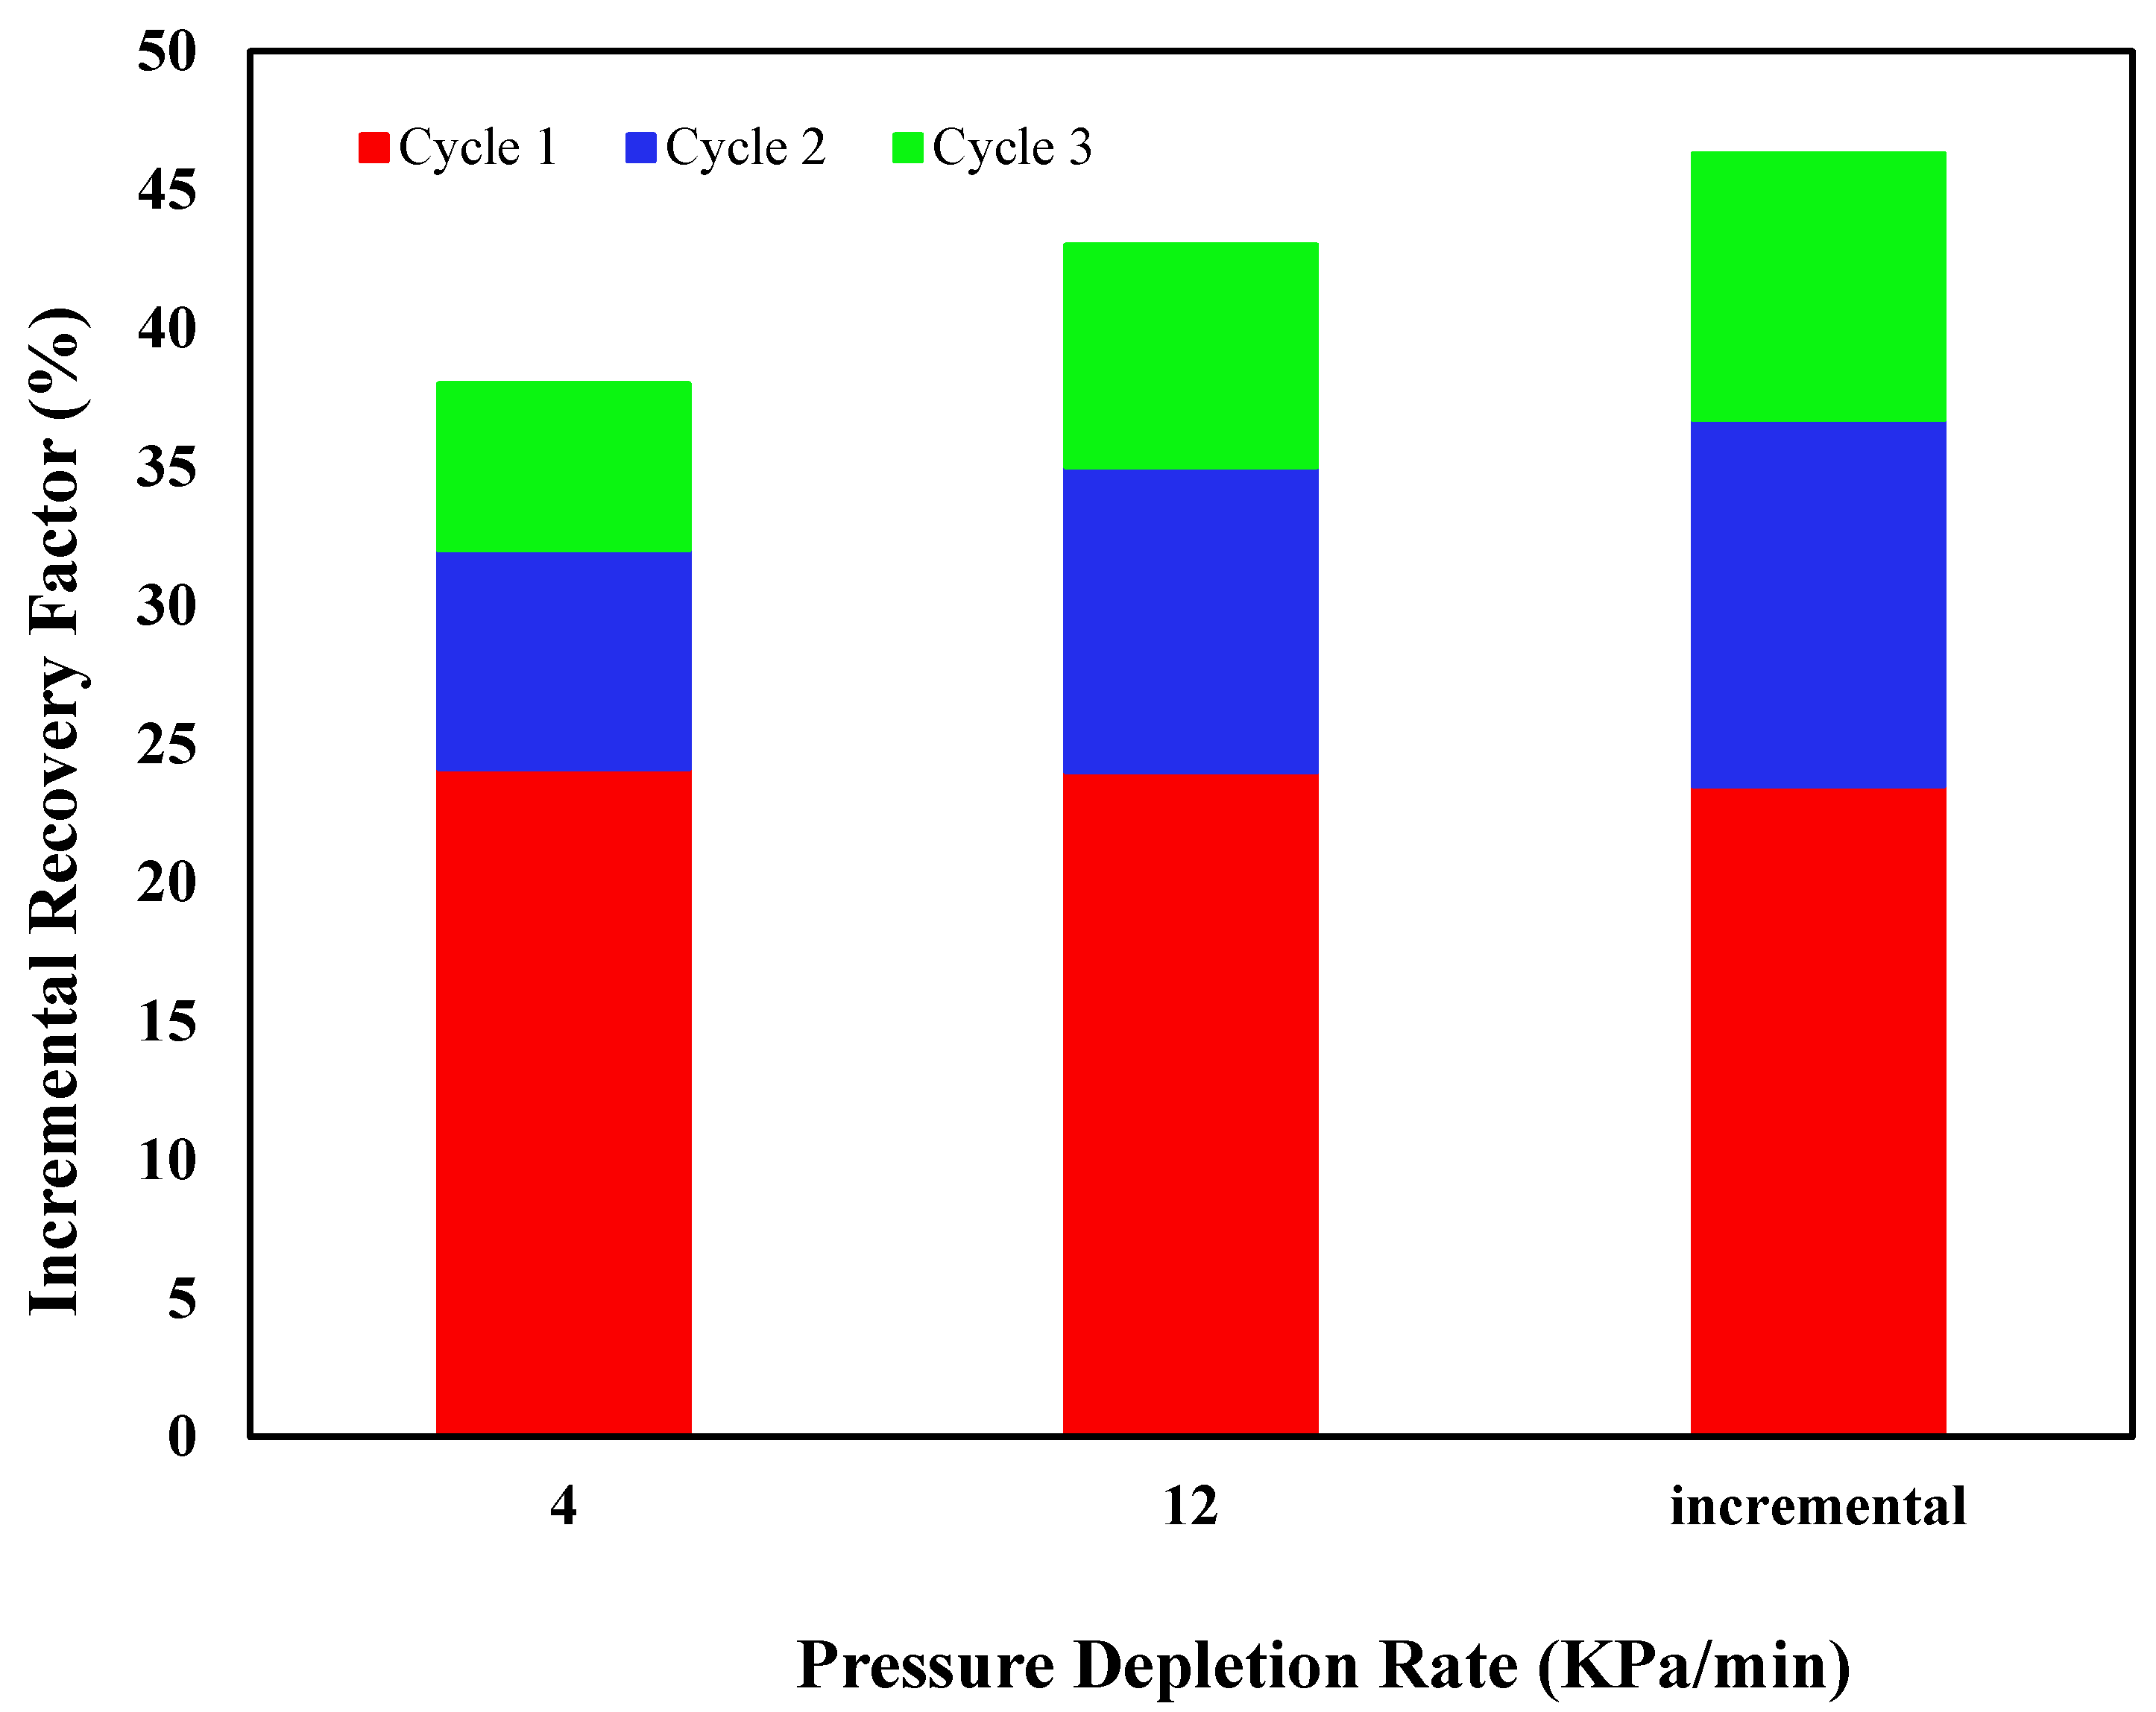
Figure 9 presents the total recovery factor over three cycles for two fixed pressure-depletion rates of 4 kPa/min and 12 kPa/min. After the first cycle, the lower depletion rate (4 kPa/min) resulted in a higher recovery factor, reaching 24% of the original oil in the micromodel. Recovery under this condition increased to 32% after the second cycle. In contrast, recovery at the higher depletion rate (12 kPa/min) was lower after the first cycle (22%) but increased more rapidly in subsequent cycles, reaching 34% after the second cycle. As a result, although the lower depletion rate performed better initially, the higher depletion rate ultimately yielded a greater cumulative recovery after three cycles, with a total recovery factor of 41%.
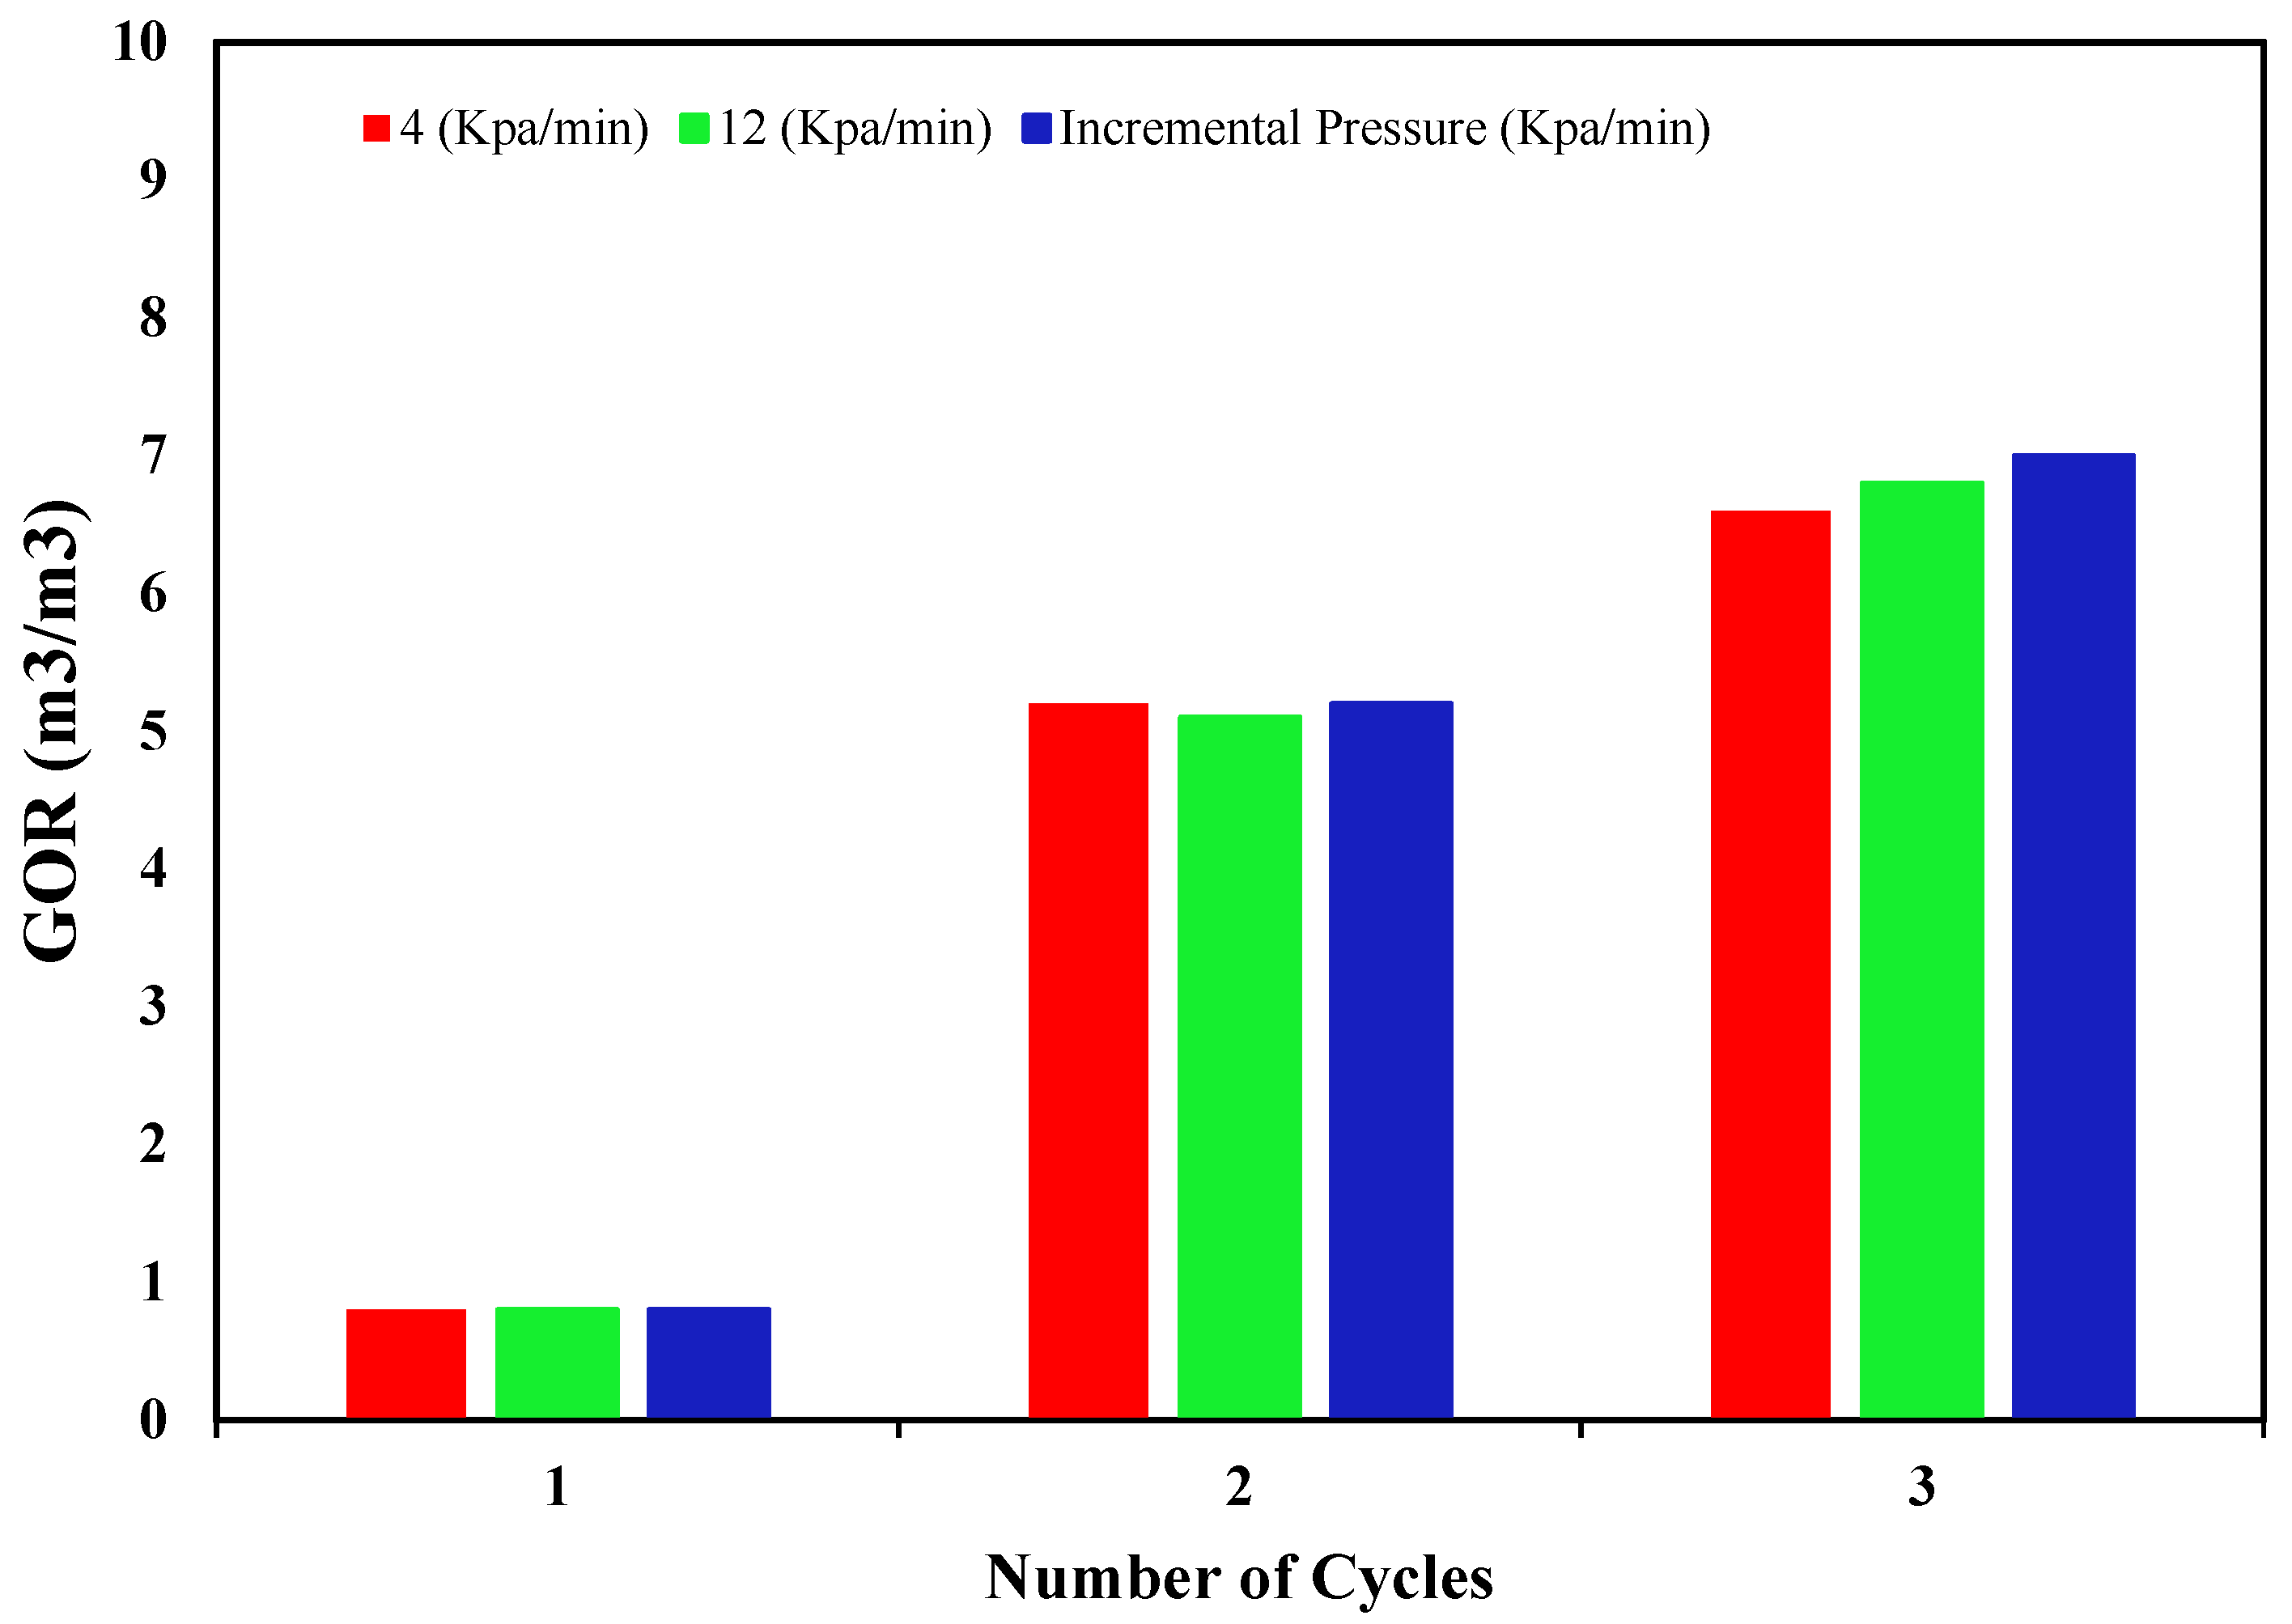
To better understand why the higher depletion rate becomes more effective in later cycles, the evolution of the gas–oil ratio (GOR) is examined in
Figure 10. In the first cycle, the micromodel is fully saturated with oil, leaving little pore space for solvent accumulation. As a result, the dissolved GOR remains relatively low, and foamy oil behavior is not the dominant recovery mechanism. During the second cycle, the lower depletion is associated with a slightly higher GOR, likely due to the larger volume produced in the first cycle and the resulting increase in available pore space for gas accumulation. Despite this higher GOR, oil recovery under the lower depletion rate remains limited. In contrast, the higher depletion rate leads to more effective oil mobilization, even though the measured GOR is slightly lower. This suggests that GOR alone is insufficient as an indicator of recovery performance. Instead, the pressure-depletion rate appears to play a key role in promoting foamy oil behavior by controlling the rate at which dissolved gas is released and contributes to an effective driving force for oil production.
This behavior can be described as the system initially being fully saturated with dead oil during the first cycle, leaving minimal accessible space for solvent injection. Under these conditions, only a limited amount of gas could effectively diffuse within the oil phase. At this initial stage, oil production was therefore mainly driven by the imposed pressure gradient. In other words, gas did not play a significant role in foamy oil generation during the first cycle and, as a result, contributed only marginally to oil production. This elucidates why oil recovery was comparatively minimal in the initial cycle, compared to later cycles, during which solvent and gas molecules had greater surface area for interaction, resulting in a more efficient recovery process. According to the capillary pressure formula, Pc = 2 ɤ cos ϕ/r, assuming the parameters ɤ and ϕ remain constant, the pore radius r is larger in the wormhole. The reason for this assumption stems from the fact that experiments were conducted in an oil–gas system without a water phase, and the micromodel was fully saturated with oil before testing. Under these conditions, the system can be considered effectively oil–wet, and the influence of wettability is expected to be less significant compared to multiphase systems. However, the surface chemistry of glass differs from the mineral composition of reservoir rocks, potentially affecting fluid–solid interactions and capillary behavior. Therefore, this difference should be considered as a limitation when extrapolating the micromodel observations to reservoir conditions. Initially, production occurred from the wormhole area, with less resistance and lower capillary pressure. Over time, oil from smaller pores around the wormhole, where capillary pressure is higher, began to be produced. A higher-pressure depletion rate (12 kPa/min) resulted in shorter cycle durations and higher superficial velocities. This left oil in smaller pores unrecovered, with production mainly occurring from the wormhole, where capillary pressure was lower.
3.2.2. Microscopic Behavior
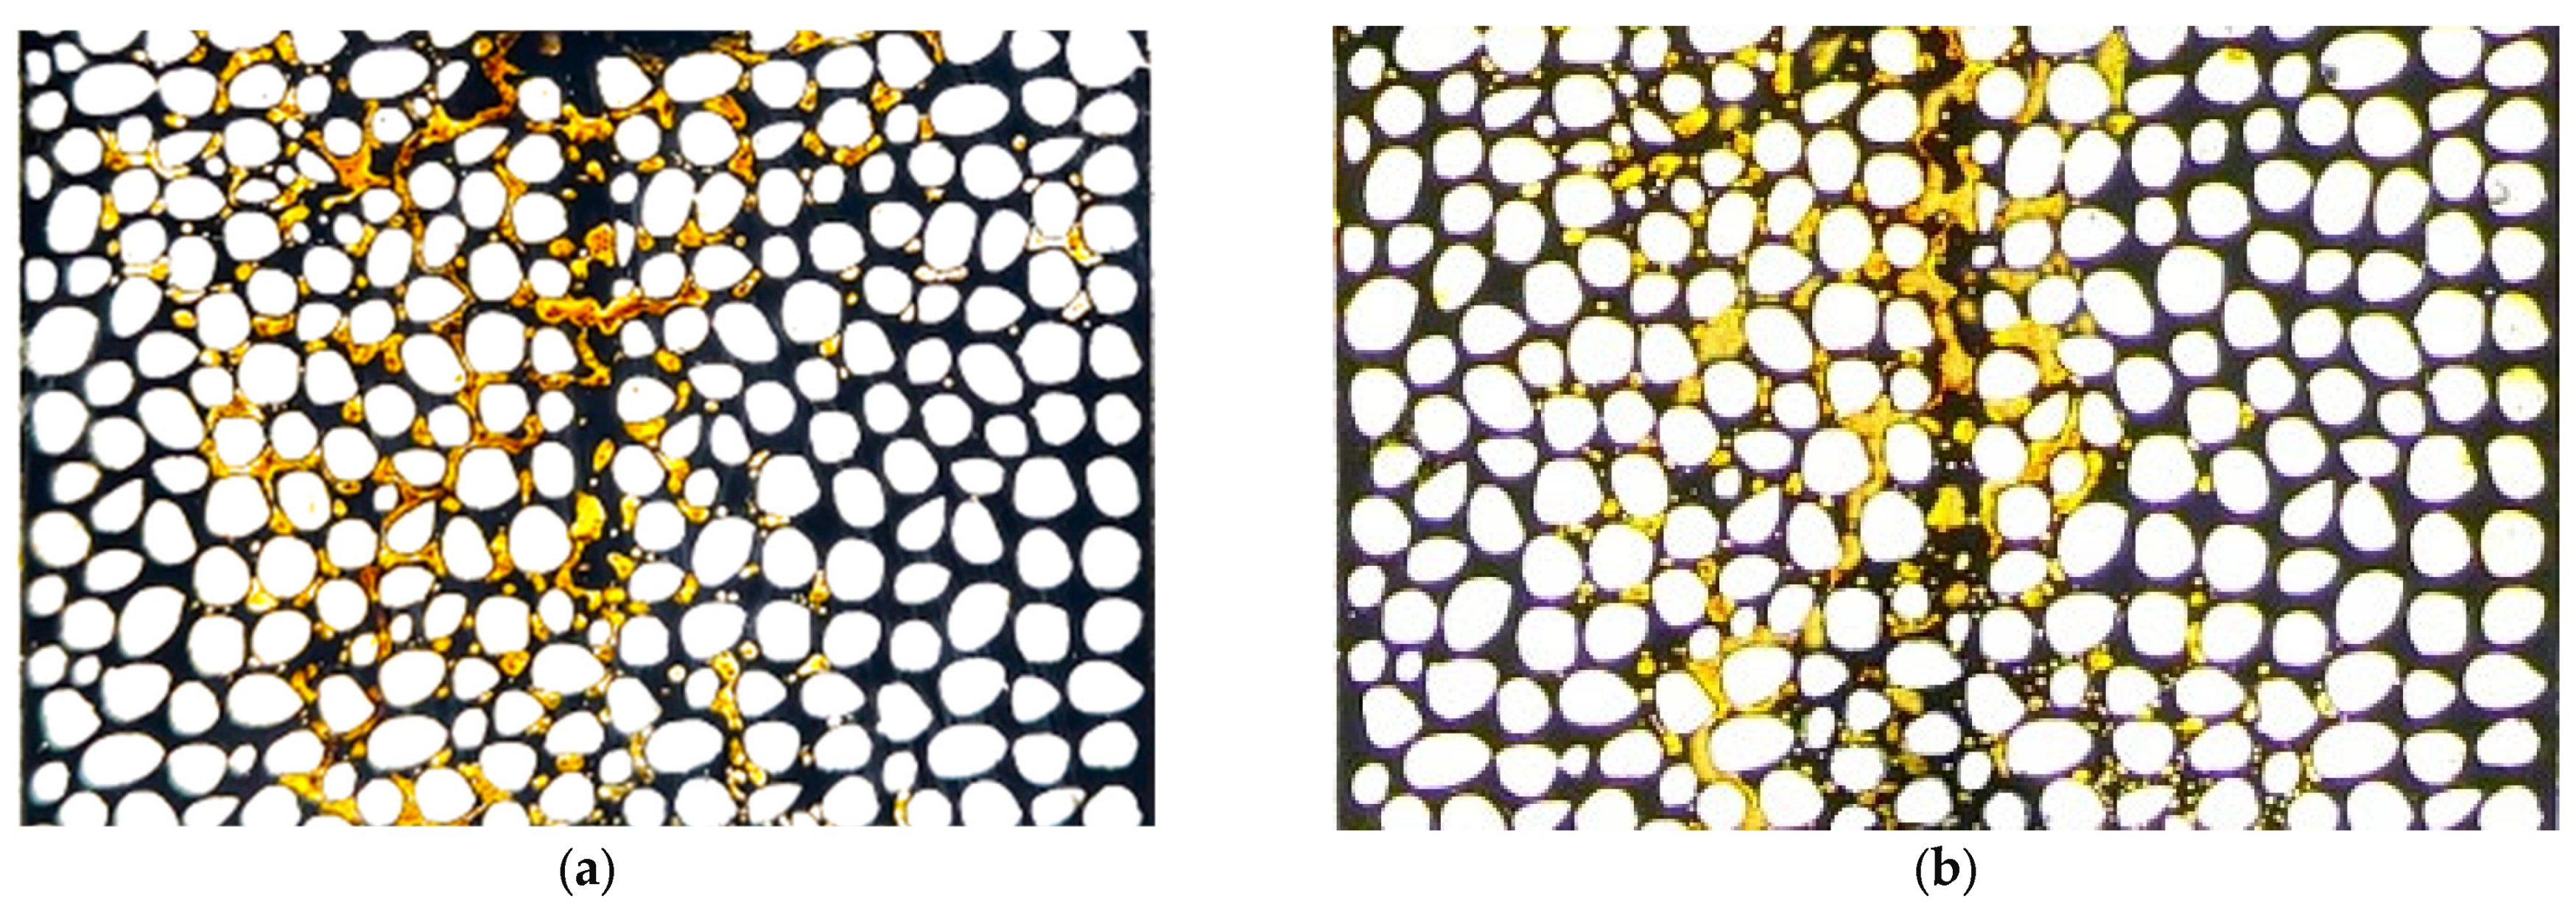
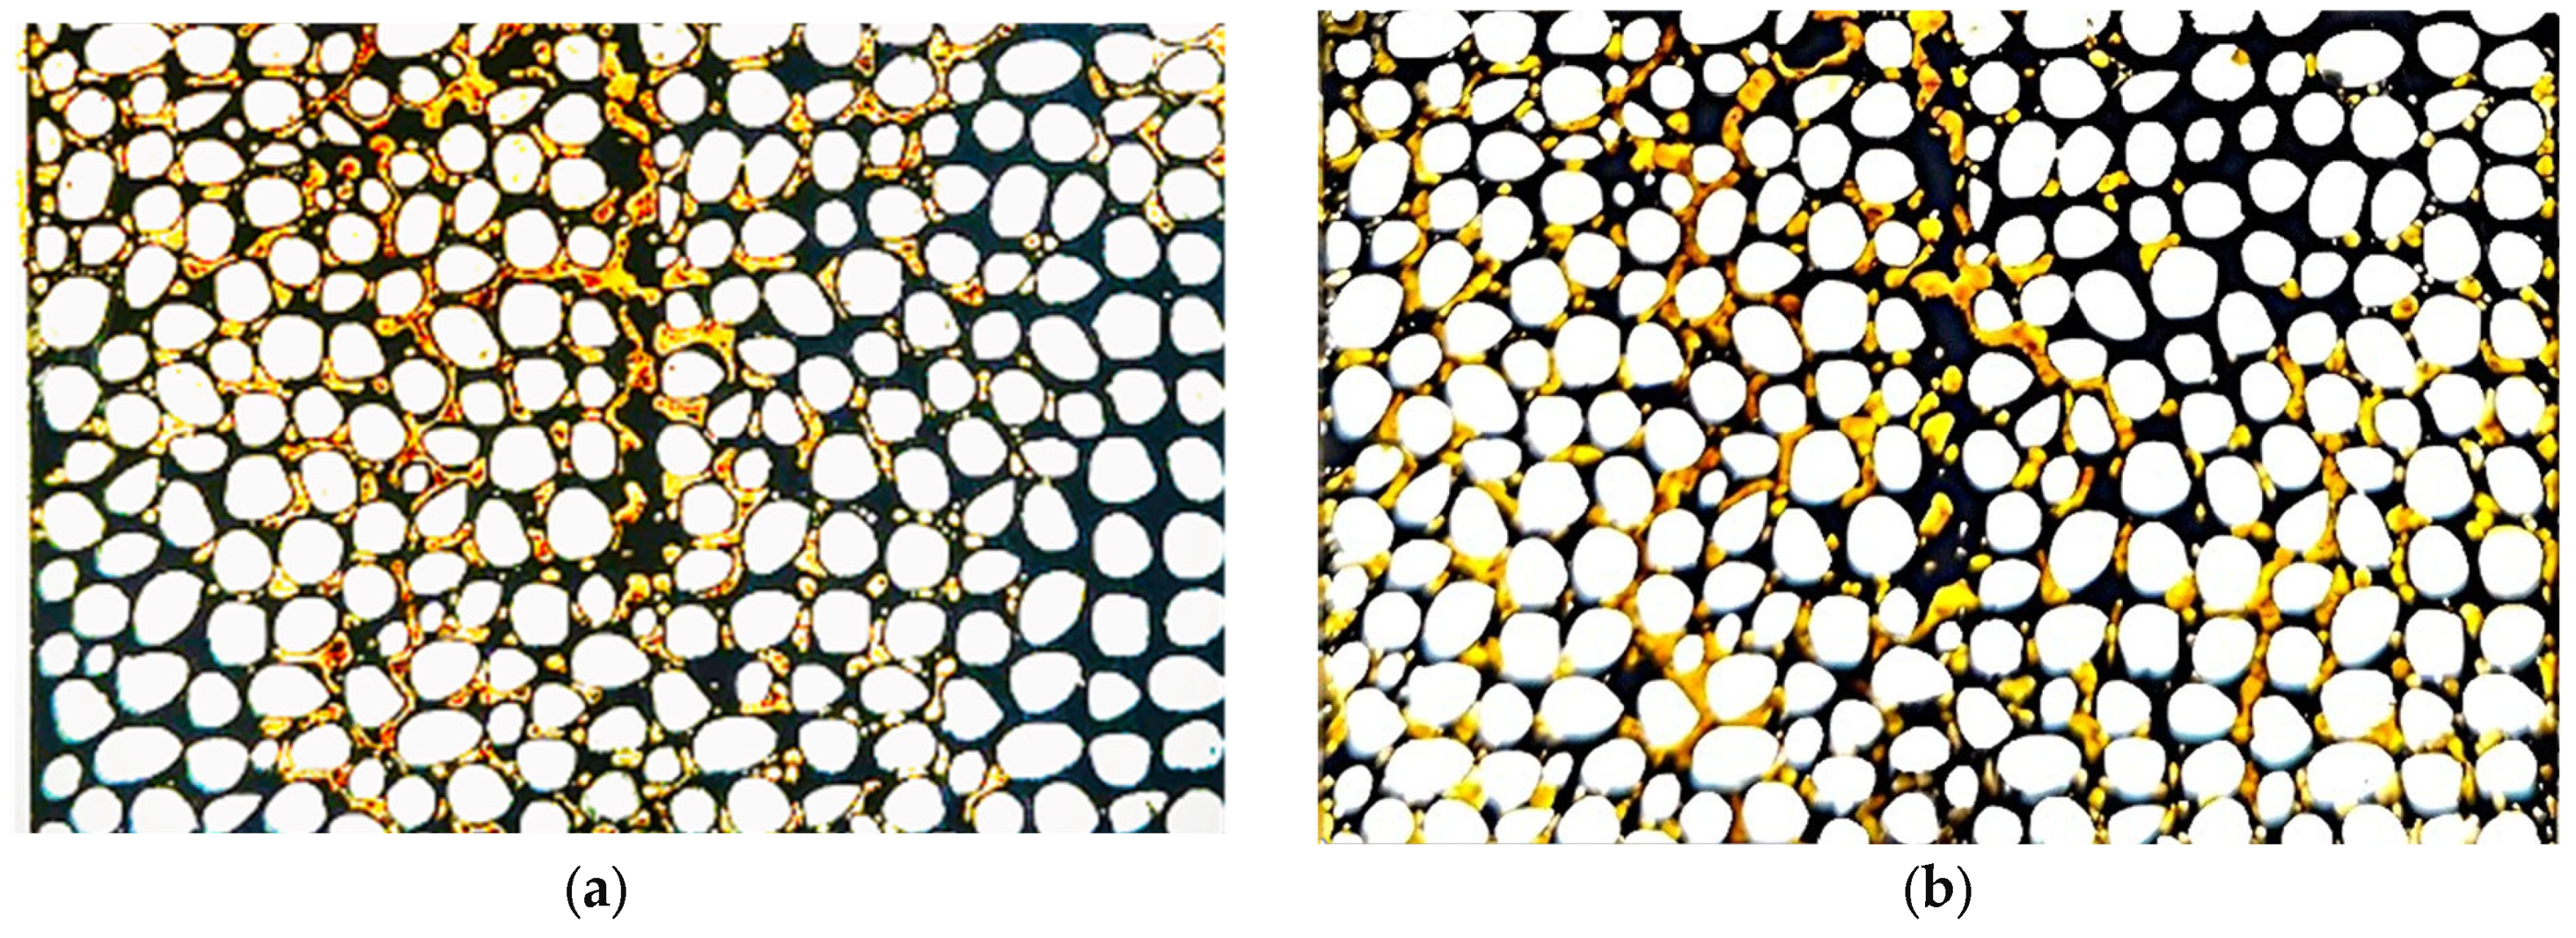
Microscopic observations after the first CSI cycle reveal clear differences in oil-displacement behavior under the two pressure-depletion rates, as shown in
Figure 11.
At the lower depletion rate of 4 kPa/min (
Figure 11a), more trapped oil was recovered from smaller pores because the system had more time to overcome the higher capillary pressure in these pores. In contrast, under the higher depletion rate of 12 kPa/min (
Figure 11b), the rapid pressure declines increased viscous forces, limiting oil mobilization from smaller pores where capillary pressure remained dominant. As a result, a larger fraction of oil remained trapped outside the main high-permeability pathways during the first cycle.
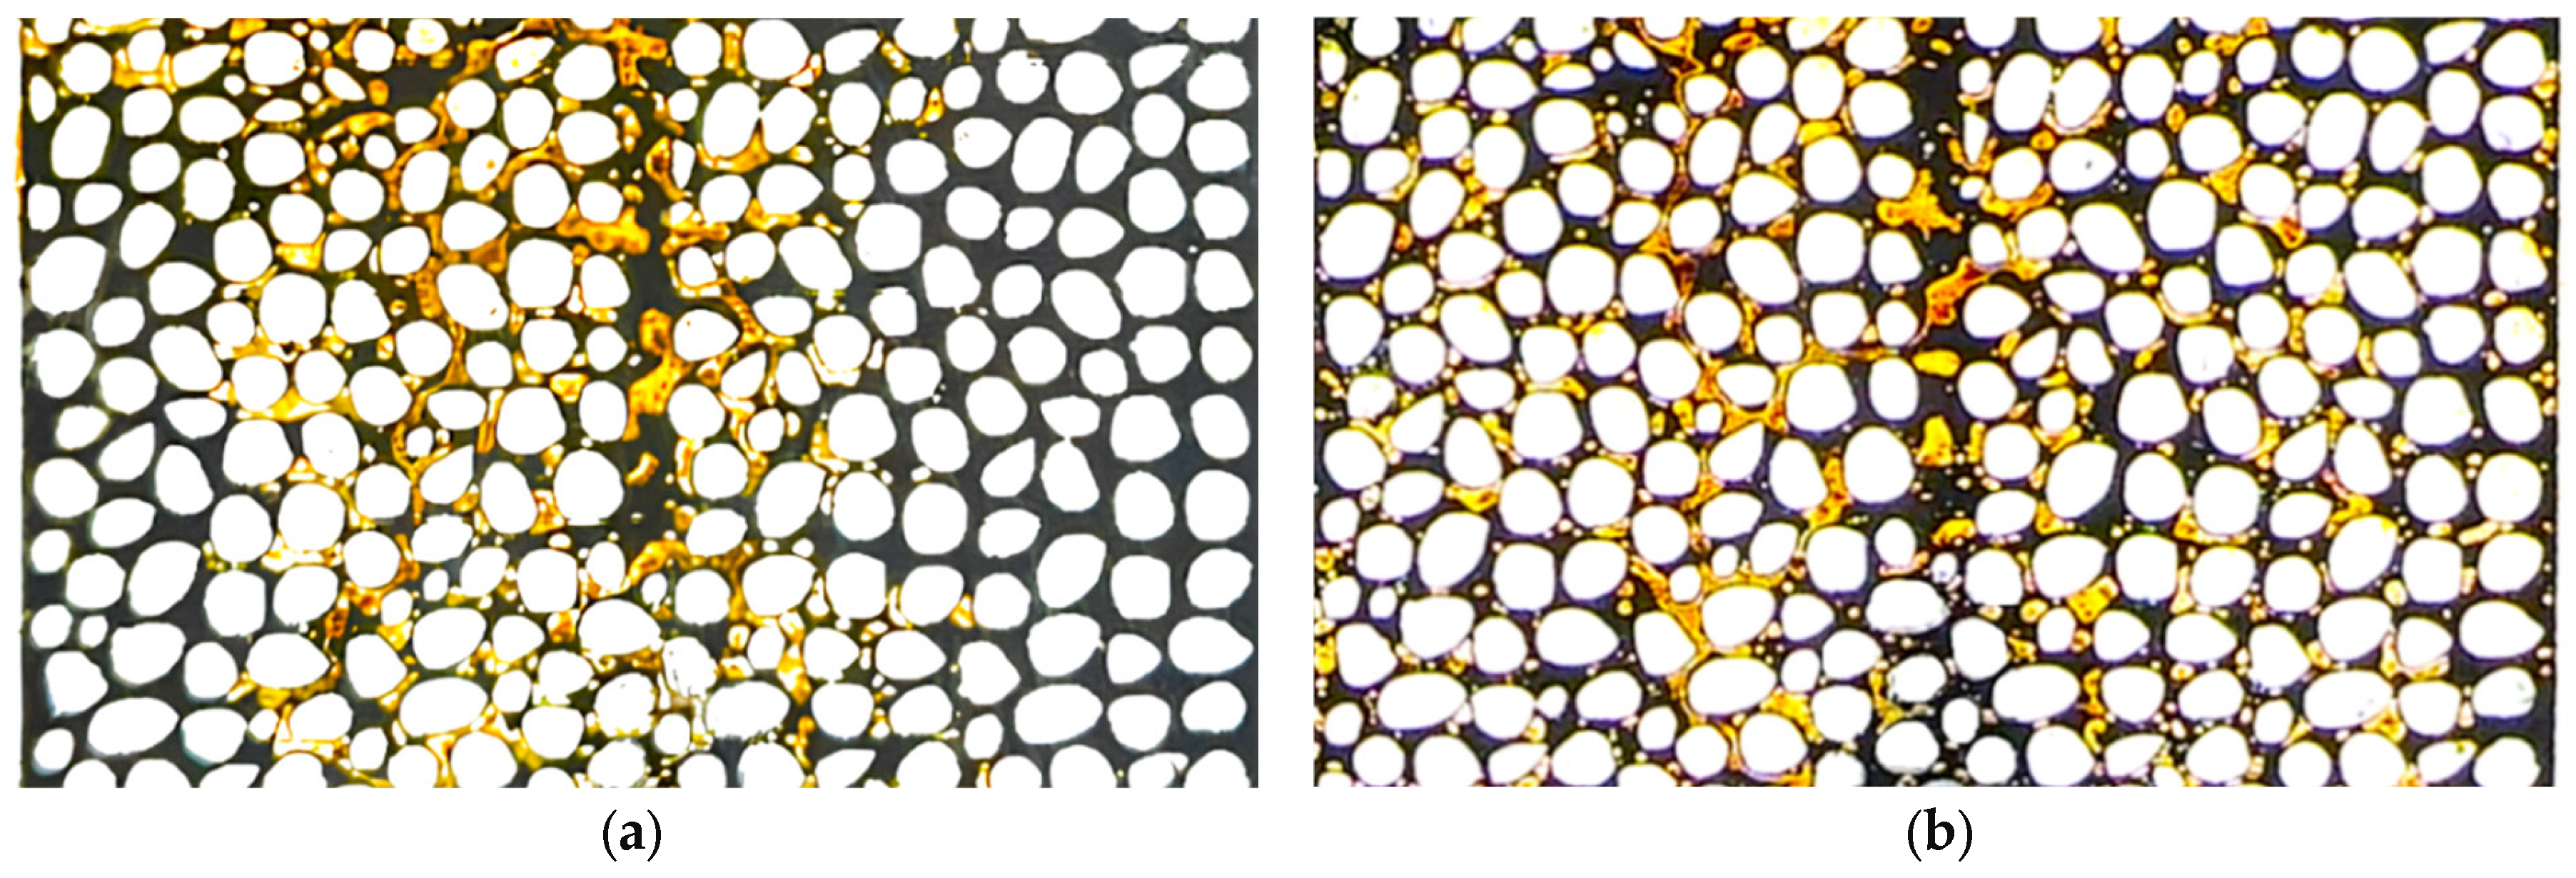
Microscopic images obtained after the second CSI cycle reveal a shift in the dominant recovery behavior with different pressure-depletion rates, as shown in
Figure 12. Compared to the first cycle, additional pore space became available for solvent injections due to prior oil production, allowing greater solvent dissolution during the soaking period. At the lower pressure depletion rate of 4 kPa/min (
Figure 12a), oil trapping in smaller pores remained largely unchanged, indicating limited additional mobilization beyond the first cycle. In contrast, at the higher depletion rate of 12 kPa/min (
Figure 12b), a noticeable reduction in trapped oil was observed. This difference is associated with a clear increase in the relative area occupied by dispersed gas (foamy oil) at the higher depletion rate, where fine gas bubbles are more uniformly distributed throughout the produced region. At the higher depletion rate, enhanced gas nucleation and foamy oil formation were observed, improving oil mobility and allowing oil to be recovered from regions that remained inaccessible during the first cycle.
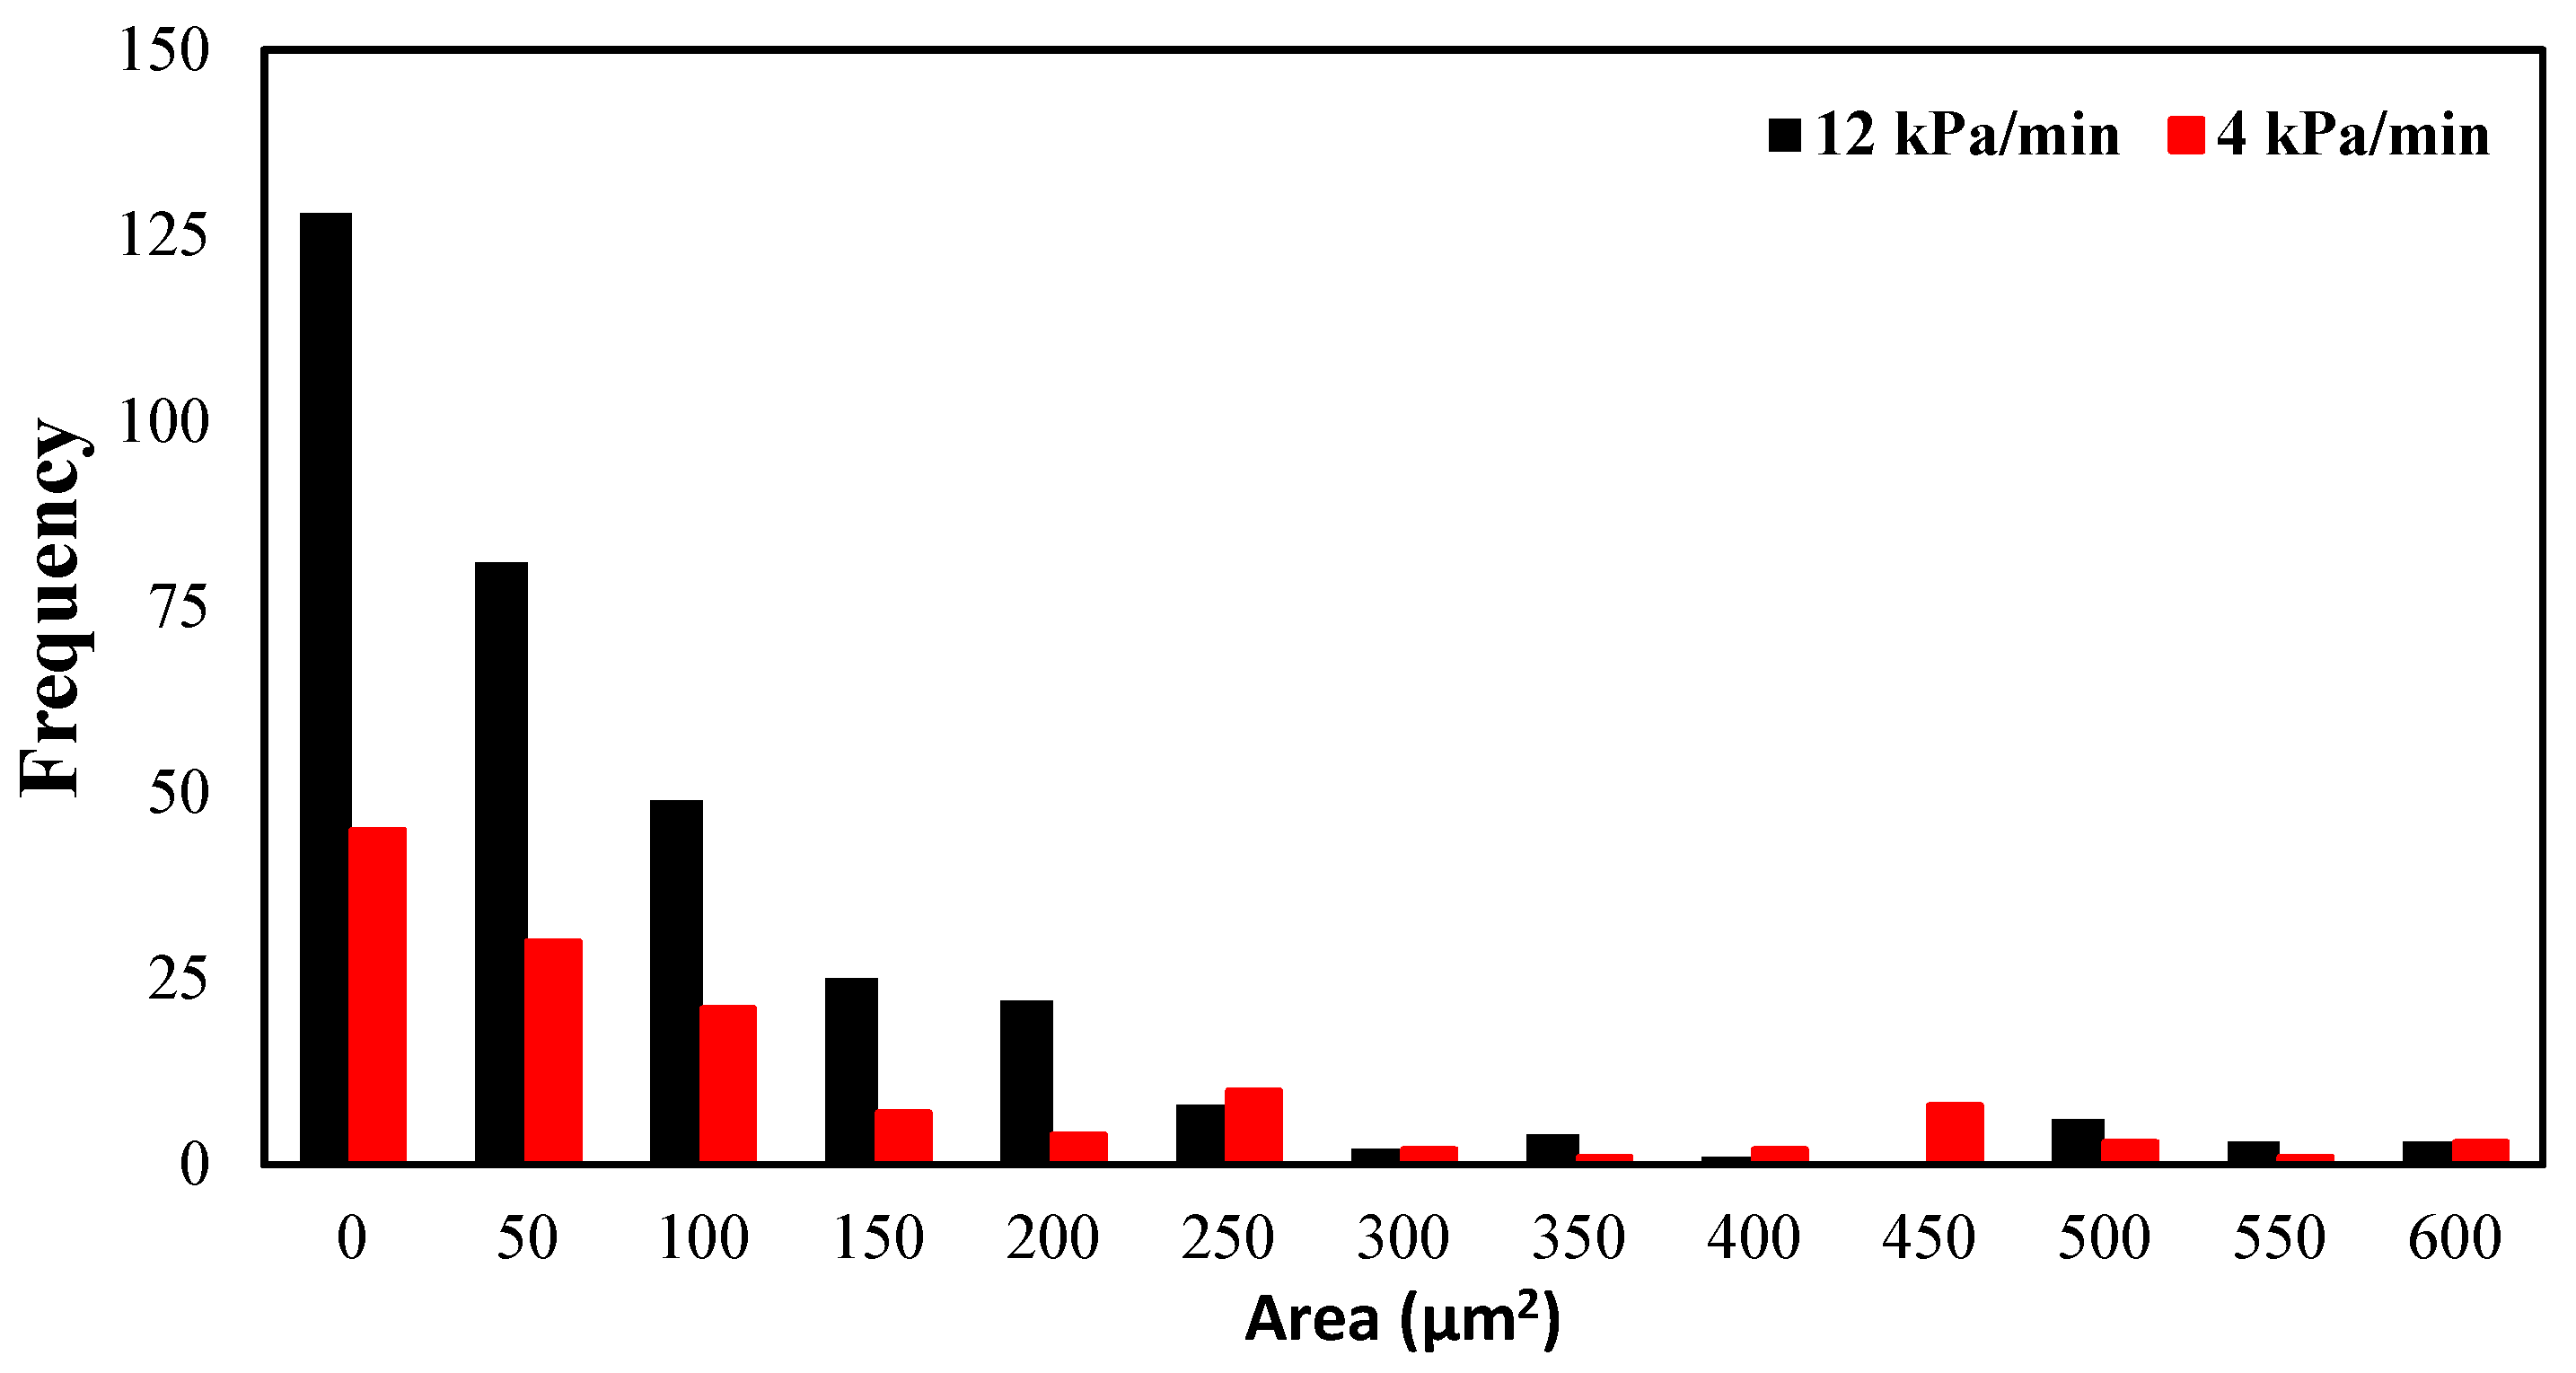
Figure 13 compares the frequency distribution of dispersed gas droplets as a function of droplet area after the second CSI cycle under low (4 kPa/min) and high (12 kPa/min) pressure-depletion rates (corresponding to
Figure 12). At the higher depletion rate, a substantially greater number of droplets is observed across all size classes, suggesting more intensive gas nucleation during pressure drawdown. Moreover, the higher frequency of small droplets extending toward larger droplet areas reflects both widespread nucleation and continued droplet growth. In contrast, the lower depletion rate results in fewer droplets overall and a narrower size distribution, suggesting limited nucleation and weaker foamy oil development. These results quantitatively support the microscopic observations in
Figure 12 and confirm that higher pressure depletion rates promote earlier and stronger activation of foamy oil-assisted oil mobilization during the second cycle.
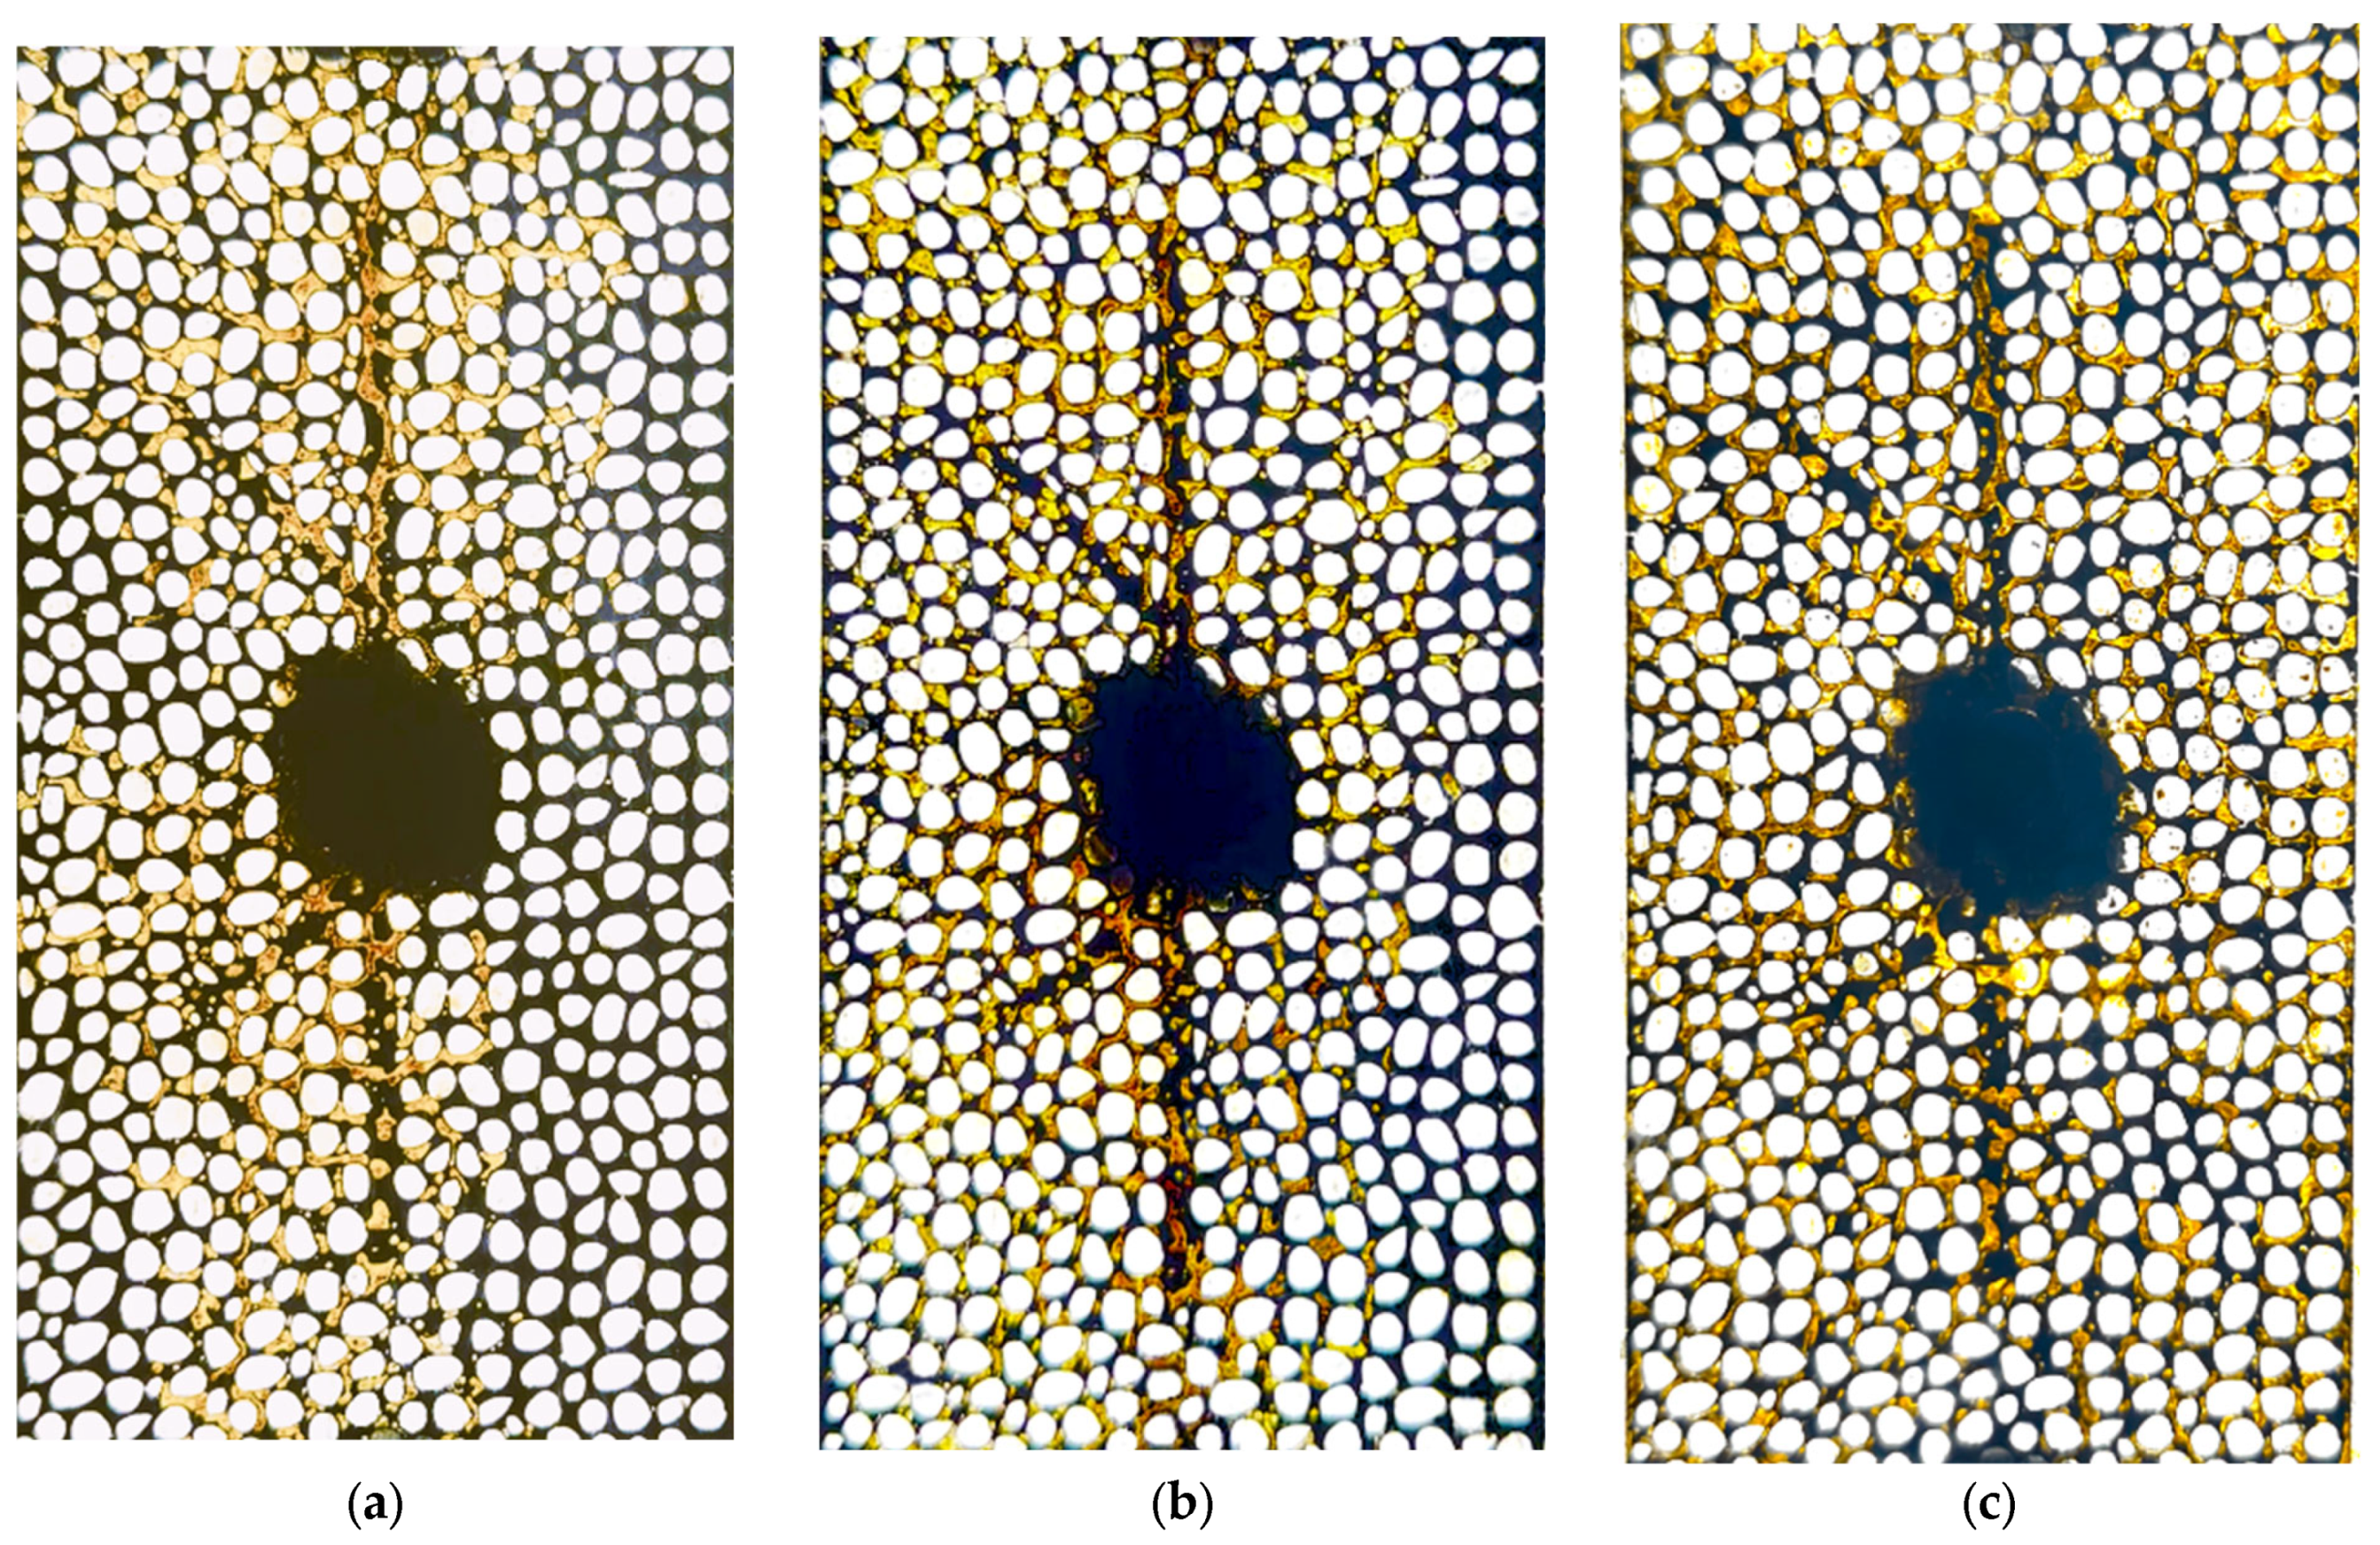
Microscopic observations after the third CSI cycle further highlight the influence of pressure-depletion rate on oil recovery behavior, as shown in
Figure 14. Under the lower depletion rate of 4 kPa/min (
Figure 14a), oil recovery showed minimal improvement compared to the second cycle, indicating that the system had reached a limiting recovery condition under slow pressure decline. In contrast, at the higher depletion rate of 12 kPa/min (
Figure 14b), a clear reduction in trapped oil was observed, accompanied by widespread foamy oil formation. The faster pressure depletion enhanced gas expansion and bubble growth within the oil phase, providing sufficient driving force to mobilize oil from smaller pores and previously inaccessible regions. This resulted in a continued increase in recovery during the third cycle, demonstrating that higher depletion rates are more effective in sustaining oil production at later stages of the CSI process.
These results highlight the strong relationship between pressure-depletion rate and dissolved gas–oil ratio (GOR) in controlling foamy oil generation. A higher pressure-depletion rate is associated with greater gas expansion and bubble nucleation in the oil phase, thereby enhancing foamy oil formation and improving recovery factors. Overall, the combined effect of pressure-depletion rate and GOR plays an important role in oil mobilization and recovery performance throughout the cyclic injection process.
Overall, these results show that the effectiveness of pressure-depletion rate during CSI is governed by wormhole-controlled connectivity rather than by depletion rate alone. Among the fixed-depletion-rate cases examined, the higher depletion rate of 12 kPa/min yielded the highest cumulative recovery after three cycles and therefore represents the most effective fixed-rate baseline. While lower depletion rates favor early-cycle, capillary-driven recovery, higher depletion rates become increasingly effective in later cycles as wormhole-enhanced solvent access and rising dissolved gas–oil ratio (GOR) promote gas expansion, foamy oil development, and oil mobilization from previously inaccessible regions. This behavior highlights the need to tailor pressure-depletion strategies to the evolving connectivity of wormhole-dominated reservoirs rather than relying on a single fixed depletion rate.
3.3. Effect of Incremental Pressure-Depletion Rate During the CSI Process
This section investigates the effect of applying an incremental pressure-depletion rate across successive CSI cycles. In Test 5, oil production was initiated at a low depletion rate of 4 kPa/min during the first cycle, increased to 8 kPa/min in the second cycle, and further raised to 12 kPa/min in the third cycle. The objective was to evaluate whether combining slow and fast depletion mechanisms across cycles could enhance overall oil recovery compared to constant depletion-rate strategies.
Figure 15 depicts the macroscopic oil-production response to incremental pressure-depletion rates during three CSI cycles. In the initial cycle, with a depletion rate of 4 kPa/min (
Figure 15a), oil extraction focused primarily on the high-permeability wormhole channels. By increasing the depletion rate to 8 kPa/min during the second cycle (
Figure 15b), the produced-oil region significantly expanded around the wormhole branches, indicating greater solvent penetration and improved oil mobilization compared with the first cycle. In the third cycle, conducted at the highest depletion rate of 12 kPa/min (
Figure 15c), oil production extended further into regions away from the wormholes, suggesting that a larger portion of the micromodel became hydraulically active. Overall, the incremental increase in pressure depletion rate led to progressively broader oil production and higher cumulative recovery.
The improved performance observed at incremental pressure-depletion rates can be attributed to the sequential activation of distinct recovery mechanisms across successive cycles. During the first cycle, conducted at a depletion rate of 4 kPa/min, the longer cycle duration allowed sufficient time for oil to be recovered from smaller pores through extended soaking and gradual pressure decline (as discussed in
Section 3.2). As shown in
Figure 10, the amount of gas dissolved in the oil during this cycle was relatively low. Under these conditions, foamy oil effects were limited, and oil production was primarily driven by pressure-gradient-controlled flow, which favored capillary-assisted recovery from smaller pore sizes. In the second cycle, when the depletion rate was increased to 8 kPa/min, the higher gas content in the system led to a balance between competing mechanisms (
Figure 10). The depletion rate remained low enough to sustain pressure-gradient-driven mobilization of trapped oil while being sufficiently high to initiate foamy oil generation. The contribution of these mechanisms further enhanced oil recovery. By the third cycle, the high depletion rate of 12 kPa/min, combined with an elevated gas–oil ratio, strongly promoted foamy oil generation. The dispersed gas phase increased oil mobility and provided the driving force necessary to recover oil from previously inaccessible regions. This progressive transition between dominant mechanisms explains the superior recovery achieved using an incremental depletion strategy.
Figure 9 highlights the differences in recovery factors over three cycles for the two fixed-pressure depletion rates and the incremental depletion strategy. An important observation is that as the number of cycles increased from one to three, the differences in recovery factor among the three cases became more pronounced. Applying an incremental pressure depletion rate from the first to the third CSI cycle resulted in the highest cumulative recovery factor, reaching 46.3% of the original oil in the micromodel. Compared with the high fixed depletion rate, this approach increased total recovery by 8%, while an improvement of 20% was observed relative to the low fixed depletion rate.
These results indicate that, under the conditions of this study, combining low and high pressure-depletion rates across successive cycles can be more effective than applying a single fixed depletion rate throughout the CSI process. In contrast to a constant high depletion rate, which is less effective in early cycles due to rapid gas release when the dissolved gas–oil ratio (GOR) is still low, the incremental strategy allows the system to evolve progressively. The initial low depletion rate promotes capillary-driven oil production and gradual solvent dissolution, leading to increased gas accumulation and higher dissolved GOR. This early-stage behavior effectively prepares the pore space for subsequent cycles, enabling higher depletion rates to more efficiently activate bubble nucleation, gas expansion, and foamy oil-assisted mobilization as wormhole-controlled connectivity and solvent access expand.
It should be noted that this behavior was observed over three CSI cycles in a small-scale micromodel, and the relative effectiveness of the depletion strategy may vary with additional cycles or under different system scales and reservoir conditions.
3.4. Comparison of Base and Wormhole Micromodels: Sensitivity of Recovery to Pressure Depletion Rate
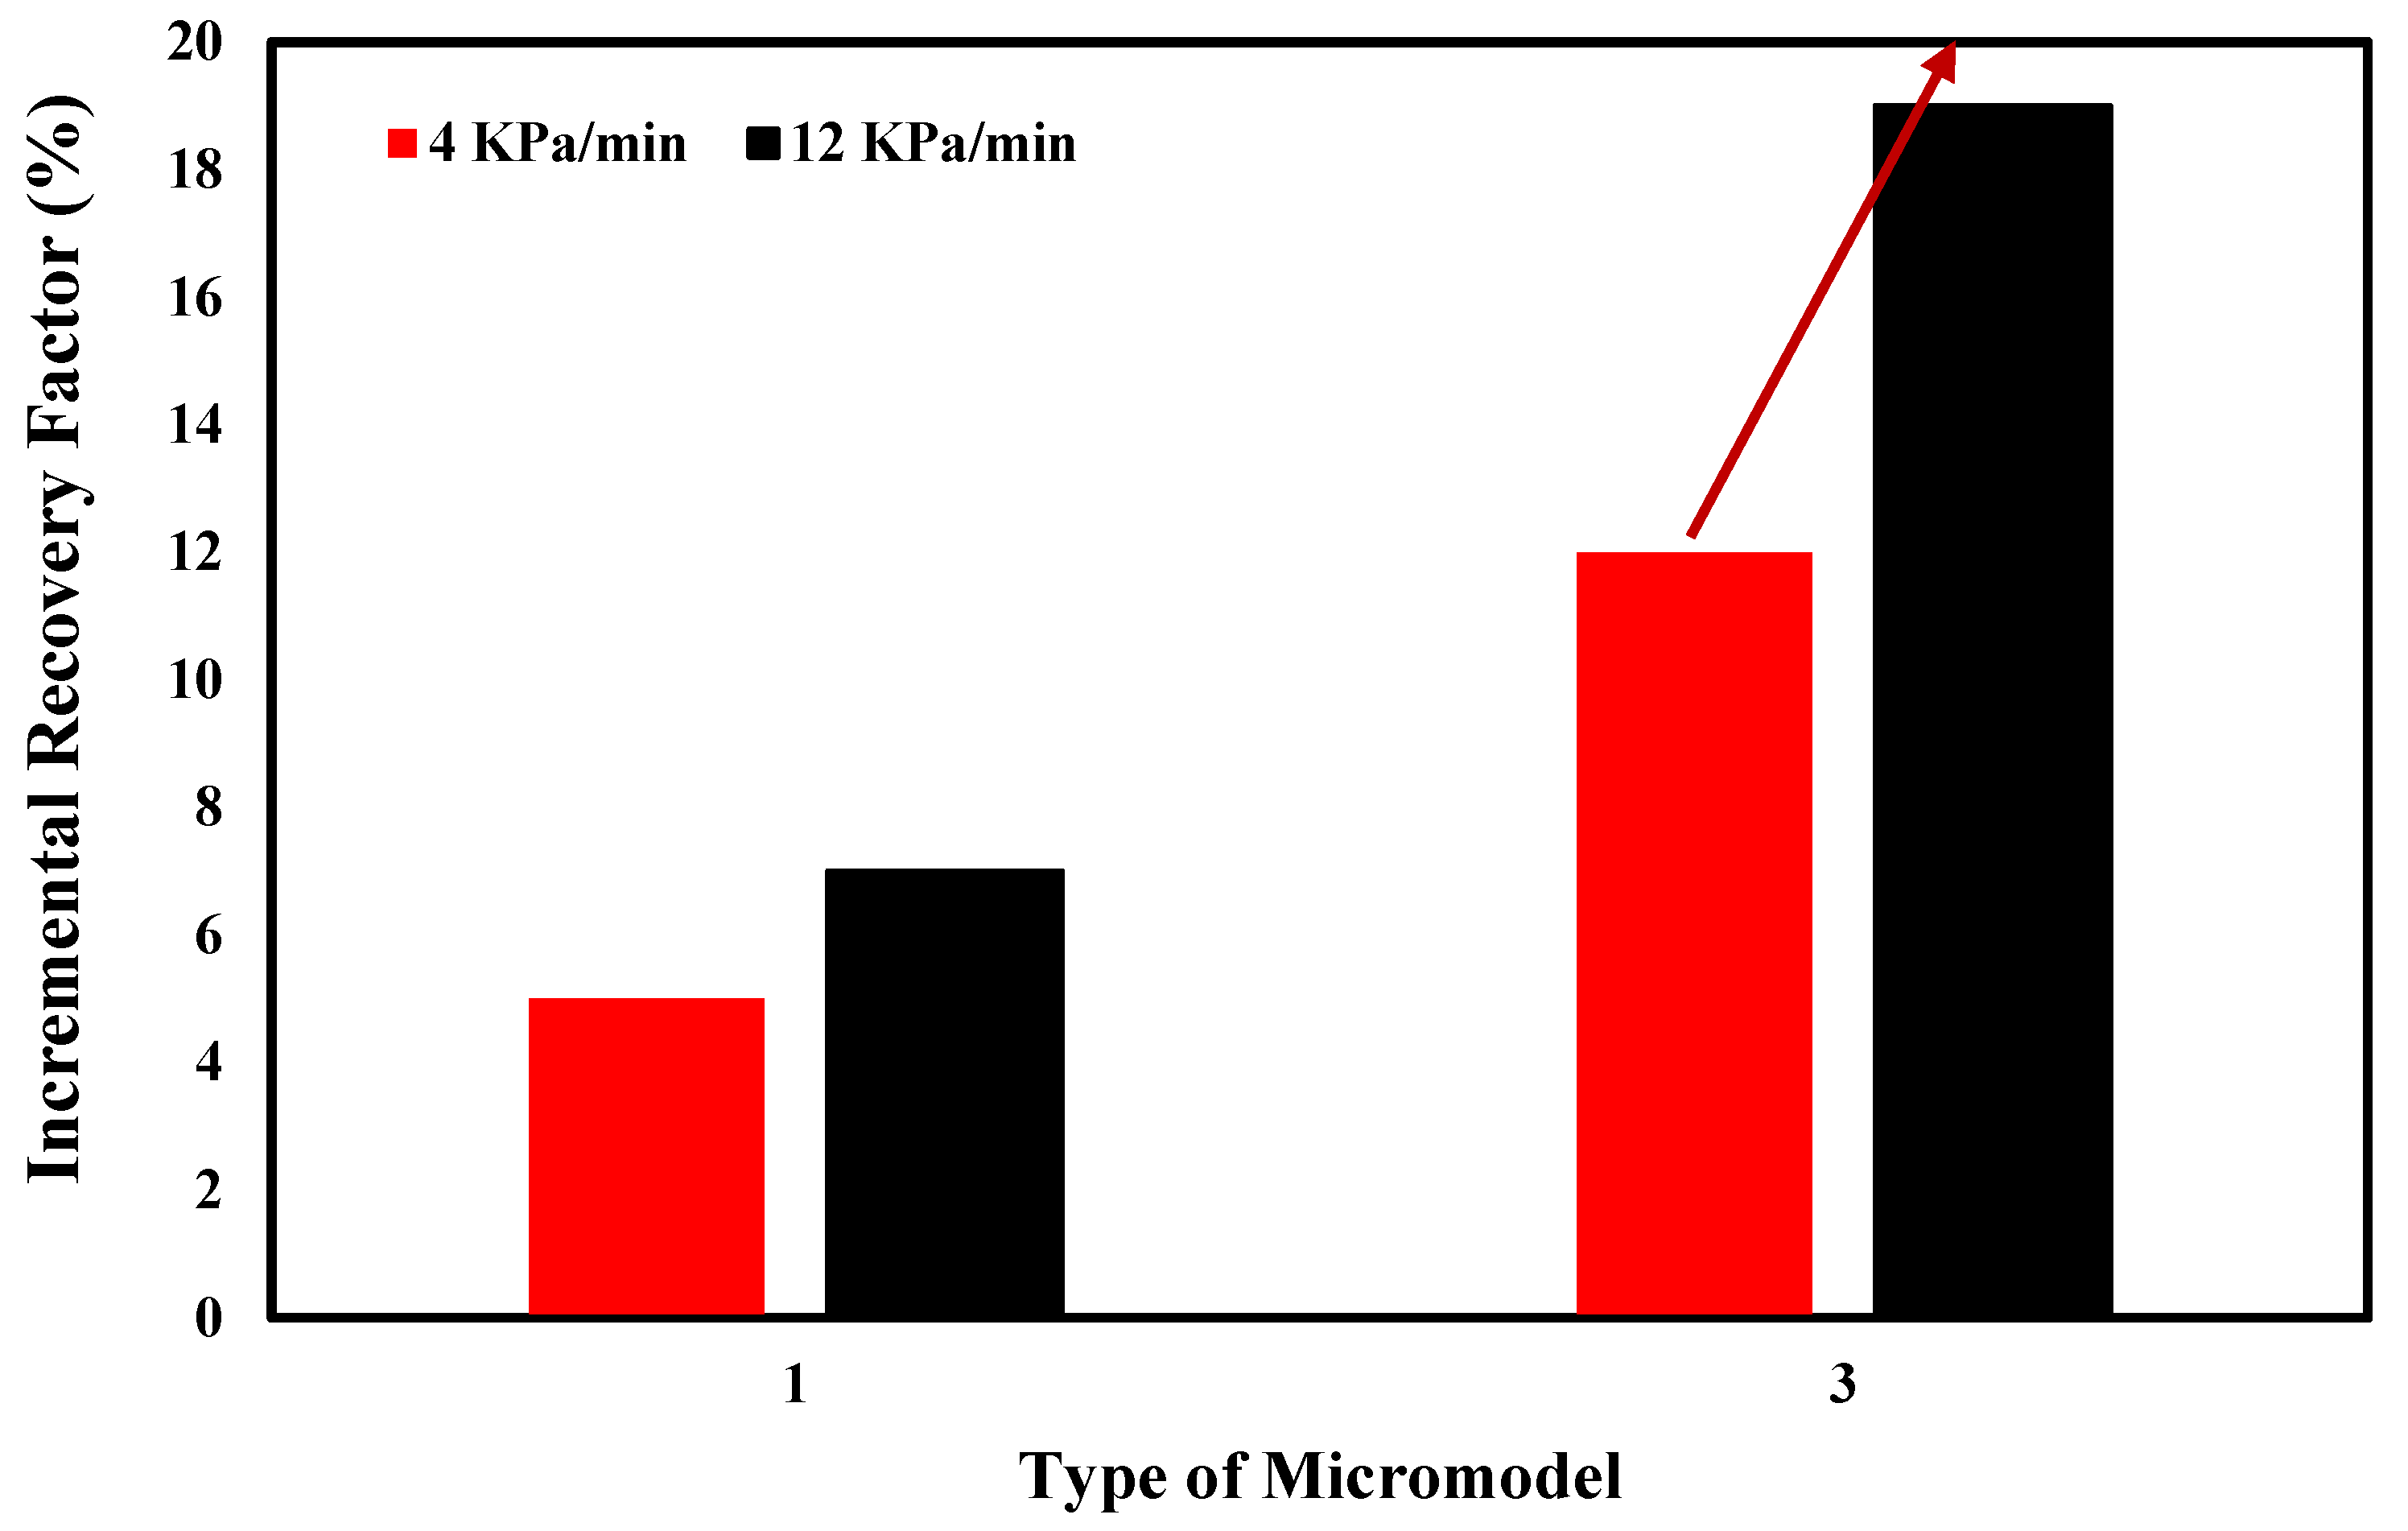
This section compares how the presence of a wormhole changes the sensitivity of oil recovery to pressure-depletion rate. Two depletion rates (4 and 12 kPa/min) were applied to the base micromodel (Tests 6 and 1) and to the symmetric long-wormhole micromodel (Tests 4 and 3). Since the depletion-rate mechanisms in Micromodel 3 were discussed in
Section 3.2 (Effect of Pressure Depletion Rate on Oil Behavior During the CSI Process), the focus here is limited to comparing the recovery factor difference between low and high depletion rates in the two geometries.
Figure 16 compares the total recovery factor obtained under low (4 kPa/min) and high (12 kPa/min) pressure-depletion rates for the base micromodel and the symmetric long-wormhole micromodel after the third CSI cycle. In the base micromodel, the total recovery factor increased by 5% under the lower depletion rate and by 7% under the higher depletion rate, resulting in a relatively small 2% difference between the two cases. This indicates limited sensitivity of oil recovery to pressure-depletion rate in the absence of wormholes. In contrast, the micromodel containing a long symmetric wormhole exhibited a much stronger dependence on depletion rate. When operated at 4 kPa/min, the cumulative recovery factor increased by 12%; at 12 kPa/min, it increased by 19% after the third cycle, leading to a larger 7% difference between the two depletion rates (as highlighted by the red arrow in
Figure 16). These results demonstrate that the presence of a wormhole enhances the impact of the pressure depletion strategy on oil recovery performance.
These results indicate that the difference in recovery factor (RF) between low- and high-pressure depletion rates becomes more pronounced in the presence of a wormhole, as the wormhole magnifies the impact of the depletion strategy. The wormhole provides a preferential, high-permeability pathway for oil production, such that after the first cycle, oil is primarily produced from the wormhole region. In contrast, oil in smaller pores remains largely trapped due to rapid pressure decline. In subsequent cycles, the wormhole channels enhance solvent gas transit and redistribution within the system, leading to stronger foamy oil generation. The larger pore sizes in the wormhole region reduce capillary pressure, facilitating gas entry, bubble formation, and oil mobilization at higher depletion rates. This reduced capillary resistance also improves sweep efficiency during later cycles. However, the basic micromodel, characterized by a more uniform pore structure and higher capillary resistance, restricts gas propagation and limits the effectiveness of foamy oil displacement. As a result, the sensitivity of recovery factors to pressure depletion rate is significantly greater in the micromodel with a symmetric wormhole, where pore structure and capillary dynamics act together to amplify the benefits of faster pressure depletion.
These results show that oil recovery responds much more strongly to the pressure depletion rate when a wormhole is present. In the base micromodel, changing the depletion rate has only a modest effect on recovery. However, in the micromodel with a wormhole, applying a higher depletion rate results in a noticeably higher recovery. This suggests that wormholes amplify the impact of pressure depletion by serving as preferential flow paths, thereby improving solvent movement and helping mobilize oil more effectively in the later cycles.
4. Conclusions
This study investigated the coupled influence of wormhole length and pressure-depletion strategy on oil recovery during CO2-based cyclic solvent injection (CSI) in wormhole-dominated post-CHOPS systems using microfluidic experiments. The results demonstrate that wormhole coverage plays a controlling role in determining how pressure-depletion strategies influence recovery behavior across successive cycles.
Wormhole length was shown to govern reservoir connectivity and solvent access, thereby defining the volume of pore space that can effectively respond to imposed pressure gradients. While the fundamental recovery mechanisms associated with CSI remain unchanged, increasing wormhole coverage expands pressure communication and gas–oil interaction within the system. This effect was reflected in the recovery performance, where the basic case without wormholes (ϕ wh = 0) achieved a total recovery factor of 24%, while increasing ϕ wh to 3.1% improved it to 37%. The highest wormhole coverage of ϕ_wh 5.1% resulted in the maximum total recovery factor of 43%. These results demonstrate that oil recovery becomes increasingly sensitive to pressure depletion rate as wormhole-controlled connectivity develops and expands across successive cycles. As a result, oil recovery becomes increasingly sensitive to pressure depletion rate as wormhole-controlled connectivity develops across successive cycles.
Fixed-pressure depletion strategies exhibited contrasting performance depending on cycle stages. Under fixed depletion conditions, the lower depletion rate of 4 kPa/min resulted in a cumulative recovery factor of approximately 38%, whereas increasing the depletion rate improved the recovery factor to about 43%, representing an increase of 5%. Lower depletion rates favored early-cycle, capillary-driven recovery, whereas higher depletion rates became more effective in later cycles as enhanced connectivity and elevated gas–oil ratios promoted gas expansion, foamy oil development, and oil mobilization from previously inaccessible regions. These findings indicate that pressure-depletion rate is not an intrinsic control parameter but rather a conditional mechanism whose effectiveness depends on reservoir connectivity.
Using an incremental pressure-depletion strategy, in which low and high depletion rates were applied in successive cycles, yielded the highest overall oil recovery of 46.3%. This approach takes advantage of the natural transition in dominant recovery mechanisms that occur as CSI progresses. In the early cycles, lower depletion rates favor capillary-driven oil production, while in later cycles, higher depletion rates enhance gas expansion and foamy oil-assisted mobilization as reservoir connectivity improves through extended wormhole networks. These observations suggest that applying a single fixed depletion rate throughout the CSI process limits recovery potential, whereas adjusting the depletion strategy to track the evolving recovery mechanisms improves performance.
In summary, this study shows that wormhole length strongly influences how operational strategies translate into oil recovery during CSI. By demonstrating that pressure depletion effectiveness depends on wormhole-controlled connectivity, this work provides new insights into the relationship between depletion strategy and evolving flow mechanisms in post-CHOPS systems. Future work will focus on developing an adaptive CSI approach in which the depletion rate for each subsequent cycle is adjusted based on system response indicators, such as recovery factor trends, produced gas–oil ratio, and observed foamy oil behavior from previous cycles. Moreover, based on our previous work [
27], the experimental results can be incorporated into numerical simulation through dimensionless analysis and parameter calibration. Future studies will extend this approach to include wormhole effects for improved reservoir-scale prediction.