


Abstract
Methane hydrate formation in multiphase transportation pipelines represents a critical challenge to flow assurance under low-temperature conditions. Gaining insight into the kinetic effects of crude oil on hydrate formation aids in developing countermeasures for mixed oil–gas transportation. For this purpose, experiments were carried out at 50 vol% to 90 vol% water cut and pressure of 6.0–7.5 MPa under crude oil–methane–water systems. Results demonstrate that crude oil has kinetic inhibition on hydrate formation, which is caused by mass transfer resistance in emulsion gels. The gas consumption increased by 81.38% when the water cut increased from 60 vol% to 70 vol%. Tween-80 converts crude oil W/O emulsions into O/W emulsions. The addition of Tween-80 to a 50 vol% water cut system resulted in only a 10.04% increase in gas consumption compared to the 90% water cut condition. The results indicate that Tween-80 significantly promotes the formation of hydrates. Furthermore, analysis of gas consumption reveals that the O/W system is more conducive to hydrate growth than the W/O system. Observations through the viewing window revealed that lowering the temperature and hydrates synergistically disrupt the stability of the emulsion. This is caused by the phase transition of wax and asphaltene in crude oil. These findings provide insights for developing flow assurance strategies in crude oil multiphase transportation pipeline operations.
1. Introduction
Due to the rich marine oil and gas resources, the focus of oil and gas exploitation has gradually shifted from land to the ocean [1,2]. Multiphase mixed transportation has been widely considered in oil and gas field development due to its advantages of low cost with the continuous improvement in offshore oil and gas transportation technologies [3]. However, pipelines may face potential risks of solid deposition under extreme environmental conditions such as in subsea pipelines [4,5]. If pipelines are exposed to low-temperature and high-pressure conditions, the safe operation can be severely compromised by wax and hydrate build-up when crude oil, produced water, and associated gas coexist [6]. The structure of the deposits remains complex and has attracted significant attention from the academic community.
The widely accepted conclusion of the wax deposition process remains elusive [7]. However, it is well established that wax precipitation and wax deposition are different. Wax precipitation refers to the conversion of high-carbon-number alkanes into solids suspended in the oil phase at low temperatures [8,9]. These wax crystals facilitate the formation of Pickering emulsions by adsorption at the oil–water interface [10,11]. But wax deposits form a layer on the inner wall, which reduces the effective diameter and eventually forms a plug [12]. The kinetic process of hydrate formation includes nucleation, growth, and aggregation [13,14,15]. Water cages may trap guest molecules and form a stable structure when the temperature and pressure are lower than phase equilibrium conditions [16]. Based on the type of gas molecules and the shape of the water cages, hydrates may be classified as sI, sII, and sH [17]. In the presence of natural surfactants in crude oil, the mixture can form emulsions, which increases the complexity of the experimental systems [18,19].
Wax and hydrates may coexist under low-temperature and high-pressure conditions. Studies have indicated that the coexistence of multiple solid phases significantly increases the risk of pipeline blockage when flow assurance is compromised [20]. Although the coupled deposition of wax and hydrates is a key concern in flow assurance, the conclusion of the interaction between wax and hydrates has yet to be reached [6]. Further, existing studies have primarily focused on model oil-containing systems. While mineral oil and diesel are beneficial for controlling wax content, this considerably deviates from actual multiphase flow conditions. For example, when asphaltenes are present, emulsions form gel network structures at low temperatures [21,22]. It might influence hydrate formation. Therefore, it is essential not only to clarify the impact of wax on hydrate formation but also to conduct in-depth investigations within crude oil systems. Elucidating the mechanisms and influence of wax and crude oil on hydrate formation is of great significance for ensuring safety in complex multiphase flow [23].
Therefore, some researchers prefer to perform hydrate formation experiments with crude oil to clarify its impact, which contributes to a deeper understanding of potential risks in actual multiphase transportation pipelines. Daraboina et al. [24] found that crude oil significantly inhibits hydrate formation. The three types of crude oil they used not only lowered the hydrate formation temperature but also considerably extended the induction period; their study covered systems with oil contents ranging from 0 to 40 vol%. Thermodynamically, Kar et al. [25] suggested that crude oil shifts the hydrate phase equilibrium temperature–pressure curve toward higher pressures and lower temperatures, indicating its inhibitory effect. In O/W emulsion systems, Feng et al. [26] observed that saturates separated from South China Sea crude oil promoted hydrate nucleation and growth, whereas aromatics and resins inhibited it. Stoporev et al. [27] discovered that dispersed methane hydrate particles in crude oil exhibit a self-preservation effect. Salmin et al. [28] studied the influence of asphaltene morphology on hydrate aggregation by controlling asphaltene aggregation and dispersion; their results showed that natural asphaltenes in crude oil inhibit hydrate particle agglomeration, and artificially reducing asphaltene aggregation to improve dispersion enhances the anti-agglomeration performance of the oil. Kolotova et al. [29] compared the performance of anti-agglomerants before and after emulsification and found that adding AA before emulsifying crude oil and water more effectively prevents hydrate particle agglomeration than adding it after emulsification; the study used North Sea crude oil with water cuts between 10 vol% and 40 vol%. Talatori et al. [30] reported that the stability of emulsions considerably influenced hydrate formation, and they noted a distinctive phenomenon: at 50 vol% water cut, the hydrate formation rate was higher than at 80 vol%.
Overall, research on hydrate formation in crude oil systems remains relatively limited. It is established that crude oil exhibits an inhibitory effect on hydrate formation. But the conclusions are neither sufficiently thorough nor systematic. The underlying mechanisms continue to require further clarification. In light of this, this study employs crude oil as the research subject and conducts experiments in oil–water emulsion systems to elucidate the patterns and mechanisms of hydrate formation in crude oil-containing systems. The findings are expected to provide valuable insights into engineering applications.
2. Materials and Methods
2.1. Apparatus and Materials
Crude oil, methane (99.9%, supplied by Chengdu Zhengrong Gas Co., Ltd.), and deionized water (prepared in the laboratory) were adopted to conduct experiments. For conventional emulsions, an emulsifier is essential to maintain emulsion stability. The hydrophilic–lipophilic balance (HLB) is a key parameter used to characterize the affinity of an emulsifier for oil or water [31]. It is generally accepted that an HLB value between 2 and 8 stabilizes water-in-oil (W/O) emulsions, while a value between 8 and 15 facilitates the formation of oil-in-water (O/W) emulsions. Tween-80 was selected due to an HLB value of 14 to act as a nonionic O/W emulsifier. It has a density of 1.06 g/cm3 at 25 °C and appears as a light pink oily liquid at room temperature. Tween-80 also acts as a kinetic hydrate promoter, which may lower surface tension and accelerate hydrate nucleation [31]. The density, SARA composition, wax content, and wax appearance temperature (WAT) of crude oil are summarized in Table 1. The phase inversion point of the crude oil was determined to be 80 vol%, measured under winter room temperature conditions of approximately 12 °C. There is a difference in the gelation temperature and pour point for crude oil W/O emulsions. The details of crude oil used in all experiments and the methodology for the measurement methods can be found in our previous study [32].
Table 1.
Basic physical properties of GQ crude oil.
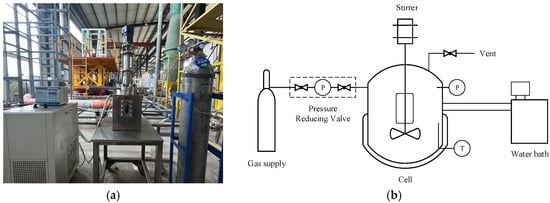
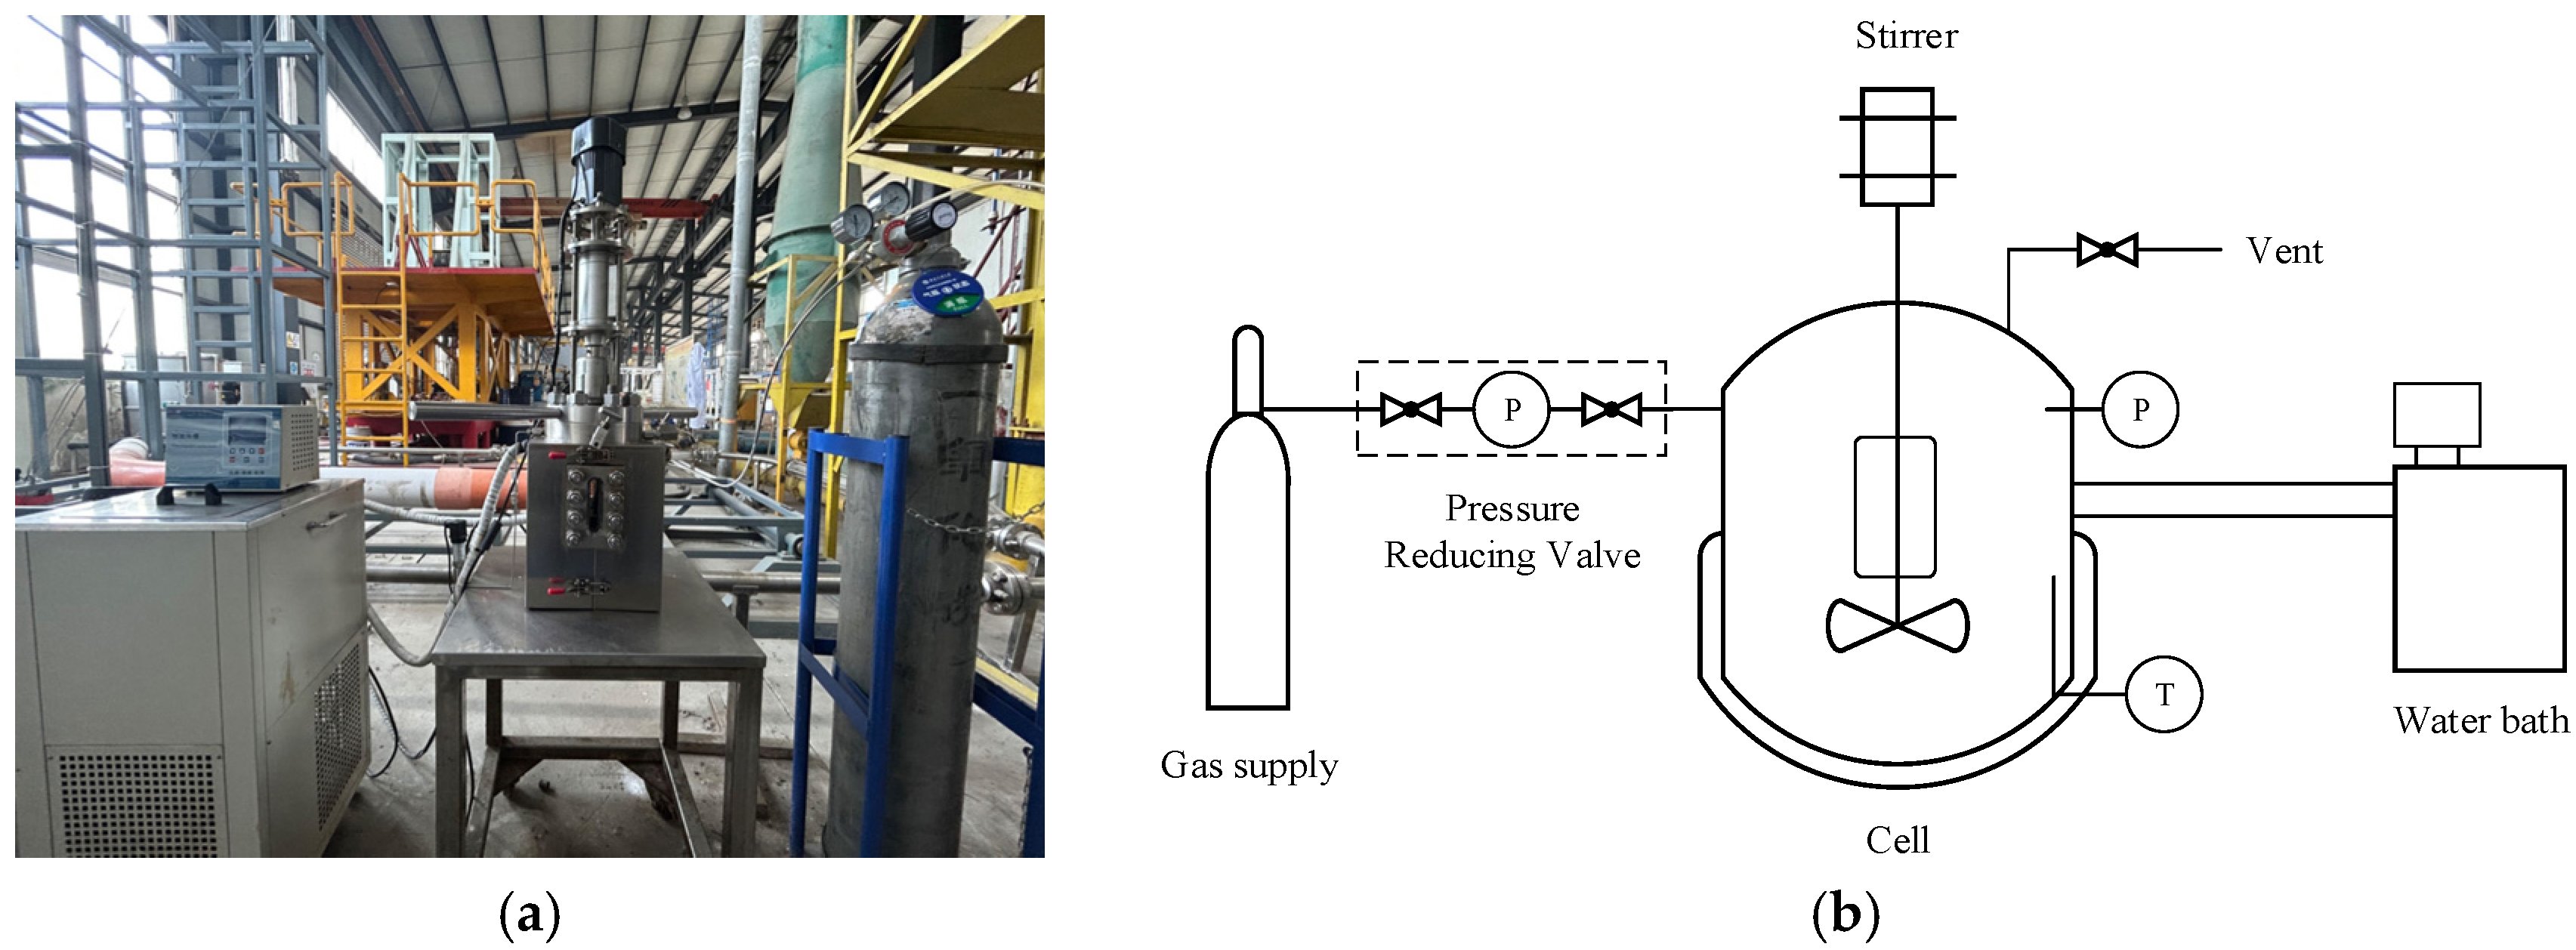
The hydrate formation experiments were conducted in a reactor with a magnetic stirrer diameter of 7.4 cm. A photograph of the actual setup and a schematic of the process flow are shown in Figure 1. The detailed methodology for this device can be found in our previously published papers [32].
Figure 1.
Hydrate formation cell: (a) a picture of the hydrate formation apparatus; (b) a schematic diagram of the hydrate formation apparatus.
2.2. Conditions and Procedures
All reactor experiments followed the same procedure, with variations only in parameters such as oil–water ratio, wax content, and pressure. Using a typical condition with 50 vol% water cut, a stirring speed of 500 rpm, a Tween-80 concentration of 500 ppm, and a CH4 charging pressure of 7.5 MPa as an example, the detailed experimental steps are described below. Table 2 lists the conditions of all experiments.
Table 2.
Experimental design for hydrate formation in the crude oil system.
For safety reasons, 1.5 L of water was injected into the reactor prior to pressurization with high-pressure gas for leakage inspection. High-pressure nitrogen was injected after closing the autoclave. The pressure-reducing valve was set to 9 MPa, and once the pressure stabilized, the gas supply was closed and maintained for 24 h. Once the pressure was maintained, the tightness was excellent. Then, the nitrogen was vented, and the reactor was cleaned.
The hydrate formation experiment was conducted. The mixture of 750 mL deionized water and 750 mL GQ crude oil was injected into the reactor and preheated to 40 °C. Since the system was not equipped with a vacuum pump, air was removed by repeatedly purging 3 times with methane. The pressure-reducing valve was then adjusted to the target pressure and opened. The magnetic stirrer was started at 500 rpm until the pressure stabilized. To facilitate comparison across different systems, the experimental pressure was referenced at 20 °C, as pressure varies with temperature under constant gas amount conditions. The change of pressure can be calculated by Equation (1), and the compressibility factor Z can be calculated by the equation of state. In this paper, the SRK equation is used for calculations. Data recording began at this point with a frequency of 10 s. The water bath was set to cool at a rate of 0.13 °C/min down to 1 °C to promote hydrate formation. The experiment continued until hydrate formation ceased or the pressure change remained within 0.1 MPa over 30 min. After each experiment, gas was vented, the reactor was opened and cleaned.
where P is the system pressure, Pa; V is the gas volume, m3; n is the amount of gas substance, mol; Z is the compressibility factor, dimensionless; R is the gas constant; T is the system temperature, K.
PV = nZRT,
2.3. Pre-Experiment
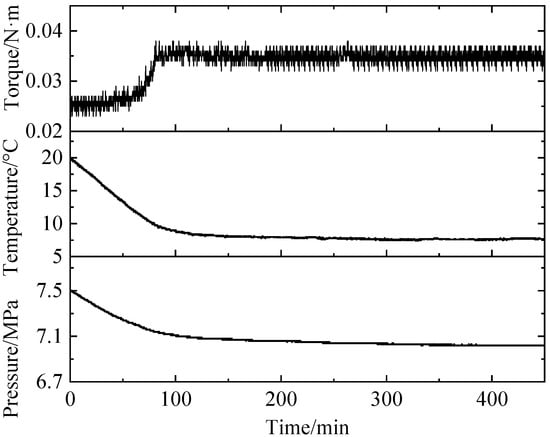
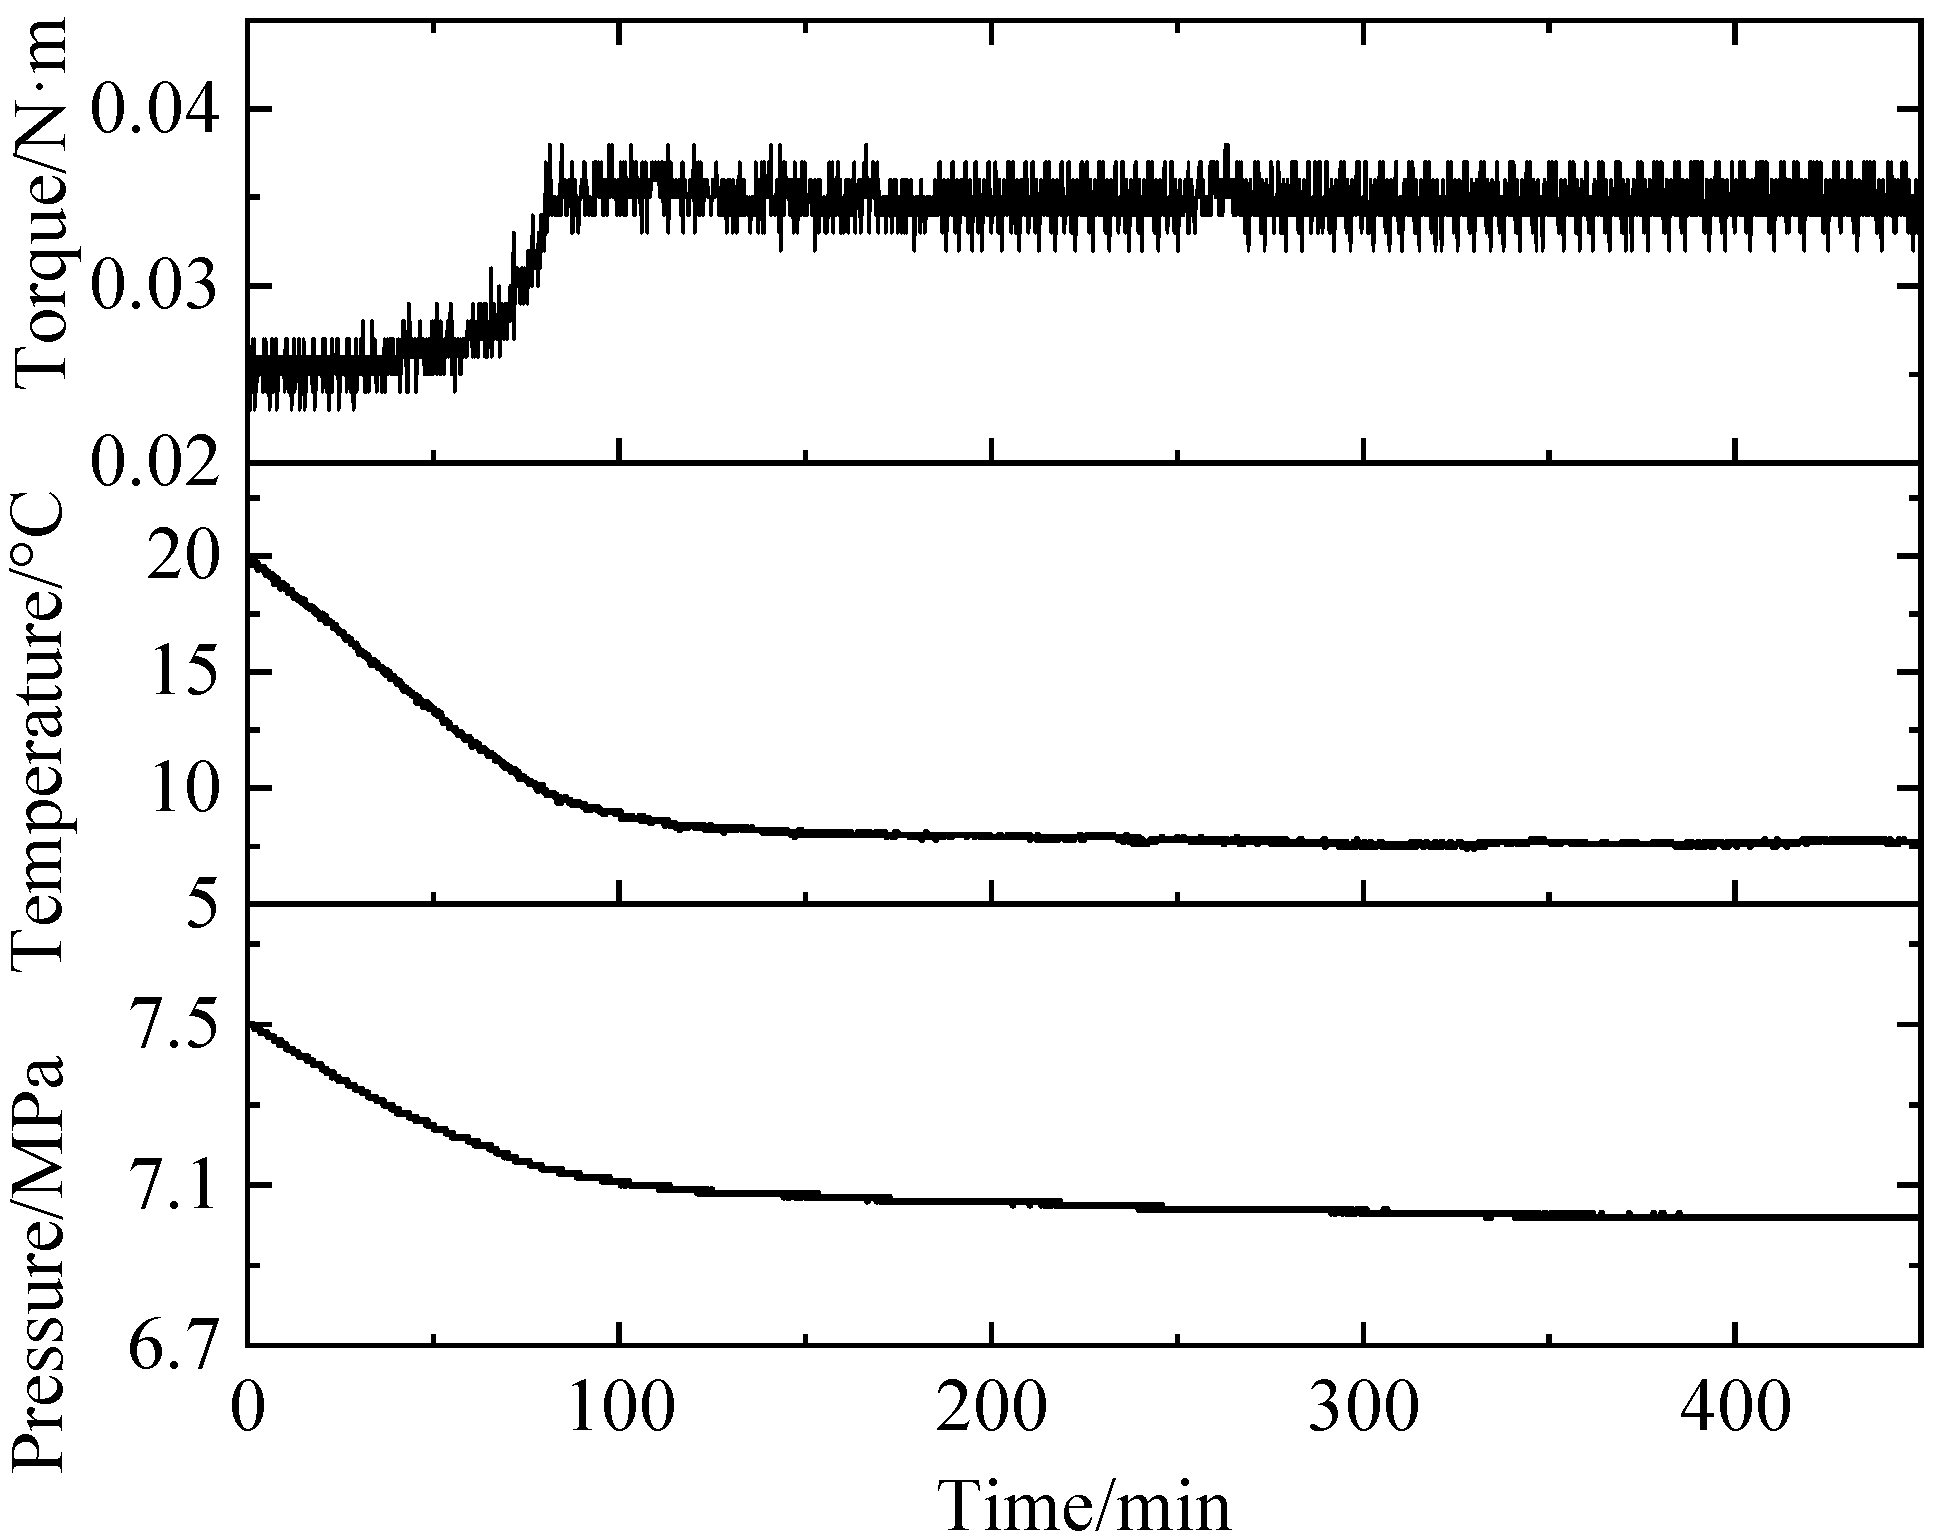
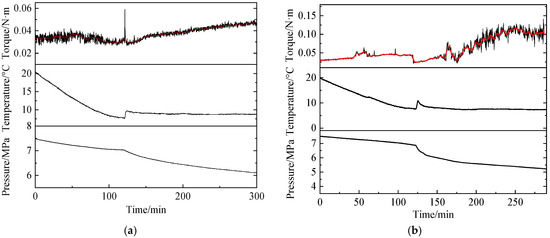
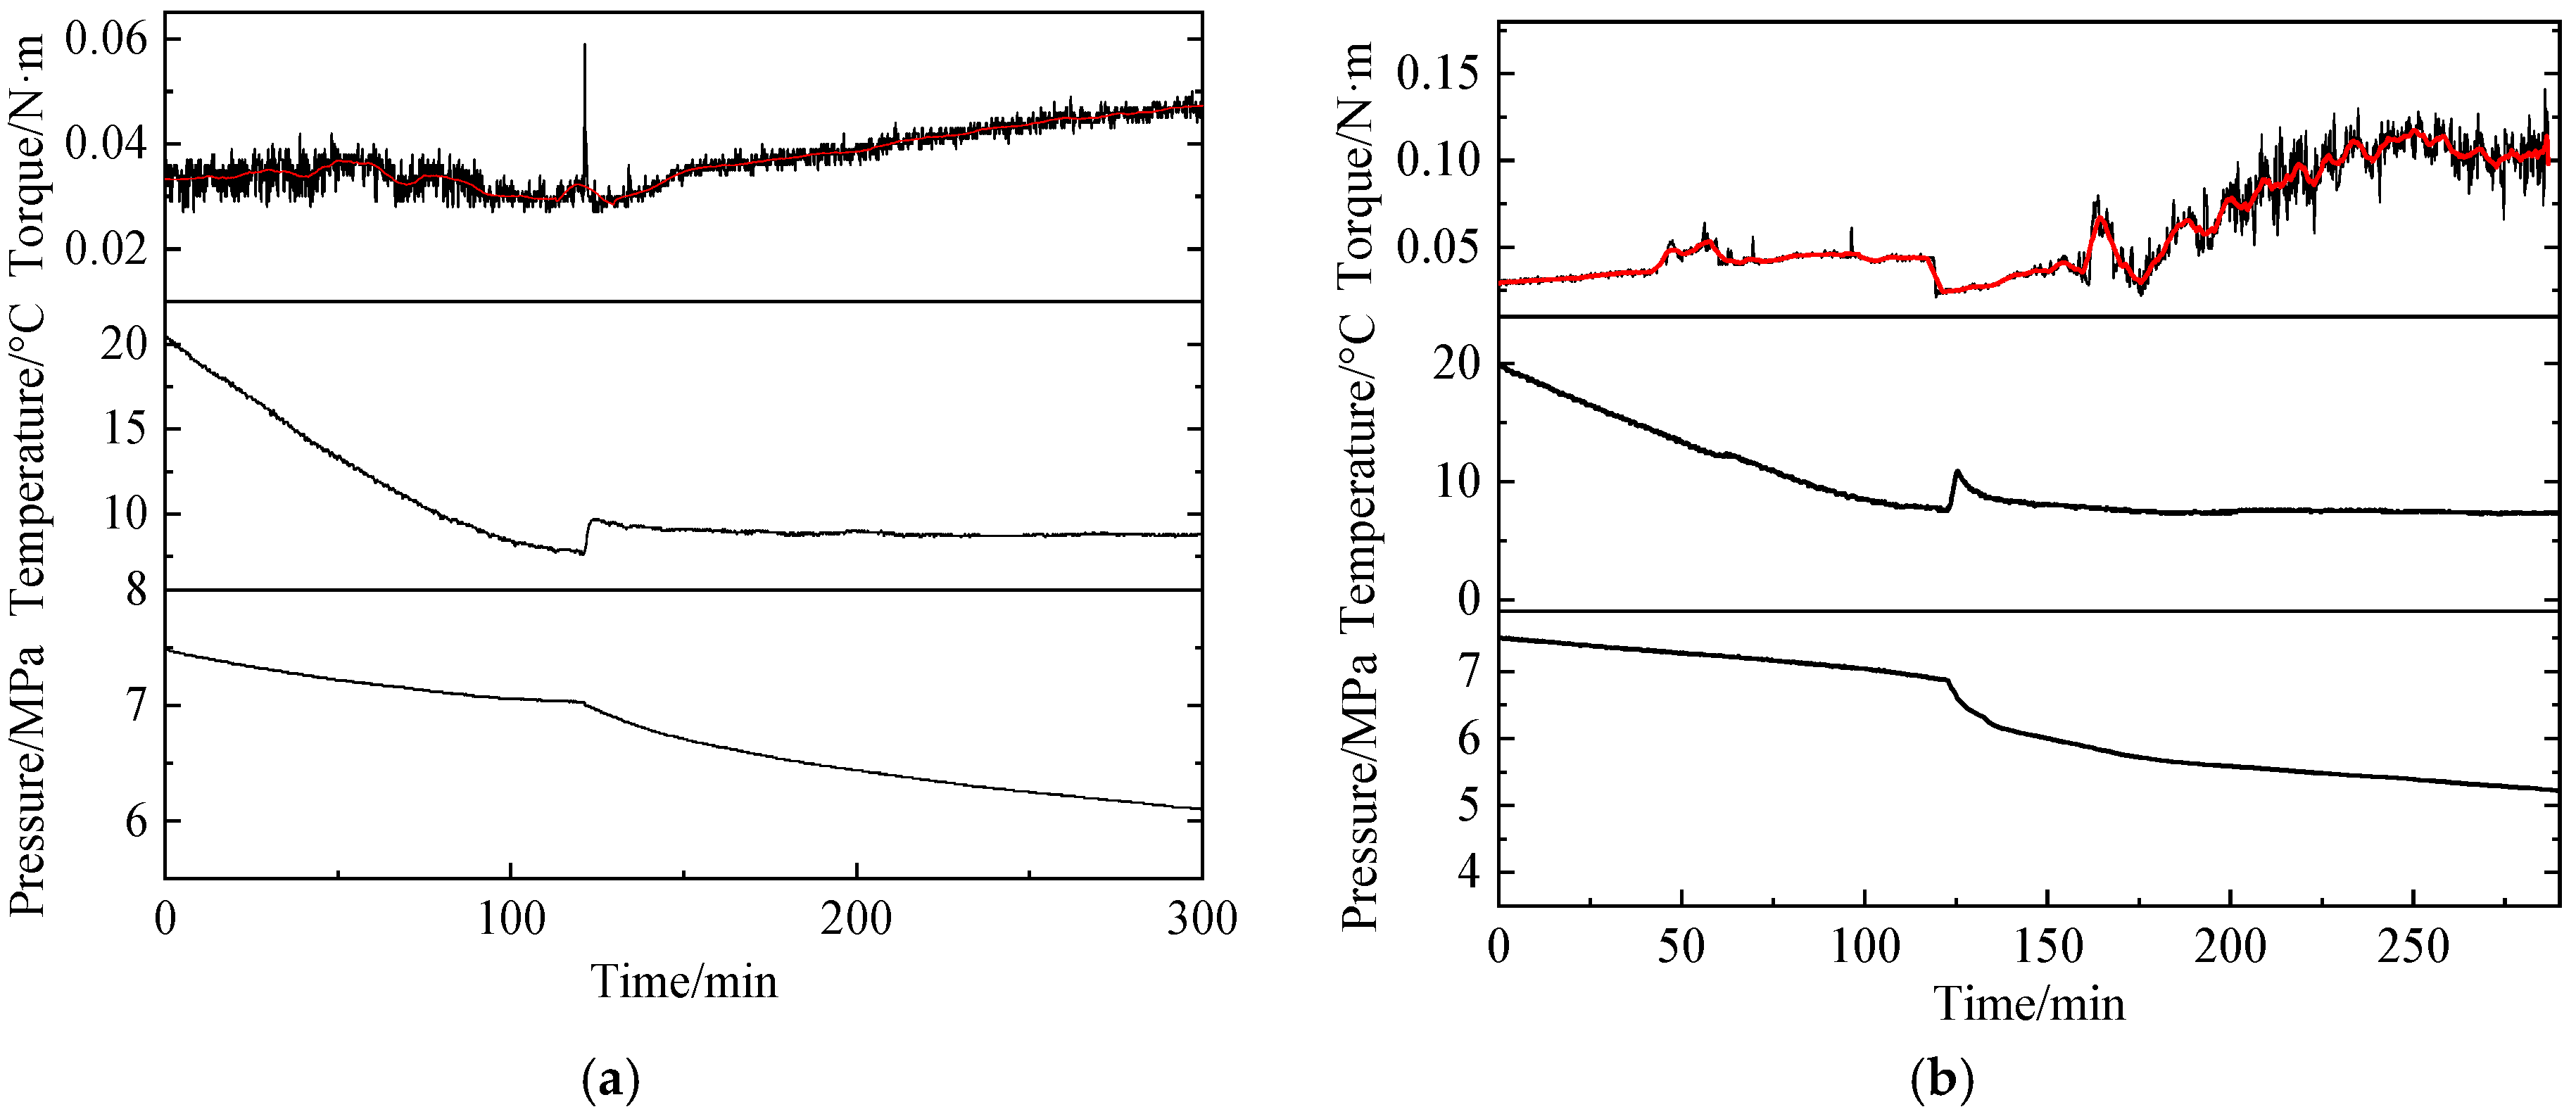
Initially, hydrate formation experiments were conducted using a system with an oil-to-water volume ratio of 1:1, corresponding to a water cut of 50 vol%. Changes in temperature, pressure, and torque during the experiment are shown in Figure 2. It can be observed that as the system temperature decreased over 450 min, no sudden temperature increase or rapid pressure drop—which would indicate significant gas consumption due to hydrate formation—occurred, suggesting that no hydrates formed in the system under these conditions. It indicates that crude oil adsorption is not conducive to hydrate formation. Notably, however, the torque gradually increased as temperature decreased, which is attributed to the gelation of the emulsion at low temperatures. This indicates that at this water cut, the gelled crude oil inhibits hydrate formation. Since no hydrates were generated under these conditions, the addition of Tween-80 was considered to transition the system into an oil-in-water (O/W) emulsion for further investigation [37].
Figure 2.
Temperature and pressure profiles under 50 vol% water cut.
3. Result and Discussion
3.1. Analysis of Hydrate Formation Mechanisms in O/W Systems
3.1.1. Observation of Hydrate Formation Morphology
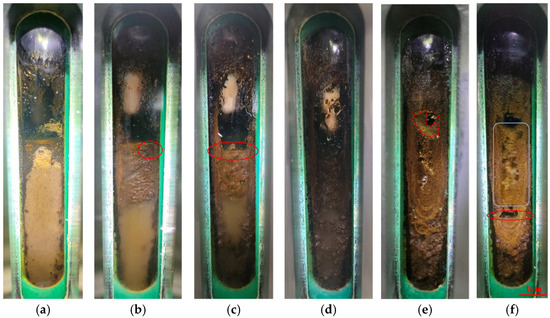
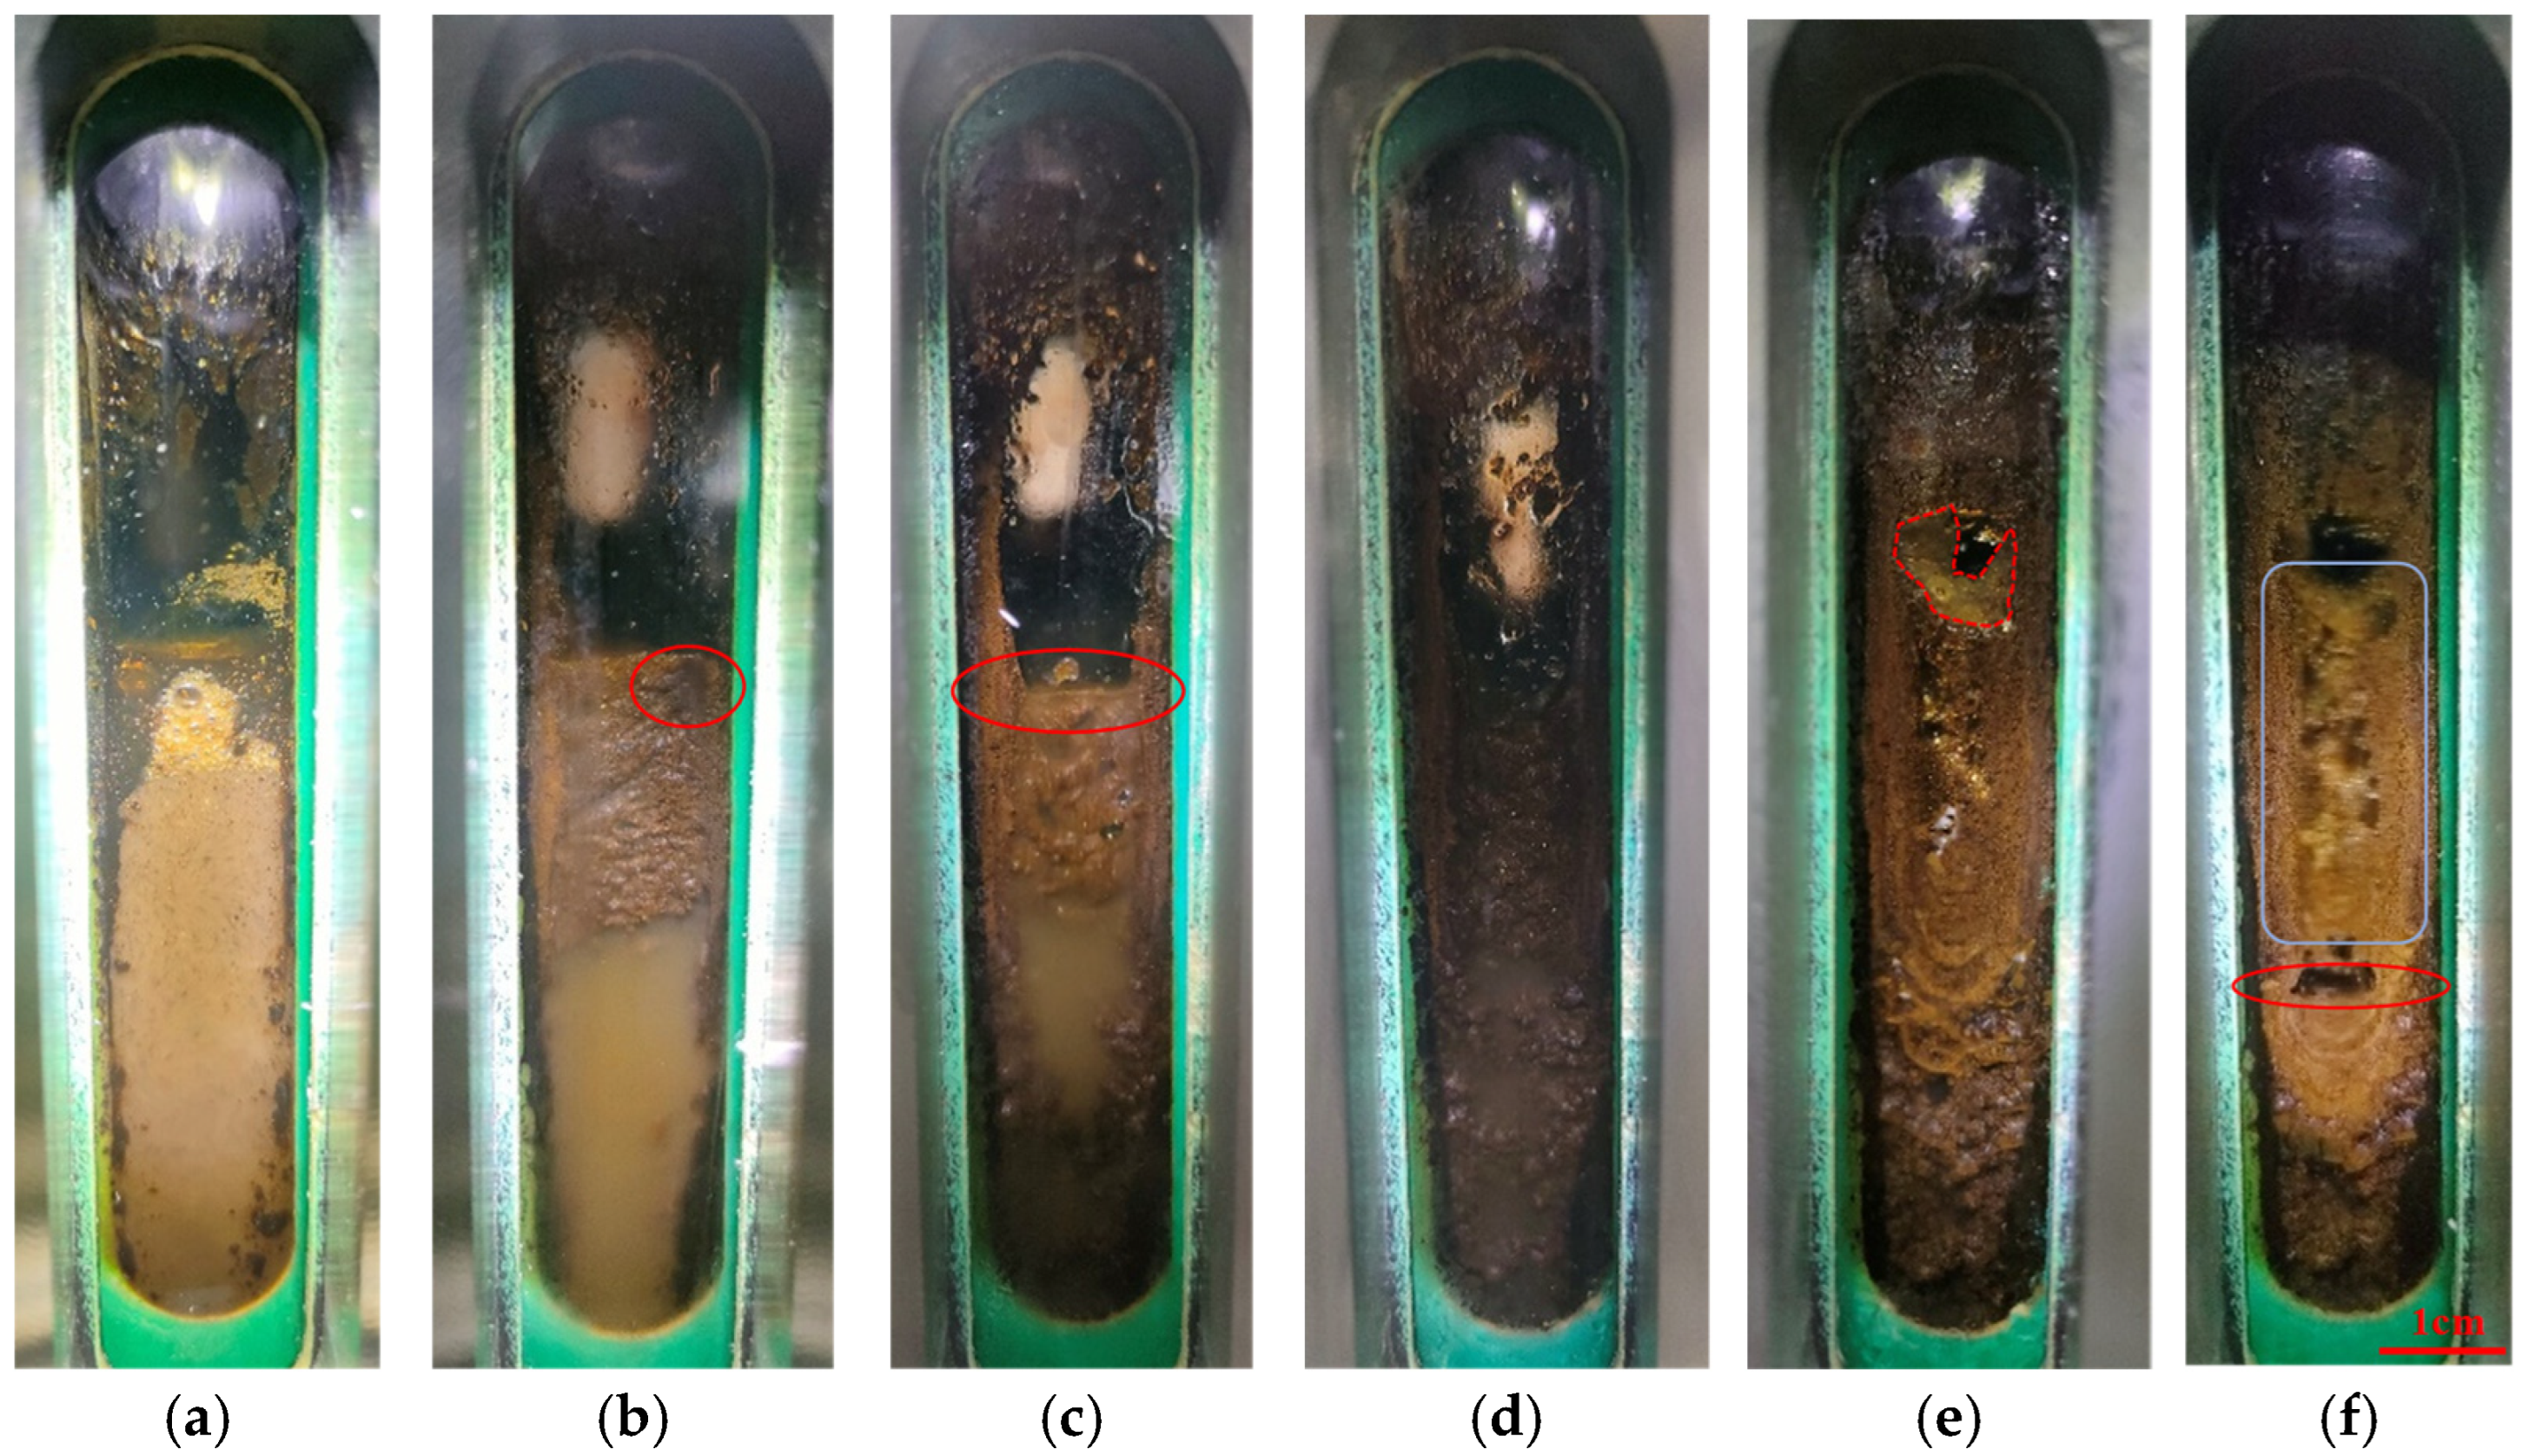
Figure 3 illustrates the changes in emulsion morphology under the initial pressure of 7.5 MPa with the water cut of 50 vol% and containing 500 ppm Tween-80. Hydrates appeared in Exp. 3. The results indicate that Tween-80 can promote hydrate formation compared with Exp. 2. As shown in Figure 3a, the O/W emulsion exhibited uniformity under the influence of Tween-80 at 30 °C. The crude oil accumulated when the temperature was reduced to 20 °C (Figure 3c). This phenomenon occurred because emulsion stability decreased, causing partial oil separation from the water phase. However, a continuous oil layer did not fully form, and careful observation revealed the presence of water at the gas–liquid interface, which is highlighted by a red circle. As the temperature continued to decrease to 15 °C (Figure 3d), water at the gas–liquid interface became more distinct, which is marked with a red ellipse. The crude oil exhibited a gelled macroscopic appearance. Although the temperature remained above the freezing point of the crude oil, the presence of water may have raised the emulsion gelling temperature. The gelled oil formed continuous masses floating in the water and trapped gas bubbles. When the temperature reached 10 °C (Figure 3e), more gelled oil was observed within the visual window. Throughout the cooling process from 30 °C to 10 °C, the liquid level remained generally stable. The temperature was below the hydrate phase equilibrium temperature. But no hydrate formation was observed as nucleation requires a certain degree of supercooling.
Figure 3.
Visual observation of hydrate formation at 7.5 MPa (Exp 2): (a) 30 °C; (b) 20 °C; (c) 15 °C; (d) 10 °C; (e) 8.1 °C; (f) 7.4 °C.
Figure 3f was captured 60 min after the induction period ended and massive hydrate formation began. The hydrates appeared light yellow in color. It was caused by the dissolution of crude oil components. Compared to the gas–liquid interface before hydrate formation, the growth position of the aggregates was relatively higher. This is attributed to water droplets splashing near gelled oil droplets adhered to the visual window wall. Hydrate shells formed with solid gelled oil acting as nucleation sites. The unconverted water inside the shell migrated through capillaries within the hydrate shell to the outside, promoting outward growth. The macroscopic morphology within the visual window after hydrate formation ceased, as shown in Figure 3f. At a system temperature of approximately 7.4 °C, a noticeable decrease in the gas–liquid/hydrate interface was observed (indicated by a red ellipse), indicating significant conversion of water into hydrates. The initially discontinuous hydrate growth shown in Figure 3f evolved into a continuous mass, suggesting that hydrates can grow upward along the gas–liquid interface and eventually merge with hydrates above the liquid level, forming large hydrate aggregates.
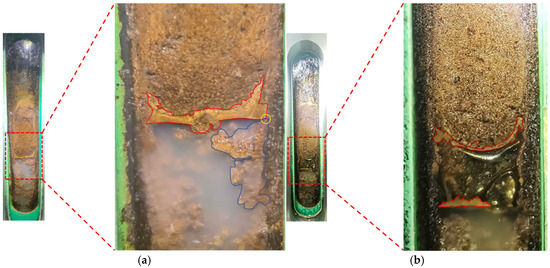
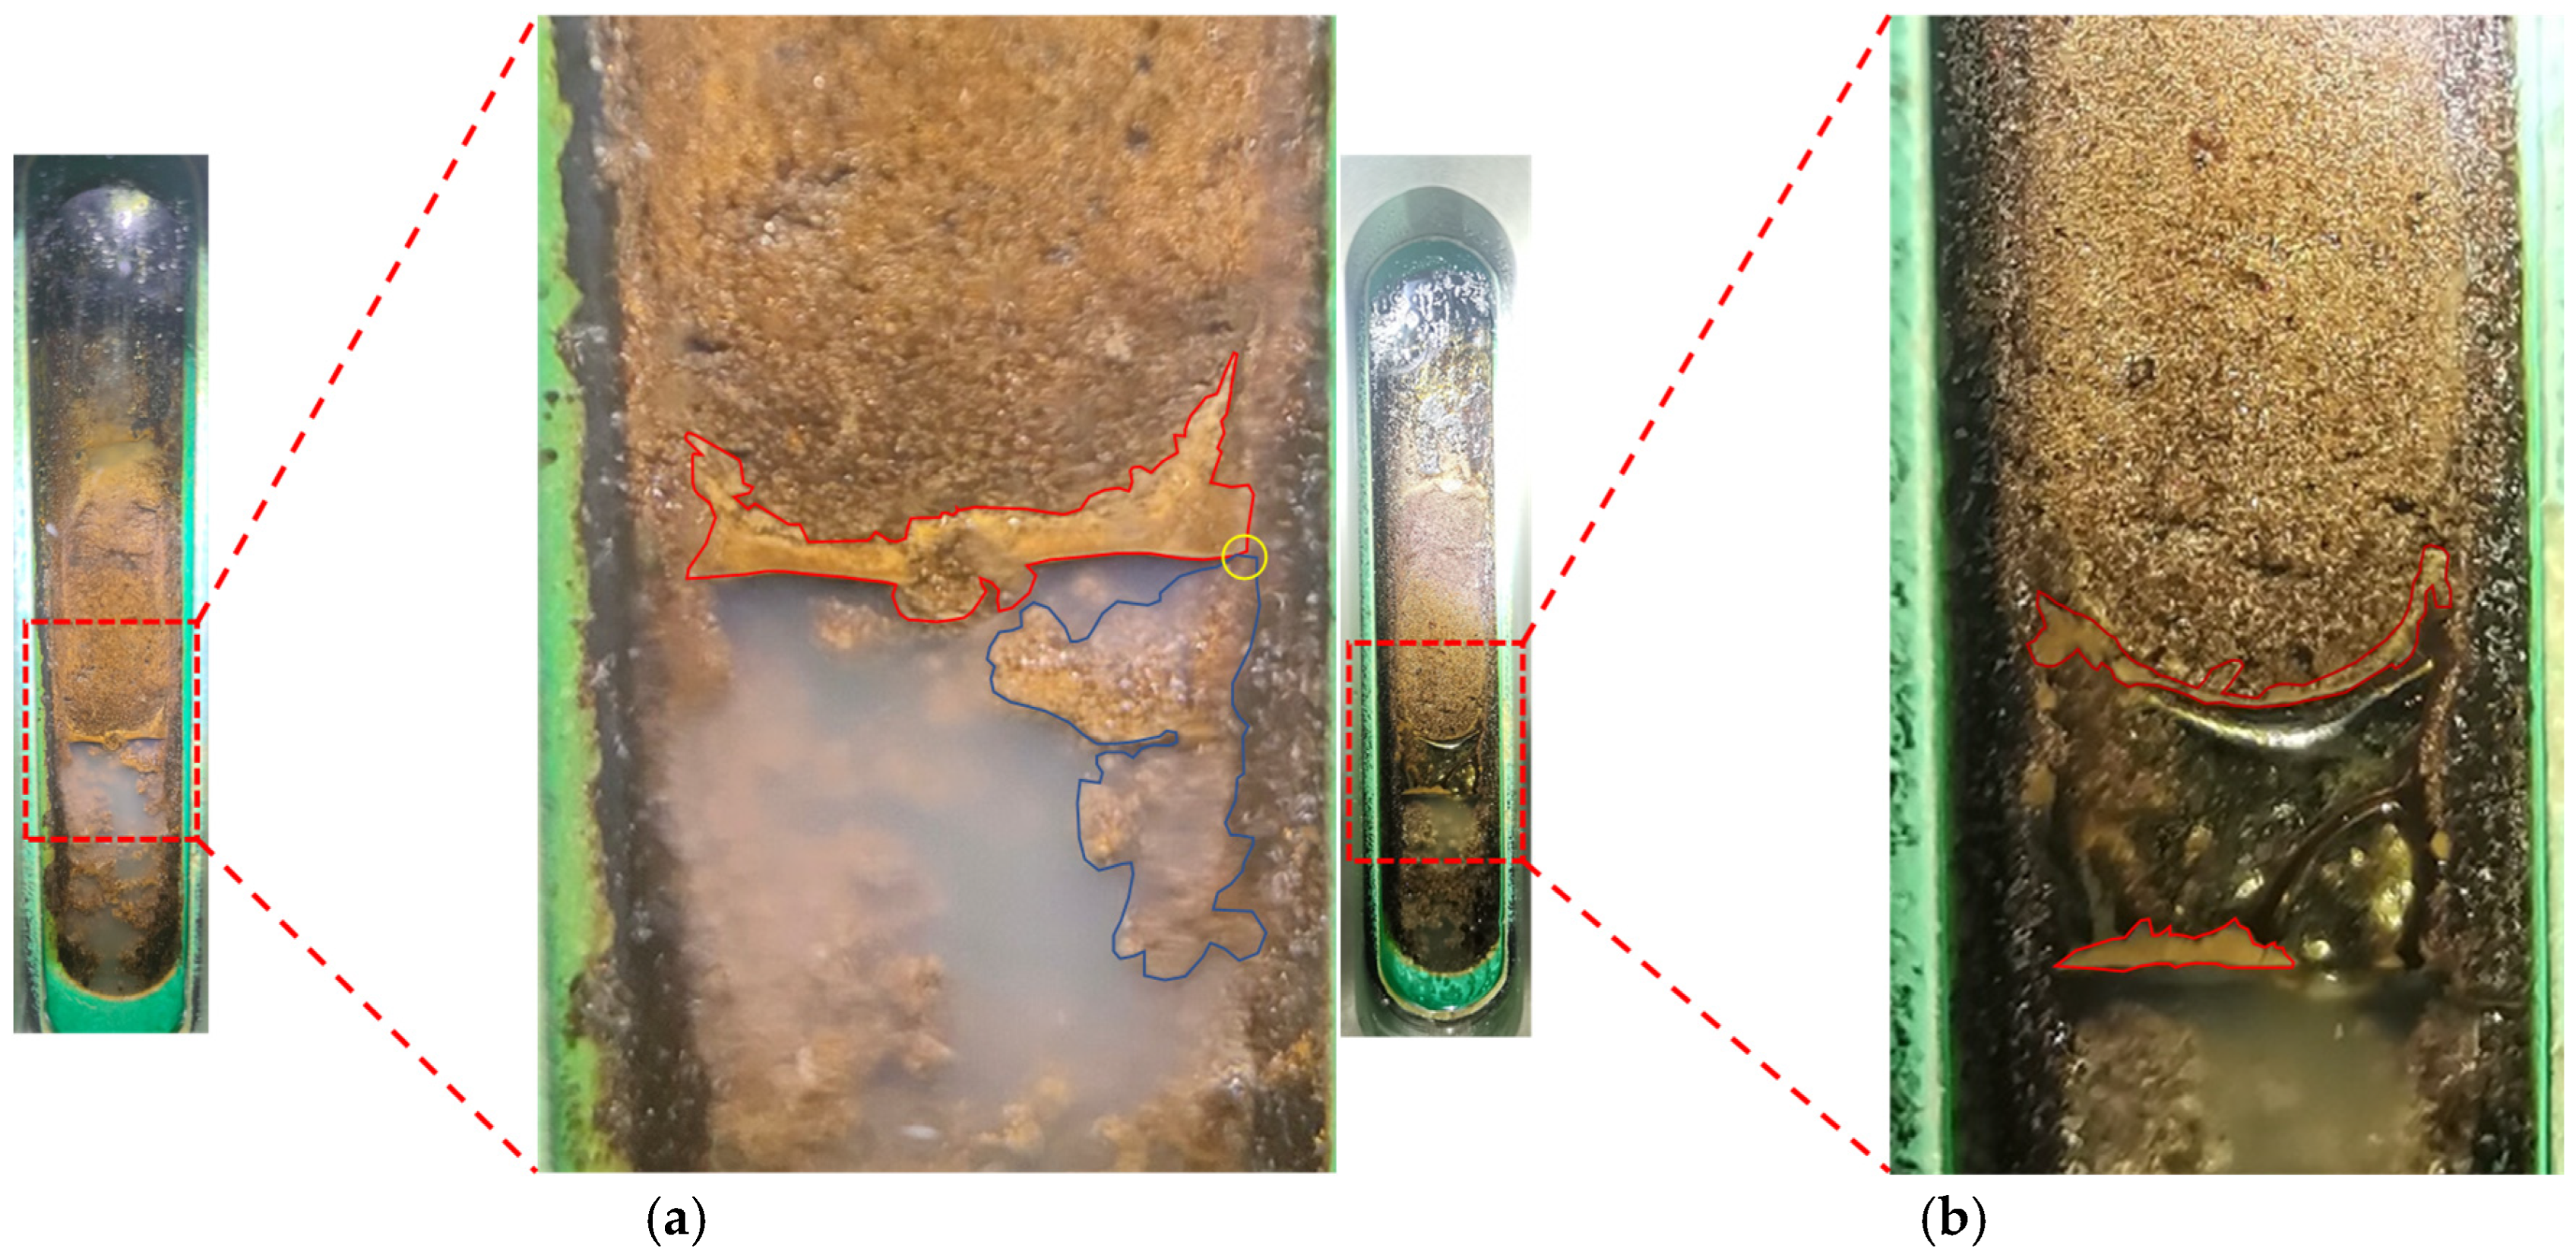
To further demonstrate that hydrates can adsorb onto gelled crude oil, observations after hydrate formation for 60 min were made under different pressure conditions, as shown in Figure 4. It can be observed that hydrates accumulated at the gas–liquid interface with an irregular morphology (highlighted in red). It indicates that the gelled crude oil can inhibit the upward climbing of hydrates. In addition, hydrate aggregates were observed within the continuous liquid phase as outlined by blue lines. It remained connected to the hydrates at the gas–liquid interface, suggesting that hydrates can grow downward along the interface. Further observations were conducted at 6.5 MPa, as shown in Figure 4b, also taken 60 min after hydrate formation. Here, the liquid level was noticeably lower than that at 7.0 MPa, indicating substantial hydrate formation. However, only limited hydrates were visible within the visual window because major hydrate formation and aggregation occurred away from the viewing area. Nevertheless, arc-shaped hydrates enveloping the gelled crude oil were observable, confirming that hydrates can attach to gelled crude oil. Moreover, the presence of hydrate aggregates at the gas–water interface suggests that hydrates maintained a tendency for continued growth under these conditions.
Figure 4.
Visual observation of hydrate formation: (a) Exp. 5 (7.0 MPa); (b) Exp. 4 (6.5 MPa).
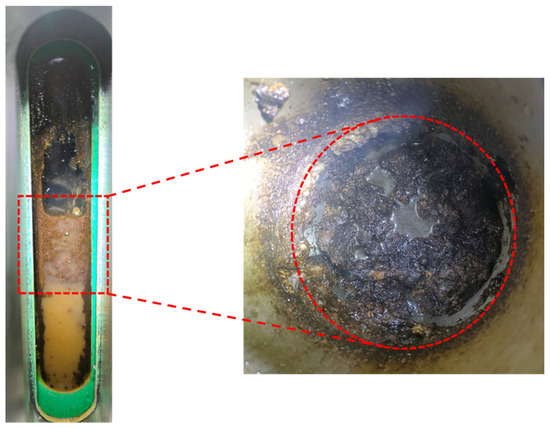
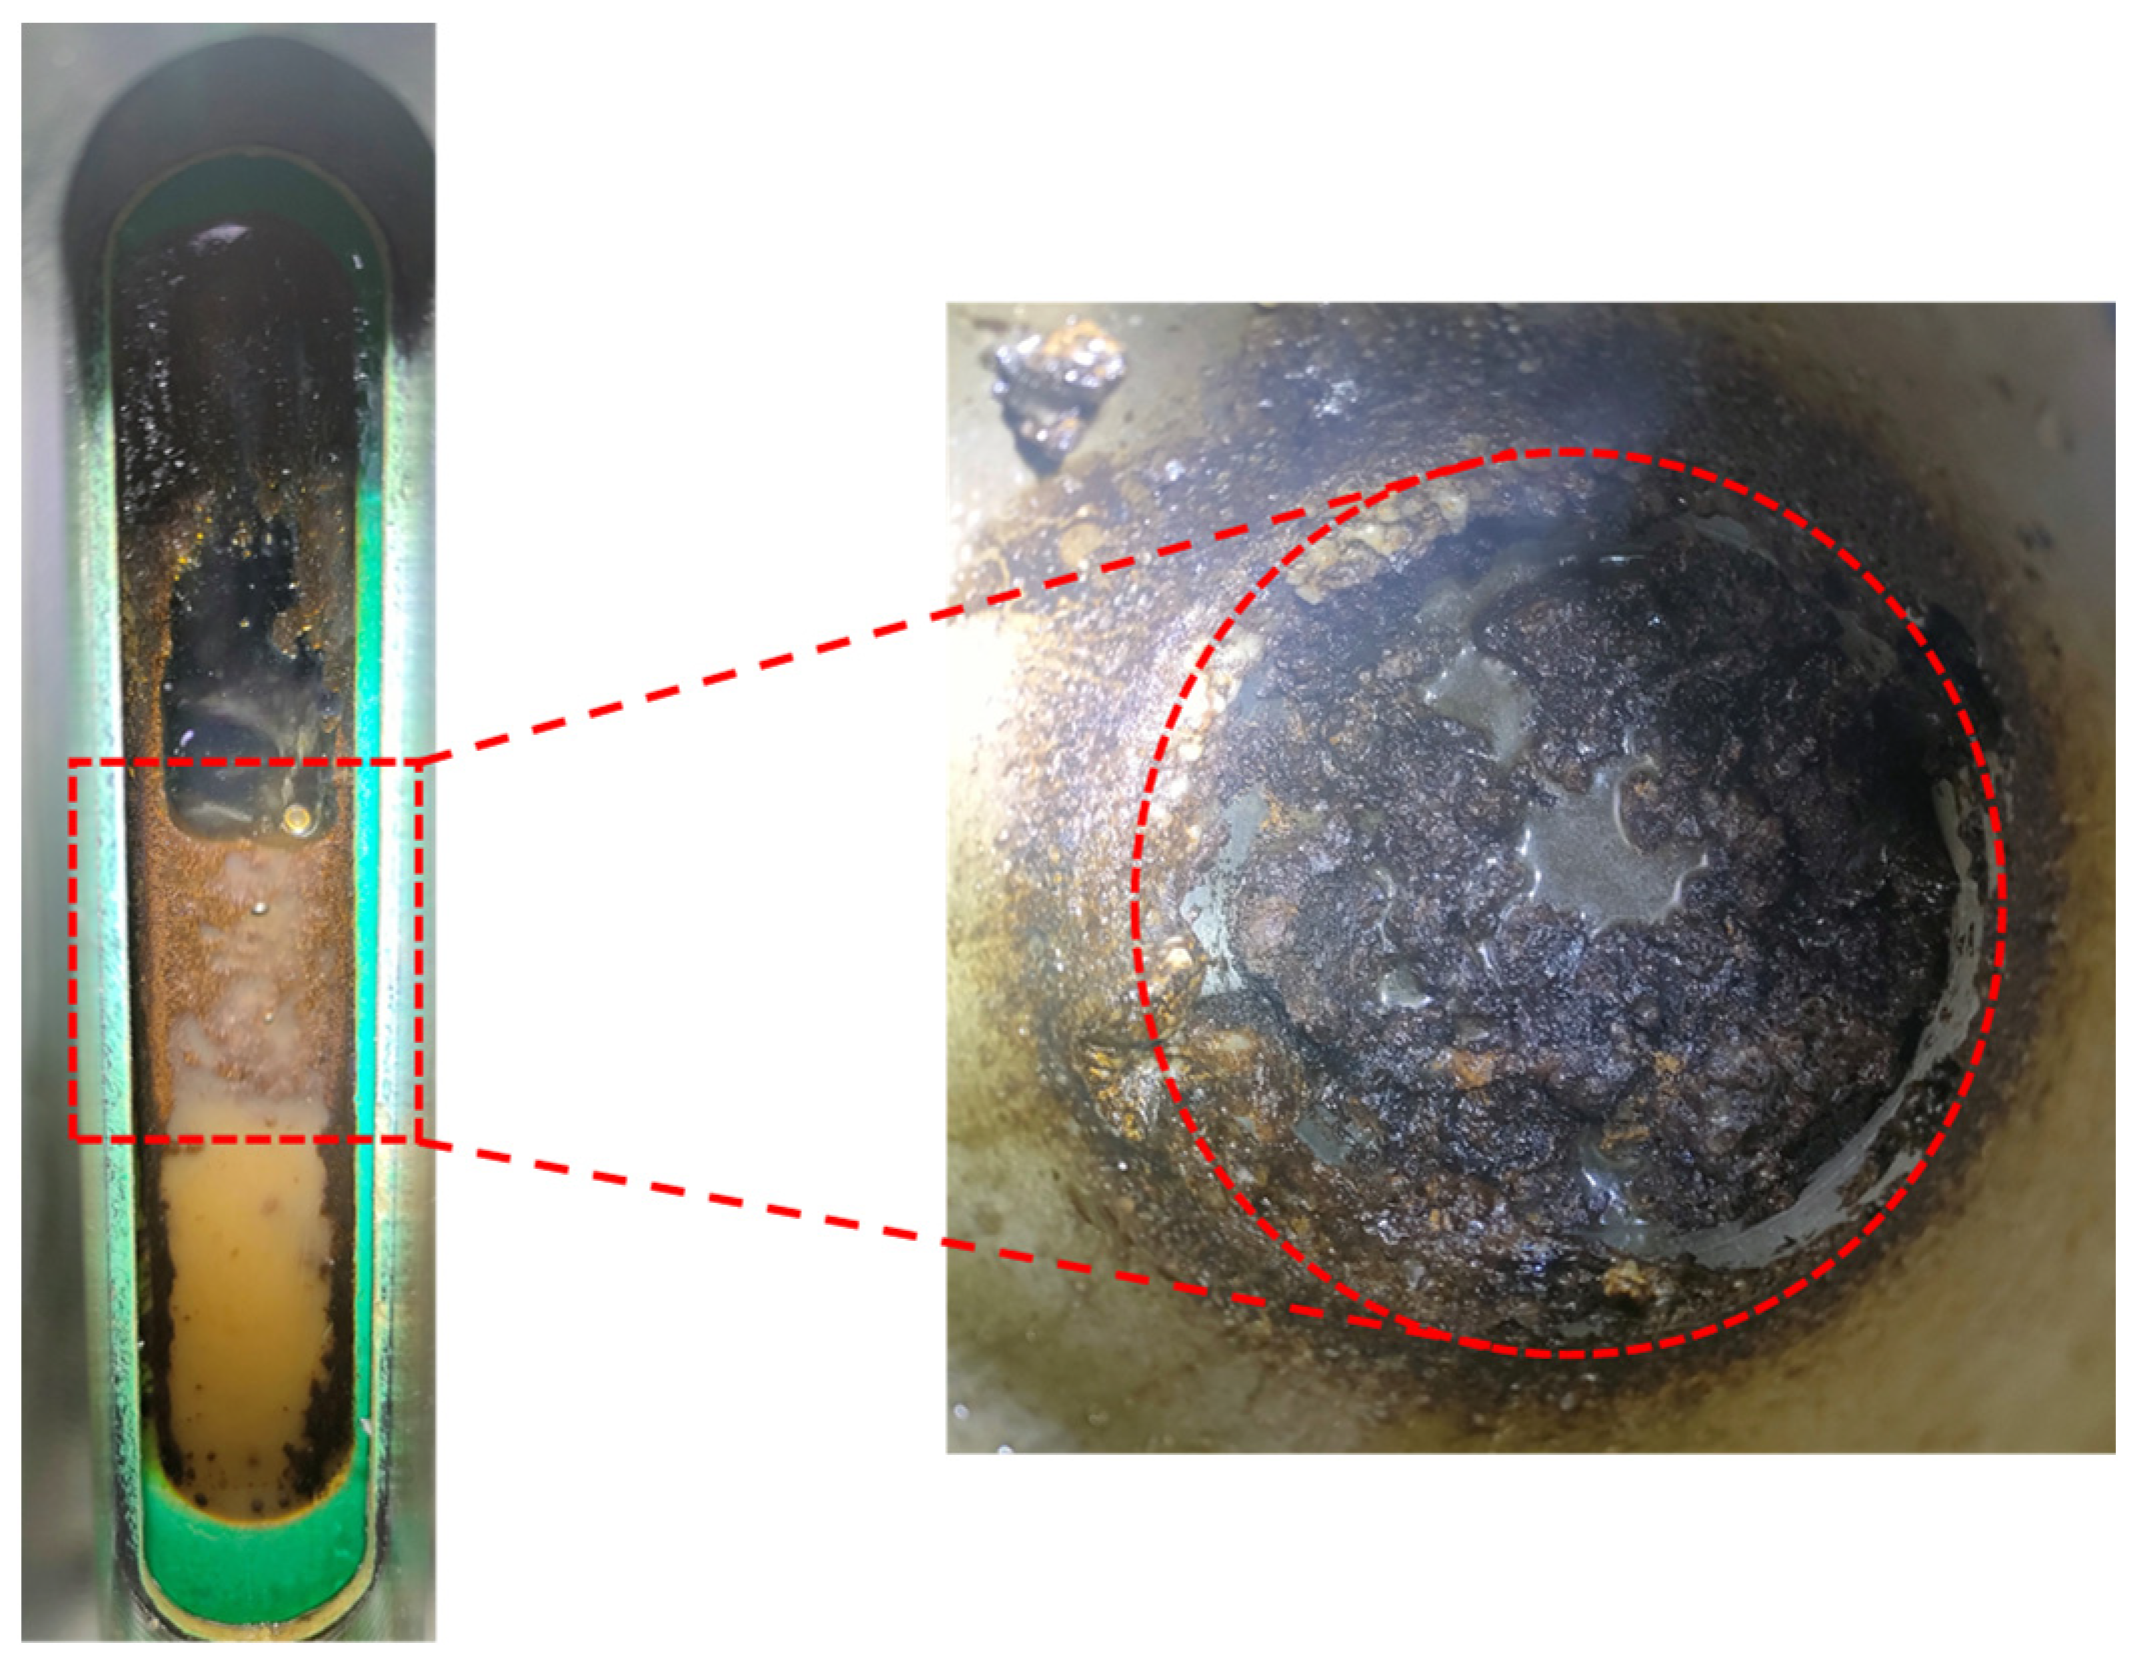
Since gelled water-containing crude oil resembles hydrates in macroscopic morphology, it is necessary to further clarify the differences between them. As observed in Figure 3 and Figure 4, both the gelled crude oil adhered to the visual window and the hydrates exhibit very similar coloration, which may be attributed to the dissolution of certain water-soluble natural components from the crude oil. During the experiment, when the pressure was reduced to 6.0 MPa and the system was cooled to 10 °C, the test was terminated without any detectable sudden changes in temperature or pressure, indicating the absence of hydrate formation. The morphology inside the vessel before and after venting the gas and opening the reactor is shown in Figure 5. It can be seen that in the absence of hydrates, the gelled crude oil and water were stratified and adhered to the visual window, consistent with the phenomena observed between 7.5 and 6.5 MPa, confirming that these formations are not hydrates. Furthermore, the gelled crude oil does not completely isolate the oil from water, which is consistent with the gas–water interface observed in Figure 3. Therefore, under conditions of 7.5~6.5 MPa, hydrates can still form in large quantities. The interface area of the oil/water phase is captured through the irregular polygon of Image J Figi Java8, and then, the ratio of the oil phase to the total area is calculated. It revealed that at a water cut of 50%, the proportion of gelled oil at the interface was approximately 48.79%; at 80 vol% water cut, it was about 41.32%; and at 90 vol% water cut, it decreased to approximately 11.24%. These results indicate that in O/W emulsions, the distribution of gelled crude oil differs from that of waxy model oil, and the gas phase cannot be completely separated from the aqueous phase.
Figure 5.
Characterization of macroscopic morphology of gelled crude oil.
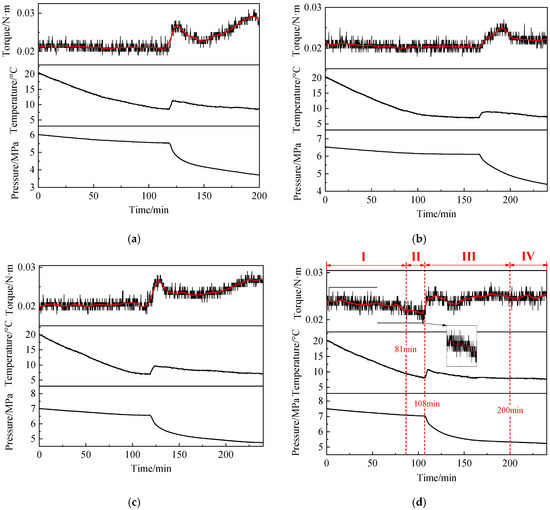
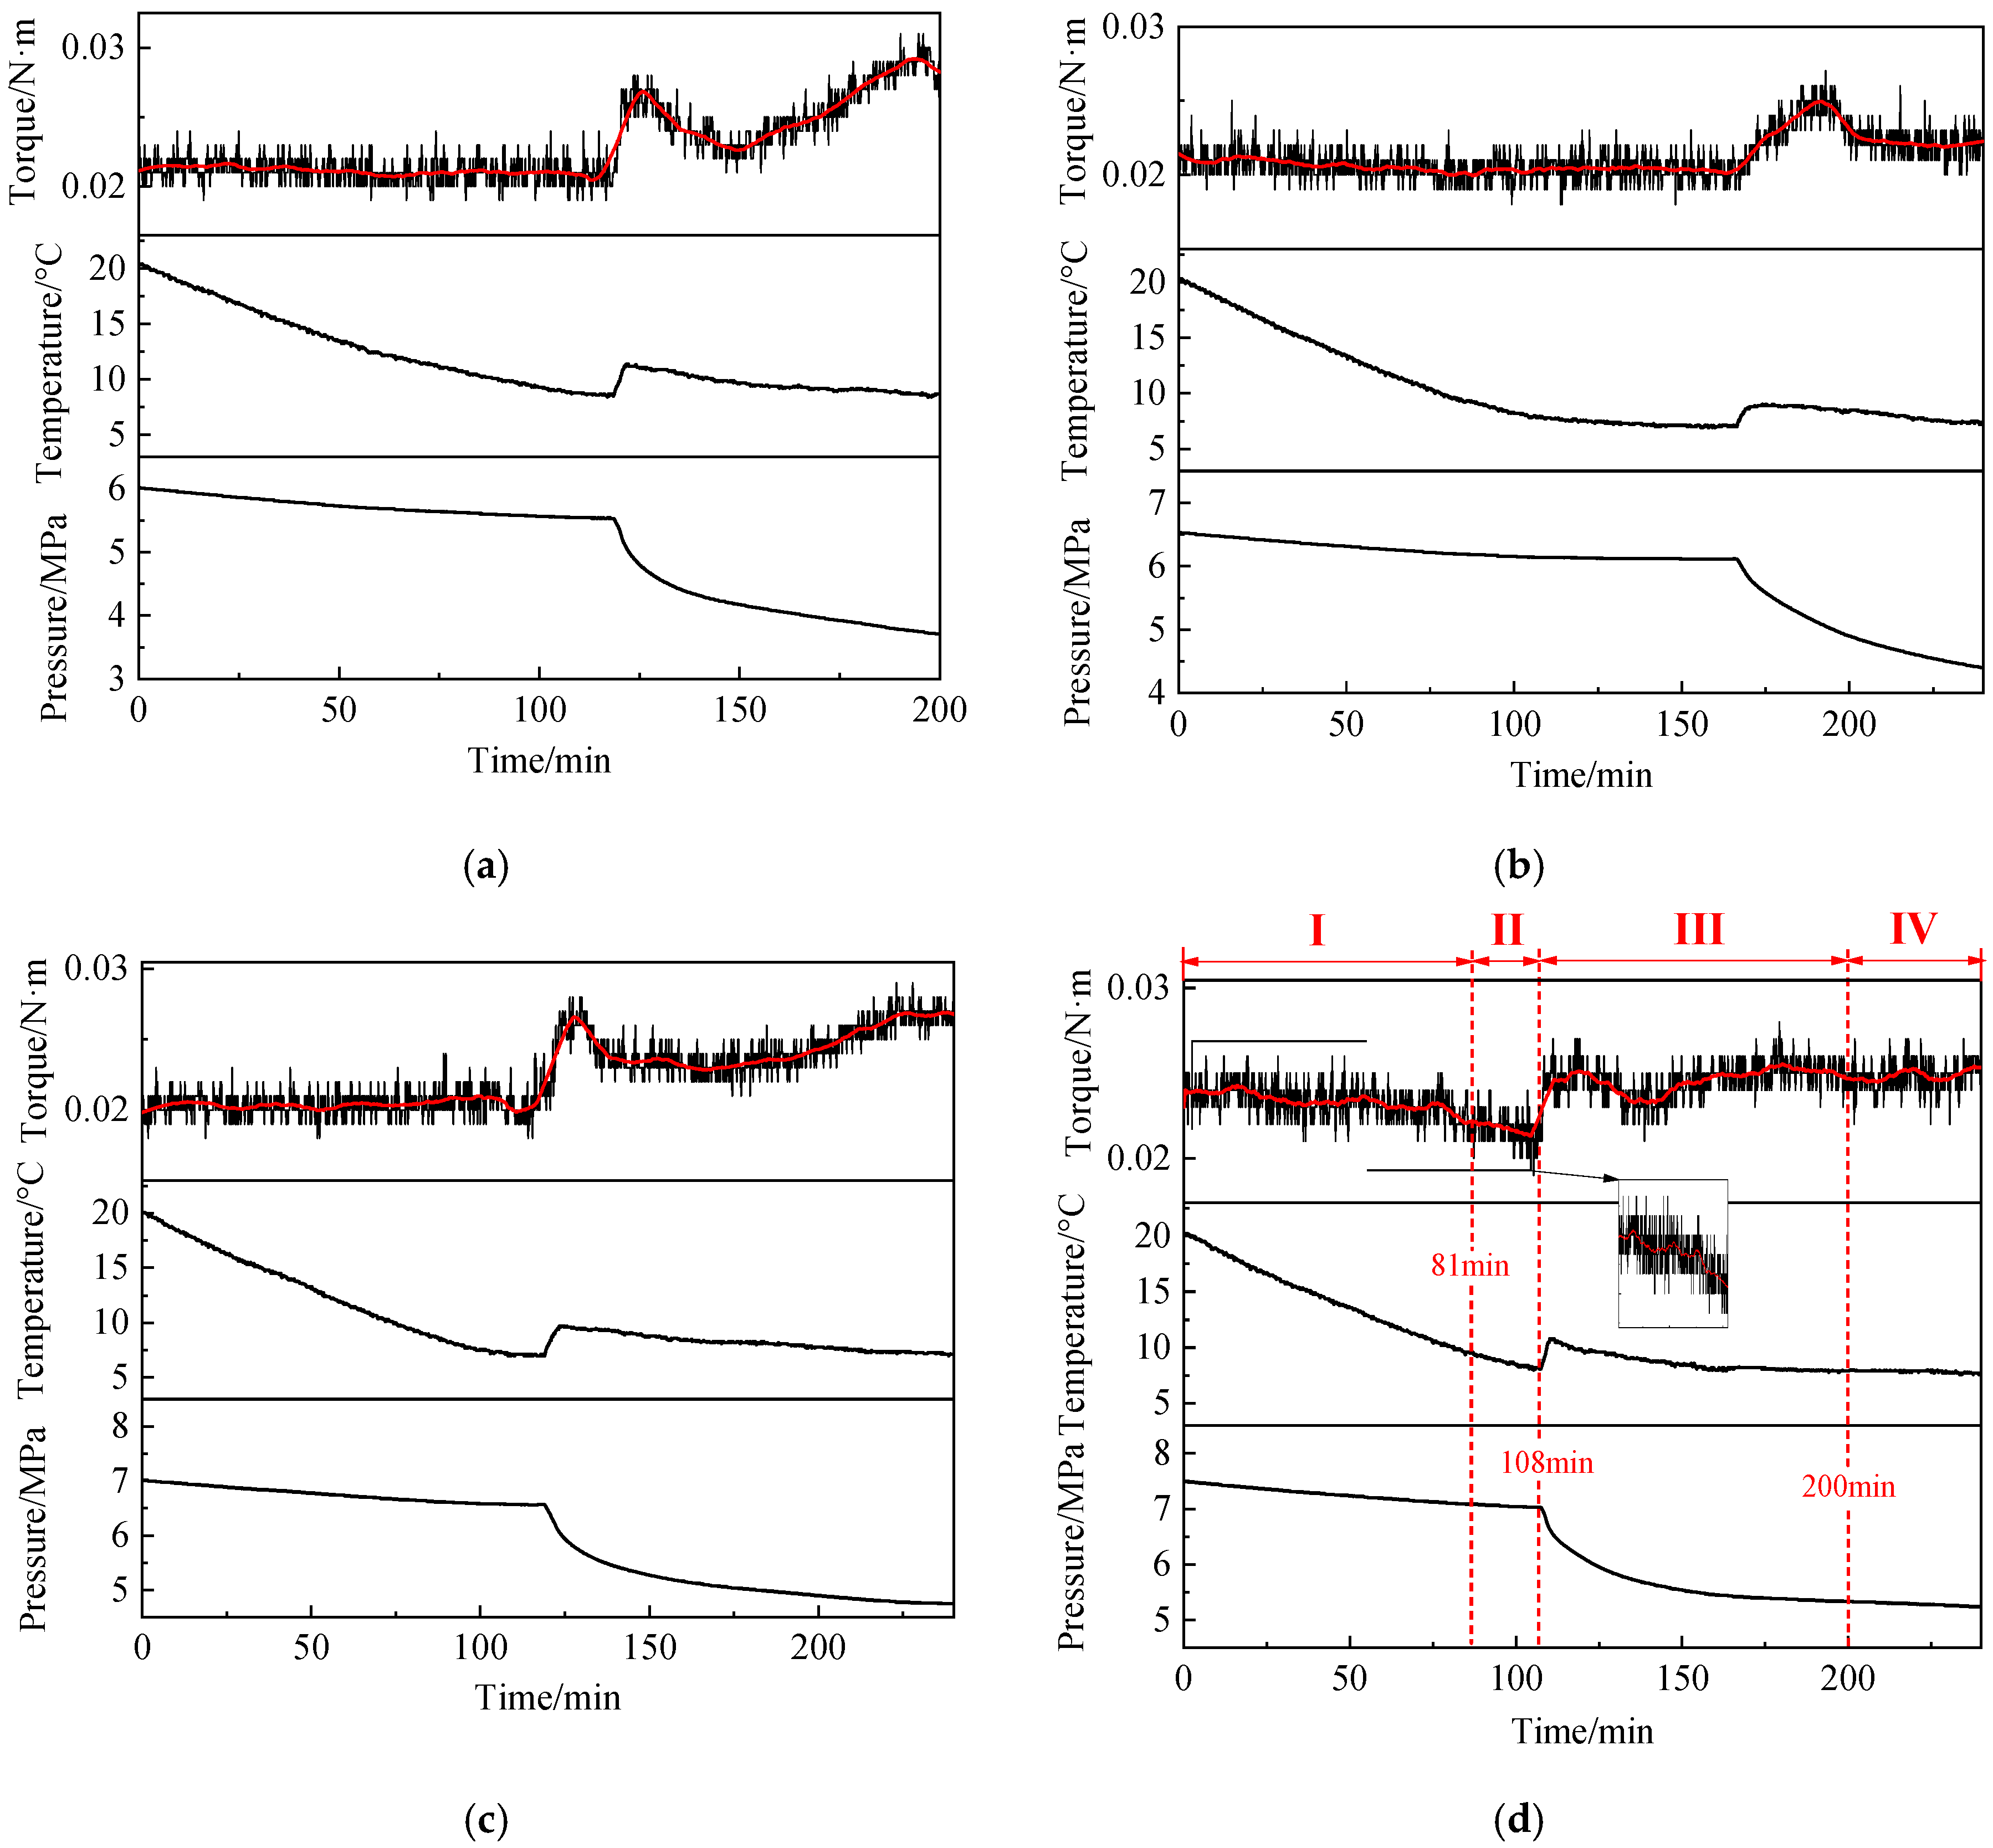
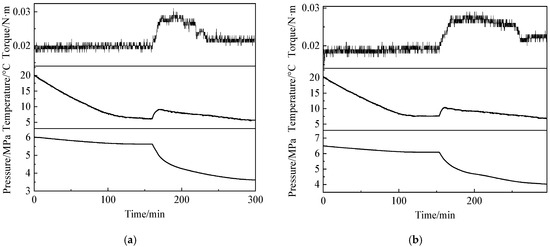
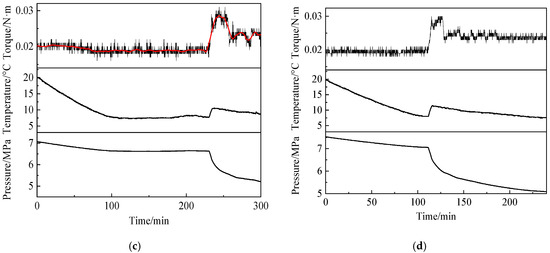
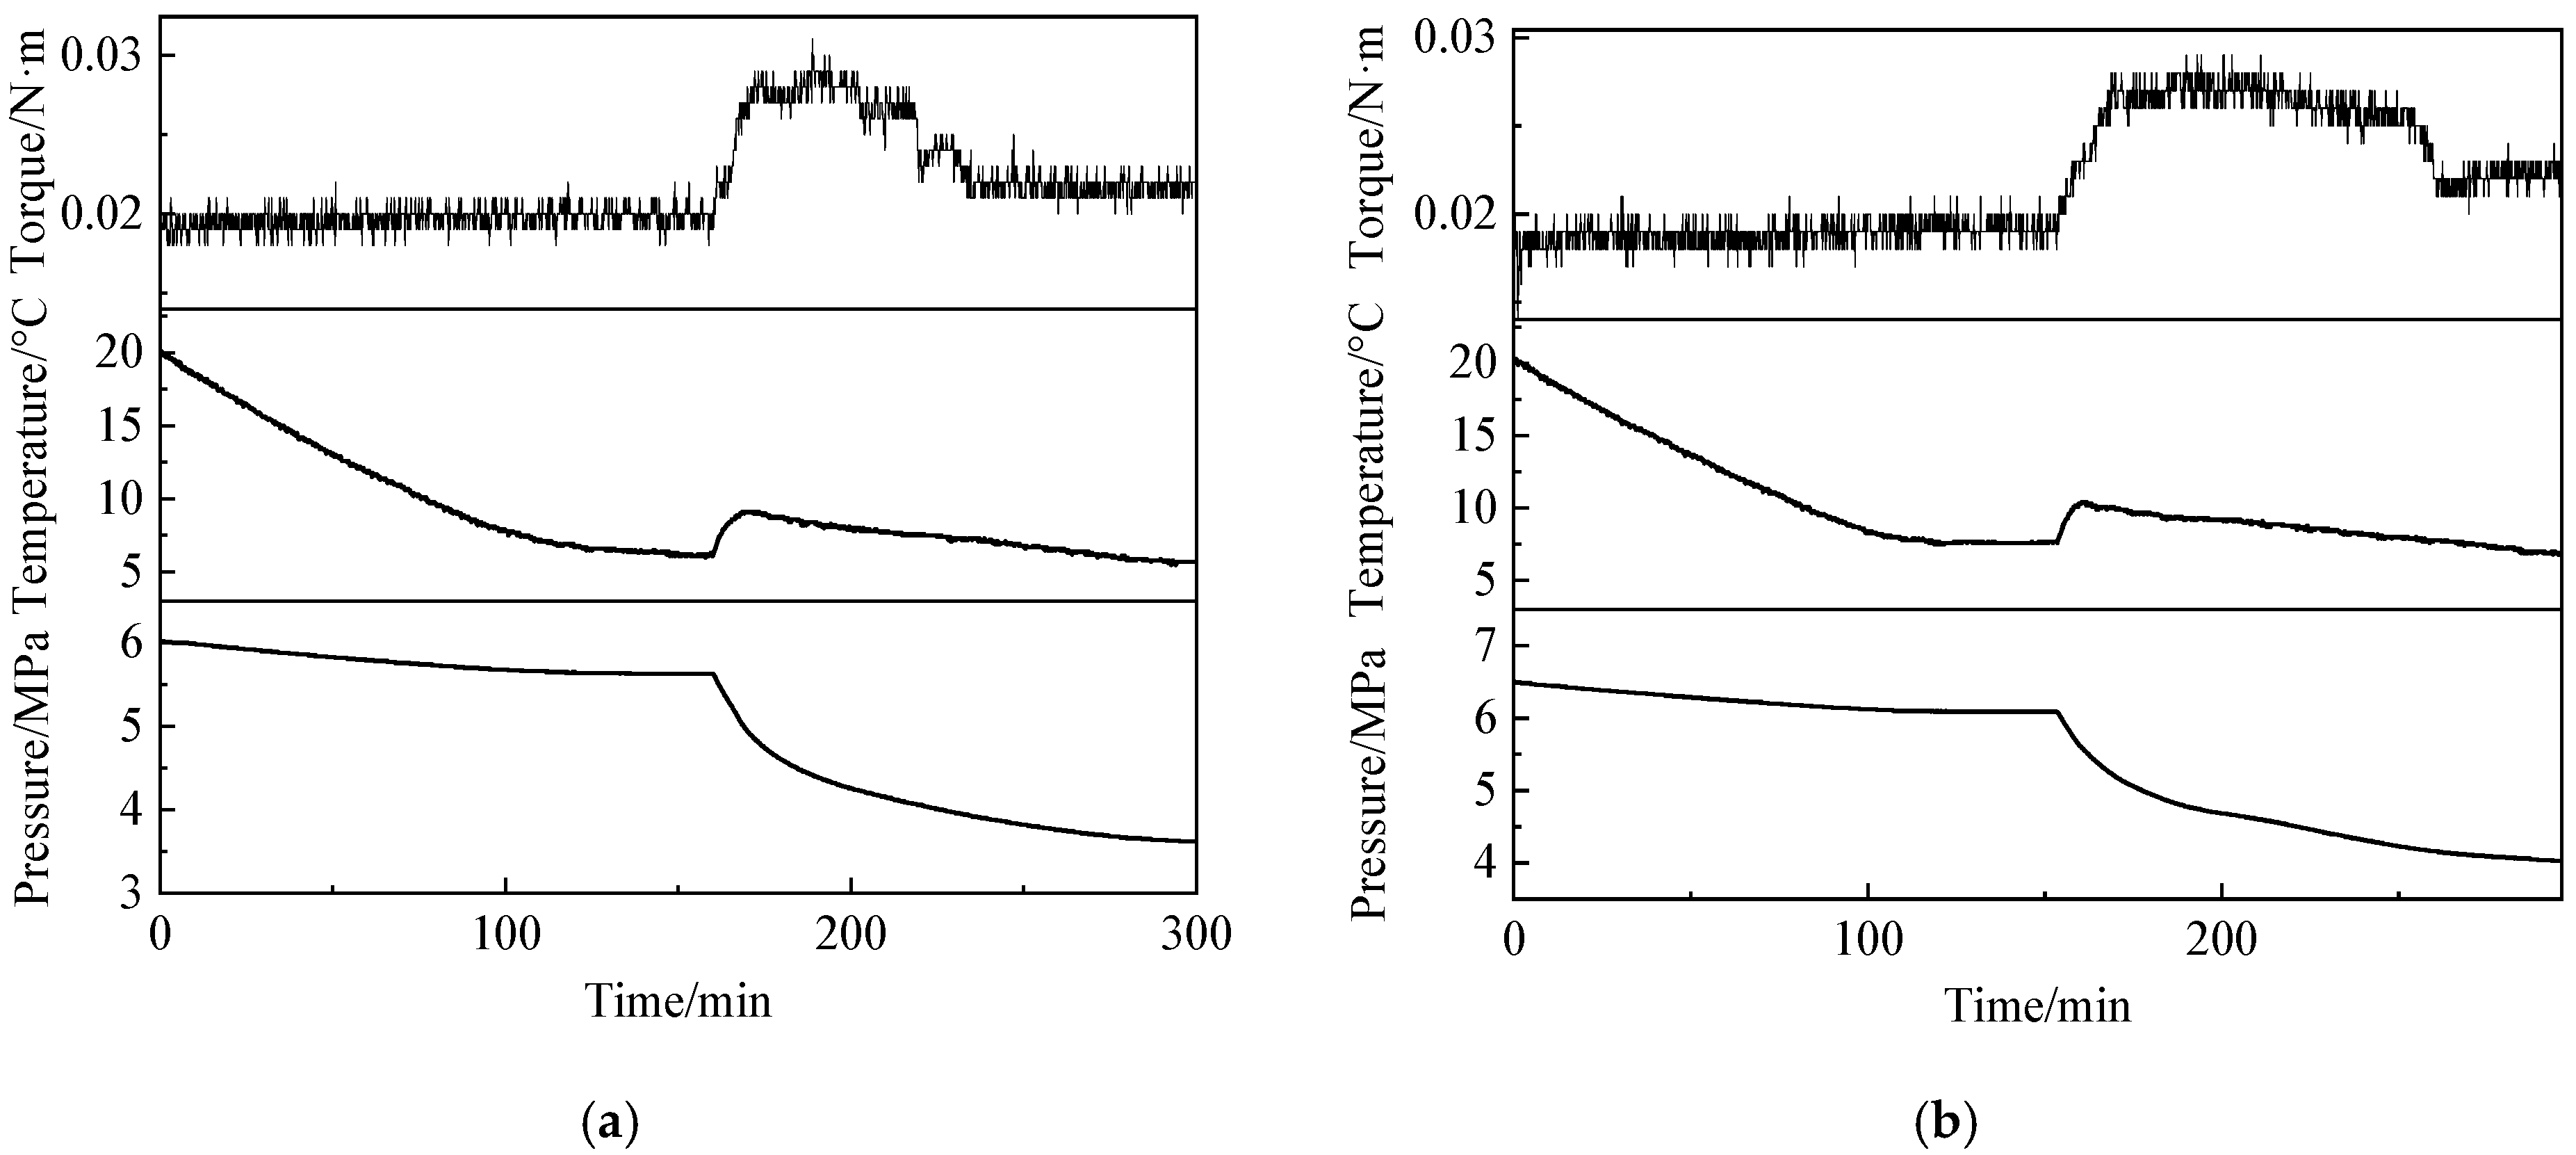
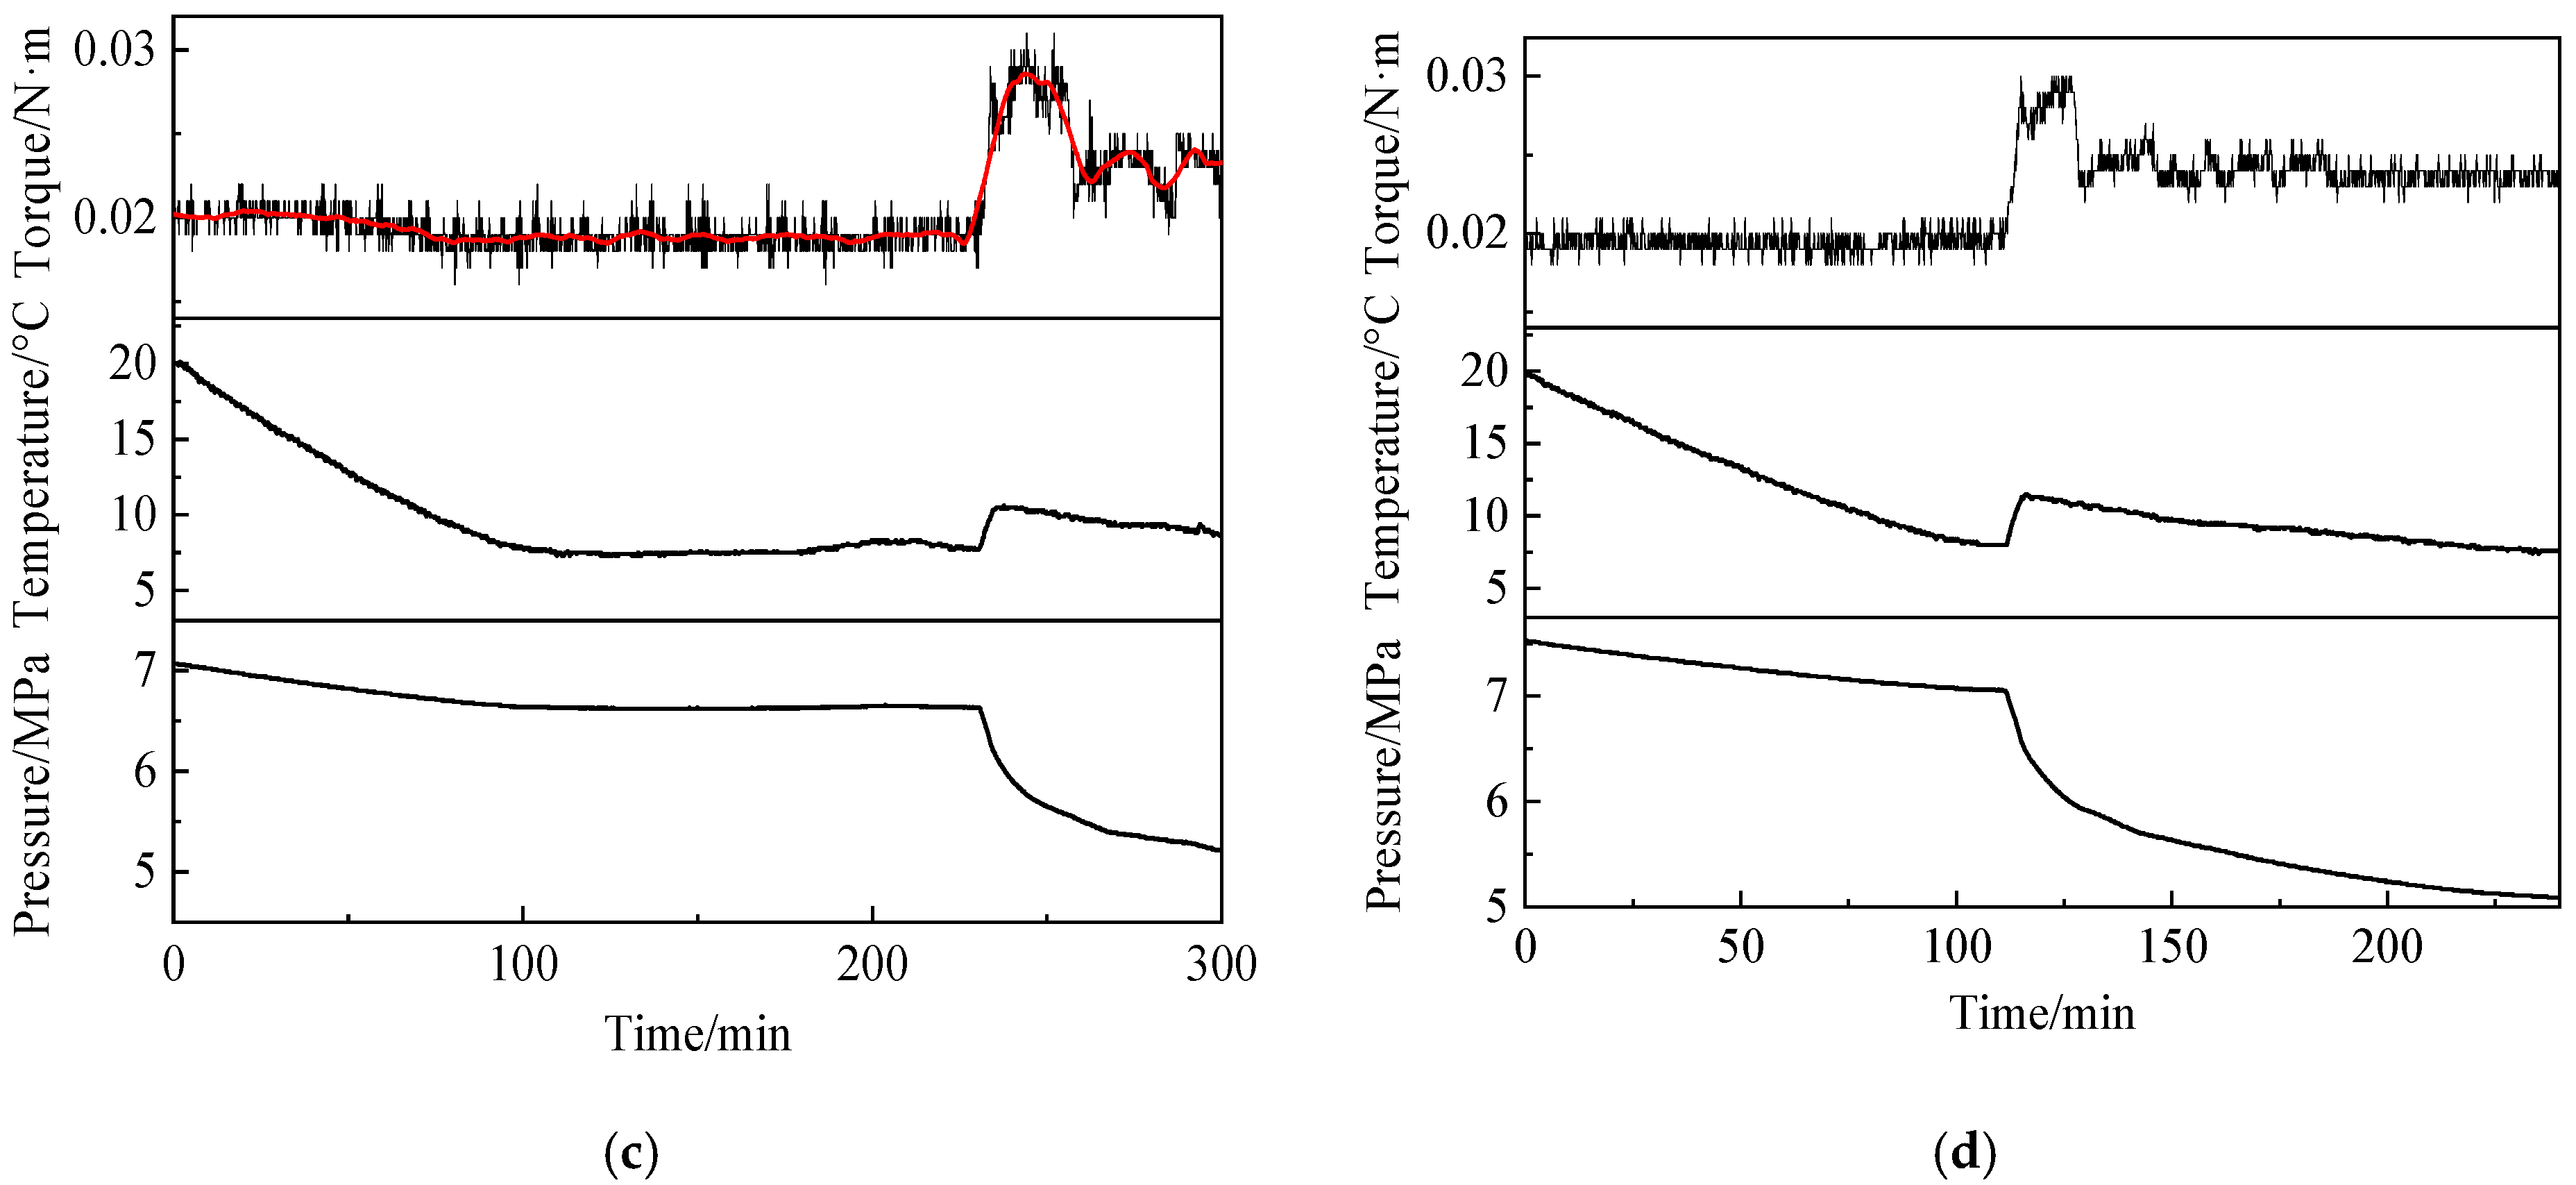
Figure 6 and Figure 7 show the variations in temperature, pressure, and torque during a hydrate formation experiment in an O/W crude oil emulsion system. Torque vibration is due to the mechanical vibration and hydrate aggregation hitting the stirrer. The water cut of 50 vol% is shown in Figure 6, while a water cut of 90 vol% is illustrated in Figure 7. As shown in Figure 6a, a distinctive decrease in torque was observed as temperature decreased prior to hydrate formation under the 50 vol% water cut. This trend is more evident in the smoothed and zoomed-in subsection of the plot, where the torque declined from 0.024 N·m to 0.021 N·m. This behavior contrasts with the increase in torque with decreasing temperature in W/O emulsion systems and the relatively constant torque in pure water systems before hydrate formation. It suggests a reduction in emulsion viscosity as the temperature drops. The stability of the emulsion decreases at lower temperatures, causing the oil droplets suspended in water to coalesce and form a continuous oil phase. This reduces the number of oil droplets near the impeller, thereby lowering the emulsion viscosity. This can be confirmed by the macroscopic morphology of the emulsion in the visual window observed in Figure 3, Figure 4 and Figure 5. Due to the limitations of observation methods, this phenomenon can be more effectively verified by microscopic droplet distribution in the future. In contrast, the torque remained relatively stable at 0.19 ± 0.01 N·m before hydrate formation under the 90 vol% water cut. This is lower than the destabilized O/W emulsion at 50 vol% water cut and is similar to that observed in pure water systems. It indicates that the presence of a small amount of oil droplets has a limited impact on the viscosity of the emulsion.
Figure 6.
Variations in temperature, pressure, and torque during hydrate formation in an O/W emulsion system with 50 vol% water cut: (a) 6.0 MPa; (b) 6.5 MPa; (c) 7.0 MPa; (d) 7.5 MPa.
Figure 7.
Variations in temperature, pressure, and torque during hydrate formation in an O/W emulsion system with 90 vol% water cut: (a) 6.0 MPa; (b) 6.5 MPa; (c) 7.0 MPa; (d) 7.5 MPa.
3.1.2. Analysis of the Hydrate Formation Process
To highlight the characteristics throughout the entire hydrate formation process, the experimental procedure was divided into 4 stages, as shown in Figure 6d, excluding the initial cooling stage (30~20 °C).
(I) Cooling and demulsification stage (0~81 min). During cooling, the emulsion in the reactor transitioned from a uniformly distributed state to an oil–water separated state due to destabilization of the emulsion at low temperatures. This phenomenon was reflected in the torque curve. It indicates a reduction in oil distributed in the continuous aqueous phase, which can be attributed to the relatively low stability of the emulsion prepared at 30 °C.
(II) Hydrate induction period stage (81~108 min). When the temperature dropped to 10.1 °C, the pressure was reduced to 7.10 MPa, which was lower than the CH4 hydrate phase equilibrium condition. It is the onset of the induction period. However, due to insufficient driving force for nucleation, no hydrates were observed. As the temperature further decreased to 8.1 °C and the pressure reduced to 7.02 MPa, a sudden temperature rise and rapid pressure drop occurred. It indicates the onset of massive hydrate formation. The torque increased from the pre-formation value of 0.022 ± 0.001 N·m to the maximum of 0.027 N·m, suggesting a significant increase in system viscosity. The period from reaching hydrate phase equilibrium conditions to the beginning of substantial hydrate formation is referred to as the induction process.
(III) Rapid growth stage (108~200 min). After the induction period, hydrates began forming extensively, accompanied by a rapid decrease in pressure. During this stage, hydrate nucleation, growth, and aggregation occurred simultaneously. When the pressure change is less than 0.1 MPa over 30 min, hydrate formation is considered to have terminated [37].
(IV) Hydrate stabilization stage (after 200 min). As hydrate formation progressed, gas consumption gradually slowed. Eventually, the pressure stabilized, and the temperature remained constant.
3.2. Analysis of Hydrate Formation Mechanisms in W/O Systems
Under conditions without additional emulsifier, the variations of macroscopic parameters over time at water cuts of 60 vol% and 70 vol% are shown in Figure 8. As can be observed in Figure 8a for the 60 vol% water cut, the torque exhibited minor fluctuations before hydrate formation, showing an overall trend of first increasing and then decreasing. After substantial hydrate formation commenced, the torque initially decreased and then increased. Under the 70 vol% water cut condition illustrated in Figure 8b, the torque similarly displayed an initial increase followed by a decrease prior to hydrate formation, and a decreasing trend after hydrate formation. It indicates that before hydrate formation, the torque may exhibit two possible trends: an initial increase followed by a decrease or a continuous increase. The rise in torque is attributed to the gelling of the W/O emulsion at low temperatures, which significantly increases its viscosity. Additionally, the decrease in torque observed under certain conditions may result from incomplete dispersion of droplets during emulsion preparation, leading to emulsion destabilization during cooling. After hydrate formation, the torque shows either a sharp decline followed by a slow increase, or a gradual decrease followed by an increase. Unlike in pure water systems, where hydrate formation leads to an increase in viscosity, the system viscosity decreases. It is important to note that the first abrupt change in torque is caused by the gelling of the emulsion, while the second abrupt change is due to low-temperature demulsification or hydrate-induced emulsion destabilization.
Figure 8.
Variations in macroscopic parameters at (a) 60 vol% and (b) 70 vol% water cut.
In previous studies, Greaves et al. [38] conducted hydrate formation and dissociation experiments under high water cut conditions. They observed that hydrates transformed W/O emulsion into an O/W/O type after dissociation. The experiments were performed at a water cut of 60 vol%. However, a distinct sudden increase in electrical conductivity was detected at the moment of massive hydrate formation. The researchers attributed this phenomenon to hydrates adsorbing onto the measurement probe, causing an abrupt rise in conductivity. Nevertheless, since the probe was located near the bottom of the reactor and hydrate formation is generally considered to initiate predominantly at the gas–liquid interface, the inference that hydrates formed directly on the probe remains questionable. If considered in conjunction with the torque reduction phenomenon observed in our experiments, it is more plausible to attribute the increase in electrical conductivity to phase inversion of the emulsion.
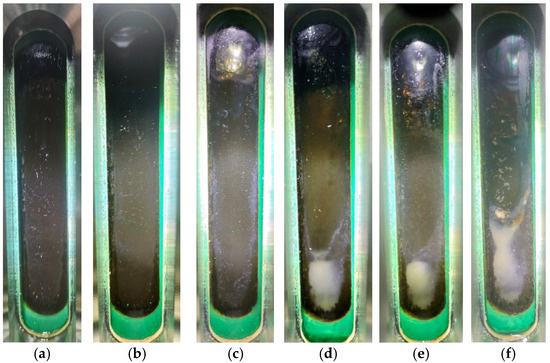
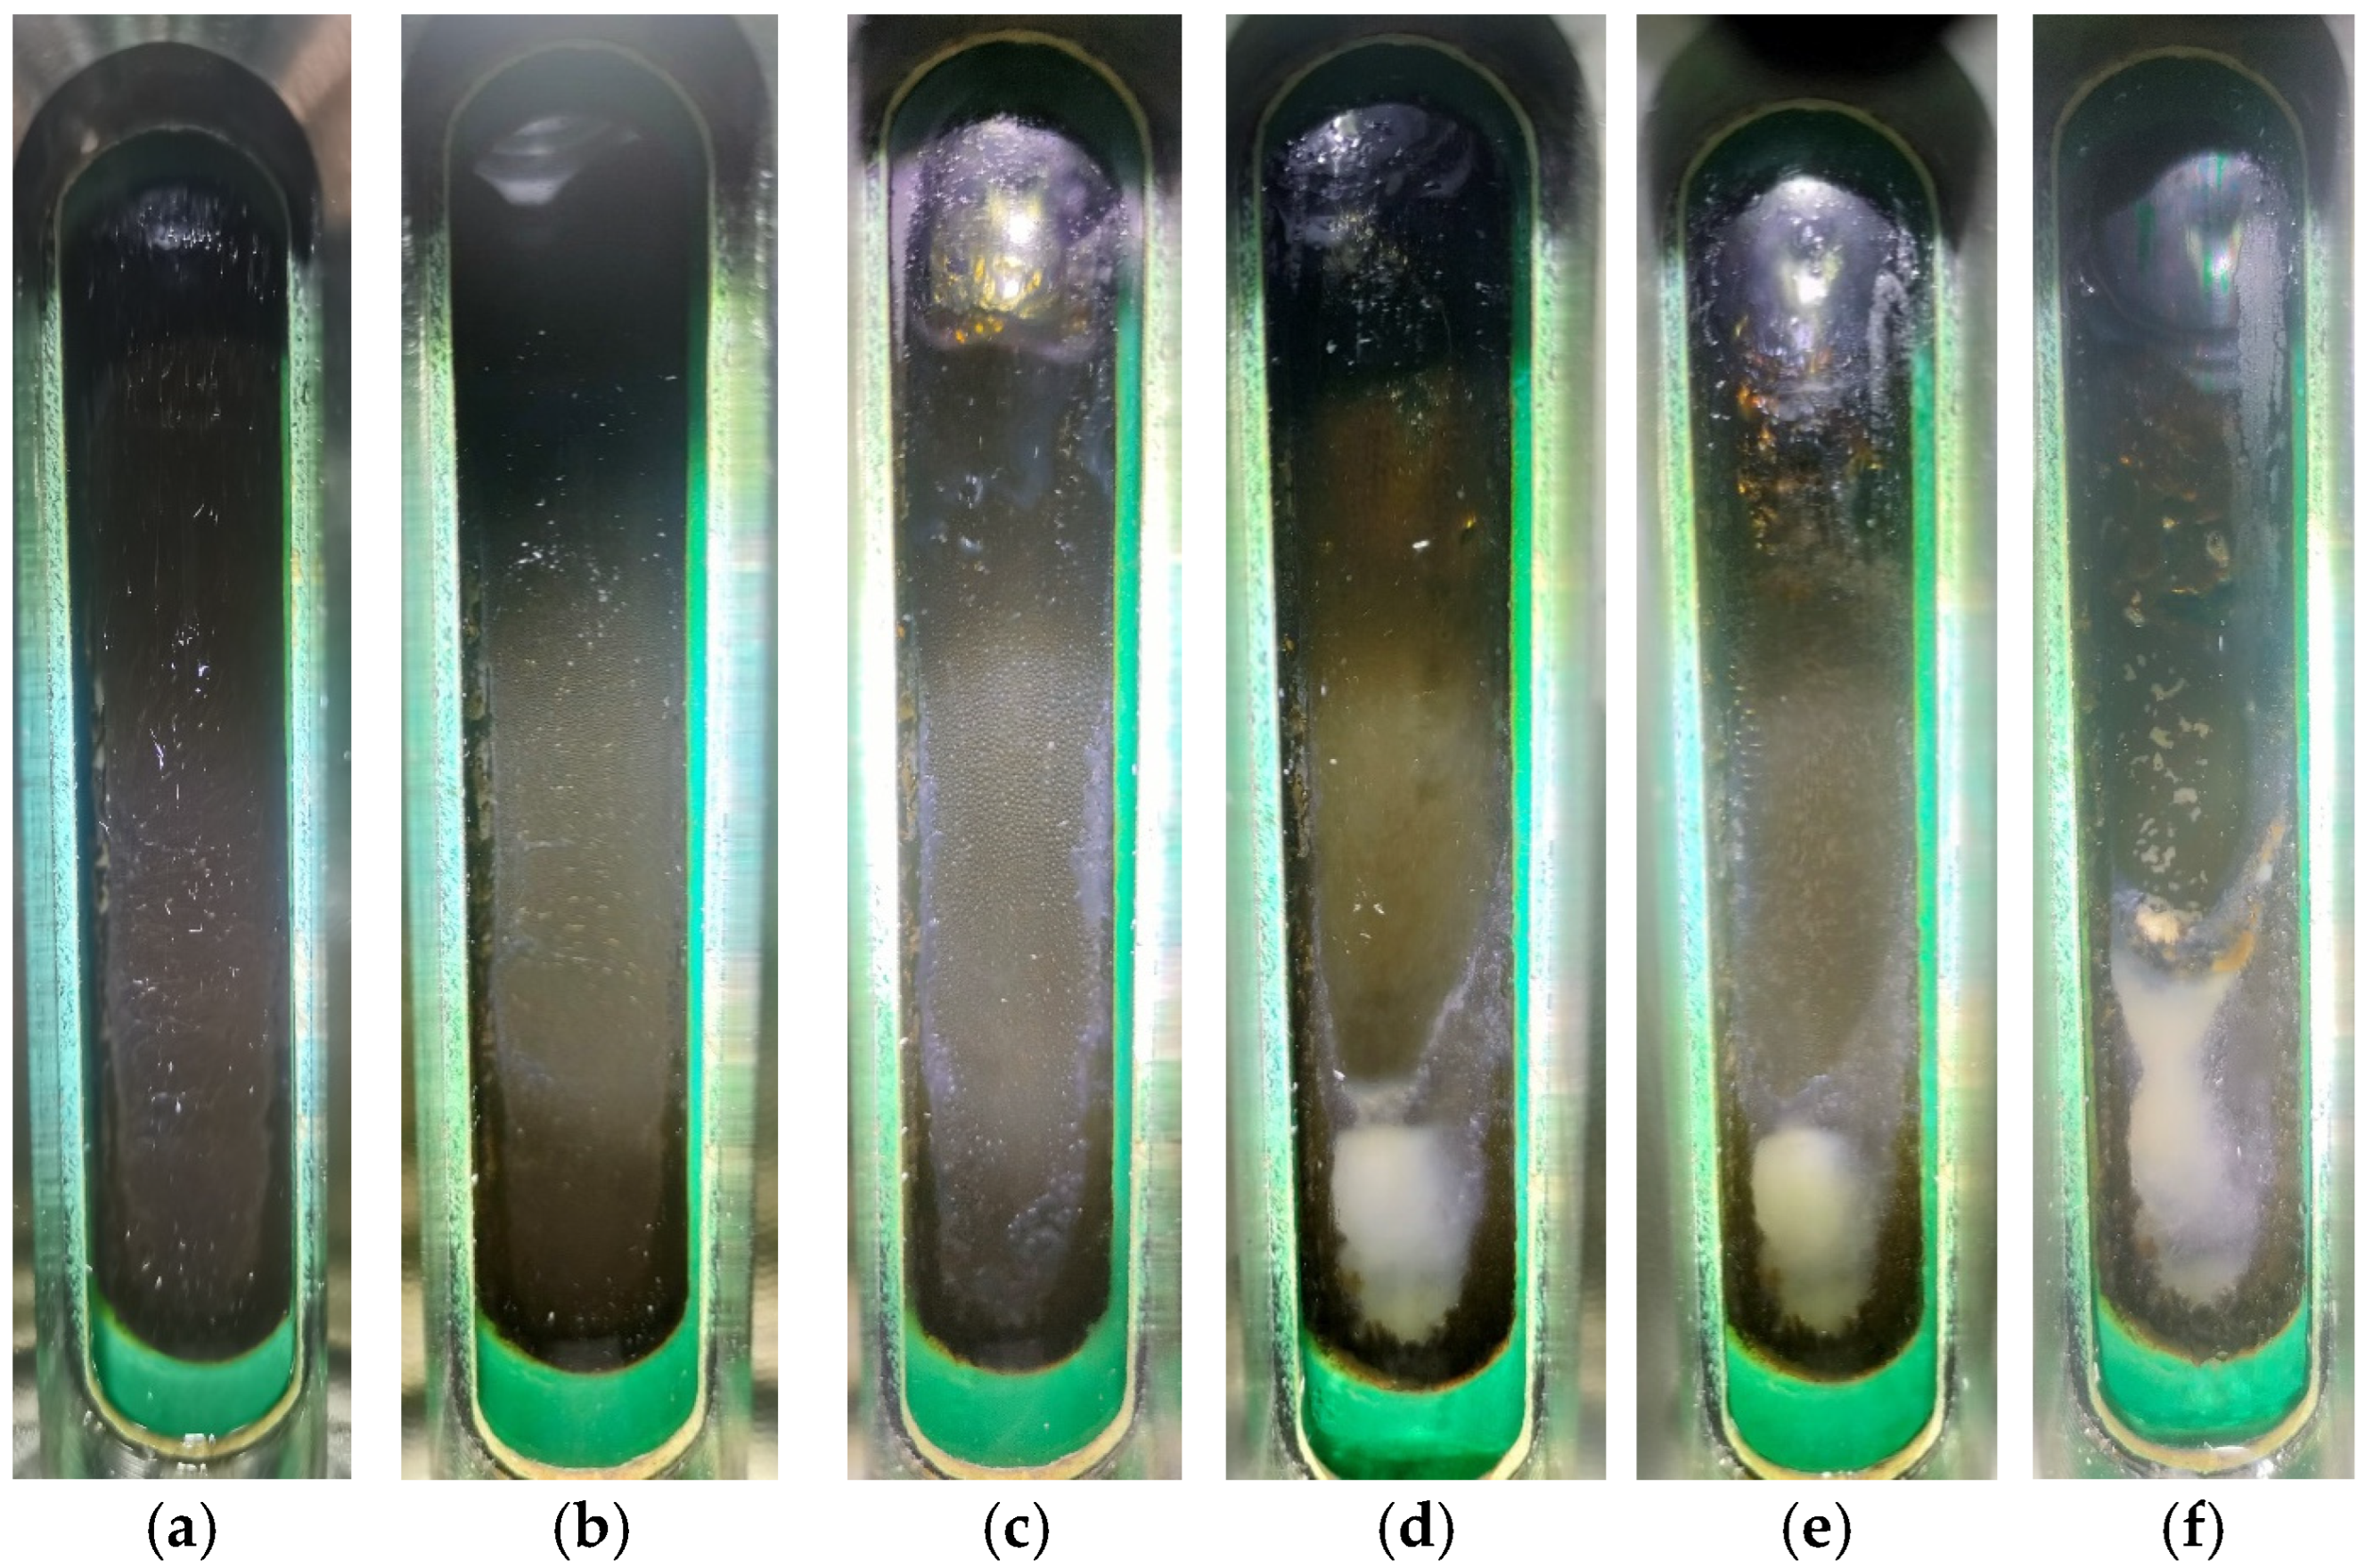
During the hydrate formation process, changes in the emulsion were observed through the visual window, as shown in Figure 9. To enhance visibility, a flashlight was used to illuminate the opposite side of the visual window, while a softer light was directed toward the front to facilitate photography. As shown in Figure 9a,b, the emulsion remained stable during the initial cooling stage, though minor aggregation of the aqueous phase was observable. When the temperature decreased to 15 °C (Figure 9c), solid deposits became clear at the gas–liquid interface because the temperature had dropped below the wax appearance point, and other components such as resins and asphaltenes in the crude oil may have also precipitated and adhered to the wall. When the temperature further decreased to 10 °C (Figure 9d), the phase equilibrium temperature was reached. In the induction period, a distinct oil–water interface began to appear. It indicated that the emulsion started to demulsify. Then, the mass hydrate formation occurred as the temperature dropped to 8.8 °C (Figure 9e, the endpoint of the induction period). The oil–water separation became clearer. It demonstrated that the hydrate formation accelerated the destabilization. Sixty minutes after the onset of hydrate formation, the liquid level dropped significantly (Figure 9f), indicating substantial water consumption.
Figure 9.
Visual observation of hydrate formation at 60 vol% water cut (Exp 6): (a) 30 °C; (b) 20 °C; (c) 15 °C; (d) 10 °C; (e) 7.7 °C; (f) 8.9 °C.
3.3. Comparison of Hydrate Formation in Different Emulsion Systems
3.3.1. Gas Consumption
Both W/O and O/W crude oil emulsions experience destabilization during hydrate formation experiments. While emulsion instability is commonly discussed under high-temperature conditions, demulsification induced by low temperatures has been less frequently reported. Although both types of emulsions become unstable, the underlying mechanisms differ. For W/O emulsions, low temperatures cause water separation prior to hydrate formation, but hydrate formation further enhances emulsion destabilization. In contrast, the instability of O/W emulsions is primarily induced by low temperature itself.
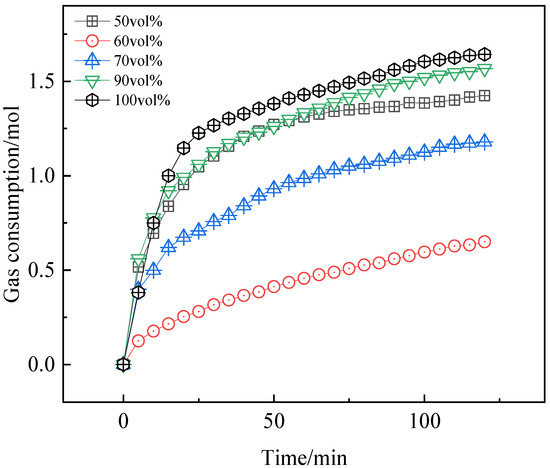
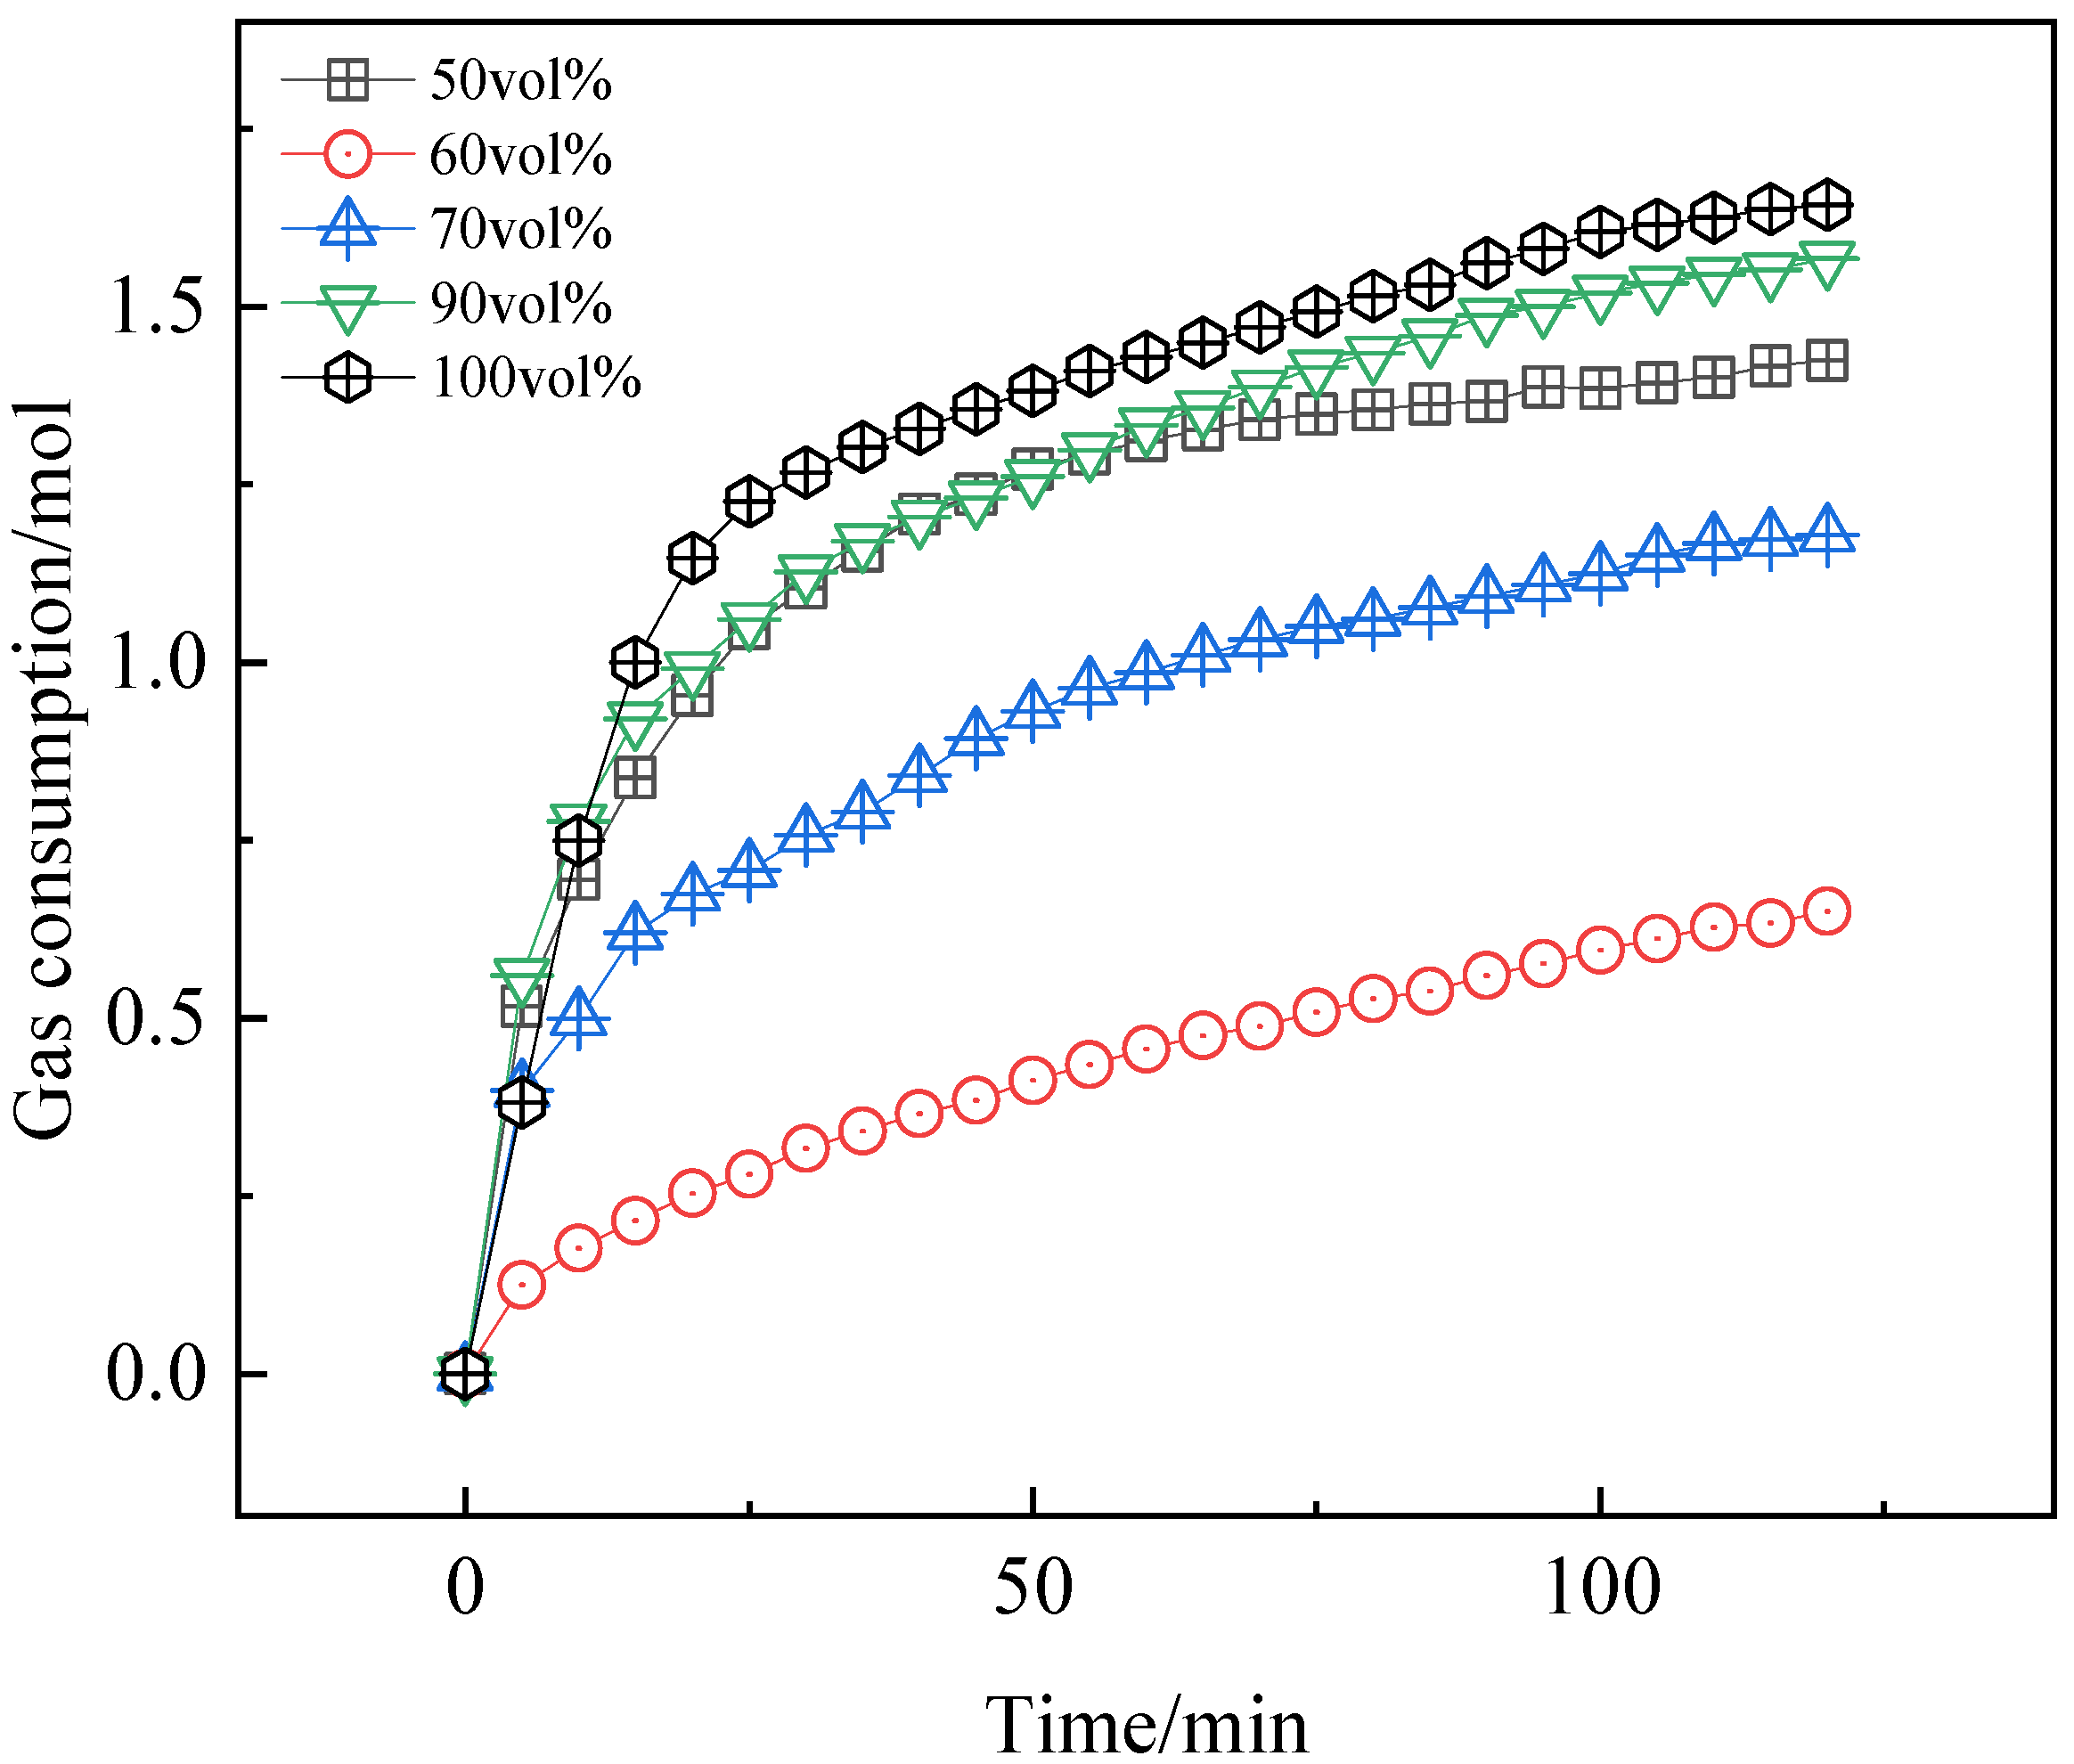
Figure 10 shows the variations in gas consumption during hydrate formation under different water cuts at an initial pressure of 7.5 MPa, a stirring speed of 500 rpm, and a controlled temperature of −3 °C. The calculation of gas consumption can be found in our previous work [4]. The dissolved gas volume varied with the change of temperature, but this effect can usually be ignored [39]. The total liquid volume was maintained at 1.5 L. Since no hydrate formation occurred at 50 vol% water cut, 500 ppm Tween-80 was added to promote water conversion and form an O/W emulsion. A water cut of 100 vol% represents a pure water system. Depending on the water cut and the presence of Tween-80, the oil–water mixture exists in two different forms: W/O emulsion at 60–80 vol% water cut, and O/W emulsion at 50 vol% and 90 vol% water cut. Data are sourced from our published literature [32].
Figure 10.
Effect of water cut on gas consumption at 7.5 MPa.
In the pure water system, the slope of the gas consumption curve decreased gradually over time, indicating a reduction in the rate of gas consumption before entering a slow consumption phase. The trend at 90 vol% water cut was similar to that in the pure water system. With the addition of the O/W emulsifier Tween-80, the gas consumption trend at 50 vol% water cut was almost identical to that at 90 vol%, suggesting that in water-dominated systems, hydrates grow rapidly during the initial gas consumption stage, but the growth rate gradually slows over time.
In the W/O emulsion system at 80 vol% water cut, gas consumption increased almost linearly during the initial growth stage and continued linearly even after slowing down, resulting in a gas consumption curve composed of two distinct linear segments with an obvious transition point. At 70 vol% water cut, the gas consumption trend was similar to that at 80 vol%. However, when the water cut was reduced to 60 vol%, the gas consumption curve exhibited a nearly linear increase throughout, indicating that the transition from rapid to slow gas consumption was significantly delayed as the water cut decreased. In W/O systems, gas consumption increased with higher water cuts. At 120 min, the gas consumption values were 0.650 mol, 1.179 mol, and 1.278 mol for water cuts of 60 vol%, 70 vol%, and 80 vol%, respectively. This represents an increase of 81.38% at 70 vol% and 128.21% at 80 vol% compared to the 60 vol% condition.
In O/W systems, also referencing gas consumption at 120 min, the lowest value was observed at 50 vol% water cut (1.425 mol). Gas consumption increased to 1.568 mol at 90 vol% water cut (a 10.04% increase) and reached 1.643 mol in the pure water system (a 15.30% increase). This indicates that in O/W systems, a higher water cut promotes hydrate growth. Furthermore, comparing W/O and O/W systems, the highest gas consumption in the W/O system (80 vol% water cut) was still lower than the lowest value in the O/W system (50 vol% water cut), demonstrating that O/W systems are more conducive to hydrate growth.
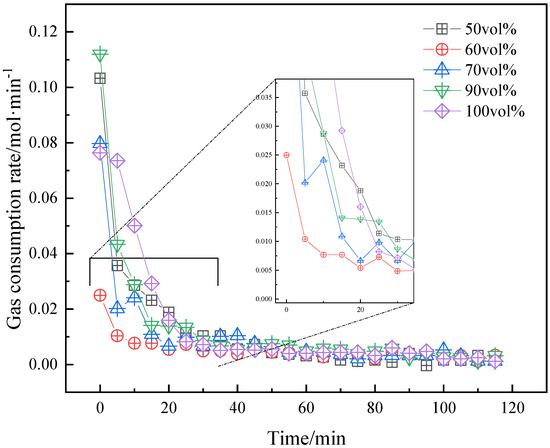
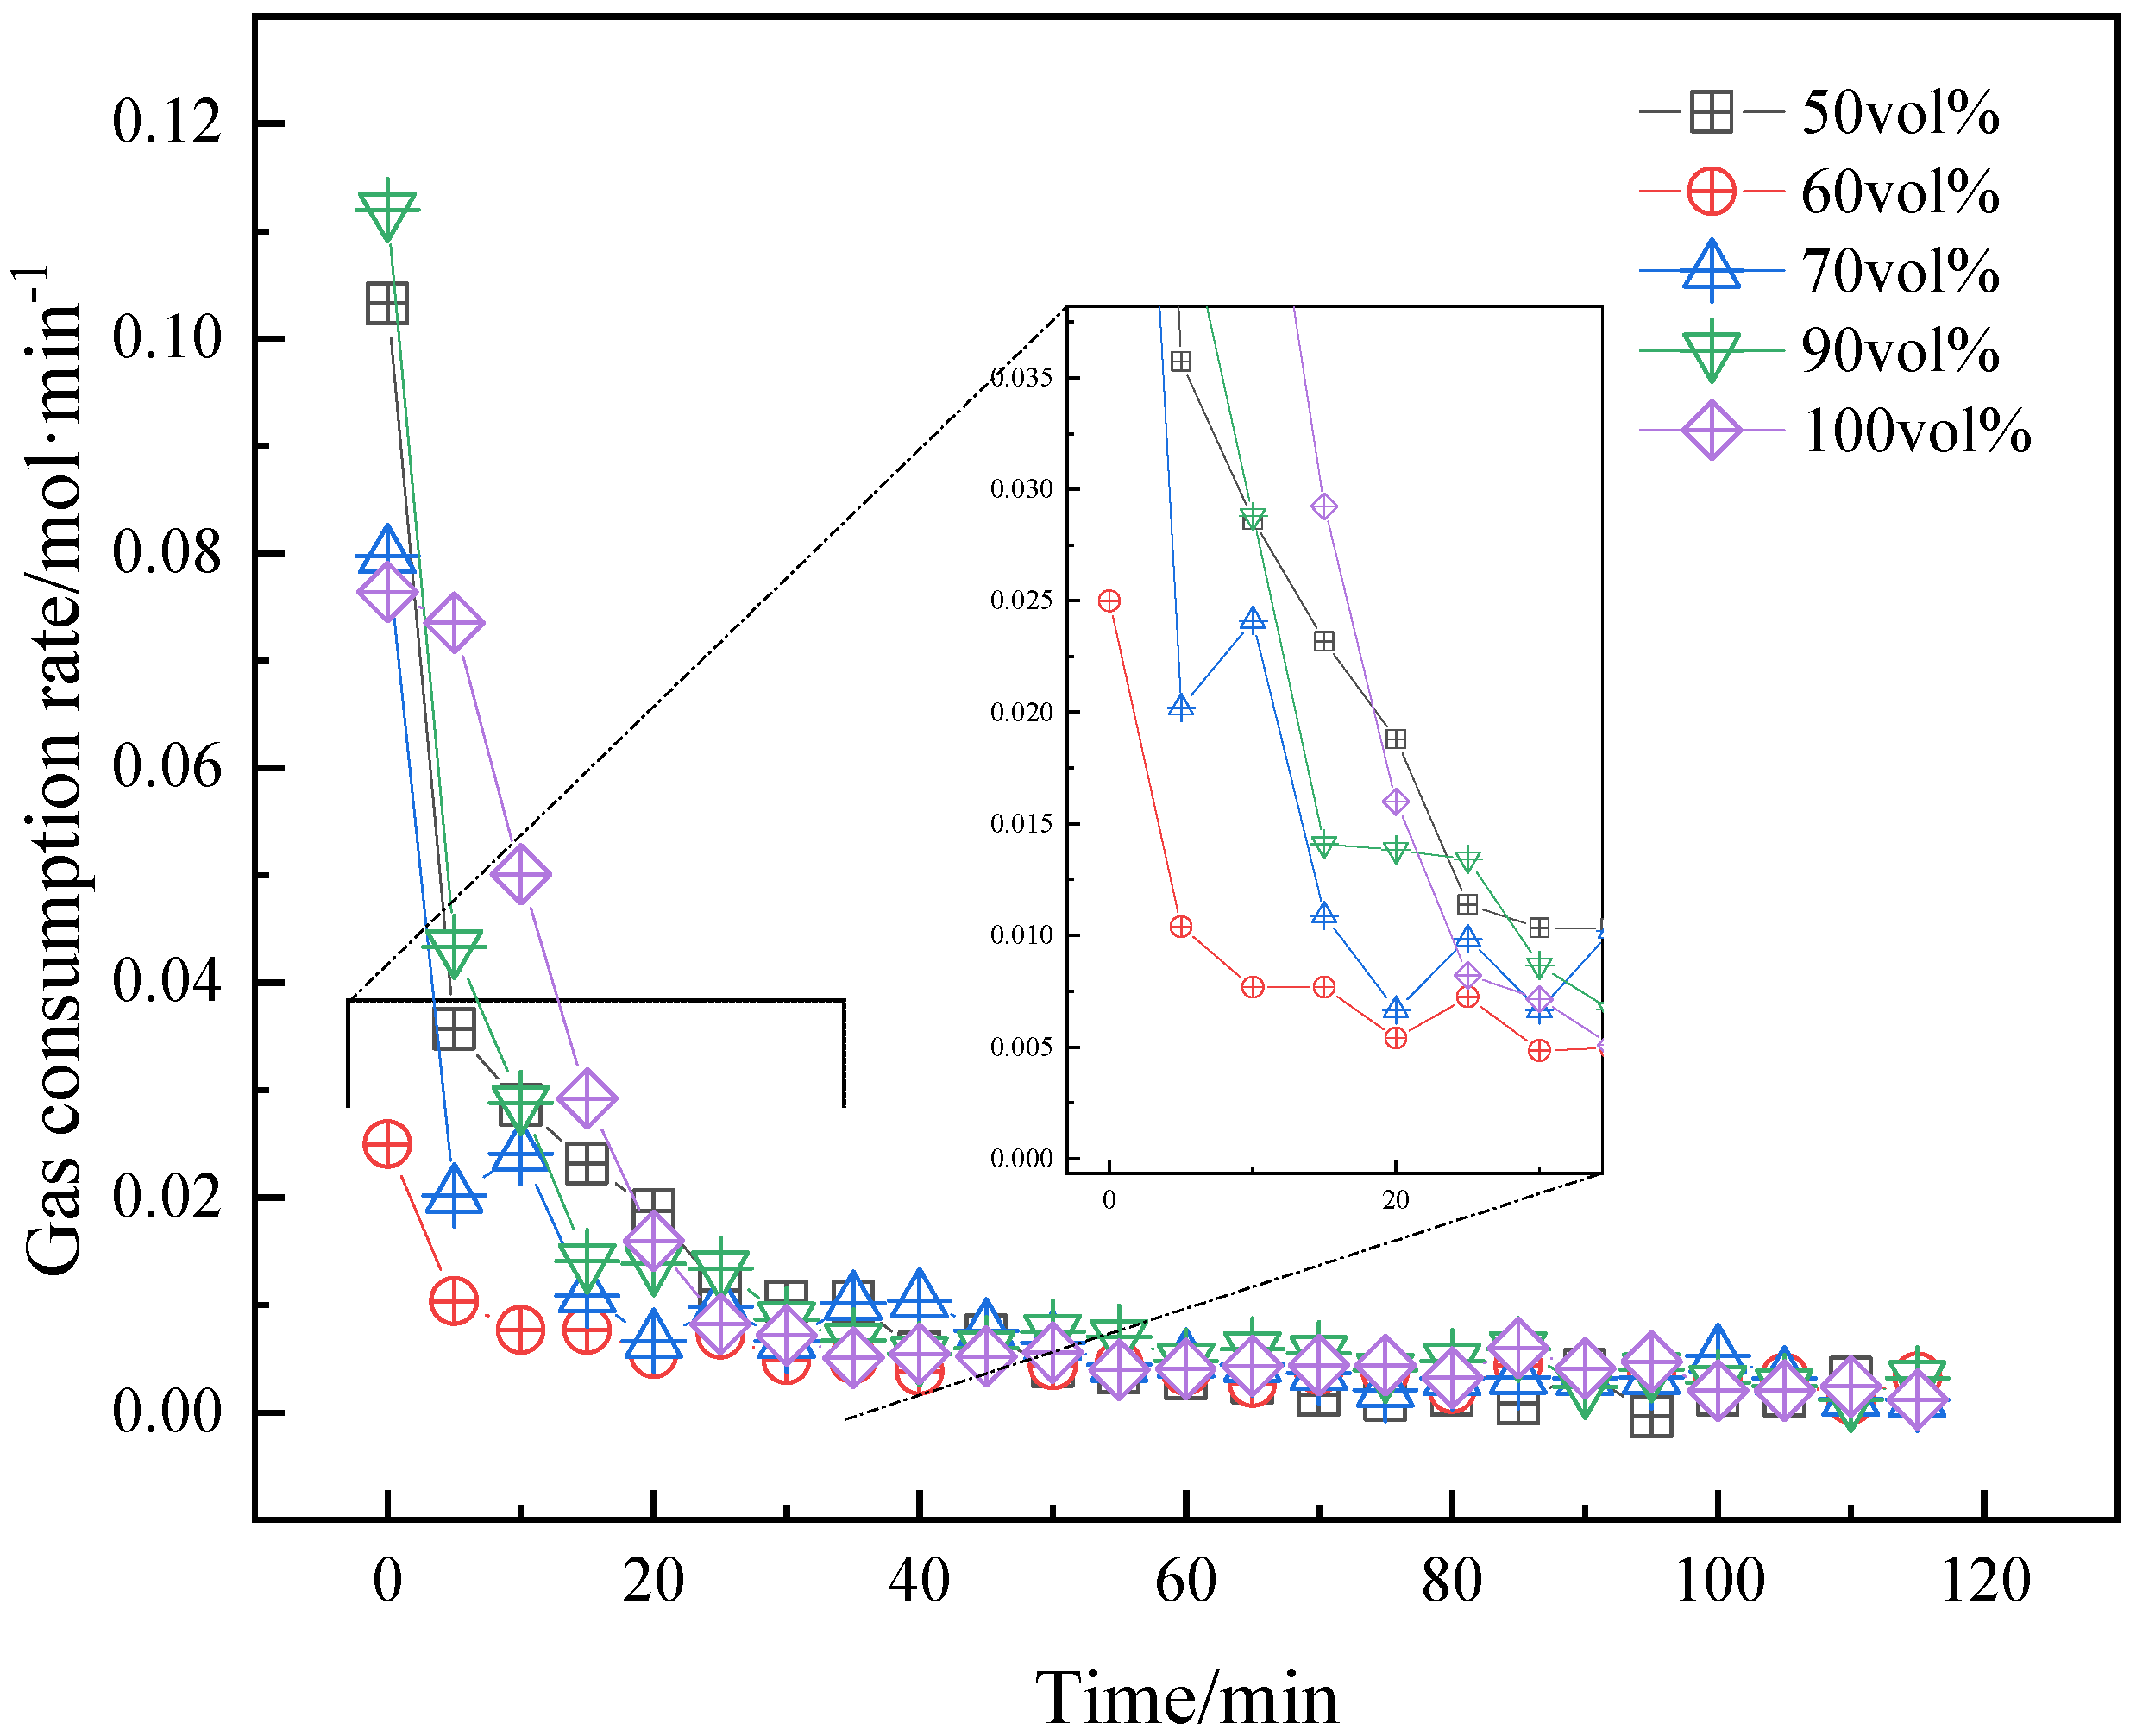
Figure 11 shows the change in gas consumption rate under different water cuts. In general, the gas consumption rate basically shows a gradual decreasing trend over time. The gas consumption rate rapidly declines during the first 30 min and eventually stabilizes. Under a 60 vol% water cut, the fastest gas consumption rate is also significantly lower than under other conditions, at only 0.025 mol/min. Further, once the rate falls below 0.01 mol/min, there is little variation. This point can, therefore, be considered the boundary between rapid and slow gas consumption. From the perspective of the boundary, the time required for the water cut to increase from 50 vol% to 100 vol% was 40 min, 10 min, 20 min, 30 min, and 25 min, respectively. It indicates that the duration of sustained rapid gas consumption is prolonged after adding Tween-80.
Figure 11.
Effect of water cut on gas consumption rate at 7.5 MPa.
3.3.2. Hydrate Formation Process
Based on the analogy between the low-temperature precipitation of fats and the crystallization of wax and asphaltenes, combined with the newly discovered low-temperature destabilization of crude oil O/W emulsions, a mechanism for the low-temperature instability of crude oil O/W emulsions is proposed [4]. This mechanism also serves as a basis for describing the hydrate formation process, as illustrated in Figure 12. Under initial conditions, when the system temperature is relatively high, oil droplets are uniformly dispersed in water, forming a relatively stable O/W emulsion under agitation, as shown in Figure 12a. As the system temperature gradually decreases, wax crystals precipitate within the crude oil, and asphaltenes adsorb at the oil–water interface, agglomerating and existing in solid form at low temperatures. Oil droplets can collide with one another, causing asphaltene aggregates and wax crystals on the surface of one droplet to penetrate the liquid region of another droplet [40,41]. The remaining liquid oil flows out, wetting the asphaltenes and wax crystals and thereby forming liquid bridges between droplets. Given that the droplets have certain shapes, this eventually leads to the formation of irregularly shaped aggregates, as depicted in Figure 12b. The aggregation of numerous droplets results in emulsion destabilization and phase separation. As the temperature continues to drop to conditions favorable for hydrate formation, hydrate shells form near the aggregated oil droplets due to heterogeneous nucleation, as shown in Figure 12c. Owing to the porous structure of hydrates, external gas permeates through the hydrate shell via capillaries and becomes trapped in water cages, facilitating inward hydrate growth. Through contact-induced nucleation, free water outside the hydrate shell readily forms additional hydrates, leading to outward growth. When two adjacent hydrate particles grow closer together or collide under agitation, liquid bridges form between particles, eventually resulting in the formation of hydrate aggregates, as illustrated in Figure 12d. In addition, since oil droplets are enveloped by water, continued hydrate formation may lead to the complete encapsulation of some small oil droplets within hydrates.
Figure 12.
Mechanism of emulsion destabilization and hydrate formation in O/W systems.
Our previous study discussed the mechanism by which hydrates destabilize water-in-oil emulsions [32] but did not specifically address the causes of emulsion instability prior to hydrate formation. Figure 13 illustrates the destabilization process of the water-in-oil emulsion. As shown in Figure 13a, water droplets are uniformly dispersed in the oil phase due to the combined effects of agitation and the presence of asphaltenes. As the temperature decreases, wax crystals precipitate in the continuous oil phase, as seen in Figure 13b. As shown in Figure 13c, at lower temperatures, the solubility of asphaltenes is reduced, causing them to precipitate and co-crystallize with wax, forming aggregates. These aggregates are then adsorbed at the oil–water interface. The formation of these aggregates reduces the amount of asphaltenes originally available at the interface and weakens the strength of the interfacial film. Consequently, the water droplets coalesce upon collision under agitation, connect via liquid bridges as depicted in Figure 13d, and ultimately merge into larger droplets, leading to the destabilization of the emulsion.
Figure 13.
Mechanism of emulsion destabilization and hydrate formation in W/O systems.
4. Conclusions
Experimental studies on hydrate formation were conducted in crude oil-containing systems to investigate the influence of pressure and water cut on hydrate formation mechanisms. By analyzing changes in temperature, pressure, and torque, alongside hydrate morphology evolution, a correlation was identified between emulsion destabilization, hydrate formation, and wax–asphaltene phase transitions. The research medium closely resembles multiphase transport pipelines. The conclusions drawn from this research are as follows.
(1) In the 50 vol% W/O emulsion-containing system, crude oil gel can effectively inhibit the nucleation and growth of hydrates. Emulsion gels occur during the cooling process, which is not conducive to the mass transfer of hydrate formation. These gels cannot form a continuous barrier after adding Tween-80. Tween 80 can promote hydrate formation by changing the emulsion type from W/O to O/W.
(2) Prior to hydrate nucleation, demulsification occurs in W/O emulsions at low temperatures. After hydrate nucleation, demulsification occurs in O/W emulsions at low temperatures. This results from droplets being connected by liquid bridges formed by wax crystal crystallization. This is also reflected in the decrease in emulsion viscosity and torque reduction. But the separated gel-like crude oil does not completely isolate the gas and water phases. It indicates that hydrates can form when subcooling.
(3) O/W emulsions form hydrates easier than W/O emulsions Gas consumption in O/W systems is significantly higher than in W/O systems. The lowest gas consumption in O/W systems exceeds the highest consumption in W/O systems. This indicates that the type of emulsion has a direct impact on hydrate formation.
Author Contributions
Conceptualization, H.Y.; methodology, H.Y. and W.C.; validation, J.Y., L.S. and Y.Z.; formal analysis, L.L.; investigation, J.Y. and L.L.; resources, W.C.; data curation, J.Y. and L.S.; writing—original draft preparation, L.L., W.C. and Y.Z.; writing—review and editing, J.Y. and L.S.; visualization, Q.H.; supervision, X.L.; project administration, X.L.; funding acquisition, Q.H. All authors have read and agreed to the published version of the manuscript.
Funding
This research was funded by the Natural Science Foundation of Chongqing (No. CSTB2024NSCQ-MSX1103).
Data Availability Statement
Data are available on request due to restrictions (Due to laboratory confidentiality policies and the fact that these data are reserved for future research).
Conflicts of Interest
Authors Jie Yuan, Liangchen Lv, Wen Cheng, and Lin Sun were employed by Shunan gas mine of PetroChina Southwest Oil and Gas field company. Author Yulin Zhu was employed by Yibin Huayou Natural Gas Co., Ltd. The remaining authors declare that the research was conducted in the absence of any commercial or financial relationships that could be construed as a potential conflict of interest.
References
- Yang, Y.; Huang, F.; Kang, S. Mechanism of Penetration Rate Improvement in Hot Dry Rock Under the Coupling of Impact Load and Confining Pressure Release. Reserv. Sci. 2026, 2, 52–64. [Google Scholar] [CrossRef] [Scilit]
- Tahir, M.U.; Guo, S. Preliminary Investigation of Fracture Behavior during Carbon Dioxide Fracturing of Natural Hydrogen Reservoir with Hard-Core Imperfections. Reserv. Sci. 2026, 2, 34–51. [Google Scholar] [CrossRef] [Scilit]
- Wang, J.; Meng, Y.; Han, B.; Liu, Z.; Zhang, L.; Yao, H.; Wu, Z.; Chu, J.; Yang, L.; Zhao, J.; et al. Hydrate blockage in subsea oil/gas flowlines: Prediction, prevention, and remediation. Chem. Eng. J. 2023, 461, 142020. [Google Scholar] [CrossRef] [Scilit]
- Jing, J.; Yang, H.; Sun, J.; Tan, J. Study of the synergistic effect of emulsion gels and methane hydrate slurry on pipeline plugging characteristics. SPE J. 2025, 30, 5725–5742. [Google Scholar] [CrossRef] [Scilit]
- Li, M.; Liu, J.; Xia, Y. Risk Prediction of Gas Hydrate Formation in the Wellbore and Subsea Gathering System of Deep-Water Turbidite Reservoirs: Case Analysis from the South China Sea. Reserv. Sci. 2025, 1, 52–72. [Google Scholar] [CrossRef] [Scilit]
- Zhang, J.; Li, C.; Shi, L.; Xia, X.; Yang, F.; Sun, G. The formation and aggregation of hydrate in w/o emulsion containing different compositions: A review. Chem. Eng. J. 2022, 445, 136800. [Google Scholar] [CrossRef] [Scilit]
- Ma, Q.; Wang, W.; Liu, Y.; Yang, J.; Shi, B.; Gong, J. Wax adsorption at paraffin oil–water interface stabilized by span80. Colloids Surf. A Physicochem. Eng. Asp. 2017, 518, 73–79. [Google Scholar] [CrossRef] [Scilit]
- Kök, M.V.; Varfolomeev, M.A.; Nurgaliev, D.K. Wax appearance temperature (wat) determinations of different origin crude oils by differential scanning calorimetry. J. Pet. Sci. Eng. 2018, 168, 542–545. [Google Scholar] [CrossRef] [Scilit]
- Helsper, S.; Liberatore, M.W. Wax appearance temperature under shear in methane-saturated mineral oil + paraffin wax mixtures: Effects of concentration and pressure. Fuel 2024, 357, 129671. [Google Scholar] [CrossRef] [Scilit]
- Haj-Shafiei, S.; Ghosh, S.; Rousseau, D. Kinetic stability and rheology of wax-stabilized water-in-oil emulsions at different water cuts. J. Colloid Interface Sci. 2013, 410, 11–20. [Google Scholar] [CrossRef] [Scilit] [PubMed]
- Szumała, P.; Luty, N. Effect of different crystalline structures on w/o and o/w/o wax emulsion stability. Colloids Surf. A Physicochem. Eng. Asp. 2016, 499, 131–140. [Google Scholar] [CrossRef] [Scilit]
- Dong, H.; Wang, S.; Guo, N.; Li, M.; Zhao, J.; Wang, Z. Study on molecular motion behavior during the wall sticking process of waxy crude oil emulsion in gathering and transportation pipeline. J. Mol. Liq. 2025, 435, 128115. [Google Scholar] [CrossRef] [Scilit]
- Bassani, C.L.; Melchuna, A.M.; Cameirão, A.; Herri, J.; Morales, R.E.M.; Sum, A.K. A multiscale approach for gas hydrates considering structure, agglomeration, and transportability under multiphase flow conditions: I. Phenomenological model. Ind. Eng. Chem. Res. 2019, 58, 14446–14461. [Google Scholar] [CrossRef] [Scilit]
- Bassani, C.L.; Sum, A.K.; Herri, J.; Morales, R.E.M.; Cameirão, A. A multiscale approach for gas hydrates considering structure, agglomeration, and transportability under multiphase flow conditions: II. Growth kinetic model. Ind. Eng. Chem. Res. 2020, 59, 2123–2144. [Google Scholar] [CrossRef] [Scilit]
- Bassani, C.L.; Kakitani, C.; Herri, J.; Sum, A.K.; Morales, R.E.M.; Cameirão, A. A multiscale approach for gas hydrates considering structure, agglomeration, and transportability under multiphase flow conditions: III. Agglomeration model. Ind. Eng. Chem. Res. 2020, 59, 15357–15377. [Google Scholar] [CrossRef] [Scilit]
- Sloan, E.D. Fundamental principles and applications of natural gas hydrates. Nature 2003, 426, 353–359. [Google Scholar] [CrossRef] [Scilit]
- Sloan, E.D., Jr.; Koh, C.A. Clathrate Hydrates of Natural Gases, 3rd ed.; CRC Press: Boca Raton, FL, USA, 2008. [Google Scholar]
- Pu, W.; He, M.; Yang, X.; Liu, R.; Shen, C. Experimental study on the key influencing factors of phase inversion and stability of heavy oil emulsion: Asphaltene, resin and petroleum acid. Fuel 2022, 311, 122631. [Google Scholar] [CrossRef] [Scilit]
- Mohammadpour, M.; Malayeri, M.R.; Kazemzadeh, Y.; Riazi, M. On the impact of oil compounds on emulsion behavior under different thermodynamic conditions. Sci. Rep. 2023, 13, 15727. [Google Scholar] [CrossRef] [Scilit]
- Liu, Y. Study on the Flow and Deposition Mechanisms of w/o Systems Containing Wax and Hydrates. Ph.D. Thesis, China University of Petroleum, Beijing, China, 2019. [Google Scholar]
- Lei, Y.; Han, S.; Zhang, J.; Bao, Y.; Yao, Z.; Xu, Y.N. Study on the effect of dispersed and aggregated asphaltene on wax crystallization, gelation, and flow behavior of crude oil. Energy Fuels 2014, 28, 2314–2321. [Google Scholar] [CrossRef] [Scilit]
- Lei, Y.; Han, S.; Zhang, J. Effect of the dispersion degree of asphaltene on wax deposition in crude oil under static conditions. Fuel Process. Technol. 2016, 146, 20–28. [Google Scholar] [CrossRef] [Scilit]
- Jing, J.; Yang, H.; Sun, J.; Tan, J. Potential kinetic effects of wax on clathrate hydrate formation: A review. Geoenergy Sci. Eng. 2025, 249, 213765. [Google Scholar] [CrossRef] [Scilit]
- Daraboina, N.; Pachitsas, S.; von Solms, N. Natural gas hydrate formation and inhibition in gas/crude oil/aqueous systems. Fuel 2015, 148, 186–190. [Google Scholar] [CrossRef] [Scilit]
- Kar, S.; Kakati, H.; Mandal, A.; Laik, S. Experimental and modeling study of kinetics for methane hydrate formation in a crude oil-in-water emulsion. Pet. Sci. 2016, 13, 489–495. [Google Scholar] [CrossRef] [Scilit]
- Feng, Y.; Li, M.; Han, Y.; Li, Q.; Lv, X.; Zhao, J.; Yang, L.; Liu, Y.; Song, Y. Gas hydrate nucleation and growth in a micro-reactor: Effect of individual component separated from the crude oil in the south China sea. Chem. Eng. J. 2023, 459, 141483. [Google Scholar] [CrossRef] [Scilit]
- Stoporev, A.S.; Manakov, A.Y.; Altunina, L.K.; Strelets, L.A. Self-preservation of gas hydrate particles suspended in crude oils and liquid hydrocarbons: Role of preparation method, dispersion media, and hydrate former. Energy Fuels 2016, 30, 9014–9021. [Google Scholar] [CrossRef] [Scilit]
- Salmin, D.C.; Delgado-Linares, J.G.; Wu, D.T.; Zerpa, L.E.; Koh, C.A. Hydrate agglomeration in crude oil systems in which the asphaltene aggregation state is artificially modified. SPE J. 2021, 26, 1189–1199. [Google Scholar] [CrossRef] [Scilit]
- Kolotova, D.S.; Derkach, S.R.; Simon, S.; Sjöblom, J.; Donaldson, T.; Hase, A. Evaluation of anti-agglomerate hydrate inhibitor in water-in-crude oil emulsions of different water cut. Pet. Sci. Technol. 2020, 38, 922–928. [Google Scholar] [CrossRef] [Scilit]
- Talatori, S.; Barth, T. Rate of hydrate formation in crude oil/gas/water emulsions with different water cuts. J. Pet. Sci. Eng. 2011, 80, 32–40. [Google Scholar] [CrossRef] [Scilit]
- Liu, Y.; Wu, C.; Lv, X.; Du, H.; Ma, Q.; Wang, C.; Zhou, S.; Shi, B.; Song, S.; Gong, J.; et al. Hydrate growth and agglomeration in the presence of wax and anti-agglomerant: A morphology study and cohesive force measurement. Fuel 2023, 342, 127782. [Google Scholar] [CrossRef] [Scilit]
- Yang, H.; Jing, J.; Karimov, R.; Sun, J.; Zhuang, L. Study on hydrate formation characteristics in crude oil-gas-water system considering emulsion gels. Fuel 2024, 364, 131052. [Google Scholar] [CrossRef] [Scilit]
- SY/T 0545-2012; Test Method for Determination of Wax Precipitation Thermodynamic Parameters by Differential Scanning Calorimetry. Petroleum Industry Press: Beijing, China, 2012.
- GB/T 13377-2010; Determination of Density or Relative Density of Crude Oil and Liquid or Solid Petroleum Products. Standards Press of China: Beijing, China, 2011.
- GB/T 510-2018; Test Method for Solidification Point of Petroleum Products. Standards Press of China: Beijing, China, 2018.
- NB/SH/T 0509-2010; Standard Test Method for Determination of Four Components in Petroleum Asphaltenes. Petroleum Industry Press: Beijing, China, 2010.
- Wang, L.; Chen, J.; Ma, T.; Jing, J.; Lei, L.; Guo, J. Experimental study of methane hydrate formation and agglomeration in waxy oil-in-water emulsions. Energy 2024, 288, 129945. [Google Scholar] [CrossRef] [Scilit]
- Greaves, D.; Boxall, J.; Mulligan, J.; Sloan, E.D.; Koh, C.A. Hydrate formation from high water content-crude oil emulsions. Chem. Eng. Sci. 2008, 63, 4570–4579. [Google Scholar] [CrossRef] [Scilit]
- Liu, Y.; Shi, B.; Ding, L.; Ma, Q.; Chen, Y.; Song, S.; Zhang, Y.; Yong, Y.; Lv, X.; Wu, H.; et al. Study of hydrate formation in water-in-waxy oil emulsions considering heat transfer and mass transfer. Fuel 2019, 244, 282–295. [Google Scholar] [CrossRef] [Scilit]
- Vanapalli, S.A.; Palanuwech, J.; Coupland, J.N. Stability of emulsions to dispersed phase crystallization: Effect of oil type, dispersed phase volume fraction, and cooling rate. Colloids Surf. A Physicochem. Eng. Asp. 2002, 204, 227–237. [Google Scholar] [CrossRef] [Scilit]
- Vanapalli, S.A.; Palanuwech, J.; Coupland, J.N. Influence of fat crystallization on the stability of flocculated emulsions. J. Agric. Food Chem. 2002, 50, 5224–5228. [Google Scholar] [CrossRef] [Scilit] [PubMed]





Disclaimer/Publisher’s Note: The statements, opinions and data contained in all publications are solely those of the individual author(s) and contributor(s) and not of MDPI and/or the editor(s). MDPI and/or the editor(s) disclaim responsibility for any injury to people or property resulting from any ideas, methods, instructions or products referred to in the content. |
© 2026 by the authors. Licensee MDPI, Basel, Switzerland. This article is an open access article distributed under the terms and conditions of the Creative Commons Attribution (CC BY) license.