


Abstract
This study investigates the hydrodynamics, oxygen mass transfer, and sodium methyl mercaptan (NaSR) oxidation in a scaled-up airlift loop reactor, aiming to clarify the interplay between operational parameters and reaction efficiency. Computational Fluid Dynamics (CFD) simulations, coupled with the Euler–Euler approach, population balance model (PBM), Higbie’s penetration theory, and Arrhenius-type reaction kinetics, were employed. Experimental determination of reaction kinetics provided foundational data for model validation. Increasing superficial gas velocity Ug enhances magnitude and spatial distribution uniformity, promotes bubble circulation between the riser and downcomer, and improves dissolved oxygen concentration. Numerical simulations showed good agreement with industrial data, confirming their reliability. Notably, at Ug = 0.0045 m/s, insufficient oxygen mass fraction in the downcomer was observed due to slow bubble renewal. The volumetric mass transfer coefficient exhibits larger value in downcomer due to the reasonable liquid turbulence dissipation. These findings provide critical insights for optimizing operational parameters in large-scale airlift reactors for NaSR oxidation.
1. Introduction
The Merox process, developed by Universal Oil Products in 1958, is widely used for desulfurizing petroleum streams worldwide [1]. In this process, thiols are extracted from hydrocarbons using an oxygen-free aqueous caustic solution containing a cobalt phthalocyanine catalyst. The thiol-loaded aqueous stream is then transported to an oxidation reactor, where oxygen is introduced to catalytically oxidize thiols to disulfides (RSSR) under the action of phthalocyanine. This enables continuous regeneration and reuse of the aqueous phase, with the caustic oxidative regeneration step playing a pivotal role in determining desulfurization efficiency [2].
Gas–liquid mass transfer directly impacts the performance and economic viability of scaled-up caustic oxidative regeneration reactors [3]. Over the years, extensive efforts have been dedicated to developing innovative equipment and technologies to enhance gas–liquid mass transfer, aiming to improve process efficiency, reduce energy consumption, and minimize environmental impact [4,5,6]. Airlift reactors are a typical multiphase reactor that uses gas–liquid circulation induced by gas sparging to promote mixing, mass transfer, and heat transfer [7]. The unique feature of airlift reactors is that they employ two distinct regions of liquid flow: a riser region and a downcomer region. The riser region is formed by the gas–liquid mixture, whereas the downcomer region is formed by the liquid that is displaced by the rising gas bubbles.
In 2024, an industrial-scale airlift loop reactor for NaSR degradation was constructed in a catalytic cracking unit in China. The airlift loop reactor consisted of outer and inner cylinders. The outer cylinder displayed an inner diameter and height of 2400 and 16,894 mm, respectively. The inner cylinder exhibited an inner diameter, wall thickness, and height of 1700, 10, and 16,557 mm, respectively. Two additional standard elliptical heads were located in the two sections of the outer cylinder.
Air and caustic streams are injected at the bottom and center of the inner cylinder, respectively, with exhaust gas and reacted liquid discharged from the top outlet. Industrial data show the caustic stream has a mass flow rate of 25 t/h, containing 5000 ppm NaSR and 200 ppm sulfonated cobalt phthalocyanine, operating at 50 °C and 0.3 MPa (top outlet pressure). During the start-up of the reactor, it was found that the oxidation efficiency depends on the magnitude of the superficial gas velocity (Ug). The superficial gas velocity dominates the exhaust gas flow rate, and more exhaust gas will lead to the increase in the cost of exhaust gas incineration.
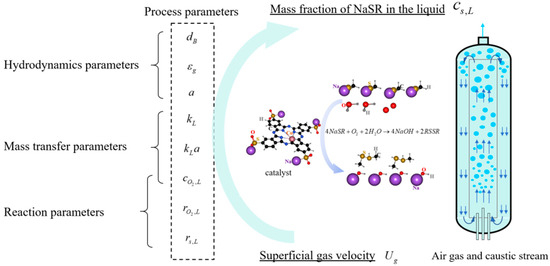
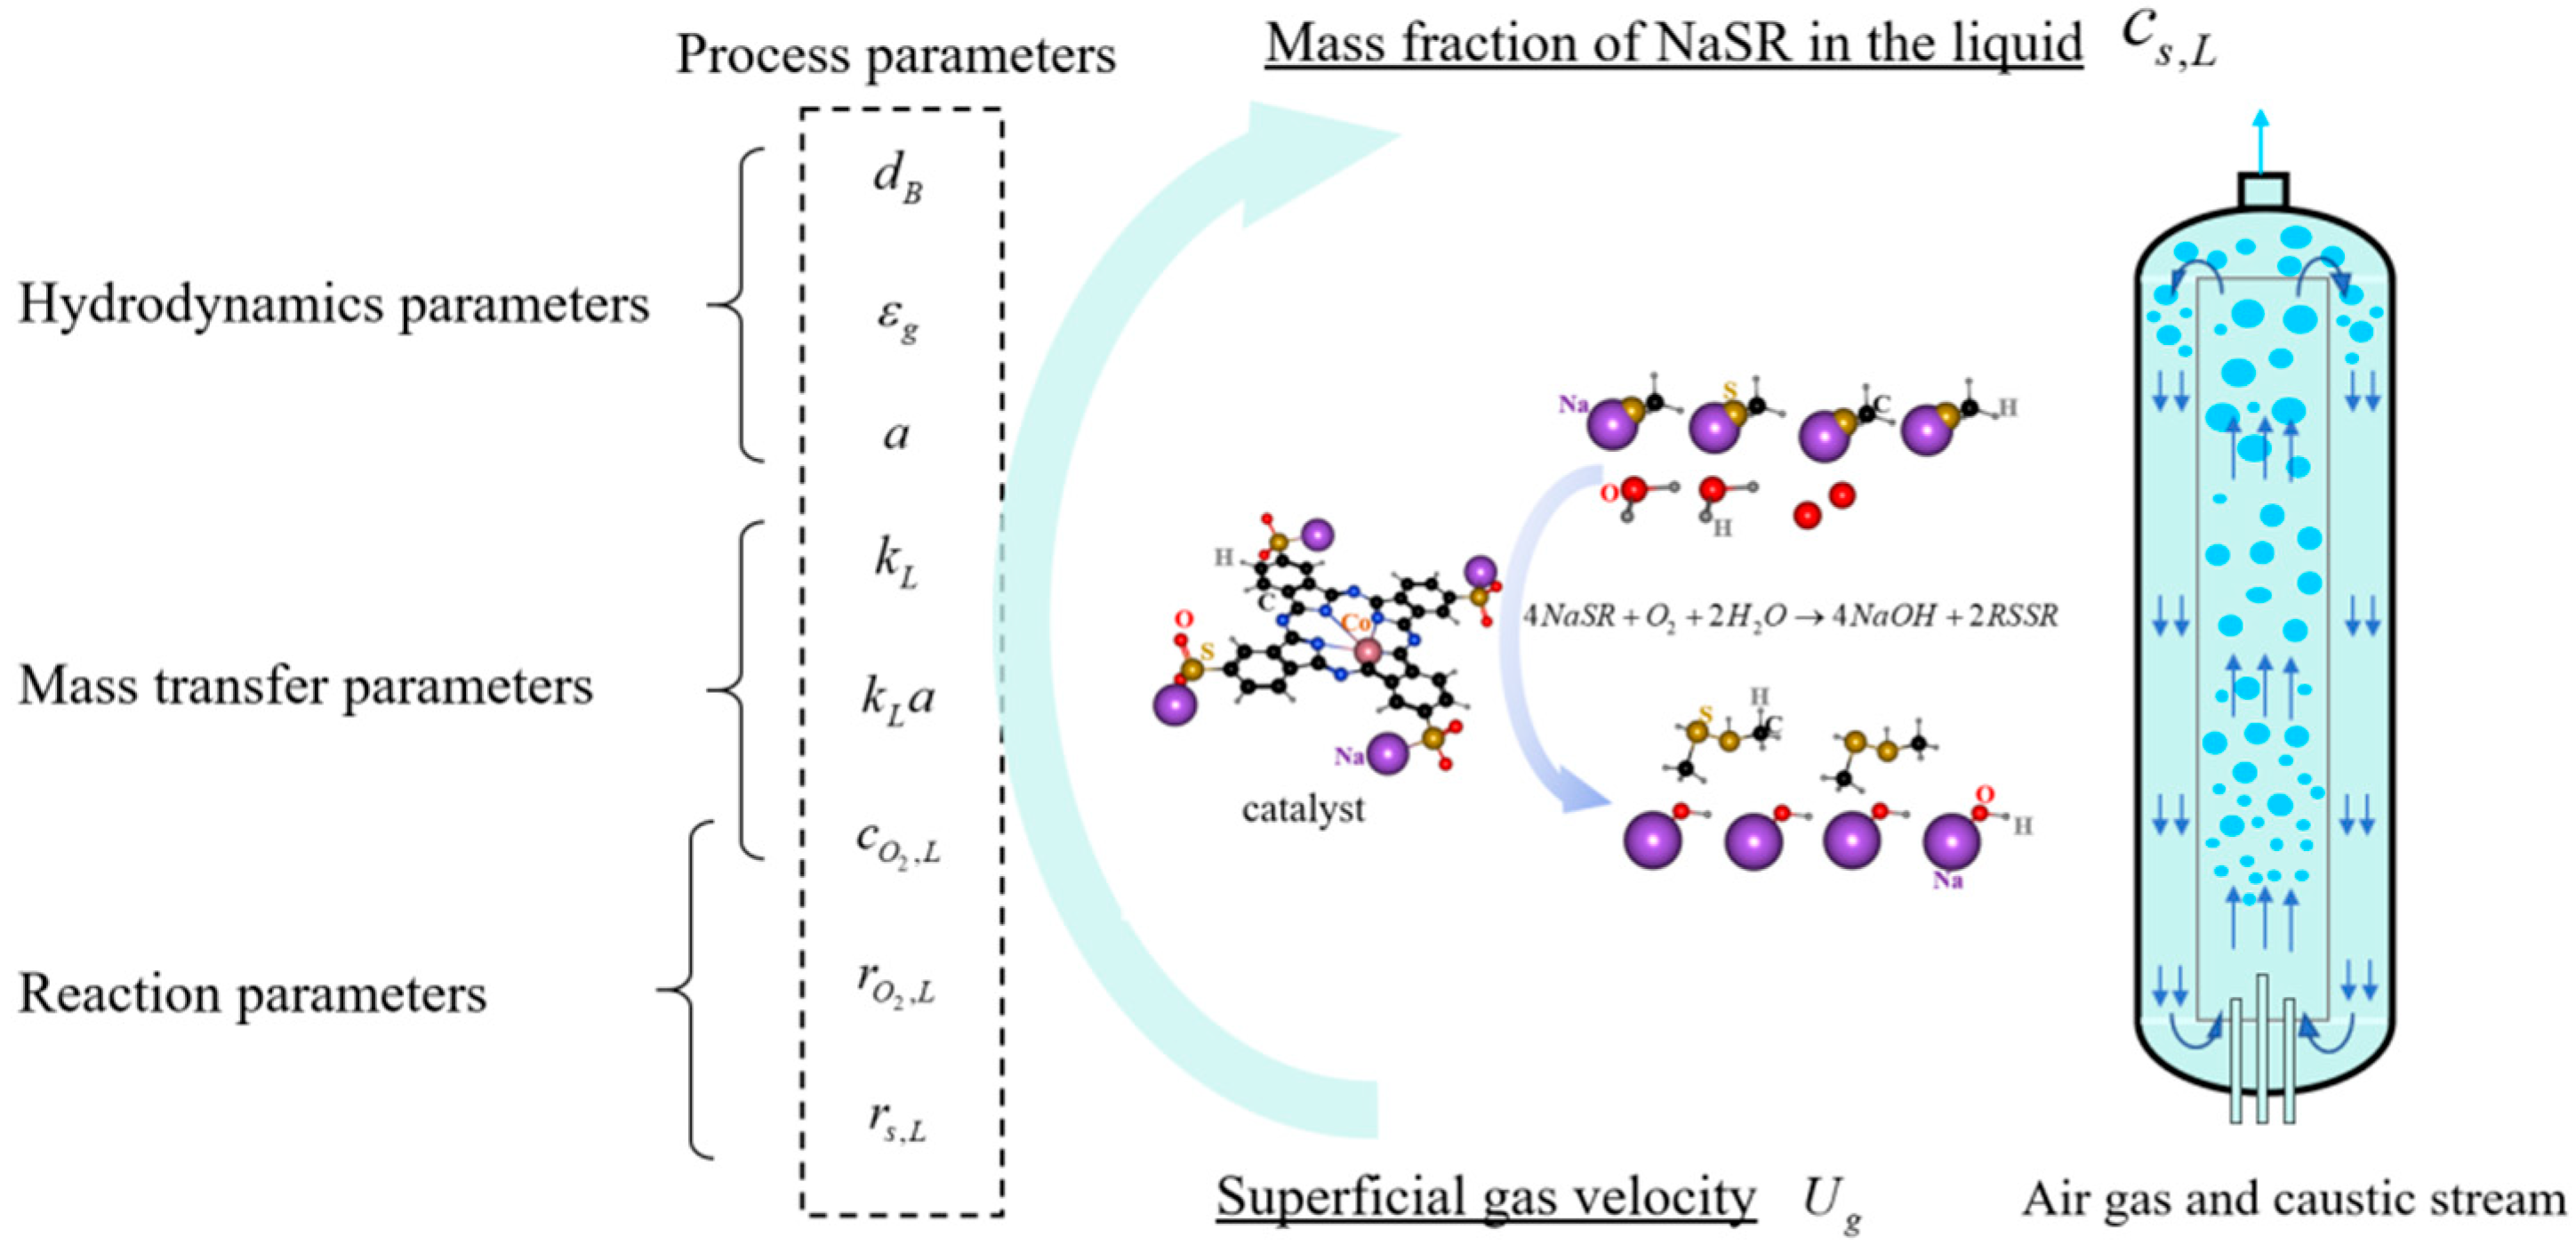
Multiphase hydrodynamics and dissolved oxygen concentration are key determinants of reaction performance in airlift reactors [8]. Accurate prediction of these parameters is thus critical for optimizing operational conditions in scaled-up systems. Figure 1 schematically illustrates how superficial gas velocity influences reaction efficiency through parameters such as bubble diameter (dB), gas holdup (εg), liquid turbulence dissipation (ε), specific surface area (), and volumetric mass transfer coefficient ().
Figure 1.
Schematic diagram of the influence of superficial gas velocity on reaction efficiency by several process parameters.
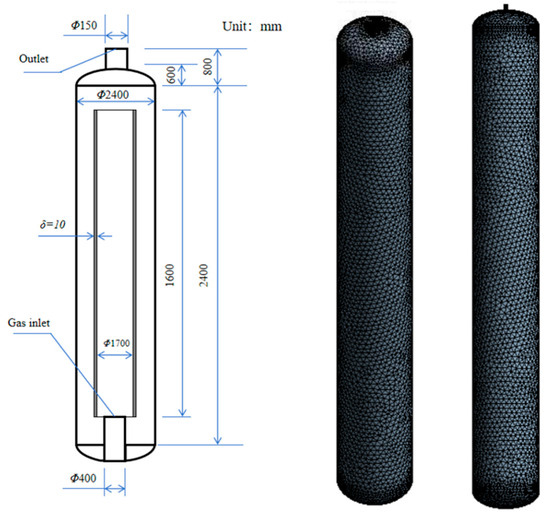
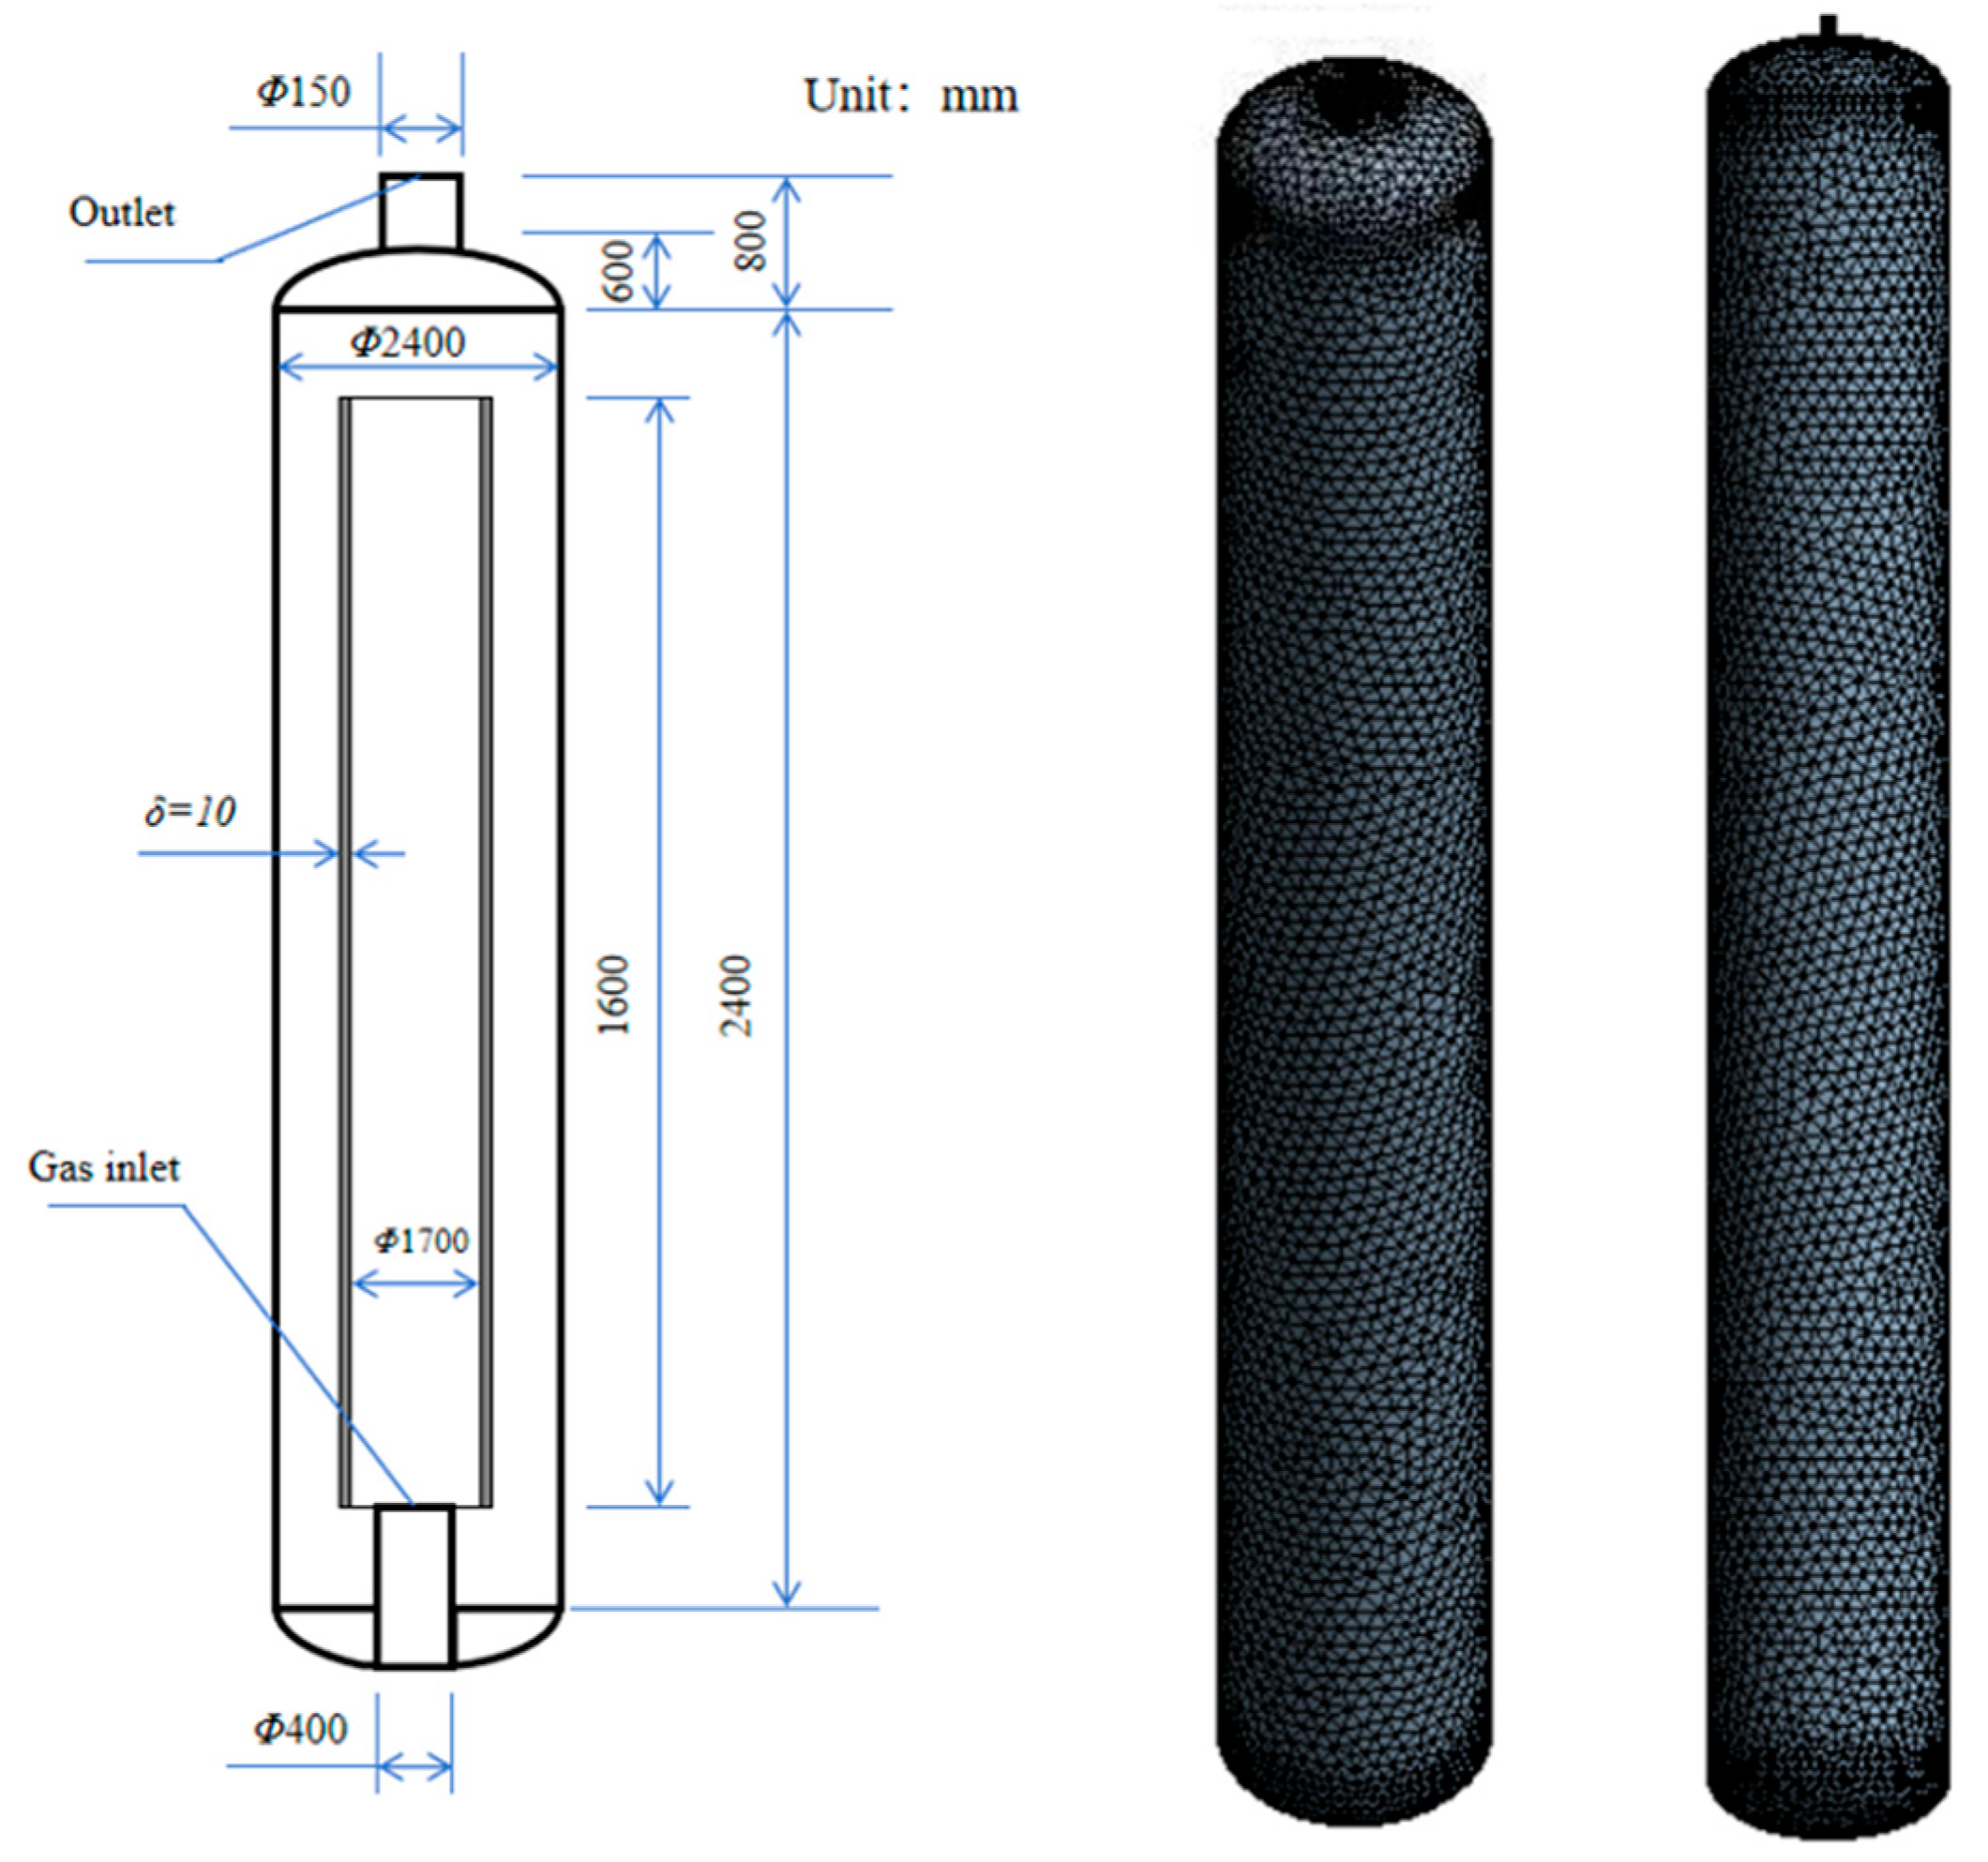
Extensive research has explored fluid dynamics and gas–liquid mass transfer mechanisms in airlift loop reactors [9,10]. Computational fluid dynamics (CFD) simulations have become a powerful tool for addressing the shortage of experiments on hydrodynamics, oxygen mass transfer, and reaction [11]. CFD simulations allow the visualization of detailed hydrodynamics and substance concentration in a complex flow field [12]. Moreover, analyzing the simulation results can provide guidelines and insights into optimization [13]. Figure 2 shows the computational diagram and grid rendering of the experimental model.
Figure 2.
Computational diagram and grid rendering.
To integrate these considerations, this study employs the population balance model and Euler–Euler approach to describe bubbly flow, Higbie’s penetration theory to calculate oxygen mass transfer, and an Arrhenius equation to model liquid-phase oxidation kinetics. The research aims to characterize gas volume fraction, bubble size, liquid velocity, and mass fractions of dissolved oxygen, reactants, and products, thereby clarifying the interconnections between hydrodynamics, oxygen mass transfer, and NaSR oxidation.
2. Experimental for Determining Reaction Kinetics
The caustic oxidative regeneration reaction, conducted in a separate vessel, is represented as follows:
A caustic stream containing extracted thiols was sampled from a domestic catalytic cracking unit (pH ≈ 12) and pumped into a 250 mL stirred vessel. Sulfonated cobalt phthalocyanine (Aladdin Co., Ltd., Shanghai, China) was added to the stream at a mass fraction of 200 ppm. The reaction temperature was maintained at 50 °C using an electric heater, and pressure was controlled via compressed pure oxygen injection, with batch experiments conducted at 0.3 MPa.
Upon air injection, the oxidation reaction was initiated. For each experiment, 35 µL samples were collected to quantify residual NaSR, with reaction rates derived from plots of NaSR mass fraction over time. NaSR mass fraction in the caustic stream was determined via titration (see Supplementary Information).
3. Computational Fluid Dynamics Simulations
3.1. Two-Phase Flow Model
The Euler–Euler approach was considered in this simulation because it allows the solution of each phase to be obtained [14,15]. The continuity and momentum equations are expressed as follows:
In the above equations, represents the gas or liquid. , , and represent the volume fraction, density, and velocity of phase , respectively. and denote the pressure and gravitational acceleration, respectively. In addition, and are the laminar and turbulent stress tensors, respectively. represents the interfacial forces, consisting of the drag, virtual mass, lift, wall lubricant, and turbulent dispersion forces [16]. For gas–liquid flows under the Euler–Euler approach, the drag and virtual mass force are significant interfacial forces:
where and represent the gas and the liquid, respectively. The interfacial force between the gas and the liquid due to drag is defined as
where represents the gas volume fraction and is the diameter of the bubble. According to Schiller and Naumann [17], the drag coefficient is correlated to the Reynolds number as follows:
where denotes the relative Reynolds number. The relative Reynolds numbers for the gas and liquid phases can then be obtained using the following expression:
3.2. Turbulence Model
This study uses the k-ε model to simulate the gas–liquid two-phase flow state, which can be expressed as
And
In the above equation, k and ε represent turbulent kinetic energy and the turbulent energy dissipation rate, respectively. In addition, Gk and Gb, respectively, represent the generation of turbulent kinetic energy caused by the average velocity gradient and buoyancy; YM represents the effect of pulsating expansion in compressible turbulence on the overall turbulence dissipation rate. Further, C2 and C1ε are constants, where C2 = 1.9, C1ε = 1.44. σk, and σε represent the turbulent Prandtl numbers of k and ε, respectively, where σk = 1.0, σε = 1.2. In addition, eddy viscosity can be defined as
Among them, Cμ represents a function of average strain rate, rotation rate, system rotation angular velocity, and turbulent field (k and ε).
3.3. Population Balance Method Model
To accurately predict the size distribution of bubbles, a group equilibrium model must be adopted, and its basic equation is defined as follows:
Among them, and represent the size distribution of bubbles and their broken sub bubbles, respectively. and , respectively, represent fragmentation and coalescence.
According to Zhang and Zeng [18], the initial bubble size increases as the apparent gas velocity increases.
Among them, denotes the characteristic diameter of newly generated bubbles, refers to the initial channel diameter through which gas is ejected in the bubble column reactor, represents the gas outlet velocity, and is the gravitational acceleration, which is taken as 9.81 m/s2 in this study.
The magnitude of was calculated via the aforementioned formula (See Table 1), while the change in bubble size distribution with the riser height in the bubble column was also examined in this study.
Table 1.
dimension table.
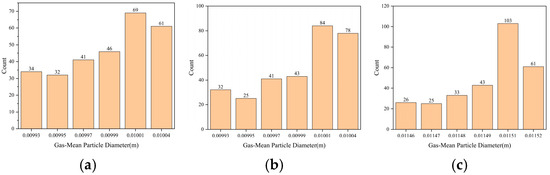
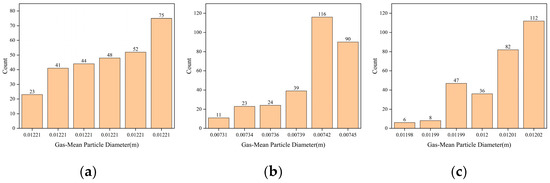
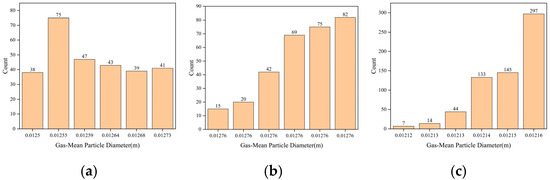
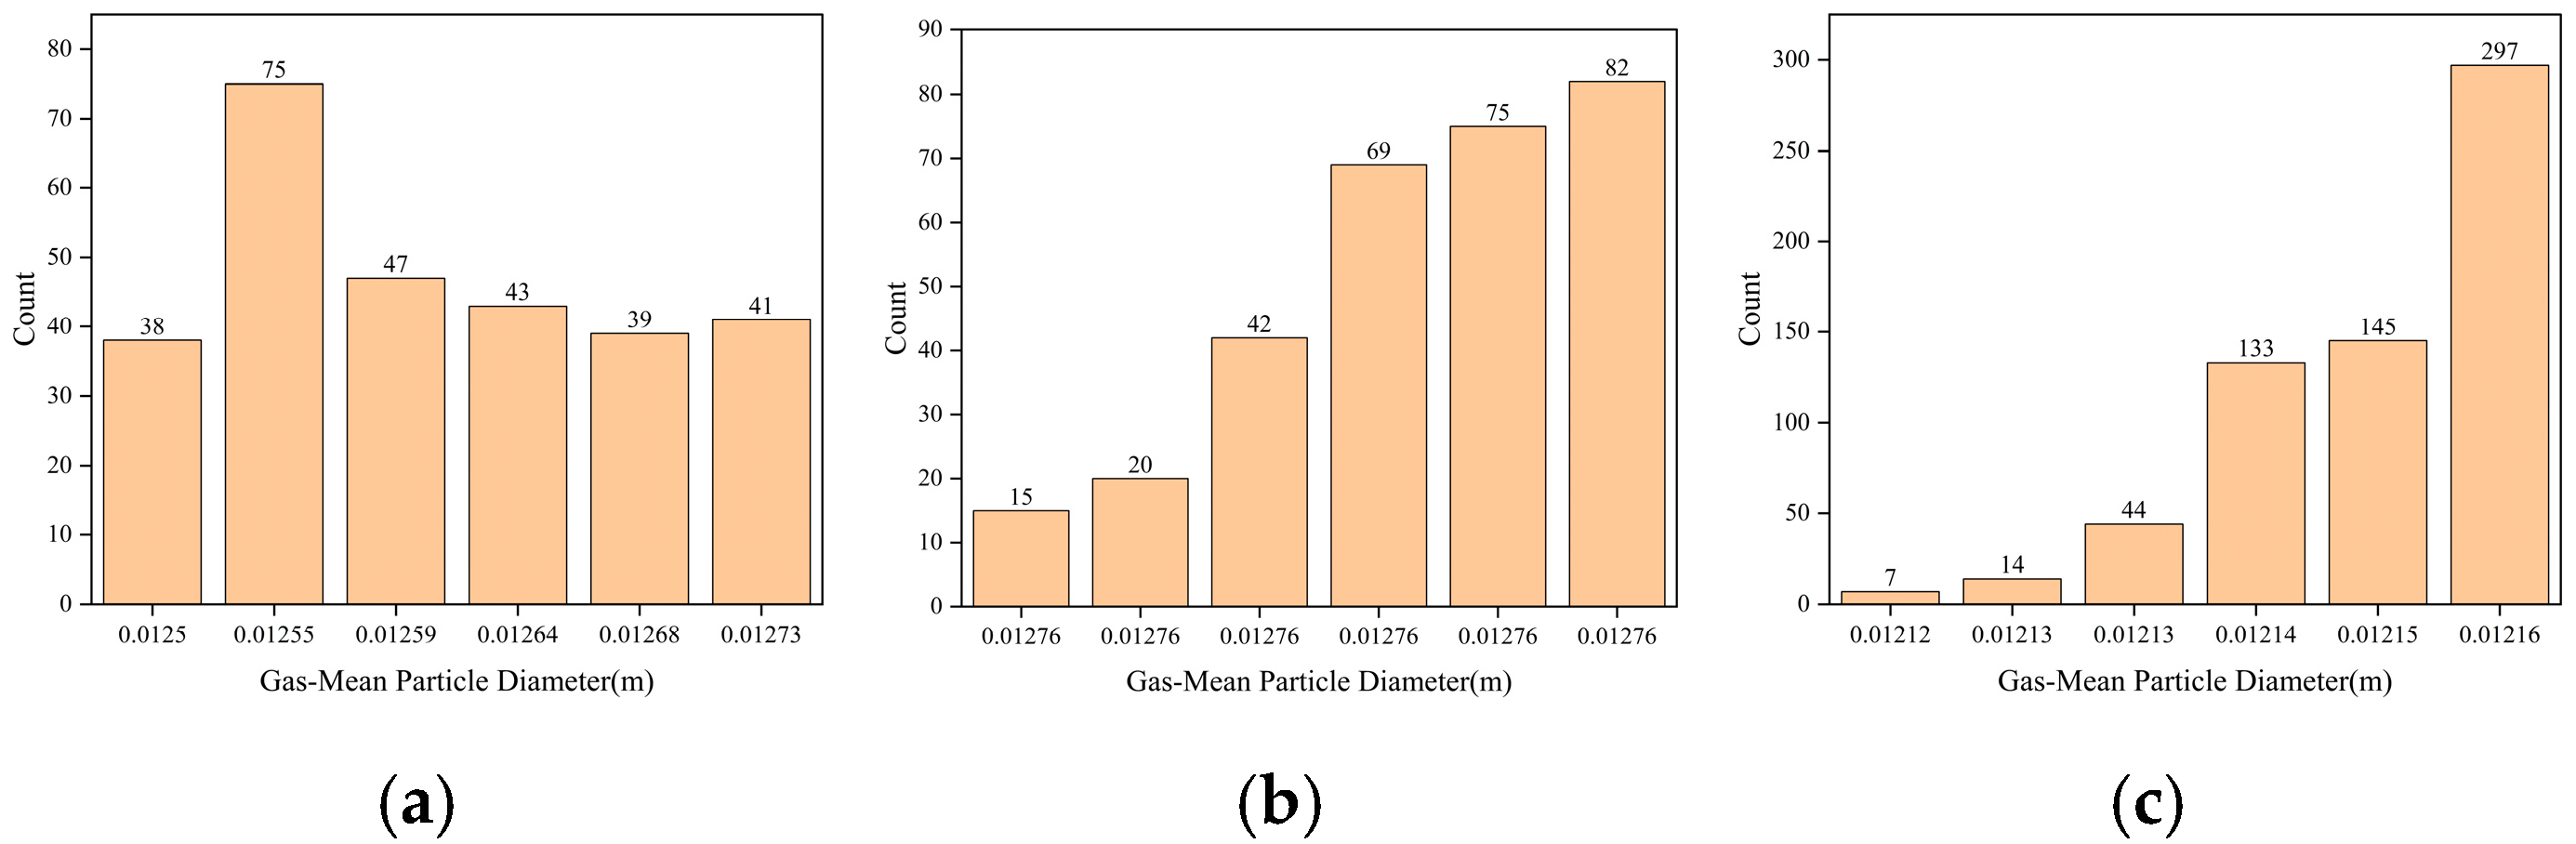
Bubble size distribution was investigated at bubble column heights of 5 m, 10 m, and 15 m, as illustrated in Figure 3, Figure 4 and Figure 5.
Figure 3.
Variations in the 50,000-cell mesh group (a) 5 m, (b) 10 m, (c) 15 m.
Figure 4.
Variations in the 76,000-cell mesh group (a) 5 m, (b) 10 m, (c) 15 m.
Figure 5.
Variations in the 100,000-cell mesh group (a) 5 m, (b) 10 m, (c) 15 m.
In this study, compared with other models, the simulation results of the Luo fragmentation and coalescence model were more consistent with experimental data, The fragmentation model proposed by Luo is defined as follows:
In the formula, is the ratio of the size of vortices to particles, and is the coefficient of increase in surface area. represents energy dissipation rate and is surface tension. The definition of the fragmentation probability corresponding to the size distribution of bubbles is as follows:
The definition of the aggregation model is as follows:
In the formula, represents the probability density function of bubble coalescence, represents the probability of bubble coalescence. represents the collision frequency between bubbles of size, and and , respectively, represent the drainage time of the film and the contact time of the bubbles.
3.4. Mass Transfer Model
For the Euler–Euler approach, an air and caustic stream was injected into the bottom of the reactor. The transport equations for the concentration of the transferred species, O2, in both phases can be defined as follows:
where represents the concentration of oxygen in the various phases (gas = G subscript, liquid = L subscript), and represents the density of the multi component mixture. In addition, denotes the volume fraction for each phase, denotes the phase velocity, represents the oxygen diffusion coefficient in each phase, and represents the source term due to oxygen transport across the interface.
Sources of dissolved oxygen and sodium methyl mercaptan from the reaction are given as follows:
Note that and are reaction rates of oxygen and sodium methyl mercaptan. and represent the molar mass values of oxygen and sodium methyl mercaptan.
The mechanism of interface mass transfer is the basis of understanding these mass transfer processes, predicting the mass transfer rates, and designing appropriate equipment for the process [19]. The model ensures applicability in NaSR oxidation processes through three key features: First, it accurately reflects the impact of alkaline high-pressure conditions on oxygen solubility via Henry coefficient correction. Second, by integrating group equilibrium models to dynamically predict bubble coalescence and fragmentation, it derives the local Sauter mean diameter and specific surface area, eliminating the need for fixed-size assumptions. Finally, the model’s predictions show excellent agreement with industrial measurements. In this context, the isotropic turbulence theory takes the ratio between the Kolmogorov scale and the turbulent fluctuation velocity as the exposure time of eddies on the surface, and is known as the “eddy” model. The majority of “eddy” models developed using this method have a similar form:
The Kawase correlation of liquid-side mass transfer coefficient with was based on Higbie’s penetration theory and Kolmogoroff’s theory of isotropic turbulence.
The local saturated dissolved oxygen concentration varies with the partial pressure of oxygen . The saturated dissolved oxygen concentration and diffusion coefficient can be obtained using an empirical formula [20]:
where correction factor related to electrolyte. is the Henry coefficient which can be calculated from a temperature dependent correlation.
where , , and have values of 0.102, 1.0, and 4.309, respectively.
In this work, the diffusion coefficient of oxygen in liquid is 2 × 10⁻⁹ m2/s. The Henry coefficient of oxygen in water is 120,000 Pa·m3/mol. The density of liquid is 1000 kg/m3. The viscosity of liquid is 0.55 × 10⁻³ Pa·s. The density of gas is related to the pressure. It was assumed that the mass transfer of oxygen between the gas and the liquid has no influence on the bubble size. The oxygen mass transfer inside gas was treated as zero resistance.
3.5. Initial Conditions and Boundary Conditions
Simulations were performed using a custom version of ANSYS CFX 15, and similar Euler–Euler simulations of mass transfer in a bubbly flow have been verified [21]. The gas mass flow at the inlet was set as 0.05, 0.15, and 0.25 kg/s, respectively. The corresponding superficial gas velocity is equal to the gas volume flow rate divided by the cross-sectional area of the inner cylinder. Those superficial gas velocities were 0.0045, 0.0135, and 0.0225 m/s. The initial bubble diameter was set as about 5 mm. The liquid mass flow with 5000 mg/L sodium methyl mercaptan at the inlet was kept as 25,000 kg/h. There was no dissolved oxygen inside the fresh liquid. The outlet pressure was set as 0.3 MPa which was consistent with the condition of the scale-up air-lift loop reactor within the Merox unit of a catalytic cracking complex. Furthermore, the specified boundary condition—an outlet pressure of 0.3 MPa—was derived from actual industrial operating data of the gas–liquid reactor under study. This pressure is representative of typical Merox regeneration conditions, ensuring sufficient system throughput and the necessary driving force for oxygen mass transfer. Therefore, within the operational framework of the reactor, this parameter is independently defined and technically justified. Critically, the validity of this boundary condition is demonstrated by the close agreement between the simulated results and industrial measurements. As presented in the figure in Section 4.1, the simulated outlet concentrations show excellent consistency with the experimentally obtained values. This strong correspondence provides compelling evidence that the complete set of initial and boundary conditions employed in the simulation accurately and reliably represents the real industrial operating environment. Using steady-state simulation calculations and monitoring the concentration of reactants at the outlet to determine convergence and conservation of mass. Steady-state simulations were validated via outlet reactant concentration convergence and mass conservation (Supplementary Information).
3.6. Grid Independence Analysis
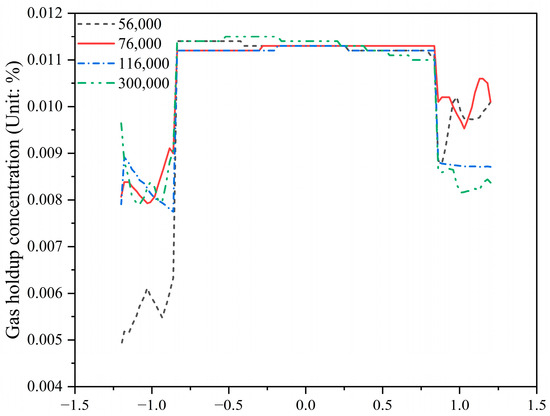
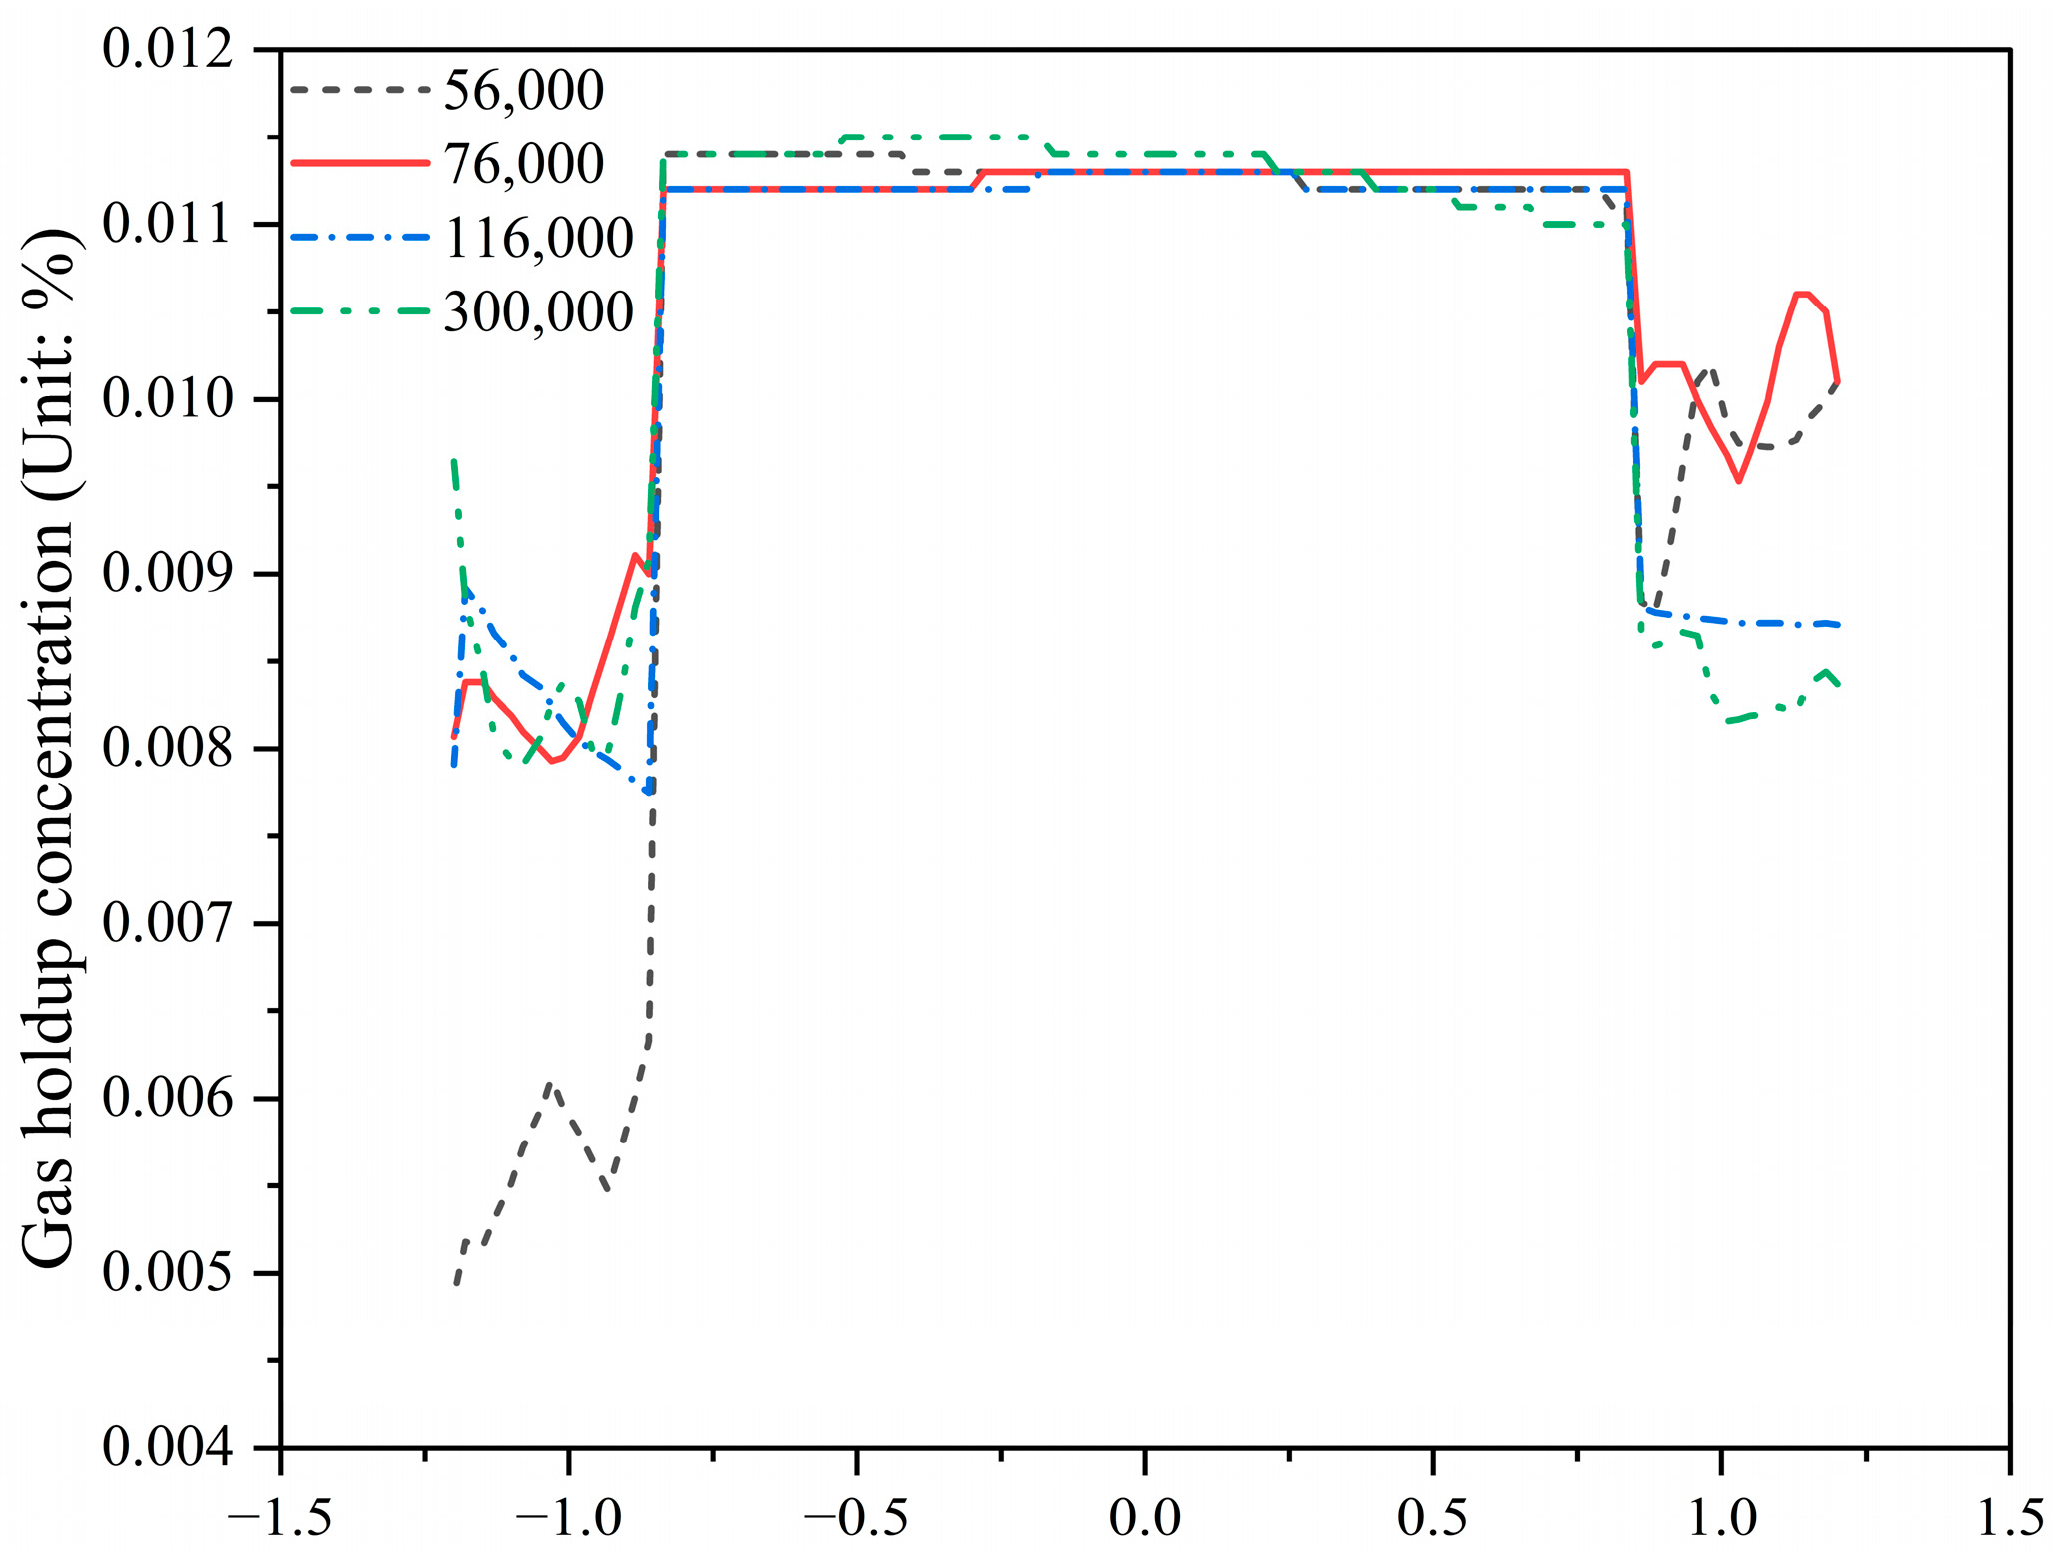
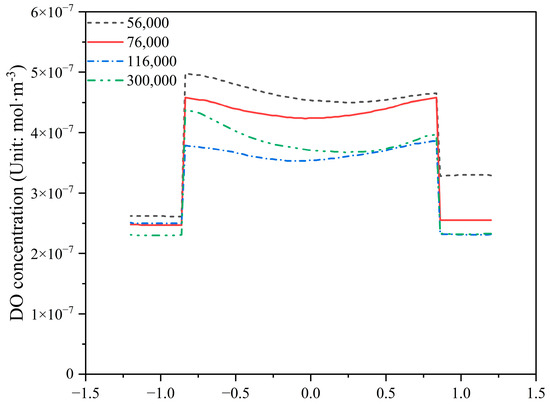
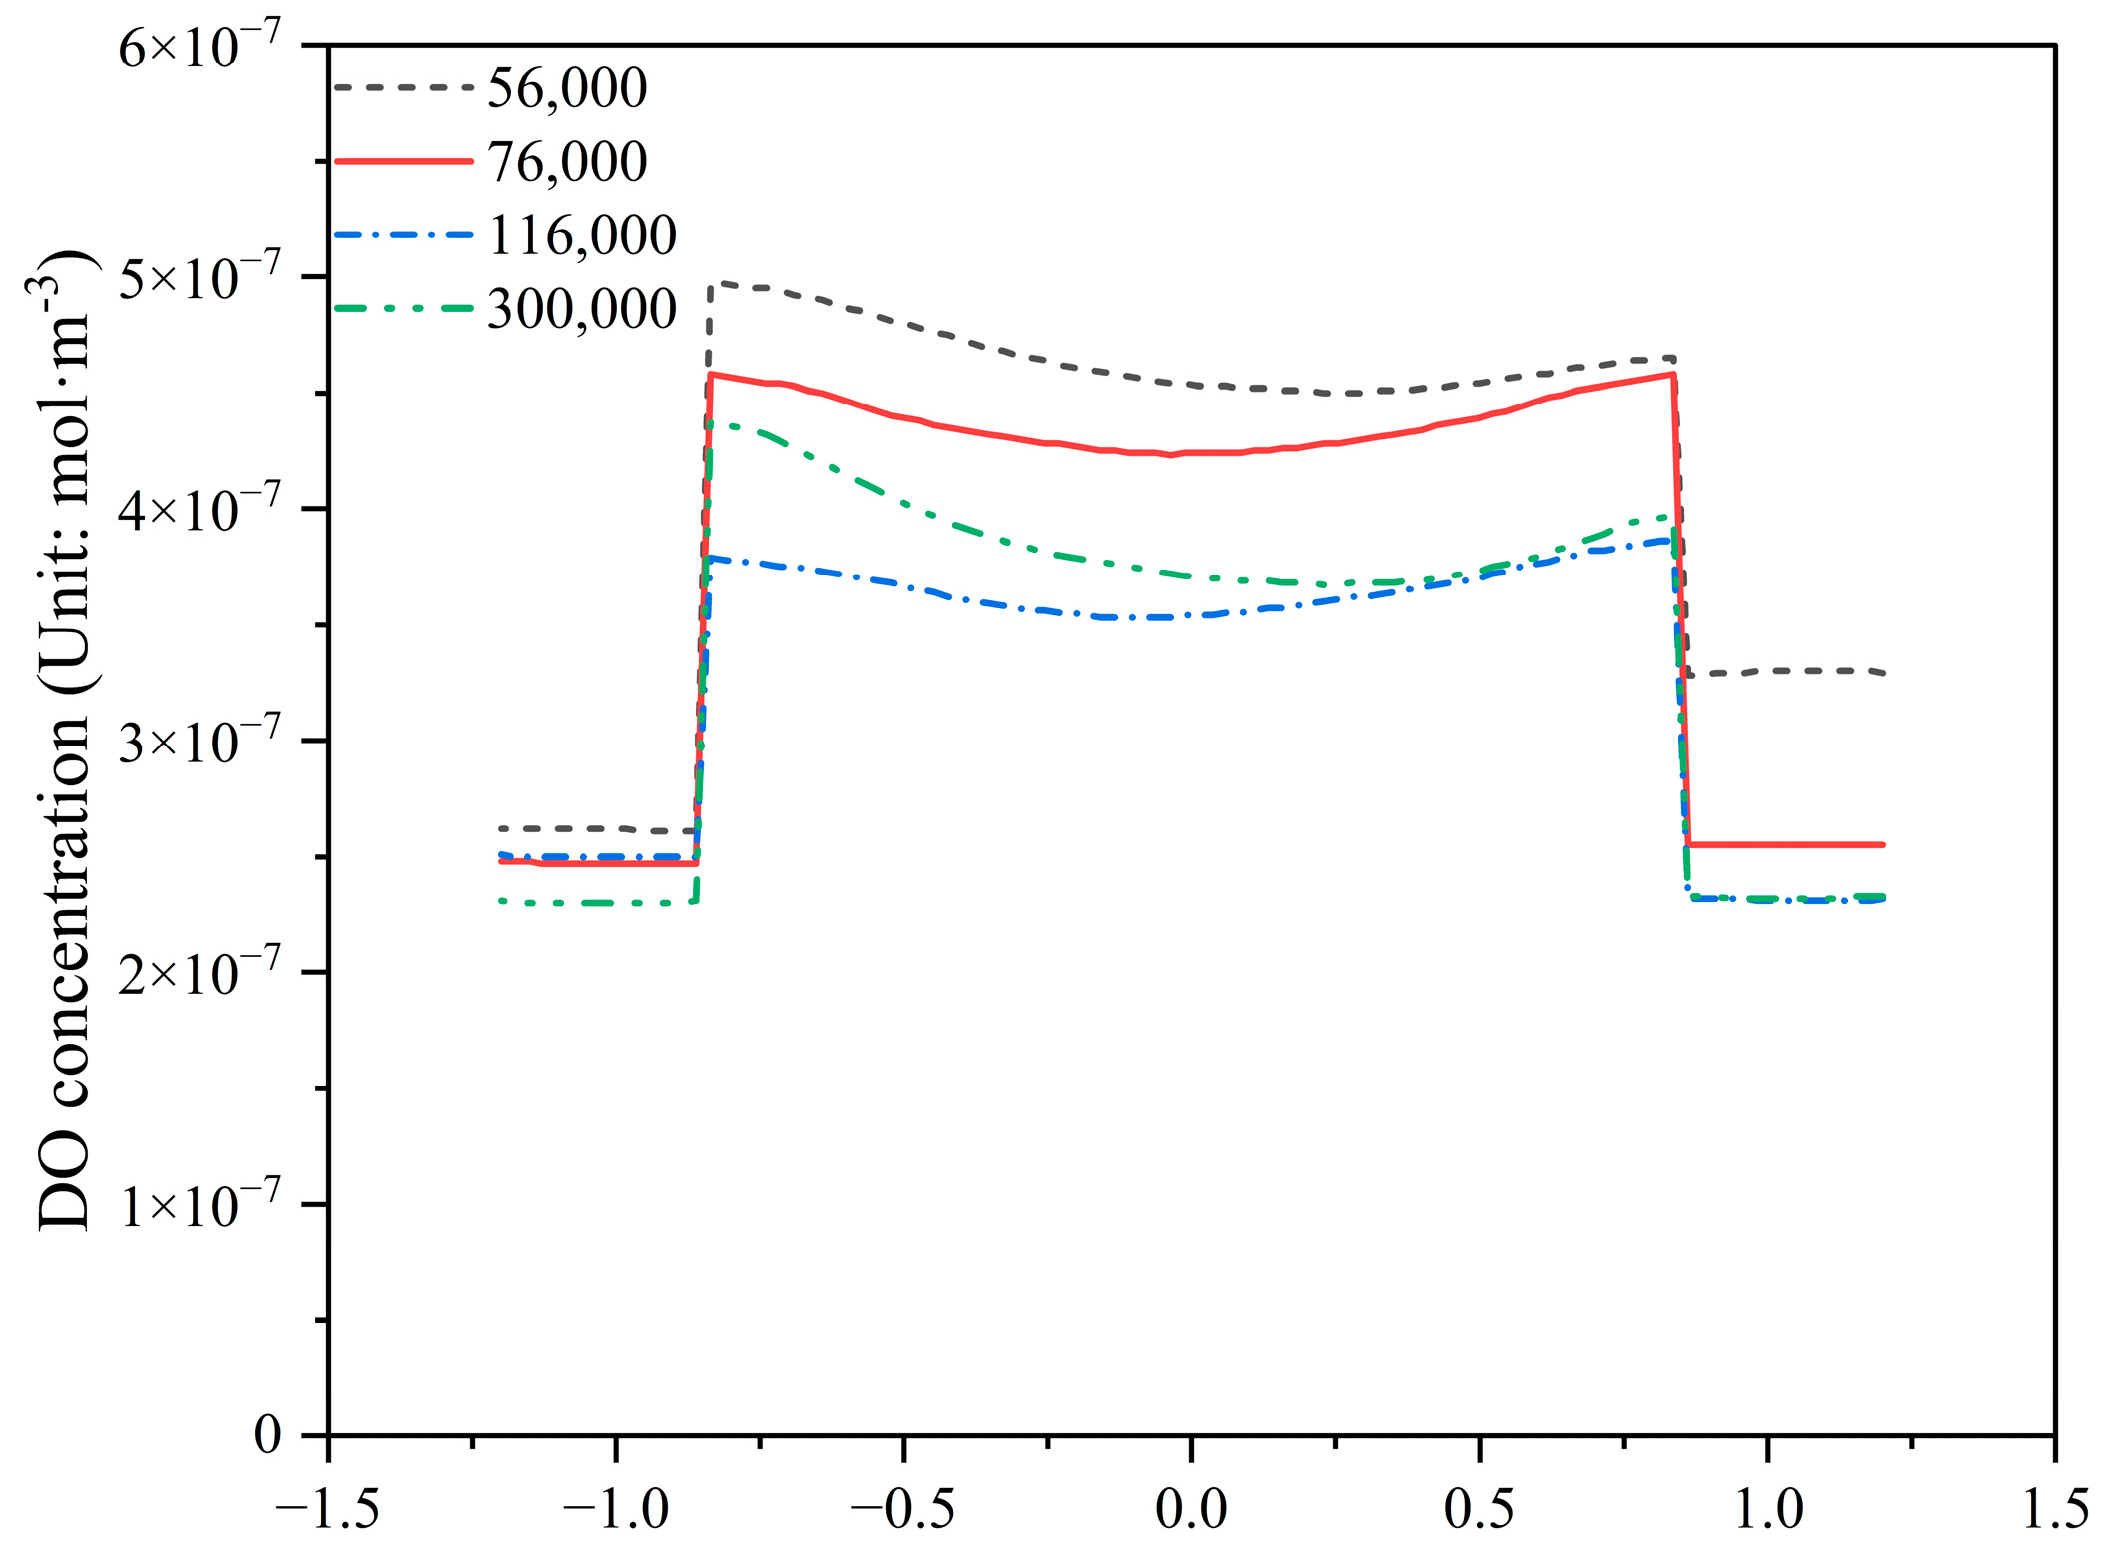
To ensure grid independence of the numerical results, a grid convergence analysis was conducted with four grid scales (56,000, 76,000, 116,000 and 300,000 cells), where two key variables, gas holdup and dissolved oxygen (DO) concentration, were monitored. The results are presented in Figure 6 and Figure 7, showing that varying the mesh density has no effect on the experimental results.
Figure 6.
The gas holdup concentration variations under different grid numbers.
Figure 7.
The Dissolved Oxygen(DO) concentration variations under different grid numbers.
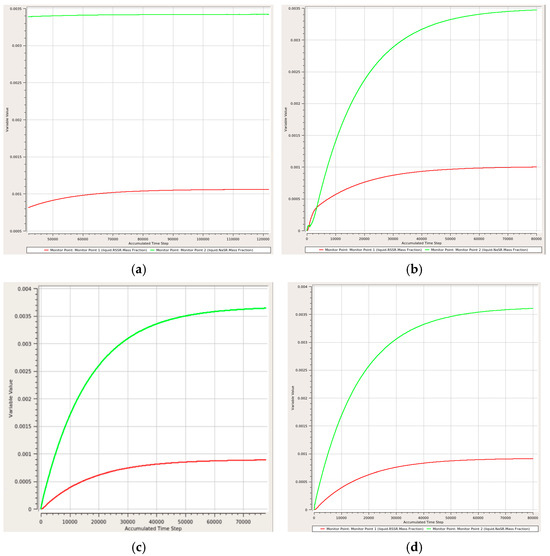
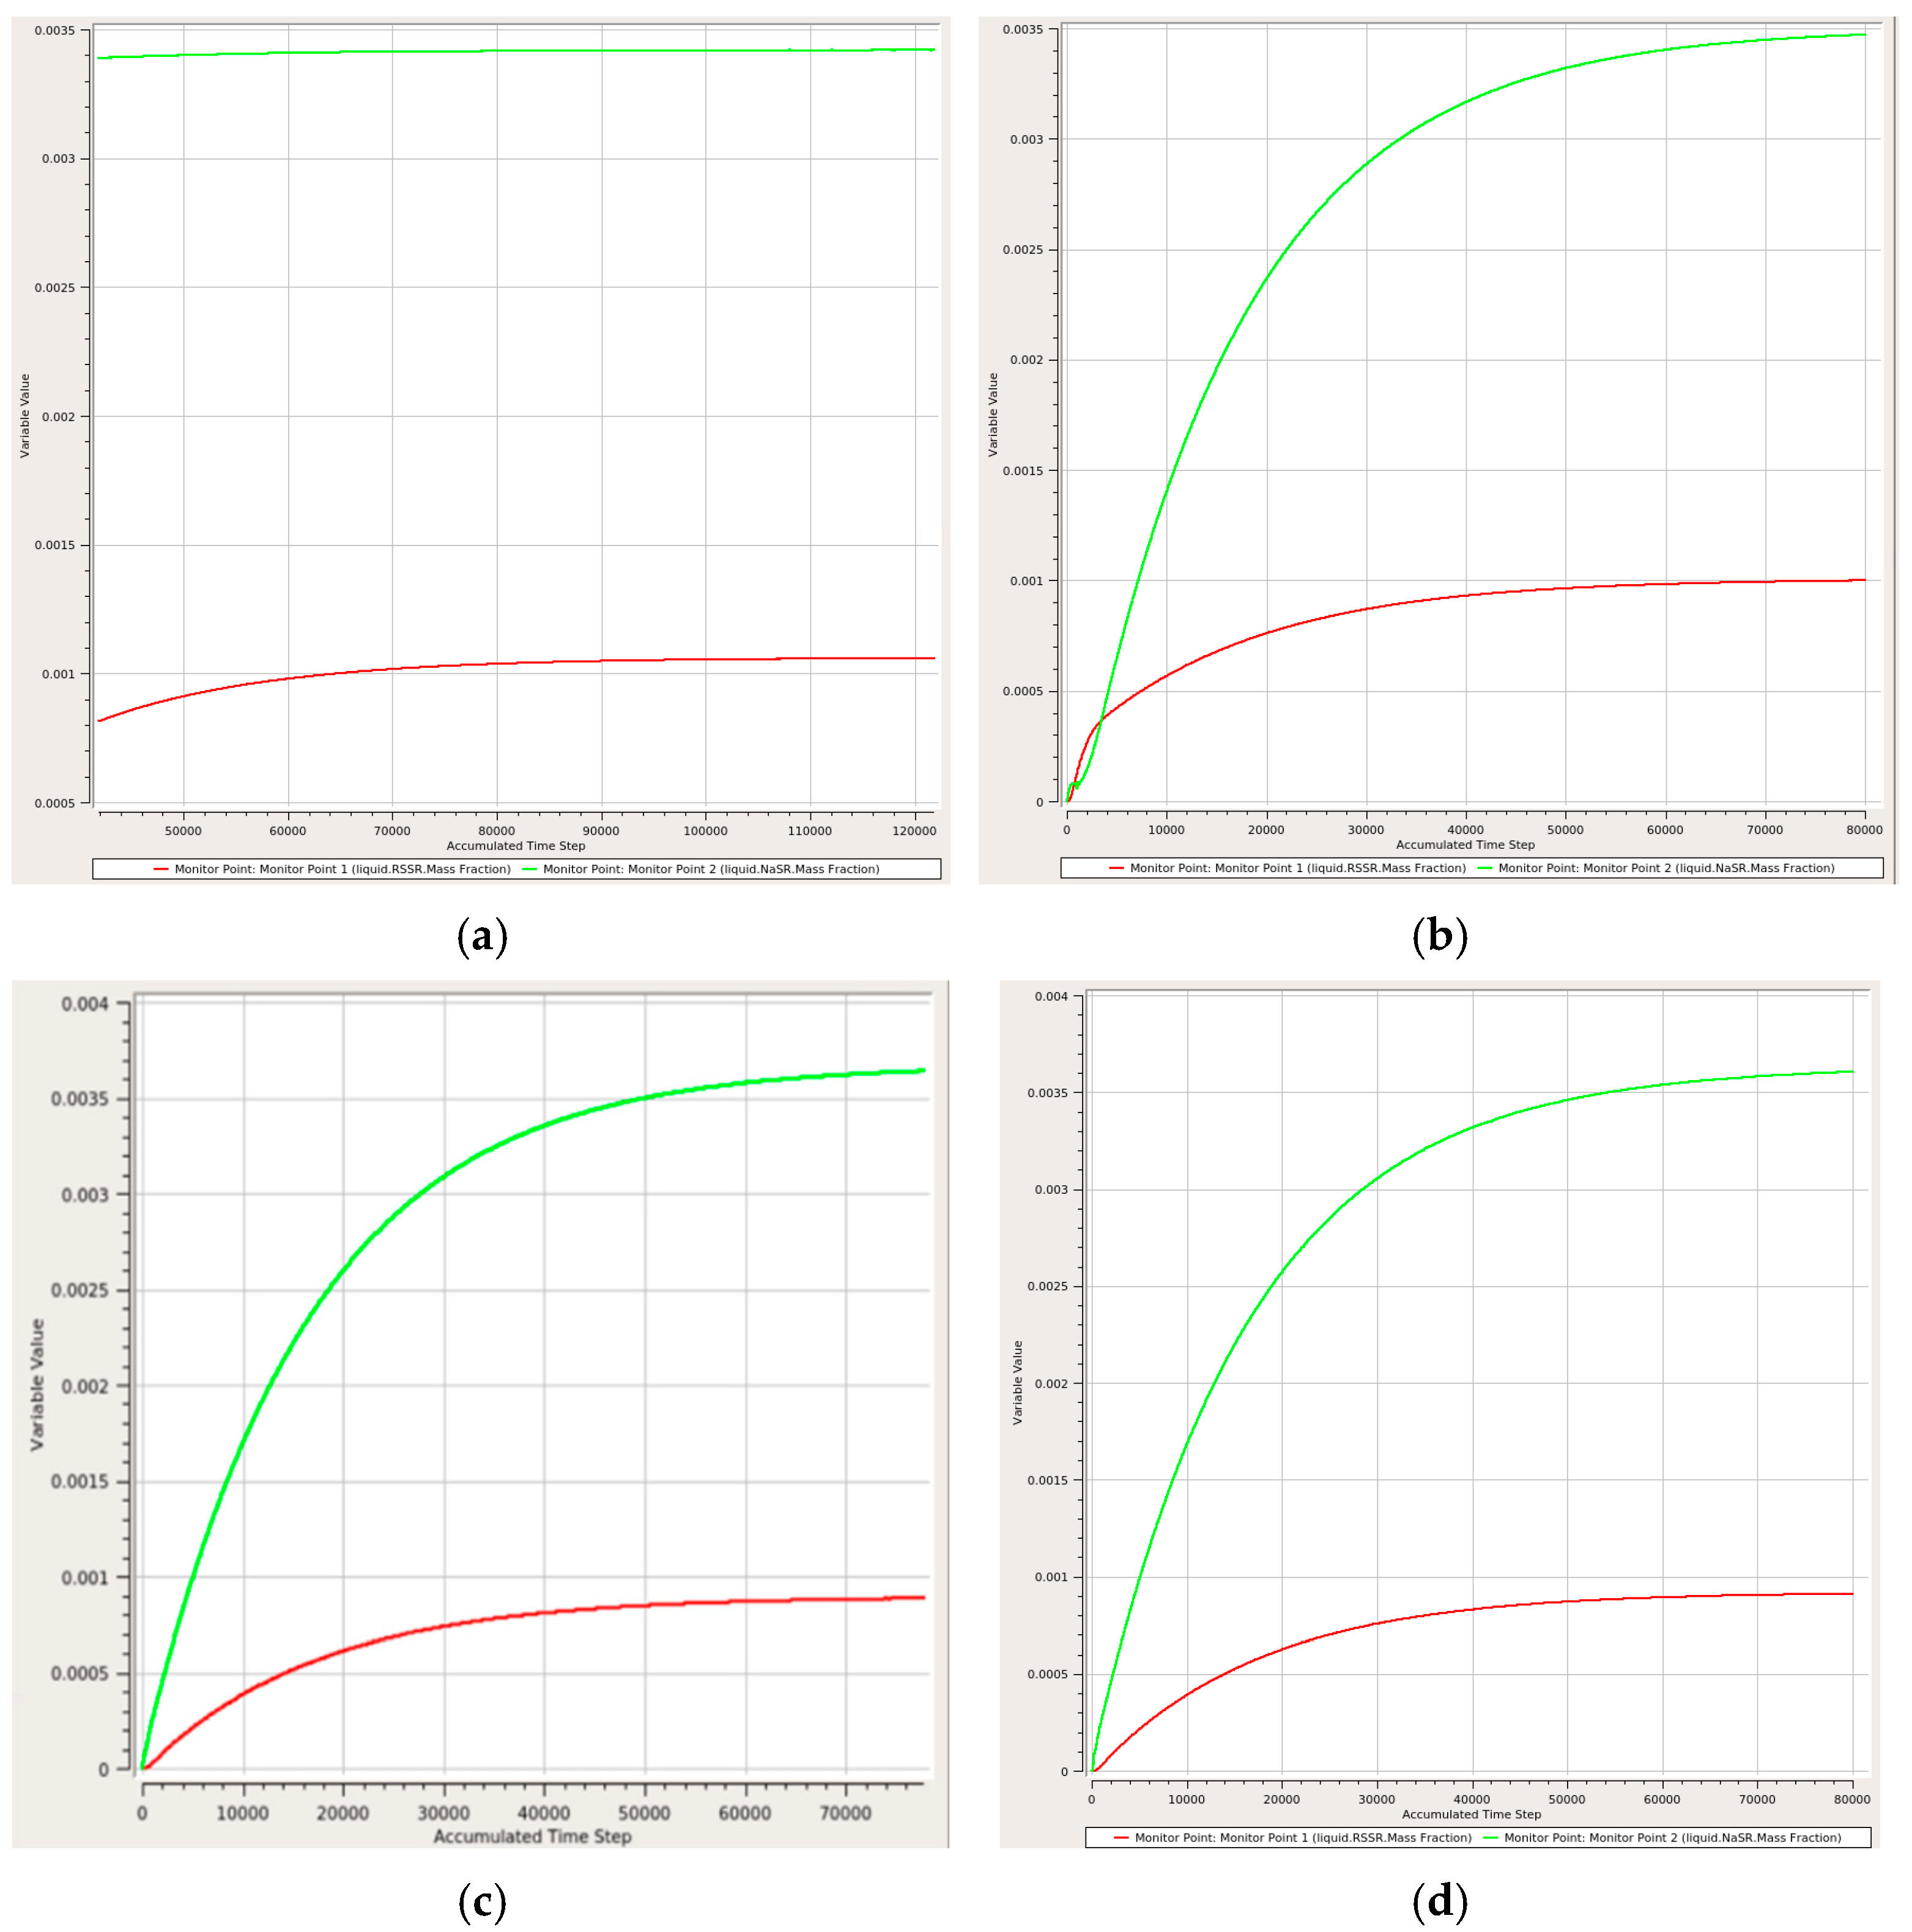
In the CFD transient simulation, the variation curves of mass fractions of RSSA (red curve) and NaSR (green curve) with accumulated time steps were monitored under four grid number conditions. As observed in Figure 8a–d, the values exhibit minimal fluctuations and tend to stabilize after 60,000 time steps, indicating that the simulation results achieve transient convergence.
Figure 8.
Plots of mass fraction of NaSR and RSSR over iteration steps. (a) For the grid number of 56,000, (b) for the grid number of 76,000, (c) for the grid number of 116,000, (d) for the grid number of 300,000.
3.7. Reaction Kinetics
Based on the conclusion by Harknes and Murray, the chemical reaction in solution is first-order with respect to both methyl mercaptan and dissolved oxygen [22]. The degradation kinetics of sodium methyl mercaptan are formulated based on the batch experimental data generated in the present study.
While the rate of disappearance of dissolved oxygen is denoted by the following:
where the unit of the reaction rate is mol/(m3·s) and the unit of the concentration is mol/m3. Mass fractions (nondimensional) are used hereafter, calculated via molar masses.
4. Results and Discussion
4.1. Hydrodynamics
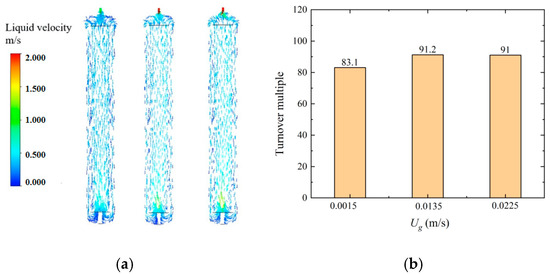
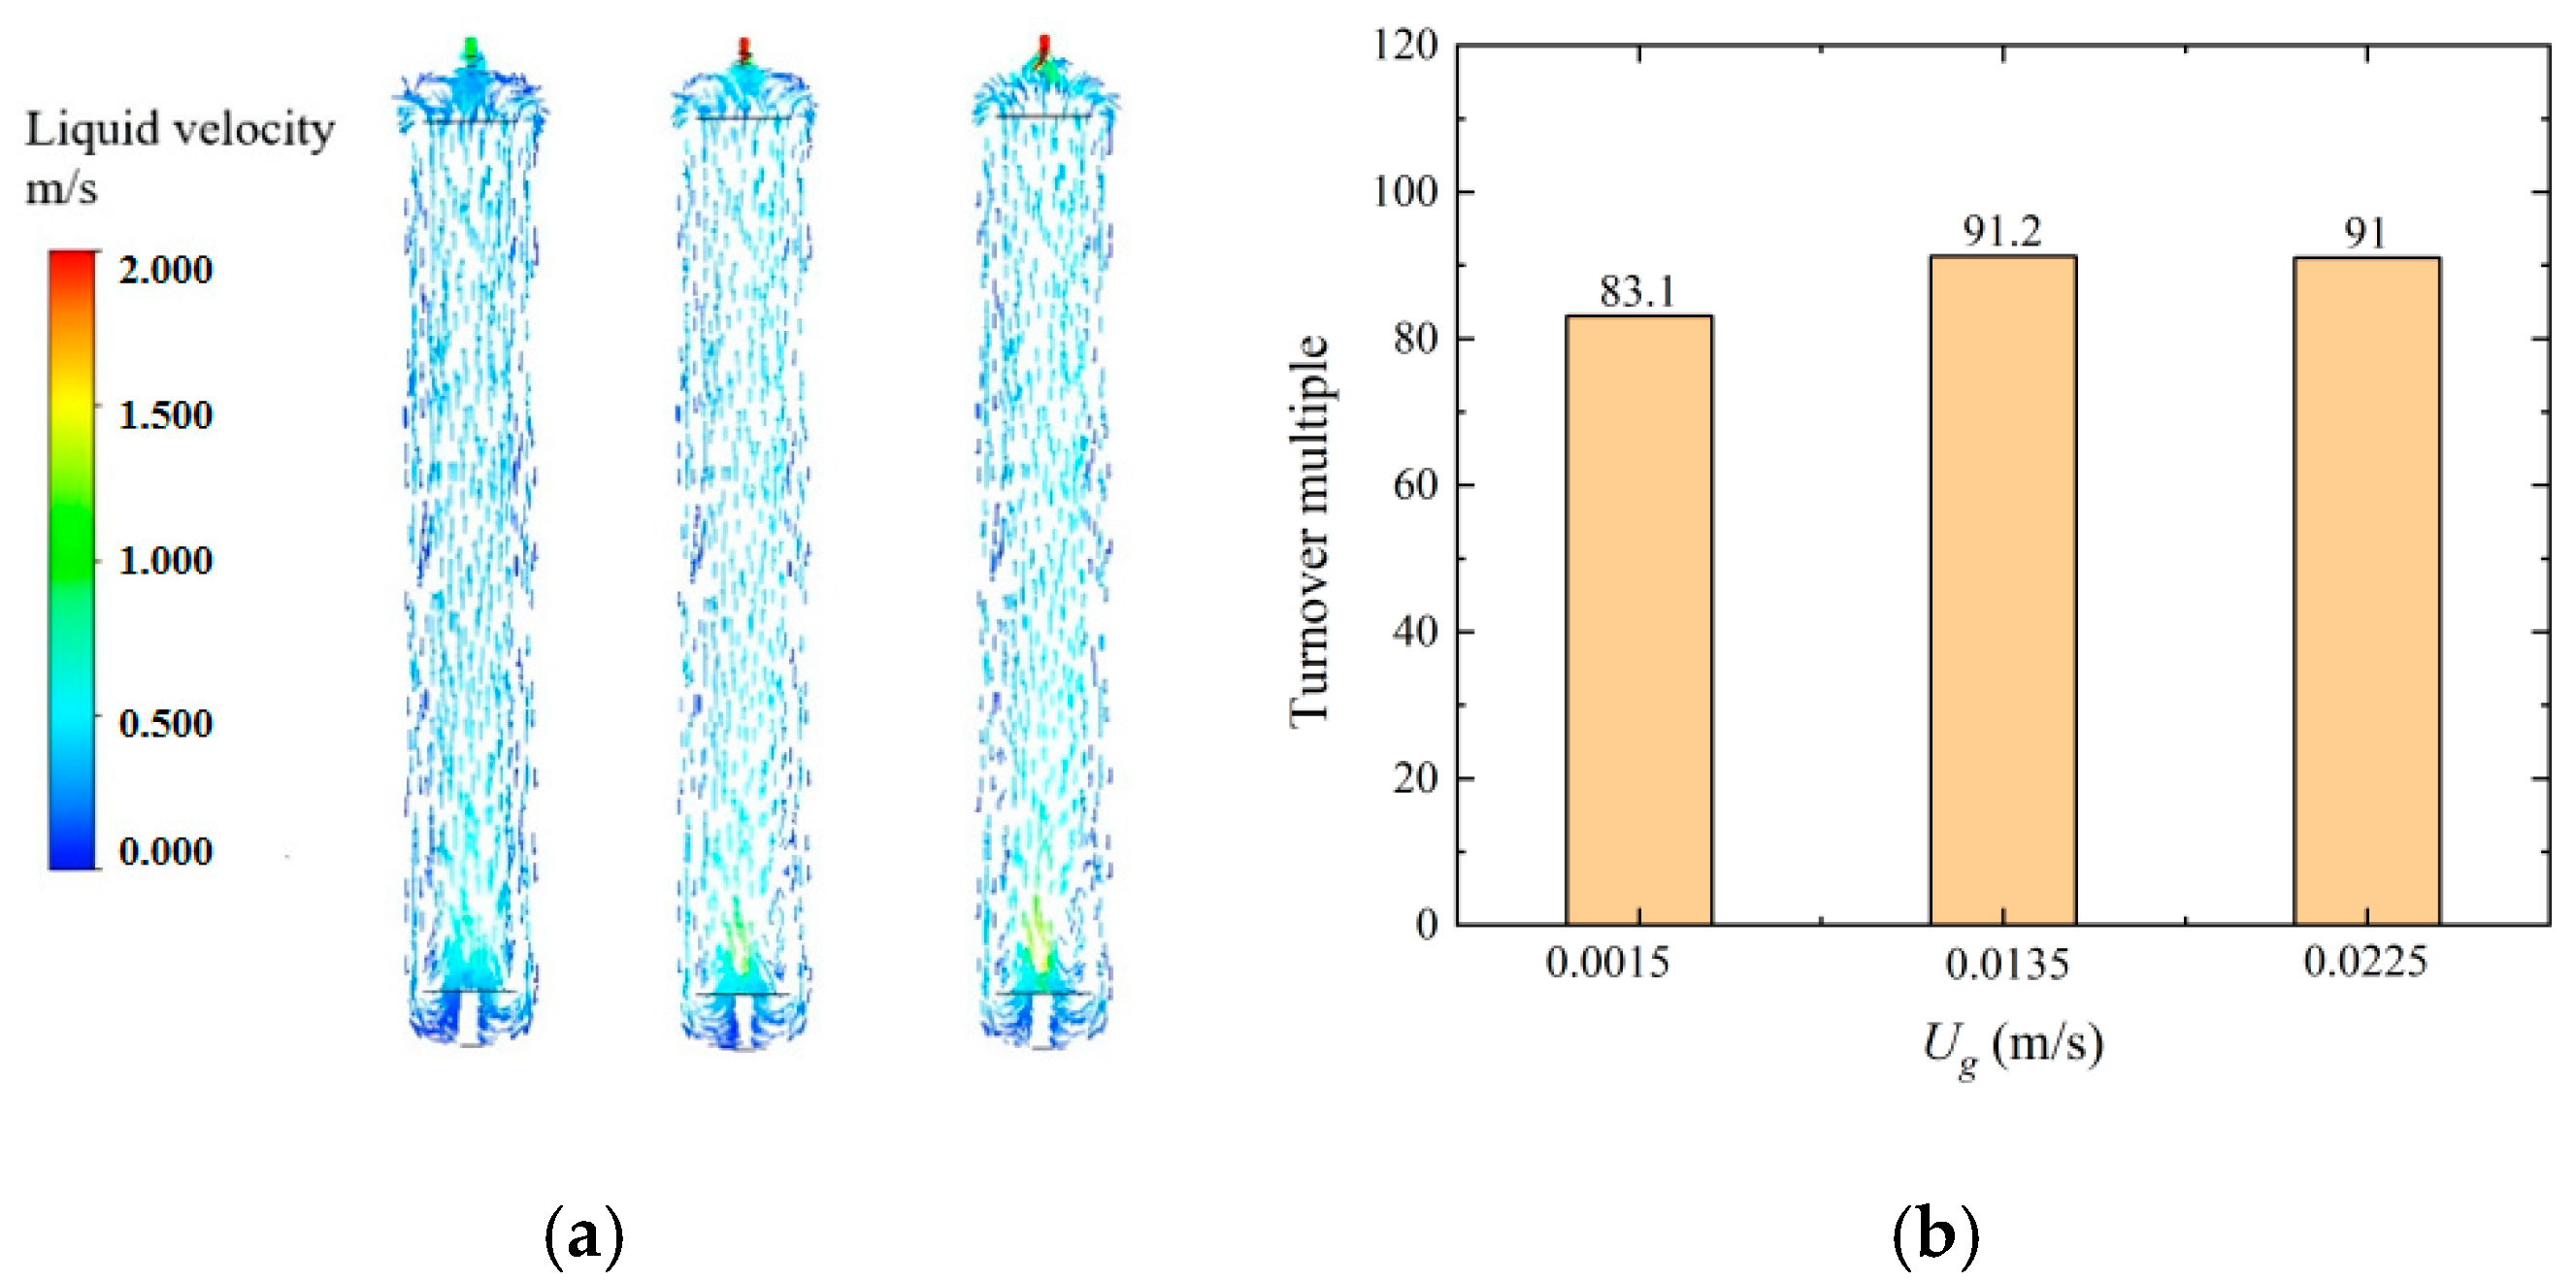
The liquid circulation is caused by the gas holdup difference between the riser and downcomer. Figure 9a shows the contours of the liquid velocity at different superficial gas velocities. The relatively small superficial gas velocity exhibits typical homogeneous bubbly flow and the liquid circulation velocity is independence on the superficial gas velocity. The turnover multiple, which is equal to the liquid circulation flow rate divided by the fresh incoming liquid flow rate, is shown in Figure 9b. Based on the Euler–Euler two-phase flow model, the k-ε turbulence model, and the Particle Balance Model (PBM), a numerical simulation framework for airlift loop reactors was established. Steady-state simulations were conducted at three different superficial gas velocities (Ug). The turnover ratio was obtained using the formula: Turnover Ratio equals liquid circulation flow divided by fresh feed flow. The turnover multiple was 83.1, 91.2, and 91 for the three superficial gas velocities, which indicates the well mixing performance of the airlift loop reactor. It is the fact that the superficial gas velocity increases the turnover multiple slightly for which the driving force generated by the differential pressure between the riser and the downcomer increases.
Figure 9.
Liquid flow pattern inside the reactor. (a) Contours of liquid velocity, (b) turnover multiple along with Ug.
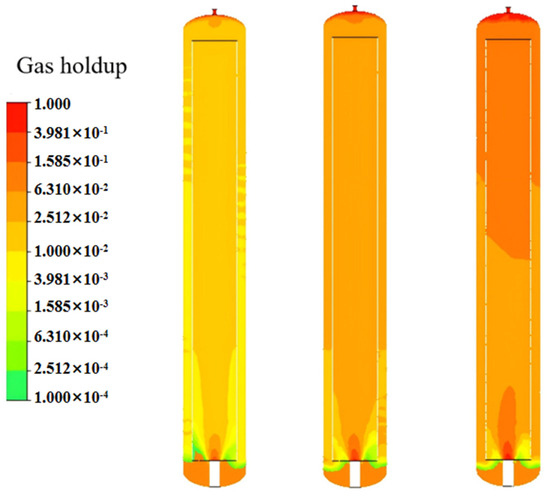
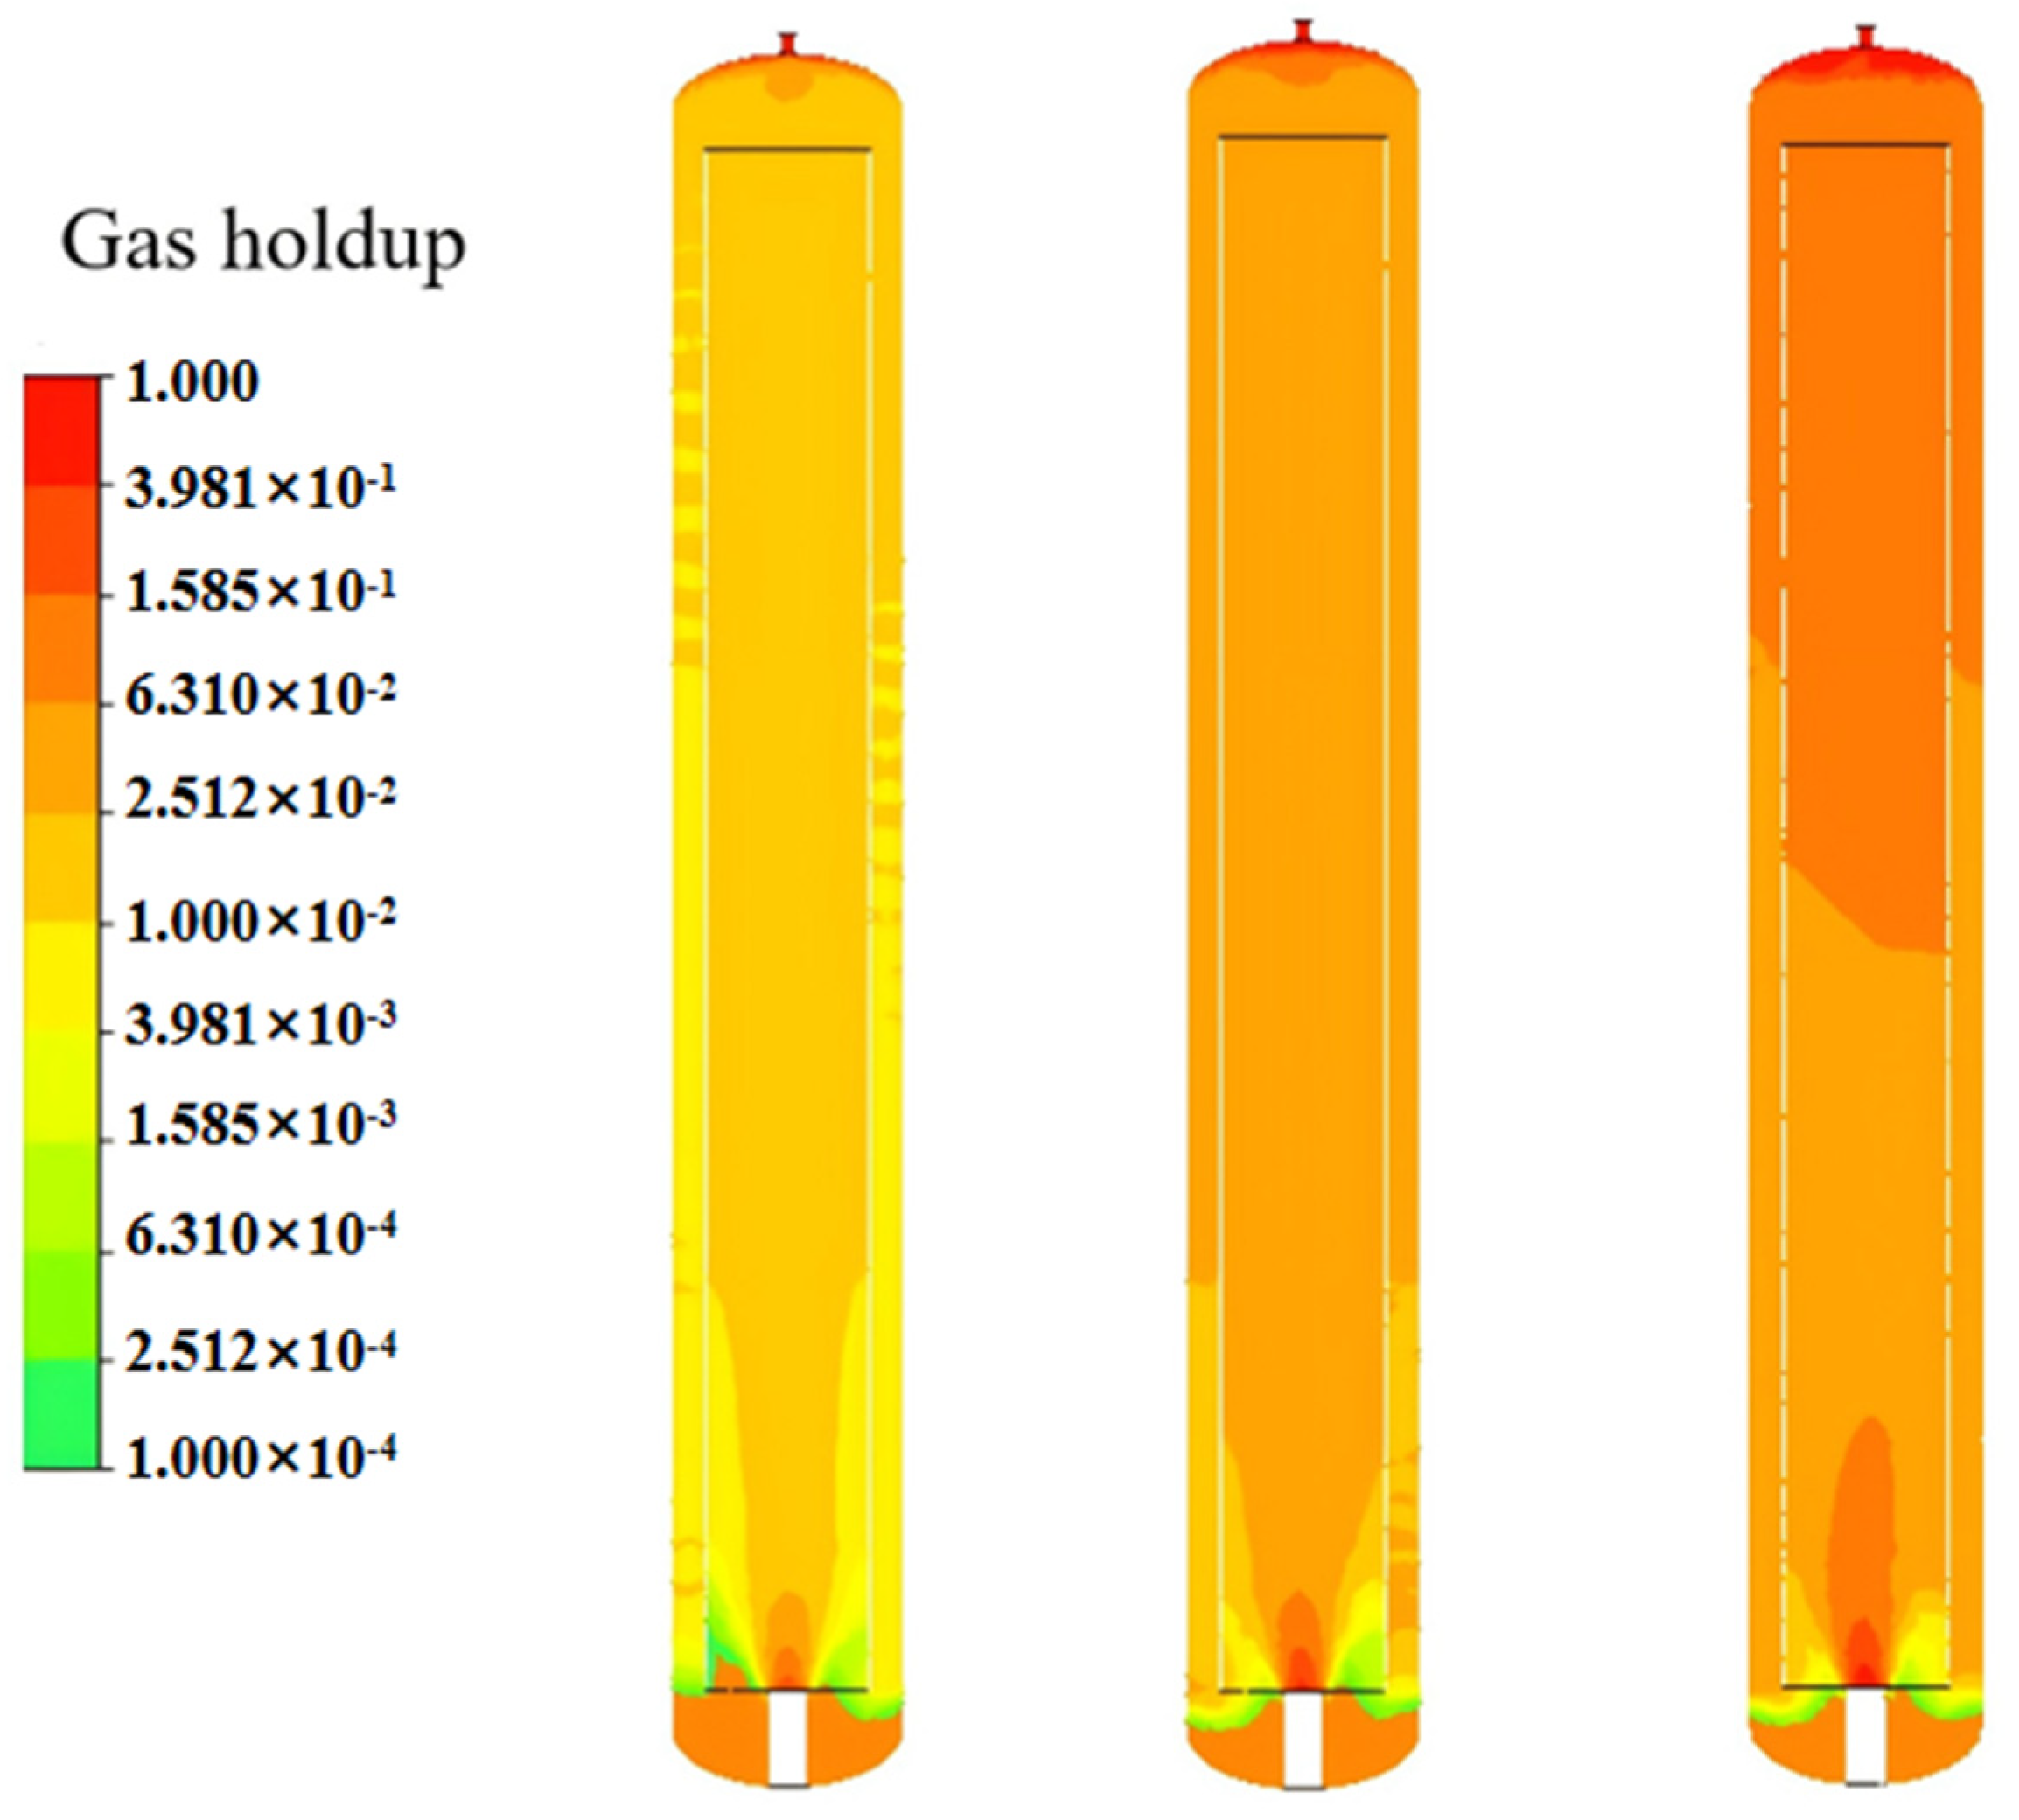
Figure 10 presents contours of gas holdup across the reactor’s longitudinal section under varying superficial gas velocities (Ug). Gas holdup increases monotonically with Ug. Notably, gas holdup within the riser is significantly higher than that in the downcomer. Minimum gas holdup occurs in the transition zone connecting the downcomer to the riser, arising from the reversal of liquid flow direction (from downward to upward) in this region, which limits bubble entrainment with the liquid. As Ug increases, an increasing number of bubbles are gradually entrained from the downcomer into the riser circulation. Maximum gas holdup is observed at the reactor’s top outlet, attributed to the high gas-to-liquid volume ratio at this position, where gas dominates the bulk volume.
Figure 10.
Contours for the mass fraction of dissolved oxygen. From left to right, they represent the superficial gas velocities of 0.0045, 0.0135, and 0.0225 m/s in sequence.
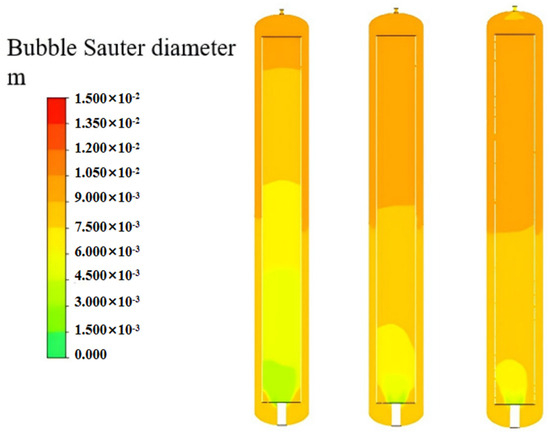
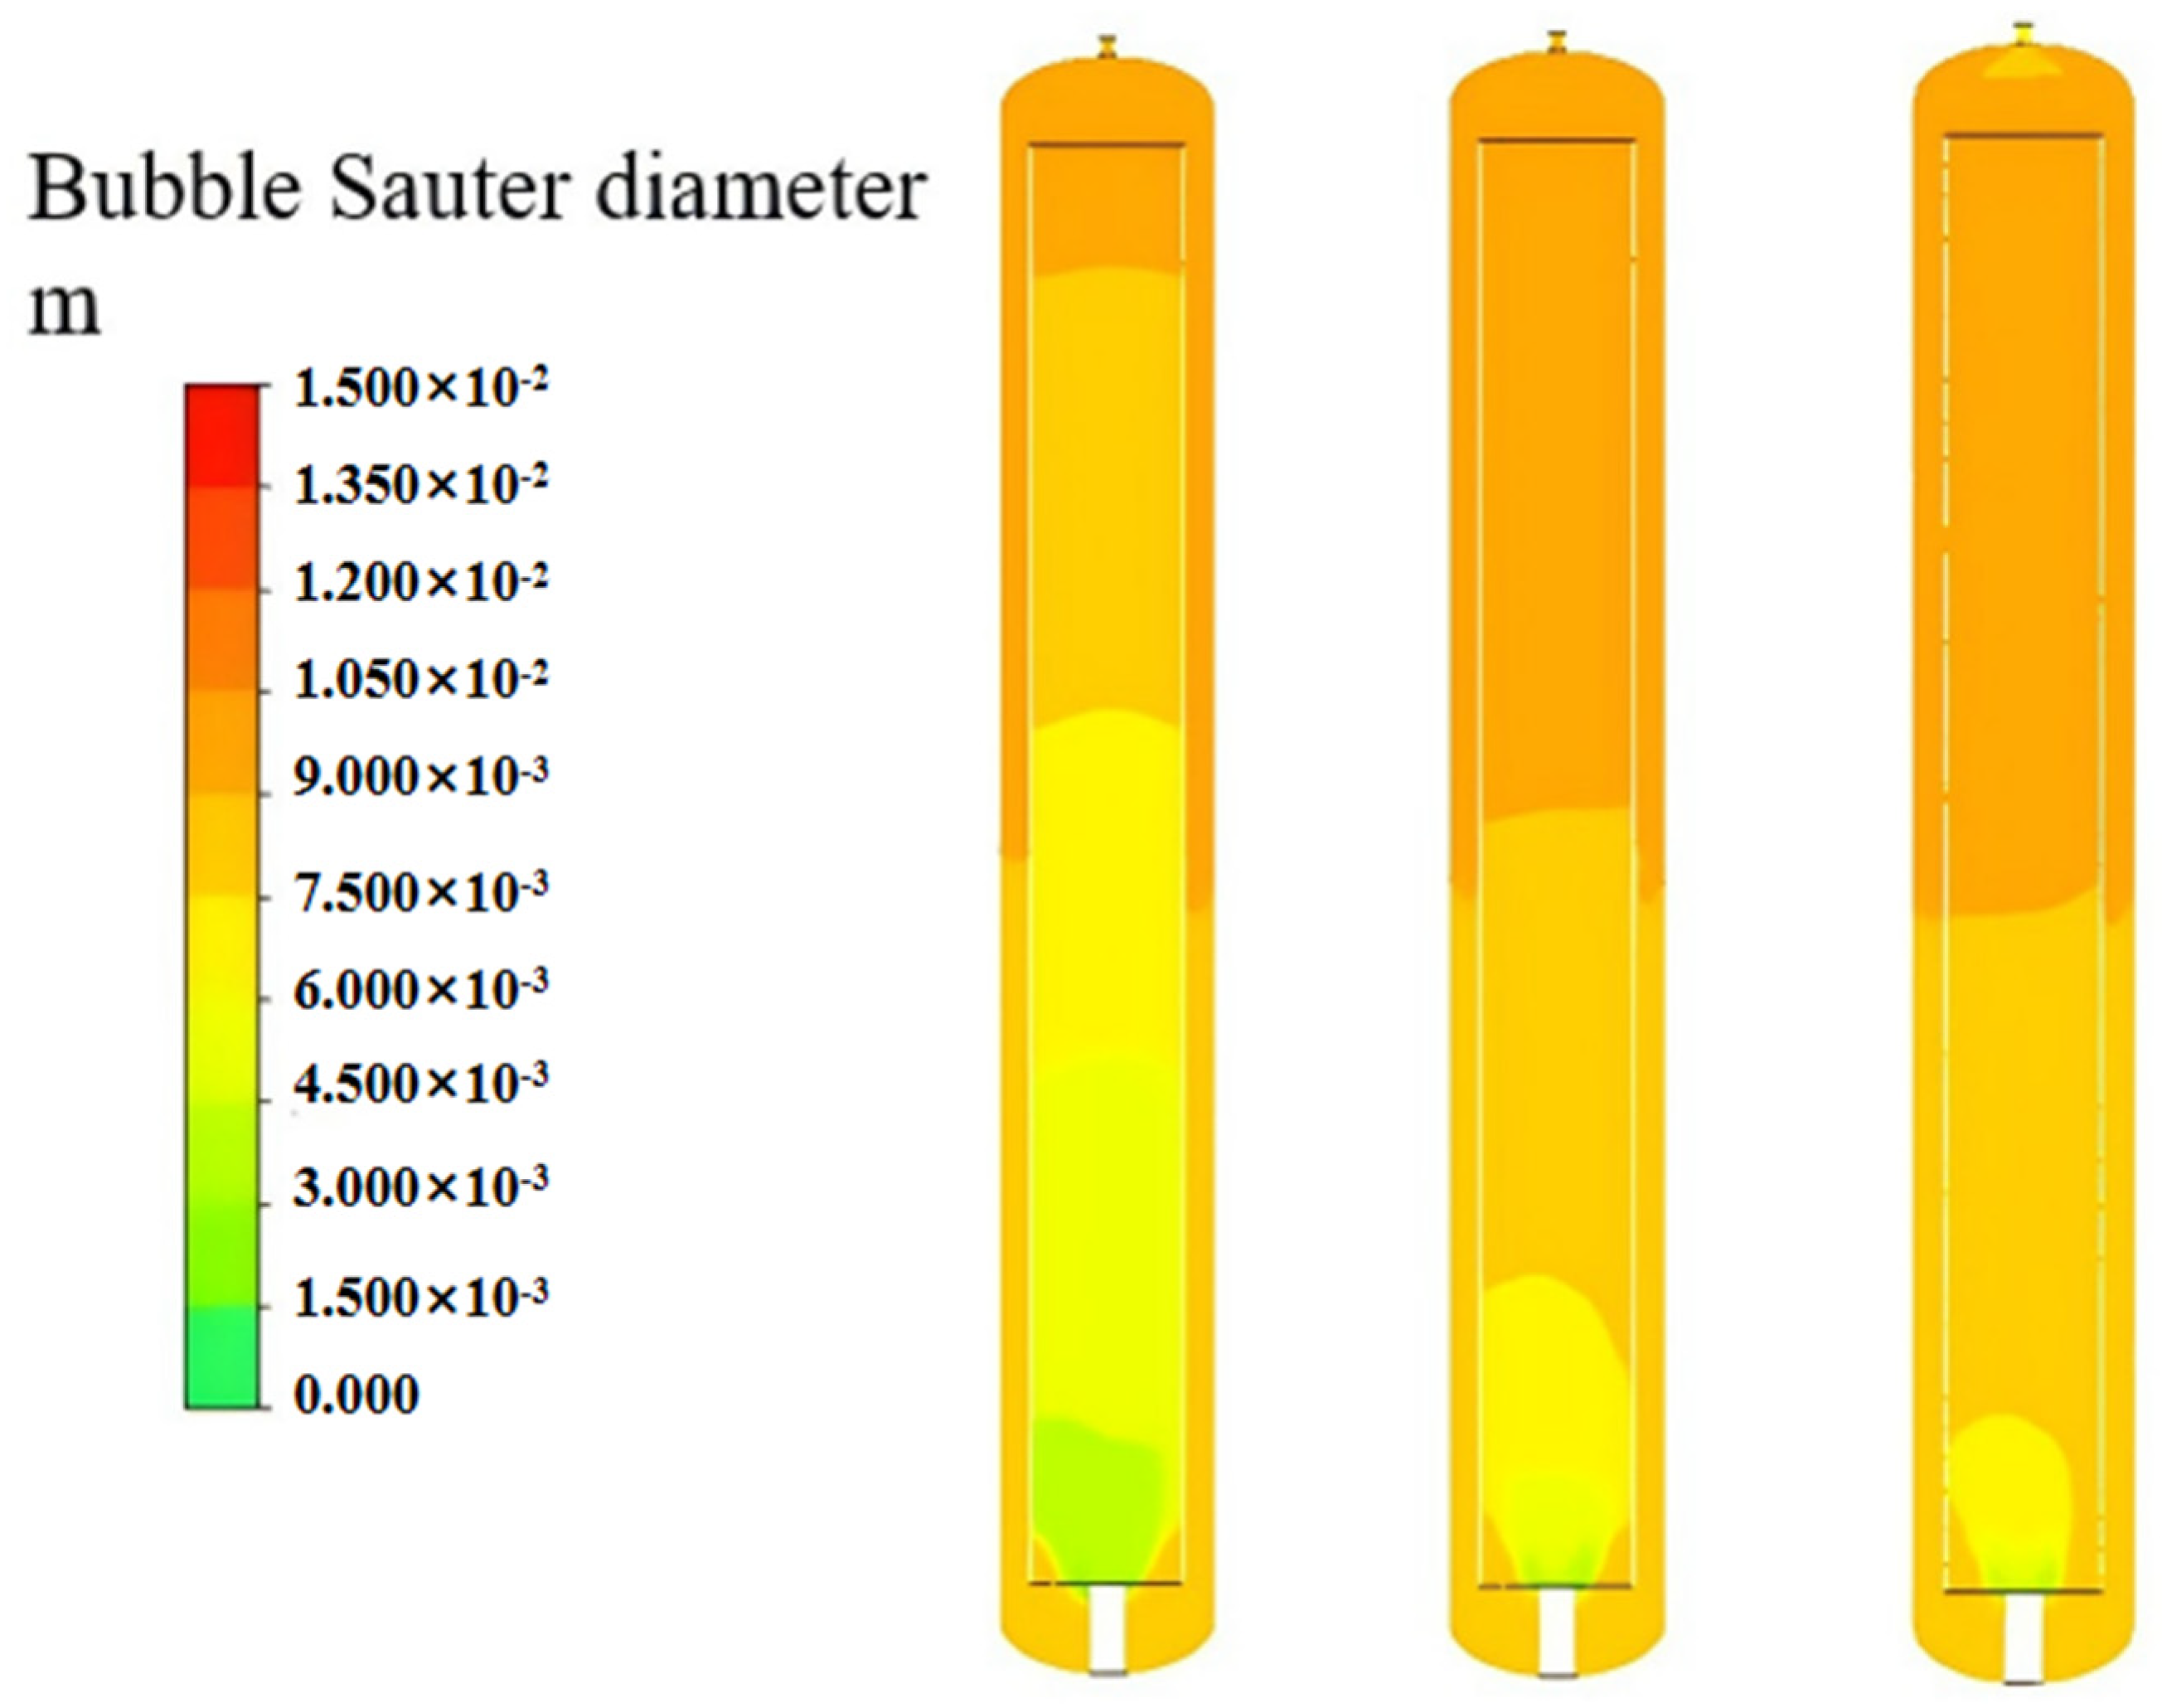
Bubble size distribution is a key hydrodynamic parameter, governed by bubble coalescence and breakup processes. Figure 11 illustrates the distribution of the Sauter mean bubble diameter under varying superficial gas velocities (Ug). At relatively low Ug, bubbles are sparsely distributed, and their diameter is independent of Ug. Bubble coalescence is inferred from the gradual increase in diameter from the bottom to the top of the riser, while bubble breakup is suggested by the progressive decrease in diameter from the top to the bottom of the downcomer.
Figure 11.
Contours for the bubble Sauter diameter. From left to right, they represent the superficial gas velocities of 0.0045, 0.0135, and 0.0225 m/s in sequence.
The surface area per unit volume is then calculated by
The volume fraction for mass transfer is implemented as
and take values of 0.8 and 10−7, respectively.
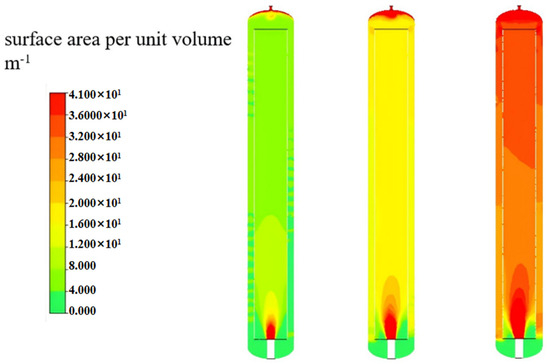
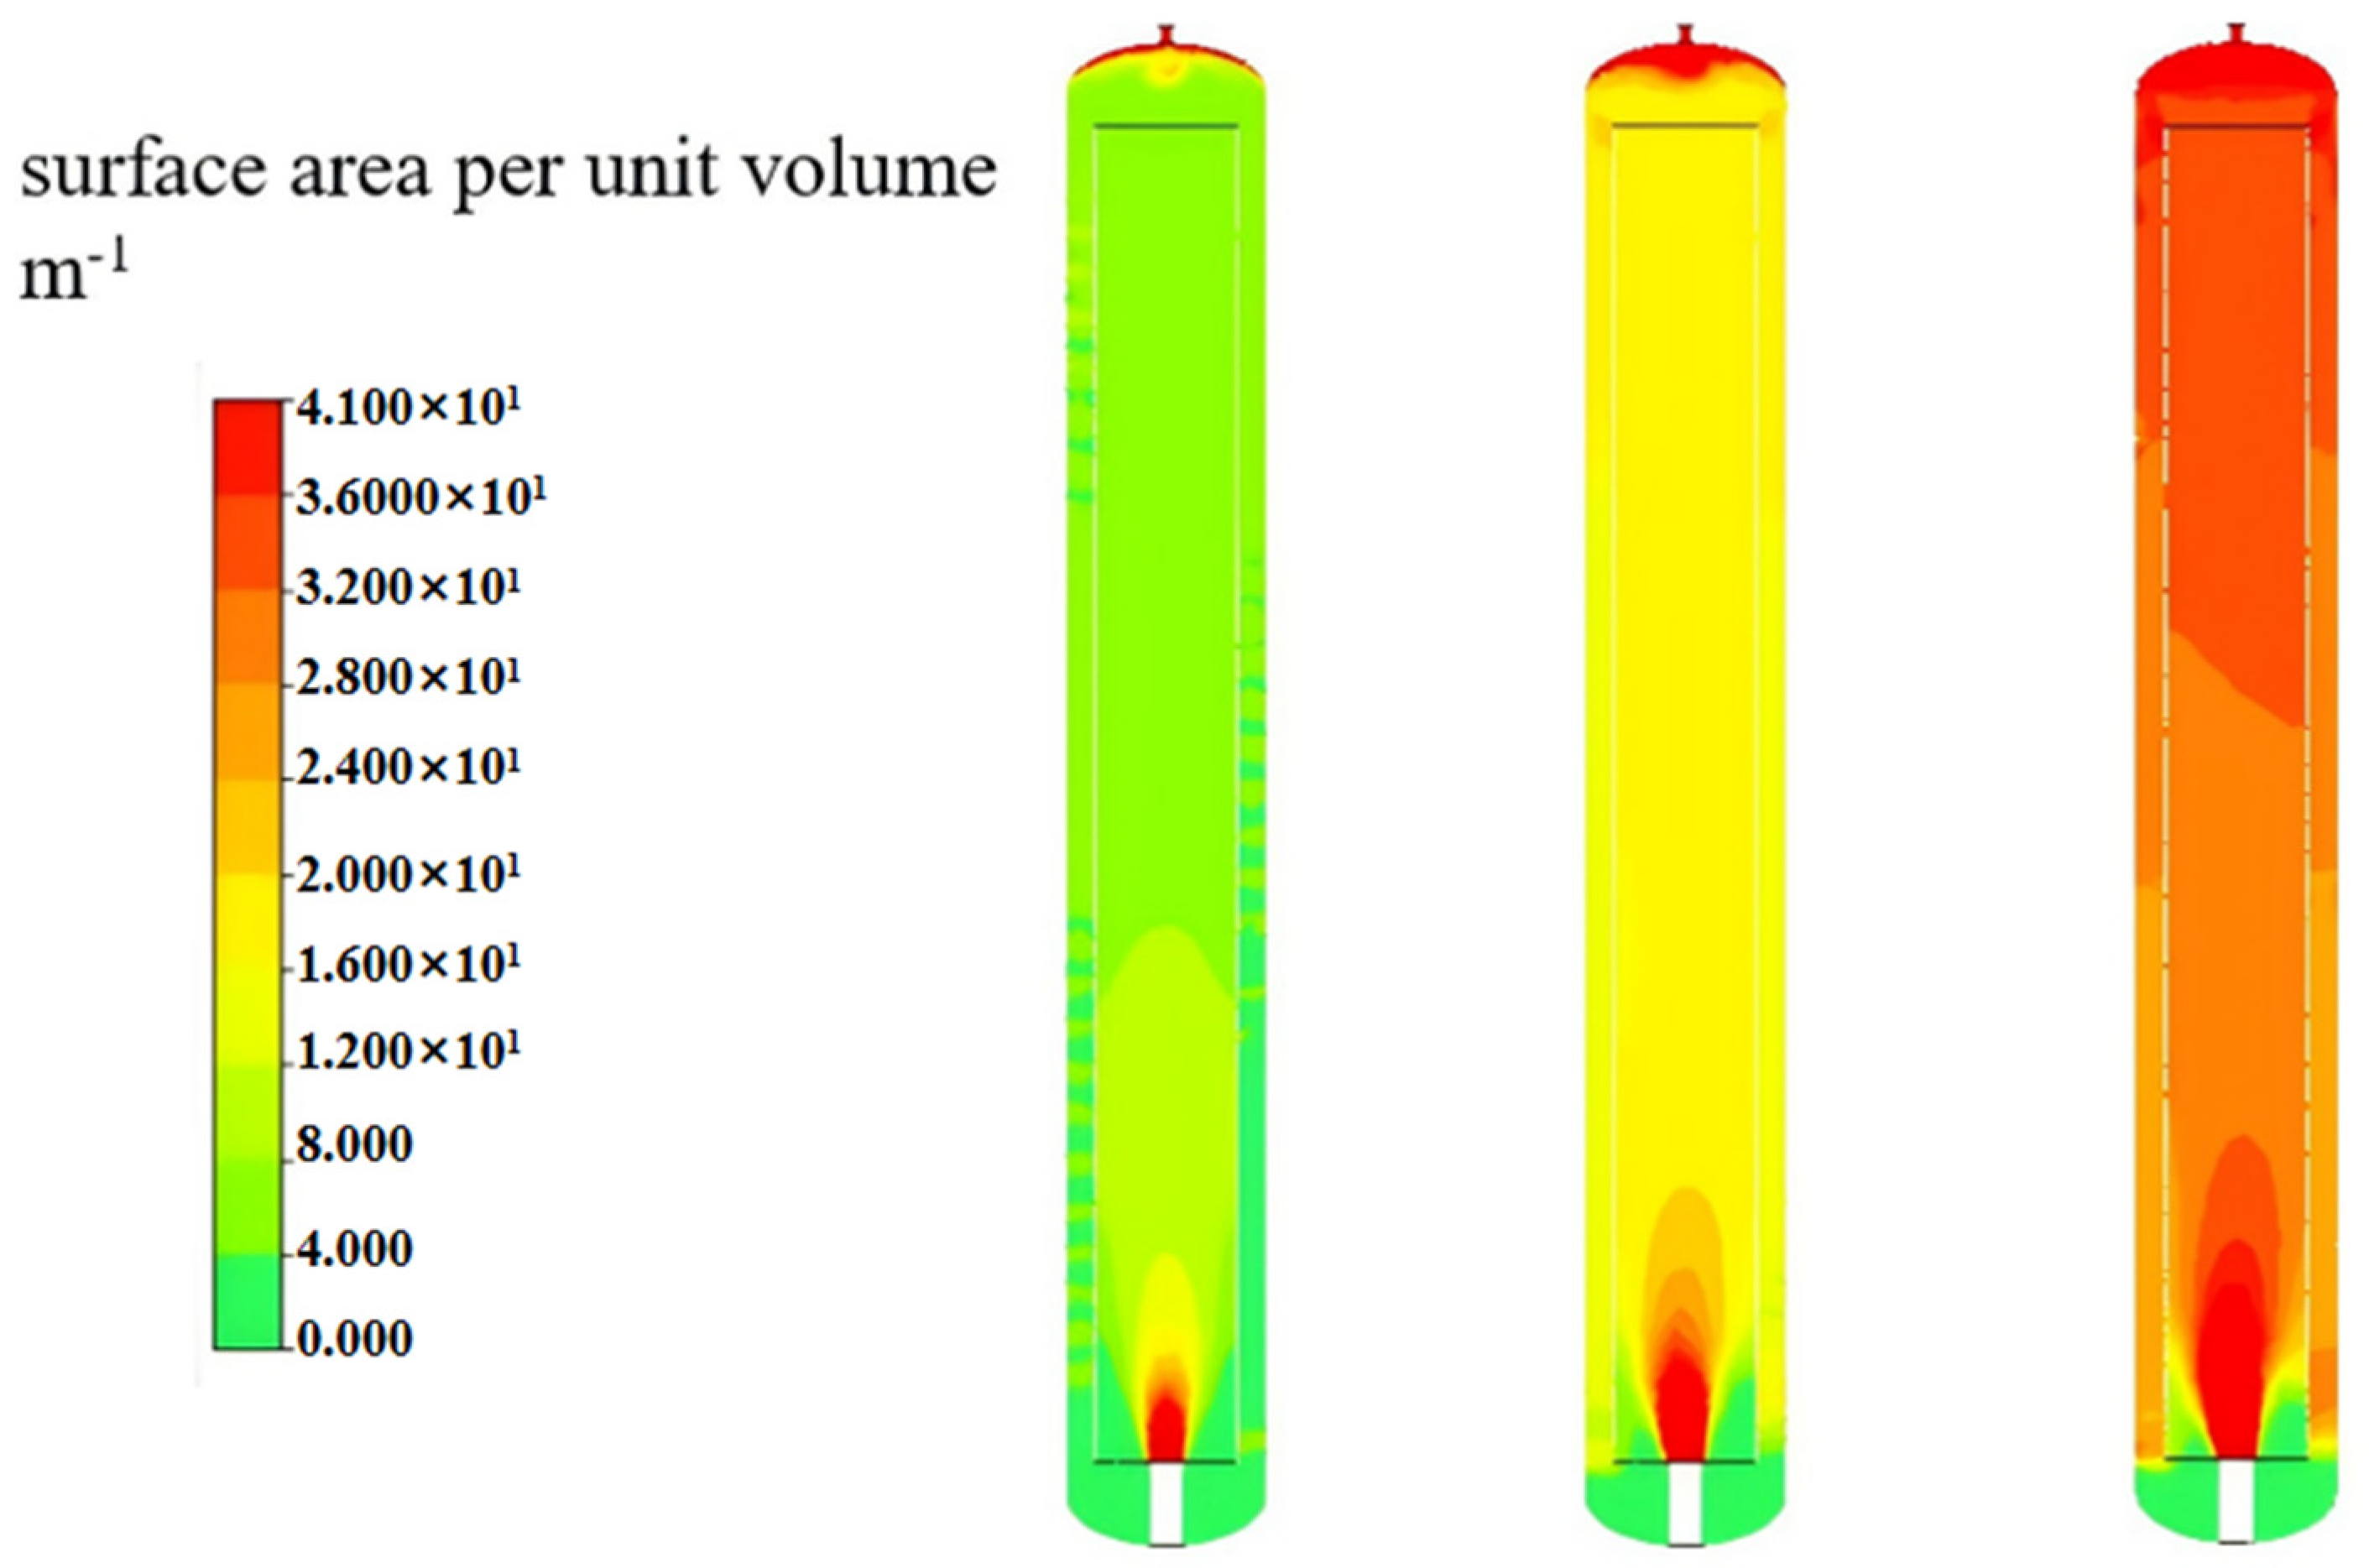
Figure 12 displays the contours of the specific surface area. The specific surface area increased a with Ug, expanding spatially to cover more of the riser, consistent with gas holdup.
Figure 12.
Contours for the surface area per unit volume. From left to right, they represent the superficial gas velocities of 0.0045, 0.0135, and 0.0225 m/s in sequence.
4.2. Mass Transfer Parameters
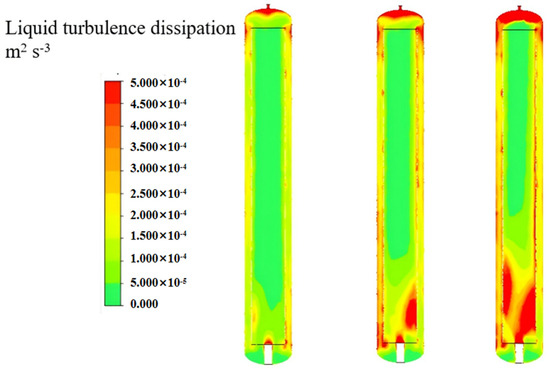
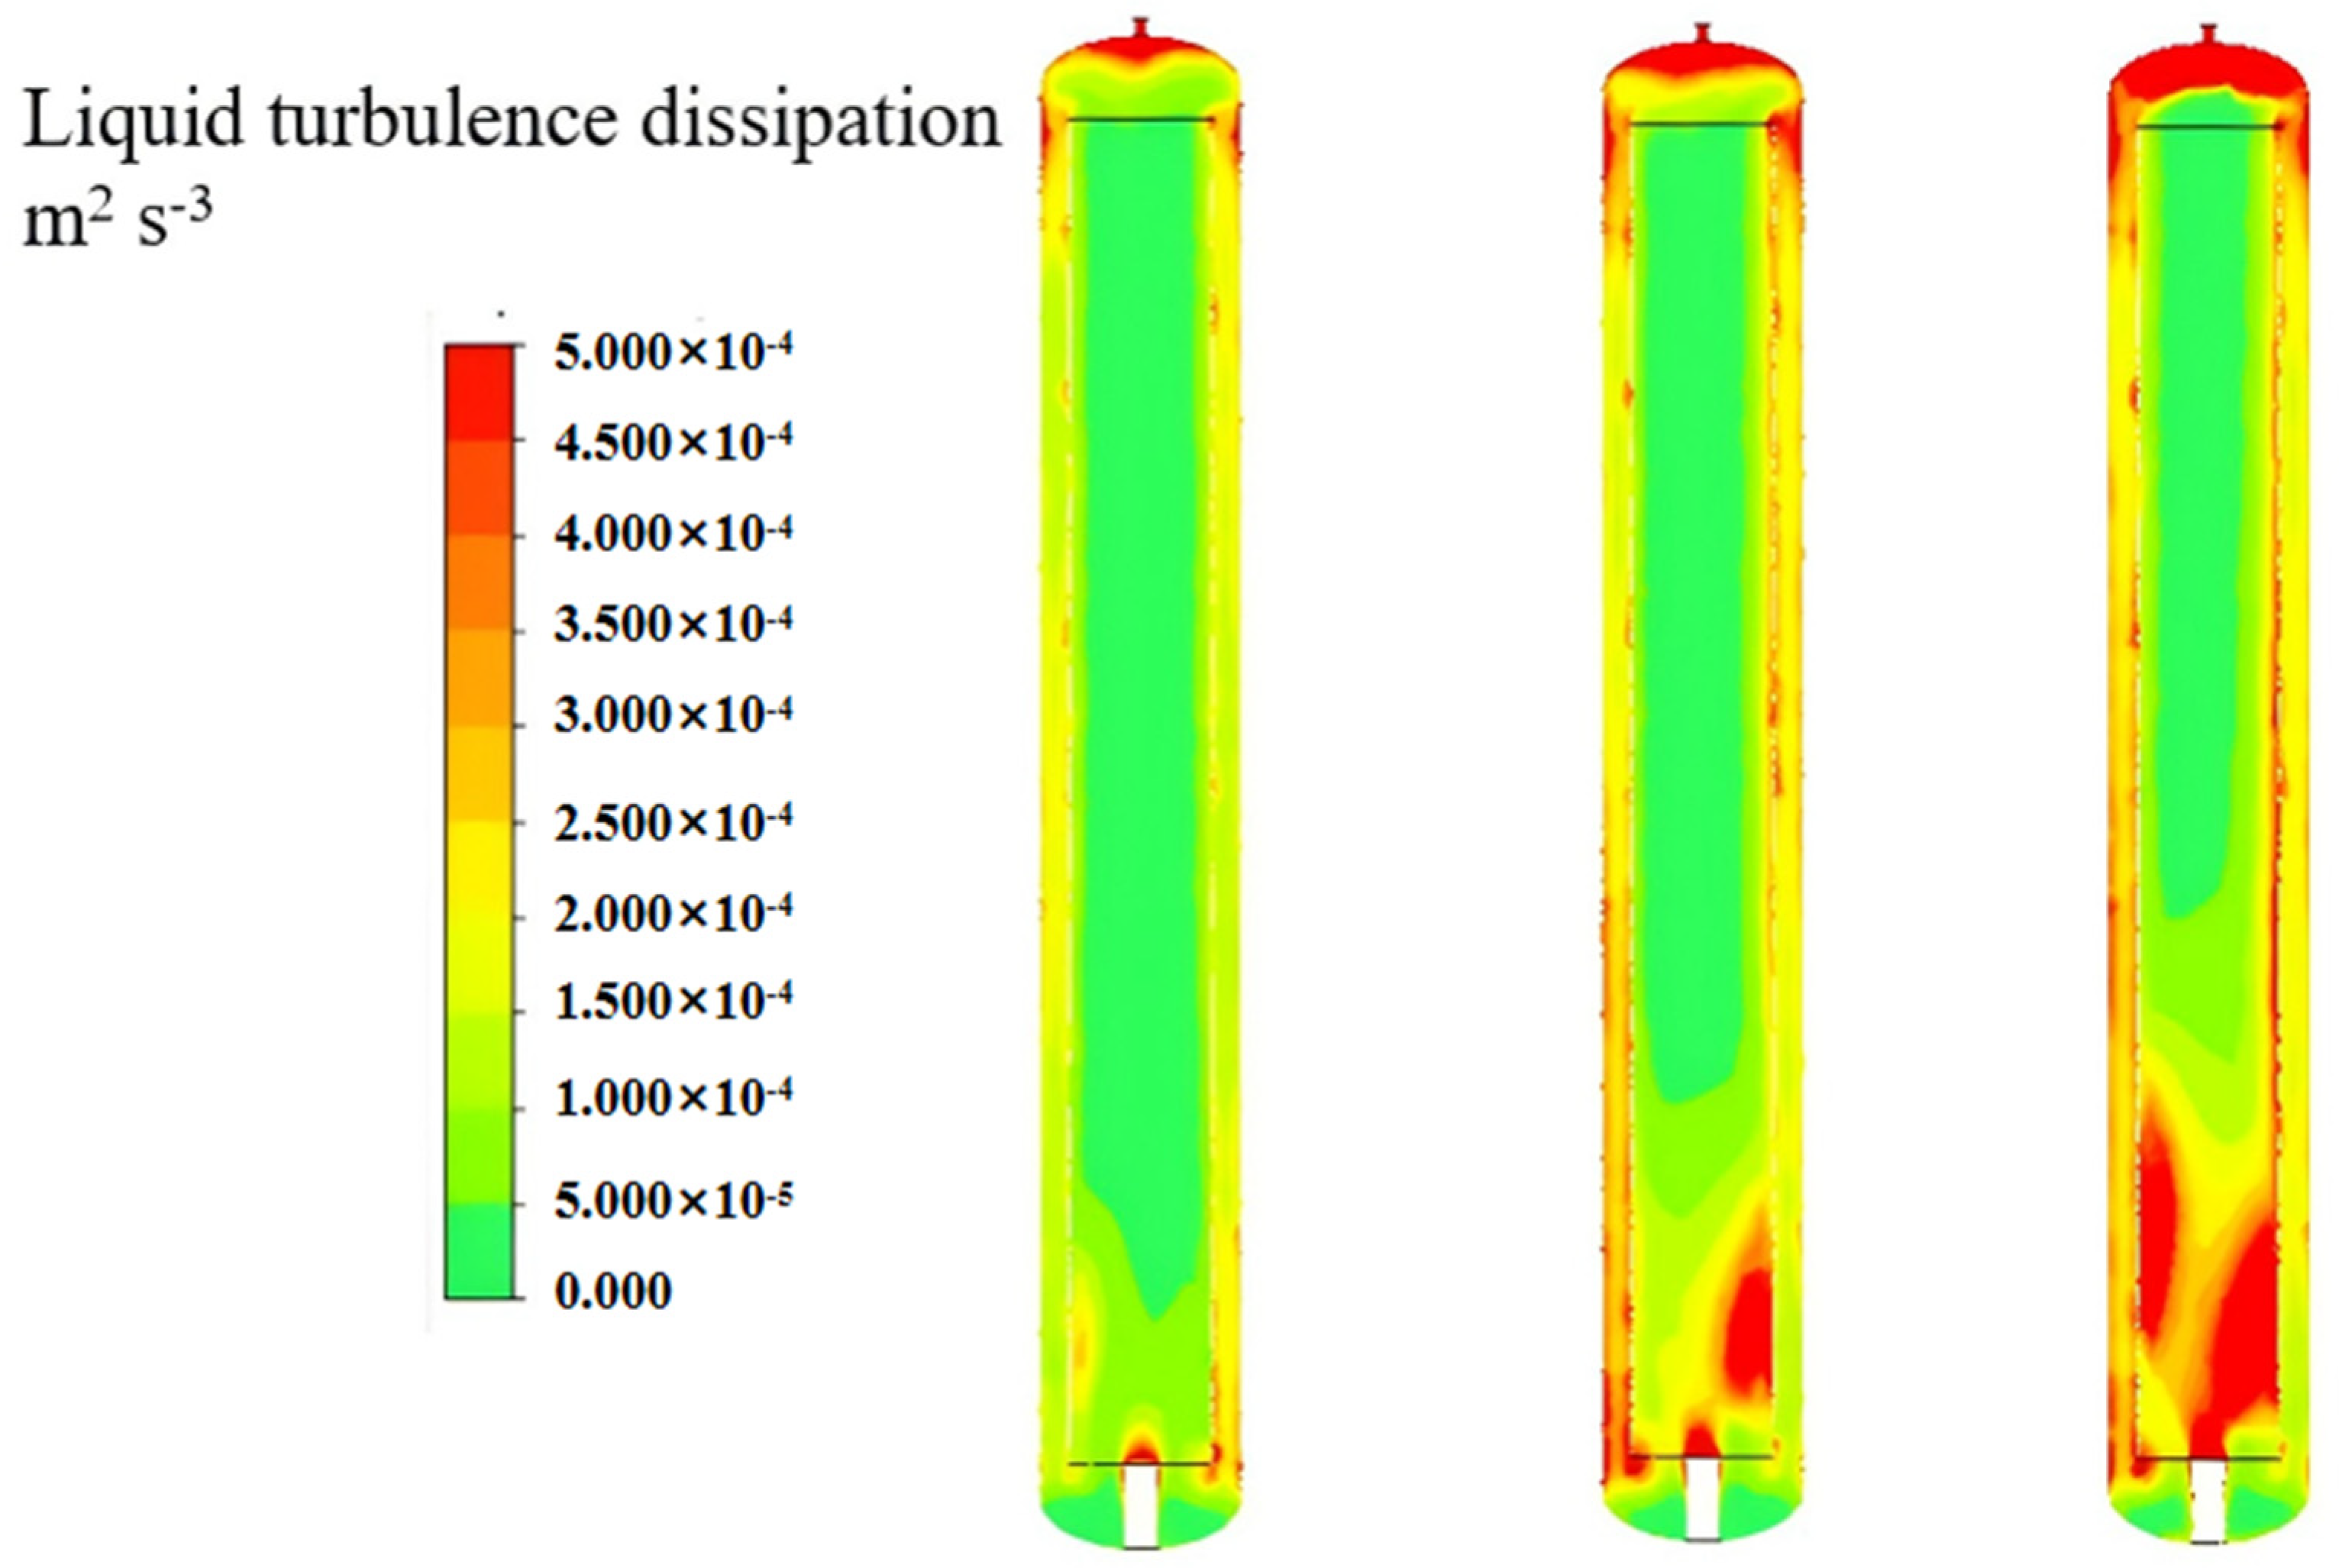
Figure 13 presents contour plots illustrating the effect of varying superficial gas velocities (Ug) on liquid turbulence dissipation. These contours indicate that elevated Ug enhances liquid turbulence, likely driven by intensified gas–liquid interactions and mixing.
Figure 13.
Contours for the liquid turbulence dissipation. From left to right, they represent the superficial gas velocities of 0.0045, 0.0135, and 0.0225 m/s in sequence.
Notably, the downcomer exhibits greater liquid turbulence dissipation compared to the riser, particularly at low Ug. Furthermore, despite liquid velocities remaining nearly constant across different Ug (as observed in Figure 9), liquid turbulence dissipation is strongly dependent on Ug. This dependence highlights that bubble-induced turbulence plays a pivotal role in governing liquid turbulence.
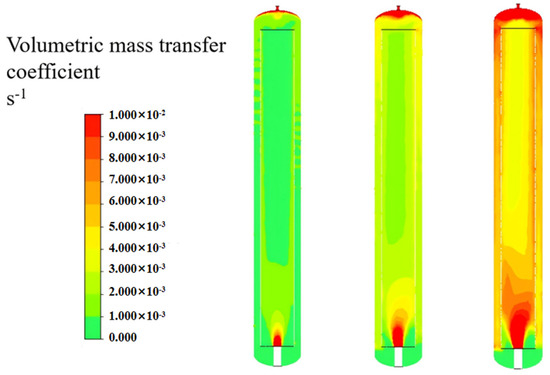
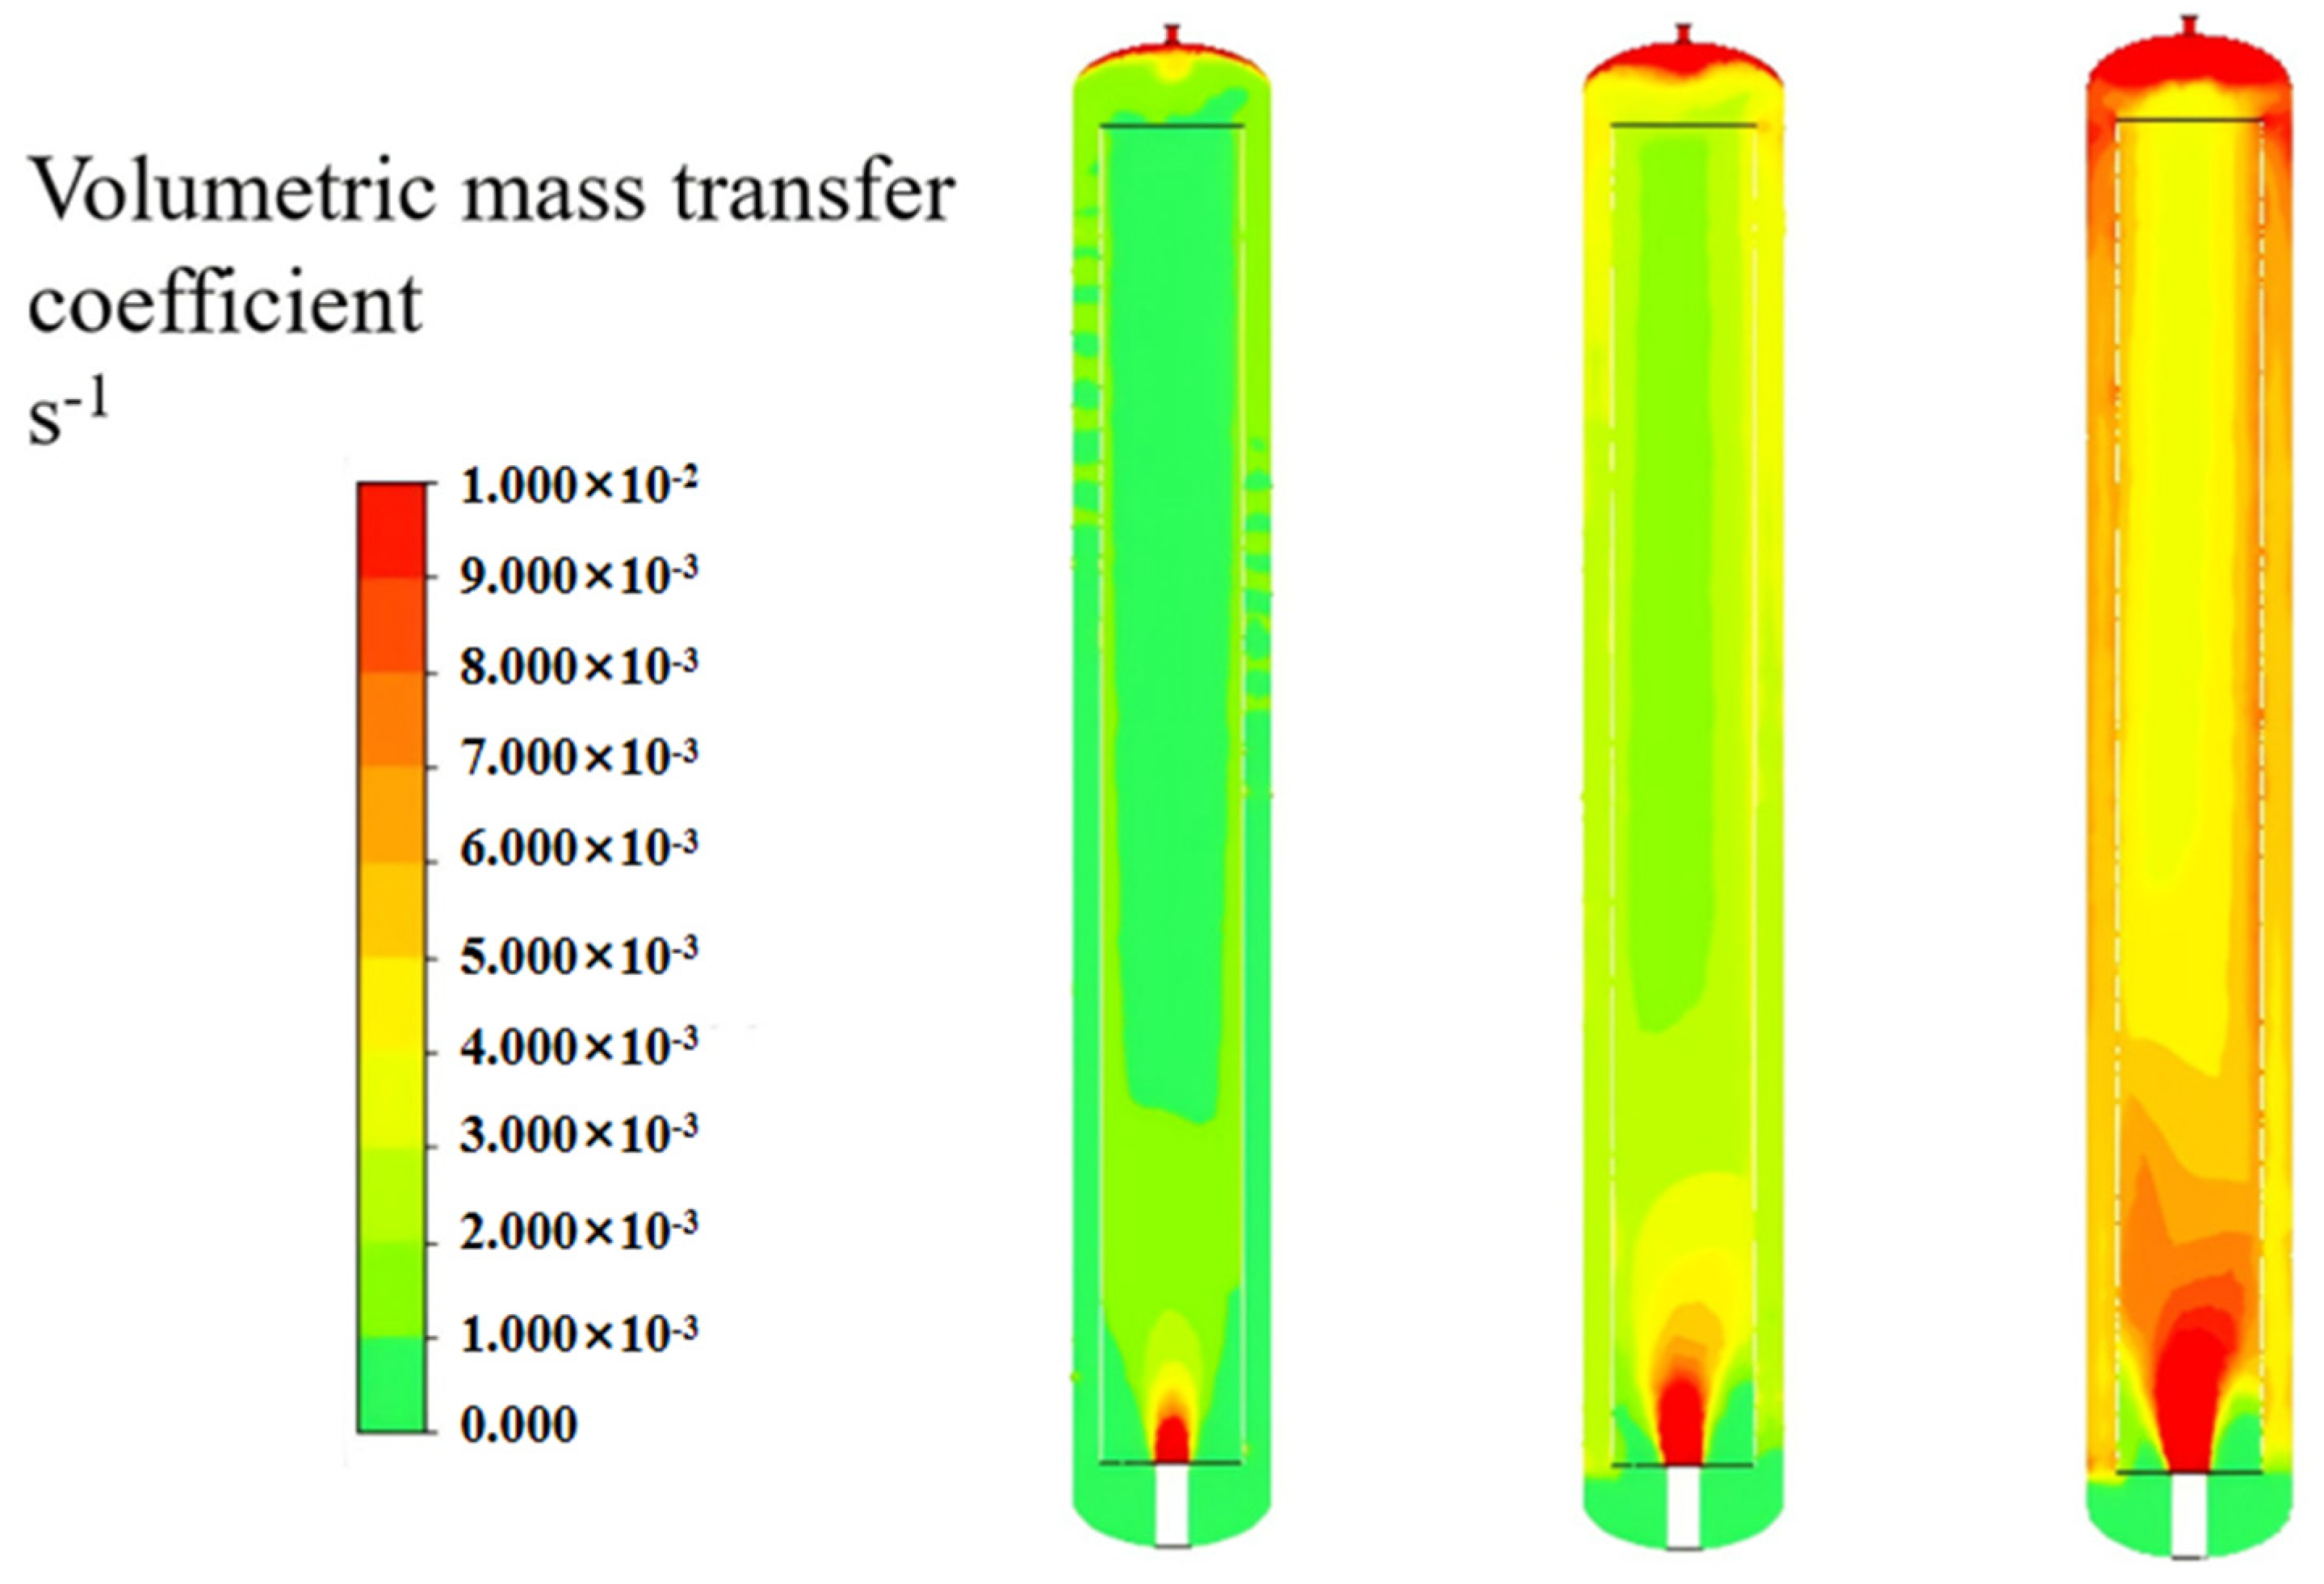
Figure 14 presents contour plots of the volumetric mass transfer coefficient () across the reactor, illustrating its dependence on superficial gas velocity (Ug). A clear monotonic increase in is observed with rising Ug, accompanied by a simultaneous vertical and horizontal expansion of high- regions. Initially concentrated near the gas inlet, these high- zones propagate upward and outward as Ug increases, progressively dominating the upper and central portions of the riser. This spatial expansion reflects enhanced gas–liquid interfacial interactions over a larger reactor volume.
Figure 14.
Contours for the volumetric mass transfer coefficient. From left to right, they represent the superficial gas velocities of 0.0045, 0.0135, and 0.0225 m/s in sequence.
Notably, the upper region of the riser exhibits relatively low values, which can be attributed to reduced liquid turbulence dissipation in this area. Conversely, the downcomer maintains a reasonable due to sustained turbulent mixing, despite lower gas holdup. These findings deepen our mechanistic understanding of mass transfer dynamics in airlift loop reactors, particularly the interplay between hydrodynamics and interfacial transport processes.
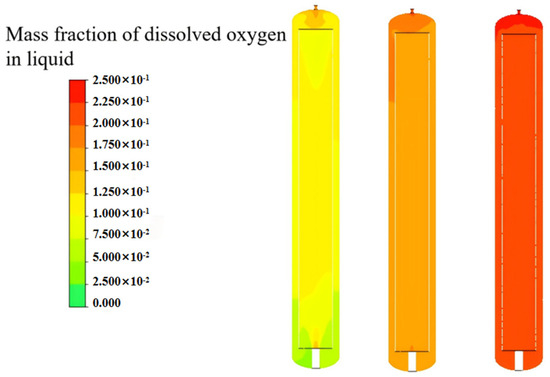
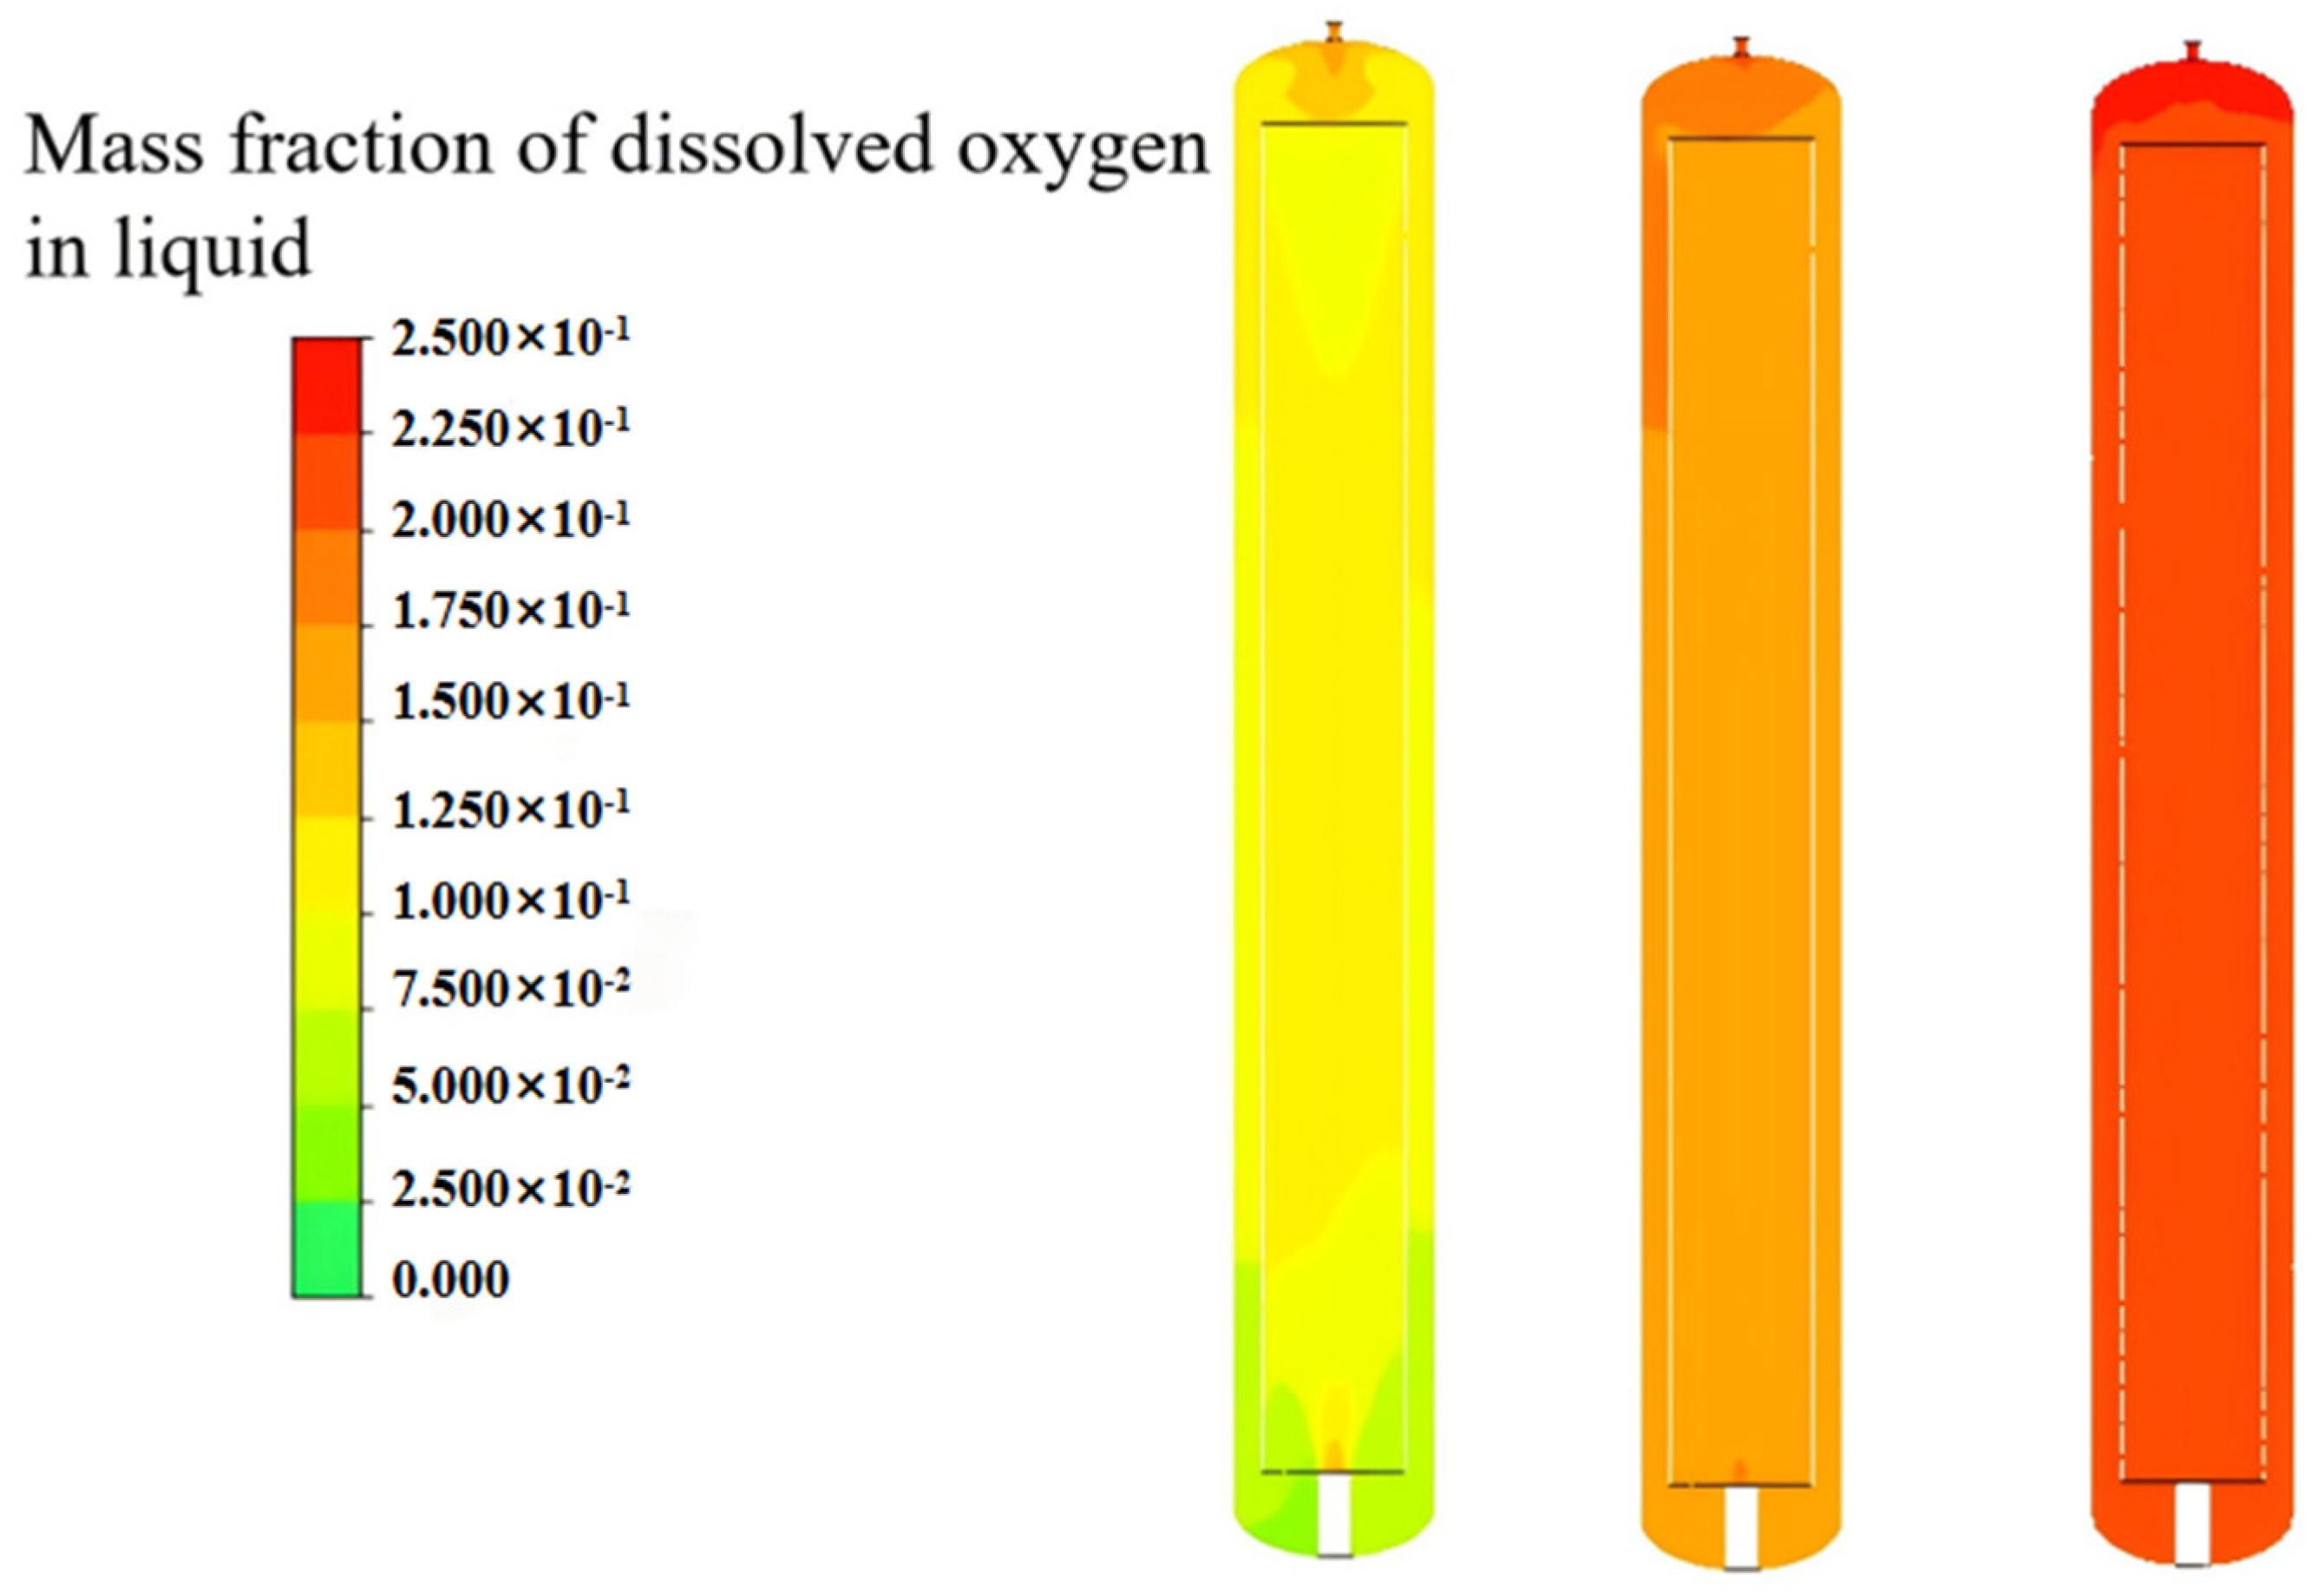
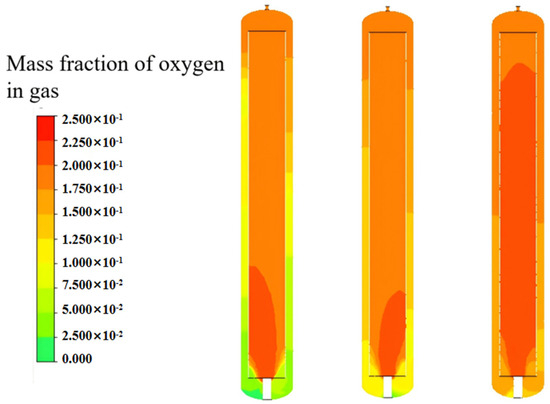
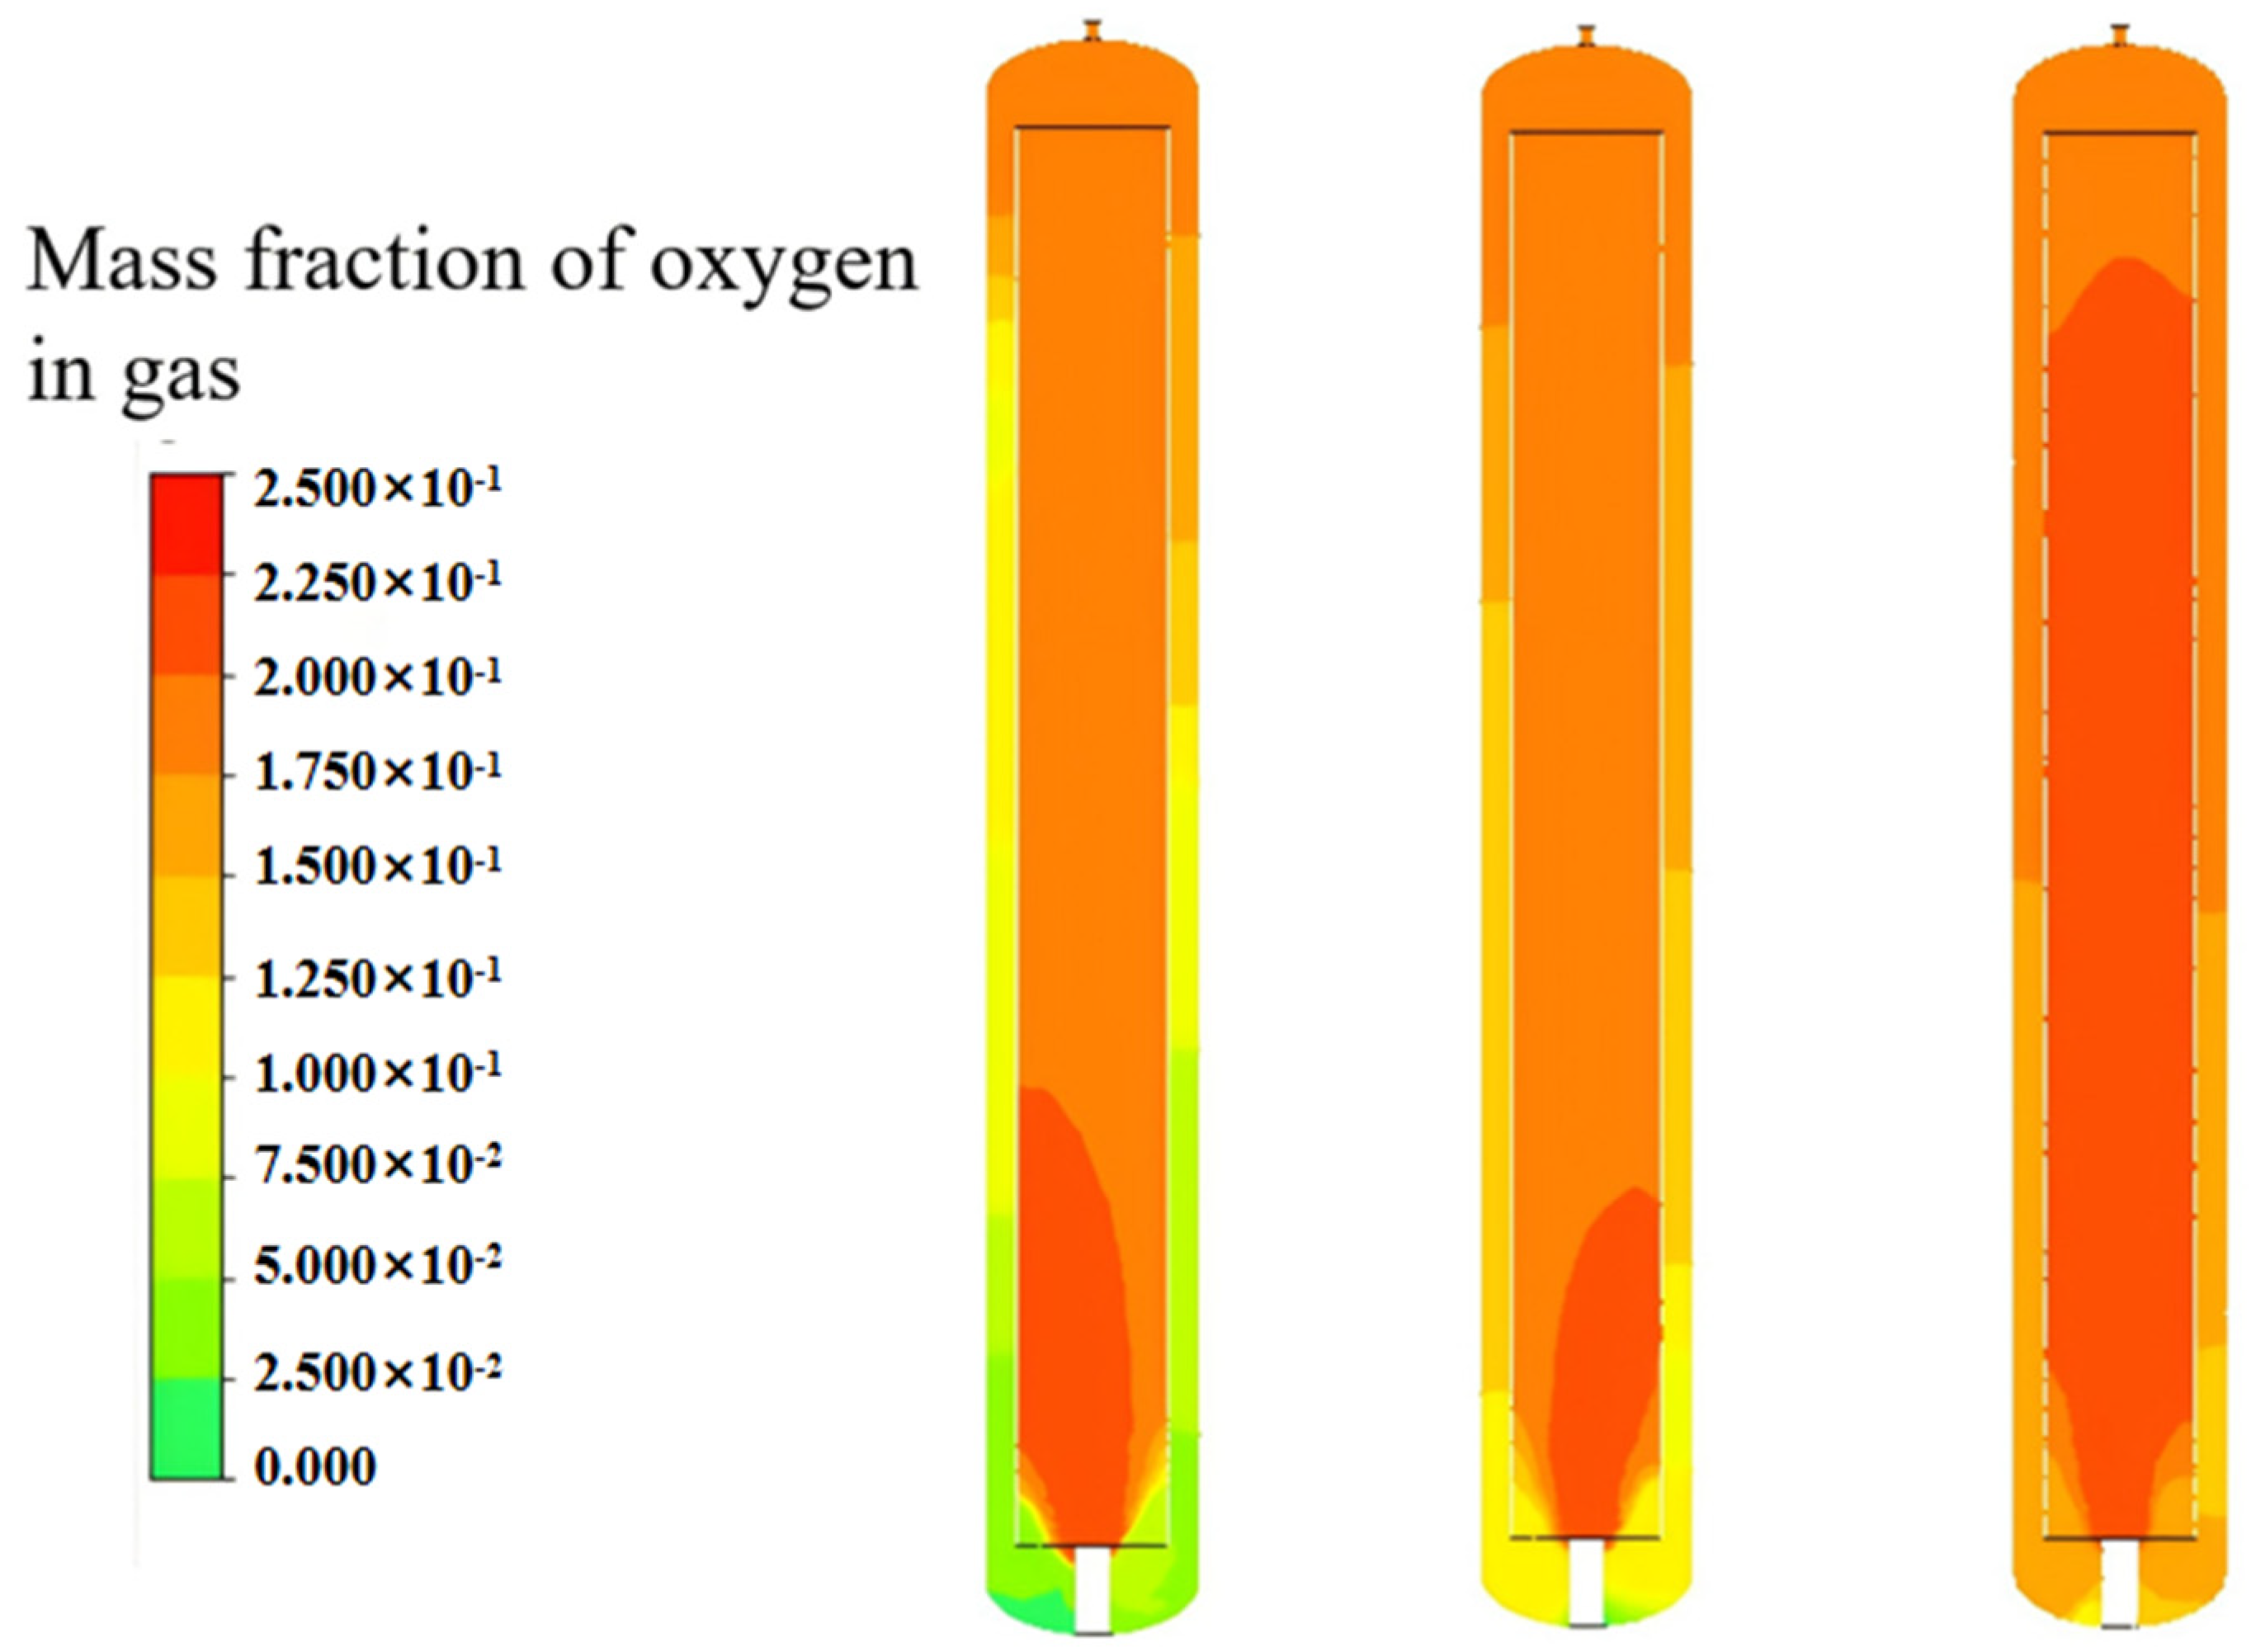
Figure 15 presents contour plots of the mass fraction of dissolved oxygen in the liquid phase. As the superficial gas velocity (Ug) increases, the mass fraction of dissolved oxygen rises progressively, transitioning from an unsaturated state to near saturation. Figure 16, in turn, shows contour plots of the oxygen mass fraction in the gas phase. A distinct feature at Ug = 0.0045 m/s is the lower oxygen mass fraction in the downcomer, suggesting that bubble renewal in this region is relatively slow. Most bubbles remain stagnant in the downcomer, resulting in insufficient oxygen concentration within the bubbles.
Figure 15.
Contours for the mass fraction of dissolved oxygen. From left to right, they represent the superficial gas velocities of 0.0045, 0.0135, and 0.0225 m/s in sequence.
Figure 16.
Contours for the mass fraction of oxygen in gas. From left to right, they represent the superficial gas velocities of 0.0045, 0.0135, and 0.0225 m/s in sequence.
Across all three tested Ug values, the oxygen mass fraction in the exhaust gas at the top outlet remains relatively high, indicating low oxygen consumption by the reaction and inadequate oxygen utilization efficiency. This issue is not inherent to the reactor design but stems from insufficient reaction pressure. Notably, however, the use of lower reaction pressure in this study reduces the energy consumption required for gas supply.
4.3. Reactant Mass Fraction
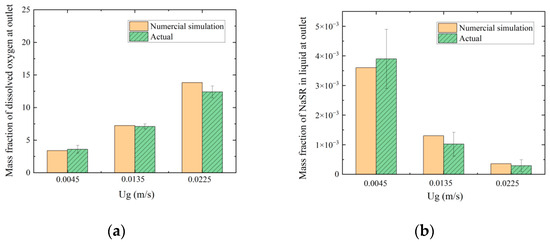
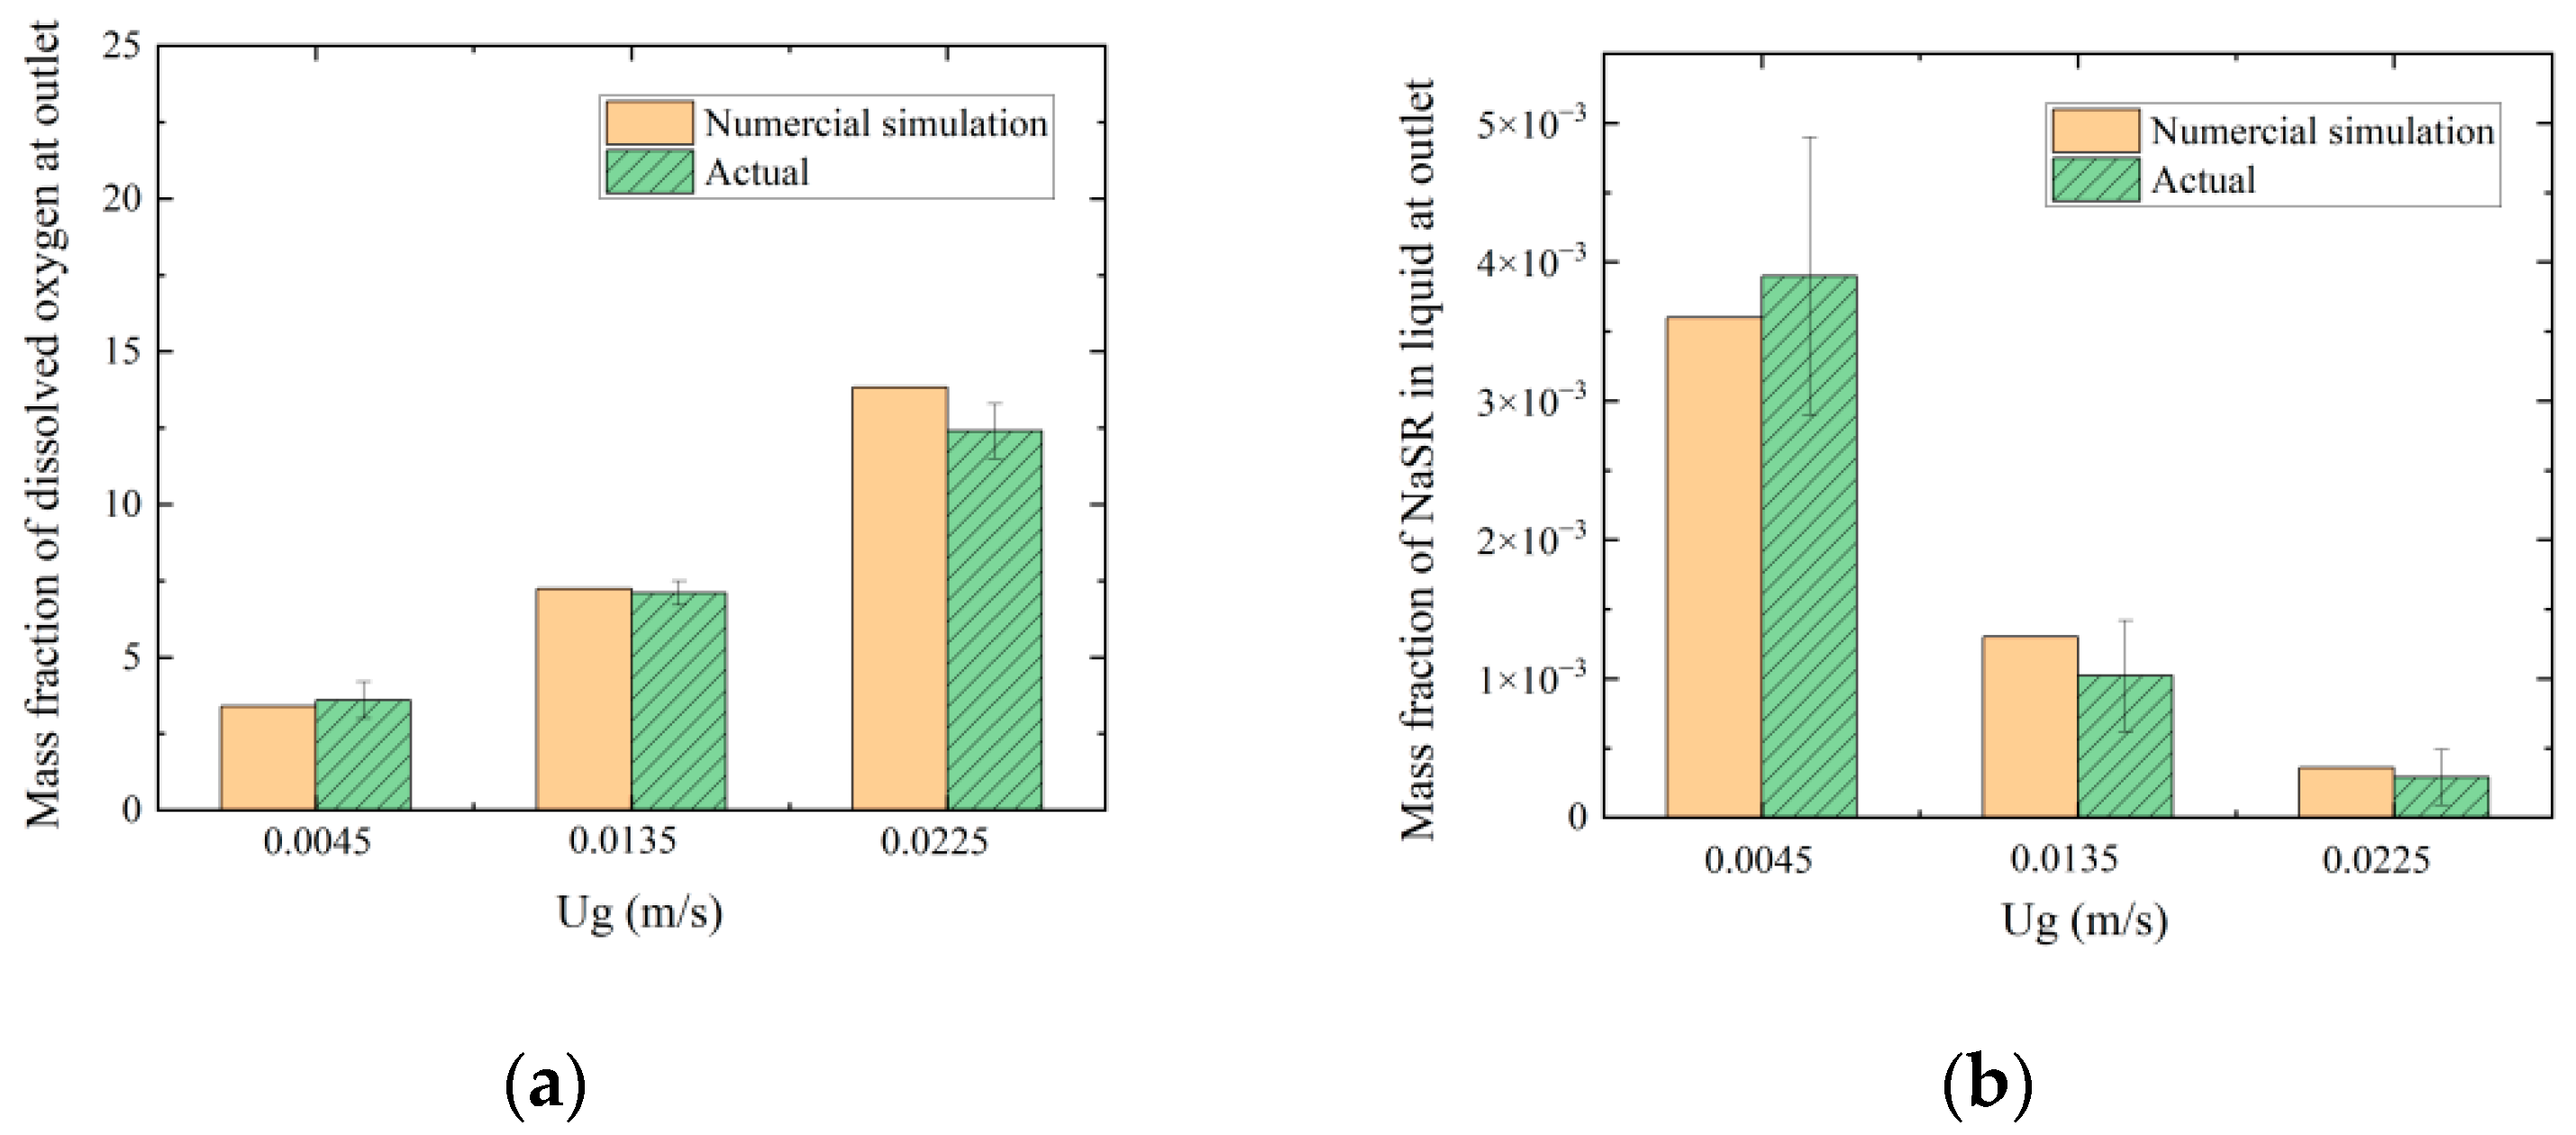
The mass fraction of dissolved oxygen at the outlet of the industrial-scale airlift loop reactor was measured using a fluorescence dissolved oxygen analyzer (Shanghai Nuobo Co., Ltd., Shanghai, China). Similarly, the mass fraction of residual sodium methyl mercaptan (NaSR) in the liquid phase was quantified. Figure 17 presents a comparison between the simulation results and actual industrial operational data. Numerical simulation results are in good agreement with industrial on-site sampling data, confirming the reliability of the numerical simulation approach.
Figure 17.
Comparison between the simulation and the actual industrial operation data, (a) mass fraction of dissolved oxygen at the outlet, (b) mass fraction of NaSR remaining in the liquid at outlet.
The initial mass fraction of NaSR is approximately 5 × 10⁻³. As the superficial gas velocity increases from 0.0045 to 0.0225 m/s, the mass fraction of NaSR at the outlet decreases from 3.6 × 10⁻³ to 3.6 × 10⁻⁴. This significant decrease is attributed to the low oxygen consumption of the reaction, where oxygen is present in excess. Although elevating Ug enhances the volumetric mass transfer coefficient () and dissolved oxygen concentration, its more critical impact lies in altering the hydrodynamic conditions within the reactor, specifically by increasing gas holdup (g) and modifying bubble circulation behavior. A higher Ug likely alters the residence time distribution of the gas (and consequently the NaSR-laden liquid) within the reactor, providing a longer effective contact time. Furthermore, as depicted in Figure 9, an elevated Ug entrains a greater number of bubbles into the downcomer, promoting recirculation and contact between the gas and liquid phases throughout the entire reactor volume, rather than being confined solely to the riser. This creates additional reaction opportunities for NaSR and oxygen. Therefore, the enhancement in oxidation efficiency is primarily attributed to the improvement of hydrodynamic conditions (such as superior mixing and extended residence time), rather than the increase in the oxygen mass transfer coefficient () per se.
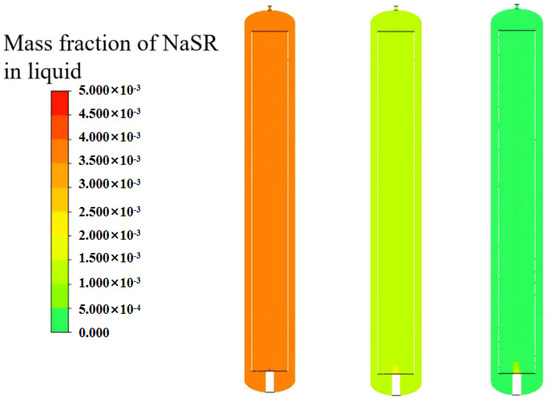
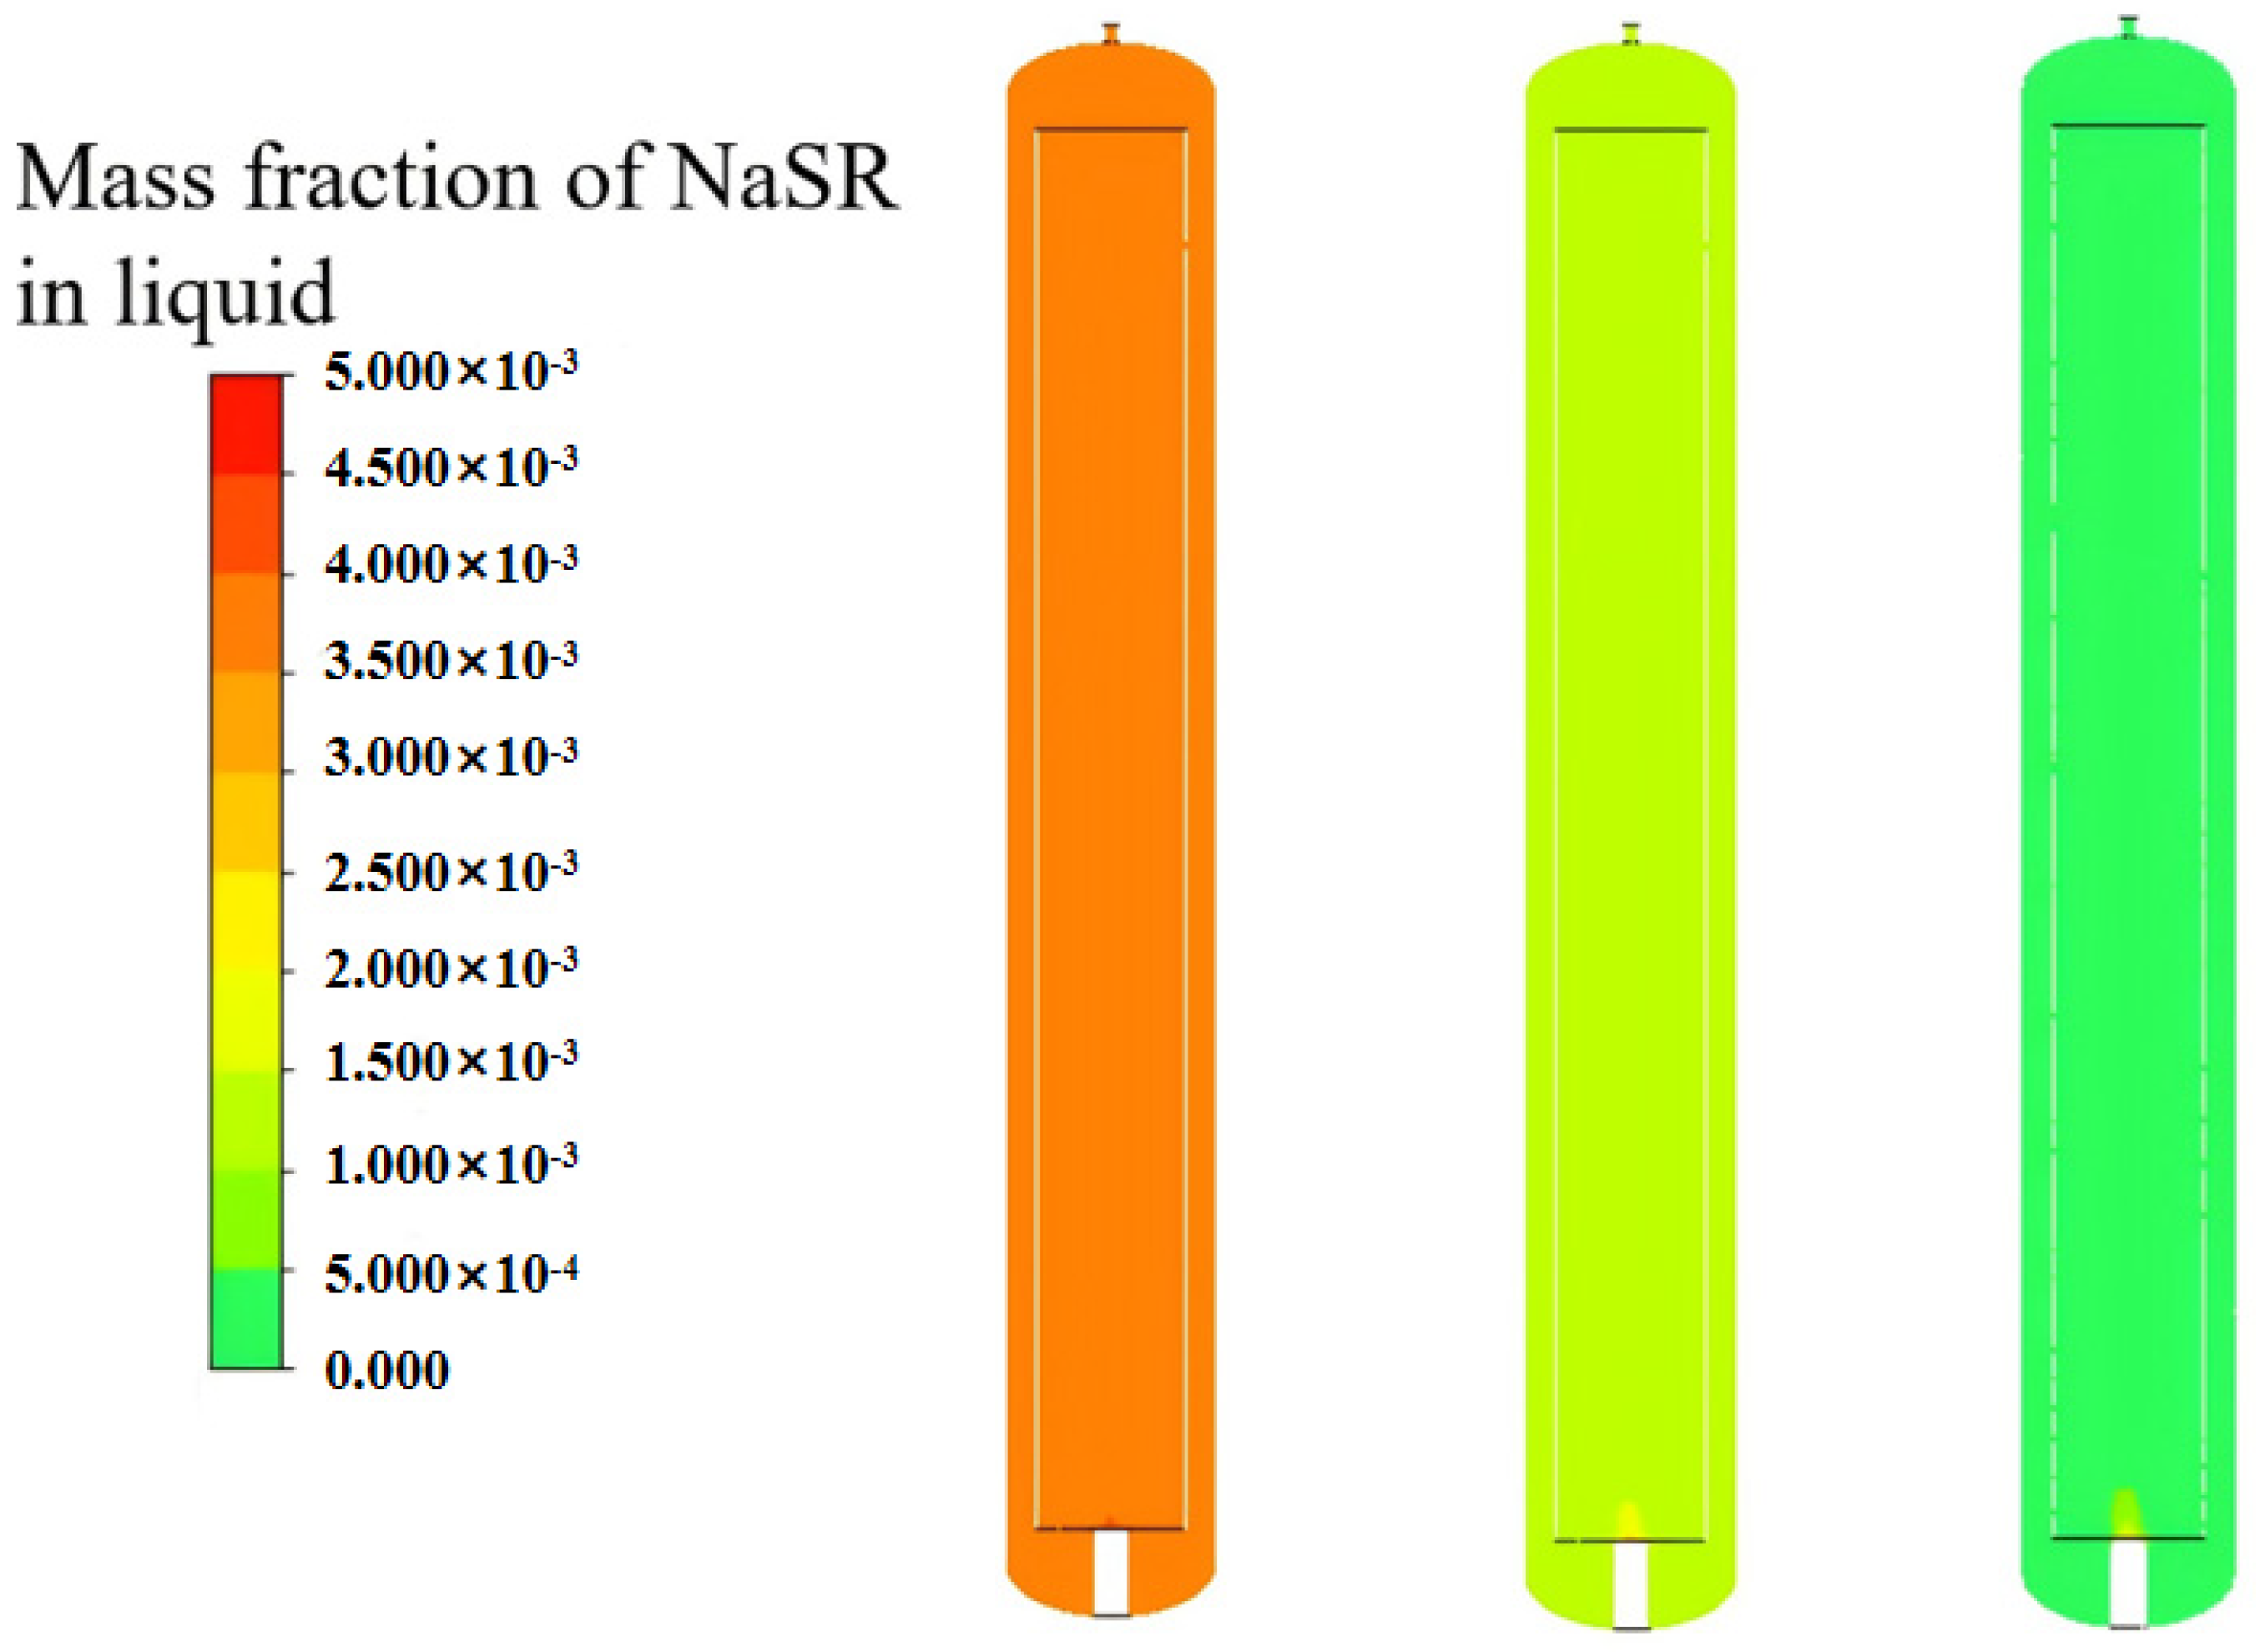
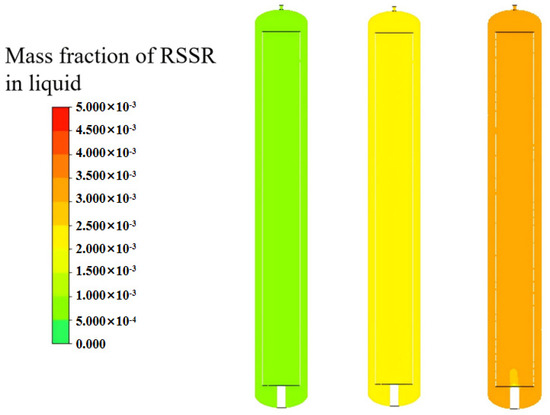
Figure 18 presents contour plots of the NaSR mass fraction, revealing a homogeneous distribution of NaSR within the airlift loop reactor, a result of its excellent mixing performance. A similar uniformity in RSSR distribution is observed in Figure 19. Sufficient liquid turnover multiples enhance the uniformity of substance concentrations.
Figure 18.
Contours for the mass fraction of NaSR. From left to right, they represent the superficial gas velocities of 0.0045, 0.0135, and 0.0225 m/s in sequence.
Figure 19.
Contours for the mass fraction of RSSR. From left to right, they represent the superficial gas velocities of 0.0045, 0.0135, and 0.0225 m/s in sequence.
5. Conclusions
This study systematically investigates the hydrodynamics, oxygen mass transfer, and sodium methyl mercaptan (NaSR) oxidation in a scaled-up airlift loop reactor through a combination of computational fluid dynamics (CFD) simulations and experimental determination of reaction kinetics. The research employs the Euler–Euler approach, population balance model, Higbie’s penetration theory, and Arrhenius-type kinetics to characterize key processes, with findings validated against industrial operational data.
The results reveal that superficial gas velocity (Ug) plays a critical role in regulating reactor performance. Increasing Ug enhances gas holdup, liquid turbulence dissipation, and the volumetric mass transfer coefficient (), with high- regions expanding both vertically and horizontally from the gas inlet to cover larger volumes of the riser, thereby improving the uniformity of oxygen distribution. Notably, at the lowest Ug of 0.0045 m/s, the downcomer exhibits insufficient oxygen mass fraction in the gas phase, attributed to slow bubble renewal and stagnation of most bubbles in this region. Across all tested Ug values, the high oxygen mass fraction in the top outlet exhaust gas indicates limited oxygen consumption by the reaction and low utilization efficiency, a phenomenon linked to insufficient reaction pressure rather than reactor design constraints.
The airlift loop reactor demonstrates excellent mixing performance, with liquid turnover multiples of 83.1, 91.2, and 91 for the three Ug values, ensuring homogeneous distributions of NaSR and its oxidation product RSSR. The outlet mass fraction of NaSR decreases significantly with increasing Ug, indicating improved oxidation efficiency, though this efficiency is found to be independent of oxygen mass transfer. Importantly, numerical simulation results show good agreement with industrial on-site sampling data, confirming the reliability of the simulation model.
Overall, these findings clarify the interconnections between hydrodynamics, oxygen mass transfer, and NaSR oxidation in scaled-up airlift loop reactors, providing critical insights for optimizing operational parameters such as superficial gas velocity and reaction pressure to balance oxidation efficiency and energy consumption. This work contributes to the rational design and performance enhancement of large-scale airlift reactors for thiol oxidation processes.
Supplementary Materials
The following supporting information can be downloaded at: https://www.mdpi.com/article/10.3390/pr14030553/s1, Figure S1: Plots of mass fraction of NaSR and RSSR over iteration steps. (a) for superficial gas velocity of 0.0045, (b) for superficial gas velocity of 0.0135, (c) for superficial gas velocity of 0.0225 m/s, (d) The variable names represented by the two curves; Figure S2: computational diagram; Figure S3: Grid rendering.
Author Contributions
Conceptualization, D.L.; Methodology, D.L. and J.B.; Validation, X.L.; Formal analysis, S.Z., Y.L. and X.X.; Investigation, X.X.; Resources, H.L. and X.X.; Data curation, H.L., Z.S. and X.X.; Writing—original draft, S.Z.; Visualization, S.Z., P.R. and X.X. All authors have read and agreed to the published version of the manuscript.
Funding
This research was funded by National Natural Science Foundation of China, grant numbers 21908057 and 52200053.
Data Availability Statement
The data presented in this study are available on request from the corresponding author.
Conflicts of Interest
The authors declare no conflict of interest.
Nomenclature
| Specific surface area (interfacial area per unit volume) (m−1) | |
| Bubble breakage rate (s−1) | |
| Drag coefficient | |
| or | Saturated dissolved oxygen concentration (mol·m−3) |
| Surface area increase coefficient (in breakage model) | |
| Constant in the mass transfer coefficient correlation | |
| Concentration of sodium methyl mercaptan (NaSR) (mol·m−3) | |
| Concentration of dissolved oxygen (mol·m−3) | |
| Diffusion coefficient (m2·s−1) | |
| or | Bubble diameter (m) |
| Drag force on liquid phase (N·m−3) | |
| Interfacial force on phase q (N·m−3) | |
| Virtual mass force on liquid phase (N·m−3) | |
| Gravitational acceleration (m·s−1) | |
| Generation of turbulent kinetic energy due to mean velocity gradient (kg·(m·s3)−1) | |
| Generation of turbulent kinetic energy due to buoyancy (kg·(m·s3)−1) | |
| Empirical constant in oxygen solubility correlation | |
| Henry’s constant (Pa·m3·mol−1) | |
| Turbulent kinetic energy (m2·s−2) | |
| Liquid-side mass transfer coefficient (m·s−1) | |
| Volumetric mass transfer coefficient (s−1) | |
| Molar mass of sodium methyl mercaptan (kg·mol−1) | |
| Molar mass of oxygen (kg·mol−1) | |
| Bubble size distribution function (m−4) | |
| Pressure (Pa) | |
| Partial pressure of oxygen (Pa) | |
| Coalescence probability of bubbles | |
| Reynolds number | |
| Universal gas constant (J·(mol·K)−1) | |
| Reaction rate of sodium methyl mercaptan (NaSR) (mol·(m3·s)−1) | |
| Reaction rate of oxygen (mol·(m3·s)−1) | |
| Source term in species transport equation (kg·(m3·s)−1) | |
| Time (s) | |
| Bubble contact time (s) | |
| Film drainage time (s) | |
| Temperature (K or °C) | |
| Superficial gas velocity (m·s−1) | |
| Velocity vector (m·s−1) | |
| Velocity of phase q (m·s−1) | |
| Weber number for coalescing bubbles | |
| Effect of fluctuating dilatation in compressible turbulence on dissipation rate (kg·(m·s3)−1) | |
| Empirical constant in oxygen solubility correlation | |
| Volume fraction of phase q | |
| Daughter size distribution function after bubble breakage | |
| Interfacial mass transfer source term (kg·(m·s3)−1) | |
| Turbulent energy dissipation rate (m2·s−3) | |
| Gas holdup (gas volume fraction) | |
| Maximum gas holdup (limit, value = 0.8) | |
| Minimum gas holdup (limit, value = 10−7) | |
| Empirical constant in oxygen solubility correlation | |
| Dynamic viscosity (Pa·s) | |
| Turbulent (eddy) viscosity (Pa·s) | |
| Kinematic viscosity (m2·s−1) | |
| Density (kg·m−3) | |
| Density of phase q (kg·m−3) | |
| Surface tension (N·m−1) | |
| Turbulent Prandtl number for k | |
| Turbulent Prandtl number for ε | |
| Laminar stress tensor (Pa) | |
| Turbulent stress tensor (Reynolds stress) (Pa) | |
| Correction factor for oxygen solubility in electrolyte solutions | |
| Size ratio of coalescing bubbles (di/dj) | |
| Collision frequency of bubbles (s−1) | |
| Ratio of vortex size to particle size (in breakage model) |
References
- Scott, D.W.; Myers, D.L.; Hill, H.; Omadoko, O. Sodium cobalt(II) tetrasulfophthalocyanine and catalytic oxidation of ethanethiol. Fuel 2019, 242, 573–579. [Google Scholar] [CrossRef] [Scilit]
- Bricker, J.C.; Laricchia, L. Advances in Merox™ Process and Catalysis for Thiol Oxidation. Top. Catal. 2012, 55, 1315–1323. [Google Scholar] [CrossRef] [Scilit]
- Gecim, G.; Ouyang, Y.; Roy, S.; Heynderickx, G.J.; Van Geem, K.M. Process Intensification of CO2 Desorption. Ind. Eng. Chem. Res. 2022, 62, 19177–19196. [Google Scholar] [CrossRef] [Scilit]
- Sathish, A.; Sharma, A.; Gable, P.; Skiadas, I.; Brown, R.; Wen, Z. A novel bulk-gas-to-atomized-liquid reactor for enhanced mass transfer efficiency and its application to syngas fermentation. Chem. Eng. J. 2019, 370, 60–70. [Google Scholar] [CrossRef] [Scilit]
- Li, W.-L.; Wang, J.-H.; Lu, Y.-C.; Shao, L.; Chu, G.-W.; Xiang, Y. CFD analysis of CO2 absorption in a microporous tube-in-tube microchannel reactor with a novel gas-liquid mass transfer model. Int. J. Heat Mass Transf. 2020, 150, 119389. [Google Scholar] [CrossRef] [Scilit]
- Wu, Y.; Chen, H.; Song, X. Microbubble Dispersion Process Intensification Using Novel Internal Baffles. Ind. Eng. Chem. Res. 2022, 61, 14284–14297. [Google Scholar] [CrossRef] [Scilit]
- Wang, Y.; Shen, X.; Zhang, H.; Wang, T. Marangoni effect on hydrodynamics and mass transfer behavior in an internal loop airlift reactor under elevated pressure. AIChE J. 2023, 70, e18291. [Google Scholar] [CrossRef] [Scilit]
- Moraveji, M.K.; Sajjadi, B.; Davarnejad, R. Gas-Liquid Hydrodynamics and Mass Transfer in Aqueous Alcohol Solutions in a Split-Cylinder Airlift Reactor. Chem. Eng. Technol. 2011, 34, 465–474. [Google Scholar] [CrossRef] [Scilit]
- Berouaken, A.; Rihani, R.; Marra, F.S. Study of sparger design effects on the hydrodynamic and mass transfer characteristics of a D-shape hybrid airlift reactor. Chem. Eng. Res. Des. 2023, 191, 66–82. [Google Scholar] [CrossRef] [Scilit]
- Al Taweel, A.M.; Idhbeaa, A.O.; Ghanem, A. Effect of electrolytes on interphase mass transfer in microbubble-sparged airlift reactors. Chem. Eng. Sci. 2013, 100, 474–485. [Google Scholar] [CrossRef] [Scilit]
- Kong, W.; Xie, S.; Song, T.; Dong, Z.; Zhong, X.; Liang, L.; Li, W.; Li, S. Mass transfer—Reaction kinetics of coupled computational fluid dynamics (CFD) for CO2 capture using a novel ionic liquid deep eutectic solution. Sep. Purif. Technol. 2025, 366, 132828. [Google Scholar] [CrossRef] [Scilit]
- Zhang, M.; Ye, X.; Bao, F.; Geng, Z.; Dong, H. Flow and mass transfer performance in the ejector and reaction kettle of a loop reactor: A CFD-PBM Analysis. Chem. Eng. Process.-Process Intensif. 2025, 216, 110378. [Google Scholar] [CrossRef] [Scilit]
- Humayun, M.S.; Ali, M.; Qureshi, M.U.; Khan Niazi, M.B.; Changqi, Y.; Zongning, S.; Feng, G.H.; Zhou, Y. CFD analysis of iodine mass transfer coupled with a chemical reaction in a filtered containment venting system. Prog. Nucl. Energy 2024, 168, 105012. [Google Scholar] [CrossRef] [Scilit]
- Ziegenhein, T.; Rzehak, R.; Ma, T.; Lucas, D. Towards a unified approach for modelling uniform and non-uniform bubbly flows. Can. J. Chem. Eng. 2016, 95, 170–179. [Google Scholar] [CrossRef] [Scilit]
- Ziegenhein, T.; Rzehak, R.; Lucas, D. Transient simulation for large scale flow in bubble columns. Chem. Eng. Sci. 2015, 122, 1–13. [Google Scholar] [CrossRef] [Scilit]
- Guan, X.; Xu, Q.; Yang, N.; Nigam, K.D.P. Hydrodynamics in bubble columns with helically-finned tube Internals: Experiments and CFD-PBM simulation. Chem. Eng. Sci. 2021, 240, 116674. [Google Scholar] [CrossRef] [Scilit]
- Schiller, L.; Naumann, A. A drag coefficient correlation. Z. Des Ver. Dtsch. Ing. 1935, 77, 318–320. [Google Scholar]
- Zhang, X.B.; Wang, X.Q.; Zeng, Q.; Ruan, S.X.; Luo, Z.H. A theoretical model for coalescence efficiency in collisions induced by the wake entrainment of a spherical-cap bubble. AIChE J. 2025, 71, E70056. [Google Scholar] [CrossRef] [Scilit]
- Han, L.; Luo, H.; Liu, Y.; You, K.; Liu, P. A multi-scale theoretical model for gas-Liquid interface mass transfer based on the wide spectrum eddy contact concept. AIChE J. 2011, 57, 886–896. [Google Scholar] [CrossRef] [Scilit]
- Tromans, D. Modeling Oxygen Solubility in Water and Electrolyte Solutions. Ind. Eng. Chem. Res. 2000, 39, 805–812. [Google Scholar] [CrossRef] [Scilit]
- Hong, H.-S.; Cai, Z.-J.; Li, J.-Q.; Shi, D.-S.; Wan, W.-Q.; Li, L. Simulation of gas-inducing reactor couples gas–liquid mass transfer and biochemical reaction. Biochem. Eng. J. 2014, 91, 1–9. [Google Scholar] [CrossRef] [Scilit]
- Harkness, A.C.; Murray, F.E. Oxidation of methyl mercaptan with molecular oxygen in aqueous solution. Atmos. Environ. Pergamon Press 1970, 4, 417–424. [Google Scholar] [CrossRef] [Scilit]

Disclaimer/Publisher’s Note: The statements, opinions and data contained in all publications are solely those of the individual author(s) and contributor(s) and not of MDPI and/or the editor(s). MDPI and/or the editor(s) disclaim responsibility for any injury to people or property resulting from any ideas, methods, instructions or products referred to in the content. |
© 2026 by the authors. Licensee MDPI, Basel, Switzerland. This article is an open access article distributed under the terms and conditions of the Creative Commons Attribution (CC BY) license.