


Abstract
The main substrate used in the pyrolysis process was Miscanthus giganteus, an energy plant. The second substrates used were municipal sewage sludge, municipal sewage sludge with lime, industrial sewage sludge, and spent mushroom substrate. The waste biomass contained ash ranging from 19 to 42%. In this study, the waste biomass was added to the Miscanthus giganteus in proportions of 0.25, 0.50, and 0.75. The study was carried out in a thermobalance at temperatures ranging from 30 to 600 °C in an inert atmosphere. The heating rate was set at 5, 10, and 20 °C/min. The kinetics of co-pyrolysis were determined using the Flynn–Ozawa–Wall method known as a model-free isoconversional technique. The results of the study indicate that as the conversion degree increases, the activation energy changes, suggesting a multi-step pyrolysis process. Adding waste biomass to Miscanthus giganteus increased the activation energy of the pyrolysis process in all cases. According to the activation energy, the greatest synergistic effect was achieved by adding municipal sewage sludge to Miscanthus giganteus.
1. Introduction
The depletion of natural resources causes an increasing interest in waste biomass. Compared to biochemical processes, thermochemical processes are characterized by a higher degree of biomass conversion. The most desirable thermochemical process is the pyrolysis process, whose products can be easily stored and transported [1]. In recent years, the co-pyrolysis of two substrates has become one of the most popular thermochemical conversion processes. Due to the different compositions of the feedstocks, co-pyrolysis can improve both the quality and quantity of the resulting products [2].
The pyrolysis substrates used were municipal sewage sludge without lime (SSM), municipal sewage sludge with lime (SSML), industrial sewage sludge (SSI), and spent mushroom substrate (SMS). The waste biomass had an ash content ranging from 19 to 42%. The various mineral components found in different types of waste biomass can catalyse the pyrolysis process. To reduce the ash content of the pyrolysis substrates, the waste biomass was mixed with Miscanthus giganteus, an energy plant. The low ash content of Miscanthus giganteus resulted in a higher concentration of organic compounds in the pyrolysis products, thereby increasing their energy density.
In 2022, Poland produced 580 thousand tons of municipal sewage sludge [3]. Sewage sludge contains many different organic compounds, microorganisms, minerals, and heavy metals. Without proper treatment, sewage sludge can cause environmental and health problems [1]. From a biological point of view thermochemical processes, especially pyrolysis, eliminate the harmful properties of sewage sludge and enable resource recovery [4]. Poland produces approximately 1.2 million tons of SMS per year [5]. Poland is the largest producer of mushrooms in the European Union. Local farmers mainly use this type of waste as fertilizer. The main substrate (M) consists of hemicellulose, cellulose, lignin, and a small amount of ash. This energy crop’s biomass yield can reach approximately 20 tons per hectare on a dry matter basis [6]. This energy crop has great potential as a feedstock for thermochemical conversion processes [7].
In addition to hemicellulose, cellulose, and lignin, waste biomass contains proteins, lipids and ash. These components can interact with each other, which may increase the rate of the pyrolysis process. In contrast to TG or DTG curve analysis, kinetic analysis provides information about changes in pyrolysis reactivity as a function of conversion degree. Many methods for investigating the kinetics of the pyrolysis process can be found in the literature. Accurately describing the pyrolysis process of heterogeneous feedstocks containing numerous components is highly complex. This complexity necessitates the use of simplifying assumptions in the kinetic description of the pyrolysis process. One of the commonly used model-free (isoconversional) methods for kinetic analysis is the Flynn–Wall–Ozawa (FWO) method and Kissinger–Akahira–Sunose (KAS) method [7,8,9]. The study conducted by Liu et al. [8] demonstrated that the FWO method described the co-pyrolysis kinetics more accurately than the KAS method. Also, Alvarado Flores et al. [10] found during their investigation of different isoconversional models and different kinds of substrates that the FWO method gives the best results.
This study focuses on the influence of waste biomass on the co-pyrolysis process with the main feedstock; therefore, only kinetic data obtained using the FWO method are presented.
The novelty of this work is the co-pyrolysis of M with SMS and different types of sewage sludge. There are only few reports in the literature on the co-pyrolysis of M with others substrates. For example, Tian et al. [11] investigated the co-pyrolysis of Miscanthus and different types of coals, Pinto et al. [12] studied the co-pyrolysis of Miscanthus and polyethylene, whereas Jayaraman and Gökalp [13] investigated the pyrolysis Miscanthus and sewage sludge. Of all the waste biomass feedstocks, sewage sludge has been the most frequently studied substrate in co-pyrolysis research. Previous studies have investigated the co-pyrolysis of sewage sludge with bagasse [14,15], corn stalk [8], cotton stalk [16], food waste digestate [17], hazelnut shells [9], microalgae [18], rice straw [19,20], rice husk [21,22], sawdust [23,24], wheat straw [25], and willow [26]. Much less attention has been paid to the co-pyrolysis of SMS with other feedstocks. Studies on the co-pyrolysis of spent mushroom substrate (SMS) with sawdust or wheat straw [27] and Huadian oil shale [28] have been reported in the literature to date. Table 1 presents more details about the co-pyrolysis of various feedstocks. The literature contains information about the pyrolysis of the pure substrate investigated in this study. However, there is no information on the co-pyrolysis of Miscanthus and sewage sludge using a thermobalance to identify kinetics, or on a large scale to determine and characterize product yields. Furthermore, comparing the kinetics of the co-pyrolysis for various substrates is challenging because the authors used different methods to identify them. The activation energies presented in Table 1 range widely. To enable better comparisons, the pyrolysis processes of various biomasses should be characterized under the same conditions and using the same kinetic description method.
Table 1.
Co-pyrolysis of different biomass.
The study aimed to carry out co-pyrolysis of Miscanthus giganteus with waste biomass in different proportions. The activation energy and pre-exponential factor were determined using the model-free isoconversional FWO method. The Arrhenius equation was used to calculate the reaction rate constant and evaluate the influence of adding waste biomass to Miscanthus giganteus on the pyrolysis rate.
2. Materials and Methods
2.1. Substrate
In this study, the main substrate used was an energy crop—Miscanthus giganteus (M). The secondary substrates were: spent mushroom substrate (SMS), the industrial sewage sludge (SSI), municipal sewage sludge without liming (SSM) and the municipal sewage sludge limed (SSML). The main substrate (M) was collected from the Institute of Soil Science and Plant Cultivation, State Research Institute in Puławy, Poland. The secondary substrate SMS was collected from Markiewicz Cultivation Plant in Dobron, Poland, after the sterilization of the hall in which the mushrooms were harvested. The moisture content of SMS was 65%. The SSI, with a moisture content of 75%, was collected from the company Grupa Azoty Zaklady Azotowe “PULAWY” S.A., Pulawy, Poland. SSM and SSML were obtained from Wastewater Treatment Plant Prosna in Kuchary near Kalisz, Poland. The moisture content of SSM and SSML was 86.1 and 75.3%, respectively. Representativeness of the samples was achieved by collecting a total of 10 kg of the substrate. The substrate, as received, was first dried at 105 °C to constant weight and then ground using a Pulverisette 15 mill (Fritsch, Idar-Oberstein, Germany) equipped with a 0.25 mm sieve. For pyrolysis, samples were prepared by mixing the secondary substrates (SMS, SSI, SSM and SSML) with the main substrate (M) at mass ratios (w) of 0.25, 0.50, and 0.75. For a mass ratio of 0.25, the mixture consists of 25 g of the secondary substrate and 75 g of M. A representative sample was obtained by thoroughly mixing 100 g of the substrates to ensure homogeneity.
2.2. Experimental
The kinetics of pyrolysis was investigated using a TGA/SDTA 851e LF thermobalance from Mettler Toledo (Zürich, Switzerland). The sample used in the experiment weighed 10.0 ± 0.1 mg and was placed in an aluminum crucible (150 µL) without a lid. The heating rate was 5, 10, or 20 °C/min within the range of 30 to 600 °C. The flow rate of the argon (purity 99.999%) was 100 mL/min. Each experiment was carried out in duplicate to ensure reproducibility, and the results were corrected using data from the blank experiment. The error of mass loss during measurement in the thermobalance was less than 2.0%.
2.3. Analytical Methods
Proximate analysis (moisture, volatile matter, fixed carbon, and ash) was carried out using a Mettler Toledo TGA/SDTA 851e LF thermobalance, in accordance with ASTM E1131 [29]. The ultimate analysis (C, H, N content) was performed with an elemental analyzer NA 2500 (CE Instruments, Hindley Green, UK) in accordance with PN-EN ISO 16948:2015 [30]. The calculation of pyrolysis kinetics was performed using Kinetics software (Netzsch, Selb, Germany). The mineral content of the ash (Ca, K, Mg, P) and heavy metals were detected using Inductively Coupled Plasma—Atomic Emission Spectroscopy (ICP-AES) (Optima 3200 RL, Perkin Elmer, Waltham, MA, USA) according to standard PN-EN ISO 11885:2009 [31]. The statistical calculation was performed using Microsoft Excel software (Redmond, WA, USA). The p-value was calculated using the t-test function.
3. Results and Discussions
3.1. Substrate Characterisation
The substrate was characterized by performing proximate and ultimate analyses of the feedstocks (Table 2). The main substrate (M) contains the highest amounts of volatile matter and fixed carbon compared to the other substrates. The ash content in M was the lowest, amounting to 3.4%. The highest ash content (approximately 41%) was observed among the secondary substrates in SSI and SSML. The ultimate analysis revealed that M contained the highest amounts of C and H, while M was characterized by the lowest amounts of N and O. Cortés and Bridgwater [7] reported a similar elemental composition of Miscanthus giganteus. The highest nitrogen content (6.9%) was observed in substrate SSM, whereas the highest oxygen content (71.6%) was found in sample SSI. In the study conducted by Zhao et al. [9], municipal sewage sludge contained similar amount of C, H, N and O, but lower content of volatile matter and fixed carbon. The concentration of sulphur in the sample was below the detection limit of the analyzer. Among the secondary substrates, SSM contained the lowest Ca content (1.90%), whereas SSI exhibited the highest Ca content (18.8%). The lowest contents of K (0.24%) and P (0.26%) were observed in SSI, whereas the highest Mg content (>0.5%) was found in SMS and SSI. In Table 2, the content of heavy metals in sewage sludges is also presented. In all cases, the amount of heavy metals was below the limit determined in Polish law.
Table 2.
Proximate and ultimate analysis of substrates.
3.2. TG and DTG Curves During Pyrolysis Process
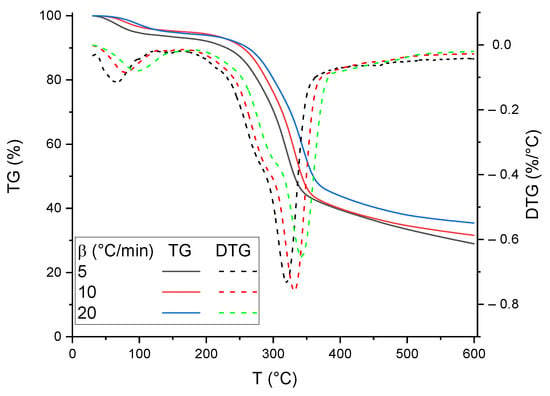
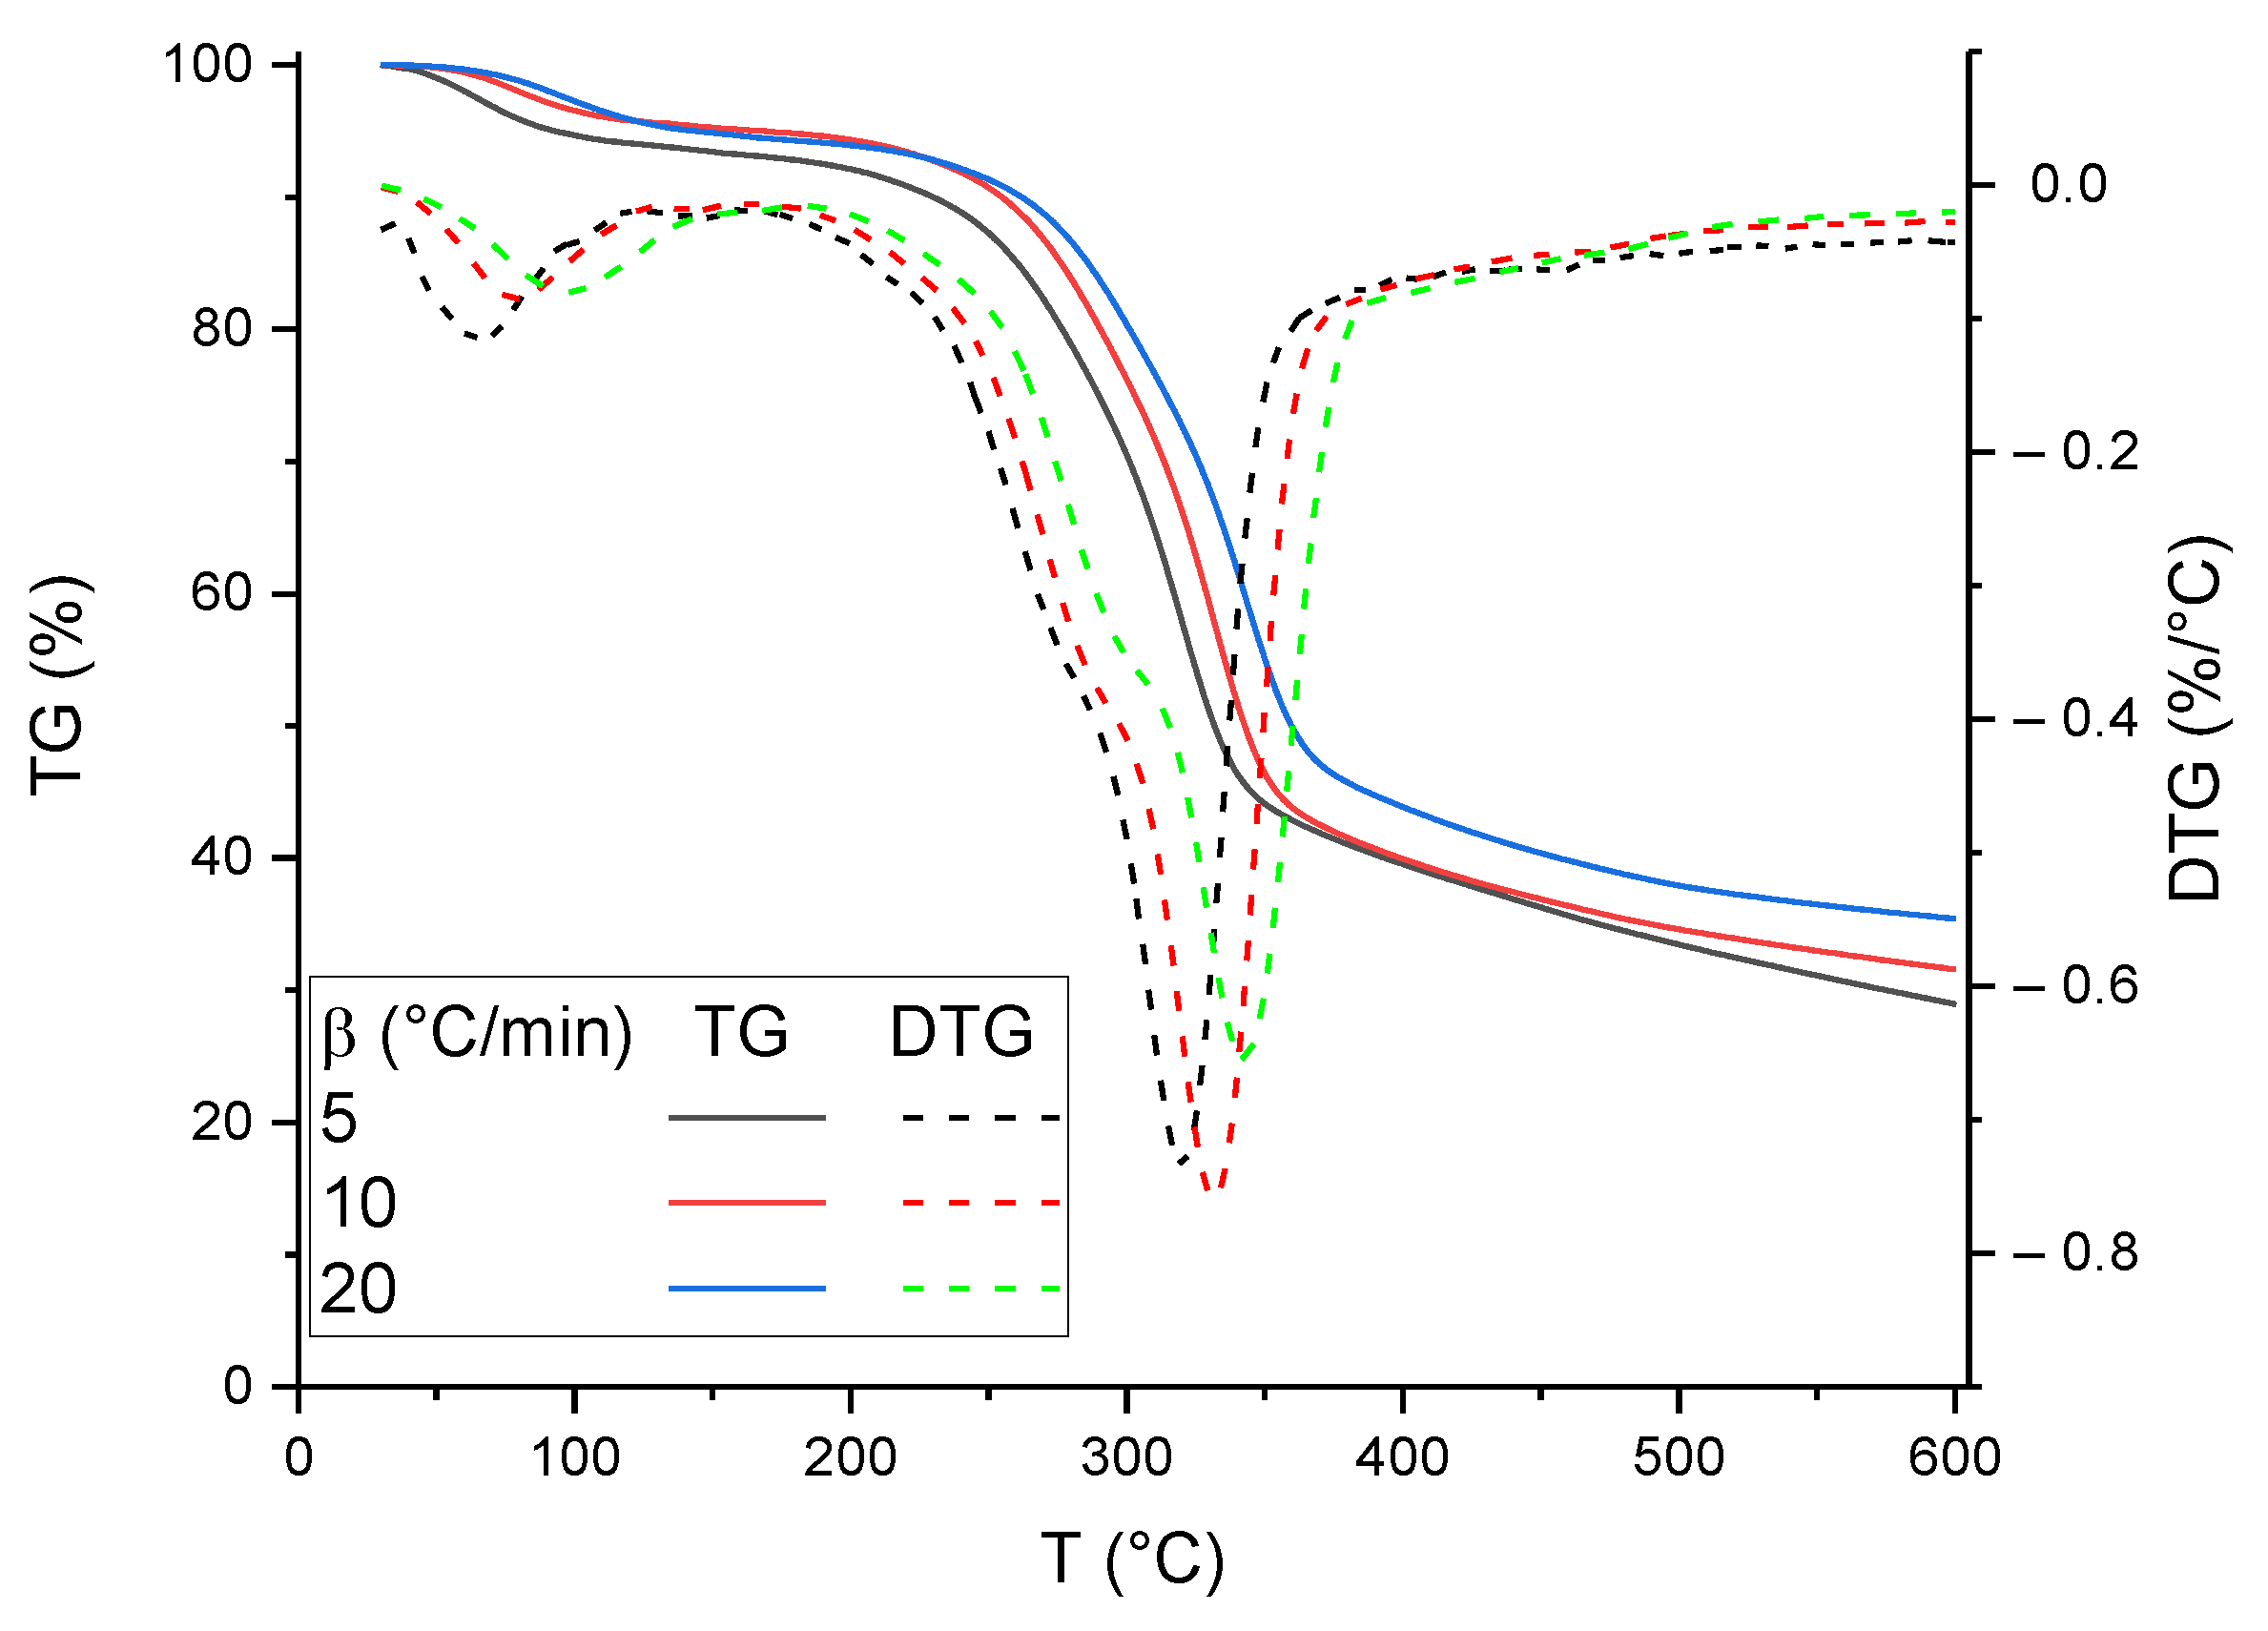
Figure 1 shows the impact of heating rate on TG and DTG curves. An increased heating rate caused the maximum decomposition rate to occur at a higher temperature. This was mainly due to the fact that the sample with the lower heating rate was in the furnace longer. Similar behaviour of the heating rate on the decomposition rate was observed by Vikraman et al. [32]. A lower heating rate decreased char yield production.
Figure 1.
TG and DTG curves during the co-pyrolysis of SMS and M at a ratio of 0.25.
The influence of the secondary substrate on the co-pyrolysis process was described using heating at a rate of 10 °C/min. Based on the TG and DTG curves, two stages were observed. The first stage, occurring in the temperature range of 30–200 °C, was associated with water removal from the samples. The second stage, which occurred in the temperature range from 200 to 600 °C, was attributed to the pyrolysis process.
The theoretical TG curve was calculated using Equation (1).
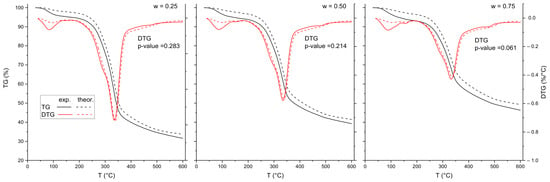
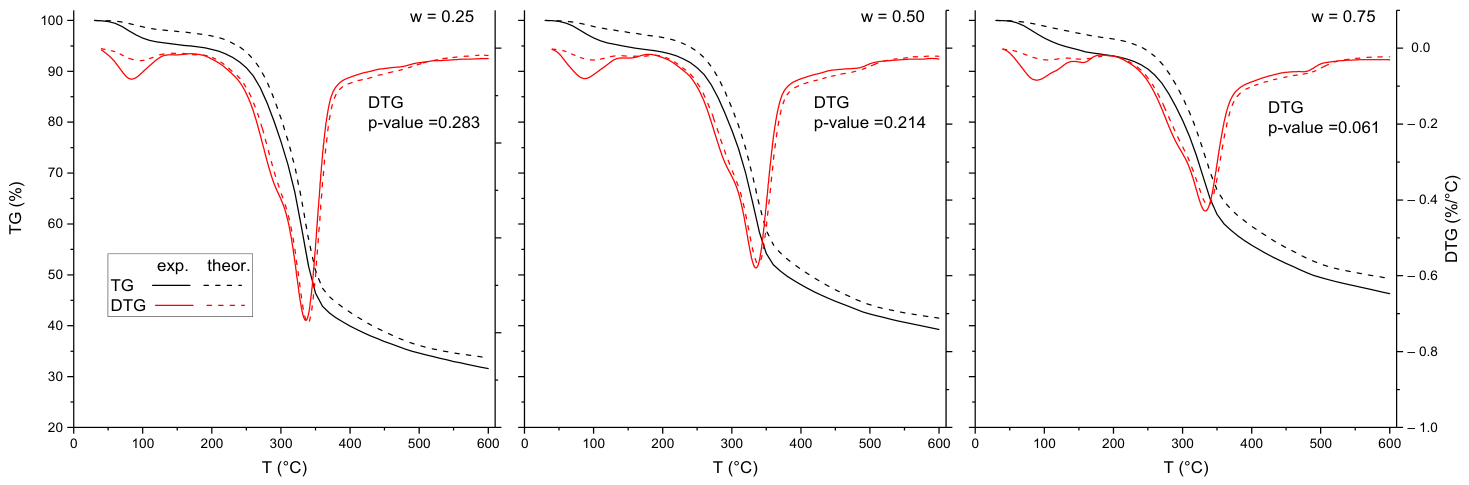
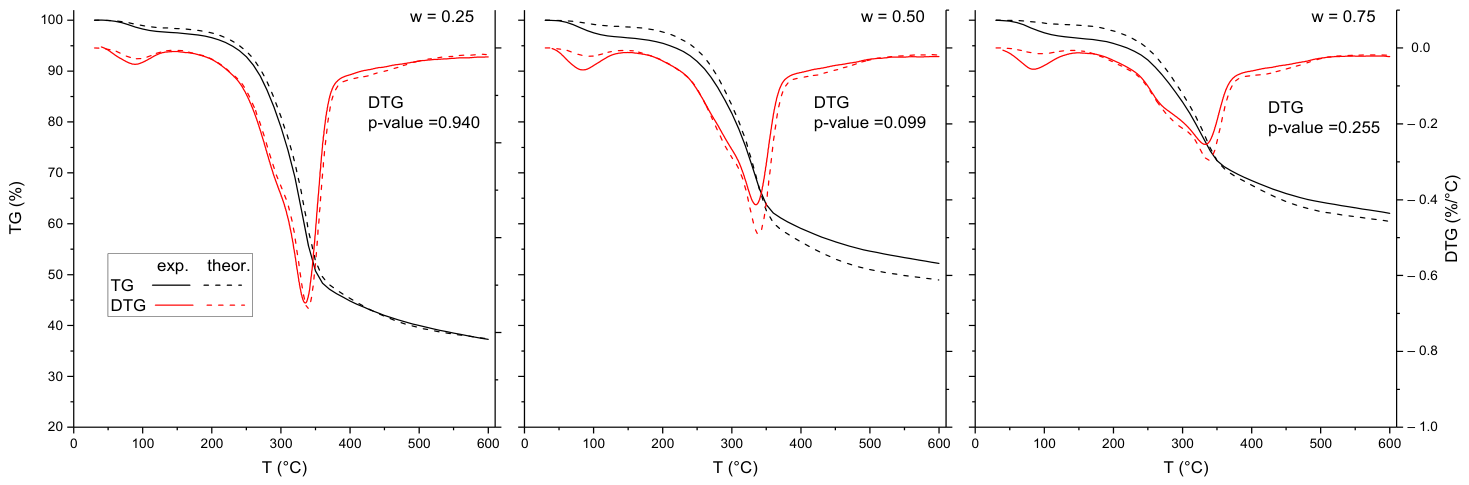
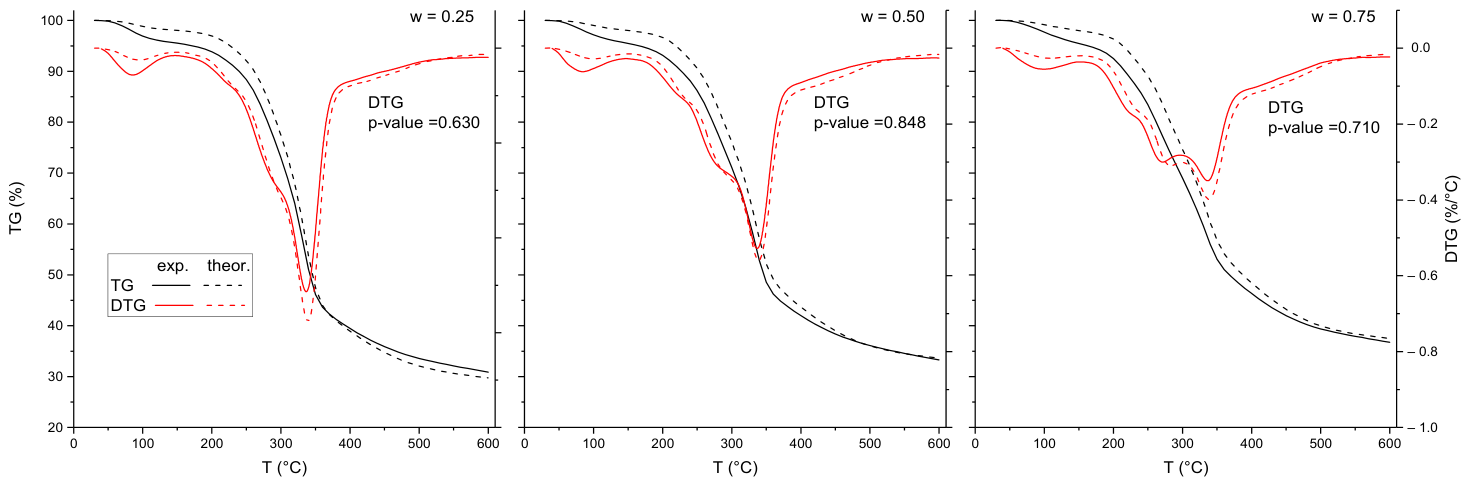
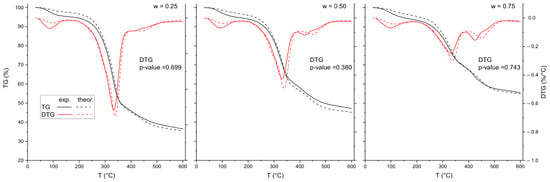
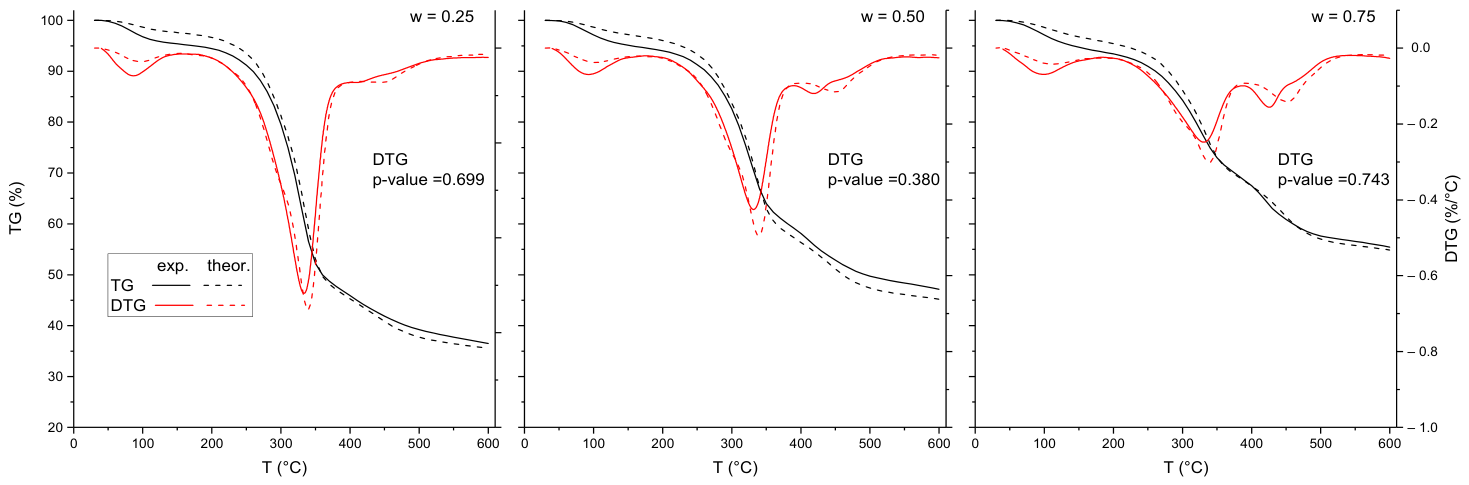
where TGther.,T is the theoretical mass at temperature T, TGwaste biomass,T described mass of the sample at temperature T for waste biomass, TGM,T is the mass of the sample at temperature T for M, and w is the mass fraction of the blend. A similar calculation was carried out for the DTG curves. The p-value was higher than 0.05 for all the DTG curves (Figure 2, Figure 3, Figure 4 and Figure 5), which means that there was no statistically significant difference between the measured and theoretical curves.
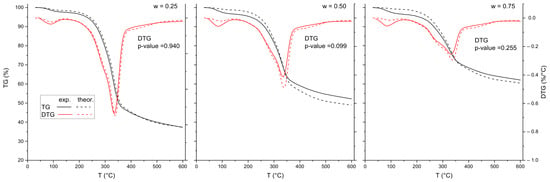
Figure 2.
TG and DTG curves during the pyrolysis of SMS with M at a heating rate of 10 °C/min.
Figure 3.
TG and DTG curves during the pyrolysis of SSI with M at a heating rate of 10 °C/min.
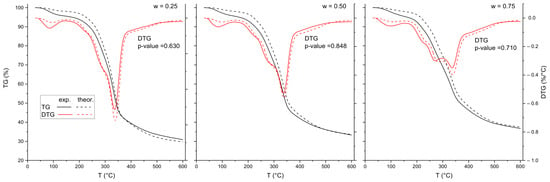
Figure 4.
TG and DTG curves during the pyrolysis of SSM with M at a heating rate of 10 °C/min.
Figure 5.
TG and DTG curves during the pyrolysis of SSML with M at a heating rate of 10 °C/min.
During the pyrolysis of SMS with M, it was observed that increasing the proportion of SMS in the feedstock resulted in a higher char yield. The mass remaining in the crucible was considered the mass of the produced char. For w equal to 0.25 the char yield production was 31.6% whereas for w equal to 0.75, it was 46.3% (Figure 2). The highest char yield during the pyrolysis process attributed to the fact that SMS contained approximately 9 times more ash than M. Analysis of the DTG curves revealed that the highest decomposition rate (−0.964%/°C) occurred during the pyrolysis of M at 333.5 °C. A similar value of the maximum decomposition rate value was reported by Cortés and Bridgwater [7]. The addition of SMS to M at the ratio 0.25 and 0.75 decreased the maximum rate decomposition from −0.786 to −0.466%/°C, respectively. Increasing the SMS content in the feed from 0.25 to 0.75 decreased the temperature corresponding to the maximum decomposition rate from 333.5 to 329.3 °C, respectively (Figure 2). A similar effect of SMS content on pyrolysis temperature corresponding to the highest rate decomposition during co-pyrolysis with pine sawdust was reported by Meng et al. [27]. A comprehensive analysis of the TG and DTG curves obtained during pyrolysis of SMS and M were published in our earlier works [33,34].
In the second stage, char yield production increased with the addition of more SSI to M; for a mass ratio of 0.25 and 0.75, the char yields were 37.3% and 62.1%, respectively. A higher proportion of SSI in the feedstock increased char production during pyrolysis. The DTG curves (Figure 3) showed that increasing the SSI content in the sample resulted in a lower maximum decomposition rate. For the sample containing 0.75 mass fraction of SSI, the maximum decomposition rate was −0.28%/°C, which was 2.6 times lower than that observed for the sample containing 0.25 mass fraction of SSI. The lowest temperature corresponding to the maximum decomposition rate (330.0 °C) was observed for the sample containing 0.50 SSI.
An increase in the SSM content of the samples resulted in a decrease in the start temperature of decomposition (Figure 4). This behaviour could be attributed to the fact that SSM contained a higher proportion of easily degradable components, such as proteins, than M. Similar behaviour was observed in the study by Zhang et al. [20] during the co-pyrolysis of sewage sludge with rice straw and Lin et al. [14], during co-pyrolysis of sewage sludge and bagasse. In our study, increasing the proportion of SSM in the sample resulted in a higher char yield. The highest char yield, reaching 36.7%, was obtained at a mass fraction of 0.75. Analysis of the DTG curves (Figure 4) indicated the presence of a second peak in the second stage of decomposition. The most pronounced additional peak was observed for the sample containing 0.75 SSM, at 268.2 °C, which corresponded to protein decomposition. The maximum rate of mass loss was observed for M and for the SSM and M blends with mass ratios of 0.25 and 0.50, at 333.3 °C. For the SSM and M blend with a mass ratio of 0.75, the temperature decreased to 330.7 °C. In the study conducted by Zhao et al. [9], the co-pyrolysis of municipal sewage sludge and hazelnut shells exhibited a maximum decomposition rate at 350 °C. Meanwhile, in the study by Liu et al. [8], the maximum decomposition rate was observed at 330 °C. In our study, increasing the SSM mass ratio from 0.25 to 0.75 reduced the maximum rate of mass loss from −0.69 to −0.36%/°C.
Increasing the SSML content in the samples significantly increased the char yield. At 600 °C, the char yield increased from 36.5% to 55.4% as the SSML mass fraction in the sample increased from 0.25 to 0.75 (Figure 5). This rise was primarily attributed to the increased CaCO3 content in the samples. Analysis of the DTG curves (Figure 5) revealed that the pyrolysis process began at a similar temperature regardless of the sample composition. Increasing the SSML mass ratio in the samples resulted in a decrease in the temperature corresponding to the maximum decomposition rate. For the sample with an SSML mass ratio of 0.75, the temperature corresponding to the maximum decomposition rate was 322.8 °C. Higher SSML content in the samples also resulted in a lower maximum decomposition rate during pyrolysis. The lowest decomposition rate (0.26%/°C) was observed for the sample with an SSML mass ratio of 0.75. Additionally, a new peak appeared above 400 °C for the samples with SSML mass ratios of 0.50 and 0.75. This peak may be attributed to the thermal decomposition of Ca(OH)2. A similar peak position was observed during the pyrolysis of sewage sludge with Ca(OH)2 by Lin et al. [4]. A comprehensive analysis of the TG and DTG curves obtained during pyrolysis of SSM and SSML were published in our earlier work [35].
Table 3 presents the char production yield with and without ash at 600 °C. The char production yield was determined from TG curves at a heating rate of 10 °C/min. The yield of char production without ash was calculated as the dry char without ash divided by dry substrate without ash. In the calculation it was assumed that the mass of the ash would not change when the sample was heated. For SSM waste biomass, which contained only 1.90% Ca, an increase in the SSM mass ratio of in the sample did not affect the char production yield without ash. The highest char production yield without ash was observed for waste biomass containing the highest amount of Ca (SSI—18.9%). This observation suggests that the presence of Ca in the sample increased the amount of char produced without ash. This increase is mainly attributed to the fact that Ca caused an increase in secondary reactions during the pyrolysis. The impact of Ca on the char formation was described by Grafmüller et al. [36] and Zhu et al. [37].
Table 3.
Yield production of char at 600 °C with and without ash.
3.3. Pyrolysis Kinetic Analysis
The isoconversion method of Flynn–Wall–Ozawa (FWO) (Equation (2)) was used to describe the pyrolysis kinetics [38].
where β is the heating rate (K/min), A represents the pre-exponential factor (1/s), E is the activation energy (J/(mol·K)), R stand for the molar constant of gas (8.314 J/(mol·K)), g(α) is the reaction model in integral form, and T represents the temperature (K). Activation energy is calculated from the of curve for constant conversion degree in plot ln(β) versus 1/T. For the calculation of A, first order reaction model was assumed. The conversion degree was determined for three different heating rates (5, 10 and 20 K/min).
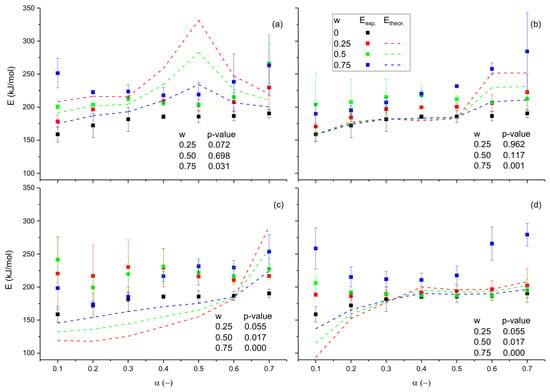
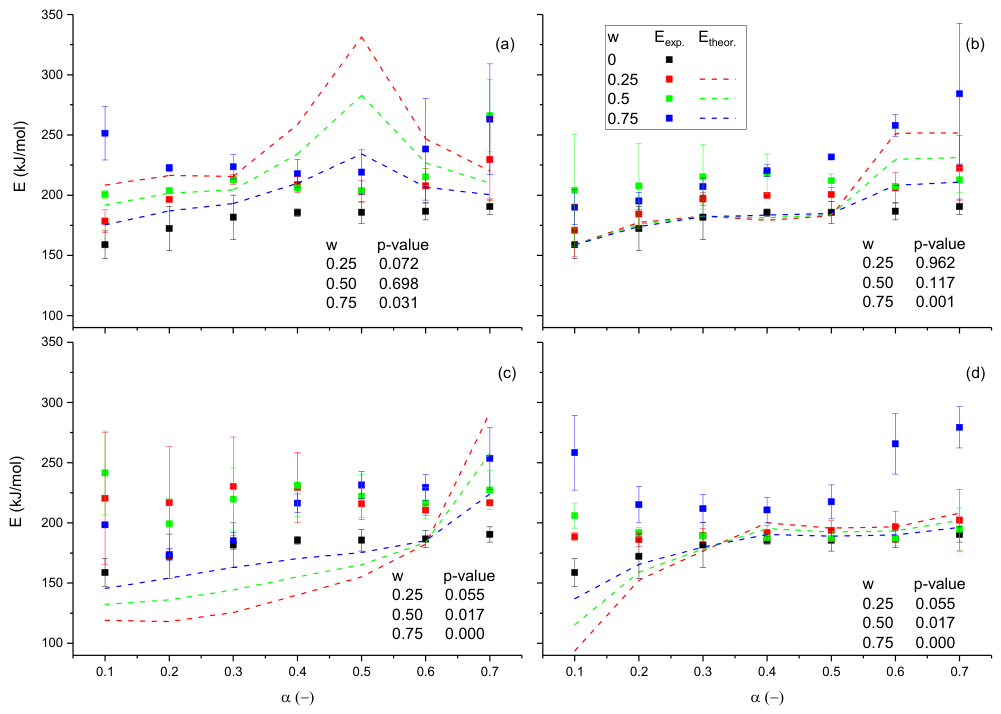
As can be seen in Figure 6, the activation energy changes with the conversion degree, which suggests that the pyrolysis process occurs through multistep reactions [39]. Data on the conversion degree in the range from 0.1 to 0.7 were selected for further analysis because low correlation was archived when determining the activation energy outside this range (Table 4).
Figure 6.
Changes in activation energy as a function of conversion degree for: (a) SMS + M, (b) SSI + M, (c) SSM + M and (d) SSML + M.
Table 4.
R2 values obtained at the different conversion degrees.
For the primary substrate (M), the activation energy increased from 158.6 to 185.5 kJ/mol within the conversion degree range of 0.1 to 0.4. This increase due to the decomposition of hemicellulose decomposed first, followed by cellulose, which requires more energy. In the conversion degree range of 0.4 to 0.7, the activation energy remained at a similar level, averaging 190.5 kJ/mol. This similar activation energy was mainly caused by the fact that lignin decomposes over a very wide temperature range (160–900 °C) [40] and is more resistant to thermal decomposition than hemicellulose and cellulose [8]. The FWO does not describe the decomposition of individual components of the biomass, but rather it describes changes in kinetics as a function of conversion degree. Therefore, this method indirectly describes the decomposition of the biomass components. Zhu et al. [24] observed a similar trend in activation energy during the pyrolysis of pine sawdust. For comparison, Cortés and Bridgwater [7] reported activation energies below 150 kJ/mol during the pyrolysis of Miscanthus giganteus in a thermogravimetric analyzer.
Figure 6a shows that addition of SMS to the M increased the experimental activation energy across the entire conversion degree range. Higher SMS addition resulted in a higher activation energy of the pyrolysis process. However, Meng et al. [27] observed that increasing the SMS content in pine sawdust did not always lead to an increase in activation energy. In our study, the addition of SMS to M at ratios of 0.25 and 0.50 resulted in a similar trend in activation energy changes as a function of conversion degree. The activation energy increased within the conversion range of 0.1–0.3 and then decreased slightly between conversion degrees of 0.3 and 0.5. At higher conversion degrees, the activation energy increased again. The addition of SMS to M at a ratio of 0.75 led to a decrease in the activation energy as the conversion degree increased from 0.1 to 0.2. However, for conversion degrees above 0.3, the activation energy variation trend was similar to that observed for the other blends. The increased activation energy at higher conversion degrees was probably caused by the high ash content, blocking the pores and hindering the release of pyrolysis products [32].
The addition of SSI to M increased the experimental activation energy compared to the primary substrate (M). For a mass fraction of 0.25, the activation energy increased as the conversion degree increased (Figure 6b). The highest activation energy was observed at a mass fraction of 0.50 at conversion degrees ranging from 0.1 to 0.3. For a conversion degree higher than 0.4 (w = 0.50) the activation energy decreased. For the sample with a mass fraction of 0.75, the activation energy increased progressively with increasing conversion degree across the entire conversion range. For practical applications, a mass fraction of 0.75 SSI is not recommended in the blend due to the high energy demand associated with its pyrolysis.
The similar activation energy of the SSM-M blend was recorded for samples at mass ratios of 0.25 and 0.50 (Figure 6c). These activation energies were higher than that of the primary pyrolysis substrate. A similar observation was reported by Liu et al. [8] during the pyrolysis of rice husk and sewage sludge. In our study, the activation energy decreased at conversion degrees ranging from 0.1 to 0.2 for the highest mass ratio (0.75). However, a further increase in the conversion degree resulted in an increase in the activation energy.
The conversion degree did not significantly influence the activation energy for SSML mass fractions of 0.25 and 0.50. The average activation energies were 190.0 kJ/mol and 191.9 kJ/mol for mass fractions of 0.25 and 0.50, respectively (Figure 6d). A different trend was observed for the mass fraction of 0.75. In the range of 0.1–0.2 the conversion degree was associated with a decrease in activation energy from 258.4 to 215.2 kJ/mol. As the conversion degree increased further up to 0.5, the activation energy remained at a similar level. Above a conversion degree of 0.5, however, a significant increase in activation energy was observed. Changes in activation energy as a function of the degree of conversion allow us to determine where in the reactor more energy should be provided. Higher activation energy is associated with more difficult biomass decomposition.
The theoretical activation energy (Ether.) was calculated using Equation (3).
where Ether,α is the theoretical activation energy at α, Ewaste biomass,α described activation energy at α for one investigated waste biomass, EM,α is the activation energy at α for M, and w is the mass fraction of the blend. For all waste biomass at w = 0.75, the p-value was less than 0.05 (Figure 6). This indicates that there was a statistically significant difference between the experimental and theoretical activation energies. The opposite occurred when waste biomass was added at a mass ratio of 0.25. A significant difference was also observed in the SSM mixed with M at a proportion of 0.5.
As shown in Table 5, an increased amount of secondary biomass results in a rise in the average activation energy calculated from the experiments. This suggests that such a substrate requires a longer residence time in the reactor and, consequently, a slower heating rate. A comparison of the experimental and theoretical average activation energies revealed a synergistic effect for SMS at mass ratios of 0.25 to 0.50 (Table 5). A higher SMS amount (0.75) does not cause a synergistic effect during pyrolysis. Compared to other substrates, this secondary substrate had the highest amount of nitrogen and fixed carbon, and the lowest volatile matter and H/C ratio. Similar average energy activation was obtained from the experiment and the theoretical calculation for the substrate mixed from SSML and M at a mass ratio of 0.25. In other cases, an antagonistic effect was observed, indicating that the choice of secondary substrate and its content in the feedstock significantly impacts kinetic pyrolysis.
Table 5.
Average activation energy from experiment and theoretical.
Table 6 shows the pre-exponential factor values (A) for various blends of the secondary substrate with M. A higher A value indicates a higher frequency of successful activated complex formation. For the primary substrate (M), it was observed that the value of log(A) rose from 12.5 to 14.1 1/s within the conversion degree range of 0.1–0.3. Beyond a conversion degree of 0.3, the pre-exponential factor remained essentially constant. Cortés and Bridgwater [7] reported a lower value of A during the pyrolysis of Miscanthus giganteus in thermobalance.
Table 6.
Changes in the pre-exponential factor for different ratios of primary and secondary substrate.
An increase in the SMS mass ratio resulted in higher A values across the entire conversion range for the SMS-M blend. For SMS mass ratios of 0.25 and 0.50, maximum A values were observed at conversion degrees of 0.7. Meng et al. [27] reported lower log(A) values ranging from 10.0 to 14.5 1/s for blends of SMS with different ratios of sawdust and wheat straw. An increase in the conversion degree resulted in an increase in the A value for SSI mass ratios of 0.25 and 0.75 in the blend. The opposite trend was observed for a mass ratio of 0.5. The maximum log(A) value (17.6 1/s) was observed at a conversion degree of 0.1 and a mass ratio of 0.50. An increase in the mass fraction of the SSM blend resulted in a decrease in the A value at conversion degrees ranging from 0.2 to 0.3. However, the opposite trend was observed for conversion degrees ranging from 0.5 to 0.7. For conversion degrees in the range of 0.1–0.2 the A value increased as the SSML mass ratio increased. Meanwhile, for conversion degrees within the range of 0.3–0.7, the pre-exponential factor reached its minimum value at a mass ratio of 0.50.
Based on mathematical expression (Equation (4)) determined compensation effects [20]. The data received from plots ln(A) in the function of E is presented in Table 7.
where a, b are compensation parameters. The compensation effect was noticed when the value of R2 was above 0.9 (Table 7). This effect was only visible for the waste biomass SSI and M with proportions of 0.25 and 0.75.
Table 7.
Compensation effect during co-pyrolysis of waste biomass with M.
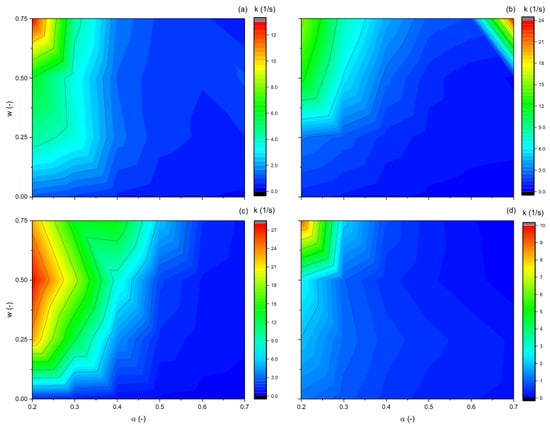
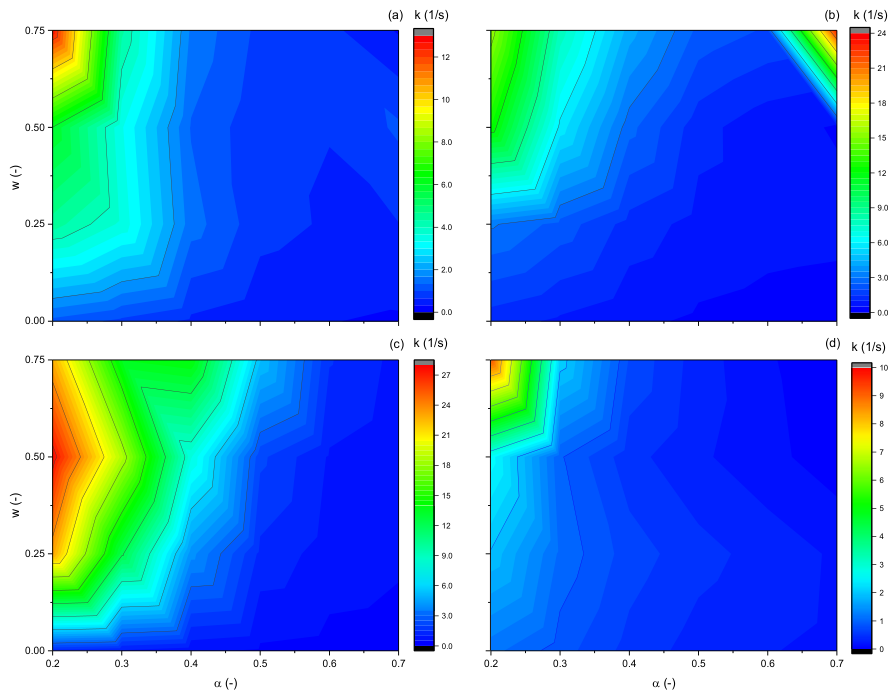
Because of the wide variation in the pre-exponential factor and activation energy values, the reaction rate constant was calculated to better evaluate the influence of the secondary substrate mass fraction on co-pyrolysis kinetics. The reaction rate constant was calculated using the Arrhenius law (Equation (5)).
where k(α,T) is the reaction rate constant (1/s), α represents the conversion degree (-), A denotes the pre-exponential factor (1/s), E is the activation energy (J/mol), R represents the universal gas constant (8.314 J/(mol·K)), and T is the temperature (K). To simplify the analysis, the reaction rate constant was calculated at 350 and 400 °C. The reaction rate constant at a conversion degree of 0.1 was omitted because, below this conversion level, the mass loss observed during thermogravimetric analysis is mainly associated with moisture removal from the sample. Knowing the reaction rate constant allows one to assess the residence time of the biomass in the reactor. A higher reaction rate constant means that the residence time of biomass in the reactor is lower.
During the pyrolysis of SMS–M mixtures at 400 °C, it was observed that the addition of SMS to M at mass fractions ranging from 0.25 to 0.75 increased the k at conversion degrees between 0.2 and 0.3 (Figure 7a). The maximum k value was obtained at a conversion degree of 0.2 and a mass fraction of 0.75. The highest reaction rate constant during the pyrolysis of SSI with M was observed at a mass ratio of 0.75 and a conversion degree of 0.7 (Figure 7b). Furthermore. the reaction rate constant increased as the SSI mass ratio increased from 0.50 to 0.75 at low conversion degrees (0.2–0.3). Among the analysed blends, the SSM–M mixture exhibited the most significant positive synergistic effect on the pyrolysis kinetics, as reflected by the highest increase in the reaction rate constant (Figure 7c). The highest k value (27.6 1/s) was observed for blend the SSM with M with a proportion 0.50 and a α value of 0.2. Despite having the lowest calcium content among the secondary samples. SSM exhibited the most pronounced positive effect on the pyrolysis kinetics, resulting in an increase in the reaction rate constant. An increase in k value was observed for samples containing SSML and M at a mass fraction of 0.75 and a low conversion degree of 0.2 (Figure 7d).
Figure 7.
Changes in the reaction rate constant as a function of conversion degree and mass ratio at 400 °C for: (a) SMS + M, (b) SSI + M, (c) SSM + M and (d) SSML + M.
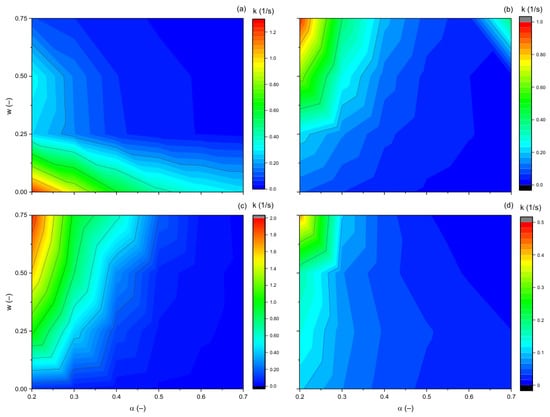
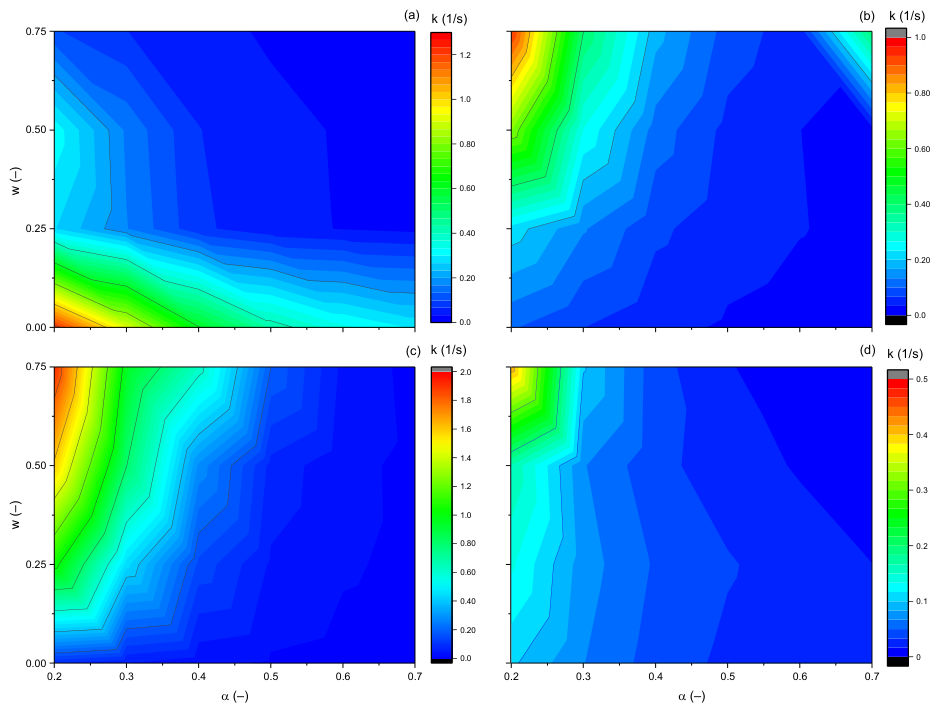
Significant changes in the reaction rate constant were observed during the co-pyrolysis of SMS with M at a lower temperature of 350 °C (Figure 8). The highest reaction rate constant during the co-pyrolysis of SMS and M was found to be in the sample containing only the primary substrate. These results indicate that the mass ratio of the secondary substrate influences the reaction rate constant at different temperatures.
Figure 8.
Changes in the reaction rate constant as a function of the conversion degree and the mass ratio at 350 °C for: (a) SMS + M, (b) SSI + M, (c) SSM + M and (d) SSML + M.
4. Conclusions
Based on the research conducted, it was observed that increasing the proportion of the secondary substrate in the sample increased the char yield. This increase was primarily due to the higher ash content of the secondary feedstocks compared to the primary substrate, Miscanthus giganteus. Increasing the proportion of the secondary substrate did not significantly affect the temperature at the maximum decomposition rate. This research compared the kinetics of co-pyrolysis of different types of biomass because the same parameters were used during the process and to determine them. Kinetic analysis revealed that the addition of the secondary substrate increased the activation energy across the entire conversion range. This was mainly due to the fact that the waste biomass did not contain easily degradable organic matter. A similar trend was observed for the pre-exponential factor except for the samples containing lime-treated municipal sewage sludge. Kinetic rate constants calculated using the Arrhenius equation at 400 °C showed that samples containing municipal sewage sludge as the secondary substrate had the most pronounced positive effect on the pyrolysis rate.
Author Contributions
Conceptualization, R.S.; methodology, R.S.; validation, R.S. and S.L.; formal analysis, M.S. and R.S.; investigation, M.S. and R.S.; data curation, M.S. and R.S.; writing—original draft, R.S.; writing—review & editing, R.S. and S.L.; supervision, S.L. All authors have read and agreed to the published version of the manuscript.
Funding
This research received no external funding.
Data Availability Statement
Data will be made available on request.
Conflicts of Interest
The authors declare no conflicts of interest.
Abbreviations
The following abbreviations are used in this manuscript:
| A | pre-exponential factor (1/s) |
| a | compensation parameter |
| α | conversion degree |
| b | compensation parameter |
| β | heating rate (K/min) |
| DAEM | distributed activation energy model |
| E | activation energy (kJ/mol) |
| FWO | Flynn–Wall–Ozawa |
| k | reaction rate constant (1/s) |
| M | Miscanthus giganteus |
| R | universal gas constant (8.314 J/(mol·K)) |
| SMS | spent mushroom substrate |
| SSI | industrial sewage sludge |
| SSM | municipal sewage sludge without lime |
| SSML | municipal sewage sludge with lime |
| T | Temperature (K) |
| w | mass ratio (-) |
References
- Xia, Y.; Tang, Y.; Shih, K.; Li, B. Enhanced Phosphorus Availability and Heavy Metal Removal by Chlorination during Sewage Sludge Pyrolysis. J. Hazard. Mater. 2020, 382, 121110. [Google Scholar] [CrossRef] [Scilit]
- Seah, C.C.; Tan, C.H.; Arifin, N.A.; Hafriz, R.S.R.M.; Salmiaton, A.; Nomanbhay, S.; Shamsuddin, A.H. Co-Pyrolysis of Biomass and Plastic: Circularity of Wastes and Comprehensive Review of Synergistic Mechanism. Results Eng. 2023, 17, 100989. [Google Scholar] [CrossRef] [Scilit]
- Płonka, I.; Kudlek, E.; Pieczykolan, B. Municipal Sewage Sludge Disposal in the Republic of Poland. Appl. Sci. 2025, 15, 3375. [Google Scholar] [CrossRef] [Scilit]
- Lin, D.; Kai, W.; Xie, X.; Isa, Y.M.; Kozlov, A.; Penzik, M.; Zhang, S.; Li, B. Pyrolysis of Lime Dried Sewage Sludge in a Fixed-Bed Reactor: Effects of the Addition Amount of Lime. Fuel 2026, 405, 136767. [Google Scholar] [CrossRef] [Scilit]
- Martín, C.; Xiong, S.; Zervakis, G.I. Exploiting the Biorefinery Potential of Spent Mushroom Substrate: The Time to Do It Is Now. Molecules 2025, 30, 4518. [Google Scholar] [CrossRef] [Scilit] [PubMed]
- Mos, M.; Banks, S.W.; Nowakowski, D.J.; Robson, P.R.H.; Bridgwater, A.V.; Donnison, I.S. Impact of Miscanthus x Giganteus Senescence Times on Fast Pyrolysis Bio-Oil Quality. Bioresour. Technol. 2013, 129, 335–342. [Google Scholar] [CrossRef] [Scilit] [PubMed]
- Cortés, A.M.; Bridgwater, A.V. Kinetic Study of the Pyrolysis of Miscanthus and Its Acid Hydrolysis Residue by Thermogravimetric Analysis. Fuel Process. Technol. 2015, 138, 184–193. [Google Scholar] [CrossRef] [Scilit]
- Liu, Y.; Song, Y.; Fu, J.; Ao, W.; Ali Siyal, A.; Zhou, C.; Liu, C.; Yu, M.; Zhang, Y.; Dai, J.; et al. Co-Pyrolysis of Sewage Sludge and Lignocellulosic Biomass: Synergistic Effects on Products Characteristics and Kinetics. Energy Convers. Manag. 2022, 268, 116061. [Google Scholar] [CrossRef] [Scilit]
- Zhao, B.; Xu, X.; Li, H.; Chen, X.; Zeng, F. Kinetics Evaluation and Thermal Decomposition Characteristics of Co-Pyrolysis of Municipal Sewage Sludge and Hazelnut Shell. Bioresour. Technol. 2018, 247, 21–29. [Google Scholar] [CrossRef] [Scilit] [PubMed]
- Alvarado Flores, J.J.; Alcaraz Vera, J.V.; Ávalos Rodríguez, M.L.; López Sosa, L.B.; Rutiaga Quiñones, J.G.; Pintor Ibarra, L.F.; Márquez Montesino, F.; Aguado Zarraga, R. Analysis of Pyrolysis Kinetic Parameters Based on Various Mathematical Models for More than Twenty Different Biomasses: A Review. Energies 2022, 15, 6524. [Google Scholar] [CrossRef] [Scilit]
- Tian, H.; Jiao, H.; Cai, J.; Wang, J.; Yang, Y.; Bridgwater, A.V. Co-Pyrolysis of Miscanthus Sacchariflorus and Coals: A Systematic Study on the Synergies in Thermal Decomposition, Kinetics and Vapour Phase Products. Fuel 2020, 262, 116603. [Google Scholar] [CrossRef] [Scilit]
- Pinto, F.; Duarte, L.C.; Carvalheiro, F.; Paradela, F.; Costa, P.; Marques, J.; André, R.; Marques, P.; Costa, D.; Sampaio, B. Production of Liquid Compounds by Co-Pyrolysis of Different Pre-Treated Biomasses Mixed with Plastic Wastes. Chem. Eng. Trans. 2019, 76, 1393–1398. [Google Scholar] [CrossRef] [Scilit]
- Jayaraman, K.; Gökalp, I. Pyrolysis, Combustion and Gasification Characteristics of Miscanthus and Sewage Sludge. Energy Convers. Manag. 2015, 89, 83–91. [Google Scholar] [CrossRef] [Scilit]
- Lin, Y.; Chen, Z.; Dai, M.; Fang, S.; Liao, Y.; Yu, Z.; Ma, X. Co-Pyrolysis Kinetics of Sewage Sludge and Bagasse Using Multiple Normal Distributed Activation Energy Model (M-DAEM). Bioresour. Technol. 2018, 259, 173–180. [Google Scholar] [CrossRef] [Scilit] [PubMed]
- Hameed, Z.; Aman, Z.; Naqvi, S.R.; Tariq, R.; Ali, I.; Makki, A.A. Kinetic and Thermodynamic Analyses of Sugar Cane Bagasse and Sewage Sludge Co-Pyrolysis Process. Energy Fuels 2018, 32, 9551–9558. [Google Scholar] [CrossRef] [Scilit]
- Wang, Z.; Shu, X.; Zhu, H.; Xie, L.; Cheng, S.; Zhang, Y. Characteristics of Biochars Prepared by Co-Pyrolysis of Sewage Sludge and Cotton Stalk Intended for Use as Soil Amendments. Environ. Technol. 2020, 41, 1347–1357. [Google Scholar] [CrossRef] [Scilit] [PubMed]
- Wang, X.; Chang, V.W.-C.; Li, Z.; Song, Y.; Li, C.; Wang, Y. Co-Pyrolysis of Sewage Sludge and Food Waste Digestate to Synergistically Improve Biochar Characteristics and Heavy Metals Immobilization. Waste Manag. 2022, 141, 231–239. [Google Scholar] [CrossRef] [Scilit] [PubMed]
- Wang, X.; Zhao, B.; Yang, X. Co-Pyrolysis of Microalgae and Sewage Sludge: Biocrude Assessment and Char Yield Prediction. Energy Convers. Manag. 2016, 117, 326–334. [Google Scholar] [CrossRef] [Scilit]
- Dong, Q.; Zhang, S.; Wu, B.; Pi, M.; Xiong, Y.; Zhang, H. Co-pyrolysis of Sewage Sludge and Rice Straw: Thermal Behavior and Char Characteristic. Energy Fuels 2019, 34, 607–615. [Google Scholar] [CrossRef] [Scilit]
- Zhang, S.-Q.; Yue, X.-M.; Yin, Z.-Y.; Pan, T.-T.; Dong, M.-J.; Sun, T.-Y. Study of the Co-Pyrolysis Behavior of Sewage-Sludge/Rice-Straw and the Kinetics. In Procedia Earth and Planetary Science; Elsevier: Amsterdam, The Netherlands, 2009; Volume 1, pp. 661–666. [Google Scholar]
- Yang, Y.-Q.; Cui, M.-H.; Guo, J.-C.; Du, J.-J.; Zheng, Z.-Y.; Liu, H. Effects of Co-Pyrolysis of Rice Husk and Sewage Sludge on the Bioavailability and Environmental Risks of Pb and Cd. Environ. Technol. 2021, 42, 2304–2312. [Google Scholar] [CrossRef] [Scilit] [PubMed]
- Naqvi, S.R.; Hameed, Z.; Tariq, R.; Taqvi, S.A.; Ali, I.; Niazi, M.B.K.; Noor, T.; Hussain, A.; Iqbal, N.; Shahbaz, M. Synergistic Effect on Co-Pyrolysis of Rice Husk and Sewage Sludge by Thermal Behavior, Kinetics, Thermodynamic Parameters and Artificial Neural Network. Waste Manag. 2019, 85, 131–140. [Google Scholar] [CrossRef] [Scilit] [PubMed]
- Leng, L.; Leng, S.; Chen, J.; Yuan, X.; Li, J.; Li, K.; Wang, Y.; Zhou, W. The Migration and Transformation Behavior of Heavy Metals during Co-Liquefaction of Municipal Sewage Sludge and Lignocellulosic Biomass. Bioresour. Technol. 2018, 259, 156–163. [Google Scholar] [CrossRef] [Scilit] [PubMed]
- Zhu, X.; Chen, Z.; Xiao, B.; Hu, Z.; Hu, M.; Liu, C.; Zhang, Q. Co-Pyrolysis Behaviors and Kinetics of Sewage Sludge and Pine Sawdust Blends under Non-Isothermal Conditions. J. Therm. Anal. Calorim. 2015, 119, 2269–2279. [Google Scholar] [CrossRef] [Scilit]
- Wang, X.; Deng, S.; Tan, H.; Adeosun, A.; Vujanović, M.; Yang, F.; Duić, N. Synergetic Effect of Sewage Sludge and Biomass Co-Pyrolysis: A Combined Study in Thermogravimetric Analyzer and a Fixed Bed Reactor. Energy Convers. Manag. 2016, 118, 399–405. [Google Scholar] [CrossRef] [Scilit]
- Kończak, M.; Oleszczuk, P. Co-Pyrolysis of Sewage Sludge and Biomass in Carbon Dioxide as a Carrier Gas Affects the Total and Leachable Metals in Biochars. J. Hazard. Mater. 2020, 400, 123144. [Google Scholar] [CrossRef] [Scilit] [PubMed]
- Meng, H.; Yang, H.; Wu, Z.; Li, D.; Wang, Z.; Wang, D.; Wang, H.; Li, H.; Li, J. Co-Pyrolysis of Mushroom Residue Blended with Pine Sawdust/Wheat Straw for Sustainable Utilization of Biomass Wastes: Thermal Characteristics, Kinetic/Thermodynamic Analysis, and Structure Evolution of Co-Pyrolytic Char. Sustainability 2024, 16, 6677. [Google Scholar] [CrossRef] [Scilit]
- Jiang, H.; Deng, S.; Chen, J.; Zhang, L.; Zhang, M.; Li, J.; Li, S.; Li, J. Preliminary Study on Copyrolysis of Spent Mushroom as Biomass and Huadian Oil Shale. Energy Fuels 2016, 30, 6342–6349. [Google Scholar] [CrossRef] [Scilit]
- ASTM E1131-25; Standard Test Method for Compositional Analysis by Thermogravimetry. ASTM International: West Conshohocken, PA, USA, 2025.
- PN-EN ISO 16948:2015-07; Solid Biofuels—Determination of Total Content of Carbon, Hydrogen and Nitrogen. Polish Committee for Standardization (PKN): Warsaw, Poland, 2015.
- PN-EN ISO 11885:2009; Water Quality—Determination of Selected Elements by Inductively Coupled Plasma Optical Emission Spectrometry (ICP-OES). Polish Committee for Standardization (PKN): Warsaw, Poland, 2009.
- Karuppasamy Vikraman, V.; Praveen Kumar, D.; Boopathi, G.; Subramanian, P. Kinetic and Thermodynamic Study of Finger Millet Straw Pyrolysis through Thermogravimetric Analysis. Bioresour. Technol. 2021, 342, 125992. [Google Scholar] [CrossRef] [Scilit] [PubMed]
- Slezak, R.; Krzystek, L.; Ledakowicz, S. Thermogravimetric Analysis Coupled with Mass Spectrometry of Spent Mushroom Substrate and Its Fractions. J. Anal. Appl. Pyrolysis 2018, 133, 1–8. [Google Scholar] [CrossRef] [Scilit]
- Matusiak, M.; Sle̜zak, R.; Ledakowicz, S. Thermogravimetric Kinetics of Selected Energy Crops Pyrolysis. Energies 2020, 13, 3977. [Google Scholar] [CrossRef] [Scilit]
- Stolarek, P.; Ledakowicz, S.; Slȩzak, R. Influence of Liming on Kinetics of Sewage Sludge Pyrolysis. Ecol. Chem. Eng. S 2019, 26, 175–188. [Google Scholar] [CrossRef] [Scilit]
- Grafmüller, J.; Tobler, M.; Vögelin, P.; Bucheli, T.D.; Schmidt, H.P.; Hagemann, N. Increasing Biochar Yield in Pyrolysis by Adding Ash. Environ. Sci. Technol. 2026, 60, 22314–22322. [Google Scholar] [CrossRef] [Scilit] [PubMed]
- Zhu, C.; Maduskar, S.; Paulsen, A.D.; Dauenhauer, P.J. Alkaline-Earth-Metal-Catalyzed Thin-Film Pyrolysis of Cellulose. ChemCatChem 2016, 8, 818–829. [Google Scholar] [CrossRef] [Scilit]
- Zhang, H.; Sun, Y.; Tao, J.; Du, C.; Yan, B.; Li, X.; Chen, G. Modeling and Kinetic Analysis for Co-Pyrolysis of Sewage Sludge and Municipal Solid Waste under Multiple Factors. Environ. Dev. Sustain. 2026, 28, 27809–27860. [Google Scholar] [CrossRef] [Scilit]
- Vyazovkin, S.; Burnham, A.K.; Criado, J.M.; Pérez-Maqueda, L.A.; Popescu, C.; Sbirrazzuoli, N. ICTAC Kinetics Committee Recommendations for Performing Kinetic Computations on Thermal Analysis Data. Thermochim. Acta 2011, 520, 1–19. [Google Scholar] [CrossRef] [Scilit]
- Dhyani, V.; Bhaskar, T. A Comprehensive Review on the Pyrolysis of Lignocellulosic Biomass. Renew. Energy 2018, 129, 695–716. [Google Scholar] [CrossRef] [Scilit]

Disclaimer/Publisher’s Note: The statements, opinions and data contained in all publications are solely those of the individual author(s) and contributor(s) and not of MDPI and/or the editor(s). MDPI and/or the editor(s) disclaim responsibility for any injury to people or property resulting from any ideas, methods, instructions or products referred to in the content. |
© 2026 by the authors. Licensee MDPI, Basel, Switzerland. This article is an open access article distributed under the terms and conditions of the Creative Commons Attribution (CC BY) license.