


Abstract
Thermal interference among neighboring piles can substantially alter the performance of energy pile groups, and its influence on heat transfer and deformation depends on pile position, spacing, layout, and ground properties. This study developed a three-dimensional thermo-mechanical numerical model to investigate these effects for energy pile groups equipped with U-type, W-type, and 3U-type heat exchangers. The thermal response was validated against a field thermal performance test, with a relative deviation of about 10%, and the mechanical component was additionally assessed against measured pile stress data from an independent single-pile test. Simulations over 700 h under summer heat rejection conditions showed that thermal interference intensified as the temperature fields of adjacent piles expanded and overlapped. Central piles experienced stronger interference than edge piles, and the resulting increase in outlet temperature was most pronounced for the 3U-type group. Increasing pile spacing reduced thermal field overlap and pile head displacement, although the additional benefit became limited beyond about 4–5 m within the 700 h simulation; this range is not a general design threshold. Differences between the investigated nine-pile square system and eight-pile staggered system were smaller than those associated with pile spacing. Because the two systems contained different numbers of piles, these differences are interpreted as system-level responses rather than isolated layout effects. For the central pile of the 3U-type group, increasing soil thermal conductivity, specific heat capacity, and density generally improved heat rejection and reduced the predicted pile head displacement within the investigated parameter ranges, with specific heat capacity producing the largest absolute variation in outlet water temperature under the investigated 700 h summer heat rejection conditions. These results indicate that energy pile group performance is governed by the combined effects of spatial configuration and ground thermal properties and cannot be inferred from isolated pile behavior alone.
1. Introduction
Energy piles combine the load-bearing function of foundation piles with ground heat exchange, allowing shallow geothermal energy to be utilized without constructing additional borehole heat exchangers. Their thermal performance is governed by heat transfer among the circulating fluid, concrete pile, and surrounding ground, and they can be affected by the configuration of the embedded heat exchanger [1,2,3,4,5,6,7,8,9]. While much of the earlier work has focused on isolated energy piles, practical foundation systems generally contain multiple piles operating within a limited ground volume [10,11]. Under such conditions, the thermal fields generated by neighboring piles may overlap, producing thermal interference that is absent or considerably weaker in an isolated pile [12,13]. The performance of an energy pile group, therefore, depends not only on the behavior of an individual pile but also on the thermal interaction among piles [14,15,16].
Thermal interference has consequently become an important issue in the design of energy pile groups. Park et al. [17] specifically investigated thermal interference in energy piles with different heat exchanger configurations, highlighting the need to account for interactions among neighboring heat sources. The development of thermal interference is closely associated with the spatial extent of heat propagation in the surrounding soil [18,19]. As operation continues, heat released from or extracted by adjacent piles can progressively modify the ground temperature between piles, reducing the temperature difference available for subsequent heat exchange. The magnitude of this interaction is, therefore, related to pile spacing and the spatial arrangement of the pile group. Heat exchanger configuration can further alter the temperature field generated by each pile, while the thermal response of the soil determines how rapidly heat is transferred and stored in the ground [20,21,22,23]. These factors make the thermal behavior of pile groups inherently more spatially dependent than that of isolated piles.
Thermal interaction within a pile group may also affect its mechanical response. Temperature variation causes expansion or contraction of the concrete pile, and the resulting deformation is constrained by the surrounding soil and structural loading [24,25,26]. Experimental and numerical studies on energy piles have demonstrated that temperature changes can modify pile displacement, axial force, and stress distributions [27,28]. In a pile group, however, neighboring piles do not necessarily experience identical thermal conditions. Piles located near the center of a group are surrounded by more thermally active piles than those near the perimeter, and the resulting differences in ground temperature can lead to position-dependent thermal and deformation responses [29]. Accordingly, an assessment based solely on group average heat transfer performance may not adequately describe the behavior of individual piles within the foundation.
Pile group geometry and ground properties are, therefore, particularly relevant to the coupled thermal and mechanical performance of energy pile foundations [30,31,32]. Increasing pile spacing can reduce the overlap of neighboring temperature fields, whereas changing the pile layout alters the number and relative positions of surrounding heat sources. The thermophysical properties of the soil provide another controlling mechanism: thermal conductivity governs heat diffusion through the ground, while specific heat capacity and density determine its thermal storage capacity [20]. Although previous studies have examined heat exchanger configurations, soil thermal behavior, thermal interference, and thermo-mechanical responses, these aspects have often been considered separately [17,21,22,23,24,25,26]. Recent studies have expanded the understanding of energy pile groups from complementary perspectives. Theoretical work has clarified thermally induced group effects and interaction mechanisms [33], three-dimensional thermo-hydro-mechanical analyses have examined stress and displacement under combined thermal and mechanical loading [31], and centrifuge tests have demonstrated the importance of pile spacing for deformation in soft clay [34]. Taken together, these studies show that group interaction, mechanical response, and pile spacing are all important; however, these factors are commonly investigated in separate settings. Systematic comparisons that jointly consider heat exchanger configuration, pile position, a continuous spacing range, group arrangement, and soil thermophysical properties under a consistent thermo-mechanical framework remain limited. A consistent comparison of how pile spacing, group layout, and soil thermophysical properties affect both thermal interference and pile deformation is, therefore, useful for the design of energy pile groups, particularly when different embedded pipe configurations are considered.
In this study, three-dimensional thermo-mechanical numerical models of energy pile groups with U-type, W-type, and 3U-type heat exchangers were developed in COMSOL Multiphysics 6.1. The numerical framework was evaluated using complementary thermal and mechanical validation cases. The thermal response was compared with a published pile group field test, while the mechanical component was additionally assessed against measured pile stresses from an independent single-pile test. The temporal and spatial development of thermal interference was then examined by comparing the temperature fields, outlet water temperatures, and pile head displacements of piles at different positions within the group. The effects of pile spacing were evaluated over a range of 2.1–5.1 m, followed by a comparison between square and staggered pile layouts. The effects of soil thermal conductivity, specific heat capacity, and density were also investigated. The analysis focuses on the relationship between group configuration, thermal interference, and thermo-mechanical response, with the aim of identifying the conditions under which interactions among neighboring piles become weak and clarifying how pile group design influences both heat transfer and deformation behavior. The results are limited to the 700 h summer heat rejection conditions and the geometries considered in this study; they do not represent a full seasonal cycle, multi-year behavior, or universal design criteria.
2. Methodology
2.1. Physical Model and Assumptions
Three-dimensional numerical models of energy pile groups were established in COMSOL Multiphysics 6.1 for three embedded heat exchanger configurations: U-type, W-type, and 3U-type. Each energy pile consisted of a cylindrical concrete pile, embedded heat exchange pipes, and circulating water, and the pile groups were embedded within a common soil domain. The soil domain had dimensions of 30 m × 30 m × 52 m. Each pile had a diameter of 0.6 m and a length of 25.5 m. The embedded pipes had an inner diameter of 0.020 m, a wall thickness of 0.004 m, and a characteristic spacing of 0.10 m.
The soil domain dimensions were selected with reference to the numerical model of deep-buried pipe energy piles reported by Ruan [35], in which a sufficiently large soil domain was adopted to eliminate boundary effects. The domain size was adapted to the present pile length and group footprint. The lateral boundaries were placed approximately 12.4 m from the outermost pile centers, which is about 8–10 times the maximum thermal influence radius (approximately 1.2–1.4 m at 700 h). The bottom boundary was located 26.5 m below the pile tips. At these distances, the far-field boundaries are expected to have a negligible influence on the calculated outlet water temperatures and pile head displacements.
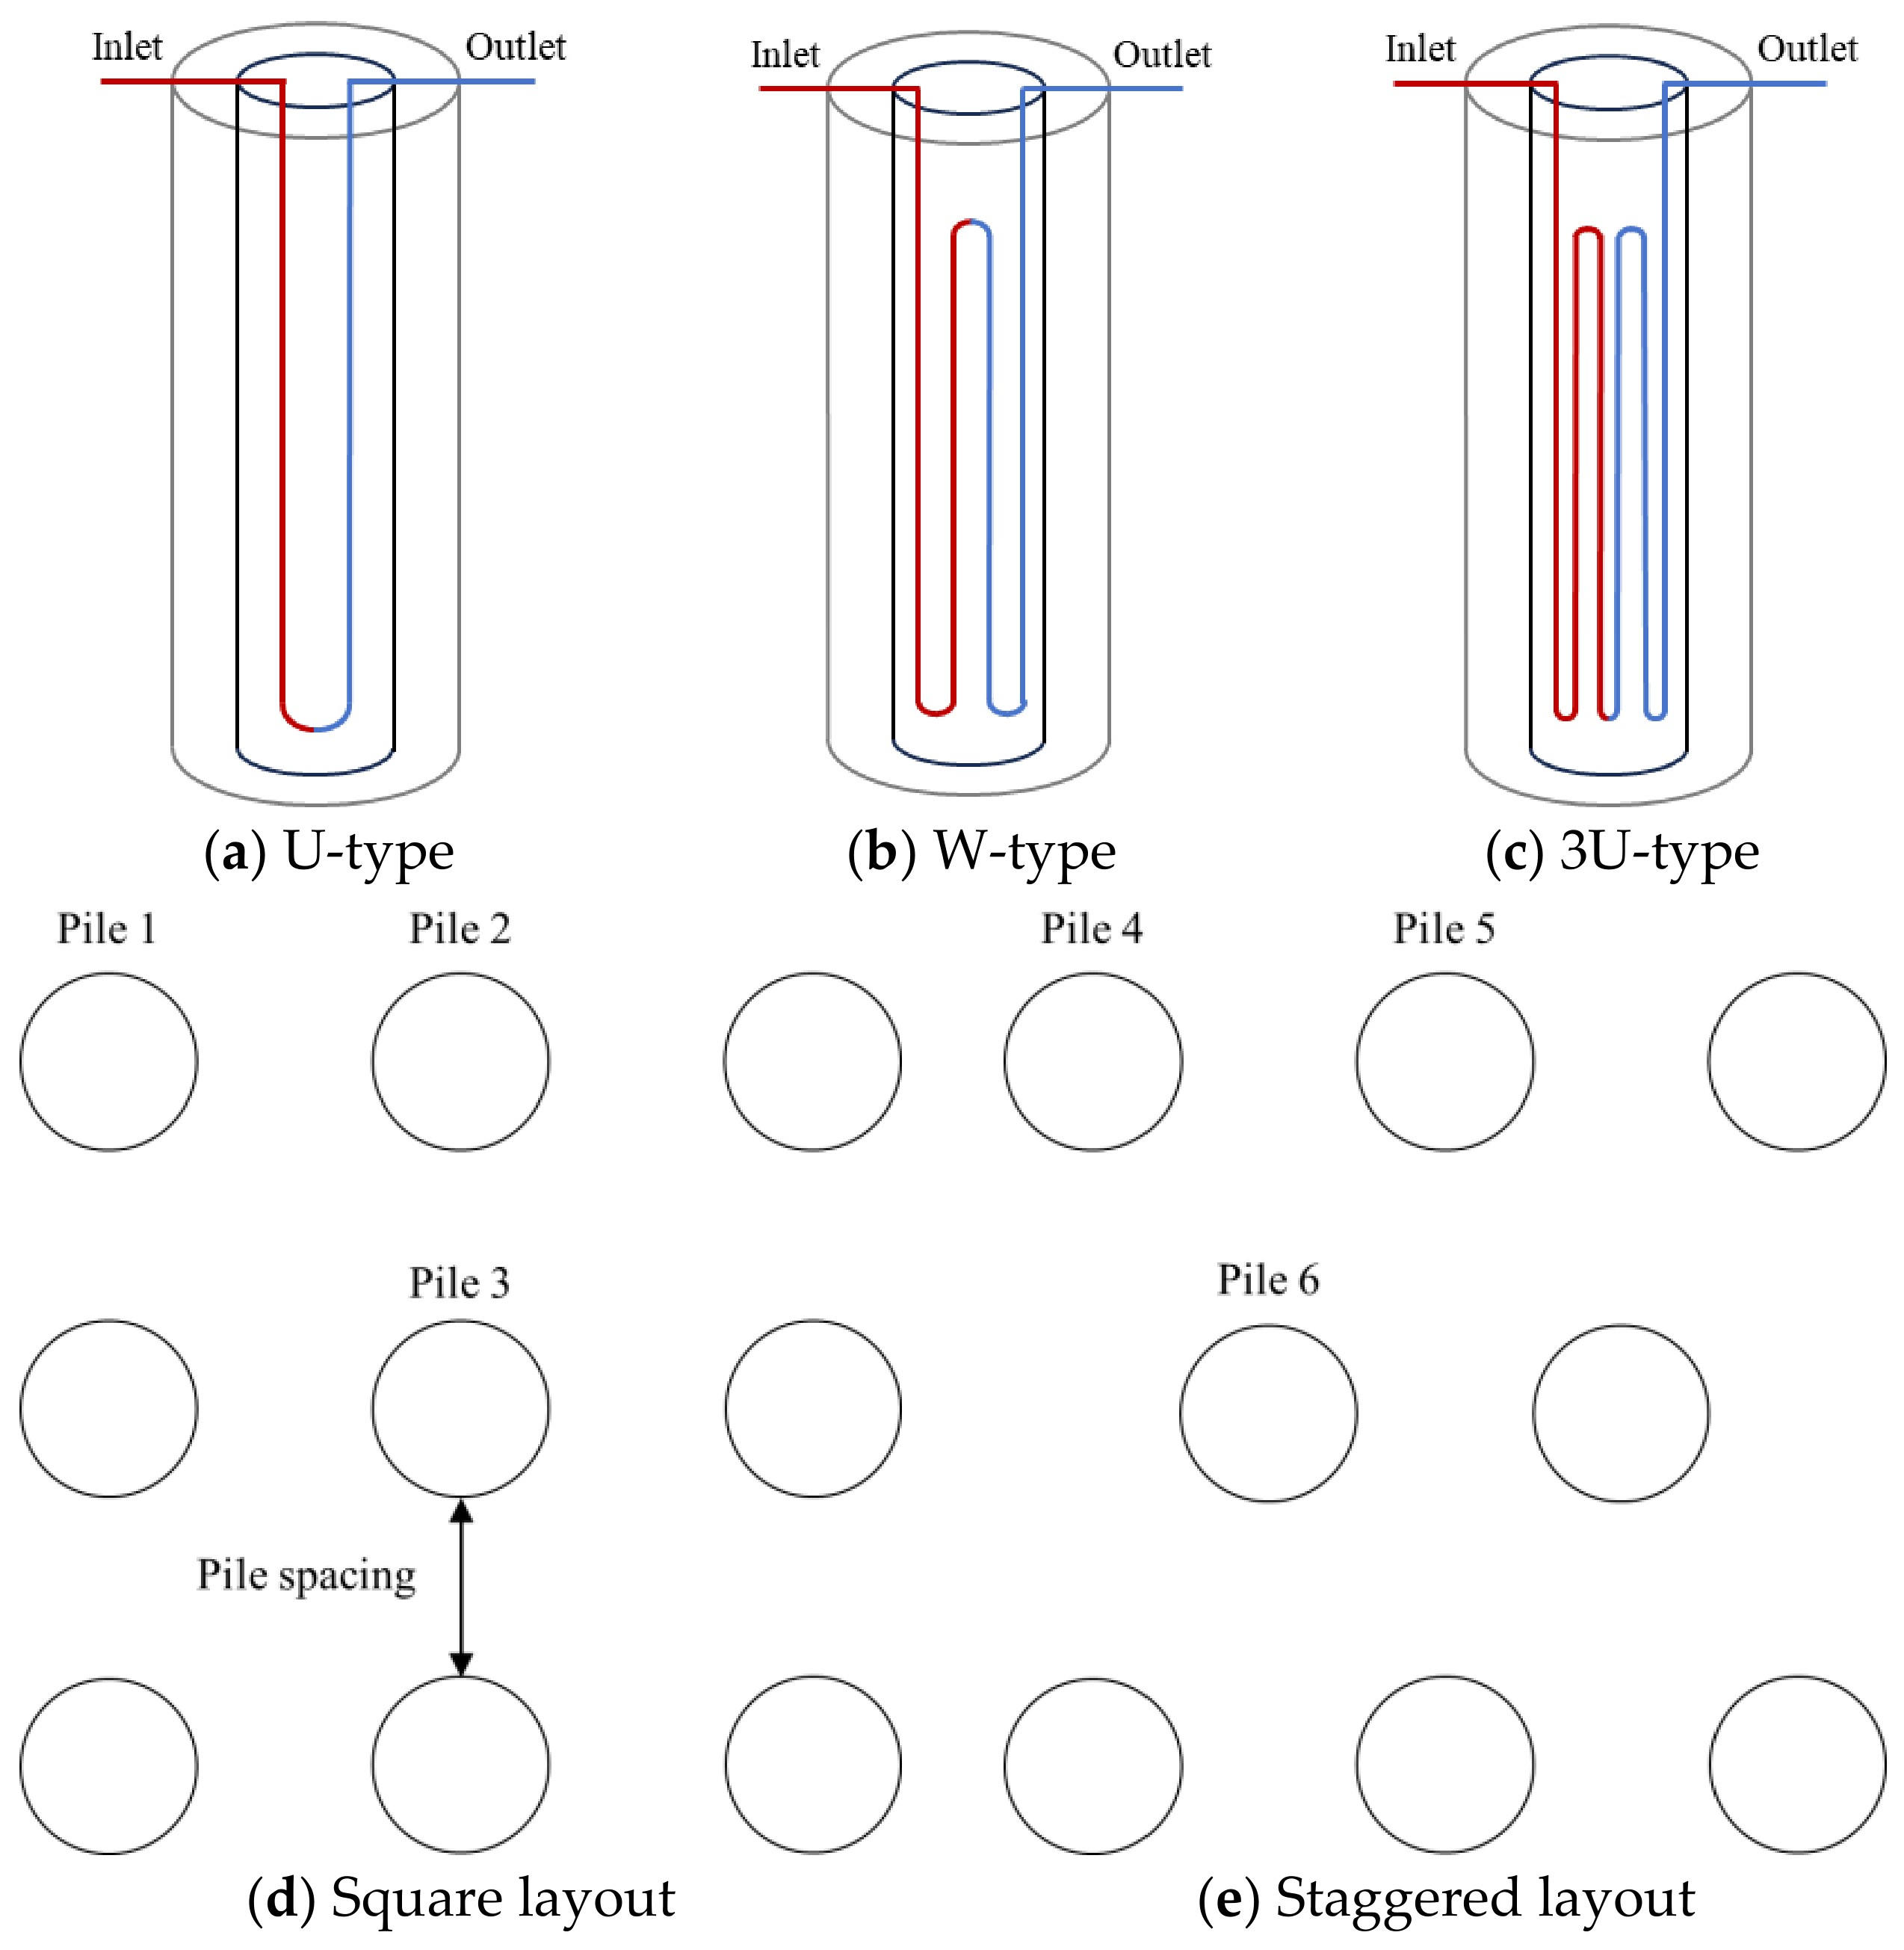
Two group layouts were considered. The square layout consisted of nine piles arranged in a 3 × 3 pattern, whereas the staggered layout consisted of eight piles arranged in a 3–2–3 pattern (Figure 1). For the square layout, piles 1, 2, and 3 were selected to represent different spatial positions within the group, while piles 4, 5, and 6 were selected at corresponding positions in the staggered layout. This arrangement allowed the thermal and mechanical responses of piles subjected to different levels of interference to be compared.
Figure 1.
Numerical models of the energy pile groups: (a) U-type, (b) W-type, (c) 3U-type, (d) square layout, and (e) staggered layout.
The pile, pipe, and surrounding soil were treated as homogeneous and continuous media, and their material properties were assumed to remain constant during each simulation [33]. Groundwater seepage was neglected, such that heat transfer through the pile and surrounding soil was governed primarily by conduction [34]. Heat transfer between the circulating water and the concrete pile was coupled through the pipe wall [36]. Thermal expansion of the concrete pile was included in the mechanical analysis to evaluate pile head displacement resulting from temperature variation and structural loading [37].
For the mechanical analysis, both the concrete pile and the surrounding soil were modeled as linear elastic and isotropic materials. The concrete pile was assigned an elastic modulus of 30 GPa, a Poisson’s ratio of 0.2, and a thermal expansion coefficient of 1 × 10⁻⁵ K−1. The soil was assigned an elastic modulus of 8 MPa, a Poisson’s ratio of 0.3, and a thermal expansion coefficient of 5 × 10⁻⁶ K−1. The pile and soil were constructed using a Form Union geometry, such that displacement continuity was enforced across their shared boundaries; no explicit frictional, cohesive, or slip interface law was activated. Fixed constraints were applied to the external soil boundaries specified in the Solid Mechanics model, and a vertical compressive load of 1776 kN was applied at the pile heads. These assumptions provide a simplified and consistent basis for comparing the relative thermo-mechanical responses of the investigated cases but do not reproduce nonlinear soil behavior or pile–soil interface slip. Linear elastic soil does not represent soil plasticity, stress-dependent stiffness, stiffness degradation, or irreversible deformation. Displacement continuity across the Form Union boundary also excludes relative pile–soil slip, interface separation, and nonlinear interface friction. These simplifications may affect the predicted magnitude of pile head displacement; the model is, therefore, used to compare relative responses under consistent assumptions, without assigning a direction to the possible displacement bias.
Groundwater seepage was neglected in the present model, such that heat transfer in the surrounding ground was treated as conduction-dominated. This assumption was adopted to isolate the effects of pile configuration, spacing, layout, and soil thermophysical properties under a consistent thermal environment. Similar simplifications have been widely adopted in previous energy pile studies. Zhang et al. [38] developed a three-dimensional dynamic model of a double-U energy pile using COMSOL and Abaqus, in which groundwater seepage and temperature-dependent material properties were neglected. Zhao et al. [39] built three-dimensional models of energy piles with double-helix and W-shaped pipes and reproduced field tests in COMSOL Multiphysics. Zarrella et al. [40] compared spiral and 3U energy piles using constant material properties and simplified thermal boundary conditions. Laloui et al. [24] used a fully bonded assumption for thermo-mechanical analysis of energy piles within the service load range, and Knellwolf et al. [25] adopted a perfectly bonded pile–soil interface in simulating the thermo-mechanical response of energy pile groups. Previous studies have also shown that groundwater seepage can alter heat transfer around energy piles [18]. If appreciable groundwater flow is present, advective heat transport may modify both the magnitude and the spatial distribution of the thermal plume and, consequently, the thermal interaction between adjacent piles. Accordingly, the present results should be interpreted as applying to conduction-dominated ground conditions rather than as a universal upper or lower bound on thermal interference. Site-specific hydrogeological conditions should be considered when extending the conclusions to field applications.
To assess the sensitivity of the numerical results to mesh density, a mesh sensitivity check was performed. COMSOL provides nine predefined physics-controlled mesh sizes: Extremely Fine, Extra Fine, Finer, Fine, Normal, Coarse, Coarser, Extra Coarse, and Extremely Coarse. Three representative levels—Fine, Finer, and Extra Fine—were selected, with refinement in the order Fine → Finer → Extra Fine. The group average outlet water temperature and the group average pile head displacement were used as the check indicators. When the mesh was refined from Fine to Finer, the change in the group average outlet water temperature was less than 0.21 °C for all three configurations, corresponding to a relative change of less than 0.7%, and the change in the group average pile head displacement was less than 0.0001 m. These reported variations characterize the Fine-to-Finer comparison; they do not establish convergence for the Finer-to-Extra Fine refinement. The Fine mesh was adopted for subsequent simulations, with element numbers of 110,060, 116,297, and 142,116 for the U-type, W-type, and 3U-type models, respectively.
2.2. Governing Equations
The numerical model accounts for heat transport within the circulating fluid, conductive heat transfer through the pile and surrounding soil, and the mechanical response induced by temperature variation.
The transient energy balance for the circulating water is expressed as:
where ρw is the fluid density, kg/m3; Ap is the pipe cross-sectional area, m2; cw is the specific heat capacity of the circulating fluid, J/(kg·K); Tw is the fluid temperature, K; t is time, s; uw,i is the mean fluid velocity along the pipe, m/s; s is the coordinate along the pipe, m; λw is the thermal conductivity of the fluid, W/(m·K); and qp is the heat transferred through the pipe wall per unit pipe length, W/m.
The general conservation equation for transport of a scalar variable can be written as:
where ρ is the fluid density, kg/m3; ϕ is a general transported variable; U is the fluid velocity vector, m/s; Γϕ is the diffusion coefficient corresponding to ϕ; and Sϕ is the associated source term. The units of ϕ, Γϕ, and Sϕ depend on the specific conservation equation. According to the definition of ϕ, Equation (2) can be used to represent the conservation equations for fluid flow and heat transport.
Heat conduction within the concrete pile and surrounding soil is described by:
where ρ is the density of the pile or surrounding soil, kg/m3; c is the specific heat capacity, J/(kg·K); T is the material temperature, °C; and λ is the thermal conductivity, W/(m·K).
The mechanical response of the pile–soil system was governed by the momentum balance equation:
For the linear thermoelastic materials adopted in the present model, the constitutive relation was expressed as:
where is the stress tensor, b is the body force vector per unit volume, is the material density, is the displacement vector, C is the elasticity tensor, is the strain tensor, is the coefficient of thermal expansion, is the calculated temperature, is the reference temperature, and is the second-order identity tensor. The transient temperature field obtained from the thermal analysis was transferred to the Solid Mechanics interface through the thermal expansion term.
2.3. Initial and Boundary Conditions
The initial temperature of the soil and pile domains was set uniformly to 18.2 °C, consistent with the initial condition used in the COMSOL model. No depth-dependent sinusoidal initial-temperature profile was imposed.
The ground surface was treated as an adiabatic boundary, while constant-temperature conditions were imposed on the lateral and bottom boundaries to represent the far-field thermal environment. The adiabatic surface assumption excludes heat exchange associated with surface convection, radiation, and solar radiation and was adopted to focus the analysis on subsurface heat transfer and pile-to-pile thermal interaction during the investigated 700 h period. Accordingly, the reported results should be interpreted under this idealized surface boundary condition rather than as a representation of complete seasonal ground–atmosphere heat exchange. At the pipe–pile interface, heat exchange was transferred through the pipe wall, while the fluid outlet was defined using a pressure boundary.
The group simulations were performed under summer heat rejection conditions [41]. The inlet water temperature was maintained at 35 °C, and the volumetric flow rate was set to 0.342 m3/h. A center-to-center spacing of 2.6 m was adopted as the reference group spacing, except in the spacing study where this parameter was systematically varied. Identical thermal operating conditions were imposed on the U-type, W-type, and 3U-type groups.
For the structural calculation, a vertical compressive load of 1776 kN was applied at the pile heads, while the external mechanical constraints were prescribed as described in Section 2.1. To clarify the relative level of the applied mechanical load, the pile load calculation was formulated with reference to the shaft- and end-resistance framework in the Technical Code for Building Pile Foundations (JGJ 94-2008) [42]. The following simplified expression was adopted for the present model:
where is the vertical load applied at the pile head (N); L is the pile length (m); D is the pile diameter (m); η is the dimensionless load proportion; and b is the load calculation coefficient related to pile length. The calculation uses π = 3.14, and b is defined as follows:
For the present pile, L = 25.5 m, D = 0.6 m, and b = 2400. A load proportion of η = 1 corresponds to the ultimate load level estimated by this expression, giving a calculated axial ultimate bearing capacity of 1953.24 kN. The applied load of 1776 kN, therefore, corresponds to a load ratio of 1776/1953.24 = 0.909, i.e., approximately 90.9% of the calculated ultimate bearing capacity. The temperature field obtained during the transient thermal calculation was coupled to the Solid Mechanics interface through thermal expansion, thereby enabling the spatial differences in pile head displacement within the group to be evaluated.
2.4. Material Properties and Simulation Cases
The pile group models were discretized using tetrahedral elements, with increased mesh density in the vicinity of the piles, embedded pipes, and inter-pile soil. Particular attention was given to the soil region enclosed by adjacent piles because this region governs the development and overlap of the thermal influence zones. Transient calculations were performed over 700 h to capture the progressive development of thermal interference during continuous summer heat rejection. Temperature fields were recorded at 100, 250, 500, and 700 h to examine the evolution of thermal interference. These temperature fields show expanding thermal influence zones, increasing overlap, and accumulating heat between piles. The outlet water temperature histories show that group and isolated U-type responses begin to separate after approximately 50 h, while the W-type group effect becomes more apparent after approximately 200 h; central pile differences are clearly evident by 700 h. This operating window captures the development of pile-to-pile interaction but does not represent a full seasonal cycle, seasonal equilibrium, or multi-year behavior.
The basic thermophysical properties used in the simulations are listed in Table 1. Constant properties were adopted within each material domain during a given calculation.
Table 1.
Thermophysical properties used in the numerical model.
The numerical investigation was organized into three groups of cases corresponding to the principal factors controlling thermal interaction in the pile foundation. The first group examined the effect of center-to-center pile spacing for the U-type, W-type, and 3U-type configurations. Using the reference spacing of 2.6 m as the center, the spacing was varied at intervals of 0.5 m in both directions, yielding seven values: 2.1, 2.6, 3.1, 3.6, 4.1, 4.6, and 5.1 m. For each spacing, the outlet water temperatures and pile head displacements of piles at representative locations were extracted together with the surrounding soil temperature field.
The second group of simulations examined the influence of pile arrangement. A nine-pile square configuration and an eight-pile staggered configuration were established using the same individual-pile geometry and operating conditions. Corresponding piles at edge, intermediate, and inner locations were selected from the two layouts, allowing the influence of spatial position and number of neighboring piles to be assessed independently of the single-pile geometry.
The third group focused on the thermophysical characteristics of the surrounding soil. The soil property study focused on the central pile of the 3U-type group. The ranges of thermal conductivity, specific heat capacity, and density were selected with reference to the thermophysical properties of clay reported in the 2003 ASHRAE Handbook—HVAC Applications [43] and the numerical study of deep-buried pipe energy piles by Ruan [35]. The same ranges were adopted by Ruan [35] to represent typical clay conditions. Thermal conductivity was varied from 1.0 to 1.4 W/(m·K), specific heat capacity from 900 to 1300 J/(kg·K), and density from 1725 to 2125 kg/m3.
The overall parametric matrix is summarized in Table 2.
Table 2.
Parameter values used in the parametric simulations.
3. Results and Discussion
3.1. Model Validation
The thermal response of the pile group model was evaluated against the field thermal performance test reported by You et al. [44]. The benchmark experiment was conducted on three parallel-connected concrete-filled gravel (CFG) energy piles equipped with W-type heat exchangers. The numerical validation model reproduced the principal geometric, thermal, and operating conditions of the field test.
The computational soil domain was 14 m × 10 m × 25 m. Each pile had a diameter of 0.42 m and a length of 18 m. The embedded heat exchange pipes had an outer diameter of 0.025 m, an embedment depth of 17.5 m, a wall thickness of 0.004 m, and a pipe spacing of 0.08 m. A constant inlet water temperature of 35 °C and a flow velocity of 0.51 m/s were imposed. The thermal conductivity and specific heat capacity of the surrounding soil were set to 2.63 W/(m·K) and 3000 J/(kg·K), respectively, in accordance with the experimental conditions. The upper boundary of the ground domain was treated as adiabatic, whereas the lateral and bottom boundaries were maintained at the prescribed far-field temperature.
The central pile of the three-pile system was selected for comparison because it was subjected to thermal interaction from the adjacent piles. In the numerical calculation, the outlet water temperature increased rapidly during the initial operating period and then gradually approached a quasi-steady value. With the inlet temperature maintained at 35 °C, the predicted outlet temperature stabilized at approximately 32.85 °C, corresponding to an inlet–outlet temperature difference of 2.15 °C (Table 3).
The field test reported a heat transfer rate of 2070 W for the central pile. Based on the circulating water flow conditions, this value corresponds to an experimental inlet–outlet temperature difference of 1.96 °C. The numerical result gives an inlet–outlet temperature difference of 2.15 °C, compared with 1.96 °C derived from the field test. The absolute difference was 0.19 °C, corresponding to a relative deviation of approximately 9.7%. This comparison provides validation of the thermal response used in the subsequent thermal interference analyses. Because this field dataset does not contain corresponding mechanical measurements, a supplementary single-pile mechanical validation is presented below.
Table 3.
Comparison between the experimental and numerical results for model validation.
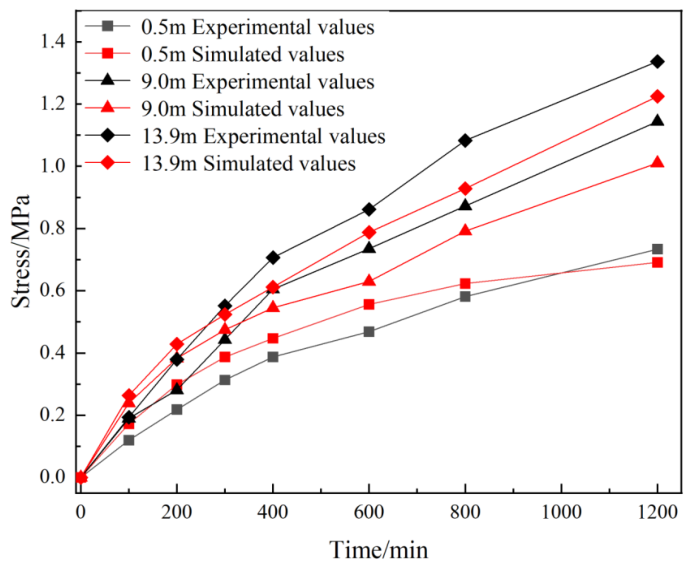
To evaluate the applicability of the thermo-mechanical model to the mechanical response of energy piles, a supplementary validation was conducted against the field test reported by Zhao et al. [39]. The test involved a double-helix-type energy pile, and pile stresses at depths of 0.5 m, 9.0 m, and 13.9 m were reported. The numerical model was established using the same pile geometry, material properties, initial temperature, and thermal loading conditions as those in the field test. As shown in Figure 2, the calculated pile stress increased with rising pile temperature and tended to level off when the temperature stabilized, consistent with the measured trend. For a quantitative comparison, the final values at 1200 min are approximately 0.73 MPa (measured) and 0.69 MPa (simulated) at 0.5 m, 1.14 and 1.01 MPa at 9.0 m, and 1.34 and 1.22 MPa at 13.9 m, corresponding to relative differences of approximately 5.5%, 11.4%, and 9.0%, respectively. The simulated stress histories, therefore, reproduce the measured temporal trends and the stress levels at the three monitoring depths with deviations of about 5–11% at the final time. This supplementary benchmark supports the mechanical formulation at the single-pile stress response level; it does not directly validate pile group mechanical interaction or pile head displacement.
Figure 2.
Comparison of measured and simulated pile stresses at different depths for the double-helix-type energy pile.
3.2. Thermal Interference and Thermo-Mechanical Response of Energy Pile Groups
Before comparing the thermal responses, the pipe length, loop flow rate, and heat exchange rate per unit pipe length are summarized in Table 4. The total pipe length is 51 m for the U-type, 102 m for the W-type, and 153 m for the 3U-type configuration, assuming that the active vertical length equals the pile length of 25.5 m and neglecting the bend length. The total mass flow rate is 0.0950 kg/s. For the 3U-type configuration, which consists of three parallel loops, the mass flow rate per loop is 0.0317 kg/s, whereas the U-type and W-type configurations each use a single loop with the full mass flow rate of 0.0950 kg/s. The total heat exchange rate Qtotal is calculated as Qtotal = mtotalcw(Tin − Tout), and the heat exchange rate per unit pipe length is q′ = Qtotal/Ltotal. At 700 h, the U-type pile exhibits the highest q′ (29.4 W/m for the central pile and 32.7 W/m for the isolated pile), followed by the W-type (16.9 and 20.6 W/m), while the 3U-type pile shows the lowest q′ (12.2 and 14.8 W/m). This indicates that increasing the embedded pipe length improves the total heat exchange but reduces the heat exchange efficiency per unit pipe length.
Table 4.
Pipe length, loop flow rate, and heat exchange rate per unit pipe length for the investigated configurations.
3.2.1. Evolution of Thermal Interference
The development of thermal interference was examined from the transient temperature fields of the U-type, W-type, and 3U-type pile groups. As shown in Figure 3, the thermal disturbance was initially concentrated around each pile and gradually propagated into the surrounding soil. With continued heat rejection, the thermal influence zones of adjacent piles expanded and began to overlap, resulting in progressive heat accumulation within the inter-pile region.
In this study, the thermal influence radius is defined as the radial distance from the pile center at which the soil temperature rise reaches ΔT = 0.5 °C. The radial temperature-rise profile was extracted at a representative depth of 15 m, and the distance corresponding to ΔT = 0.5 °C was identified as the thermal influence radius. The region with ΔT ≥ 0.5 °C is, therefore, treated as thermally affected. All thermal influence radii reported below are based on this criterion.
For the U-type group, using this criterion, the approximate radius of thermal influence was 0.4 m at 100 h and increased to about 0.9 m at 250 h. After 700 h of operation, it exceeded 1.2 m, and most of the soil between adjacent piles showed a temperature increase of approximately 2 °C. The W-type group exhibited a broader thermal influence zone, increasing from approximately 0.6 m at 100 h to 1.0 m at 250 h and exceeding 1.4 m at 700 h. The temperature rise over much of the inter-pile soil was approximately 1.5 °C at the end of the simulation. For the 3U-type group, the corresponding influence radii were approximately 0.6 and 0.8 m at 100 and 250 h, respectively, and exceeded 1.4 m at 700 h. A larger temperature rise, approximately 4 °C over much of the inter-pile region, was observed in this case.
Figure 3.
Evolution of the soil temperature field in the energy pile groups: (a–d) U-type, (e–h) W-type, and (i–l) 3U-type at 100, 250, 500, and 700 h.
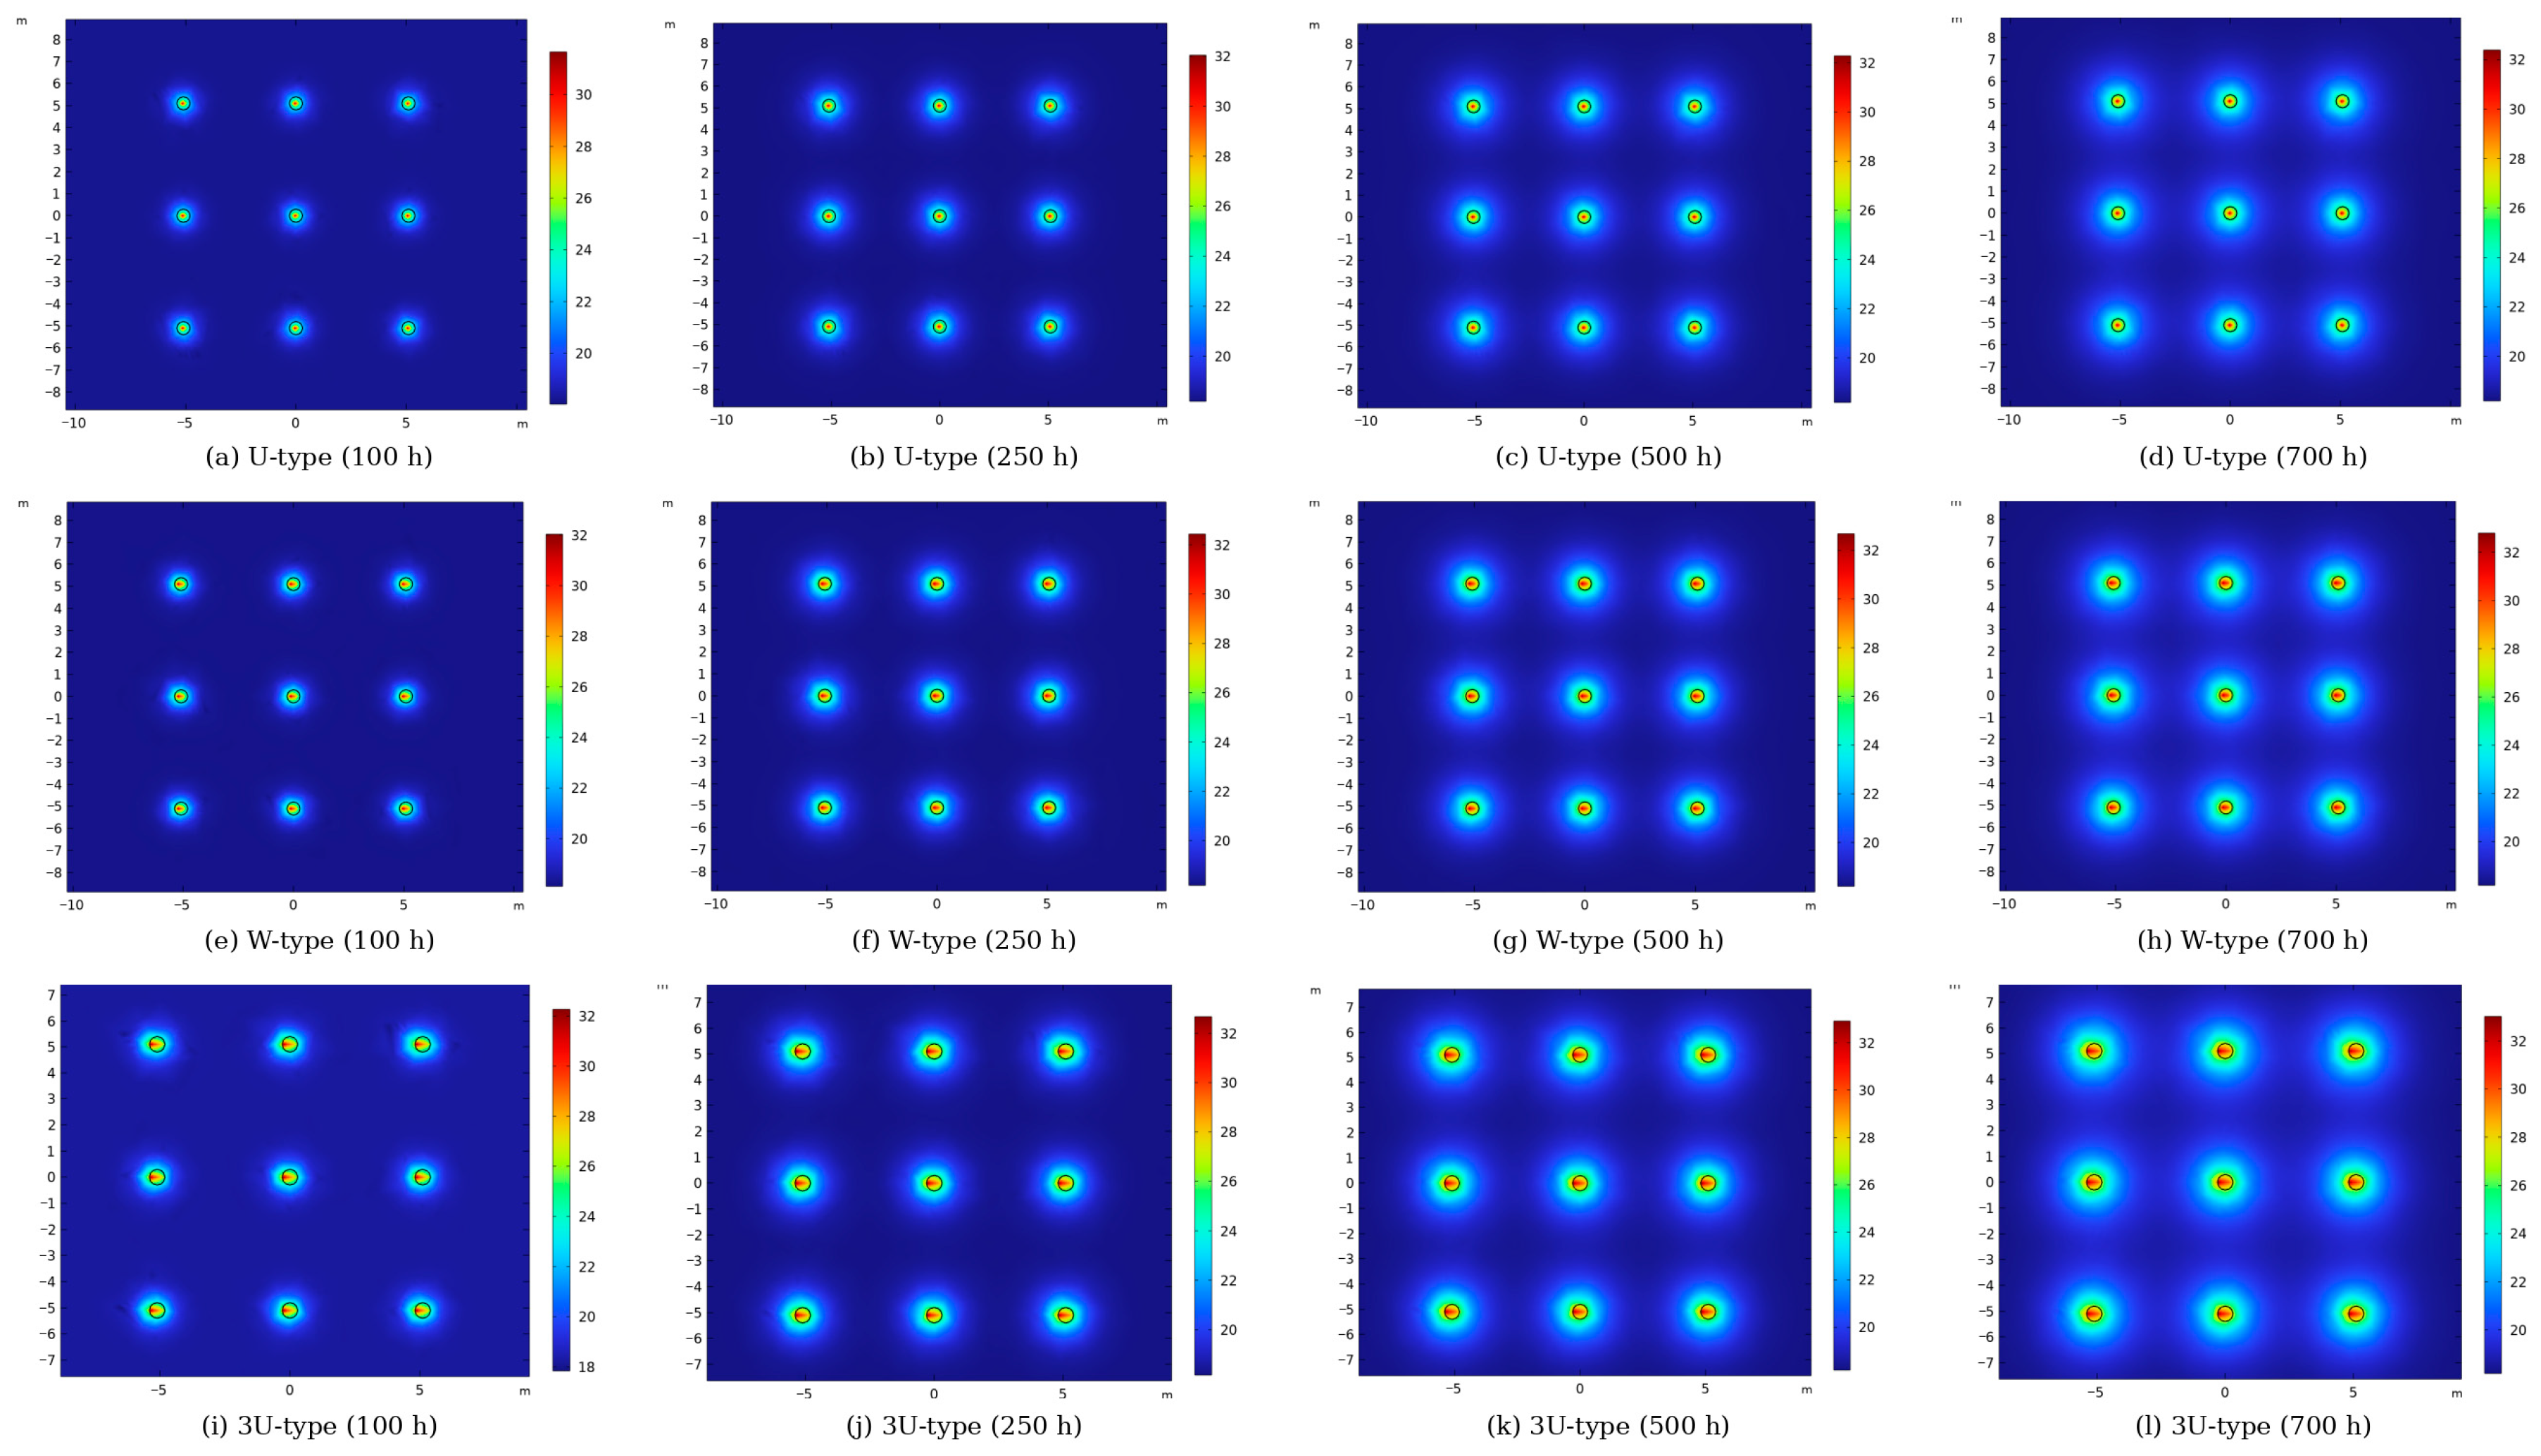
These results indicate that thermal interference develops progressively rather than immediately after system start-up. During the early operating period, each pile primarily interacts with the soil in its immediate vicinity. As the affected region expands, the undisturbed soil volume between neighboring piles decreases, and the individual thermal fields begin to merge. Consequently, the ground surrounding an inner pile becomes progressively warmer under summer heat rejection conditions, reducing the temperature difference available for further heat transfer.
The outlet water temperature histories provide further evidence of this interaction (Figure 4). For the U-type group, the responses of piles 1–3 were nearly indistinguishable from that of the isolated pile during the initial operating period, but they gradually separated after approximately 50 h. At 700 h, the outlet temperatures of piles 1, 2, and 3 were 30.835, 30.979, and 31.180 °C, respectively, compared with 30.743 °C for the isolated pile. The outlet temperature of the central pile was, therefore, 0.437 °C higher than that of the corresponding isolated pile.
A stronger group effect was obtained for the W-type configuration. The outlet temperature differences became more apparent after approximately 200 h, and values of 30.138, 30.340, and 30.610 °C were obtained for piles 1, 2, and 3 at 700 h. Under the same operating conditions, the isolated W-type pile reached 29.654 °C, giving a central pile deviation of 0.956 °C. For the 3U-type group, the outlet temperatures at 700 h were 29.672, 29.939, and 30.252 °C for piles 1, 2, and 3, respectively, whereas the isolated pile reached 29.208 °C. The central pile outlet temperature was thus 1.044 °C higher than the isolated pile value.
Figure 4.
Outlet water temperature histories of representative piles and the corresponding isolated piles: (a) U-type, (b) W-type, and (c) 3U-type.
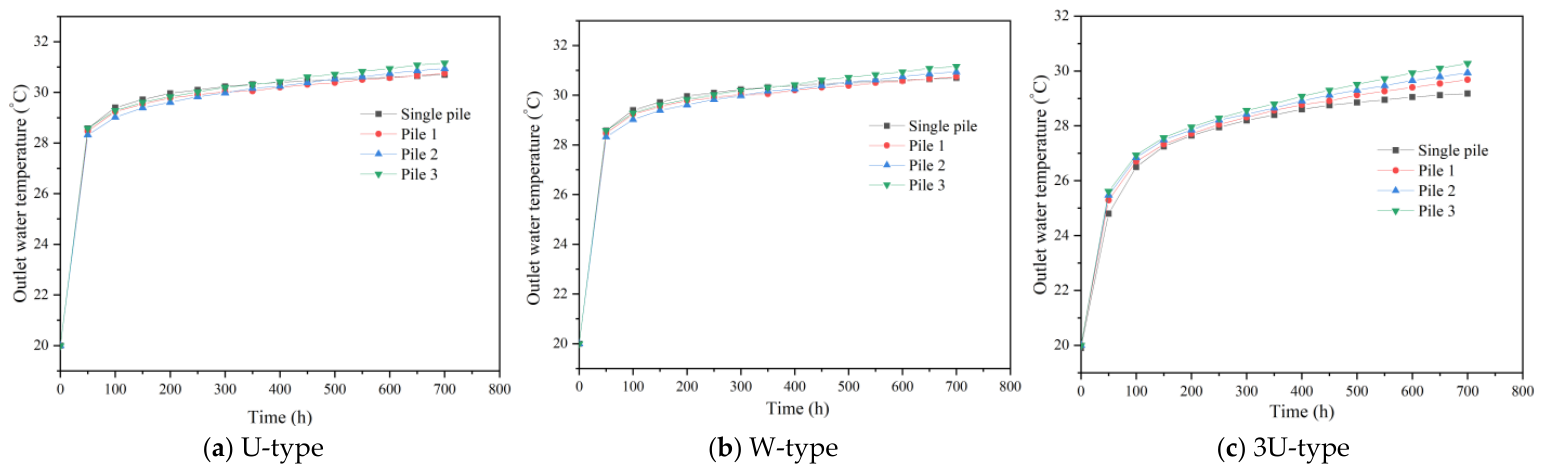
Because the inlet temperature and flow conditions were maintained within each comparison, an increase in outlet temperature under summer heat rejection conditions reflects a reduction in the temperature drop of the circulating water and hence a deterioration of the pile’s heat rejection capability. The deviation between the central pile and the corresponding isolated pile increased from the U-type to the W-type and then to the 3U-type configuration. This comparison shows that a pile configuration with stronger heat transfer capability can also impose a stronger thermal disturbance on the shared ground volume when several piles operate simultaneously.
To compare the degree of thermal interference among different pipe configurations on a normalized basis, a group heat exchange retention ratio RQ and a thermal interference index IQ are defined as:
where Qgroup is the average heat exchange rate per pile in the group, calculated from the outlet water temperatures of all piles via , and Qsingle is the heat exchange rate of the corresponding isolated pile with the same heat exchanger configuration, pile geometry, pipe geometry, material and soil properties, inlet water temperature, total mass flow condition, and simulation time, but without neighboring pile thermal interaction. RQ = 1 (i.e., IQ = 0) indicates that group operation causes no additional heat exchange degradation; a smaller RQ (larger IQ) indicates stronger thermal interference. This dimensionless index compares the average per-pile group response with its corresponding isolated pile reference. It supports comparisons between the investigated configurations and spacings but does not remove the combined effects of pile number and spatial arrangement in the square–staggered system comparison.
For the 3 × 3 square group at the reference spacing of 2.6 m and 700 h, using the geometric symmetry Qgroup = (4Q1 + 4Q2 + Q3)/9, the computed IQ values are approximately 4.6% for the U-type, 11.7% for the W-type, and 11.2% for the 3U-type group. These results confirm that both the W-type and 3U-type groups experience substantially greater normalized heat transfer degradation than the U-type group, while the relative ordering between W-type and 3U-type differs slightly from that based on the absolute outlet temperature deviation.
3.2.2. Effects of Pile Position and Pipe Configuration
The thermal response within a pile group was clearly dependent on spatial position. For all three heat exchanger configurations, the outlet temperature increased from the outer pile toward the center of the group. At 700 h, the difference between piles 1 and 3 was approximately 0.345 °C for the U-type group, 0.472 °C for the W-type group, and 0.580 °C for the 3U-type group.
This positional dependence can be attributed to the different thermal environments surrounding individual piles. The central pile is enclosed by a larger number of thermally active neighboring piles and, therefore, has less access to relatively undisturbed ground. In contrast, piles near the perimeter can transfer heat toward the external soil domain where the temperature disturbance is weaker. The thermal performance of a pile within a group should, therefore, not be represented solely by a group average response, particularly when inner and outer piles experience distinctly different surrounding ground conditions.
To quantify the position-dependent thermal interference, the outlet water temperature deviation is defined as ΔTout,i = Tout,i − Tout,isolated, where Tout,i is the outlet water temperature of pile i in the group and Tout,isolated is that of the corresponding isolated pile at the same operating time. Because the inlet temperature and flow condition are identical within each comparison, a larger ΔTout,i indicates a greater reduction in the fluid temperature drop and, therefore, stronger group-induced thermal interference. For the 3U-type group at 700 h, ΔTout,i is 0.464 °C for the edge pile, 0.731 °C for the intermediate pile, and 1.044 °C for the central pile. The monotonic increase from the group perimeter toward the centre quantitatively confirms that the central pile is exposed to the most strongly disturbed thermal environment and has less access to relatively undisturbed ground.
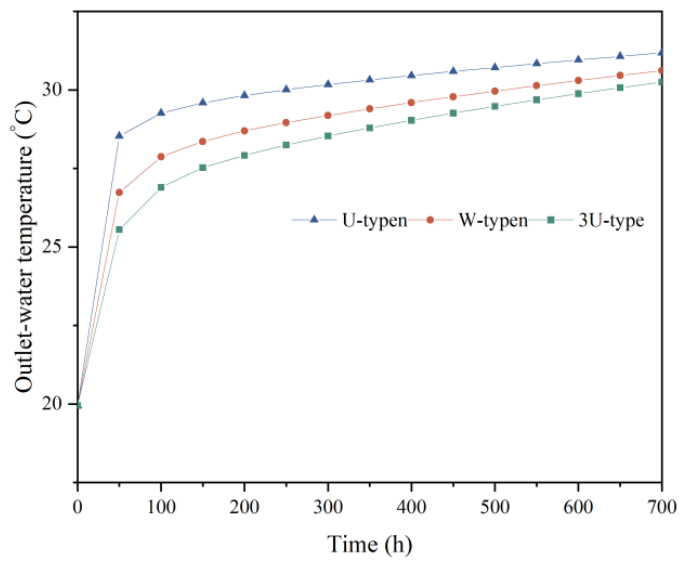
Comparison of the three central piles further demonstrates the effect of embedded pipe configuration. As shown in Figure 5, the U-type pile exhibited the highest outlet temperature, followed by the W-type pile, whereas the 3U-type pile maintained the lowest outlet temperature over most of the operating period. Under the prescribed summer operating conditions, the 3U-type arrangement, therefore, provided the strongest heat rejection capability among the three configurations. However, its relatively large difference from the corresponding isolated pile response also indicates a greater sensitivity to neighboring pile interference. Thus, the thermal advantage of increasing the embedded heat exchange area is partly offset by stronger interaction with the surrounding pile group.
Figure 5.
Comparison of outlet water temperatures of the central piles for the U-type, W-type, and 3U-type groups.
Thermal interaction was also reflected in pile deformation. Figure 6e presents the displacement histories over the full 700 h simulation and shows that the pile head displacement entered a slowly varying stage after approximately 100 h. The 100 h displacement distributions in Figure 6a–d are, therefore, retained only for the spatial comparison among pile positions and heat exchanger configurations, whereas the pile spacing analysis in Section 3.3 uses the displacement results at 700 h. This distinction is made explicitly to avoid interpreting the 100 h snapshot as the final mechanical response. For the U-type group, the pile head displacements of piles 1, 2, and 3 were 5.713, 6.152, and 6.651 mm, respectively. The corresponding values were 5.913, 6.339, and 7.401 mm for the W-type group and 6.050, 6.487, and 6.981 mm for the 3U-type group.
Figure 6.
Pile head displacement of the energy pile groups: (a–c) displacement distributions of the U-type, W-type, and 3U-type groups; (d) comparison of representative pile positions; and (e) displacement histories of the central piles.
Within each pile group, the central pile consistently exhibited a larger displacement than the intermediate and edge piles. The same spatial ordering was observed in the outlet temperature results, confirming that the non-uniform thermal environment within the group is accompanied by a non-uniform deformation response. The differences between inner and outer piles, therefore, represent an important thermo-mechanical consequence of thermal interference.
The effect of pipe configuration on pile head displacement did not follow the same ranking as the outlet water temperature. At 100 h, the central pile displacements were 6.651 mm for the U-type, 7.401 mm for the W-type, and 6.981 mm for the 3U-type groups. In contrast, the 3U-type pile maintained the lowest outlet water temperature and, therefore, the greatest heat rejection under the prescribed operating condition. This difference does not indicate an inconsistency between the thermal and mechanical results because the two quantities describe different aspects of the system response. For a fixed inlet temperature and flow rate, the outlet water temperature mainly reflects the net heat rejected by the circulating fluid, whereas pile head displacement is governed by the thermoelastic response of the entire pile–soil system. The local thermal strain depends on the spatial temperature field, while the final displacement is also affected by the stiffness contrast between pile and soil, the applied axial load, and the restraint provided by the pile–soil interface and external boundaries. Therefore, a lower outlet water temperature does not necessarily correspond to a larger pile head displacement. The present results illustrate this distinction: although the 3U-type configuration rejects more heat overall, the W-type configuration produces the largest central pile displacement at 100 h.
Overall, the results demonstrate two characteristic features of energy pile groups. Thermal interference intensifies with operating time as the temperature fields of neighboring piles overlap, and its magnitude varies systematically with pile position. At the same time, the embedded pipe configuration modifies both the heat transfer response and the associated pile deformation. These observations provide the basis for the following assessment of pile spacing, which directly controls the extent to which neighboring thermal influence zones interact.
3.3. Effect of Pile Spacing on Thermal Interference and Thermo-Mechanical Response
Pile spacing directly determines the extent to which the thermal influence zones of neighboring piles overlap. To quantify this effect, the center-to-center spacing was varied around the reference value of 2.6 m at intervals of 0.5 m, resulting in seven spacings from 2.1 to 5.1 m (2.1, 2.6, 3.1, 3.6, 4.1, 4.6, and 5.1 m), while the remaining operating conditions were unchanged. The temperature fields, outlet water temperatures, and pile head displacements obtained after 700 h were compared for the U-type, W-type, and 3U-type groups.
As shown in Figure 7, closely spaced piles produced extensive overlap of the heated soil regions. At a spacing of 2.1 m, the temperature rise in the inter-pile soil reached approximately 6–7 °C for both the U-type and W-type groups. As the spacing increased, the high-temperature regions surrounding adjacent piles became progressively separated and the temperature of the soil enclosed by the pile group decreased. Beyond approximately 4.1 m, further increases in spacing produced comparatively small changes in the overall temperature field pattern, and the temperature increase over parts of the inter-pile soil remained below approximately 1.5 °C.
Figure 7.
Soil temperature distributions of the energy pile groups after 700 h at representative spacings of 2.1, 3.1, 4.1, and 5.1 m: (a–d) U-type, (e–h) W-type, and (i–l) 3U-type groups.
The same dependence was more pronounced for the 3U-type group. At a spacing of 2.1 m, the inter-pile soil temperature increased by approximately 8–9 °C after 700 h, reflecting stronger accumulation of rejected heat within the confined ground volume. Increasing the spacing reduced both the extent and intensity of the heated region. Between approximately 4.1 and 5.1 m, the temperature contours changed only moderately, indicating that neighboring pile interaction had become considerably weaker under the investigated operating conditions.
The outlet water temperature results in Figure 8 provide a quantitative measure of the reduction in thermal interference. For all three configurations, increasing the pile spacing lowered the outlet temperatures of piles 1–3 under summer heat rejection conditions. At small spacings, clear differences were observed among the piles because their surrounding thermal environments differed considerably. The largest difference occurred between the edge and central piles. As the spacing increased, these differences gradually diminished, and the three outlet temperature curves converged.
Figure 8.
Effect of pile spacing on the outlet water temperatures of representative piles after 700 h: (a) U-type, (b) W-type, and (c) 3U-type groups.
For the U-type group, the difference between the edge and central piles was approximately 0.8 °C at small spacing. At a spacing of 4.1 m, the outlet temperatures of the three representative piles approached approximately 30.5 °C and showed only limited variation with further increases in spacing. The W-type group displayed a similar tendency: the pile-to-pile temperature difference decreased as the spacing increased, and the outlet temperatures converged to approximately 30.25 °C around 4.1 m.
The effect was particularly clear for the 3U-type group. At small spacing, the outlet-temperature difference between piles 1 and 3 was approximately 0.9 °C. At 4.1 m, the outlet temperatures converged to approximately 29.1 °C, close to the corresponding isolated pile value of approximately 29.2 °C reported under the same operating condition. Further increases in spacing caused little additional change.
The convergence of outlet temperatures with increasing spacing has two implications. The overall heat rejection performance improves because each pile interacts with a larger volume of relatively undisturbed ground, while the thermal response also becomes more uniform across different pile positions. The latter effect is particularly relevant to the central pile, which experiences the strongest interference when the pile spacing is small. The results, therefore, show that increasing pile spacing mitigates both the magnitude and spatial non-uniformity of group thermal interaction.
The mechanical response exhibited a corresponding dependence on pile spacing. As shown in Figure 9, the pile head displacements of all three representative piles decreased as the spacing increased. For the U-type central pile, the displacement decreased from 7.866 mm at 2.1 m to 5.218 mm at 5.1 m. The corresponding central pile displacement of the W-type group decreased from 8.093 to 5.419 mm. For the 3U-type group, the displacement decreased from 8.227 mm at 2.1 m to 5.560 mm at 5.1 m.
Figure 9.
Effect of pile spacing on pile head displacement after 700 h: (a) U-type, (b) W-type, and (c) 3U-type groups.
Increasing the spacing also reduced, although did not eliminate, the positional difference in pile displacement. For the U-type group, the displacement difference between the edge and central piles decreased from approximately 1.05 mm at 2.1 m to 0.958 mm at 5.1 m. The corresponding values for the W-type group decreased from 1.045 to 0.958 mm, while those for the 3U-type group decreased from approximately 1.04 to 0.97 mm. This indicates that wider pile spacing weakens the additional deformation associated with thermal interaction, although differences arising from the spatial position of individual piles remain present.
Comparison of the central piles further shows that the sensitivity to spacing depends on heat exchanger configuration. With increasing spacing, the outlet temperature decreased for all three cases, with the 3U-type configuration exhibiting the strongest heat rejection performance, followed by the W-type and U-type configurations. In the 700 h spacing analysis, the central pile displacement followed the order 3U-type > W-type > U-type. The thermal and mechanical responses, therefore, do not vary independently: reducing thermal interaction by increasing pile spacing simultaneously modifies the ground temperature field and the thermally induced pile deformation.
To provide a quantitative criterion for the spacing effect, the normalized thermal-interference index IQ was evaluated at each spacing. The magnitude of the change in IQ between two adjacent spacing levels is denoted ΔIQ. An absolute change of less than 0.01 in this dimensionless index (one percentage point when IQ is expressed as a percentage) is used as an author-defined, study-specific criterion for a diminishing marginal benefit from further spacing increases. It is neither a generally accepted engineering limit nor a design code or universal threshold.
Based on the outlet water temperatures at 700 h, the computed ΔIQ values for the U-type, W-type, and 3U-type groups decrease as the spacing increases. When the spacing exceeds approximately 4.1 m, the ΔIQ between adjacent spacing levels falls below 0.01 in absolute index units for all three configurations, and the IQ curves tend to flatten. Accordingly, the range 4.1–5.1 m is identified as the interval in which the marginal effect of increasing spacing on thermal interference becomes small under the present geometry, soil parameters, and 700 h summer heat rejection conditions.
This range should not be interpreted as a universal design threshold because the extent of thermal interaction also depends on pile dimensions, operating duration, heat rejection, and soil properties. Nevertheless, within the investigated cases, spacing was an effective geometric parameter for limiting thermal field overlap and reducing the thermo-mechanical interaction among neighboring piles.
3.4. System-Level Comparison of Square and Staggered Pile Groups
Pile arrangement changes the number and relative positions of neighboring heat sources and, therefore, modifies the spatial development of thermal interference. The square 3 × 3 arrangement was compared with the staggered 3−2−3 arrangement under the same operating conditions. Representative piles 1–3 in the square group were compared with piles 4–6 at corresponding edge, intermediate, and inner positions in the staggered group. Because the square group contains nine piles and the staggered group eight, this is a system-level comparison: both pile number and spatial arrangement vary, so their individual contributions cannot be isolated.
The temperature fields in Figure 10 show that the two layouts produced different distributions of accumulated heat within the inter-pile soil. For all three heat exchanger configurations, relatively low-temperature regions remained between some neighboring piles in the square arrangement at 500 h and were still visible at 700 h. In contrast, the staggered arrangement produced a more spatially uniform temperature field within the pile group by the later stage of operation. This tendency was observed for the U-type, W-type, and 3U-type cases.
Figure 10.
Comparison of soil temperature fields for square and staggered pile layouts: (a,b) U-type, (c,d) W-type, and (e,f) 3U-type groups at 700 h.
The more uniform soil temperature distribution of the staggered arrangement did not, however, correspond to uniformly lower outlet water temperatures (Figure 11). For the U-type group, the outlet temperatures at 700 h were 30.835, 30.979, and 31.180 °C for piles 1–3 in the square arrangement, compared with 30.798, 31.023, and 31.271 °C for piles 4–6 in the staggered arrangement. Thus, the staggered edge pile showed a slightly lower outlet temperature, whereas the intermediate and inner piles exhibited slightly higher values.
The same positional pattern was obtained for the W-type group. The square arrangement produced outlet temperatures of 30.138, 30.340, and 30.610 °C for piles 1–3, whereas the corresponding values for the staggered arrangement were 30.099, 30.464, and 30.694 °C. For the 3U-type group, the square-layout values were 29.672, 29.939, and 30.252 °C, compared with 29.624, 30.098, and 30.354 °C for the staggered group. In all three configurations, therefore, the staggered arrangement slightly reduced the outlet temperature of the outermost pile but increased that of the intermediate and inner piles.
Figure 11.
Outlet water temperatures of representative piles under square and staggered layouts after 700 h.
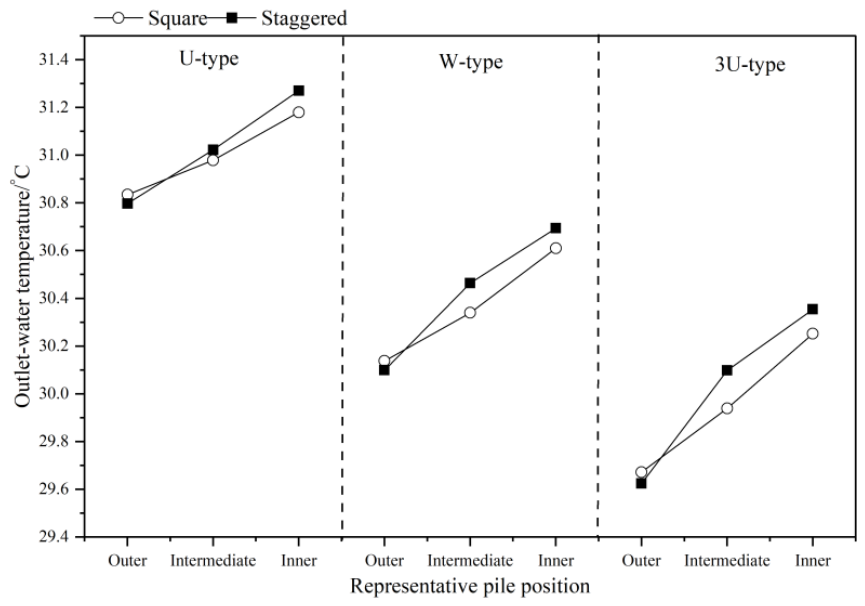
These results show different spatial distributions of thermal interference in the two complete systems. The eight-pile staggered system produced a more even inter-pile temperature field, together with greater thermal interaction at some inner positions; these differences reflect both pile number and spatial arrangement. For the 3U-type case, for example, the outlet temperature of the outermost pile decreased by only 0.048 °C when changing from the square to the staggered arrangement, whereas the intermediate and inner piles increased by 0.159 and 0.102 °C, respectively. A similar tendency was found for the U-type and W-type groups.
The difference between the two pile group systems was also reflected in the deformation response. Figure 12 compares the pile head displacements at 100 h. For the staggered arrangement, the U-type piles 4, 5, and 6 exhibited displacements of 5.998, 6.567, and 6.862 mm, respectively. The corresponding values were 6.216, 6.758, and 7.069 mm for the W-type group and 6.299, 6.905, and 7.195 mm for the 3U-type group. In each configuration, displacement increased from the outer pile toward the inner pile, consistent with the spatial variation in thermal interaction.
Figure 12.
Effect of pile layout on pile head displacement: (a–c) displacement distributions for the U-type, W-type, and 3U-type staggered groups; (d) comparison among representative piles in the staggered groups.
Comparison with the square arrangement indicates that the mechanical differences between the two systems were configuration-dependent. For the U-type group, the staggered arrangement increased the displacements of the edge, intermediate, and inner piles relative to their square-layout counterparts. The same trend was obtained for the 3U-type group, for which the square-layout displacements of 6.050, 6.487, and 6.981 mm increased to 6.299, 6.905, and 7.195 mm in the staggered arrangement. The W-type group showed a different response for the inner pile: its displacement decreased from 7.401 mm in the square group to 7.069 mm in the staggered group, although the outer and intermediate piles increased. Thus, a single mechanical ranking between the two layouts cannot be applied to all pile positions and heat exchanger configurations.
Overall, changing the group arrangement altered the spatial distribution of both ground temperature and pile deformation, but the differences were smaller than those associated with pile spacing. The staggered system produced a more uniform inter-pile temperature field, whereas the square system generally showed lower outlet water temperatures for the intermediate and inner piles under the investigated conditions. Because the square and staggered models contain different numbers of piles, the observed differences reflect the combined effects of pile number and spatial arrangement and should be interpreted only as a system-level comparison. For the 3U-type case, the outlet-temperature differences between the two systems were 0.048, 0.159, and 0.102 °C for the outer, intermediate, and inner representative piles, respectively. The reported Fine-to-Finer mesh sensitivity comparison showed that changes in the group average outlet water temperature were below 0.21 °C (<0.7%). Because that check is based on group average quantities and is not a formal uncertainty bound for each representative pile, it cannot be used to classify an individual layout difference as numerical error. Nevertheless, the small magnitude of the observed differences warrants a cautious interpretation. No quantitative superiority of either arrangement is, therefore, claimed; the main result is that the two complete systems redistribute thermal interference differently across pile positions.
3.5. Effect of Soil Thermophysical Properties
The thermal response of an energy pile group is also controlled by the capacity of the surrounding ground to conduct and store heat. Because the 3U-type configuration exhibited the strongest heat rejection capability among the investigated pipe arrangements, the central pile of the 3U-type group was selected to examine the effects of soil thermal conductivity, specific heat capacity, and density. Thermal conductivity was varied from 1.0 to 1.4 W/(m·K), specific heat capacity from 900 to 1300 J/(kg·K), and density from 1725 to 2125 kg/m3, with only one property varied at a time. In the density study, Young’s modulus E, Poisson’s ratio ν, the thermal expansion coefficient α, and the other mechanical parameters were held fixed; no density-dependent stiffness or other mechanical property relation was introduced.
As shown in Figure 13a, increasing the soil thermal conductivity reduced the outlet water temperature of the central pile. A higher thermal conductivity promotes heat diffusion away from the pile group, thereby limiting local heat accumulation in the surrounding soil and maintaining more favorable conditions for continued heat rejection. The influence of thermal conductivity was most apparent during approximately 200–300 h of operation, after which the differences among the temperature curves gradually decreased. At 700 h, the outlet temperature difference between soils with thermal conductivities of 1.0 and 1.4 W/(m·K) was approximately 0.25 °C.
Figure 13.
Effects of soil thermophysical properties on the outlet water temperature of the central 3U-type pile: (a) thermal conductivity, (b) specific heat capacity, and (c) density.
Specific heat capacity produced a more persistent effect on the thermal response. As shown in Figure 13b, the outlet water temperature decreased as the soil specific heat capacity increased from 900 to 1300 J/(kg·K). A soil with greater heat storage capacity undergoes a smaller temperature rise for a given amount of rejected heat, which delays the deterioration of the temperature difference between the pile and the surrounding ground. Unlike the effect of thermal conductivity, the separation between the temperature curves continued to increase with operating time. At 700 h, the maximum outlet-temperature difference among the investigated specific heat capacity cases was approximately 0.9 °C.
The effect of soil density followed the same general direction but was weaker. As shown in Figure 13c, outlet water temperature increased over time during the 700 h summer heat rejection period, but higher-density cases consistently exhibited slightly lower temperatures. This trend is attributed primarily to the increased volumetric heat capacity at fixed specific heat capacity, which reduced thermal accumulation around the pile and improved heat rejection. The density effect was weaker than that of specific heat capacity over the investigated ranges.
The mechanical response showed a corresponding dependence on the soil properties. Under the 700 h summer heat rejection conditions, Figure 14a shows that pile head displacement increased over time, while higher thermal conductivity consistently resulted in smaller displacement. More effective heat transfer into the surrounding ground limited the thermal accumulation around the pile and consequently reduced the deformation associated with heating.
Figure 14.
Effects of soil thermophysical properties on pile head displacement of the central 3U-type pile: (a) thermal conductivity, (b) specific heat capacity, and (c) density.
Increasing the specific heat capacity also reduced pile head displacement. Since a larger specific heat capacity limits the temperature increase in the soil during heat rejection, the pile–soil system experiences a less pronounced thermal response over the investigated 700 h period. The resulting reduction in thermally induced deformation is consistent with the corresponding decrease in outlet water temperature.
Pile head displacement also decreased with increasing soil density. In the coupled formulation, density enters the transient heat transfer equation through the volumetric heat capacity term ρc and enters the transient momentum equation through the inertial term ρü. These two pathways should, therefore, be distinguished. For the present problem, however, the thermal loading evolves over hours to hundreds of hours, much more slowly than a structural vibration time scale. An order-of-magnitude comparison between the inertial and elastic terms, Rinertia ~ ρL2/(Eτ2), gives approximately 1.3 × 10⁻⁸ even for τ = 1 h when ρ = 2125 kg/m3, L = 25.5 m, and E = 8 MPa. The direct inertial contribution is, therefore, negligible for the slowly varying thermal loading considered here. Accordingly, the density-dependent displacement trend is interpreted primarily as an indirect thermo-mechanical effect: increasing density increases the volumetric heat capacity, modifies the transient pile–soil temperature field, and consequently changes the thermally induced strain and pile head displacement.
Comparison of the three parameters indicates that soil thermal conductivity and heat storage characteristics govern different aspects of the group response. Thermal conductivity primarily controls the rate at which rejected heat diffuses away from the pile group, whereas specific heat capacity and density determine the amount of heat that can be stored for a given temperature rise. Within the investigated parameter ranges, for the central pile of the 3U-type group under the 700 h summer heat rejection conditions, specific heat capacity produced the largest absolute variation in outlet water temperature, with a maximum difference of approximately 0.9 °C at 700 h, while the effect of density was comparatively limited. Broader property ranges, different soil types, other heat exchanger configurations, and different operating durations may change this sensitivity ranking.
These results further show that soil properties affect both thermal interference and deformation rather than only the heat transfer performance of an individual pile. Ground conditions that facilitate heat diffusion or provide greater heat storage capacity reduce heat accumulation within the pile group and are accompanied by lower pile head displacement under the investigated summer operating condition. Together with the pile spacing and layout results, this demonstrates that the thermo-mechanical response of an energy pile group is controlled by both its geometric arrangement and the thermal characteristics of the surrounding ground.
4. Conclusions
A three-dimensional thermo-mechanical numerical framework was developed to investigate thermal interference in energy pile groups and the effects of pile position, pile spacing, group layout, and soil thermophysical properties. U-type, W-type, and 3U-type heat exchangers were considered under identical summer heat rejection conditions. The main conclusions are as follows:
(1) The numerical framework was evaluated using complementary thermal and mechanical benchmarks. For the pile group thermal benchmark, the calculated inlet–outlet temperature difference was 2.15 °C, compared with 1.96 °C derived from the field data, giving an absolute difference of 0.19 °C. A supplementary single-pile benchmark further showed that the simulated pile stress histories at depths of 0.5, 9.0, and 13.9 m reproduced the measured temporal trends. These comparisons support the adopted thermal and thermo-mechanical formulations under the investigated validation conditions.
(2) Thermal interference developed progressively as the thermal influence zones of neighboring piles expanded and overlapped. After 700 h, the central piles exhibited higher outlet water temperatures than their corresponding isolated piles by 0.437, 0.956, and 1.044 °C for the U-type, W-type, and 3U-type configurations, respectively. Within each group, the central pile consistently experienced stronger thermal interference than the intermediate and edge piles. The spatially non-uniform thermal environment was also reflected in the predicted deformation response, with larger pile head displacements generally occurring toward the interior of the group.
(3) Within the investigated 700 h summer heat rejection conditions, pile spacing exerted a pronounced and systematic influence on pile-to-pile thermal interaction and pile head displacement. Increasing the spacing from 2.1 to 5.1 m reduced the overlap of the temperature fields, lowered the outlet water temperatures, and decreased pile head displacement. For the central piles, the displacement decreased from 7.866 to 5.218 mm for the U-type group, from 8.093 to 5.419 mm for the W-type group, and from 8.227 to 5.560 mm for the 3U-type group. Using the normalized thermal interference index IQ, the change in IQ between adjacent spacing levels fell below the author-defined, study-specific criterion of 0.01 in absolute index units beyond approximately 4.1 m, indicating that the marginal effect of further increasing the spacing on thermal interference became small within 4.1–5.1 m under the present geometry, soil parameters, and 700 h summer heat rejection conditions. This range is specific to the present time window and should not be interpreted as a general design threshold.
(4) The investigated nine-pile square system and eight-pile staggered system exhibited different spatial distributions of thermal interference. The staggered system produced a more uniform inter-pile temperature field, whereas the square system generally showed lower outlet temperatures for intermediate and inner piles under the investigated conditions. Because the two systems contained different numbers of piles, these differences represent the combined effects of pile number and spatial arrangement and cannot be interpreted as isolated layout effects. The outlet temperature differences between the two systems were small. Although the reported Fine-to-Finer comparison indicated limited sensitivity in the group average outputs, no formal uncertainty quantification was performed for the individual layout differences. Therefore, no quantitative superiority of either layout is claimed. This system-level comparison does not isolate the effect of spatial layout at a fixed pile number.
(5) Soil thermophysical properties affected both heat transfer performance and thermally induced deformation. Increasing thermal conductivity, specific heat capacity, or density reduced the outlet water temperature and pile head displacement of the central 3U-type pile. Higher thermal conductivity improved heat diffusion away from the pile group, reducing thermal accumulation and thermally induced deformation, whereas increasing density primarily increased volumetric heat capacity and reduced thermal accumulation. Within the investigated parameter ranges, for the central pile of the 3U-type group under the 700 h summer heat rejection conditions, specific heat capacity produced the largest absolute variation in outlet water temperature, reaching approximately 0.9 °C at 700 h, while the effect of density was comparatively smaller.
Overall, the results show that the behavior of an energy pile group cannot be represented by isolated pile performance alone. Pile position, spacing, layout, and ground thermophysical properties jointly govern the development of thermal interference and the associated deformation response. Among the investigated design variables, pile spacing had the clearest influence on both thermal field overlap and pile head displacement, while soil heat storage characteristics became increasingly important during the 700 h simulation. The present results are limited to the 700 h summer heat rejection conditions and the geometries considered; seasonal cycles, winter heat extraction, and multi-year thermal accumulation are not addressed. These results provide a consistent comparison of multiple heat exchanger configurations, pile positions, spacings, layouts, and soil thermophysical properties within a single thermo-mechanical framework, which was not available in previous studies.
Several limitations define the applicability of the present results. First, the supplementary mechanical validation is based on single-pile stress measurements and, therefore, does not directly validate pile group mechanical interaction or pile head displacement. Second, linear elastic soil excludes plasticity, stress-dependent stiffness, stiffness degradation, and irreversible deformation, while the continuous pile–soil interface excludes relative slip, separation, and nonlinear friction. These assumptions may affect the magnitude of pile head displacement, whose absolute values should be interpreted within the adopted model; relative comparisons use the same assumptions. Third, groundwater seepage and surface convection, radiation, and solar radiation were not included, so the thermal results correspond to conduction-dominated ground conditions with an adiabatic ground surface. Fourth, the simulations represent 700 h of continuous summer heat rejection and do not cover seasonal cycling or multi-year thermal accumulation. Finally, the soil property analysis was limited to the central pile of the 3U-type group and to the selected parameter ranges, which follow typical clay values [35,43] rather than the full range of all soil types. The finding that specific heat capacity produces the largest absolute variation in outlet water temperature is limited to the central 3U-type pile, the investigated parameter ranges, and 700 h of summer heat rejection. Broader ranges, different soil types, other heat exchanger configurations, and different operating durations may alter the sensitivity ranking. The reported trends should, therefore, not be generalized beyond these numerical conditions without additional validation and sensitivity analysis.
Author Contributions
Methodology, Z.Z., Y.Z., Y.W., and H.T.; software, Z.Z. and Y.Z.; investigation, Z.Z., Y.Z., and H.T.; data curation, Z.Z.; writing—original draft preparation, Z.Z.; supervision, H.T.; funding acquisition, Z.Z., Y.W., and H.T. All authors have read and agreed to the published version of the manuscript.
Funding
This research was funded by the Science, Technology and Innovation Commission of Shenzhen Municipality, grant number JCYJ20220818103010021; the Major Project of the Xiangjiang Laboratory, grant number 24XJJCYJ01005; the National Undergraduate Innovation Training Program, grant number 202610554153; and the Hunan Provincial Undergraduate Innovation Training Program, grant number S202610554281.
Data Availability Statement
The numerical data supporting the findings of this study are available from the corresponding author upon reasonable request.
Conflicts of Interest
The authors declare no conflicts of interest.
References
- Park, H.; Lee, S.R.; Yoon, S.; Choi, J.C. Evaluation of thermal response and performance of PHC energy pile: Field experiments and numerical simulation. Appl. Energy 2013, 103, 12–24. [Google Scholar] [CrossRef] [Scilit]
- Lee, C.K.; Lam, H.N. A simplified model of energy pile for ground-source heat pump systems. Energy 2013, 55, 838–845. [Google Scholar] [CrossRef] [Scilit]
- Yoon, S.; Lee, S.R.; Xue, J.; Zosseder, K.; Go, G.H.; Park, H. Evaluation of the thermal efficiency and a cost analysis of different types of ground heat exchangers in energy piles. Energy Convers. Manag. 2015, 105, 393–402. [Google Scholar] [CrossRef] [Scilit]
- Zheng, Z.; Wang, Y.; Tan, H.; Lyu, B.; Zhang, J.; Xiang, J. Thermo-mechanical analysis of energy piles with different pipe configurations using numerical simulations and machine learning models. Comput. Geotech. 2027, 202, 108601. [Google Scholar] [CrossRef] [Scilit]
- Yang, Q.; Xu, F.; Lu, W.; Yang, Z.; Bai, Y.; Wen, B. Green renovation and multi-objective optimization of Tibetan courtyard dwellings. Build. Environ. 2025, 279, 113071. [Google Scholar] [CrossRef] [Scilit]
- Zheng, Z.; Wen, B.; Zhou, J.; Xu, F.; Liang, L.; Xiang, J. Multi-objective optimization of college dormitory buildings incorporating actual energy use behaviors: From the ultra-low energy goal to zero energy goal. Build. Environ. 2026, 294, 114433. [Google Scholar] [CrossRef] [Scilit]
- Yang, Q.; Lu, W.; Xu, F.; Luo, X.; Wen, B. A passive strategy for energy-saving retrofitting of courtyard dwellings and its climatic adaptability. Energy Build. 2026, 352, 116811. [Google Scholar] [CrossRef] [Scilit]
- Zheng, Z.; Gao, W.; Tan, H.; Yuan, Z.; Cai, K.; Zhang, J. Explainable machine learning analysis of thermo-mechanical performance in energy piles with different pipe configurations. Appl. Therm. Eng. 2026, 307, 133429. [Google Scholar] [CrossRef] [Scilit]
- Zheng, Z.; Wang, Y.; Zhang, J.; Zhang, J. Prediction of heat exchange performance of energy piles and comparison of pipe configurations based on machine learning. Chem. Ind. Eng. Prog. 2026, in press. [Google Scholar]
- Batini, N.; Rotta Loria, A.F.; Conti, P.; Testi, D.; Grassi, W.; Laloui, L. Energy and geotechnical behaviour of energy piles for different design solutions. Appl. Therm. Eng. 2015, 86, 199–213. [Google Scholar] [CrossRef] [Scilit]
- Faizal, M.; Bouazza, A.; McCartney, J.S.; Haberfield, C. Axial and radial thermal responses of energy pile under six storey residential building. Can. Geotech. J. 2019, 56, 1019–1033. [Google Scholar] [CrossRef] [Scilit]
- Sani, A.K.; Singh, R.M.; Tsuha, C.H.C.; Cavarretta, I. Pipe–pipe thermal interaction in a geothermal energy pile. Geothermics 2019, 81, 209–223. [Google Scholar] [CrossRef] [Scilit]
- Sani, A.K.; Singh, R.M. Response of unsaturated soils to heating of geothermal energy pile. Renew. Energy 2020, 147, 2618–2632. [Google Scholar] [CrossRef] [Scilit]
- Brandl, H. Energy foundations and other thermo-active ground structures. Géotechnique 2006, 56, 81–122. [Google Scholar] [CrossRef] [Scilit]
- Loveridge, F.; Powrie, W. Temperature response functions (G-functions) for single pile heat exchangers. Energy 2013, 57, 554–564. [Google Scholar] [CrossRef] [Scilit]
- Loveridge, F.; Powrie, W. G-Functions for multiple interacting pile heat exchangers. Energy 2014, 64, 747–757. [Google Scholar] [CrossRef] [Scilit]
- Park, S.; Lee, S.; Lee, D.; Ahn, D.; Choi, H. Effect of thermal interference on energy piles considering various configurations of heat exchangers. Energy Build. 2019, 199, 381–401. [Google Scholar] [CrossRef] [Scilit]
- Zhang, W.; Yang, H.; Fang, L.; Cui, P.; Fang, Z. Study on heat transfer of pile foundation ground heat exchanger with three-dimensional groundwater seepage. Int. J. Heat Mass Transf. 2017, 105, 58–66. [Google Scholar] [CrossRef] [Scilit]
- Akrouch, G.A.; Sánchez, M.; Briaud, J.L. An experimental, analytical and numerical study on the thermal efficiency of energy piles in unsaturated soils. Comput. Geotech. 2016, 71, 207–220. [Google Scholar] [CrossRef] [Scilit]
- Park, S.; Lee, D.; Choi, H.J.; Jung, K.; Choi, H. Relative constructability and thermal performance of cast-in-place concrete energy pile: Coil-type GHEX (ground heat exchanger). Energy 2015, 81, 56–66. [Google Scholar] [CrossRef] [Scilit]
- Bezyan, B.; Porkhial, S.; Mehrizi, A.A. 3-D simulation of heat transfer rate in geothermal pile-foundation heat exchangers with spiral pipe configuration. Appl. Therm. Eng. 2015, 87, 655–668. [Google Scholar] [CrossRef] [Scilit]
- Kaltreider, C.; Krarti, M.; McCartney, J.S. Heat transfer analysis of thermo-active foundations. Energy Build. 2015, 86, 492–501. [Google Scholar] [CrossRef] [Scilit]
- Park, S.; Lee, D.; Lee, S.; Chauchois, A.; Choi, H. Experimental and numerical analysis on thermal performance of large-diameter cast-in-place energy pile constructed in soft ground. Energy 2017, 118, 297–311. [Google Scholar] [CrossRef] [Scilit]
- Laloui, L.; Nuth, M.; Vulliet, L. Experimental and numerical investigations of the behaviour of a heat exchanger pile. Int. J. Numer. Anal. Methods Geomech. 2006, 30, 763–781. [Google Scholar] [CrossRef] [Scilit]
- Knellwolf, C.; Peron, H.; Laloui, L. Geotechnical analysis of heat exchanger piles. J. Geotech. Geoenviron. Eng. 2011, 137, 890–902. [Google Scholar] [CrossRef] [Scilit]
- Di Donna, A.; Laloui, L. Numerical analysis of the geotechnical behaviour of energy piles. Int. J. Numer. Anal. Methods Geomech. 2015, 39, 861–888. [Google Scholar] [CrossRef] [Scilit]
- Bourne-Webb, P.J.; Amatya, B.; Soga, K.; Amis, T.; Davidson, C.; Payne, P. Energy pile test at Lambeth College, London: Geotechnical and thermodynamic aspects of pile response to heat cycles. Géotechnique 2009, 59, 237–248. [Google Scholar] [CrossRef] [Scilit]
- Amatya, B.L.; Soga, K.; Bourne-Webb, P.J.; Amis, T.; Laloui, L. Thermo-mechanical behaviour of energy piles. Géotechnique 2012, 62, 503–519. [Google Scholar] [CrossRef] [Scilit]
- Suryatriyastuti, M.E.; Mroueh, H.; Burlon, S. Understanding the temperature-induced mechanical behaviour of energy pile foundations. Renew. Sustain. Energy Rev. 2012, 16, 3344–3354. [Google Scholar] [CrossRef] [Scilit]
- Rotta Loria, A.F.; Laloui, L. The interaction factor method for energy pile groups. Comput. Geotech. 2016, 80, 121–137. [Google Scholar] [CrossRef] [Scilit]
- Di Donna, A.; Rotta Loria, A.F.; Laloui, L. Numerical study of the response of a group of energy piles under different combinations of thermo-mechanical loads. Comput. Geotech. 2016, 72, 126–142. [Google Scholar] [CrossRef] [Scilit]
- Rotta Loria, A.F.; Laloui, L. Thermally induced group effects among energy piles. Géotechnique 2017, 67, 374–393. [Google Scholar] [CrossRef] [Scilit]
- Loveridge, F.; Powrie, W. 2D thermal resistance of pile heat exchangers. Geothermics 2014, 50, 122–135. [Google Scholar] [CrossRef] [Scilit]
- Ng, C.W.W.; Farivar, A.; Gomaa, S.M.M.H.; Shakeel, M.; Jafarzadeh, F. Performance of elevated energy pile groups with different pile spacing in clay subjected to cyclic non-symmetrical thermal loading. Renew. Energy 2021, 172, 998–1012. [Google Scholar] [CrossRef] [Scilit]
- Ruan, Q. Numerical Study on Heat Transfer Performance of Deep-Buried Pipe Energy Piles. Master’s Thesis, Huazhong University of Science and Technology, Wuhan, China, 2019. [Google Scholar]
- Murphy, K.D.; McCartney, J.S.; Henry, K.S. Evaluation of thermo-mechanical and thermal behavior of full-scale energy foundations. Acta Geotech. 2015, 10, 179–195. [Google Scholar] [CrossRef] [Scilit]
- You, S.; Cheng, X.H.; Guo, H.X.; Yao, Z.Q. Experimental study on structural response of CFG energy piles. Appl. Therm. Eng. 2016, 96, 640–651. [Google Scholar] [CrossRef] [Scilit]
- Zhang, S. Exploration on thermo-mechanical characteristics of energy piles with double-U pipes buried in parallel by means of numerical simulations. CIESC J. 2019, 70, 1750–1760. (In Chinese) [Google Scholar]
- Zhao, L.; Gao, L.; Zhang, S.; Liu, H. Exploration of the thermo-mechanical features of energy piles with different types of buried pipes. J. Saf. Environ. 2020, 20, 81–90. (In Chinese) [Google Scholar]
- Zarrella, A.; De Carli, M.; Galgaro, A. Thermal performance of two types of energy foundation pile: Helical pipe and triple U-tube. Appl. Therm. Eng. 2013, 61, 301–310. [Google Scholar] [CrossRef] [Scilit]
- Mimouni, T.; Laloui, L. Behaviour of a group of energy piles. Can. Geotech. J. 2015, 52, 1913–1929. [Google Scholar] [CrossRef] [Scilit]
- JGJ 94-2008; Technical Code for Building Pile Foundations. China Architecture & Building Press: Beijing, China, 2008. (In Chinese)
- ASHRAE. 2003 ASHRAE Handbook—HVAC Applications; American Society of Heating, Refrigerating and Air-Conditioning Engineers: Atlanta, GA, USA, 2003. [Google Scholar]
- You, S.; Cheng, X.H.; Guo, H.X.; Yao, Z.Q. In-situ experimental study of heat exchange capacity of CFG pile geothermal exchangers. Energy Build. 2014, 79, 23–31. [Google Scholar] [CrossRef] [Scilit]
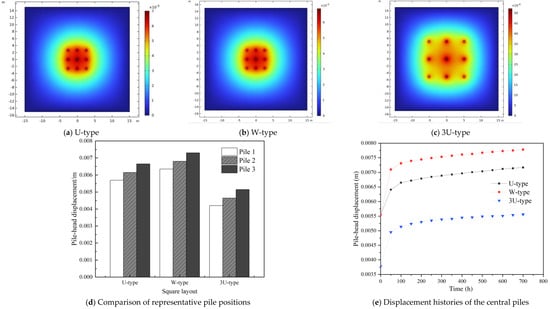
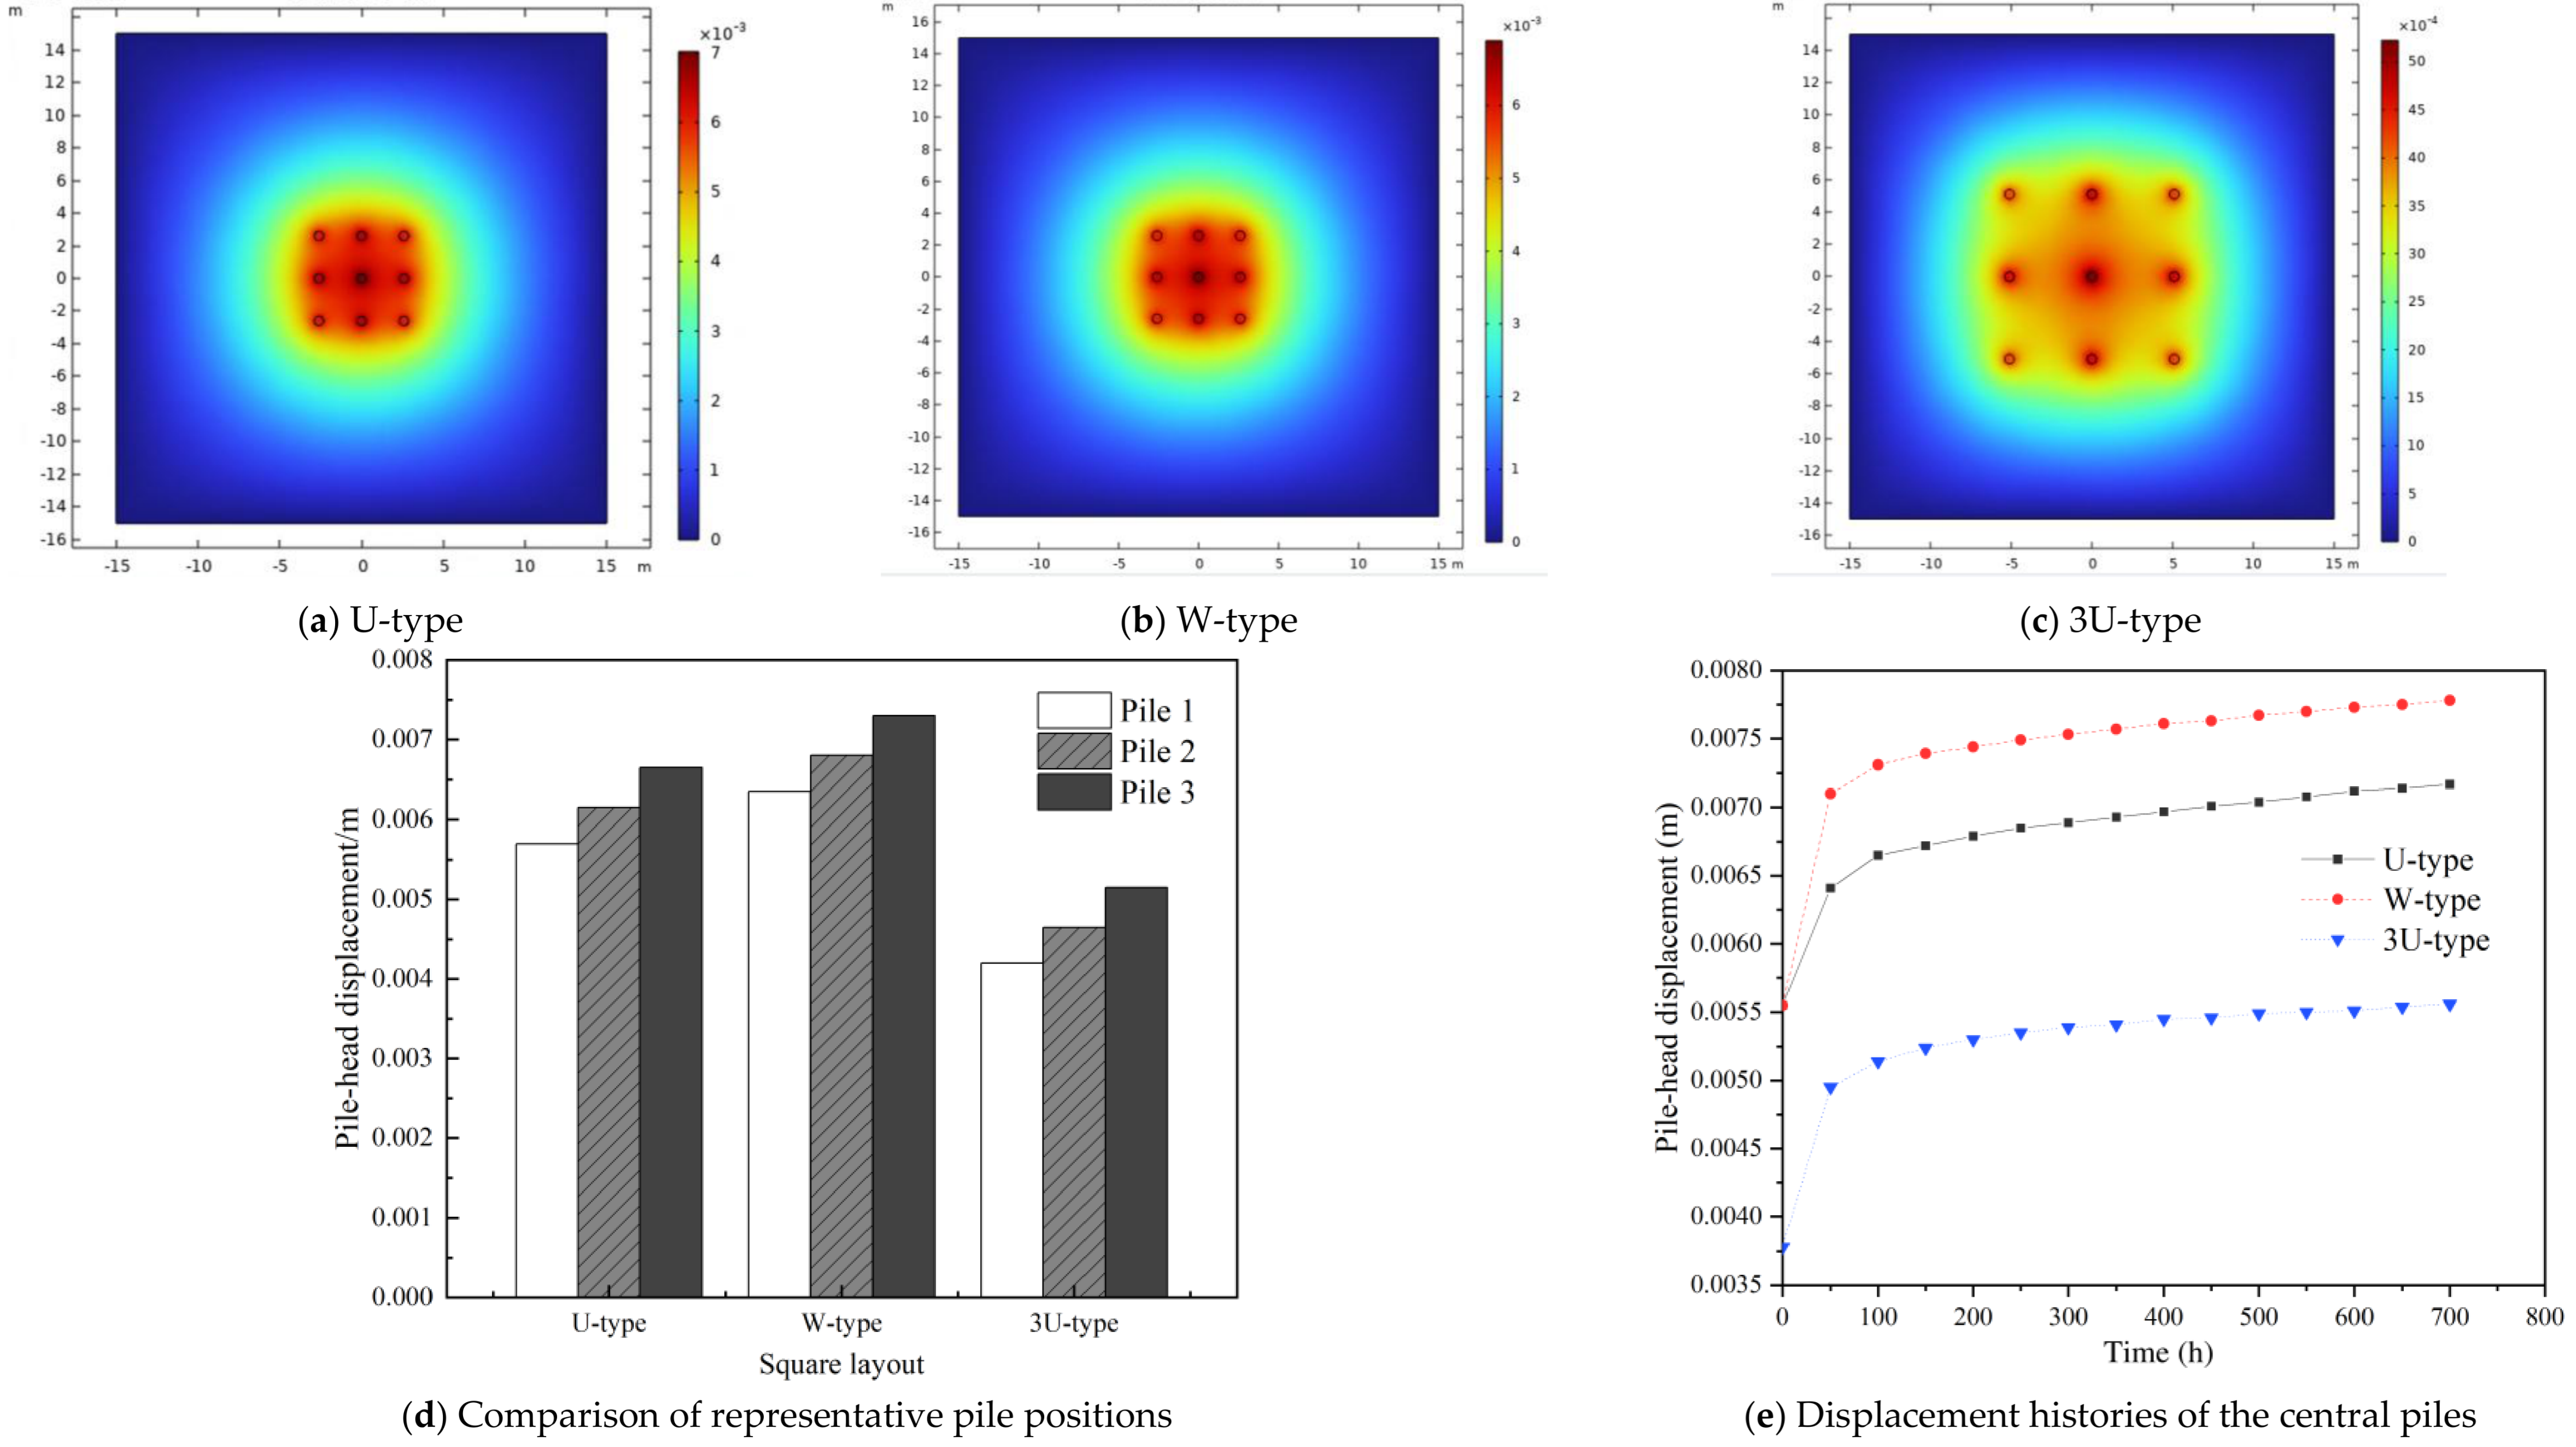
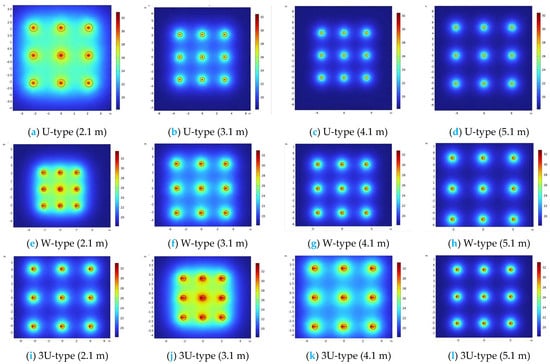
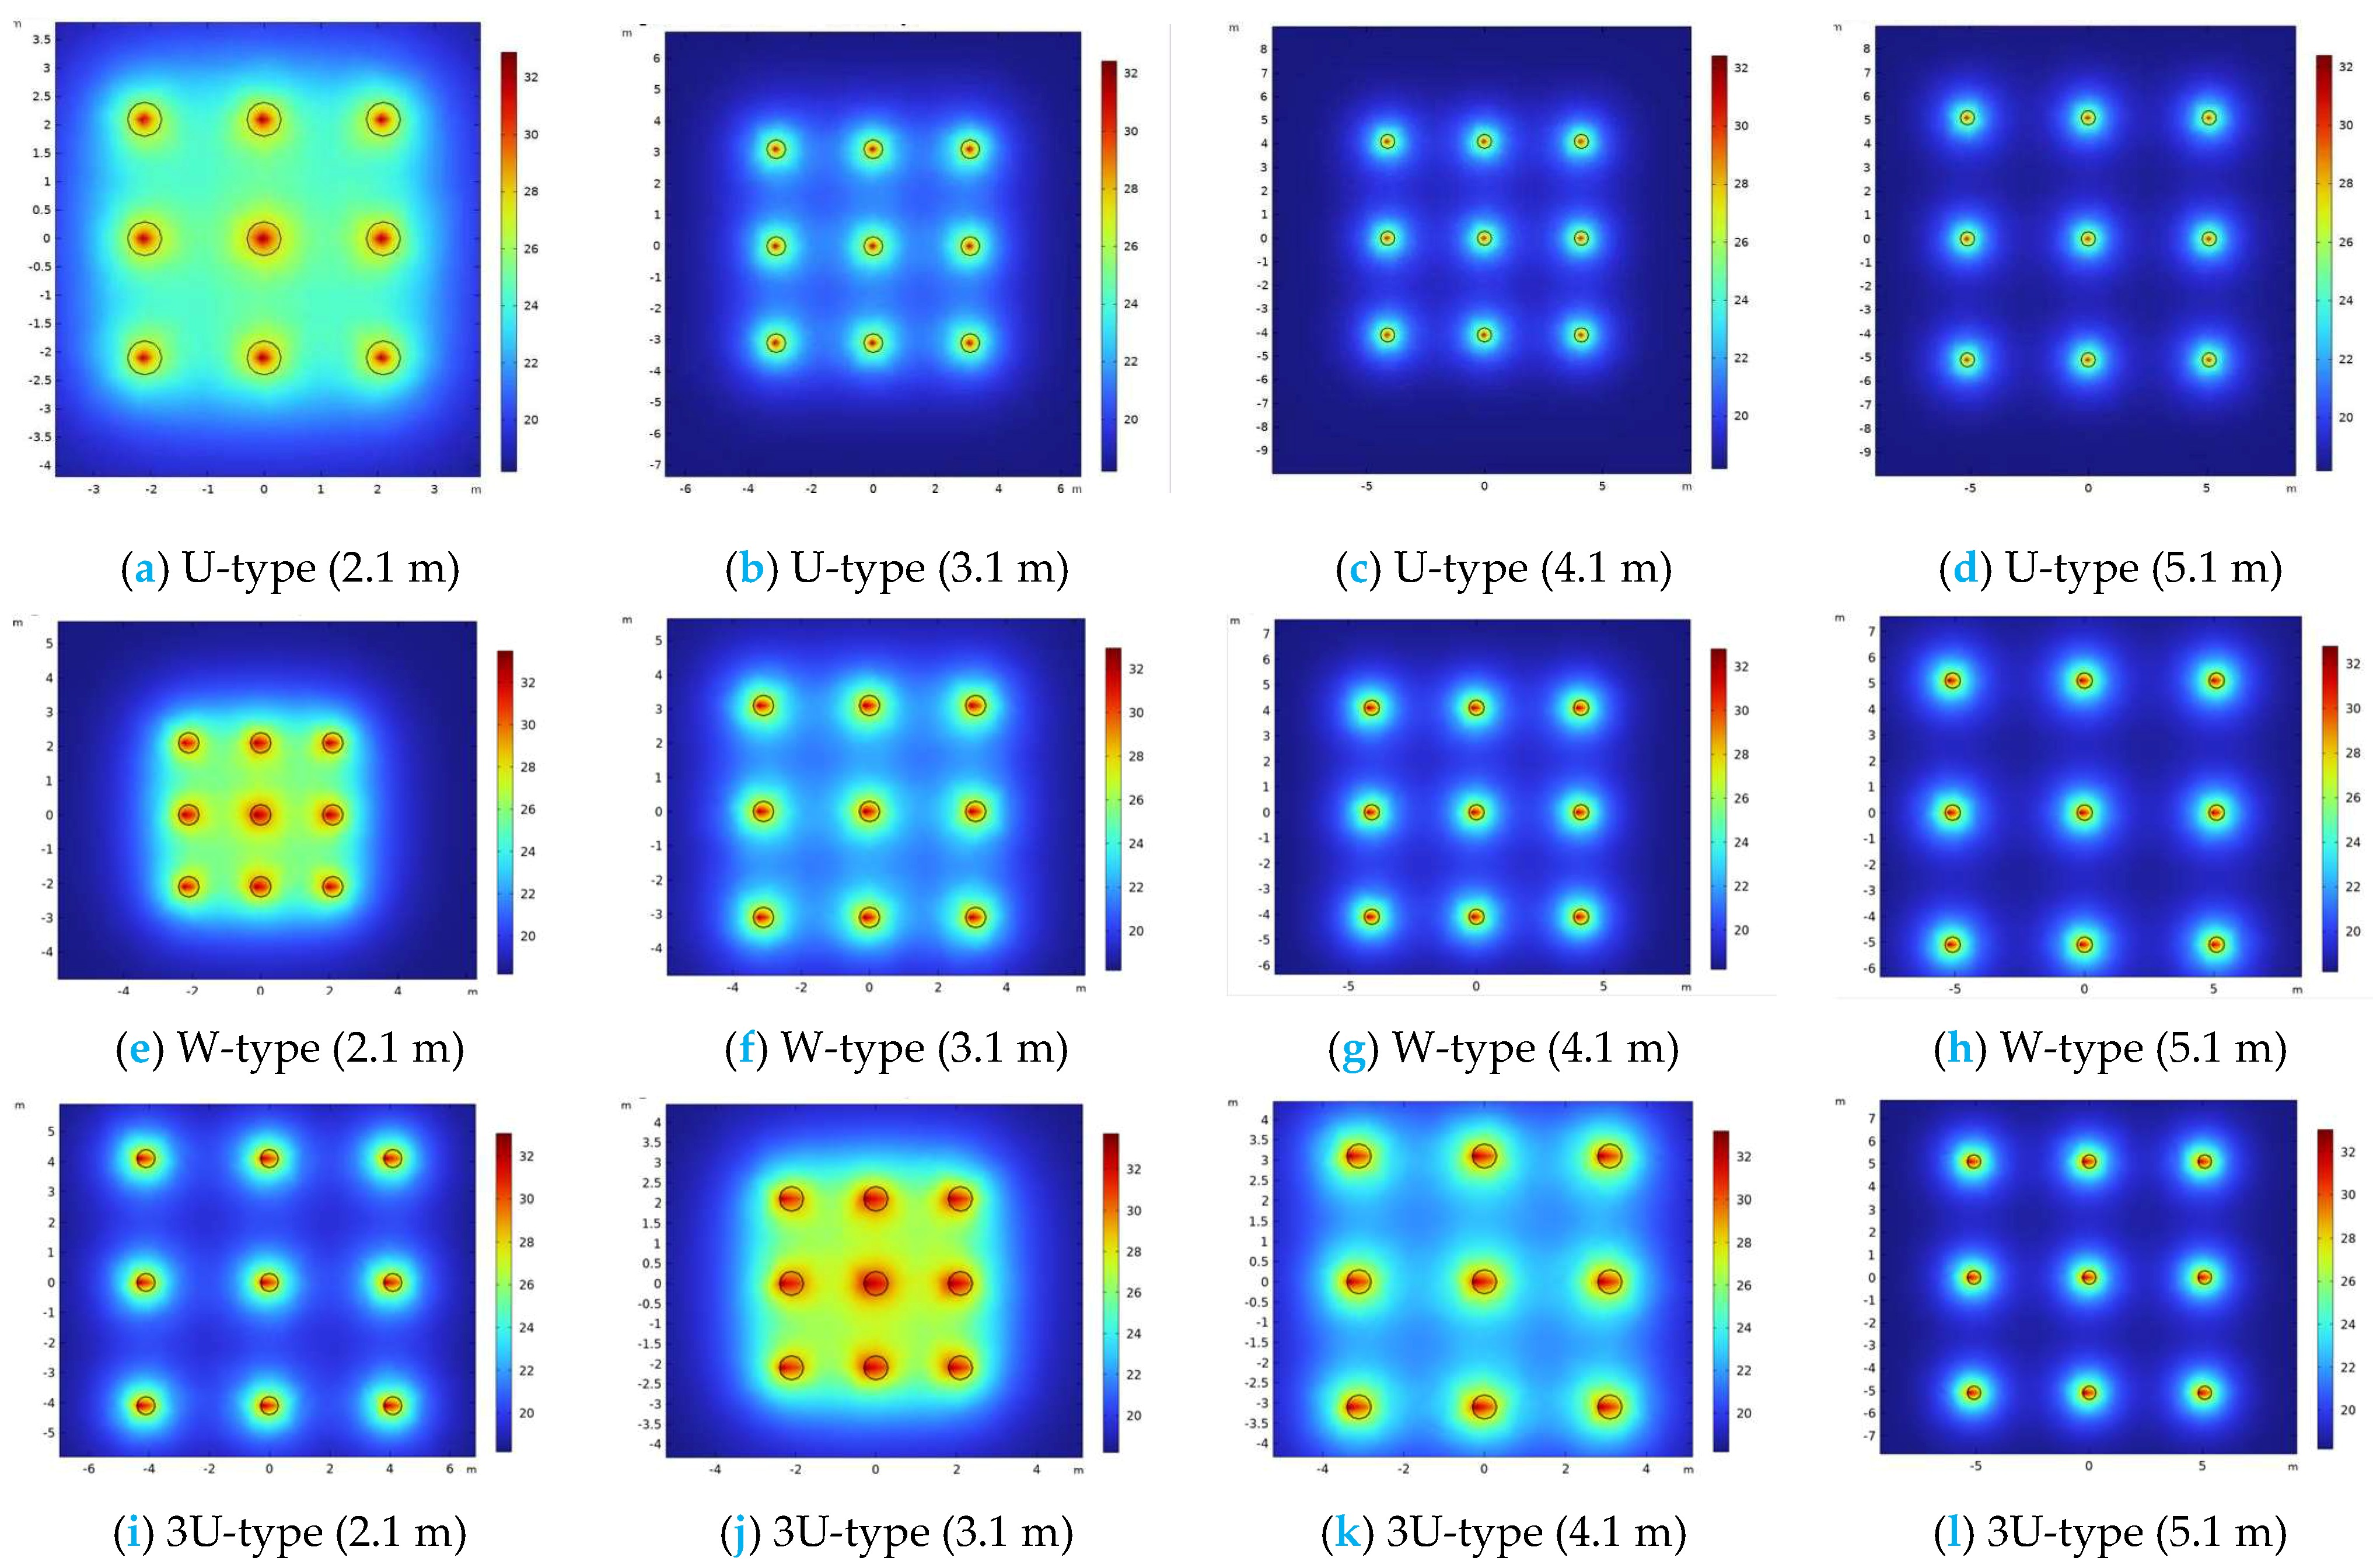
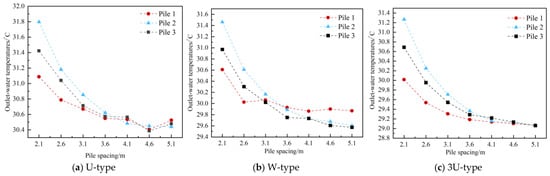
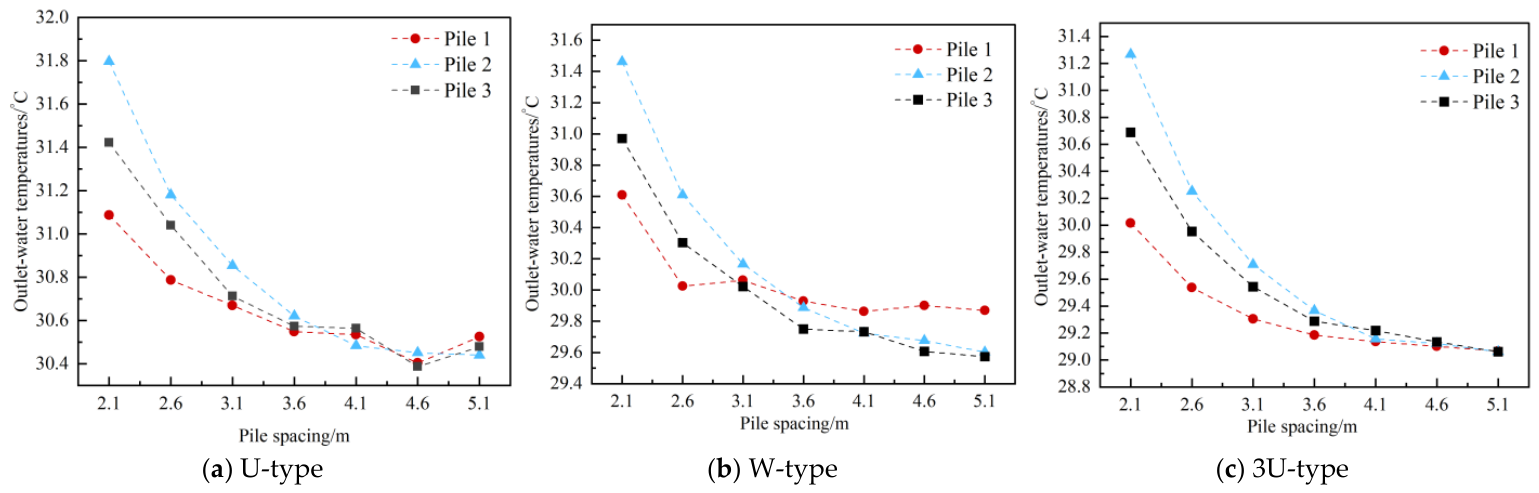
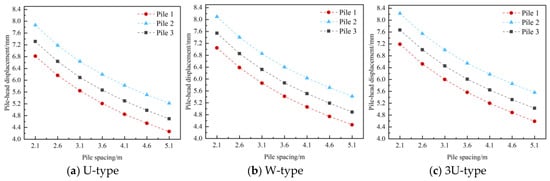
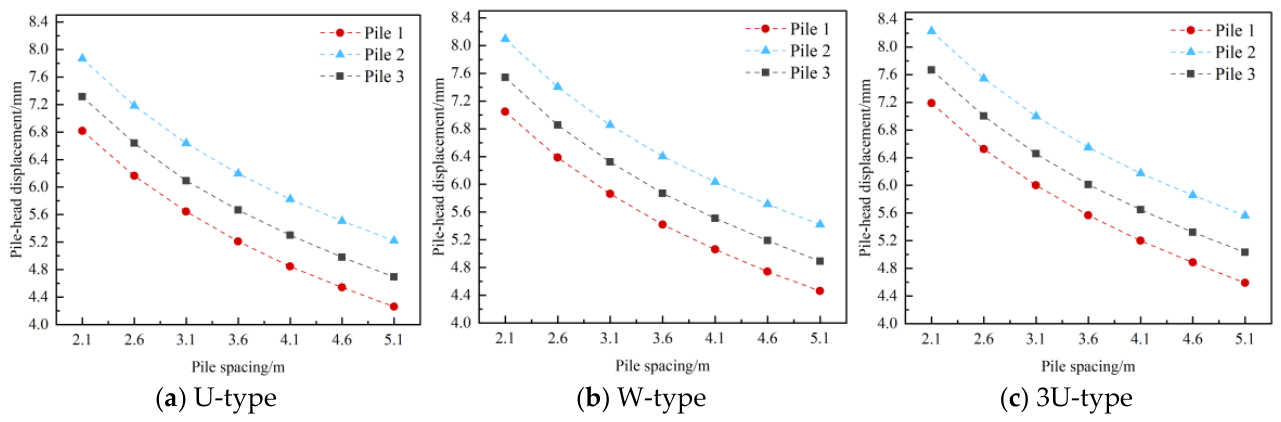
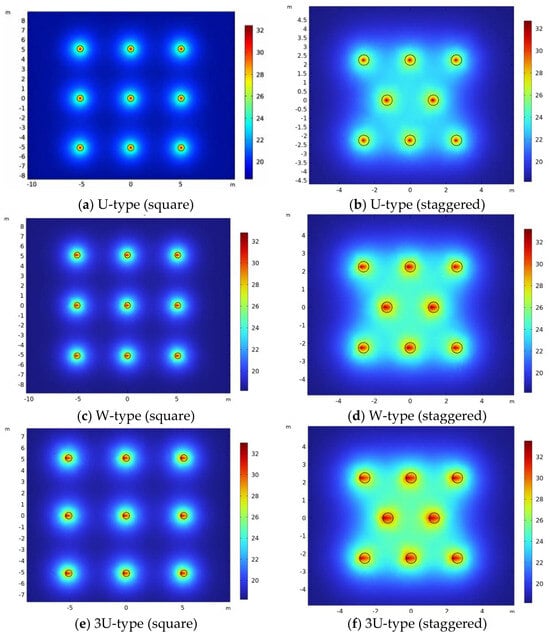
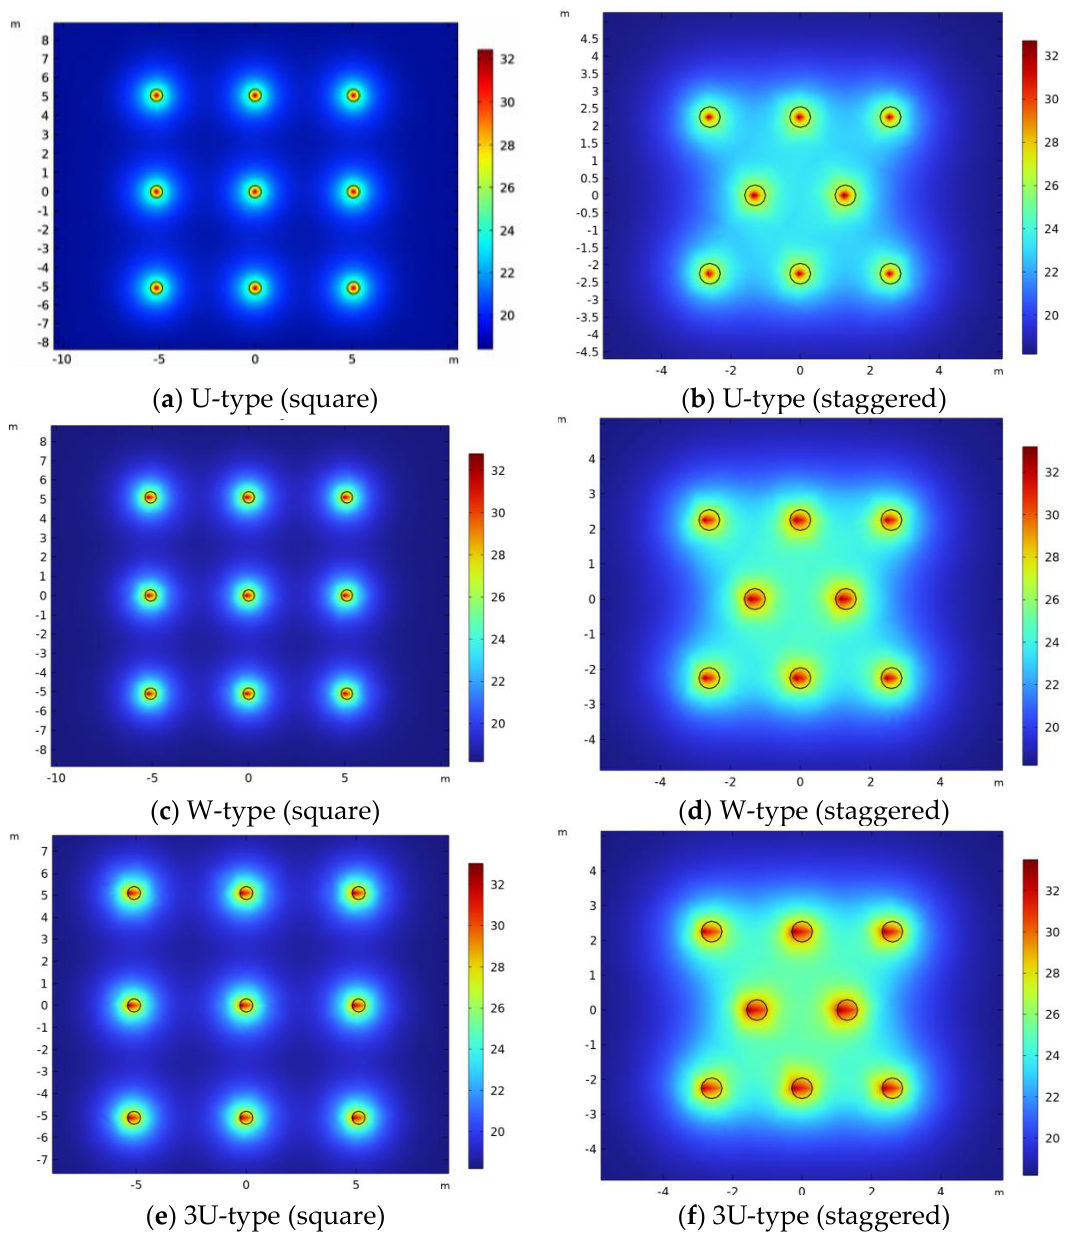
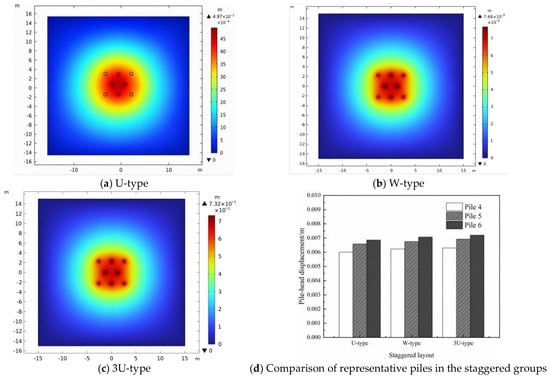
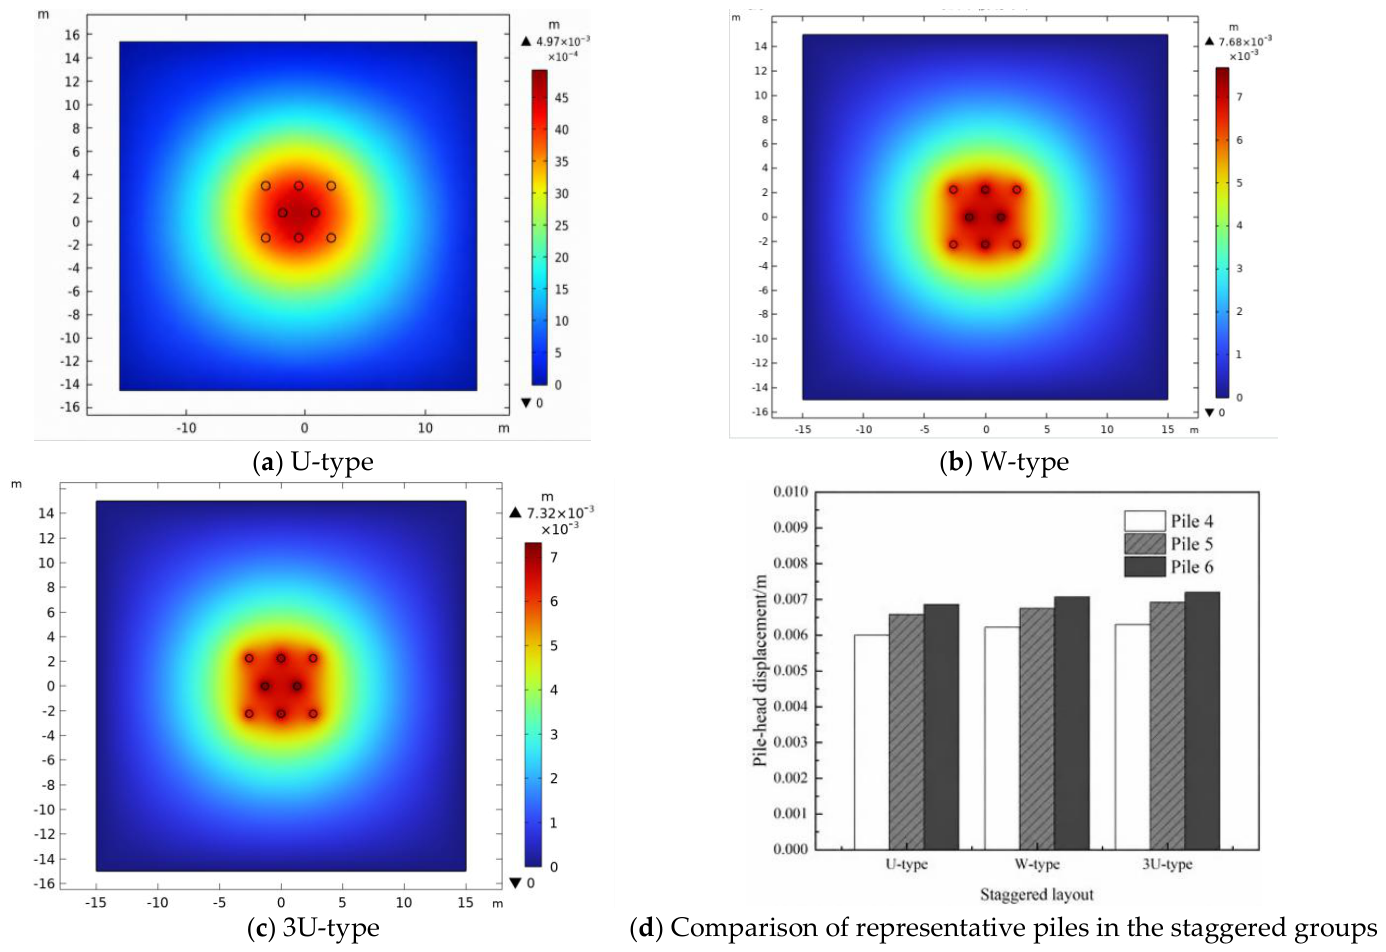
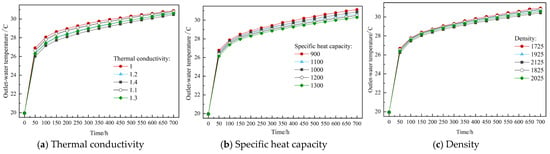
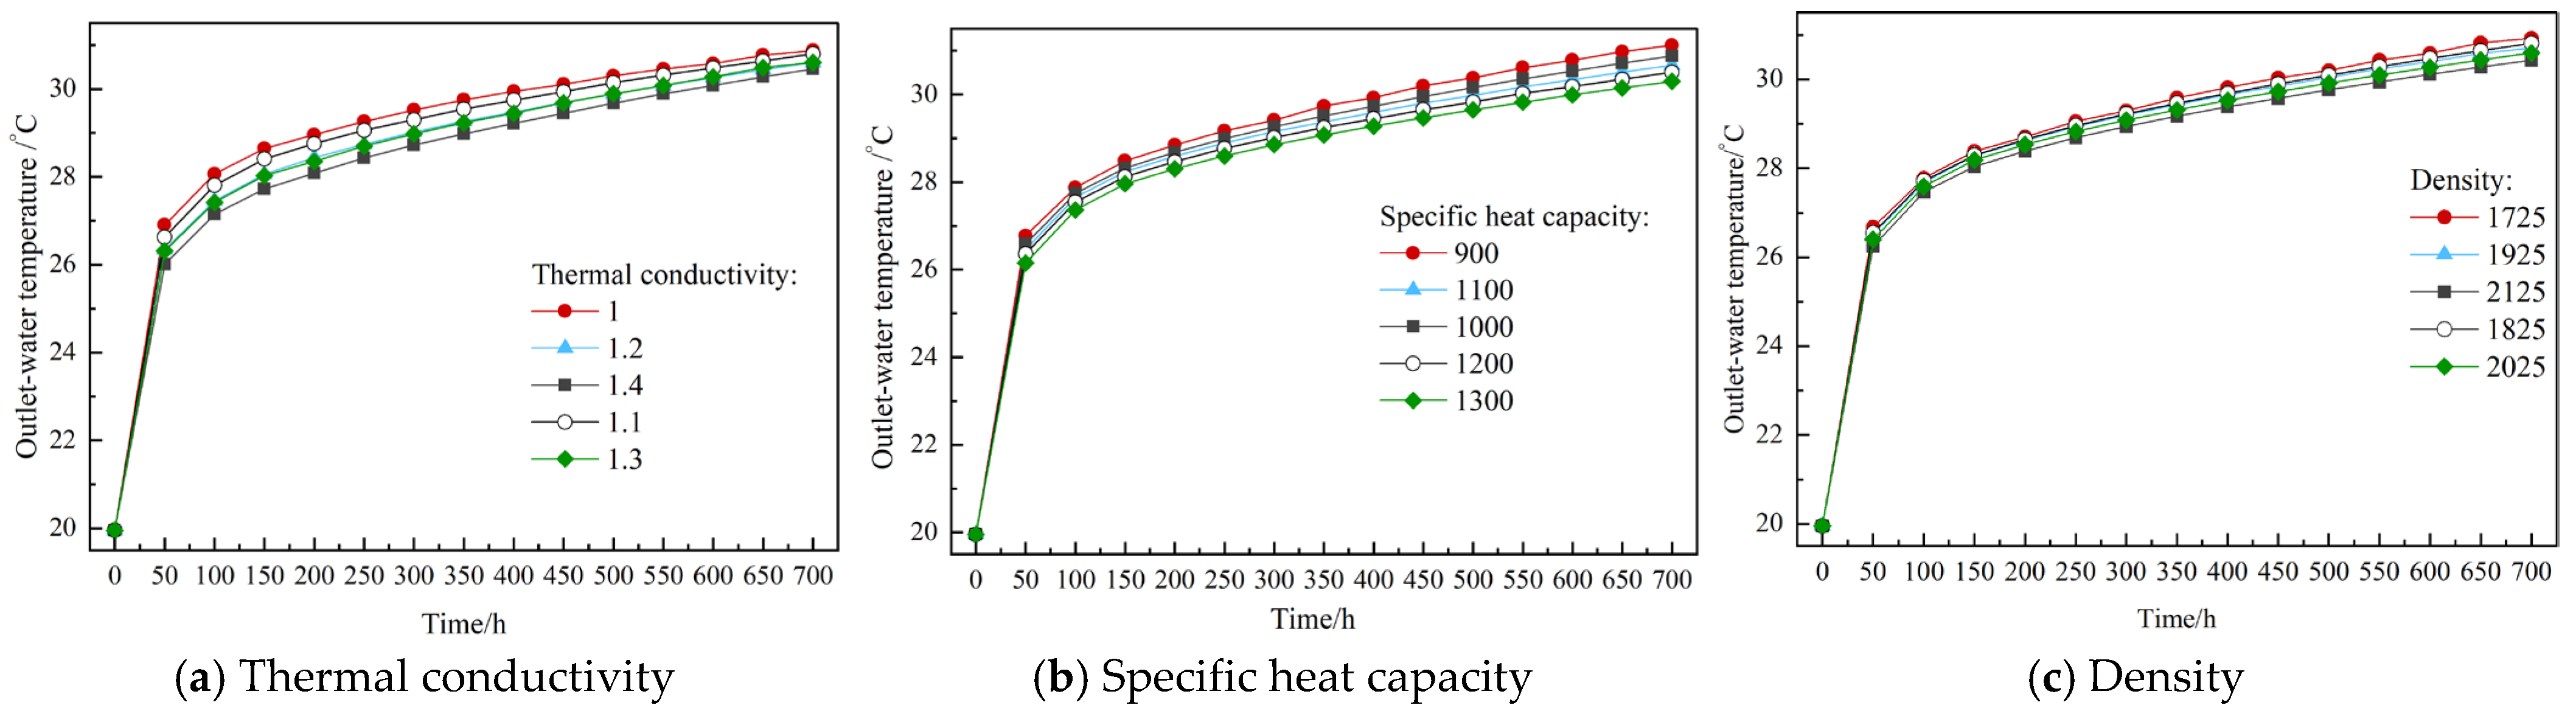
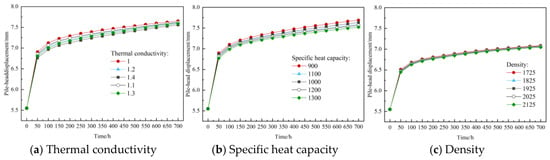
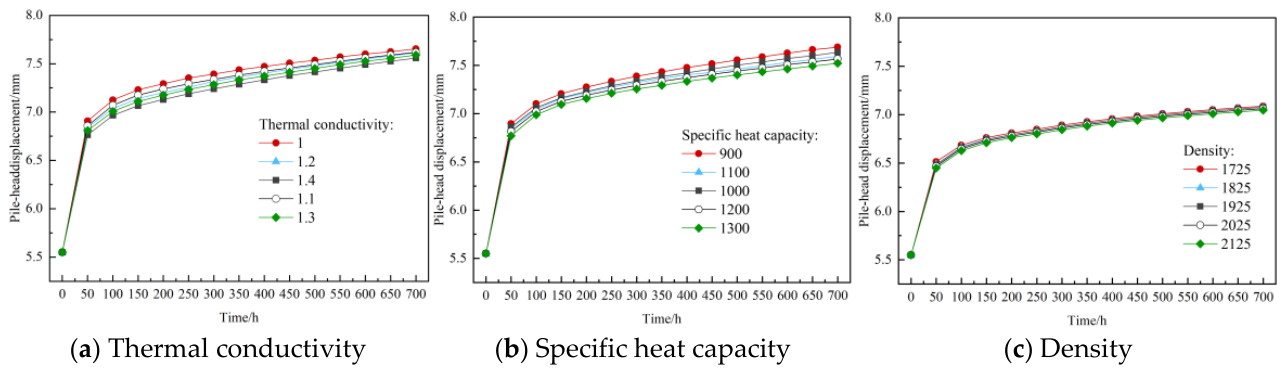

Disclaimer/Publisher’s Note: The statements, opinions and data contained in all publications are solely those of the individual author(s) and contributor(s) and not of MDPI and/or the editor(s). MDPI and/or the editor(s) disclaim responsibility for any injury to people or property resulting from any ideas, methods, instructions or products referred to in the content. |
© 2026 by the authors. Licensee MDPI, Basel, Switzerland. This article is an open access article distributed under the terms and conditions of the Creative Commons Attribution (CC BY) license.