


Abstract
Tight sandstone gas reservoirs are characterized by complex pore-throat structures, and the occurrence and transport of natural gas are jointly controlled by pore-throat size, mineral composition, water saturation, and other factors. Clarifying the intrinsic relationships between pore-throat structure and CO2/CH4 adsorption and diffusion is therefore important for understanding the microscopic mechanisms of CO2-enhanced gas recovery (CO2-EGR). In this study, three types of tight sandstone cores with different permeabilities from the Yan’an Gas Field were selected. Cast thin-section analysis, scanning electron microscopy, X-ray diffraction, nuclear magnetic resonance (NMR), and high-pressure mercury intrusion were employed to characterize the pore structure, mineral composition, and movable-fluid occurrence. Fractal analysis was further used to distinguish intragranular and intergranular pores. Based on experimentally determined pore-throat scales and mineral compositions, quartz and illite pore models were constructed, and grand canonical Monte Carlo (GCMC) and molecular dynamics (MDs) simulations were performed to investigate CO2/CH4 competitive adsorption and diffusion. The results show that larger pore throats become better developed and pore-throat connectivity improves markedly with increasing core permeability. The proportion of movable fluid in intergranular pores increases from 63.76% to 98.61%, while that in intragranular pores increases from 10.87% to 70.33%. Molecular simulation results indicate that CO2 exhibits a substantially stronger competitive adsorption capacity than CH4 in both quartz and illite pores. Increasing pressure favors gas adsorption, whereas increasing temperature, pore size, and water saturation alter the occurrence and transport characteristics of both gases. Under the same conditions, the diffusion coefficient of CH4 is consistently higher than that of CO2. Larger pore sizes and higher temperatures enhance gas diffusion, whereas increasing pressure and water saturation suppress diffusion. These findings provide a theoretical basis for evaluating CO2-EGR and geological CO2 storage in tight sandstone reservoirs.
1. Introduction
Tight sandstone gas is an important component of unconventional natural gas resources, and its large-scale development is of great significance for ensuring a stable natural gas supply and promoting the low-carbon transition of the energy system. Compared with conventional gas reservoirs, tight sandstone gas reservoirs are generally characterized by low porosity, low permeability, small pore-throat sizes, complex pore structures, and strong heterogeneity. The macroscopic petrophysical properties of tight sandstone are closely related to its microscopic mineralogical and textural characteristics. Mineral composition, grain packing, compaction, cementation, and clay-mineral filling jointly control the development and preservation of effective pore space and pore-throat connectivity. Consequently, variations in these microstructural characteristics can lead to pronounced differences in porosity, permeability, and fluid storage and transport capacity. Natural gas mainly occurs in residual intergranular pores, intragranular dissolution pores, intercrystalline pores within clay minerals, and microfractures. Its storage and transport capacities depend not only on pore volume, but also on throat radius, pore-throat connectivity, mineral filling, and structural heterogeneity [1,2,3]. Small throats generate high capillary pressure and strong flow resistance, which slow down formation pressure transmission and restrict natural gas migration from the far-field matrix toward hydraulic fractures and the wellbore. Meanwhile, bound water and movable water occupy part of the effective pore space and flow pathways, reducing the effective gas permeability and potentially causing water blocking and gas–water two-phase interference [4,5]. Consequently, tight sandstone gas reservoirs commonly suffer from low natural productivity, short stable-production periods, rapid production decline, and poor mobilization of remaining gas during the late stage of depletion. Clarifying pore-throat structural differences among reservoirs with different permeabilities and their controls on fluid occurrence and transport is therefore fundamental to evaluating the development potential of tight sandstone gas reservoirs and improving natural gas recovery.
To characterize the complex microscopic storage space of tight sandstones, researchers have employed a variety of techniques for multiscale pore-structure characterization, including cast thin-section analysis, scanning electron microscopy, X-ray diffraction, high-pressure mercury intrusion, rate-controlled mercury porosimetry, low-temperature gas adsorption, nuclear magnetic resonance, and X-ray micro-computed tomography [6,7,8,9]. NMR provides the advantages of rapid measurement and high sensitivity to pore fluids. By combining NMR measurements under fluid-saturated and post-centrifugation conditions, bound and movable fluids can be distinguished, and the contributions of pores at different scales to the effective storage space can be quantitatively evaluated [10,11]. Furthermore, integrating mercury-intrusion-derived pore-throat distributions, NMR relaxation spectra, and fractal theory makes it possible to establish a relationship between relaxation time and pore-throat size and to reveal the links among pore-throat complexity, connectivity, and fluid mobility [7,12]. Previous studies indicate that larger effective throats and better pore-throat connectivity generally favor movable-fluid occurrence and flow, whereas clay-mineral filling, compaction, and cementation increase pore-throat heterogeneity and reduce fluid mobility.
At the late stage of conventional depletion development, CO2 injection is considered an important approach for replenishing reservoir energy, enhancing natural gas recovery, and simultaneously achieving geological carbon storage. Injected CO2 can restore reservoir pressure and re-establish the driving pressure gradient, thereby displacing free CH4 in the pore space toward the production wells through gas–gas displacement. Meanwhile, differences in density, viscosity, and diffusion properties between CO2 and natural gas enable CO2 to contribute to pressure maintenance and gas displacement [13,14,15,16,17]. At the microscopic scale, CO2 generally exhibits a stronger affinity for mineral surfaces than CH4 and can competitively occupy high-energy adsorption sites, thereby promoting the desorption of adsorbed CH4 and its conversion into the free-gas state. Injected CO2 can also be retained underground over long periods through structural trapping, residual trapping, dissolution trapping, and mineral trapping. Therefore, CO2-EGR offers both resource-development and carbon-mitigation benefits [18,19,20,21]. Physical experiments and reservoir simulations indicate that the performance of CO2-EGR is jointly controlled by reservoir permeability, heterogeneity, water saturation, formation pressure, injection timing, injection rate, and injector–producer spacing [22,23,24,25,26]. High water saturation reduces the effective gas-filled pore space and hinders CO2 transport, whereas strong heterogeneity can lead to early breakthrough through preferential flow paths, thereby reducing CO2 sweep efficiency and CH4 displacement efficiency. Therefore, optimization of macroscopic injection and production parameters requires a clear understanding of the microscopic occurrence, competitive adsorption, and pore-scale diffusion mechanisms of CO2 and CH4.
Experimental adsorption measurements can determine the macroscopic adsorption capacities of real rocks for single- and multicomponent gases, but they cannot directly reveal the competitive occupation of mineral surface sites, adsorption-layer structures, or dynamic molecular transport processes. GCMC simulations can be used to calculate equilibrium adsorption capacity, adsorption selectivity, isosteric heat of adsorption, and spatial density distributions based on chemical potential, temperature, and pore models. MD simulations can further reveal molecular mobility and local interactions through molecular trajectories, mean square displacement, diffusion coefficients, and radial distribution functions [27,28,29,30,31]. In recent years, molecular simulation studies have expanded from ideal graphite slit pores to kerogen, quartz, illite, montmorillonite, and organic–inorganic composite pore models. The effects of temperature, pressure, pore size, water content, and mineral surface chemistry on CO2/CH4 competitive adsorption have also been systematically investigated [32,33,34,35,36,37,38]. In general, increasing temperature enhances molecular thermal motion and weakens gas adsorption, whereas increasing pressure promotes adsorption. However, the pressure dependence of CO2/CH4 selectivity is also affected by the saturation of high-energy adsorption sites, molecular packing, and intermolecular interactions [33,34,35,36,37,38,39]. Despite substantial progress in molecular simulation, most existing studies focus on coal and organic-rich shale, and the pore models are mainly limited to the nanometer scale. For tight sandstones dominated by quartz and clay minerals, cross-scale simulations constrained by experimentally determined pore-throat distributions and fluid occurrence remain limited. In particular, the combined effects of nano- to submicron-scale pores and mineral type on CO2/CH4 competitive adsorption and diffusion require further investigation [40,41]. Recent molecular studies have also highlighted the importance of explicitly defining the confined mineral-fluid model and interaction parameters when interpreting adsorption and transport behavior. GCMC and MD simulations in water-bearing kerogen and quartz nanopores show that water occupation and aggregation can reduce accessible pore space and suppress gas adsorption and diffusion [42,43]. Recent MD studies also explicitly specify force fields, non-bonded interaction treatments, boundary conditions, and equilibration procedures when analyzing molecular mobility from molecular trajectories [44]. These studies indicate that molecular-simulation results should be interpreted within the specific surface, hydration, pore, and thermodynamic conditions represented by the model rather than as universal properties of the bulk rock.
Accordingly, three types of tight sandstone cores with different permeabilities are selected in this study. Cast thin-section analysis, scanning electron microscopy, and X-ray diffraction are used to characterize pore types, microscopic morphology, and mineral composition. Nuclear magnetic resonance measurements under water-saturated and post-centrifugation conditions, together with high-pressure mercury intrusion, are further conducted to characterize multiscale pore-throat structures and movable-fluid occurrence. Based on the experimentally determined pore-throat scales and mineral compositions, quartz and illite pore models are constructed. GCMC and MD simulations are first employed to investigate the adsorption and pore-scale diffusion of single-component CH4 and CO2. A binary CO2/CH4 system is then established to systematically examine the effects of temperature, pressure, representative pore widths of 10, 20, 100, and 400 nm, and mineral type on competitive adsorption capacity, adsorption selectivity, molecular spatial distribution, and diffusion behavior. This study aims to establish the relationship between the macroscopic pore-throat structure and movable-fluid occurrence in tight sandstone and the molecular-scale adsorption and diffusion behaviors of CO2/CH4, thereby providing a theoretical basis for CO2-EGR and the evaluation of geological CO2 storage potential in tight sandstone reservoirs.
2. Experimental and Simulation Methods
2.1. Experimental Materials
The core samples used in the experiments were collected from the tight sandstone reservoir of the Shanxi Formation in the Yan’an Gas Field, at a burial depth of approximately 2300 m. Three intact cores spanning distinctly different permeability values within the target interval were selected as representative specimens to compare pore-structure and fluid-occurrence characteristics under different petrophysical conditions. All three cores exhibit typical low-porosity and low-permeability properties, and their basic petrophysical parameters are listed in Table 1. The selection of cores with different permeabilities allows a comparative analysis of how pore-throat structure, connectivity, and movable-fluid occurrence vary with reservoir flow capacity, and also provides an experimental basis for selecting representative pore scales and constructing mineral models in the subsequent molecular simulations. The aqueous phase used in the experiments was synthetic formation water prepared according to the properties of the target reservoir in the Yan’an Gas Field, and was mainly used for core saturation and nuclear magnetic resonance measurements.
Table 1.
Petrophysical properties of the tight sandstone core samples.
2.2. Experimental Setup
Before sample cutting, the porosity and gas permeability of Cores #1–#3 were measured using a porosity analyzer and a gas permeameter (Jiangsu Huaan Scientific Research Co., Ltd., Nantong, China), respectively, and the measured values are listed in Table 1. The microscopic pore structure of the tight sandstone was characterized using cast thin-section analysis and scanning electron microscopy (SEM). Cast thin sections were prepared using a ZT-2 high-pressure impregnation instrument (Jiangsu Lianyou Scientific Research Co., Ltd., Nantong, China) and examined with an NP-107 polarizing microscope (Nanjing Jiangnan Novel Optics Co., Ltd., Nanjing, China) to characterize grain composition, cementation features, and pore types, including intergranular pores, intragranular dissolution pores, and intercrystalline pores. SEM observations were performed using a Quanta 400 environmental scanning electron microscope (FEI, Hillsboro, OR, USA) to further characterize the microscopic morphology, pore structure, and the occurrence and filling characteristics of minerals such as kaolinite and illite within the pore space.
Nuclear magnetic resonance measurements were conducted using a MesoMR23-060 benchtop NMR imaging analyzer (Suzhou Niumag Analytical Instrument Corporation, Suzhou, China). Movable and bound fluid occurrence at different pore scales was identified by comparing the T2 spectra under water-saturated and post-centrifugation conditions. The pore-throat structure of the tight sandstone was characterized by high-pressure mercury intrusion using a PoreMaster 60 mercury porosimeter (Anton Paar, Graz, Austria), with a pore-size measurement range of 3.6 nm–1100 μm. By progressively increasing and subsequently decreasing the mercury intrusion pressure, mercury intrusion-extrusion capillary pressure curves were obtained. Parameters including displacement pressure, maximum mercury saturation, and pore-throat radius distribution were then determined, providing an experimental basis for pore-throat classification at different scales and pore-size conversion of the NMR T2 spectra.
2.3. Experimental Procedures
To ensure comparability among the different experimental results, the three tight sandstone plug cores listed in Table 1 were cut and allocated using the same procedure. First, a representative section approximately 2 cm in length was cut from one end of each intact core for cast thin-section analysis and scanning electron microscopy. The remaining core was then divided axially into two sections, each approximately 4 cm long. One section was used for high-pressure mercury intrusion measurements, while the other was used for NMR measurements under water-saturated and post-centrifugation conditions.
For the NMR measurements, the approximately 4 cm long core samples were first vacuum-treated and then saturated with synthetic formation water representative of the target reservoir in the Yan’an Gas Field for 24 h under constant pressure, ensuring sufficient entry of the formation water into the effective pore space. After saturation, the cores were placed in a low-field NMR analyzer, and the first T2 spectrum was acquired using the CPMG sequence to obtain fluid signals from pores of different sizes under fully saturated conditions. The cores were then centrifuged at 12,000 rpm for 1 h, corresponding to an equivalent centrifugal pressure of 2.07 MPa, to remove movable water from the pore space. Immediately after centrifugation, a second T2 spectrum was acquired. By comparing the changes in signal amplitude within different T2 intervals before and after centrifugation, the occurrence ranges and relative proportions of movable and bound fluids in the cores were determined.
For high-pressure mercury intrusion measurements, the core samples were first thoroughly dried to remove residual water from the pore space. The samples were then placed in the sample chamber of a PoreMaster 60 mercury porosimeter. At the low-pressure stage, mercury first entered the larger pores and throats near the core surface. The intrusion pressure was then progressively increased to force mercury into smaller pore-throat spaces, while the cumulative mercury intrusion volume was continuously recorded at different pressures. After the preset maximum pressure was reached, the pressure was gradually reduced and the mercury extrusion process was recorded. Complete mercury intrusion–extrusion capillary pressure curves and pore-throat radius distributions were thereby obtained. The NMR T2 spectra were converted to pore-radius distributions by calibration against the high-pressure mercury intrusion results of the corresponding cores. Because pore structure and surface properties differ among the three samples, the T2 to pore-radius conversion coefficient was calibrated separately for each core rather than applying a single constant to all samples. The calibrated conversion coefficients for Cores #1, #2, and #3 were 0.0239, 0.00124, and 0.00136 μm/ms, respectively.
2.4. Simulation Methods and Model Construction
To reveal the adsorption and diffusion behaviors of CO2 and CH4 in tight sandstone pores at the molecular scale, GCMC and MD simulations are employed in this study. In the GCMC simulations, gas molecules are randomly inserted, deleted, translated, and rotated under specified temperature, volume, and chemical potential conditions. Whether a newly generated configuration is accepted is determined according to the Metropolis criterion, allowing the system to gradually reach thermodynamic equilibrium. Based on the equilibrated molecular configurations, the adsorption capacity, spatial density distribution, and competitive adsorption characteristics of CO2 and CH4 under different temperatures, pressures, pore sizes, and mineral surface conditions are obtained.
The MD method describes the dynamic transport of CO2 and CH4 by solving Newton’s equations of motion for all atoms in the system and continuously tracking the trajectories of gas molecules within the pores. The mean square displacement (MSD) is calculated from the equilibrated molecular trajectories, from which the self-diffusion coefficients of the gases are further determined. The local interactions between gas molecules and mineral surfaces are also analyzed based on the spatial density distributions of the molecules. By combining GCMC and MD simulations, the occurrence and transport behaviors of CO2/CH4 in tight sandstone pores can be characterized from the perspectives of thermodynamic equilibrium adsorption and dynamic molecular migration, respectively.
Based on the mineral composition and multiscale pore-throat distribution obtained from the experiments, quartz and illite are selected as representative inorganic minerals, and slit-pore models with different pore sizes are constructed, as shown in Figure 1. Although the pore space of tight sandstone exhibits complex geometries, slit-pore models were adopted in this study to isolate the effects of mineral surface properties, pore size, temperature, pressure, and water saturation on CO2/CH4 adsorption and diffusion under controlled conditions. This idealized geometry also allows the distance from the mineral surface to be clearly defined, facilitating comparison of near-wall adsorption layers and molecular density profiles. It should be noted that pore curvature, pore-throat constriction, and irregular connectivity in real sandstone may affect the absolute adsorption and diffusion values. Therefore, the simulation results in this study are mainly interpreted in terms of relative trends and molecular-scale mechanisms rather than as direct quantitative representations of the full three-dimensional pore network. The quartz pore model is first constructed from a quartz unit cell. A stable quartz surface is obtained by cleaving the crystal along a selected crystallographic plane. The unit cell is then periodically expanded along the surface directions to form a quartz wall with a specified lateral dimension. Two parallel mineral walls are subsequently arranged, and slit pores of different sizes are constructed by adjusting the distance between the two surfaces. All molecular simulations were performed using Materials Studio 2024. The COMPASS III force field was employed to describe CO2, CH4, H2O, and the quartz and illite surfaces. The quartz model was constructed from a SiO2 structure, and the exposed quartz surfaces were fully hydroxylated. The illite model was constructed according to the structural formula Kx+1[Si(8−x)Alx](Al(4−x)Mgx)O20(OH)4 (x = 1). Periodic boundary conditions were applied. Long-range electrostatic interactions were calculated using the Ewald summation method, and van der Waals interactions were treated with a cutoff radius of 12.5 Å.
Figure 1.
Quartz and illite pore models with different pore sizes.
After the pore models were constructed, CO2 and CH4 adsorption was simulated within the mineral pore space following structural optimization and equilibration. GCMC adsorption simulations were performed using the Sorption module based on the Metropolis sampling scheme. At elevated pressures, gas fugacity was not assumed to be equal to the imposed pressure. Instead, the Peng–Robinson equation of state was used to convert pressure to fugacity, which was subsequently used in the GCMC calculations. Single-component adsorption simulations of CO2 and CH4 were first performed under different temperature, pressure, and pore-size conditions. A binary CO2/CH4 system was then constructed to investigate competitive adsorption under different mineral and water-saturation conditions. In the GCMC simulations, the numbers of CO2 and CH4 molecules were not fixed but were dynamically determined through molecular insertion and deletion under the specified temperature and fugacity conditions. For water-containing systems, the number of water molecules was determined according to the prescribed water saturation. The water molecules were initially distributed throughout the accessible pore space rather than being pre-arranged near the mineral surfaces. During equilibration, the water molecules spontaneously redistributed and preferentially accumulated near the hydrophilic quartz surfaces. The subsequent MD simulations were continued until the temperature and total energy reached stable fluctuations, after which the equilibrated trajectories were used for further analysis.
The equilibrated adsorption configurations obtained from the Sorption module were subsequently used as the initial configurations for MD simulations in the Forcite module. The MD simulations were conducted in the NVT ensemble using a Nosé thermostat, with a time step of 1 fs. The system was regarded as equilibrated when the temperature fluctuated stably around the prescribed value and the total energy reached a stable dynamic equilibrium. The equilibrated trajectories were then used to analyze molecular spatial distributions and diffusion behavior.
3. Results and Discussion
3.1. Pore Structure and Movable Fluid Occurrence Characteristics of Tight Sandstone
To clarify the microscopic pore structure and mineralogical characteristics of tight sandstone reservoirs with different permeabilities, cast thin-section analysis and scanning electron microscopy (SEM) are first performed on Cores #1, #2, and #3, and the results are shown in Figure 2. The cast thin sections show that all three cores are generally highly compact. However, obvious differences in pore types, pore development, and connectivity are observed as permeability increases. Core #1 has the lowest permeability of 0.0505 mD and is mainly characterized by a medium- to coarse-grained texture, with predominantly line contacts between grains. Pores are poorly developed overall, with only a few primary intergranular pores and intragranular dissolution pores locally observed, together with pronounced clay-rich filling. SEM observations further show that intergranular dissolution pores occur locally in Core #1. However, abundant flaky kaolinite and filamentous or hair-like illite fill the spaces between grains, occupying part of the effective pore space and reducing pore-throat size. This weakens pore-throat connectivity and is an important reason for the low permeability of Core #1. Multiple pore types can be identified in the cast thin sections of Core #2, including primary intergranular pores, intergranular dissolution pores, intragranular dissolution pores, and intercrystalline pores. The area filled with blue epoxy is clearly larger than that in Core #1, indicating better development of effective pore space. The rock is mainly coarse-grained, with moderate sorting, and a certain degree of quartz overgrowth is also observed. SEM images show that kaolinite, illite, and siliceous crystal aggregates still locally fill intergranular pores, while a certain number of intercrystalline micropores are also developed. Compared with Core #1, Core #2 has a larger effective storage space. However, clay minerals and siliceous cements still divide and block some pore throats, and therefore its overall flow capacity remains limited to some extent. Core #3 has the highest permeability of 0.568 mD. In addition to primary intergranular pores and intragranular dissolution pores, intercrystalline pores and microfractures are also observed in the cast thin sections, indicating a greater diversity of pore types. SEM observations show that dissolution pores are more extensively developed, and some microfractures connect with adjacent pores. In contrast, pore filling by clay minerals such as kaolinite and illite is relatively weak. The development of microfractures and dissolution pores not only increases the effective storage space but also promotes the formation of connected pathways among different pore types, thereby reducing pore-throat resistance to fluid transport. It should be noted that porosity does not increase monotonically with permeability among the three cores. This reflects the fact that permeability is controlled not only by total pore volume but also by effective pore-throat size, connectivity, and the development of microfractures.
Figure 2.
Cast thin-section and SEM images of cores with different permeabilities: (a) Core #1; (b) Core #2; (c) Core #3.
As described in Section 2.1, Cores #1–#3 were fully allocated to microscopic observation, NMR, and high-pressure mercury intrusion measurements. Therefore, XRD measurements were performed on seven additional cores (Cores #4–#10) collected from the same target stratigraphic interval. These samples span a permeability range of 0.0048–0.5690 mD and were selected to characterize the mineralogical composition range of the target tight sandstone interval. Accordingly, the XRD results are used to describe the dominant mineral phases and their compositional variations within the target interval, rather than being directly assigned to Cores #1–#3. The quantitative XRD results are summarized in Table 2 and Figure 3. The variations among the seven XRD samples also indicate that mineral composition is heterogeneous within the target interval. Therefore, the XRD results are interpreted as a compositional range for the studied reservoir interval rather than as the exact mineral composition of any individual core among Cores #1–#3. Quartz is the dominant mineral in the tight sandstone of the studied interval, with a relative content of 53.6–94.8%. Clay minerals account for 4.7–32.0%, together with minor amounts of plagioclase, ankerite, and siderite. In general, samples with higher permeability tend to contain more quartz and fewer clay minerals. However, this relationship is not strictly consistent, indicating that reservoir flow capacity is also jointly controlled by pore-throat structure and connectivity. Among the clay minerals, illite is dominant, with a relative content of 63.2–82.6%, followed by illite/smectite mixed layers, whereas kaolinite and chlorite occur in relatively low proportions. Combined with the observations in Figure 2, kaolinite and illite locally fill intergranular pores and pore throats, reducing the effective flow space and weakening pore-throat connectivity. In contrast, a higher quartz content and weaker clay-mineral filling are more favorable for the development of an effective pore-throat network.
Table 2.
Mineral composition and relative clay mineral contents of tight sandstone cores from the target interval.
Figure 3.
Mineral composition and relative clay mineral contents of tight sandstone cores with different permeabilities: (a) mineral composition; (b) relative clay mineral contents.
To further characterize the pore-size distribution and fluid occurrence characteristics of cores with different permeabilities, NMR T2 measurements were conducted on the three cores under water-saturated and post-centrifugation conditions, and the results are shown in Figure 4. As shown in Figure 4a, Core #1 exhibits a relatively broad T2 spectrum, with the signal mainly concentrated in the small-pore range and only a limited contribution from larger pores. This indicates that its pore sizes are generally small and broadly distributed. The overall difference between the saturated and post-centrifugation T2 spectra is relatively small, with only a moderate decrease in signal intensity in the medium- and large-pore ranges. This suggests that fluids in Core #1 are strongly constrained by capillary and surface forces, resulting in a relatively low proportion of movable fluid. Among the three selected cores, the higher-permeability samples (Cores #2 and #3) exhibit main T2 peaks shifted toward larger pore sizes and more concentrated distributions, indicating a greater development of relatively large effective pores. For Core #2, the main peak decreases markedly after centrifugation, suggesting that a considerable amount of movable fluid occurs in the larger pores. Core #3 exhibits an even more pronounced main T2 peak and the largest difference between the saturated and post-centrifugation spectra. Meanwhile, a certain amount of signal remains in the small-pore range, indicating a multiscale pore system, although fluids are mainly distributed in larger pores with better connectivity. Overall, as permeability increases, the main NMR T2 peak shifts toward larger pore sizes and the difference between the saturated and post-centrifugation spectra becomes more pronounced. This indicates that the development of larger pores and the improvement of pore-throat connectivity significantly enhance fluid mobility in tight sandstone.
Figure 4.
NMR T2 spectra of cores with different permeabilities under formation-water-saturated and post-centrifugation conditions: (a) Core #1; (b) Core #2; (c) Core #3.
To further clarify the differences in pore-throat structure among tight sandstone cores with different permeabilities, high-pressure mercury intrusion measurements were conducted on the three cores, and the results are shown in Figure 5. As shown in Figure 5a, the maximum mercury saturation of the cores ranges from approximately 56.3% to 83.9%, indicating substantial differences in pore-throat structural parameters. Among the three selected cores, the maximum mercury saturation is generally higher in the higher-permeability samples. Core #1 exhibits the lowest maximum mercury saturation, whereas those of Cores #2 and #3 are markedly higher, indicating that the higher-permeability cores contain a larger proportion of effective pore-throat space accessible to mercury. In addition, the mercury intrusion and extrusion curves of all three cores show varying degrees of hysteresis, reflecting strong pore-throat heterogeneity and pronounced differences in pore-throat configuration within the tight sandstone. As shown in Figure 5b, Core #1 exhibits a relatively broad pore-throat size distribution, mainly ranging from approximately 0.005 to 0.15 μm. The distribution is relatively dispersed and lacks a distinct dominant pore-throat peak, indicating poor pore-throat sorting and strong heterogeneity. In contrast, Cores #2 and #3 both show more pronounced main peaks. The pore throats of Core #2 are mainly concentrated in the range of approximately 0.05–0.10 μm, whereas the dominant pore-throat distribution of Core #3 shifts further toward larger radii and extends to larger pore-throat sizes.
Figure 5.
Pore-throat structure characteristics of cores with different permeabilities obtained from high-pressure mercury intrusion: (a) mercury intrusion–extrusion capillary pressure curves; (b) pore-throat radius distribution frequency.
Fractal theory can be used to quantitatively characterize the heterogeneity and self-similarity of complex porous media at different scales. For tight sandstone, the pore-throat size spans a wide range, and pore throats at different scales differ markedly in their formation mechanisms, geometries, and connectivity. Therefore, the pore structure generally does not follow a single fractal pattern but instead exhibits dual- or triple-fractal characteristics. Based on the fractal relationship between mercury saturation and pore-throat radius, the fractal analysis was performed according to the following equation:
where SHg is the mercury saturation, r is the pore-throat radius, and Df is the fractal dimension. According to this relationship, SHg was plotted against Log(r), and the data were fitted using piecewise linear regression. On a double-logarithmic plot, different pore-throat size ranges can be represented by linear fitting segments with different slopes, and the transition points between adjacent segments are defined as fractal inflection points. The characteristic pore-throat sizes corresponding to these inflection points can be used to distinguish different pore types and further establish a link between the pore-throat distribution derived from high-pressure mercury intrusion and fluid occurrence obtained from NMR measurements. The fractal fitting results of the three cores with different permeabilities are shown in Figure 6. The relationship between mercury saturation and pore radius for all three cores can be divided into three linear regions with different slopes, indicating distinct scaling characteristics over different pore-throat size ranges. This indicates that the pore structures of the tight sandstones in the study area show distinct triple-fractal characteristics. As pore radius increases, the slopes of the fitted segments change significantly, indicating that pore throats at different scales differ in structural complexity and spatial distribution. The two fractal inflection points represent the scale-transition boundaries between adjacent pore-throat structure regions and provide an important basis for subsequent pore-type classification. In particular, the pore-throat radius corresponding to the first fractal inflection point serves as an important reference for distinguishing intragranular pores from intergranular pores.
Figure 6.
Fractal fitting and identification of fractal inflection points from high-pressure mercury intrusion data for cores with different permeabilities: (a) Core #1; (b) Core #2; (c) Core #3.
A further comparison among the three cores shows that the pore radii corresponding to the first fractal inflection point are 0.1757, 0.1830, and 0.1931 μm for Cores #1, #2, and #3, respectively. As permeability increases from 0.0505 to 0.568 mD, the first fractal inflection point shifts toward larger pore sizes. Combined with the high-pressure mercury intrusion and NMR results described above, this indicates that higher-permeability cores contain more well-developed and better-connected effective pore throats at relatively large scales, whereas lower-permeability cores exhibit a more dispersed pore-throat size distribution and stronger structural heterogeneity. Therefore, fractal fitting not only reflects the complexity of the multiscale pore-throat structure in tight sandstone, but also allows the critical scales separating different pore-structure regions to be identified from the fractal inflection points. This provides a basis for subsequently combining the fractal results with NMR T2 spectra to distinguish intergranular and intragranular pores and to identify the occurrence ranges of movable fluids.
Based on the fractal inflection points obtained from Figure 6, the pore-throat radius corresponding to the first fractal inflection point is taken as the boundary between intragranular and intergranular pores and is mapped onto the NMR-derived pore-size distribution curves, as shown in Figure 7. The NMR pore-size distribution is thereby divided into intragranular- and intergranular-pore regions. The differences between the water-saturated and post-centrifugation T2 spectra are then used to further identify movable fluids within the different pore types. In the figure, S1 and S2 represent the bound and movable fluids in intragranular pores, respectively, whereas S3 and S4 represent the movable and bound fluids in intergranular pores, respectively. These areas are used to calculate the proportions of movable fluid in intragranular and intergranular pores. The S1-S4 areas were determined from the integrated NMR T2 signal amplitudes within the corresponding pore-size intervals, based on the difference between the water-saturated and post-centrifugation spectra, and were then used to calculate the relative movable-fluid proportions in intragranular and intergranular pores. As shown in Figure 7, the NMR signals of all three tight sandstone cores are still mainly concentrated in the smaller-pore-size range, indicating that small-scale pores constitute the dominant storage space in the studied reservoir. In Core #1, the water-saturated and post-centrifugation T2 spectra show a high degree of overlap on the left side of the fractal inflection point, indicating a relatively low proportion of movable fluid in intragranular pores. With increasing permeability, the differences between the saturated and post-centrifugation T2 spectra become more pronounced for Cores #2 and #3, particularly within the pore-size range corresponding to the main peak, where a stronger movable-fluid signal is observed. This indicates a marked improvement in pore connectivity and fluid mobility. Overall, intragranular pores account for a relatively large proportion of the pore system in all three cores, while the proportion of movable fluid increases significantly with increasing permeability.
Figure 7.
NMR-based identification of pore types and fluid occurrence using fractal inflection points for cores with different permeabilities: (a) Core #1; (b) Core #2; (c) Core #3.
The proportions of movable fluid in intragranular and intergranular pores for cores with different permeabilities are shown in Figure 8. Clear differences are observed between the movable-fluid proportions in the two pore types. In Core #1, the movable-fluid proportion in intragranular pores is only 10.87%, whereas that in intergranular pores reaches 63.76%. This indicates poor connectivity of intragranular pores and strong fluid confinement in the low-permeability core, with movable fluid occurring mainly in the better-connected intergranular pores. As permeability increases, the movable-fluid proportions in the intragranular and intergranular pores of Core #2 increase to 69.48% and 84.26%, respectively, indicating a marked improvement in pore-throat connectivity. As a result, part of the fluid in intragranular pores can also participate in transport through effective pore throats. For Core #3, which has the highest permeability, the movable-fluid proportion in intragranular pores further increases to 70.33%, while that in intergranular pores reaches 98.61%. The fluid in the intergranular pores is therefore almost entirely movable, indicating that larger pore throats and good connectivity provide the primary pathways for fluid transport. Overall, as permeability increases from 0.0505 to 0.568 mD, the proportions of movable fluid in both intragranular and intergranular pores increase substantially. The increase and absolute proportion are more pronounced for intergranular pores, demonstrating that improved intergranular-pore connectivity is a key factor controlling flow capacity and fluid mobilization in tight sandstone. Meanwhile, the substantial increase in movable fluid within intragranular pores in the higher-permeability cores indicates that, as the pore-throat network improves, some previously isolated or poorly connected intragranular pores become effectively connected to the main flow pathways, thereby enhancing overall fluid mobilization.
Figure 8.
Proportion of movable fluid in intragranular and intergranular pores of tight sandstone cores with different permeabilities.
3.2. Molecular-Scale Simulation of CO2/CH4 Competitive Adsorption and Diffusion
3.2.1. CO2/CH4 Competitive Adsorption and Influencing Factors
To clarify the differences in adsorption behavior and the competitive adsorption characteristics of CO2 and CH4 in tight sandstone pores, single-component adsorption simulations of CO2 and CH4 are first conducted using quartz pore models to examine the effects of temperature, pressure, and pore size. On this basis, a binary CO2/CH4 system is constructed to further investigate the effects of temperature, pressure, pore size, mineral type, and water saturation on competitive adsorption capacity, adsorption selectivity, and molecular spatial distribution. The objective is to clarify the preferential adsorption of CO2 and its competitive displacement of CH4 under different reservoir conditions, thereby providing a molecular-scale basis for understanding CO2-EGR in tight sandstone reservoirs. To evaluate the effects of temperature and pressure on single-component adsorption under representative pore conditions, CO2 and CH4 adsorption simulations were performed in 10 nm and 20 nm pore models, and the results are shown in Figure 9.
Figure 9.
Equilibrium numbers of CO2 and CH4 molecules in different pore-size models at various temperatures and pressures: (a) 10 nm pore model; (b) 20 nm pore model.
As shown in Figure 9, in both the 10 nm and 20 nm pore models, the number of adsorbed CO2 and CH4 molecules continuously increases with increasing pressure, while it generally decreases with increasing temperature. At a given temperature, as the pressure increases from 2 to 20 MPa, the gas density within the pore increases and more adsorption sites on the mineral surface become occupied. As a result, the equilibrium molecular populations of CO2 and CH4 within the pore increase markedly. In contrast, increasing temperature enhances the thermal motion of gas molecules, allowing adsorbed molecules to more readily overcome the interactions with the mineral surface and desorb. Therefore, at a given pressure, the equilibrium molecular population within the pore gradually decreases as the temperature increases from 60 to 100 °C. Moreover, the difference in adsorption among different temperatures becomes more pronounced with increasing pressure, indicating that temperature exerts a stronger influence on gas adsorption under high-pressure conditions. Under the same temperature, pressure, and pore-size conditions, the number of adsorbed CO2 molecules is consistently higher than that of CH4. This indicates that the mineral surface has a stronger adsorption affinity for CO2. The stronger adsorption of CO2 is mainly attributed to its pronounced quadrupole moment and molecular polarizability, which result in stronger electrostatic and van der Waals interactions with the mineral surface. In contrast, nonpolar CH4 interacts more weakly with the mineral surface. Therefore, when CO2 and CH4 coexist, CO2 has the potential to preferentially occupy mineral surface adsorption sites and competitively displace CH4, providing a basis for the subsequent analysis of CO2/CH4 competitive adsorption. It should be noted that the molecule numbers reported in Figure 9 represent the equilibrium molecular populations within the specific simulation cells. Because the pore models have different volumes, these values are not normalized adsorption capacities and are therefore not used for direct quantitative comparison between different pore sizes. Instead, Figure 9 is mainly used to compare the effects of temperature and pressure within each pore model and the relative adsorption behavior of CO2 and CH4 under identical model conditions.
Competitive adsorption simulations of a binary CO2/CH4 system are conducted in the 10 nm pore model under different temperature and pressure conditions. The occurrence characteristics of the two gases near the mineral walls and in the pore center are analyzed using axial mass-density profiles, as shown in Figure 10. As shown in Figure 10a,b, at 90 °C, the mass densities of both CO2 and CH4 increase markedly with increasing pressure. Distinct density peaks appear near both mineral walls, whereas the density in the central region of the pore remains relatively stable. This indicates the formation of well-defined adsorption layers on the mineral surfaces. As the pressure increases from 2 to 20 MPa, both the near-wall adsorption peaks and the gas density in the pore interior increase continuously. This shows that increasing pressure not only promotes adsorption on the mineral surface but also increases the number of gas molecules in the free pore space. Compared with CH4, CO2 exhibits a much higher near-wall mass density and more pronounced adsorption peaks over the entire pressure range. For example, at 20 MPa and 90 °C, the peak mass density of CO2 near the mineral wall reaches approximately 0.65 g·cm−3, whereas that of CH4 is only about 0.11 g·cm−3. This further demonstrates the substantially stronger adsorption affinity of the mineral surface for CO2 under the same pore and thermodynamic conditions. The difference is mainly associated with the stronger quadrupole moment and polarizability of CO2, which lead to stronger electrostatic and van der Waals interactions with the mineral surface, whereas nonpolar CH4 interacts more weakly with the surface. Consequently, in the binary CO2/CH4 system, CO2 preferentially occupies adsorption sites near the mineral walls and exhibits a clear competitive adsorption advantage. For CO2, the increase in the pore-center density becomes more pronounced at higher pressures. At low pressures, the equilibrium number of CO2 molecules in the pore is relatively small, and a large fraction of these molecules preferentially occupies the high-affinity adsorption sites near the mineral surfaces. Therefore, the CO2 density in the pore-center region remains very low. As pressure increases, the equilibrium molecular population determined by the GCMC simulation increases continuously, while the available surface adsorption sites become progressively occupied and approach saturation. Consequently, an increasing proportion of CO2 molecules remains in the relatively free pore space, leading to a more pronounced increase in the pore-center density at higher pressures. This interpretation is also consistent with Figure 9, where the number of adsorbed CO2 molecules continues to increase with pressure but with a gradually decreasing slope. Figure 10c,d further illustrate the effect of temperature on competitive adsorption. At 12 and 20 MPa, the near-wall mass densities of both CO2 and CH4 generally decrease as the temperature increases from 60 to 90 °C, and the gas densities in the pore center also decrease to some extent. Increasing temperature enhances molecular thermal motion and enables adsorbed molecules to more readily overcome the adsorption potential of the mineral surface, thereby weakening gas enrichment near the pore walls. Nevertheless, the adsorption peaks of CO2 remain distinctly higher than those of CH4 at all temperatures. This indicates that temperature changes affect the absolute adsorption levels of both gases but do not alter the preferential adsorption of CO2 over CH4. Overall, increasing pressure promotes the adsorption and enrichment of CO2 and CH4 within the pore, whereas increasing temperature weakens adsorption. Under all investigated temperature and pressure conditions, CO2 exhibits a substantially stronger affinity for the mineral surface than CH4. This preferential adsorption enables injected CO2 to occupy mineral surface adsorption sites and compete with initially adsorbed CH4, providing a molecular-scale basis for the displacement of adsorbed CH4 by CO2 and enhanced natural gas recovery in tight sandstone reservoirs.
Figure 10.
Mass density distributions of CO2/CH4 competitive adsorption in the 10 nm pore model under different temperatures and pressures: (a) CH4 mass density distributions at different pressures and 90 °C; (b) CO2 mass density distributions at different pressures and 90 °C; (c) CO2 and CH4 mass density distributions at different temperatures and 12 MPa; (d) CO2 and CH4 mass density distributions at different temperatures and 20 MPa.
To link the molecular simulations with the experimentally characterized pore structure, the pore sizes used in this analysis were selected with reference to the characteristic pore-throat size ranges obtained from the MICP measurements. The experimental results indicate that the tight sandstone contains abundant pore-throat scales ranging from tens to hundreds of nanometers. Therefore, 20, 100, and 400 nm slit-pore models were selected as representative pore scales to investigate the influence of pore size on CO2/CH4 competitive adsorption and spatial distribution. Accordingly, at 12 MPa and 90 °C, quartz pore models with pore sizes of 20, 100, and 400 nm were used to investigate the effects of pore size on CO2/CH4 competitive adsorption and spatial distribution, as shown in Figure 11. For pores substantially larger than the characteristic range of wall-gas interactions, the influence of the mineral surface is expected to be concentrated mainly within the near-wall adsorption region, while molecules farther from the surface increasingly exhibit bulk-like behavior. Therefore, for the 20–400 nm pore models considered here, the pore-size effect is interpreted primarily in terms of the relative proportion of pore space influenced by the mineral walls and the resulting spatial redistribution of gas molecules, rather than as a long-range wall potential acting across the entire pore. The local mass-density profiles in Figure 11 are therefore used to evaluate the spatial effect of pore size, rather than directly comparing the unnormalized molecular populations shown in Figure 9. As shown in the figure, distinct mass density peaks of both CO2 and CH4 appear near the quartz surfaces at all pore sizes, indicating adsorption of both gases on the mineral surface. With increasing distance from the pore wall, the gas mass density decreases rapidly and then gradually approaches a stable value, suggesting that the influence of the quartz surface on gas molecules is mainly concentrated in the near-wall region. As the pore size increases from 20 to 100 and 400 nm, the relative contribution of the near-wall adsorption region to the total pore space decreases, whereas an increasingly large fraction of the pore-center region exhibits relatively free-gas behavior. Accordingly, the profiles in Figure 11 are mainly used to characterize the localization of wall-induced enrichment and the transition toward bulk-like behavior with increasing pore size, rather than to infer a monotonic pore-size dependence of the absolute pore-center density. In addition, at the same pore size, the mass density of CO2 near the quartz surface is consistently much higher than that of CH4, and this difference is most pronounced in the 20 nm pore. This indicates that CO2 exhibits stronger interfacial enrichment and competitive adsorption in quartz pores. With increasing pore size, the degree of near-wall enrichment of both gases gradually weakens, and the adsorption advantage of CO2 over CH4 becomes increasingly confined to the local region near the mineral surface. These results demonstrate that pore size is an important factor controlling CO2/CH4 competitive adsorption. Smaller pores exhibit stronger confinement and surface effects, which favor the preferential enrichment of CO2, whereas with increasing pore size, gas occurrence gradually shifts from surface-adsorption-dominated behavior toward occupation of the free pore space.
Figure 11.
Mass density distributions of CO2/CH4 competitive adsorption in quartz pores with different pore sizes (12 MPa, 90 °C): (a) CH4; (b) CO2.
Under the same pore size and thermodynamic conditions, the competitive adsorption behaviors of CO2 and CH4 in 20 nm quartz and illite pore models are compared, and the results are shown in Figure 12. It can be seen that, in both mineral models, distinct mass density peaks of CO2 and CH4 appear near the pore walls, then decrease rapidly with increasing distance from the mineral surface, and gradually become relatively stable in the central region of the pore. This indicates that both gases exhibit obvious adsorption enrichment near the mineral surfaces. A comparison of Figure 12a,b shows that, in both quartz and illite pores, the near-wall mass density of CO2 is significantly higher than that of CH4. In the quartz model, the near-wall peak mass density of CO2 is about 0.52 g·cm−3, whereas that of CH4 is only about 0.10 g·cm−3. In the illite model, the corresponding near-wall peak values are about 0.43 g·cm−3 for CO2 and 0.08 g·cm−3 for CH4. These results indicate that, regardless of mineral type, CO2 exhibits a much stronger surface enrichment capacity than CH4 and thus has a clear competitive adsorption advantage in the binary system. Certain differences are also observed between the two minerals. Under the current model conditions, both the near-wall peak values and the overall mass densities in the pore interior for CO2 and CH4 are higher in the quartz model than in the illite model, indicating that quartz exhibits a stronger adsorption enrichment effect for both gases. Differences in surface atomic composition, surface charge distribution, and the nature of adsorption sites can alter the interactions between gas molecules and mineral surfaces, thereby leading to differences in adsorption behavior under different mineral conditions. Overall, mineral type significantly affects the spatial distributions of CO2 and CH4 as well as the intensity of competitive adsorption. However, CO2 maintains a clear preferential adsorption behavior in both types of mineral pores, indicating that mineral composition is an important microscopic factor controlling the competitive displacement of CH4 by CO2 in tight sandstone.
Figure 12.
Mass density distributions of CO2/CH4 competitive adsorption in 20 nm quartz and illite pore models: (a) CH4; (b) CO2.
Based on the reservoir water occurrence characteristics reflected by the NMR measurements under water-saturated and post-centrifugation conditions, the water saturation in the model (Sw) is set to 0%, 30%, 50%, and 80%, respectively, and CO2/CH4 competitive adsorption simulations are performed at 12 MPa and 90 °C. The results are shown in Figure 13. It can be seen that, under different water saturation conditions, both CO2 and CH4 exhibit distinct mass density peaks near the pore walls, indicating that the mineral surface remains the main adsorption region for gas molecules. As Sw increases, both the near-wall adsorption peaks and the gas mass densities within the pore generally decrease, with the most pronounced reduction observed at Sw = 80%. This indicates that a high water saturation significantly suppresses the adsorption and enrichment of CO2 and CH4 within the pore space. This behavior is mainly related to the occupation of mineral surface adsorption sites and effective pore space by water molecules. As water saturation increases, water molecules preferentially accumulate on hydrophilic mineral surfaces and gradually form adsorbed water films or local water clusters. On the one hand, they occupy the original gas adsorption sites and weaken the direct interactions between gas molecules and mineral surfaces. On the other hand, they reduce the pore space available for gas molecules and hinder their migration toward the pore walls. As a result, the adsorption of both CO2 and CH4 is suppressed. Especially under high-water-saturation conditions, the gas density peaks near the pore walls decrease significantly, indicating that the controlling effect of water on surface adsorption becomes stronger. As illustrated by the representative molecular configurations in Figure 13c,d, the interfacial water layers and local water clusters formed after equilibration are not perfectly symmetric on the two pore surfaces. This nonuniform local water distribution results in slight differences in the available adsorption sites and accessible pore space on the two sides and is therefore considered the main reason for the slight asymmetry observed in the CH4 density profiles. A comparison of the two gases further shows that, at the same water saturation, the mass density and near-wall enrichment degree of CO2 are consistently higher than those of CH4. This indicates that although the presence of water weakens the overall gas adsorption, CO2 still maintains a clear competitive adsorption advantage. Overall, water saturation is an important factor affecting CO2/CH4 competitive adsorption in tight sandstone. Increasing water saturation significantly reduces the effective adsorption space and the surface enrichment capacity of gas molecules, whereas the preferential adsorption of CO2 still persists under high-water-saturation conditions.
Figure 13.
Mass density distributions and representative molecular configurations of CO2/CH4 competitive adsorption under different water saturation conditions (12 MPa, 90 °C): (a) CH4 mass density distributions; (b) CO2 mass density distributions; (c) initial molecular configuration at Sw = 80%; (d) equilibrated molecular configuration at Sw = 80%.
3.2.2. Molecular Simulation of CO2/CH4 Diffusion Behavior
In molecular dynamics simulations, the diffusion capability of gas molecules can be characterized by the mean square displacement (MSD), which has been widely used to evaluate molecular mobility and diffusion behavior in confined porous systems. In the present study, the late-stage MD trajectories after the system had reached a stable diffusion state were used for MSD analysis, thereby avoiding the influence of the initial transient relaxation stage. The MSD is calculated as follows:
where N is the total number of CO2 or CH4 molecules within the accessible pore space included in the MSD analysis, and ri (0) and ri (t) denote the positions of the ith molecule at the initial time and at time t, respectively. The MSD calculation includes all gas molecules in the pore rather than only molecules located in the near-wall adsorption region. Therefore, the calculated diffusion coefficient represents the overall self-diffusion behavior of the confined gas population. When the system reaches the stable diffusion regime, MSD exhibits an approximately linear relationship with time. The corresponding MSD slope, KMSD, is expressed as:
According to the three-dimensional Einstein diffusion relation, the self-diffusion coefficient D can be calculated as:
Therefore,
Accordingly, the diffusion coefficient was determined from one-sixth of the slope of the linear MSD-time relationship in the stable late-stage diffusion interval. Similar MSD-based procedures have been widely employed in previous MD studies of gas and molecular diffusion in confined systems [42,43,44]. The goodness of the linear fitting was evaluated using the coefficient of determination (R2). Taking the simulation results for the 10 nm pore model at 2 MPa and 60 °C as an example, the MSD curves of CO2 and CH4 and their corresponding linear fitting results are shown in Figure 14. The MSD values of both gases continuously increase with simulation time and exhibit good linear relationships in the steady diffusion regime. The coefficients of determination (R2) for the fitted CH4 and CO2 curves are 0.99959 and 0.99876, respectively, confirming the strong linearity of the MSD-time relationship within the selected late-stage diffusion interval. The diffusion coefficient of CH4 in the pore is significantly higher than that of CO2, indicating that CH4 has stronger molecular mobility under the same temperature, pressure, and pore conditions, whereas CO2 diffusion is more strongly restricted by adsorption on the pore walls. This result is consistent with the competitive adsorption results discussed above. The stronger adsorption affinity of CO2 for the mineral surface imposes greater constraints on its molecular motion, whereas CH4 interacts more weakly with the pore walls and therefore exhibits a higher diffusion coefficient. The overall simulation results likewise show that, at the same temperature and pressure, the diffusion coefficient of CO2 is lower than that of CH4.
Figure 14.
MSD curves and linear fitting results of CO2 and CH4 in the 10 nm pore model at 2 MPa and 60 °C.
Based on the MSD linear fitting method shown in Figure 14, the diffusion coefficients of CO2 and CH4 in the 10 nm pore model under different temperature and pressure conditions are calculated, and the results are shown in Figure 15. It can be seen that, at the same temperature and pressure, the diffusion coefficient of CH4 is generally higher than that of CO2, indicating that CH4 has stronger molecular mobility in quartz pores. This is mainly because CO2 has a stronger quadrupole moment and interacts more strongly with mineral surfaces, resulting in stronger adsorption and greater restriction of molecular motion by the pore walls. In contrast, CH4 interacts more weakly with the mineral surface and therefore exhibits a higher diffusion capability. This trend is consistent with the preferential adsorption behavior of CO2 discussed above. Pressure has a pronounced effect on the diffusion behavior of both gases. As the pressure increases from 2 to 20 MPa, the diffusion coefficients of both CO2 and CH4 generally decrease, with the most pronounced reduction occurring in the low-pressure range. Increasing pressure raises the number of gas molecules and the fluid density within the pore, increases the frequency of intermolecular collisions, and promotes molecular enrichment near the mineral surface, thereby restricting free molecular migration. As the pressure increases further, the decline in diffusion coefficient gradually becomes less pronounced and tends to level off. For CO2, fluid density and adsorption state change more markedly in the pressure range near its critical pressure, making its diffusion behavior more sensitive to pressure variations. Increasing temperature generally promotes gas diffusion. At the same pressure, the diffusion coefficients of both CH4 and CO2 at 90 °C are generally higher than those at 60 °C, with CH4 showing a more pronounced temperature response. This is because higher temperature enhances molecular thermal motion and increases molecular kinetic energy, while also weakening gas adsorption on the pore walls. As a result, molecular mobility within the pore space is enhanced. Overall, increasing temperature promotes the diffusion of CO2 and CH4, whereas increasing pressure suppresses their diffusion. The stronger adsorption of CO2 on mineral surfaces results in a lower diffusion capability than that of CH4. These results indicate that gas transport in tight sandstone is jointly controlled by mineral-surface adsorption, molecular thermal motion, and pore-fluid density.
Figure 15.
Diffusion coefficients of CO2 and CH4 in the 10 nm pore model under different temperature and pressure conditions.
Based on the molecular dynamics simulation results for different pore-size models, the diffusion coefficients of CO2 and CH4 at 12 MPa and 90 °C are calculated, as shown in Figure 16. It can be seen that the diffusion coefficients of both gases increase markedly with increasing pore size, indicating that pore size has a significant influence on molecular mobility. In smaller pores, gas molecules are strongly constrained by both adsorption on the mineral walls and spatial confinement, resulting in relatively low diffusion coefficients. As the pore size increases, the influence of the pore walls on gas molecules within the pore gradually weakens, while the space available for free molecular motion increases. Because the diffusion coefficients are calculated from all gas molecules within the pore, the relative contribution of the near-wall adsorbed population decreases as the pore size increases, whereas the contribution of molecules in the relatively free pore-center region becomes progressively larger. Consequently, the overall diffusion behavior increasingly approaches bulk-like molecular mobility in the larger pore models. As a result, the diffusion capabilities of both CO2 and CH4 are significantly enhanced. At the same pore size, the diffusion coefficient of CH4 is consistently higher than that of CO2, and the difference between the two gases gradually increases with increasing pore size. At larger pore sizes, the overall diffusion coefficient reflects contributions from both near-wall adsorbed molecules and increasingly bulk-like molecules in the pore center. The lower overall diffusivity of CO2 relative to CH4 is therefore interpreted as the combined result of stronger interfacial adsorption and differences in molecular transport properties under the same thermodynamic conditions. In the 400 nm pore model, the diffusion coefficients of CH4 and CO2 reach approximately 309 and 172 Å2·ps−1, respectively, which are substantially higher than those in the smaller-pore models. This difference is mainly related to the different interaction strengths between the two gases and the mineral surface. CO2 exhibits stronger surface adsorption, and its migration is therefore more strongly restricted by the pore walls. In contrast, CH4 interacts more weakly with the mineral surface and thus exhibits a higher diffusion capability. Overall, increasing pore size weakens the confinement effect and enhances gas diffusion. Larger pores are more favorable for the rapid migration of CH4 and CO2, whereas gas transport in smaller pores is more strongly controlled by surface adsorption.
Figure 16.
Diffusion coefficients of CO2 and CH4 under different pore-size conditions (12 MPa, 90 °C).
Based on the late-stage MD trajectories under different water saturation conditions, the diffusion coefficients of CO2 and CH4 at 12 MPa and 90 °C were calculated from one-sixth of the slope of the linear MSD-time relationship using all gas molecules within the accessible pore space, following the same procedure described above. The results are shown in Figure 17. It can be seen that the diffusion coefficients of both gases decrease markedly as water saturation increases from 0% to 80%. The largest decrease occurs within the 0–30% water saturation range, after which the reduction gradually becomes less pronounced. The diffusion coefficient of CH4 decreases from 44.06 Å2·ps−1 under dry conditions to 25.09 Å2·ps−1 at 80% water saturation, while that of CO2 decreases from 33.12 to 21.21 Å2·ps−1. These results indicate that increasing water saturation substantially suppresses the mobility of gas molecules. It should be noted that increasing water saturation produces two competing effects on gas mobility. On the one hand, water adsorption on the hydrophilic quartz surface reduces the number of direct gas–mineral adsorption sites and shifts part of the gas population away from the near-wall adsorption region, which by itself would tend to enhance molecular mobility. On the other hand, the accumulated water films and local water clusters occupy a substantial fraction of the accessible pore space and reduce the continuity of the gas-phase region. Under the conditions investigated here, the latter spatial-confinement effect dominates over the mobility enhancement associated with weakened gas-surface adsorption, resulting in an overall decrease in the diffusion coefficients of both CO2 and CH4 with increasing water saturation. This behavior is mainly attributed to the occupation of part of the effective pore space by water molecules and the formation of adsorbed water films or local water clusters on the mineral surface and within the pore space. These water structures reduce the effective space available for gas migration and increase the tortuosity of the diffusion pathways. As water saturation continues to increase, the continuous gas-phase space available for the free migration of CO2 and CH4 is further compressed, resulting in a gradual decrease in the diffusion coefficients. Compared with the low-water-saturation stage, the diffusion coefficients vary more gradually at higher water saturations, indicating that the restriction imposed by the water phase on gas transport tends to stabilize. In addition, the diffusion coefficient of CH4 remains higher than that of CO2 under all water saturation conditions, indicating that the stronger adsorption of CO2 on the mineral surface continues to impose greater constraints on its molecular migration. Overall, reservoir water not only alters the competitive adsorption behavior of CO2/CH4 but also reduces the diffusion capabilities of both gases by compressing the effective gas-phase space and increasing molecular transport resistance. Therefore, high water saturation is unfavorable for the rapid migration of CO2 and CH4 in tight sandstone pores.
Figure 17.
Diffusion coefficients of CO2 and CH4 under different water saturation conditions (12 MPa, 90 °C).
The adsorption and diffusion results further indicate a trade-off between interfacial retention and molecular transport in tight sandstone pores. Under the present model conditions, CO2 exhibits stronger near-wall enrichment than CH4, whereas its diffusion coefficient remains lower. This suggests that stronger gas–mineral interactions favor CO2 retention near mineral surfaces but simultaneously restrict molecular mobility. The mineral dependence observed here should be interpreted within the specific quartz and illite models employed, because surface hydroxylation, atomic structure, and charge distribution can substantially affect gas–mineral interactions. Similarly, the pore-size results reveal competing effects: smaller pores enhance the relative importance of surface adsorption, whereas larger pores reduce the fraction of surface-influenced space and promote more bulk-like molecular transport. Therefore, pore-size heterogeneity may simultaneously favor CO2 retention in smaller pores and gas migration through larger pores. At the reservoir scale, these molecular-scale effects may influence CO2 storage and CH4 recovery, but breakthrough and sweep efficiency will additionally depend on pore connectivity, fractures, permeability heterogeneity, and pressure-driven flow, which are beyond the scope of the present molecular models. Accordingly, the simulation results are primarily interpreted in terms of relative trends and molecular-scale mechanisms rather than direct predictions of field-scale transport performance.
4. Conclusions
In this study, cast thin-section analysis, scanning electron microscopy, X-ray diffraction, nuclear magnetic resonance, and high-pressure mercury intrusion are used to characterize the pore-throat structure and fluid occurrence of tight sandstones with different permeabilities. Fractal analysis is further employed to distinguish intragranular and intergranular pores. On this basis, GCMC and MD simulations are conducted to investigate CO2/CH4 competitive adsorption and diffusion under different reservoir conditions, thereby establishing a link between pore-throat structure and molecular-scale gas occurrence and transport. The following conclusions can be drawn from this study.
(1) The storage space of tight sandstone mainly consists of intergranular pores, dissolution pores, intercrystalline pores, and microfractures. Pore-throat connectivity and clay-mineral filling are important factors controlling flow capacity. As permeability increases from 0.0505 to 0.568 mD, the development and connectivity of larger effective pore throats improve markedly. In addition, all three cores exhibit distinct triple-fractal characteristics, with the pore radii corresponding to the first fractal inflection point being 0.1757, 0.1830, and 0.1931 μm, respectively. Combined analysis of the fractal inflection points and NMR results shows that the movable-fluid proportion in intergranular pores increases from 63.76% to 98.61%, while that in intragranular pores increases from 10.87% to 70.33%. These results indicate that improved intergranular-pore connectivity is a key factor in enhancing fluid mobilization in tight sandstone.
(2) CO2 exhibits a markedly stronger adsorption capacity than CH4 in both quartz and illite pores. Increasing pressure promotes the adsorption of CO2 and CH4, whereas increasing temperature weakens adsorption. Smaller pores exhibit stronger confinement and surface effects. As pore size increases, gas occurrence gradually shifts from surface-adsorption-dominated behavior toward occupation of the free pore space. Increasing water saturation occupies mineral-surface adsorption sites and effective pore space, thereby weakening the adsorption of both gases. Nevertheless, CO2 consistently maintains a clear competitive adsorption advantage over CH4.
(3) Under the same temperature, pressure, and pore conditions, the diffusion coefficient of CH4 is consistently higher than that of CO2, indicating that the stronger adsorption of CO2 on mineral surfaces imposes greater constraints on its migration. Increasing temperature and pore size promote the diffusion of both gases, whereas increasing pressure and water saturation suppresses molecular migration. As water saturation increases from 0% to 80%, the diffusion coefficient of CH4 decreases from 44.06 to 25.09 Å2·ps−1, while that of CO2 decreases from 33.12 to 21.21 Å2·ps−1. Overall, the preferential competitive adsorption of CO2 facilitates the release of adsorbed CH4, whereas pore-throat size and water saturation further control the subsequent diffusion and transport of the two gases.
Author Contributions
Conceptualization, X.W., J.Z. (Jianfeng Zhang), C.X. and J.Z. (Jinsheng Zhao); Methodology, X.W., J.Z. (Jianfeng Zhang), W.X., Y.W., Y.D. and J.Z. (Jinsheng Zhao); Investigation, X.W., J.Z. (Jianfeng Zhang), W.X., C.X., Y.W., H.Y., Y.D., E.F. and J.Z. (Jinsheng Zhao); Data curation, X.W., W.X., H.Y. and E.F.; Writing—original draft, X.W., Y.W., H.Y., E.F. and J.Z. (Jinsheng Zhao); Writing—review & editing, X.W. and J.Z. (Jinsheng Zhao); Visualization, J.Z. (Jinsheng Zhao); Supervision, J.Z. (Jinsheng Zhao); Funding acquisition, J.Z. (Jinsheng Zhao). All authors have read and agreed to the published version of the manuscript.
Funding
This research was supported by the National Natural Science Foundation of China (No. 52574044), the National Science and Technology Major Project (No. 2026ZD1405602), and the Youth Innovation Team of Shaanxi Universities.
Data Availability Statement
The raw data supporting the conclusions of this article will be made available by the authors on request.
Acknowledgments
The authors also sincerely thank the anonymous reviewers for their valuable comments and constructive suggestions, which helped improve the quality of this manuscript.
Conflicts of Interest
Authors Xiangzeng Wang, Jianfeng Zhang, Wei Xu, Cuiping Xin, Yongke Wang, Hong Yang and Yonghui Du were employed by the Shaanxi Yanchang Petroleum (Group) Co., Ltd. The remaining authors declare that the research was conducted in the absence of any commercial or financial relationships that could be construed as a potential conflict of interest. The Shaanxi Yanchang Petroleum (Group) Co., Ltd had no role in the design of the study; in the collection, analyses, or interpretation of data; in the writing of the manuscript, or in the decision to publish the results.
References
- Qin, Y.; Yao, S.; Xiao, H.; Cao, J.; Hu, W.; Sun, L.; Tao, K.; Liu, X. Pore structure and connectivity of tight sandstone reservoirs in petroleum basins: A review and application of new methodologies to the Late Triassic Ordos Basin, China. Mar. Pet. Geol. 2021, 129, 105084. [Google Scholar] [CrossRef] [Scilit]
- Zhang, Q.; Liu, Y.; Wang, B.; Ruan, J.; Yan, N.; Chen, H.; Wang, Q.; Jia, G.; Wang, R.; Liu, H.; et al. Effects of pore-throat structures on the fluid mobility in Chang 7 tight sandstone reservoirs of Longdong area, Ordos Basin. Mar. Pet. Geol. 2022, 135, 105407. [Google Scholar] [CrossRef] [Scilit]
- Dong, X.; Meng, X.; Pu, R. Impacts of mineralogy and pore throat structure on the movable fluid of tight sandstone gas reservoirs in coal measure strata: A case study of the Shanxi Formation along the southeastern margin of the Ordos Basin. J. Pet. Sci. Eng. 2023, 220, 111257. [Google Scholar] [CrossRef] [Scilit]
- Liu, G.; Xie, S.; Tian, W.; Wang, J.; Li, S.; Wang, Y.; Yang, D.; Porter, M. Effect of pore-throat structure on gas-water seepage behaviour in a tight sandstone gas reservoir. Fuel 2022, 310, 121901. [Google Scholar] [CrossRef] [Scilit]
- Zang, Q.; Liu, C.; Awan, R.S.; Yang, X.; Lu, Z.; Li, G.; Wu, Y.; Feng, D.; Ran, Y. Comparison of pore size distribution, heterogeneity and occurrence characteristics of movable fluids of tight oil reservoirs formed in different sedimentary environments: A case study of the Chang 7 Member of Ordos Basin, China. Nat. Resour. Res. 2022, 31, 415–442. [Google Scholar] [CrossRef] [Scilit]
- Su, Y.; Zha, M.; Jiang, L.; Ding, X.; Qu, J.; Jin, J.; Iglauer, S. Pore structure and fluid distribution of tight sandstone by the combined use of SEM, MICP and X-ray micro-CT. J. Pet. Sci. Eng. 2022, 208, 109241. [Google Scholar] [CrossRef] [Scilit]
- Ouyang, S.; Lü, X.; Zhang, Y.; Chen, L.; Qu, Y.; Sun, W. Impacts of the pore-throat structure on fluid mobility in tight sandstone: Insight from an improved method based on rate-controlled porosimetry and nuclear magnetic resonance. Energy Fuels 2023, 37, 273–290. [Google Scholar] [CrossRef] [Scilit]
- Yang, Y.; Xiao, W.; Zheng, L.; Lei, Q.; Qin, C.; He, Y.; Liu, S.; Li, M.; Li, Y.; Zhao, J.; et al. Pore throat structure heterogeneity and its effect on gas-phase seepage capacity in tight sandstone reservoirs: A case study from the Triassic Yanchang Formation, Ordos Basin. Pet. Sci. 2023, 20, 2892–2907. [Google Scholar] [CrossRef] [Scilit]
- Shi, X.; Xiao, C.; Ni, H.; Gao, Q.; Han, L.; Xiao, D.; Jiang, S. Pore structure and pore size change for tight sandstone treated with supercritical CO2 fluid. Energy Rep. 2023, 9, 2286–2299. [Google Scholar] [CrossRef] [Scilit]
- Li, P.; Ou, Y.; Chen, H.; Li, Q.; Zhao, L.; Yan, J. Pore throat distributions and movable fluid occurrences in different diagenetic facies of tight sandstone reservoirs in the Triassic Chang 6 reservoirs, Wuqi Area, Ordos Basin, China. J. Pet. Explor. Prod. Technol. 2024, 14, 1783–1797. [Google Scholar] [CrossRef] [Scilit]
- Su, Y.; Lai, J.; Dang, W.; Bie, K.; Zhao, Y.; Zhao, X.; Li, D.; Zhao, F.; Wang, G. Pore structure characterization and reservoir quality prediction in deep and ultra-deep tight sandstones by integrating image and NMR logs. J. Asian Earth Sci. 2024, 272, 106232. [Google Scholar] [CrossRef] [Scilit]
- Zhang, Q.; Yang, C.; Gu, Y.; Tian, Y.; Liu, H.; Xiao, W.; Wang, Z.; Mi, Z. Microscopic pore-throat structure and fluid mobility of tight sandstone reservoirs in multi-provenance systems, Triassic Yanchang Formation, Jiyuan area, Ordos Basin. Energy Geosci. 2025, 6, 100407. [Google Scholar] [CrossRef] [Scilit]
- Ding, J.; Yan, C.; He, Y.; Wang, C. Supercritical CO2 sequestration and enhanced gas recovery in tight gas reservoirs: Feasibility and factors that influence efficiency. Int. J. Greenh. Gas Control 2021, 105, 103234. [Google Scholar] [CrossRef] [Scilit]
- Ding, J.; Yan, C.; Wang, G.; He, Y.; Zhao, R. Competitive adsorption between CO2 and CH4 in tight sandstone and its influence on CO2-injection enhanced gas recovery. Int. J. Greenh. Gas Control 2022, 113, 103530. [Google Scholar] [CrossRef] [Scilit]
- Liu, S.-Y.; Ren, B.; Li, H.-Y.; Yang, Y.-Z.; Wang, Z.-Q.; Wang, B.; Xu, J.-C.; Agarwal, R. CO2 storage with enhanced gas recovery: A review of experimental and numerical studies. Pet. Sci. 2022, 19, 594–607. [Google Scholar] [CrossRef] [Scilit]
- Liu, S.; Yuan, L.; Zhao, C.; Zhang, Y.; Song, Y. A review of research on the dispersion process and CO2 enhanced natural gas recovery in depleted gas reservoirs. J. Pet. Sci. Eng. 2022, 208, 109682. [Google Scholar] [CrossRef] [Scilit]
- Jukić, L.; Vulin, D.; Lukić, M.; Sedlar, D.K. Enhanced gas recovery and storability in a high CO2 content gas reservoir. Int. J. Greenh. Gas Control 2022, 117, 103662. [Google Scholar] [CrossRef] [Scilit]
- Liao, H.; Pan, W.; He, Y.; Fang, X.; Zhang, Y. Study on the mechanism of CO2 injection to improve tight sandstone gas recovery. Energy Rep. 2023, 9, 645–656. [Google Scholar] [CrossRef] [Scilit]
- Tang, C.; Zhou, W.; Chen, Z. Numerical simulation of CO2 sequestration in shale gas reservoirs at reservoir scale coupled with enhanced gas recovery. Energy 2023, 277, 127657. [Google Scholar] [CrossRef] [Scilit]
- Wang, W.; Wen, J.; Wang, C.; Gomari, S.R.; Xu, X.; Zheng, S.; Su, Y.; Li, L.; Hao, Y.; Li, D. Current status and development trends of CO2 storage with enhanced natural gas recovery. Fuel 2023, 349, 128555. [Google Scholar] [CrossRef] [Scilit]
- Prasad, S.K.; Sangwai, J.S.; Byun, H.S. A review of supercritical CO2 fluid applications for improved oil and gas production and associated carbon storage. J. CO2 Util. 2023, 72, 102479. [Google Scholar] [CrossRef] [Scilit]
- Zhang, L.; Bai, T.; Zhao, Q.; Zhang, X.; Cheng, H.; Li, Z. CO2 injection for enhanced gas recovery and geo-storage in complex tight sandstone gas reservoirs. Processes 2023, 11, 2059. [Google Scholar] [CrossRef] [Scilit]
- Zhao, E.; Jin, Z.; Li, G.; Zhang, K.; Zeng, Y. Feasibility of CO2 storage and enhanced gas recovery in depleted tight sandstone gas reservoirs within multi-stage fracturing horizontal wells. Pet. Sci. 2024, 21, 4189–4203. [Google Scholar] [CrossRef] [Scilit]
- Zhao, E.; Jin, Z.; Li, G.; Zhang, K.; Zeng, Y. Numerical simulation of CO2 storage with enhanced gas recovery in depleted tight sandstone gas reservoirs. Fuel 2024, 371, 131948. [Google Scholar] [CrossRef] [Scilit]
- Ou, C.; You, Z. Review of CO2 utilization and storage in adsorption-type unconventional natural gas reservoirs. Fuel 2024, 374, 132352. [Google Scholar] [CrossRef] [Scilit]
- Liu, L.; Li, J.; Liu, P.; Fu, B.; Wang, Y.; Zhong, J.; Wu, Z.; Cao, C.; Zhao, Y.; Zhu, H.; et al. Research on enhanced gas recovery by CO2/N2 injection in tight sandstone gas reservoirs. Processes 2026, 14, 868. [Google Scholar] [CrossRef] [Scilit]
- Lu, T.; Zeng, K.; Jiang, P.; Zhou, B.; Xu, R. Competitive adsorption in CO2 enhancing shale gas: Low-field NMR measurement combined with molecular simulation for selectivity and displacement efficiency model. Chem. Eng. J. 2022, 440, 135865. [Google Scholar] [CrossRef] [Scilit]
- Xie, W.; Wang, M.; Chen, S.; Vandeginste, V.; Yu, Z.; Wang, H. Effects of gas components, reservoir property and pore structure of shale gas reservoir on the competitive adsorption behavior of CO2 and CH4. Energy 2022, 254, 124242. [Google Scholar] [CrossRef] [Scilit]
- Yang, X.; Chen, Z.; Liu, X.; Xue, Z.; Yue, F.; Wen, J.; Li, M.; Xue, Y. Correction of gas adsorption capacity in quartz nanoslit and its application in recovering shale gas resources by CO2 injection: A molecular simulation. Energy 2022, 240, 122789. [Google Scholar] [CrossRef] [Scilit]
- Pan, S.; Zhou, H.; Wang, Q.; Bai, J.; Cui, D.; Wang, X. Experimental and molecular simulation studies of Huadian oil shale kerogen. ACS Omega 2022, 7, 17253–17269. [Google Scholar] [CrossRef] [Scilit] [PubMed]
- Wu, J.; Huang, P.; Maggi, F.; Shen, L. Effect of sorption-induced deformation on methane flow in kerogen slit pores. Fuel 2022, 325, 124886. [Google Scholar] [CrossRef] [Scilit]
- Liao, Q.; Zhou, J.; Xian, X.; Yang, K.; Zhang, C.; Dong, Z.; Yin, H. Competition adsorption of CO2/CH4 in shale: Implications for CO2 sequestration with enhanced gas recovery. Fuel 2023, 339, 127400. [Google Scholar] [CrossRef] [Scilit]
- Song, Y.; Liu, T.; Wang, M.; Wang, X.; Zheng, S.; Quan, F.; Feng, G. Kerogen differential swelling during CO2-CH4 adsorption: Mechanism and significance. Energy Fuels 2023, 37, 4948–4959. [Google Scholar] [CrossRef] [Scilit]
- Li, W.; Stevens, L.A.; Zhang, B.; Zheng, D.; Snape, C.E. Combining molecular simulation and experiment to understand the effect of moisture on methane adsorption in kerogens. Chem. Eng. J. 2023, 454, 139942. [Google Scholar] [CrossRef] [Scilit]
- Wu, J.; Yang, X.; Huang, S.; Zhao, S.; Zhang, D.; Zhang, J.; Ren, C.; Zhang, C.; Jiang, R.; Liu, D.; et al. Molecular simulation of methane adsorption in deep shale nanopores: Effect of rock constituents and water. Minerals 2023, 13, 756. [Google Scholar] [CrossRef] [Scilit]
- Tian, S.; Bai, R.; Zhao, Y.; Lu, Y.; Chen, J.; Wu, S. Molecular simulation and experimental study on adsorption effect of CH4/CO2 in shale minerals. Ind. Eng. Chem. Res. 2024, 63, 818–832. [Google Scholar] [CrossRef] [Scilit]
- Wang, H.; Zhang, M.; Xia, X.; Tian, Z.; Qin, X.; Cai, J. Lattice Boltzmann prediction of CO2 and CH4 competitive adsorption in shale porous media accelerated by machine learning for CO2 sequestration and enhanced CH4 recovery. Appl. Energy 2024, 370, 123638. [Google Scholar] [CrossRef] [Scilit]
- Zhang, D.; Tang, H.; Song, Y.; Perera, M.S.A.; Ranjith, P.G. Molecular simulation of the competitive adsorption of methane and carbon dioxide in the matrix and slit model of shale kerogen and the influence of water. Geoenergy Sci. Eng. 2024, 242, 213212. [Google Scholar] [CrossRef] [Scilit]
- Li, J.; Li, B.; Liu, Y.; Lang, Y.; Lan, Y.; Rahman, S.S. Giant effect of CO2 injection on multiphase fluid adsorption and shale gas production: Evidence from molecular dynamics. Langmuir 2024, 40, 13622–13635. [Google Scholar] [CrossRef] [Scilit] [PubMed]
- Sun, Y.; Ma, Y.; Yu, B.; Zhang, W.; Zhang, L.; Chen, P.; Xu, L. Perspectives on molecular simulation of CO2/CH4 competitive adsorption in a shale matrix: A review. Energy Fuels 2024, 38, 15935–15971. [Google Scholar] [CrossRef] [Scilit]
- Cao, M.; Qin, C.; Jiang, Y.; Xia, P.; Wang, K. Review of competitive adsorption of CO2/CH4 in shale: Implications for CO2 sequestration and enhancing shale gas recovery. ACS Omega 2025, 10, 12756–12771. [Google Scholar] [CrossRef] [Scilit] [PubMed]
- Gong, L.; Shi, J.H.; Ding, B.; Huang, Z.Q.; Sun, S.Y.; Yao, J. Molecular insight on competitive adsorption and diffusion characteristics of shale gas in water-bearing channels. Fuel 2020, 278, 118406. [Google Scholar] [CrossRef] [Scilit]
- Guo, D.; Zhang, L.; Zhao, Y.; Yang, X.; Wen, S.; Wu, J.; Chen, X. Impact of the water content on CO2 and CH4 adsorption and diffusion in quartz nanopores: A comprehensive study using GCMC, MD, and DFT. Colloids Surf. A Physicochem. Eng. Asp. 2024, 703, 135442. [Google Scholar] [CrossRef] [Scilit]
- Zhang, J.; Cai, X.; Li, Y.; Gao, J.; Xiao, M.; Li, Y.; Wang, X.; Yin, Z. Unveiling how THF tunes the micro-kinetics of H2-THF clathrate for enhanced H2 storage: A molecular dynamics study. J. Colloid Interface Sci. 2026, 705, 139483. [Google Scholar] [CrossRef] [Scilit] [PubMed]
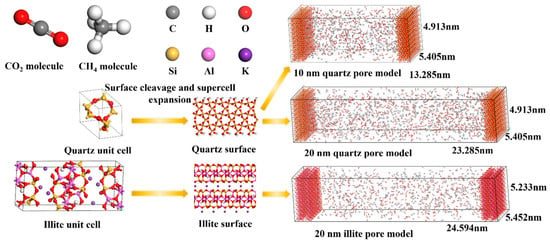
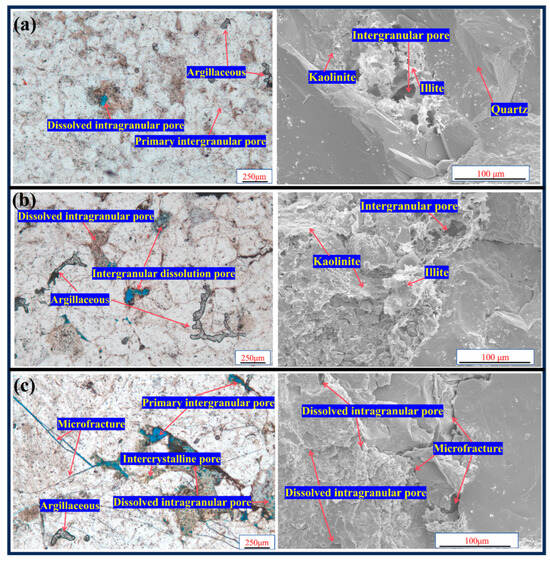
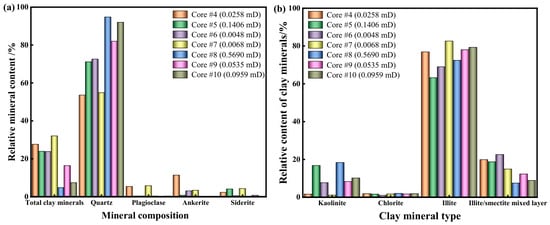
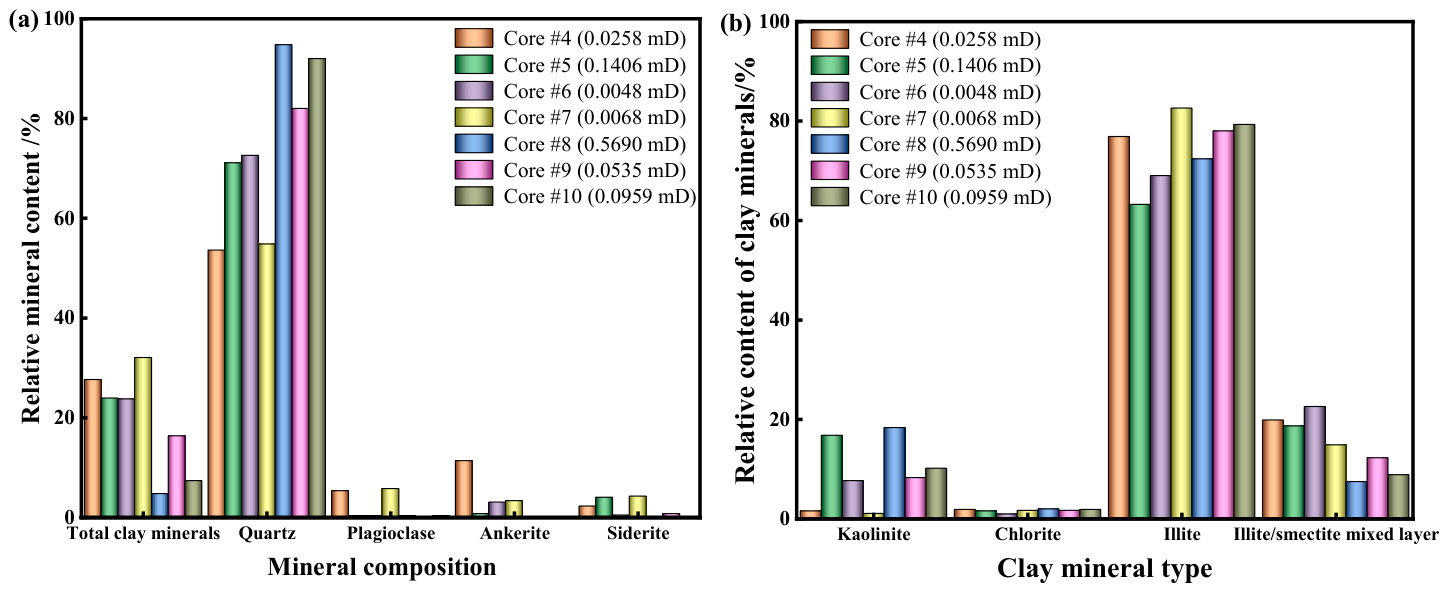
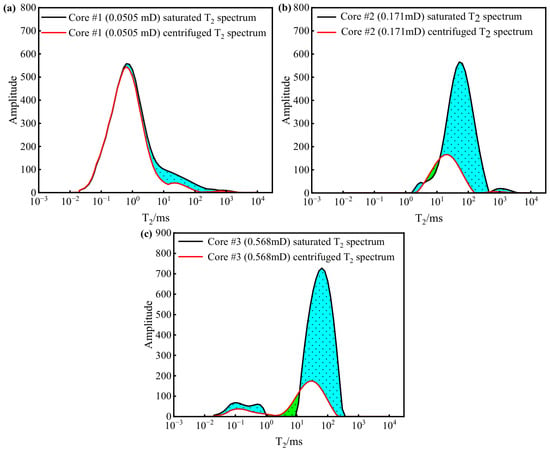
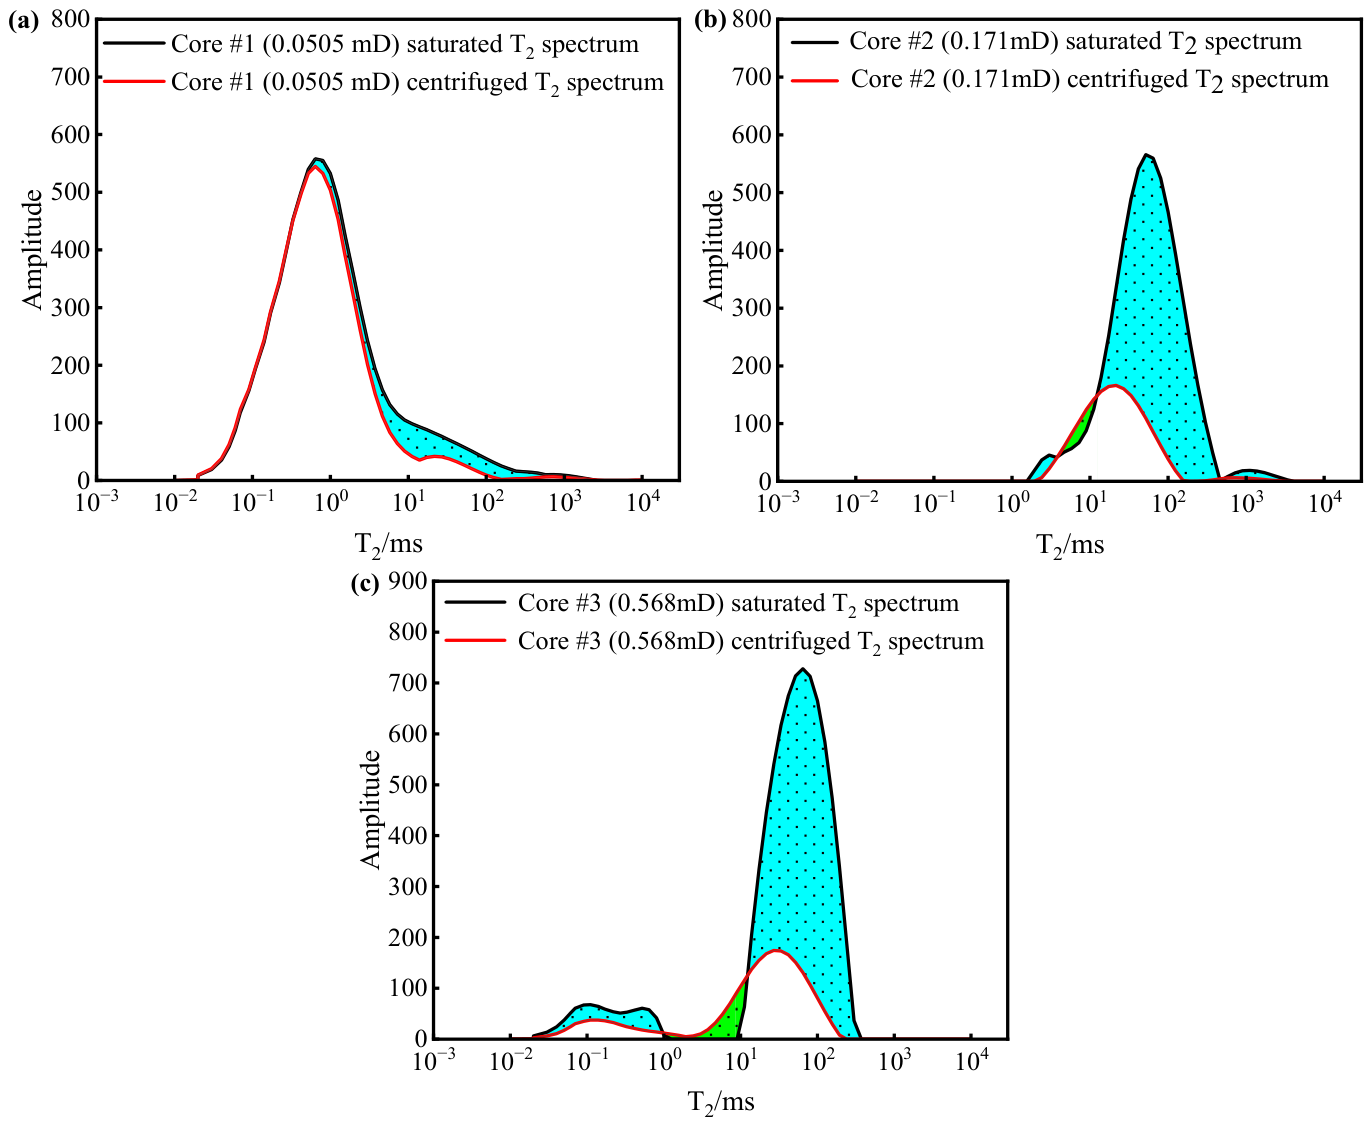
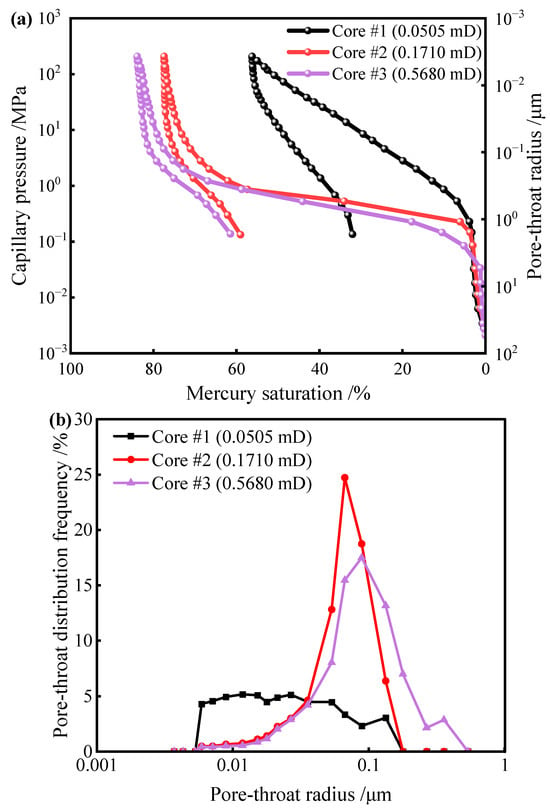
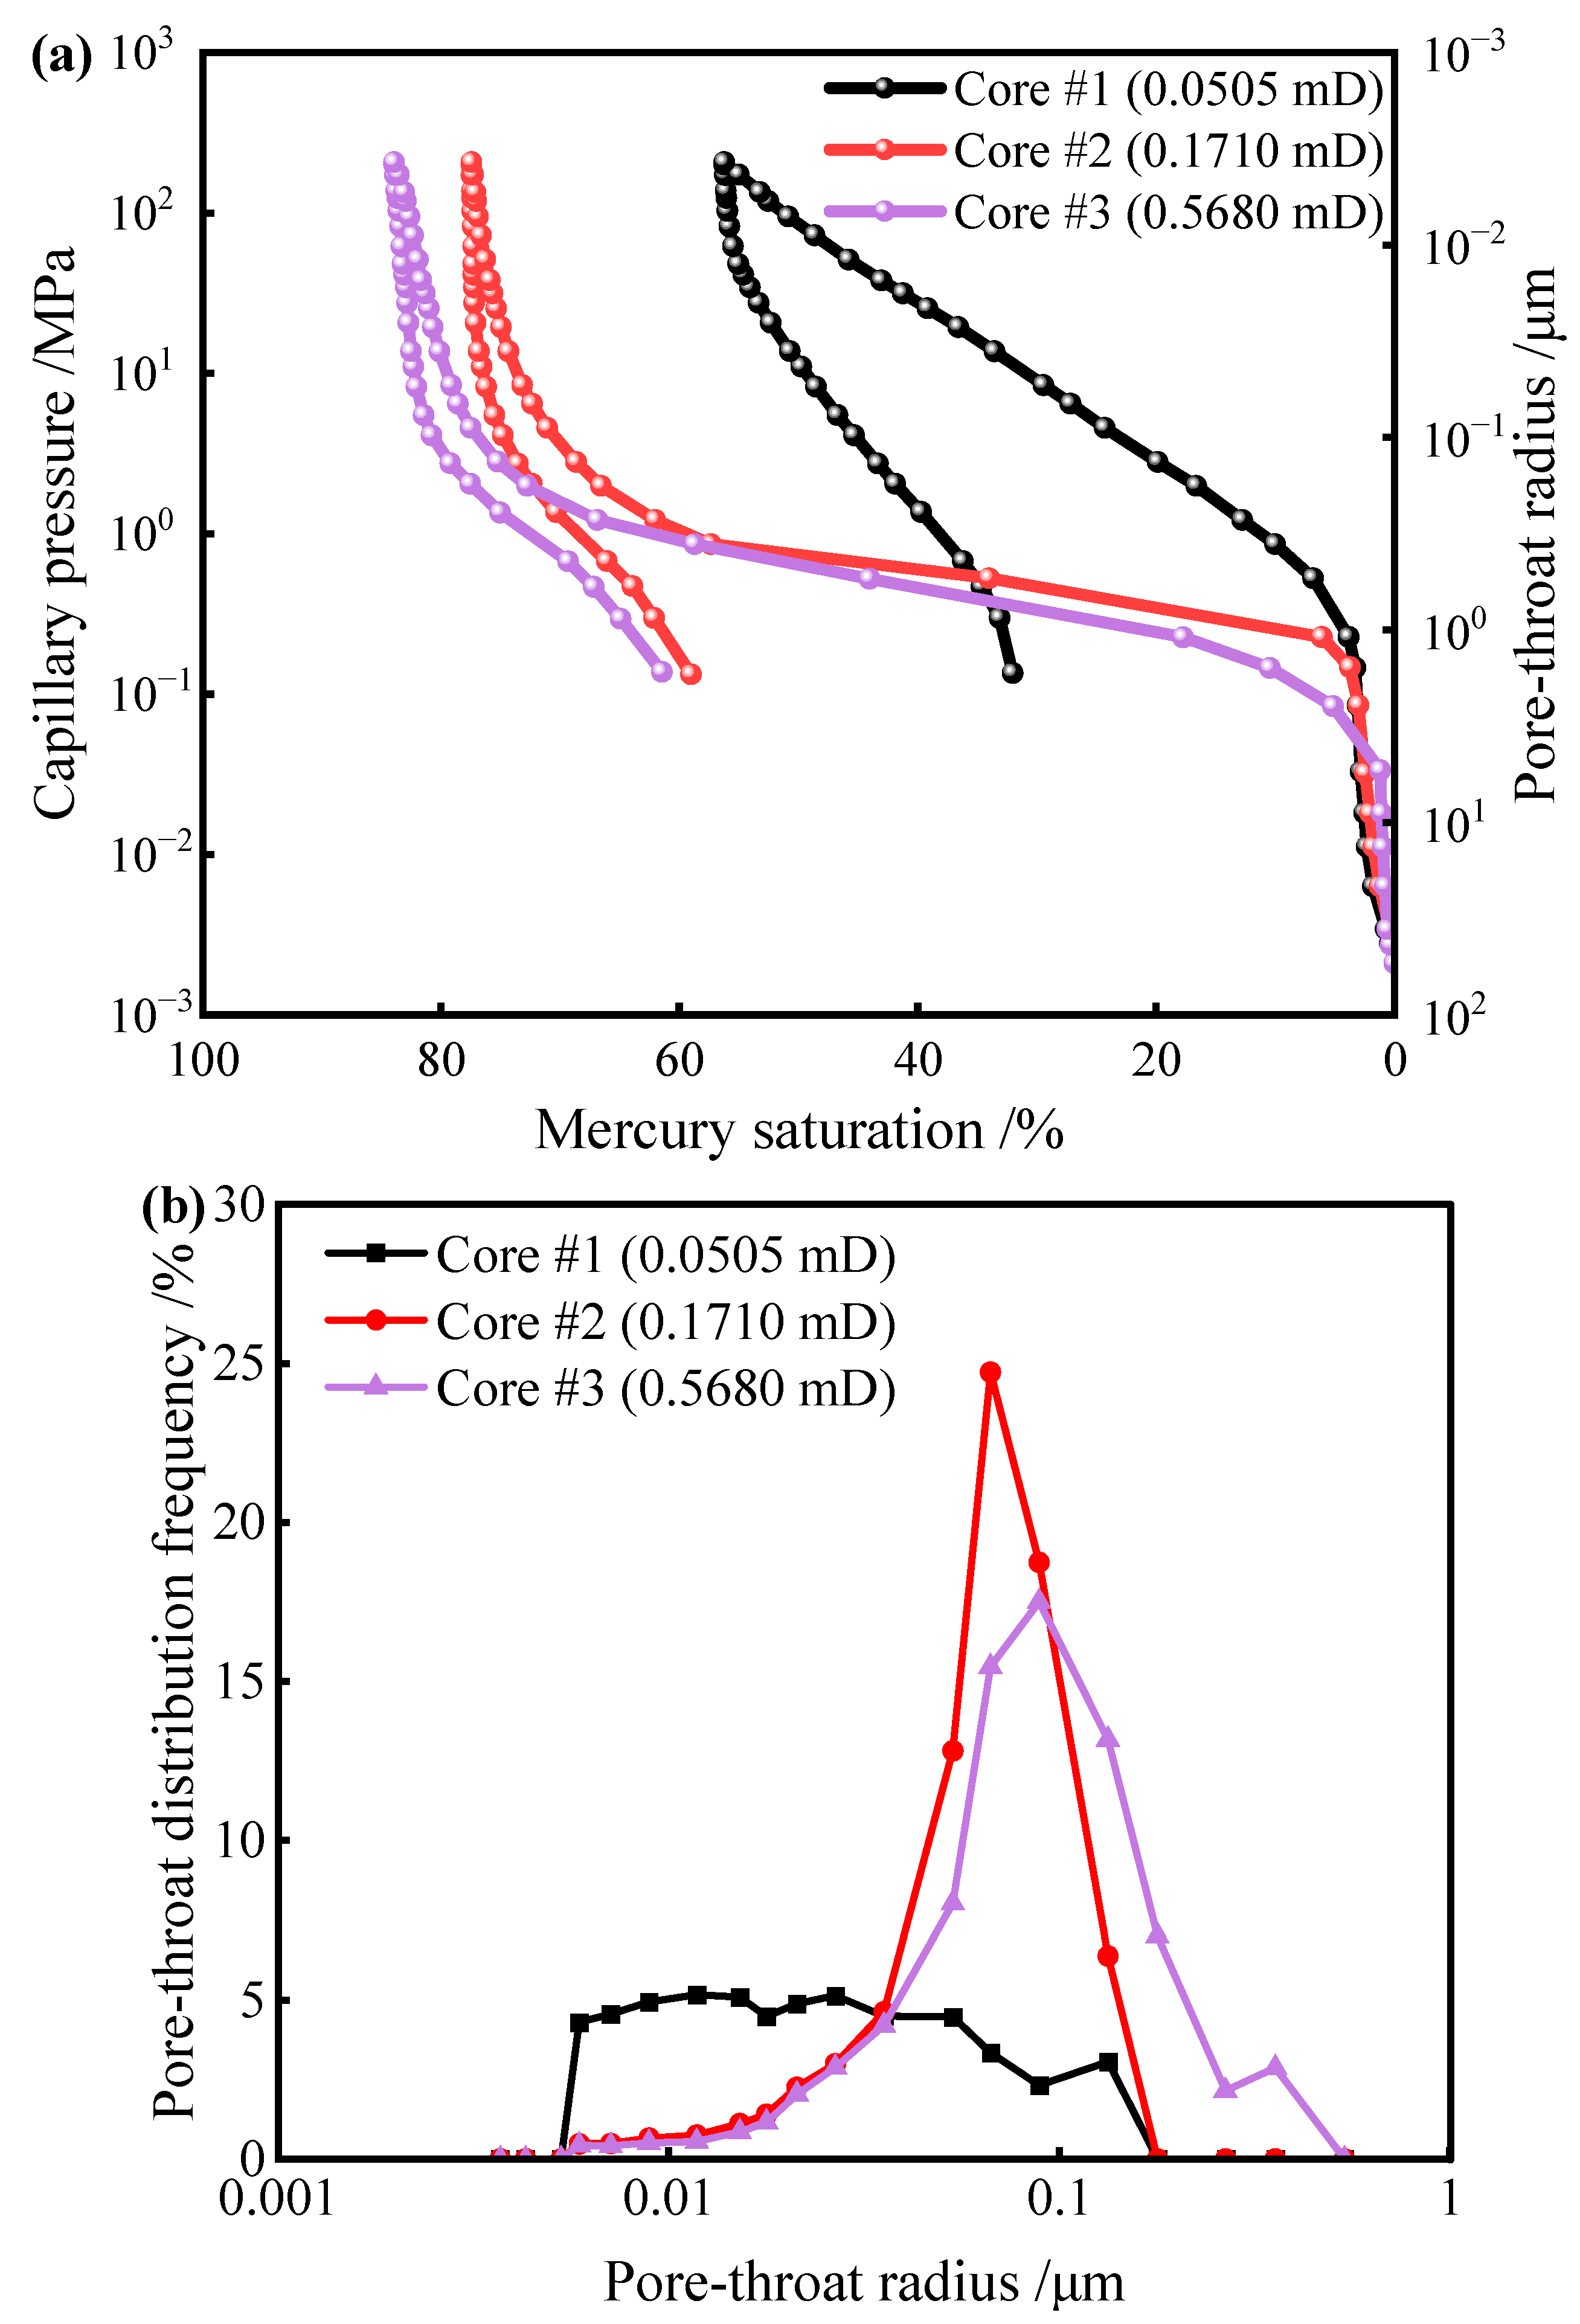
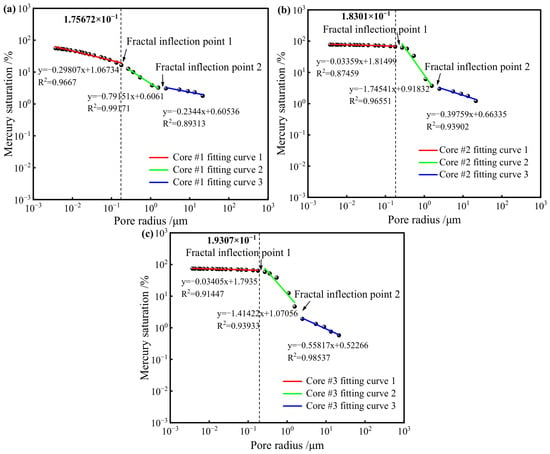
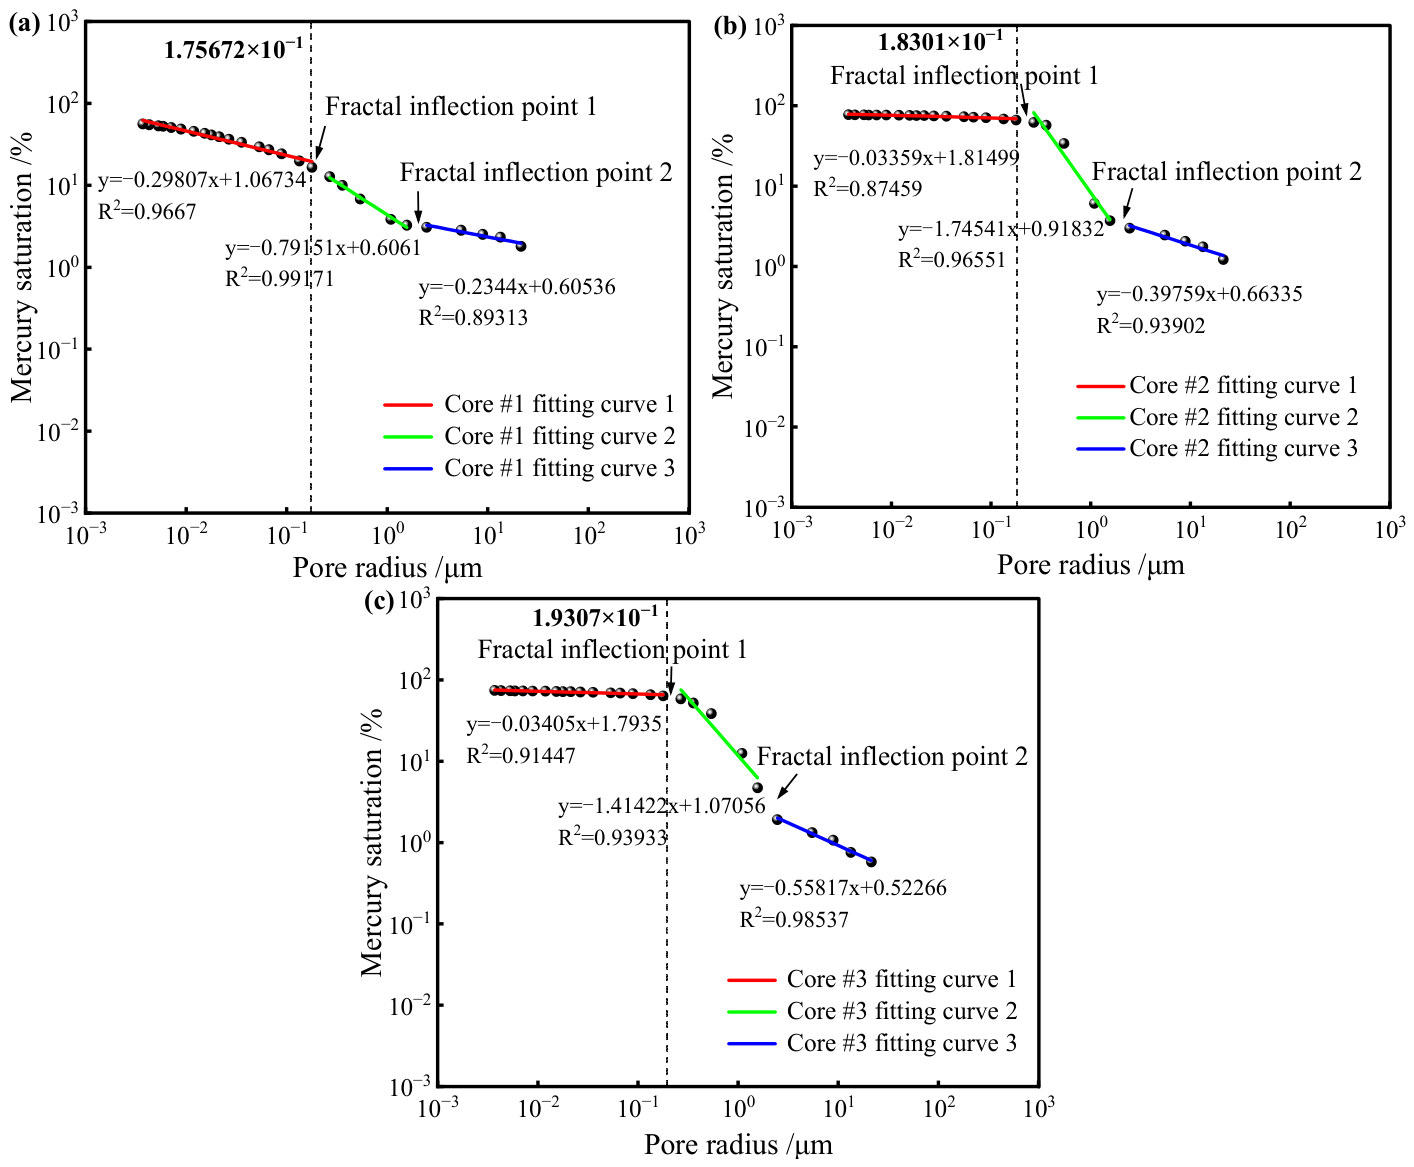
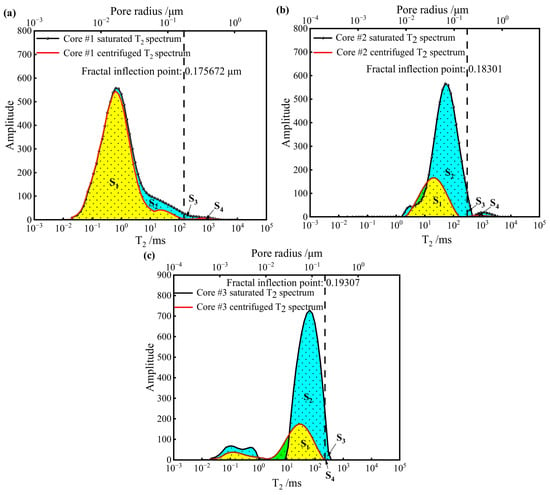
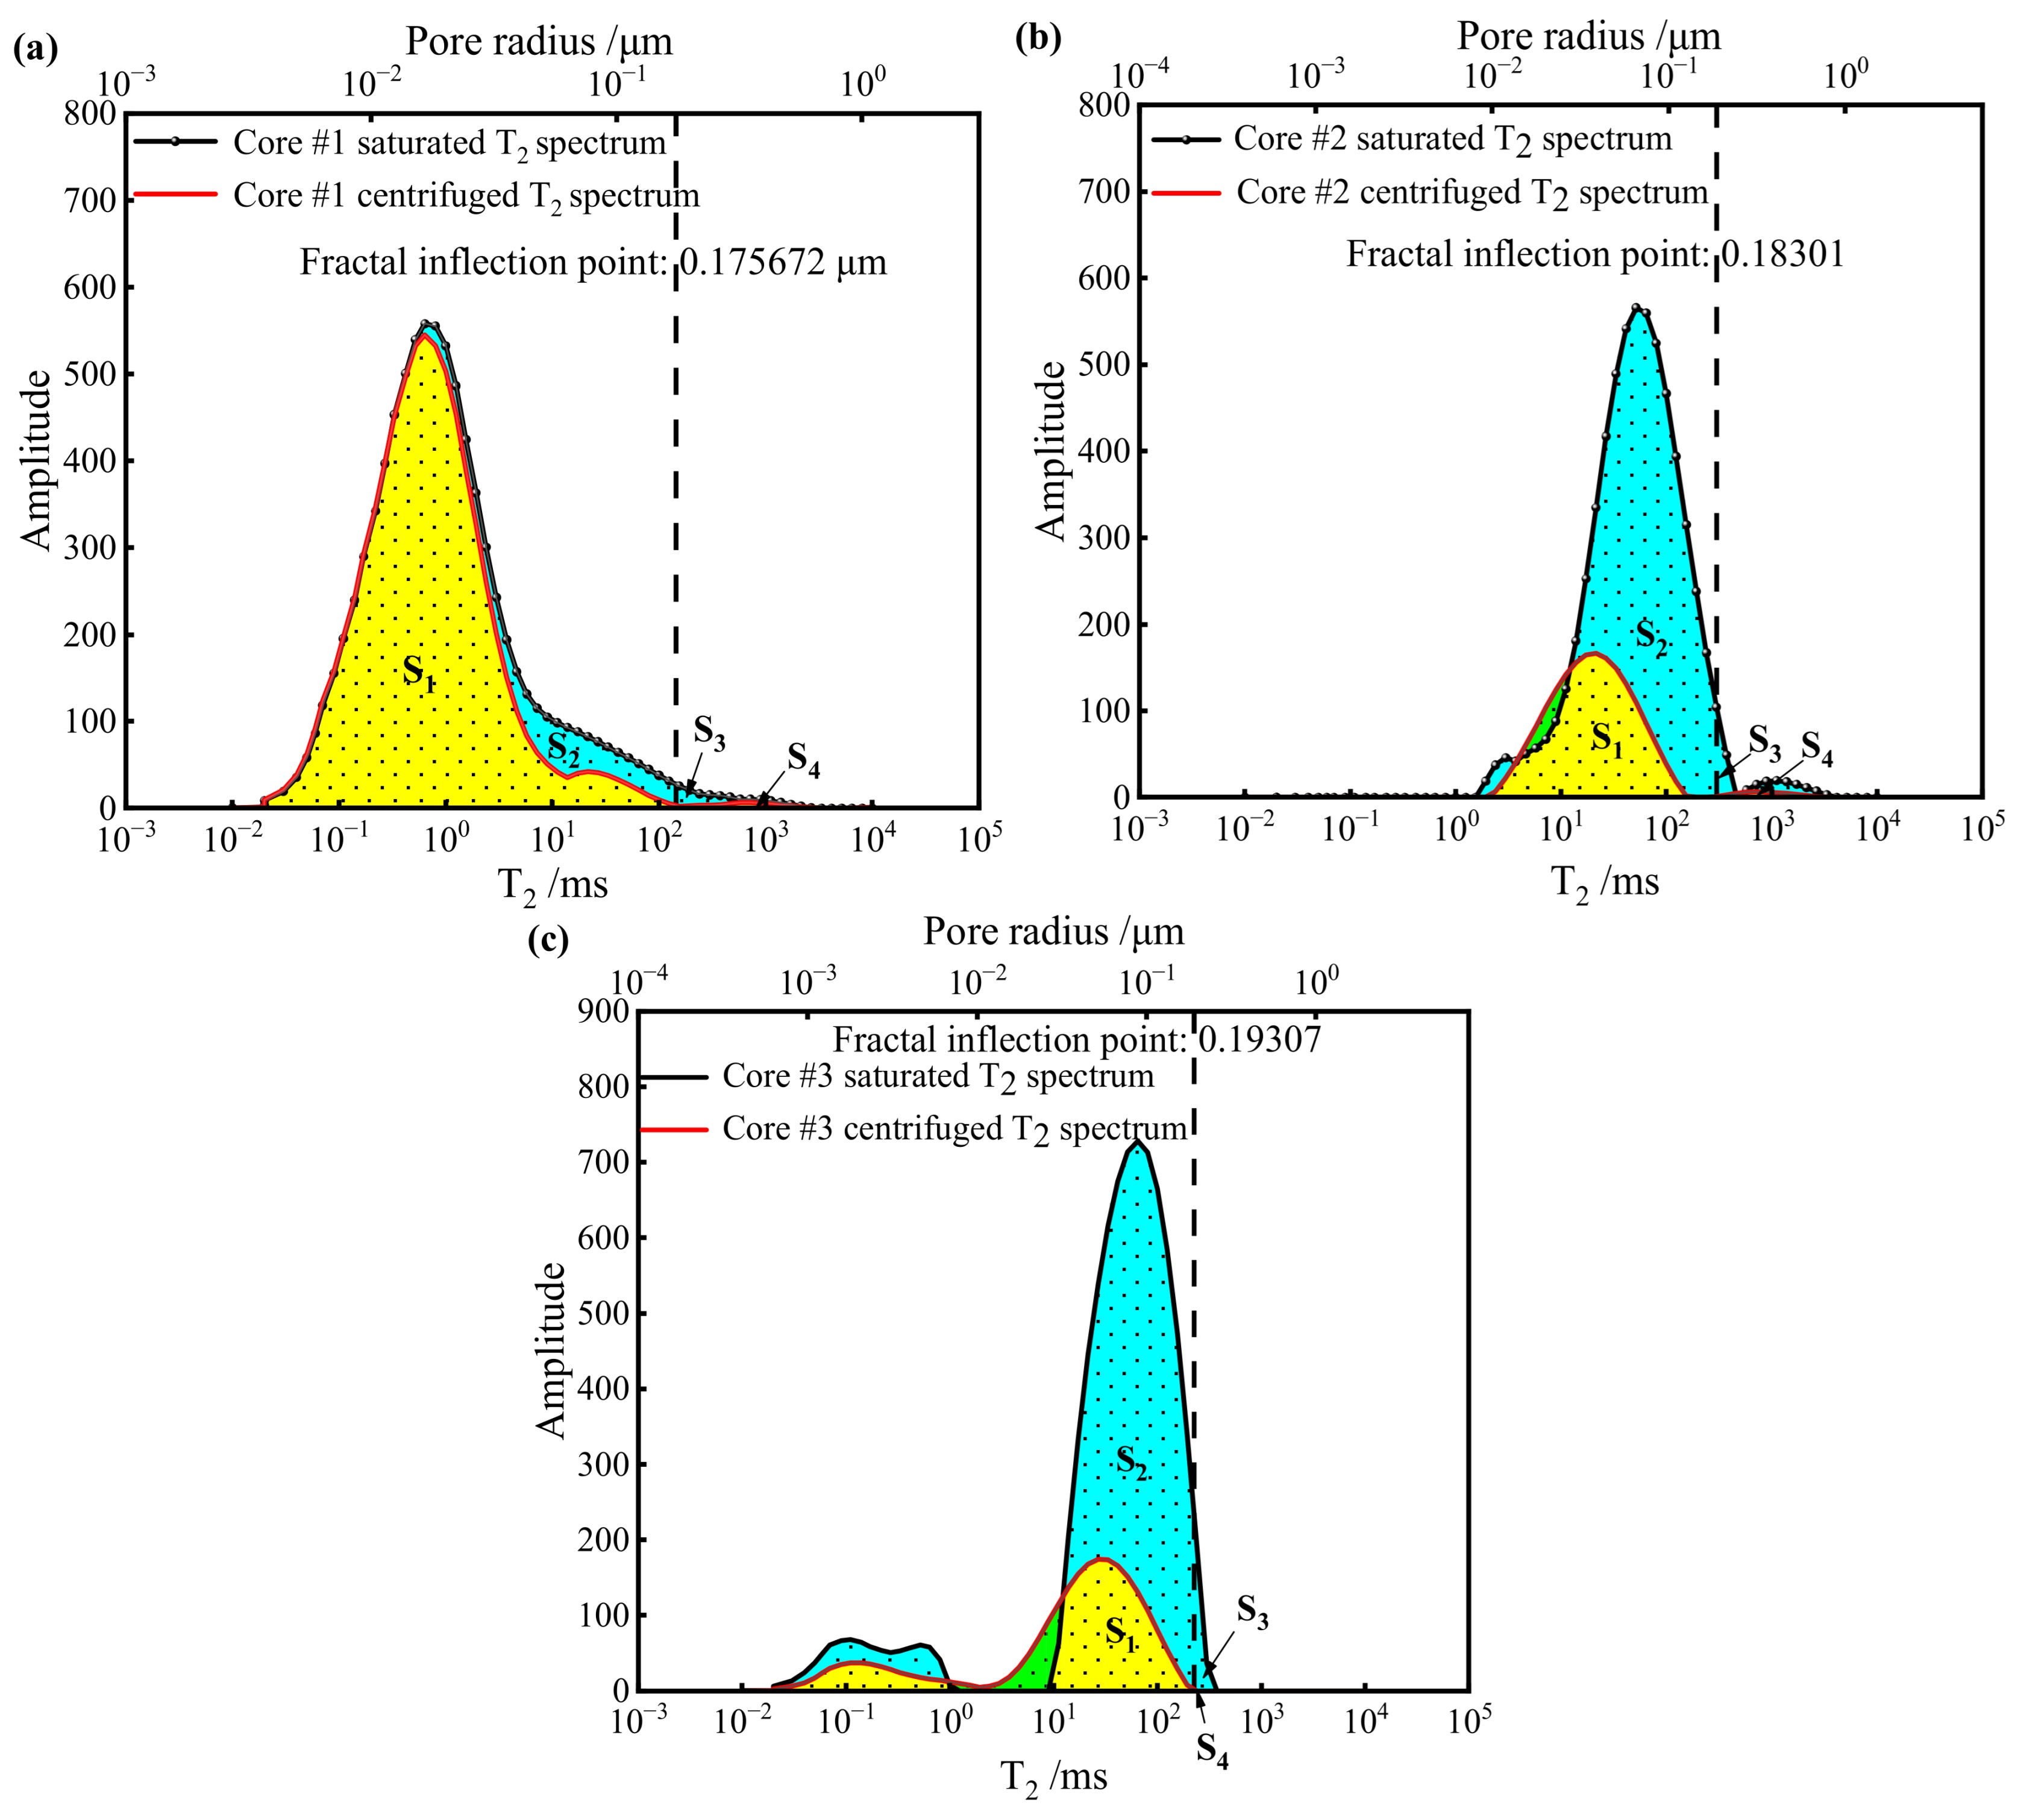
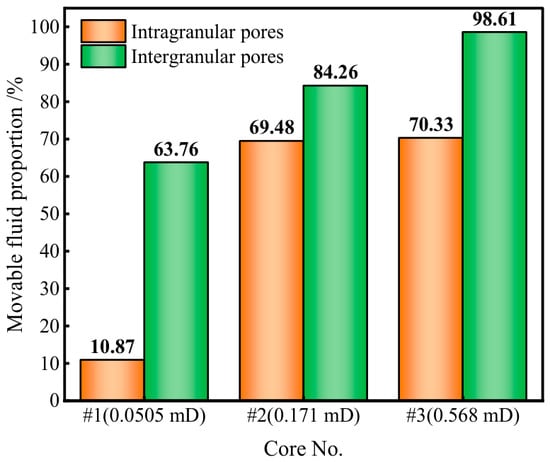
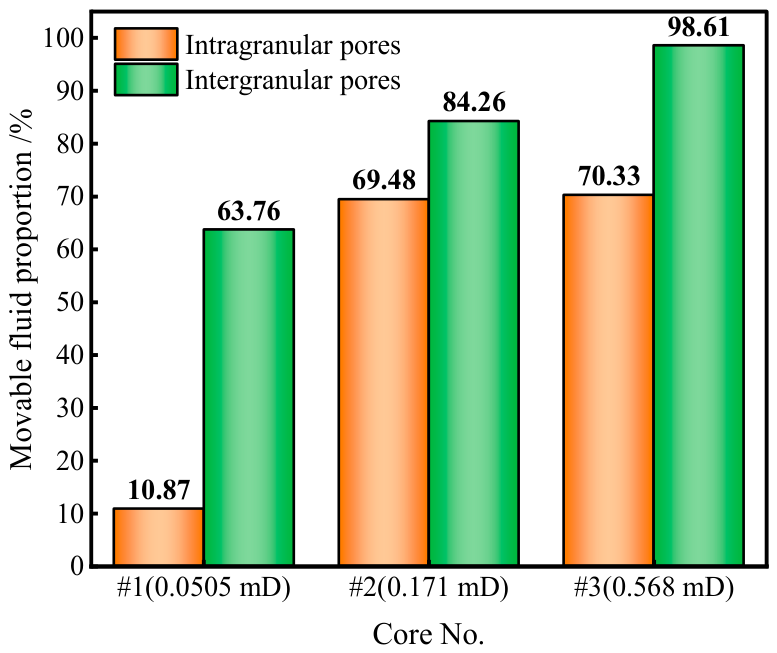
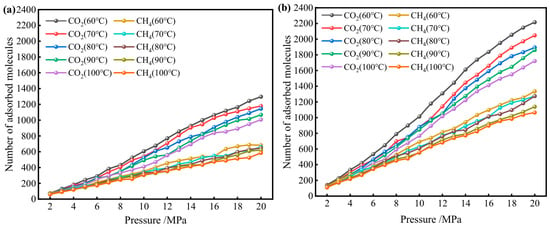
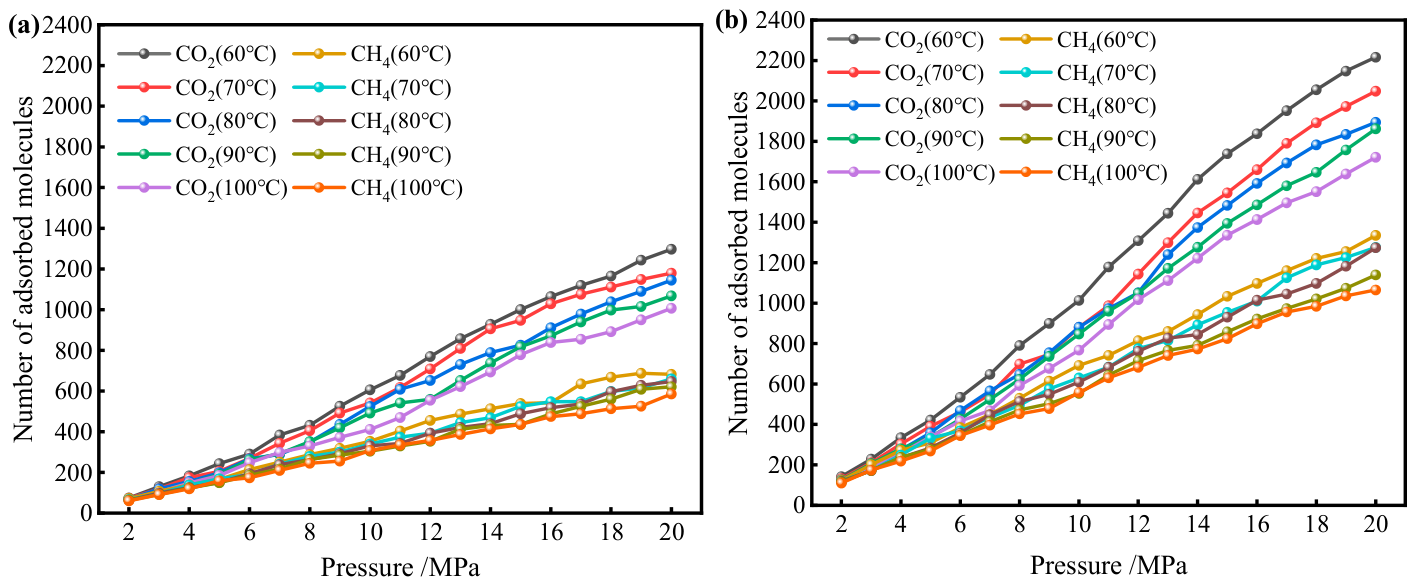
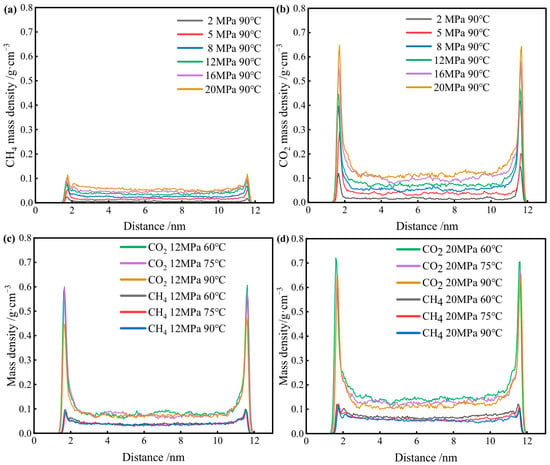
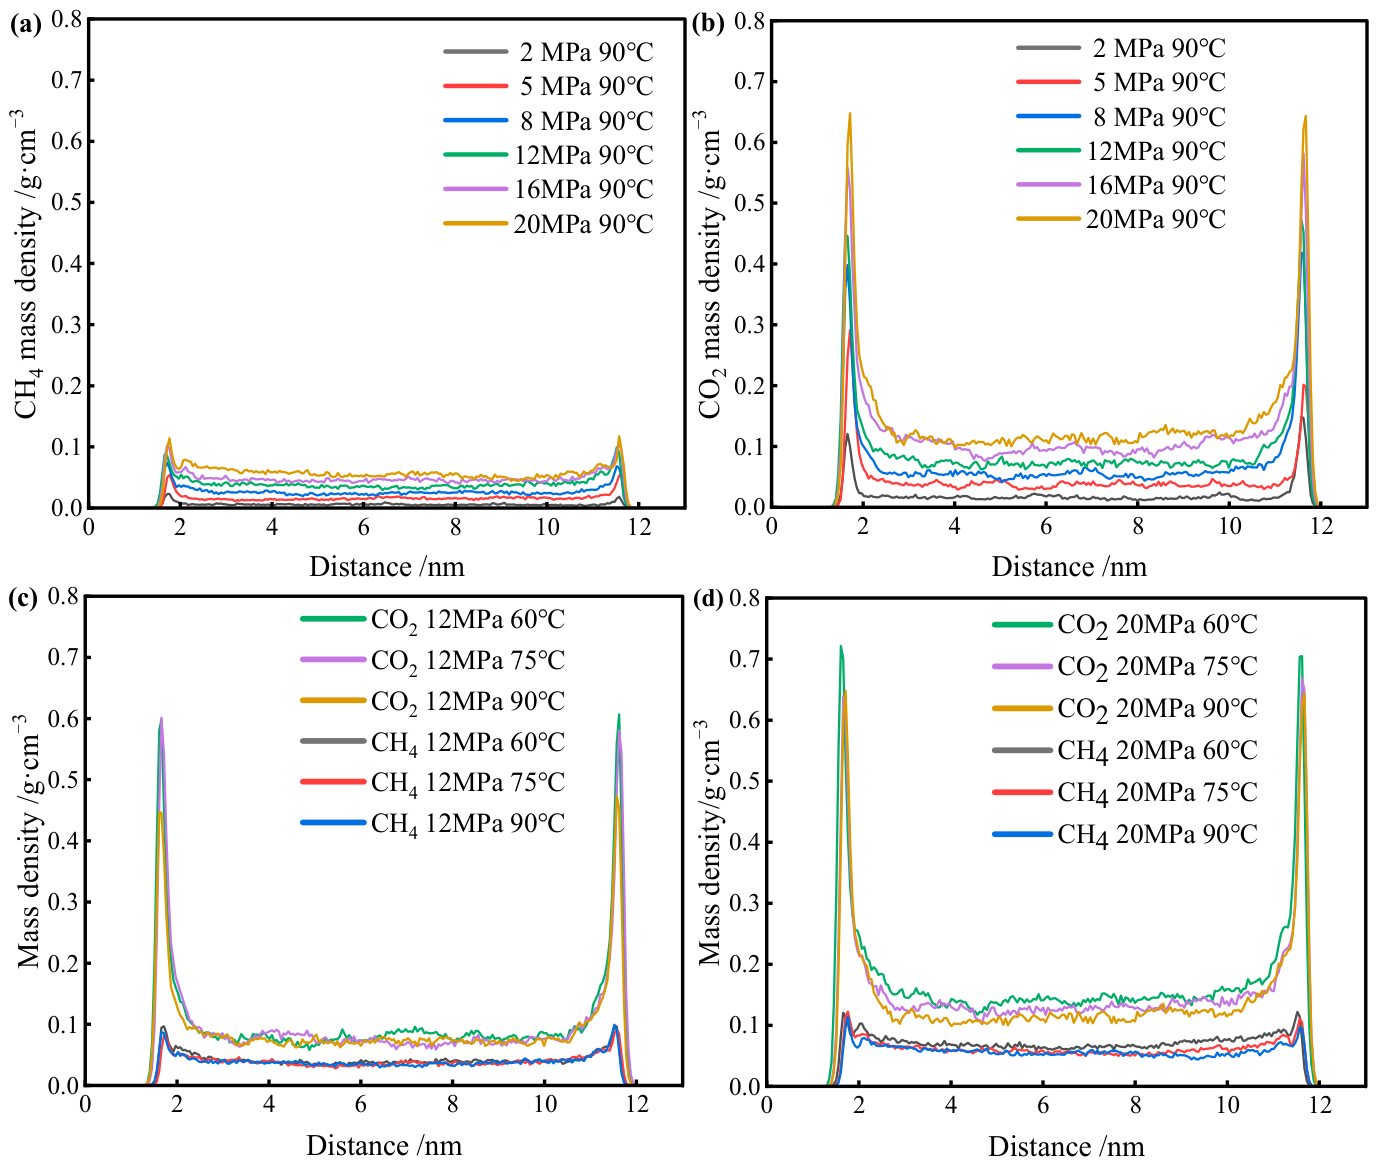
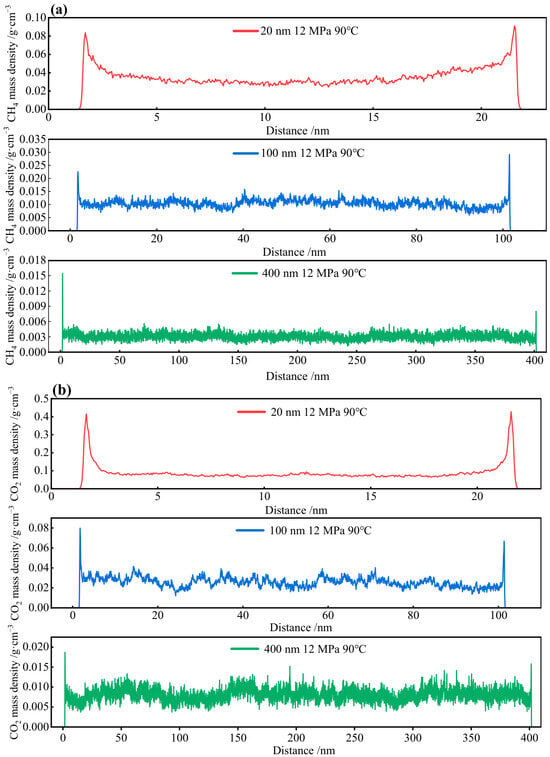
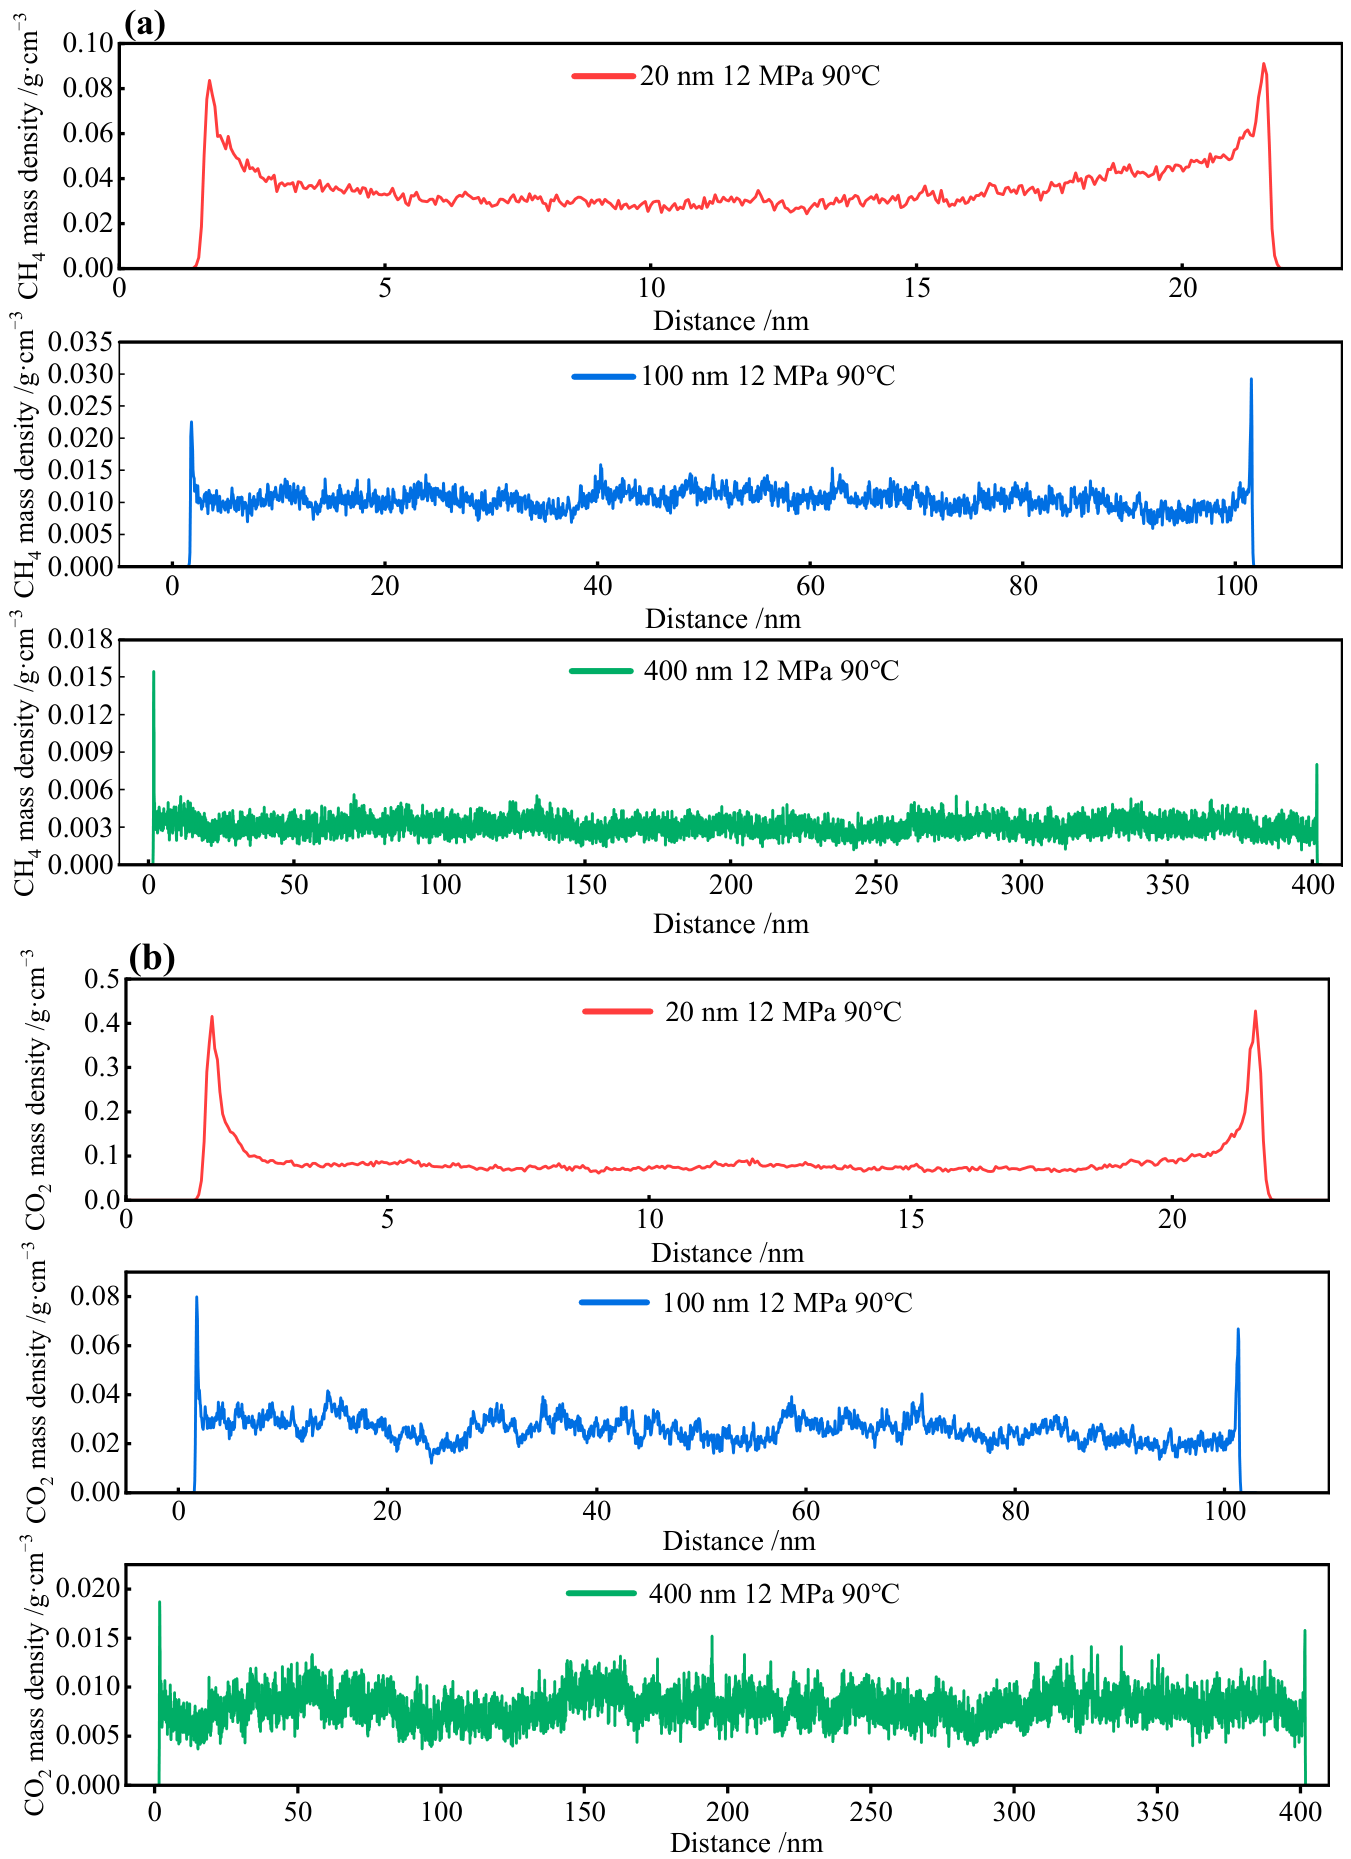
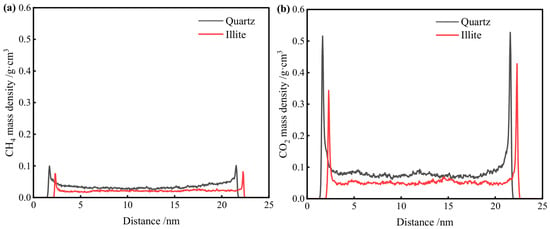
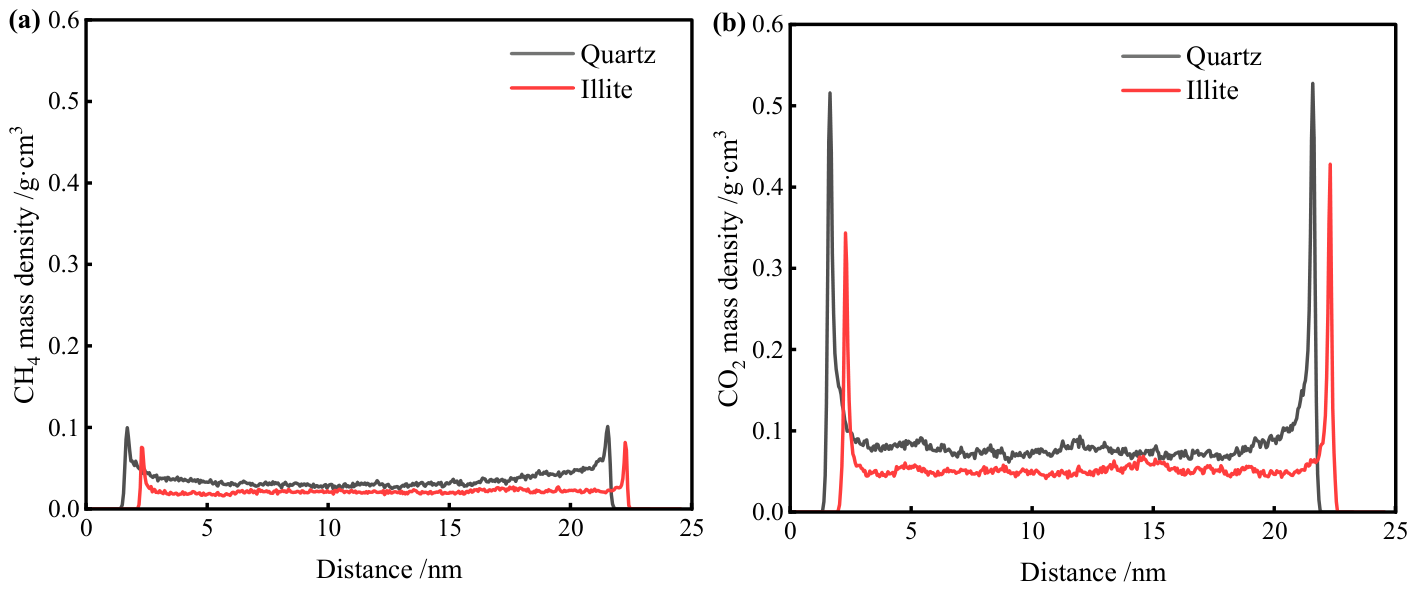
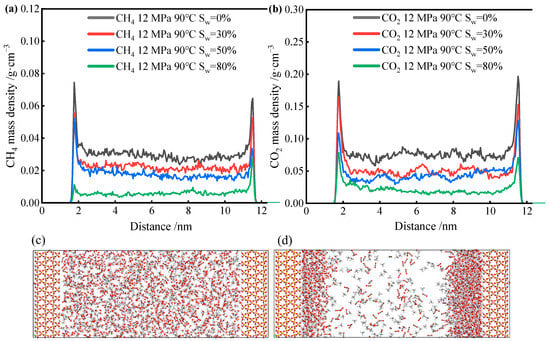
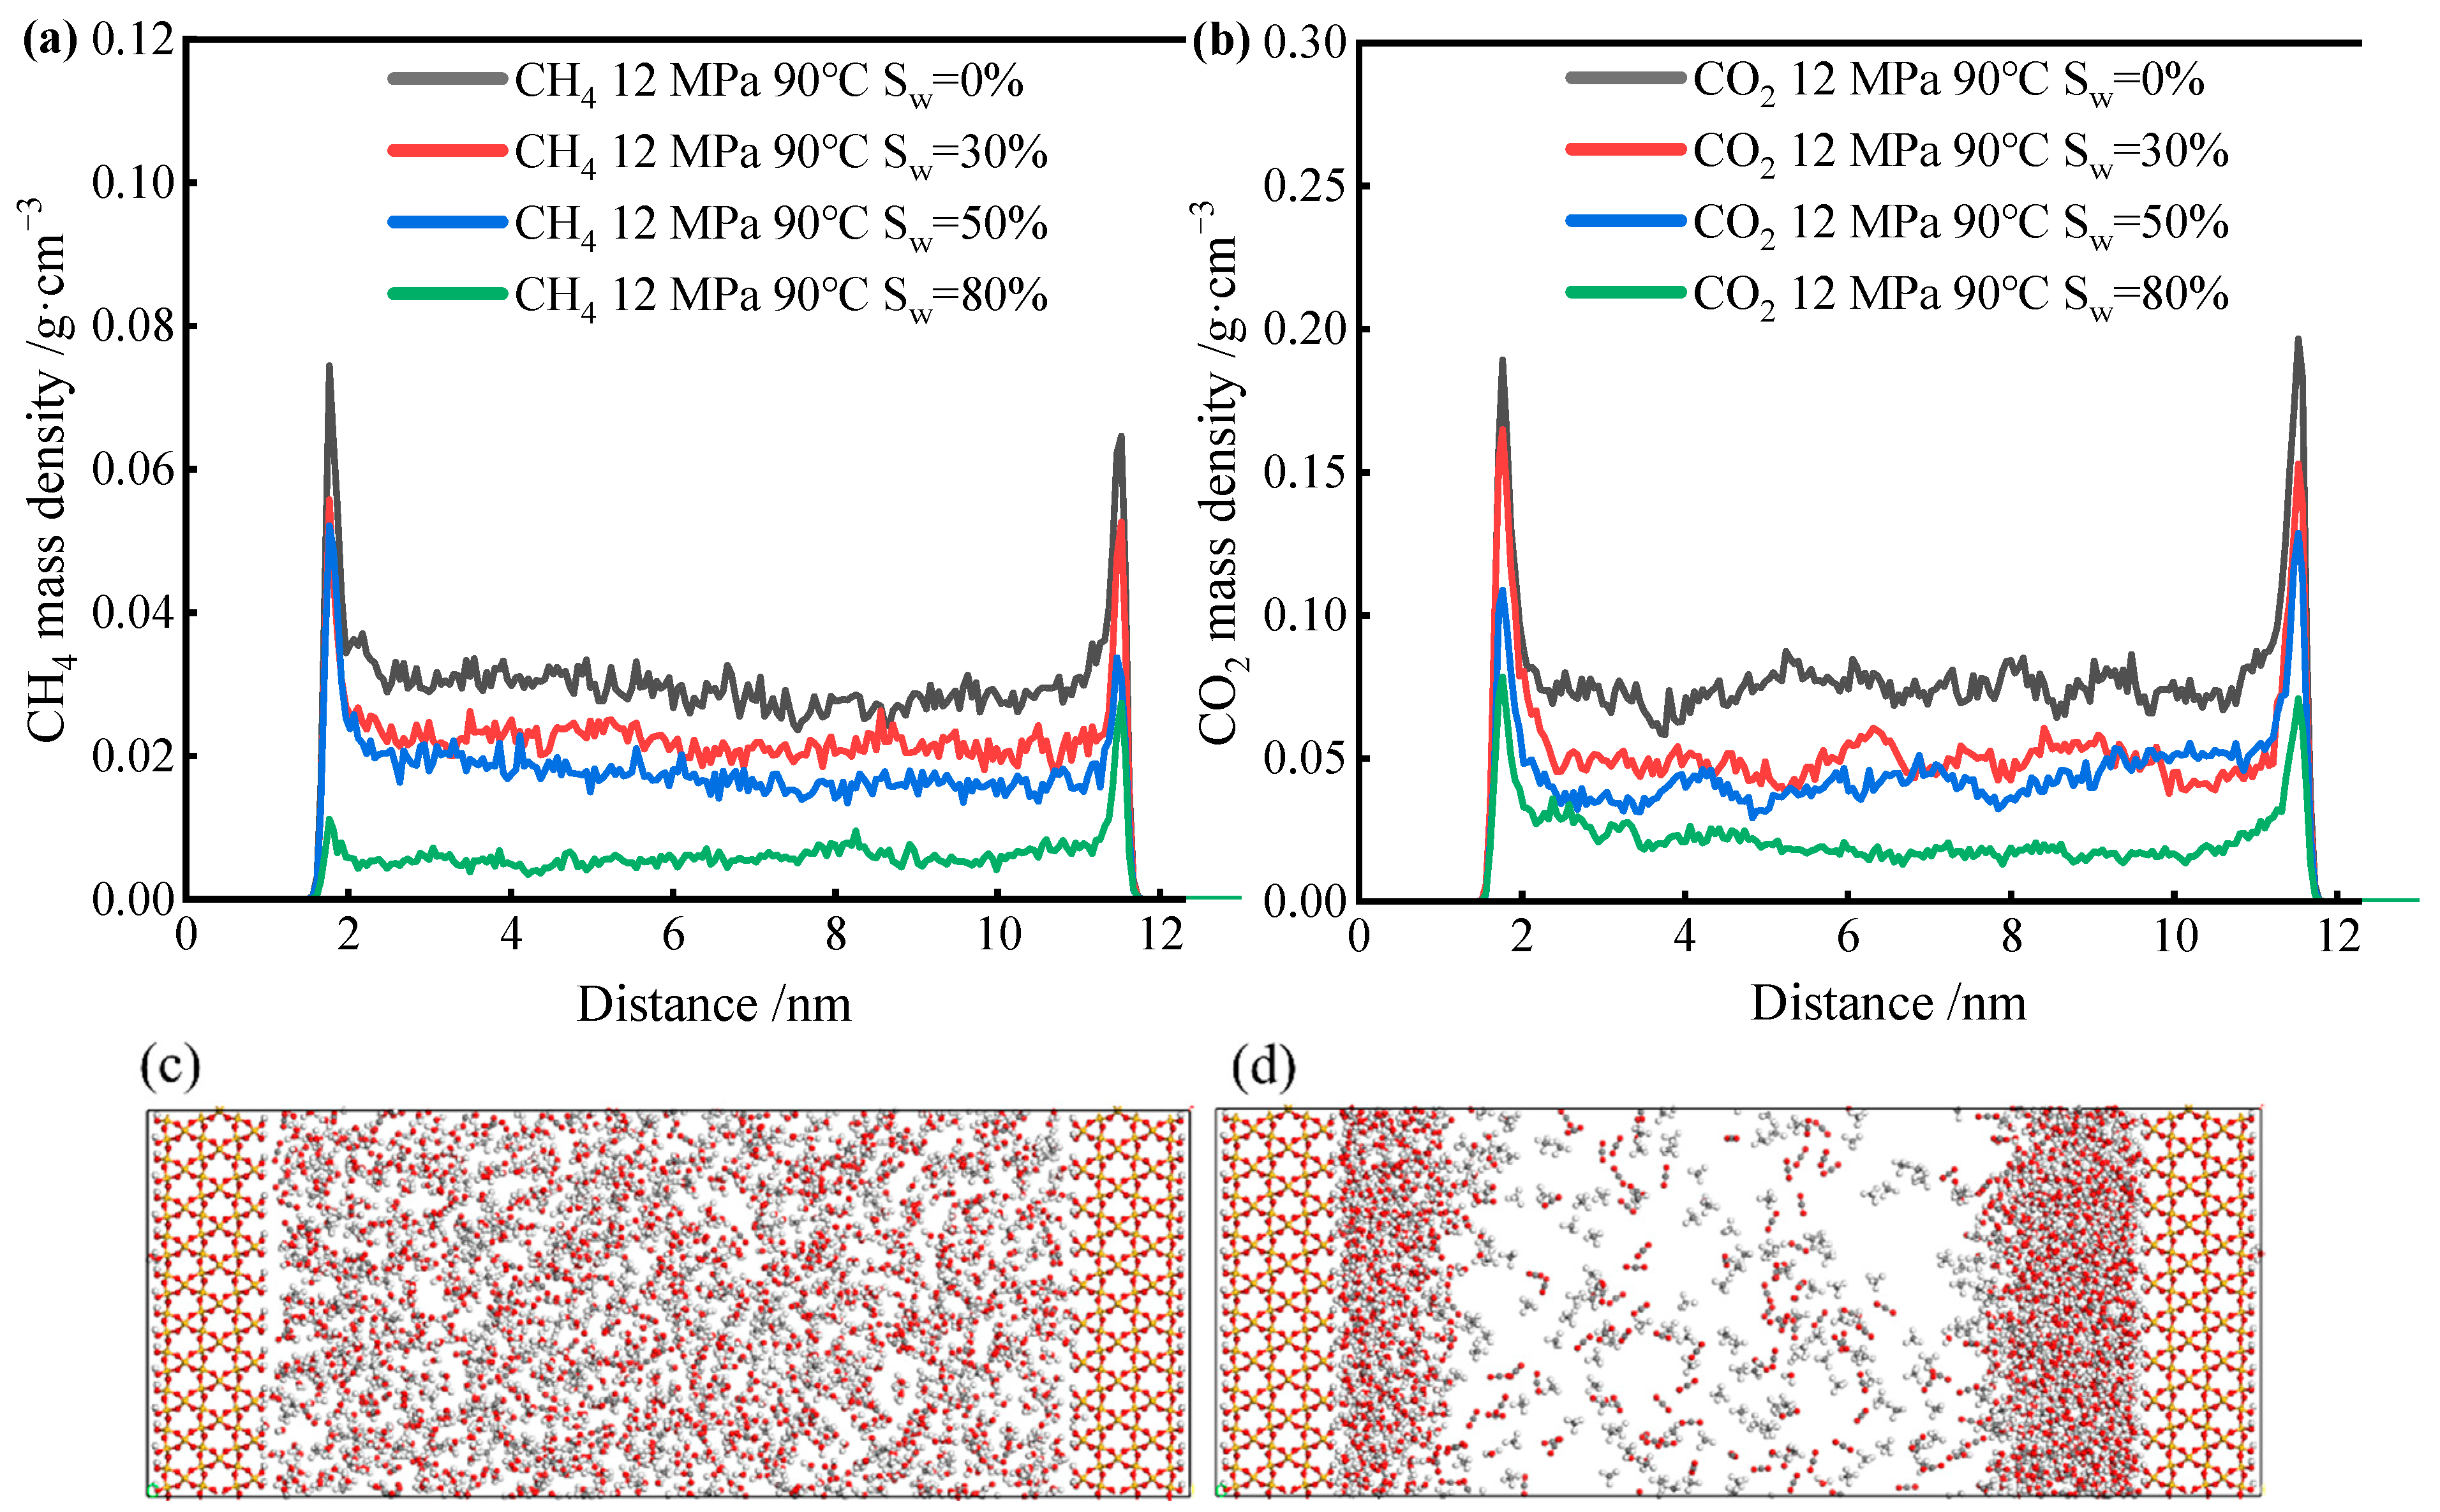
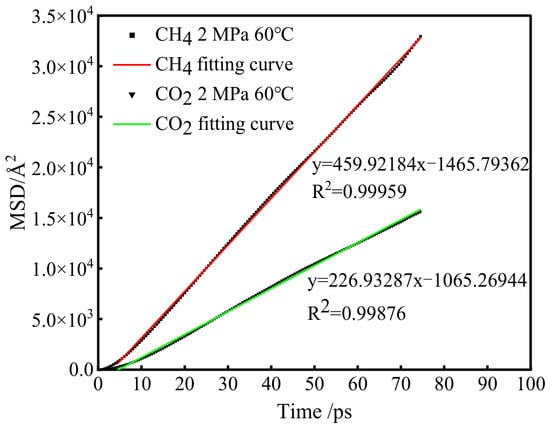
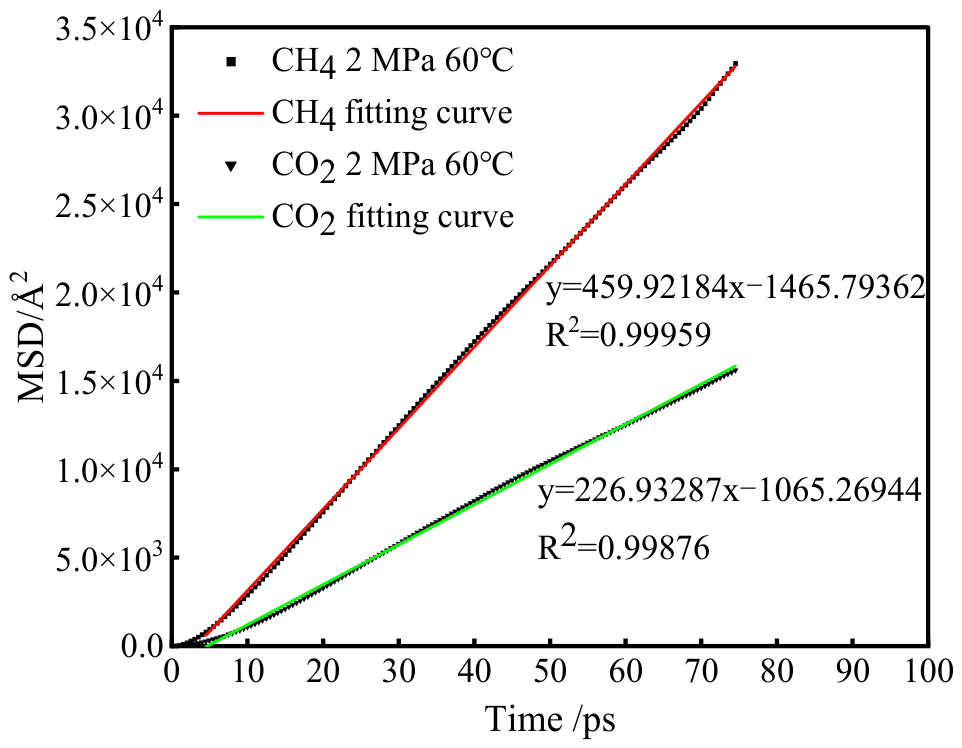
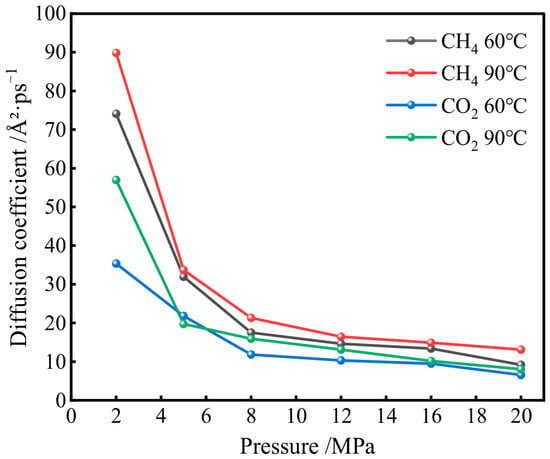
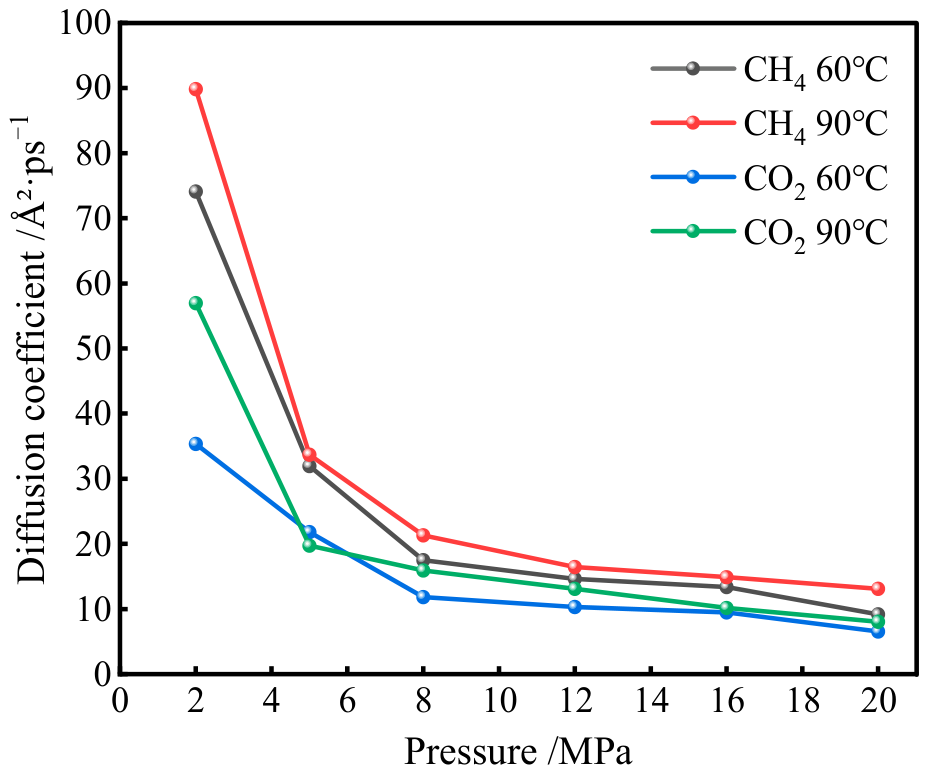
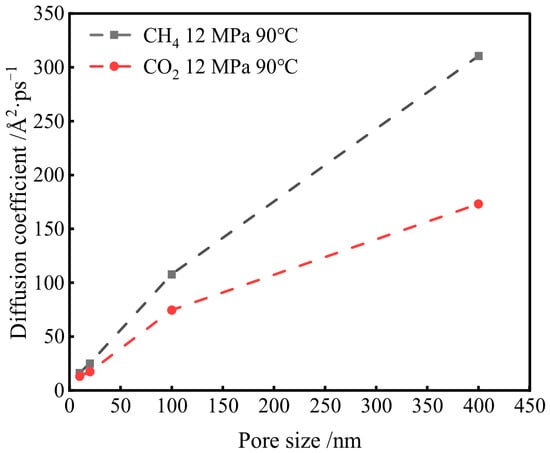
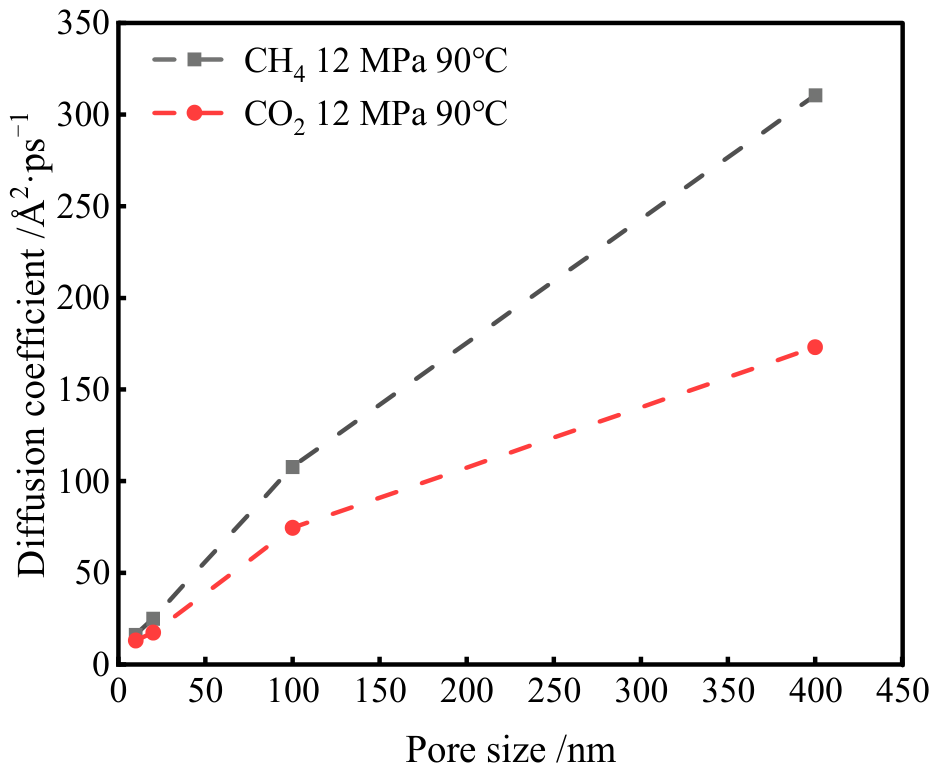
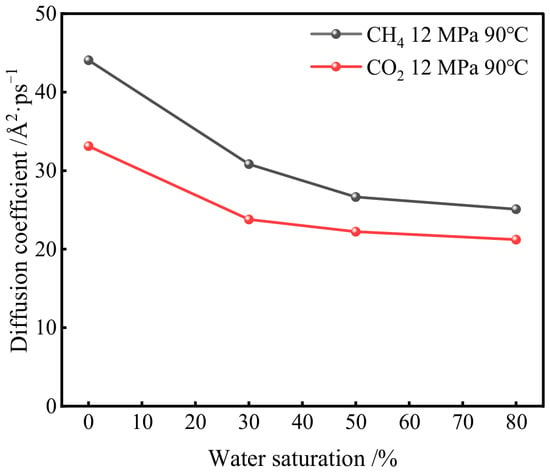
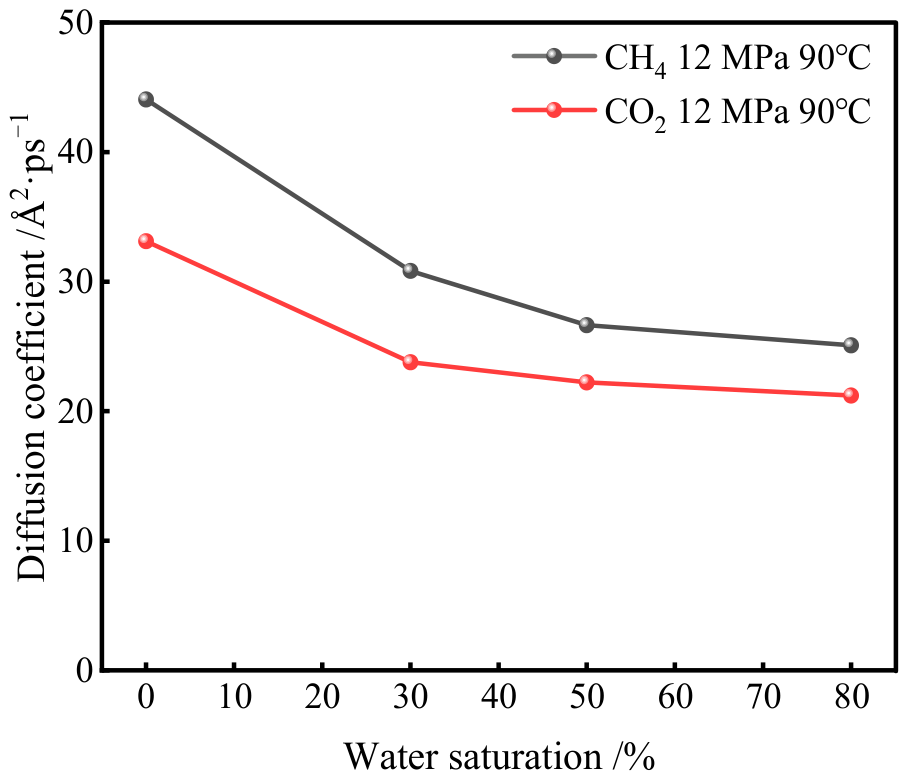

Disclaimer/Publisher’s Note: The statements, opinions and data contained in all publications are solely those of the individual author(s) and contributor(s) and not of MDPI and/or the editor(s). MDPI and/or the editor(s) disclaim responsibility for any injury to people or property resulting from any ideas, methods, instructions or products referred to in the content. |
© 2026 by the authors. Licensee MDPI, Basel, Switzerland. This article is an open access article distributed under the terms and conditions of the Creative Commons Attribution (CC BY) license.