


Abstract
Low-rank coalbed methane (CBM) resources are abundant in China, but their commercial development is limited by insufficient understanding of the coupled controls of coal material composition, pore-fracture structure, and desorption behavior in deeper low- to medium-rank bituminous coals. This study focused on the No. II coal seam in the Longjiapu Mining Area, southeastern uplift zone of the Songliao Basin. Fifteen samples were collected from three working faces. All 15 samples were subjected to material composition analysis (proximate analysis, vitrinite reflectance, and maceral composition). Eleven representative samples were selected for reservoir physical property characterization (thin-section microfracture observation, FE-SEM, mercury intrusion porosimetry, and low-temperature N2 adsorption), and nine of them were further used for high-pressure CH4 adsorption experiments. The coals are low- to medium-rank bituminous coals (Ro,max = 0.63–0.80%). The 620 working face has the most favorable pore-fracture structure, with the highest total pore volume and specific surface area, the lowest fractal dimensions, and the strongest microfracture development; the 615 working face is the poorest, and b4 is intermediate. The average Langmuir volume (VL) of the three working faces ranges from 12.40 to 16.94 m3/t, with an overall average of 15.47 m3/t; b4 has the highest value (16.94 m3/t), followed by 620 (15.91 m3/t), and 615 has the lowest value (12.40 m3/t). Partial correlation and ash-free normalization indicate that VL is positively correlated with volatile matter, and the negative correlation between ash and VL mainly reflects mineral dilution, suggesting that VL is controlled by organic matter abundance and micropore development. Among the three characteristic pressures, the 620 working face has the highest sensitive pressure (1.49 MPa); b4 has the highest starting pressure and transition pressure (8.69 and 4.12 MPa); and the 615 working face has the lowest values (6.37, 3.02, and 1.05 MPa). VL positively controls all three characteristic pressures, while coal rank negatively controls the sensitive pressure. Integrating pore-fracture development characteristics with desorption characteristic pressure parameters, the 620 working face has the best desorption performance, followed by b4, while 615 is the least favorable. This study reveals the controlling mechanism of pore-fracture structure on low-rank coal desorption behavior and provides a quantitative basis for favorable target selection of low-rank CBM in northeastern China.
1. Introduction
Low-rank coalbed methane (CBM) resources are abundant in China, with an estimated volume of 14.70 × 10¹² m3, accounting for approximately 40% of the country’s total CBM resources. These resources are mainly distributed in the Junggar, Erlian, and Songliao basins, and are characterized by large cumulative coal-seam thickness, low gas content, and poor permeability [1,2]. To date, low-rank CBM development has achieved breakthroughs in individual production wells: the CSD-01 well in the Fukang area of the Junggar Basin yielded a single-well gas production rate of 17,125 m3/d, and the Jimei-4 well in the Jiergalangtu Sag of the Erlian Basin reached a gas production rate of 2000 m3/d after 100 days of drainage. Nevertheless, commercial-scale development of low-rank CBM has not yet been realized [3,4,5]. A key reason is the insufficient understanding of the interplay among coal material composition, pore-fracture structure characteristics, and adsorption–desorption behavior in low-rank coal reservoirs.
Coal reservoirs possess a dual-porosity system consisting of pores and fractures, which provides critical space for methane adsorption, migration and storage. Current methods for characterizing pore-fracture structures can be mainly classified into three categories: fluid injection, image analysis, and physical detection. It is widely recognized that no single technique can comprehensively capture the multiscale pore-fracture structures in coal; accordingly, a combination of multiple characterization methods is required to overcome the limitations of individual techniques [6,7]. Numerous studies have integrated high-pressure mercury intrusion porosimetry (MIP), low-temperature nitrogen adsorption, and carbon dioxide adsorption, with fractal theory to analyze the dominant pore-size ranges characterized by different experimental methods, thereby achieving full-scale pore-size characterization of coal samples [8]. However, the significance of microfractures is often overlooked. As a “bridge” connecting nanoscale pores and macroscopic fractures within coal reservoirs, microfractures not only enhance the connectivity of multiscale pore-fracture networks but also serve as storage spaces, consequently affecting reservoir fracability and stimulation effectiveness. For coal reservoirs with extremely low matrix porosity, in particular, microfractures play a critical role in improving both storage capacity and permeability.
Coalbed methane production follows the classical theory of “drainage–pressure reduction–desorption-gas production”. To better understand the methane desorption process, many researchers have assumed that methane adsorption in coal is predominantly physisorption and that adsorption and desorption processes are approximately reversible. Accordingly, adsorption isotherms are commonly used to investigate the desorption process [9]. By introducing the concept of desorption efficiency, a quantitative classification method for CBM desorption stages has been established, and characteristic desorption pressure parameters and desorption stages have been defined, providing a new perspective for investigating the methane desorption process [10]. It should be noted, however, that the assumption of approximately reversible adsorption–desorption is a simplification. Adsorption–desorption hysteresis can occur in moist and pore-confined coal, and the desorption behavior inferred from adsorption isotherms may therefore deviate from the actual desorption process. Since no direct desorption experiments were performed in this study, the characteristic desorption pressures reported here are model-inferred values, and their absolute values should be further verified using field production data and direct desorption tests.
Despite these advances, two key knowledge gaps remain. First, the relative importance of multiple factors—including material composition, coal rank, and pore-fracture structure—in controlling methane adsorption–desorption behavior in low-rank coal reservoirs is still unclear. Second, most existing desorption studies have focused on coal rank and particle size, whereas the influence of material composition and pore-fracture structure on characteristic desorption pressures has rarely been quantified. To address these gaps, this study aims to answer the following questions: (1) How do the material composition, coal rank, and pore-fracture structure vary among different working faces? (2) How do these variations affect methane adsorption capacity and the characteristic desorption pressures? (3) Which factors play a dominant role in controlling desorption efficiency? We hypothesize that multiple geological factors jointly control desorption efficiency, and this study aims to clarify their relative importance. These questions are tested through integrated experiments and quantitative analysis.
Building on the above considerations, coal samples from the No. II coal seam in the Longjiapu Mining Area, southeastern Songliao Basin, were selected for this study. It should be noted that existing low-rank CBM studies have mostly focused on shallow (generally <1000 m), biogenic gas-dominated areas such as the southern Junggar Basin and the Erlian Basin, where accumulation is mainly controlled by structure, hydrogeology, and seal conditions. In contrast, the coal samples from the Longjiapu Mining Area are buried at greater depths (1174–1260 m), are low- to medium-rank bituminous coal with more pronounced thermogenic characteristics, and their desorption behavior is mainly controlled by pore-fracture structure, which differs from the “accumulation-controlled” perspective adopted for the above basins. This difference is the main reason for selecting the Longjiapu Mining Area for the present study on desorption behavior from the perspective of pore-fracture structure. A suite of experimental investigations and quantitative analyses was systematically conducted. Proximate analysis, quantitative maceral analysis, and vitrinite reflectance measurements were performed to determine the material composition and coal quality characteristics of the major producing coal seam in the study area. Optical microscopy combined with large-area image stitching were employed to characterize the scale, morphology, and development intensity of microfractures in coal reservoirs. Furthermore, scanning electron microscopy (SEM), MIP, and low-temperature nitrogen adsorption were integrated to reveal the development characteristics of pores with different genetic origins, compare variations in pore-size distributions among samples, and quantitatively analyze the heterogeneity of pore structures using fractal theory.
On this basis, the Langmuir adsorption model was applied to fit the methane adsorption isotherms, and the adsorption starting pressure, transition pressure, and sensitive pressure were determined. The methane desorption process was subsequently divided into distinct evolutionary stages, enabling a systematic investigation of the mechanisms by which coal material composition, pore structure, and fracture structure influence desorption behavior. Finally, the desorption performance of different coal reservoirs in the study area was comprehensively evaluated. The findings provide theoretical support and scientific references for the efficient exploration of low-rank coalbed methane in northeastern China.
2. Regional Geological Setting
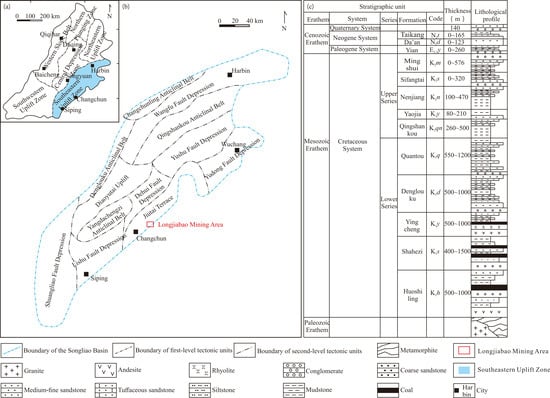
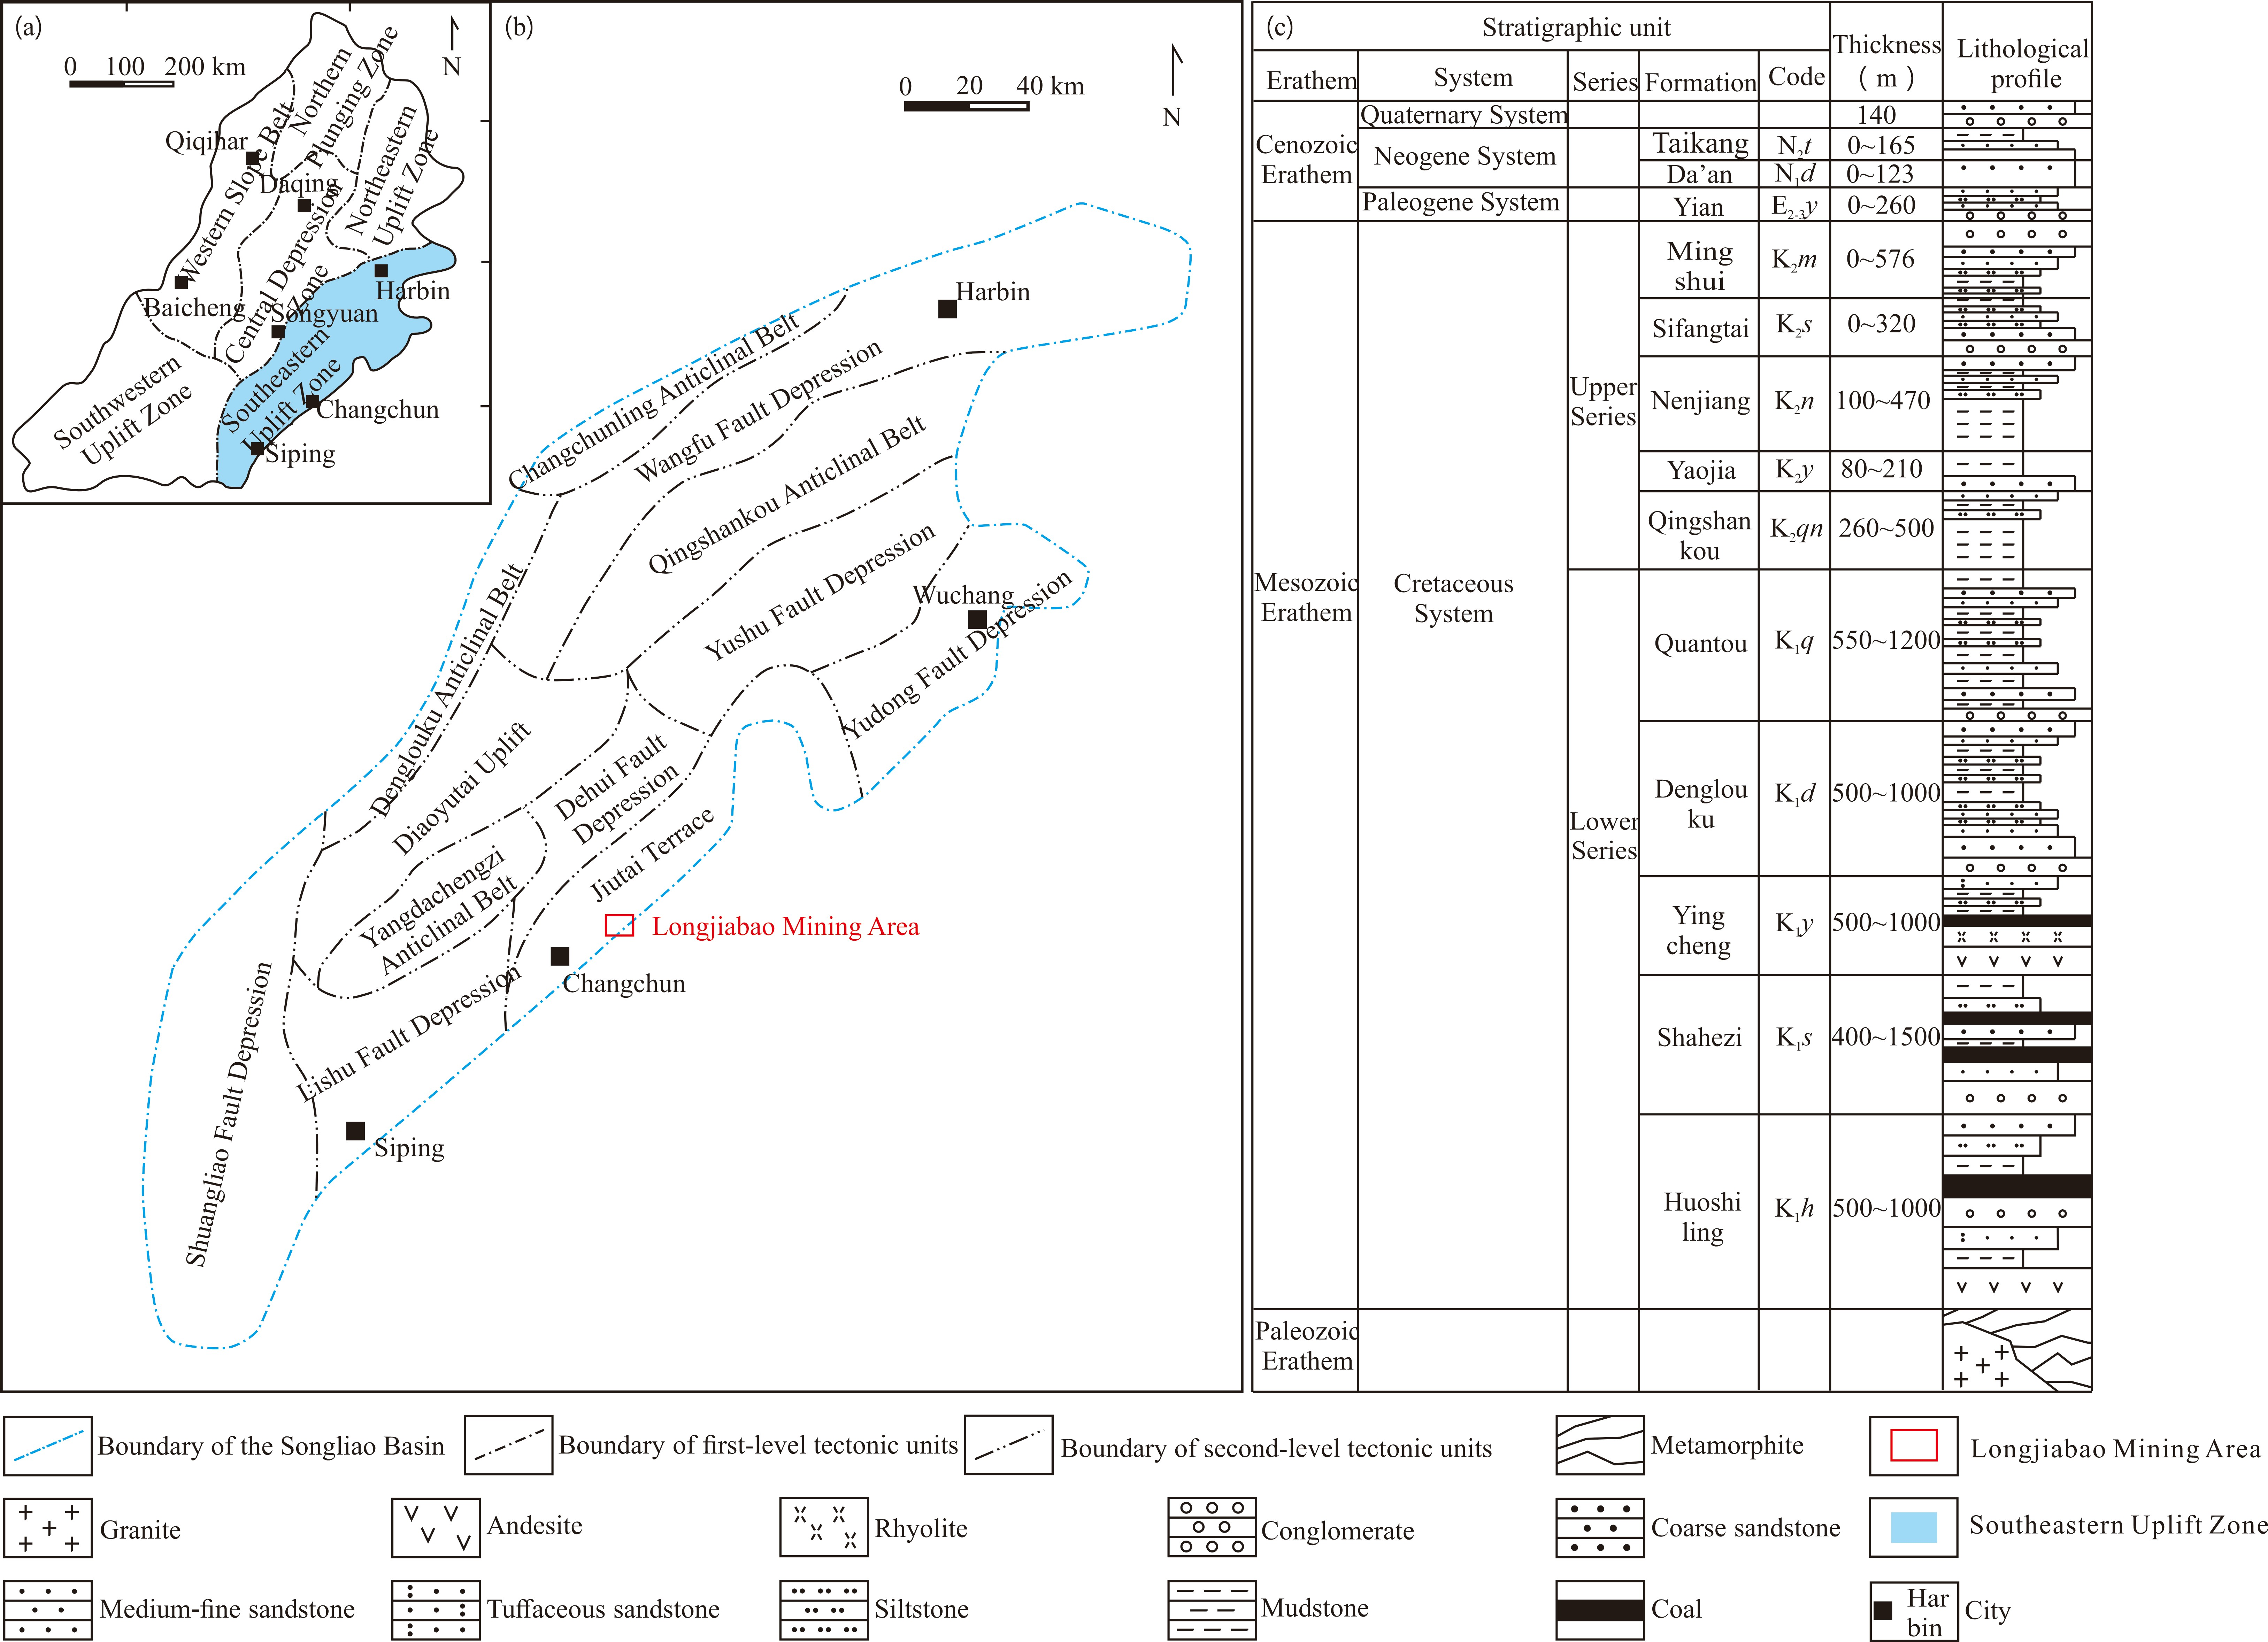
The Longjiapu Mining Area is located in Longjiapu Town, Jiutai District, Changchun City, Jilin Province, and is tectonically situated within the southeastern uplift zone of the Songliao Basin. As a first-order tectonic unit of the Songliao Basin, the southeastern uplift zone covers an area of approximately 5.2 × 10⁴ km2 (Figure 1a). The regional tectonic framework is jointly controlled by basement fault activity and multiple phases of tectonic movement. The framework is dominated by NNE-trending fault zones, overprinted by NW-trending secondary faults, resulting in a complex tectonic system. The tectonic evolution of the study area can be divided into four stages: extensional faulting, fault-depression transition, thermal subsidence, and tectonic inversion [11,12]. Based on the spatial distribution of regional NNE-trending extensional faults, the southeastern uplift zone can be further divided into 12 secondary tectonic units. From north to south and from west to east, these units include the Changchunling anticline belt, Wangfu fault depression, Qingshankou anticline belt, Yushu fault depression, Yudong fault depression, Denglouku anticline belt, Diaoyutai uplift, Yangdachengzi anticline belt, Dehui fault depression, Jiutai terrace, Lishu fault depression, and Shuangliao fault depression (Figure 1b). The Longjiapu Mining Area is specifically located in the southeastern part of the Jiutai terrace, representing a small-scale Early Cretaceous volcanic fault-depression coal-bearing basin developed along the southeastern margin of the Songliao Basin.
Figure 1.
Tectonic setting and stratigraphic column of the study area. (a) Regional tectonic location map; (b) Tectonic unit division of the southeastern uplift zone and the location of the Longjiapu Mining Area; (c) Regional stratigraphic column.
The stratigraphic succession in the study area consists predominantly of Cretaceous and Cenozoic strata, with a relatively complete sequence and well-defined stratigraphic contacts. From base to top, the Lower Cretaceous consists successively of the Huoshiling Formation, Shahezi Formation, Yingcheng Formation, Denglouku Formation, and Quantou Formation, followed by the Upper Cretaceous Qingshankou Formation, Yaojia Formation, Nenjiang Formation, Sifangtai Formation, and Mingshui Formation. The Cenozoic succession includes the Eocene–Oligocene Yian Formation, Miocene Da’an Formation, Pliocene Taikang Formation, and Quaternary unconsolidated sediments (Figure 1c). The regional coal resources are mainly hosted in the Lower Cretaceous Huoshiling, Shahezi, and Yingcheng formations. The principal coal-bearing interval in the Longjiapu Mining Area occurs in the upper member of the Yingcheng Formation (K1y3), which was deposited in a lakeshore–marsh environment.
Based on the vertical characteristics of the coal seams, the coal-bearing strata in the mining area can be vertically divided into four coal seam groups, designated I, II, III, and IV from bottom to top, among which the No. II coal seam is the principal mineable horizon. The No. II coal seam is relatively stable in thickness, ranging from 3.30 to 15.60 m, with an average of 7.98 m. The coal is predominantly of semi-bright to bright macrolithotype, with good coal quality. To date, the total identified coal reserves in the mining area amount to 1.81 × 10⁸ t, making it an important coal production base in northeastern China and a key area of CBM enrichment in the region [13], with considerable development potential.
3. Sample Collection and Experimental Methods
For this study, a total of 15 coal samples were collected from the No. II coal seam—the principal mineable seam of the Yingcheng Formation in the Longjiapu Mining Area. Three samples were collected from the b4 transportation roadway face (b4 in the figures) at a burial depth of 1174 m, four from the 615 working face (615 in the figures) at 1200 m, and eight from the 620 working face (620 in the figures) at 1260 m. The samples were obtained by channel sampling on freshly exposed coal walls, with the sampling direction perpendicular to the bedding. The selection criteria were fresh, unweathered, gangue-free, and representative samples. The samples were evenly distributed within each working face and are considered representative of the coal reservoir characteristics of that working face.
The experimental analyses comprised three main parts (Table S1). Material composition was analyzed using proximate analysis, vitrinite reflectance measurement, and maceral composition analysis. Pore-fracture structure was investigated through petrographic thin-section observation, FE-SEM, MIP, and low-temperature nitrogen adsorption. Methane adsorption–desorption behavior was evaluated using isothermal adsorption experiments. All experiments were performed in strict accordance with Chinese national standards, and the detailed procedures and technical parameters are described as follows:
- (1)
- Proximate analysis was performed in accordance with the Chinese standard GB/T 212-2008 (Proximate Analysis of Coal) [14]. Coal samples were crushed and sieved to <0.2 mm, and about 1 g of each sample was used for analysis. Each sample was measured in triplicate, and the mean value was reported. A 5E-MACIII infrared rapid coal analyzer was used, and the instrument was calibrated daily with a standard coal sample. The detection limits and analytical precision for proximate analysis followed GB/T 212-2008. Specifically, the detection limits were 0.10% for moisture, 0.20% for ash, and 0.50% for volatile matter; the quantification limits were 0.50% for moisture, 1.00% for ash, and 1.00% for volatile matter. The repeatability limits were 0.20–0.30% for moisture, 0.20–0.50% for ash (depending on ash content), and 0.30–1.00% for volatile matter (depending on volatile matter content); the reproducibility limits were 0.30–0.50% for moisture, 0.30–0.70% for ash, and 0.50–1.50% for volatile matter.
- (2)
- Vitrinite reflectance was measured following GB/T 6948-2008 (Method of determining microscopically the reflectance of vitrinite in coal) [15]. Polished coal blocks were prepared, and more than 100 vitrinite particles were randomly selected and measured using a Leica DM4500P polarizing microscope (Leica Microsystems, Wetzlar, Germany) equipped with a microspectrophotometer. The instrument was calibrated using standard reflectance standards. The repeatability standard deviation was <0.02%. The average reflectance was used to evaluate coal rank.
- (3)
- Maceral composition analysis was conducted according to GB/T 15588-2013 (Classification of macerals for bituminous coal) [16]. A ZEISS Axio Imager A2m polarizing microscope (Carl Zeiss Microscopy GmbH, Jena, Germany) was used under oil immersion, and at least 500 points were counted per sample to determine the volume percentages of vitrinite, liptinite, and inertinite. Repeated counts were performed to ensure analytical precision.
- (4)
- Standard thin sections (30 μm thick) were prepared perpendicular to bedding to capture fractures intersecting the bedding at high angles as well as the cross-sectional morphology of bedding-parallel fractures. Because the samples were collected from different working faces with variable cleat orientations, the section orientation was not specifically controlled relative to a single cleat direction; instead, all sections were cut perpendicular to bedding to represent the dominant fracture sets associated with bedding. It should be noted that two-dimensional section measurements are subject to stereological bias, which may cause underestimation or overestimation of fracture density, length, and areal porosity depending on the angle between the section and the fracture plane. In this study, large-area image stitching and multi-field statistics were used to reduce local bias, and the comparison among working faces is based on relative rather than absolute values. Samples were observed using a Nikon Eclipse LV100POL (Nikon Corporation, Tokyo, Japan) polarizing microscope at a magnification of 500× with a pixel resolution of 0.25 μm/pixel. For each sample, 20 images were captured and stitched into a large-area image, giving a total analyzed area of approximately 5 mm2. Microfractures were quantitatively characterized using ImageJ software (version 1.54p; National Institutes of Health, Bethesda, MD, USA). The segmentation threshold was set at a gray value of 120, and the minimum detectable fracture aperture was approximately 1 μm. Intersecting fractures were treated as separate segments unless they formed a clear junction. The quality-control procedure included comparing the processed images with the original images, manually checking fracture retention, and repeating the analysis three times per sample to obtain an average value.
- (5)
- FE-SEM analysis was performed using a ZEISS GeminiSEM 500 instrument (Carl Zeiss Microscopy GmbH, Oberkochen, Germany). Following argon-ion polishing, samples were observed at an accelerating voltage of 5 kV. The magnification, pixel resolution, number of images, and total analyzed area per sample were recorded.
- (6)
- MIP was conducted in accordance with GB/T 21650.1-2008 [17]. A 1 cm3 cubic sample was analyzed using an AutoPore IV 9505 porosimeter (Micromeritics Instrument Corp., Norcross, GA, USA). The maximum intrusion pressure was 60,000 psi, the contact angle was 140°, and the mercury surface tension was 485 mN/m. The pressure-equilibration criterion was 10 s. Blank and compressibility corrections were applied. Pore volume, specific surface area, average pore diameter, and pore-size distribution parameters were calculated from mercury intrusion–extrusion data using the Washburn equation. The detectable pore diameter range was 3 nm to 800 μm.
- (7)
- Low-temperature nitrogen adsorption was performed using a Micromeritics ASAP 2460 analyzer (Micromeritics Instrument Corp., Norcross, GA, USA) at 77 K. Coal samples were crushed to 0.25–0.18 mm, and about 2 g of each sample was degassed at 300 °C under a vacuum below 10 μmHg (approximately 1.33 Pa) for 6 h. The relative pressure range was 0.01–0.99, and the equilibration criterion was a pressure change of <0.01 mmHg/s. Specific surface area was calculated using the Brunauer–Emmett–Teller (BET) model. Pore-size distribution was analyzed using the Barrett–Joyner–Halenda (BJH) model based on the adsorption branch. Micropore structure was corrected using the non-local density functional theory (NLDFT) equilibrium model with the kernel “N2 at 77 K on carbon (slit pore, NLDFT equilibrium model)”, assuming slit-shaped pore geometry and a nitrogen-on-carbon adsorbate–surface model.
- (8)
- Methane adsorption isotherm experiments were conducted according to GB/T 19560-2025 (Experimental method of high-pressure isothermal adsorption to coal) [18]. Prior to the adsorption measurements, coal samples were crushed and sieved to 0.25–0.18 mm (60–80 mesh) and equilibrated at 30 °C and approximately 96–97% relative humidity in a desiccator containing saturated potassium sulfate solution, until the mass change between two consecutive weighings was less than 2% of the sample mass. The equilibrium moisture contents ranged from 2.255% to 4.251%. The equilibrium moisture content was then calculated from the mass difference before and after equilibration. About 40 g of each sample was used. Methane purity was 99.99%. The void volume was calibrated using helium. The pressure points were 0, 0.5, 2, 4, 6, 8, 10, 11.5, 12.5, 14, and 15 MPa, and the equilibration time at each pressure point was at least 4 h. Adsorption measurements were performed using an ATM volumetric high-pressure adsorption instrument at 30 °C. The gas density was calculated using the Peng–Robinson equation of state as implemented in the instrument software. Adsorption was measured as excess adsorption, and absolute adsorption was calculated using the Langmuir equation with buoyancy correction. The Langmuir model was fitted to the adsorption data to obtain the Langmuir volume and pressure-related parameters.
4. Results and Discussion
4.1. Basic Characteristics of Coal Samples
4.1.1. Coal Rank Evaluation Based on Proximate Analysis and Vitrinite Reflectance
Vitrinite reflectance (Ro,max) is a key parameter for coal rank classification and directly reflects the degree of coalification. In this study, the average Ro,max values of coal samples from the three working faces fall within a narrow range, ranging from 0.63% to 0.80% (Table 1), indicating that the coals are classified as low- to medium-rank bituminous coals.
Table 1.
Proximate analysis, vitrinite reflectance, and maceral composition of coal samples from different working faces.
The proximate analysis results show that the moisture content (Mad) of all coal samples is relatively stable, ranging from 2.45% to 4.79%, with an average of 3.21%. The average moisture contents of the b4 transportation roadway face, 615 working face, and 620 working face are 3.21%, 3.27%, and 3.17%, respectively, showing no significant differences among working faces. All samples are classified as ultra-low-moisture coal. The ash content (Aad) varies significantly, ranging from 5.21% to 36.69%, with an average of 13.65%. The 615 working face has the highest average ash yield (16.92%), corresponding to medium-ash coal. The 620 working face has an average ash content of 14.78%, classified as low-ash coal, while the b4 transportation roadway face has the lowest average ash content (6.29%), representing ultra-low-ash coal. The volatile matter content (Vad) ranges from 28.70% to 41.12%, with an average value of 35.10%. The average volatile matter contents of the b4 transportation roadway face, 615 working face, and 620 working face are 37.72%, 32.50%, and 35.41%, respectively. Differences among the working faces are relatively small, and all samples exhibit relatively high volatile matter contents, indicating high-volatile coal. The fixed carbon content (FCad) ranges from 31.52% to 56.87%, with an average of 48.05%. Differences exist among the three working faces, with the highest average observed in the b4 transportation roadway face (52.78%), followed by the 615 working face (47.31%) and the 620 working face (46.64%).
Overall, the proximate analysis results indicate that moisture contents of coal samples from different working faces are similar, while the average volatile matter contents all exceed 30%, suggesting high reactivity of the coal samples from the principal coal seam [19]. Significant differences are observed in ash and fixed carbon content among the three working faces. The b4 transportation roadway face has the highest fixed carbon content and the lowest ash yield, indicating a relatively higher degree of coalification and lower mineral dilution. In contrast, the 615 working face has the highest ash content and the lowest volatile matter content, while the 620 working face shows intermediate values (Table 1).
4.1.2. Maceral Composition Characteristics
The maceral composition of the coal samples from the No. II coal seam is summarized in Table 1. On a whole-rock basis, vitrinite is the dominant maceral group, with contents ranging from 94% to 100% (mean 95.8%). Inertinite and liptinite contents are low, ranging from 0% to 2% (mean 1.0%) and 0% to 2% (mean 1.2%), respectively. Mineral matter content ranges from 0% to 3% (mean 2.0%). Among the three working faces, the mean vitrinite content is 96.0% for the b4 working face, 95.5% for the 615 working face, and 95.9% for the 620 working face. The mean inertinite content is 1.0%, 1.3%, and 0.9%, respectively; the mean liptinite content is 1.0%, 1.3%, and 1.3%, respectively; and the mean mineral matter content is 2.0% for all three working faces. These differences are minor, indicating that the maceral composition is relatively uniform across the three working faces. Sample-level maceral data are provided in Table 1.
4.2. Pore Classification and Pore Structure Characteristics
4.2.1. Development Characteristics of Pores with Different Genetic Origins
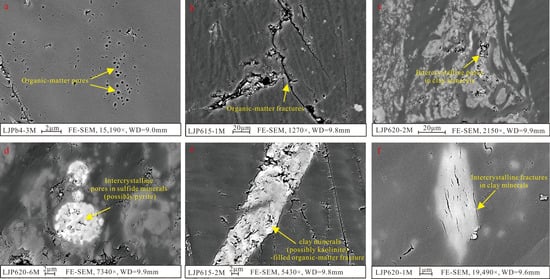
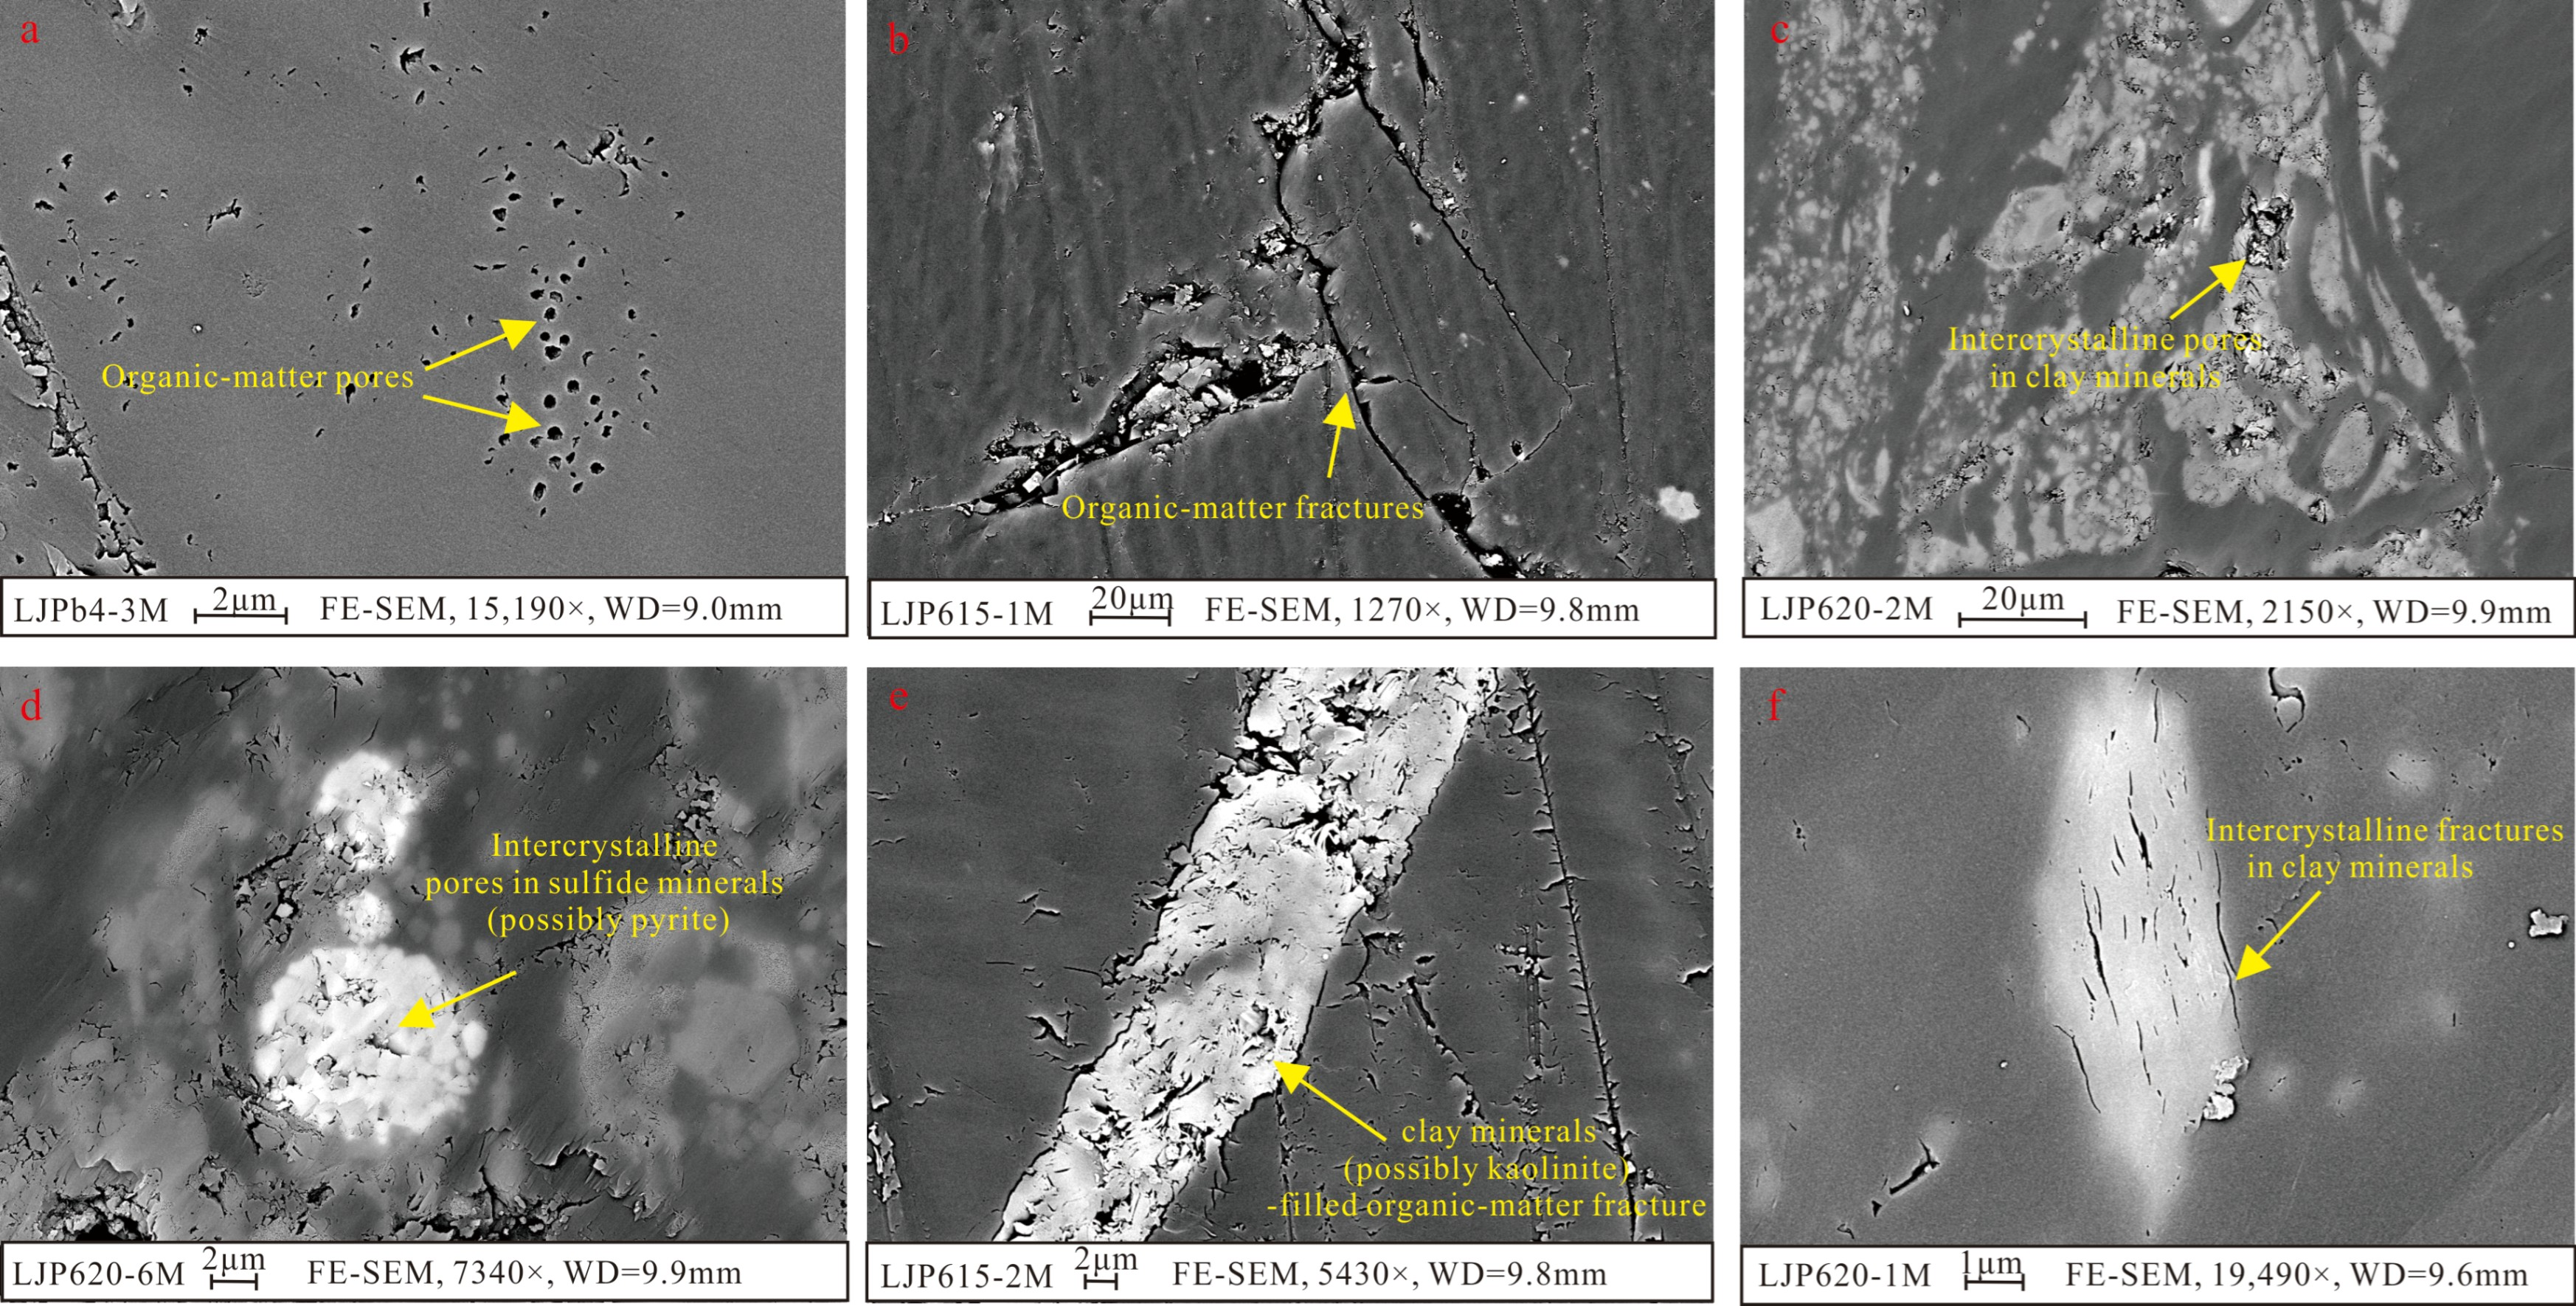
Five main types of pores and fractures are developed in the principal coal seam of the Longjiapu Mining Area, including organic matter pores, organic matter fractures (partially filled with clay minerals and partially unfilled), clay mineral intercrystalline pores, sulfide mineral intercrystalline pores (possibly pyrite), and clay mineral intercrystalline fractures (Figure 2). It should be noted that mineral types were inferred from FE-SEM morphology. The genetic mechanisms and microscopic characteristics of these pore types are described as follows:
Figure 2.
Pores with different genetic origins in the principal coal seam of the Longjiapu Mining Area. (a) organic-matter pores in sample LJPb4-3M; (b) organic-matter fractures in sample LJP615-1M; (c) intercrystalline pores in clay minerals in sample LJP620-2M; (d) intercrystalline pores in sulfide minerals, possibly pyrite, in sample LJP620-6M; (e) an organic-matter fracture filled with clay minerals, possibly kaolinite, in sample LJP615-2M; (f) intercrystalline fractures in clay minerals in sample LJP620-1M.
- (1)
- Organic matter pores
Direct microscopic observations show that organic matter pores occur mainly within specific organic macerals, such as vitrinite and huminite. They commonly exhibit circular, elliptical, and droplet-like morphologies, and are generally isolated in distribution. The pore boundaries are smooth and well-defined, with no infilling, and pore diameters range from 0.1 to 6 μm (Figure 2a). These pores may have formed during coalification, when gas generated from organic matter accumulated and the gas expansion pressure reached a dynamic equilibrium with the coal matrix stress, resulting in secondary pores (i.e., gas pores) [20]. However, alternative origins, such as organic matter shrinkage or other processes, cannot be excluded based on morphology alone. Further evidence, such as thermal simulation experiments or high-resolution imaging, would be required to confirm their origin.
- (2)
- Organic matter fractures
Organic matter fractures are secondary fractures formed during organic matter maturation (Figure 2b). The extension direction of these fractures is closely related to the distribution of organic matter. Some fractures are selectively filled with clay minerals, whereas the unfilled portions provide effective spaces for fluid storage and migration [21].
- (3)
- Clay mineral intercrystalline pores
Clay minerals, possibly dominated by kaolinite, are mainly distributed within the coal matrix or fill various pores, fractures, and plant cell cavities. They exhibit irregular morphology and variable particle sizes. Under microscopic observation, clay minerals commonly occur as irregular aggregates, spot-like, banded, lenticular, and thin-layered forms, with vermicular forms occasionally observed. Intercrystalline pores are widely developed between clay mineral crystals (Figure 2c). In terms of genesis, detrital clay minerals generally have a disordered structure, whereas authigenic clay minerals are characterized by an ordered structure. In the coal samples from the Longjiapu Mining Area, clay minerals mainly occur in banded, lenticular, thin-layered, and matrix forms. They are generally distributed parallel to the bedding along the microscopic lamination of the coal matrix. Significant differences exist in the width, distribution density, and continuity of clay mineral bands, suggesting that the clay minerals in the study area may be predominantly of detrital origin, although this cannot be confirmed without XRD/EDS analysis (Figure 2e). Some clay minerals fill pore and fracture spaces and occur within the cell cavities of organic macerals such as fusinite and telinite. Their morphology is highly consistent with the inherent geometry of the spaces they occupy.
- (4)
- Sulfide mineral intercrystalline pores
Sulfide minerals (possibly pyrite) are typical minerals in coal and commonly occur in coal seams formed under marine or transitional marine–terrestrial depositional environments [22,23]. In the coal samples from the Longjiapu Mining Area, sulfide minerals mainly occur in granular and disseminated forms. Granular sulfide minerals exhibit relatively well-developed euhedral to subhedral crystals and commonly form aggregates of euhedral grains. Disseminated sulfide minerals are irregularly distributed within the clay mineral matrix or pore spaces, showing significant variations in morphology and particle size. Intercrystalline pores are well developed between sulfide mineral crystals (Figure 2d).
- (5)
- Clay mineral intercrystalline fractures
Clay mineral intercrystalline fractures are slit-shaped pores formed between clay mineral crystal particles, with pore sizes ranging from several nanometers to over 1 μm. Owing to their widespread distribution in coal seams, these fractures act as important storage spaces and migration pathways for fluids, exerting a critical influence on the occurrence and production of coalbed methane and other resources [24,25]. Their formation is closely related to the crystal structure of clay minerals. Clay minerals possess layered crystal structures, and their fine particle size results in relatively high specific surface energy. These characteristics facilitate the development of microfractures between clay mineral crystals (Figure 2f).
4.2.2. Characterization of Pore Structure Heterogeneity
In this study, the Hodot classification is adopted for pore-size classification of coal reservoirs, while the IUPAC classification is used only for the interpretation of physisorption isotherm and hysteresis loop types. Following the Hodot scheme and considering the pore-size distribution characteristics of coal samples from the Longjiapu Mining Area, pores were classified into four categories according to pore diameter: macropores (>1000 nm), mesopores (100–1000 nm), transition pores (10–100 nm), and micropores (<10 nm) [6,25].
- (1)
- Pore Structure Characterization by Nitrogen Adsorption
Compared with high-pressure mercury intrusion porosimetry, nitrogen adsorption can more effectively characterize the morphology of pores smaller than 100 nm. According to the IUPAC classification [26], physisorption isotherms are divided into six types, and hysteresis loops are categorized into H1–H5 types. It should be noted that the IUPAC classification is used here to describe the isotherm and hysteresis loop types, not to classify the pore sizes of the coal reservoir.
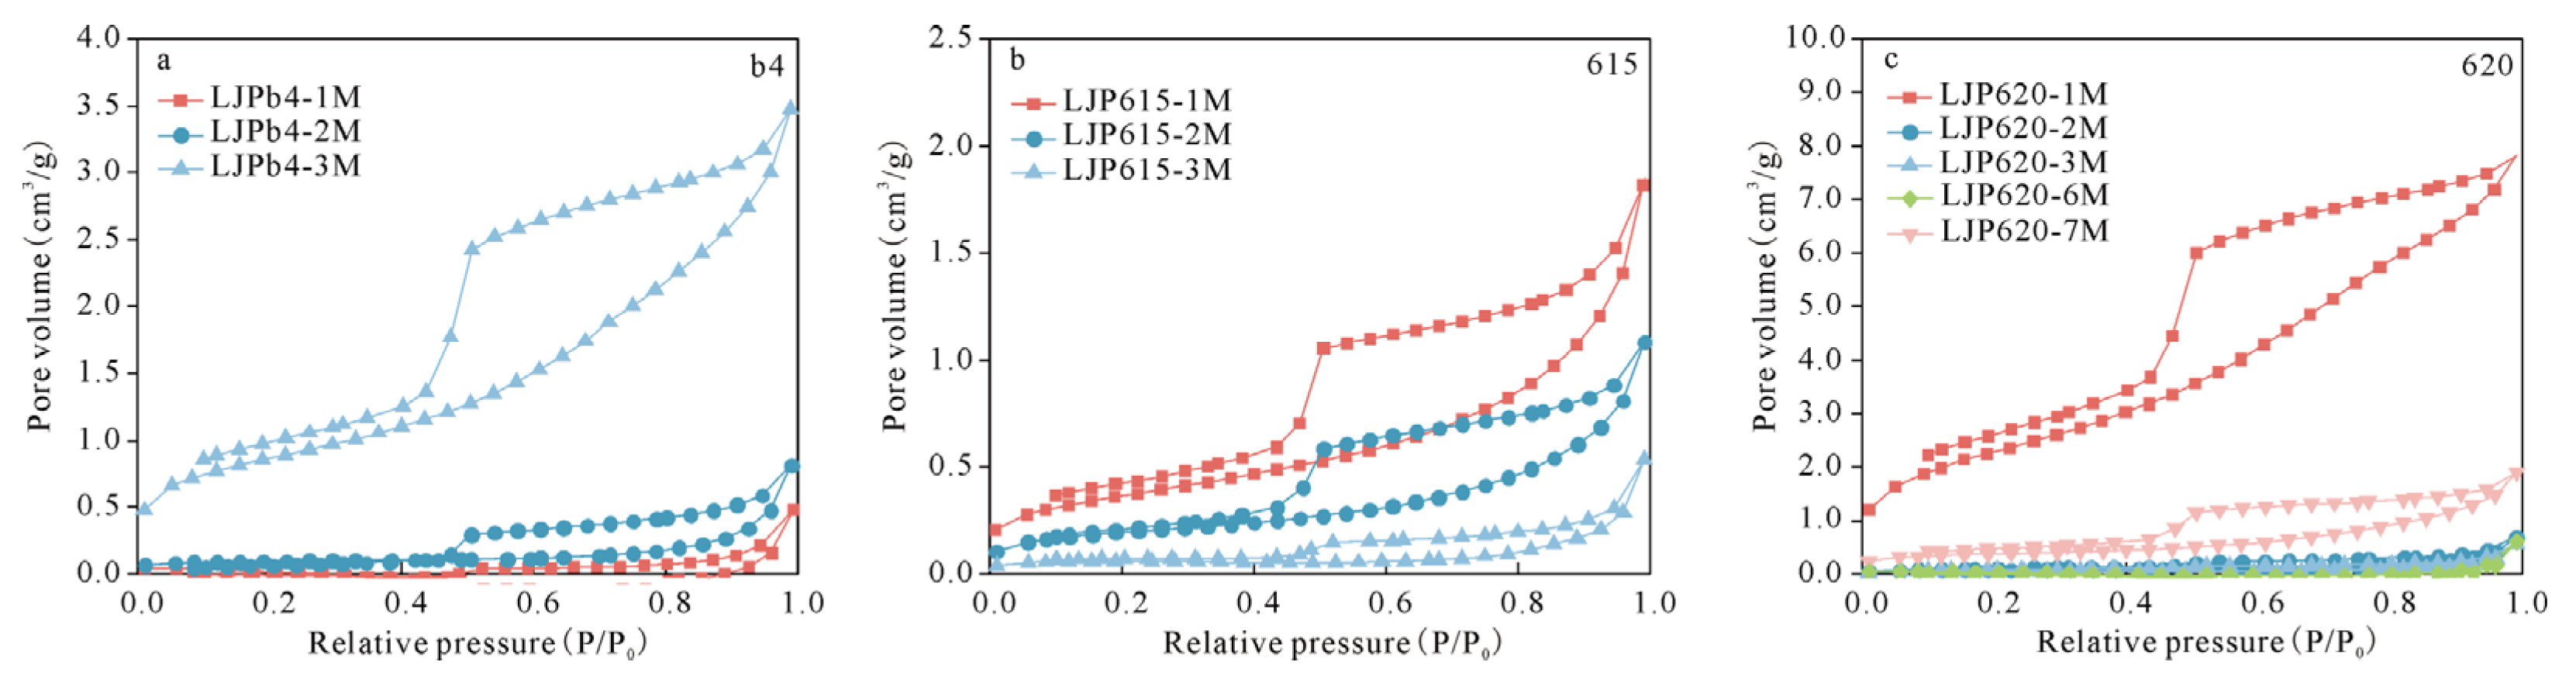
Nitrogen adsorption results indicate that the pore structures of coal samples from different working faces in the Longjiapu Mining Area can be classified overall according to the proportion of samples exhibiting each isotherm type (Figure 3). Among the three samples from the b4 transportation roadway face, LJPb4-1M and LJPb4-2M exhibit Type III isotherms, while LJPb4-3M exhibits a Type IV(a)+I isotherm. Type III is dominant; therefore, this working face is classified overall as Type III, reflecting a predominance of macropores/fractures and poorly developed micropores, with only local samples developing H2(a)-type hysteresis loops and containing ink-bottle pores. Among the three samples from the 615 working face, LJP615-1M and LJP615-2M exhibit Type IV(a)+I isotherms with H2(a)-type hysteresis loops, while LJP615-3M exhibits a Type III isotherm. Type IV(a)+I is dominant; therefore, this working face is classified overall as Type IV(a)+I, indicating well-developed micropores and ink-bottle mesopores with a relatively uniform pore structure. Among the five samples from the 620 working face, LJP620-3M, LJP620-6M, and LJP620-7M exhibit Type III isotherms, while LJP620-1M and LJP620-2M exhibit Type IV(a)+I isotherms with H2(a)-type hysteresis loops. Type III is dominant; therefore, this working face is classified overall as Type III, reflecting that most samples are dominated by macropores/fractures with poorly developed micropores.
Figure 3.
Nitrogen adsorption–desorption isotherms of coal samples from different working faces. (a) b4 working face; (b) 615 working face; (c) 620 working face.
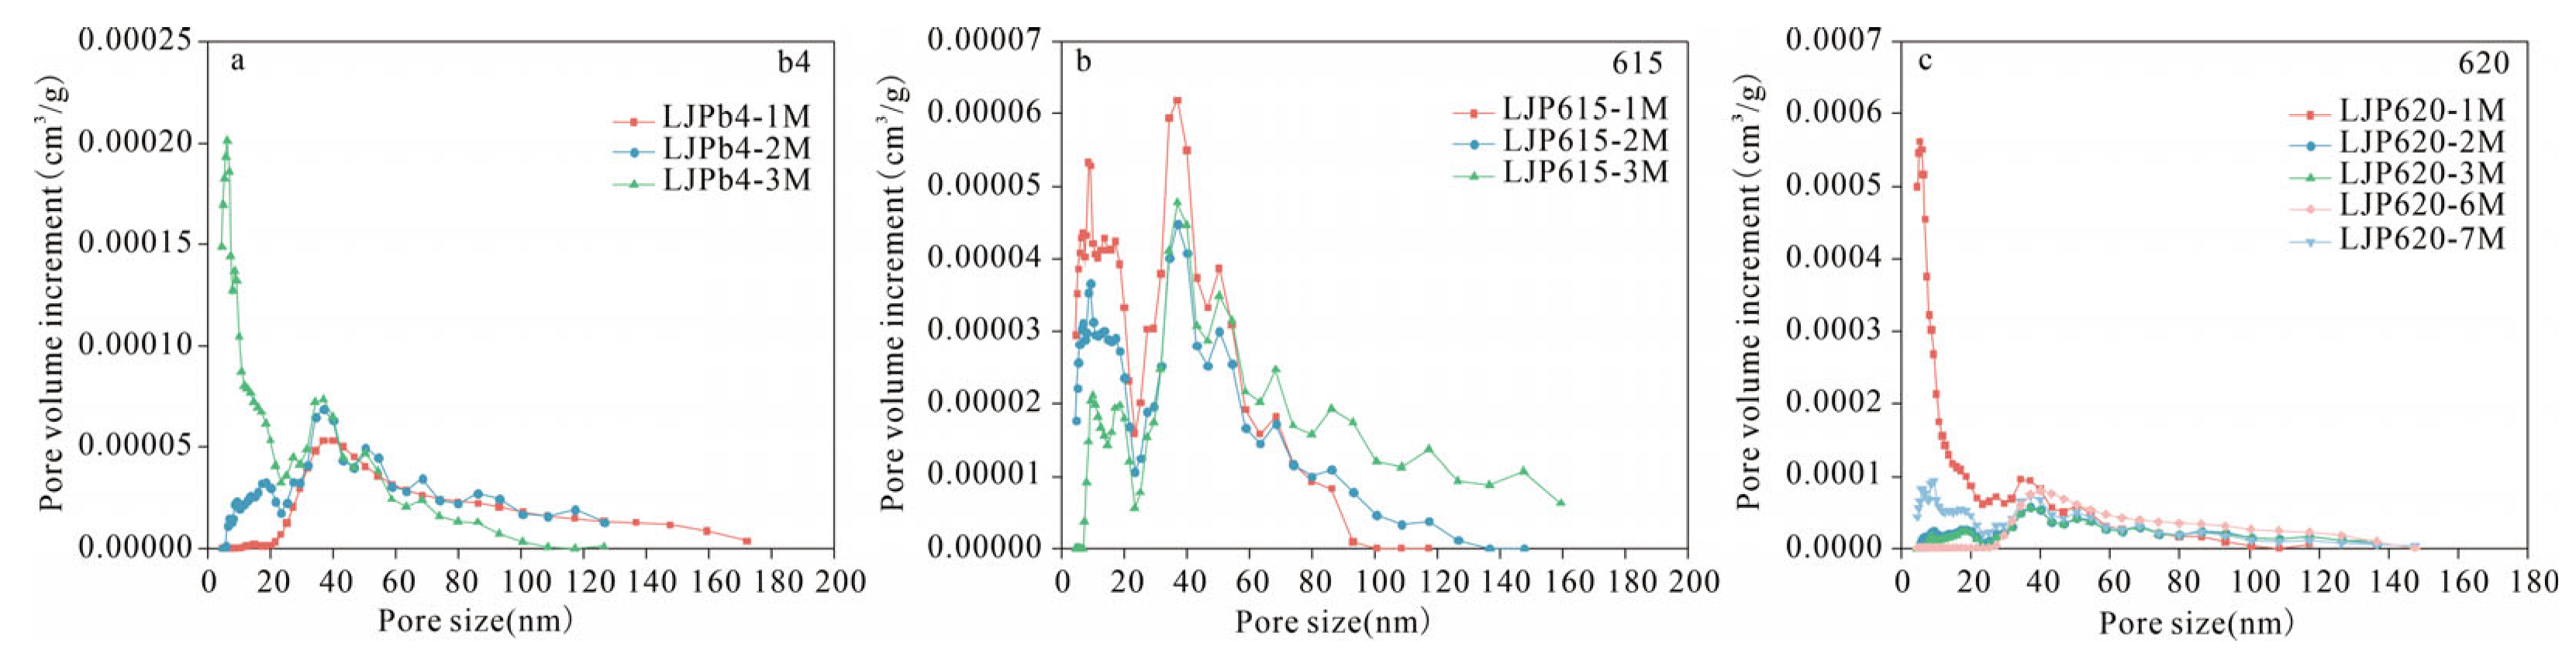
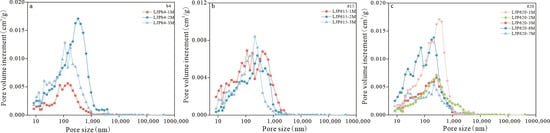
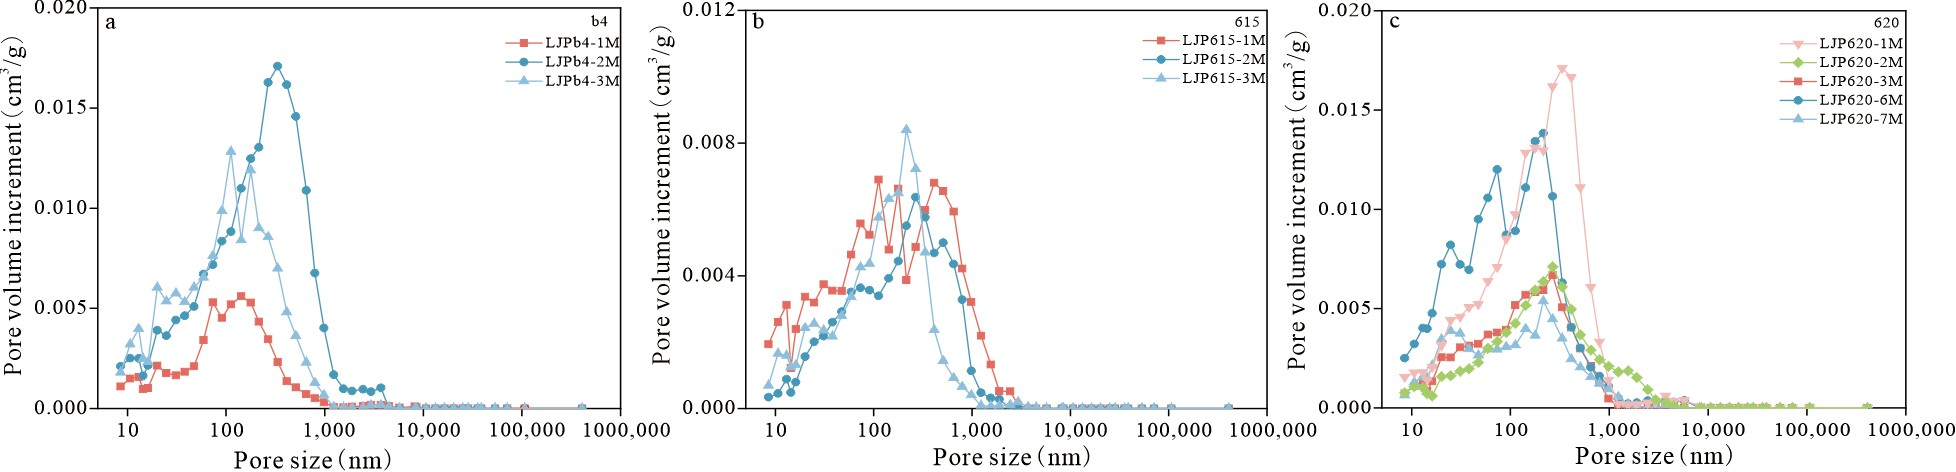
For the b4 transportation roadway face, the main pore development interval is concentrated at 0–60 nm, with a dominant peak below 10 nm and a secondary peak at approximately 20–60 nm. This is mainly contributed by the LJPb4-3M sample, which develops an H2(a)-type hysteresis loop, whereas the other two samples show very limited pore development. Therefore, the pore system of LJPb4-3M is interpreted as likely containing ink-bottle pores, although its pore-size distribution is relatively less concentrated (Figure 4a). The coal seam at the 615 working face is characterized by a highly concentrated distribution of small pores. Multiple sharp, high-intensity distribution peaks occur within the 0–80 nm range, with particularly pronounced peaks in the 20–40 nm range. Together with the H2(a)-type hysteresis loops observed in LJP615-1M and LJP615-2M, this indicates that the pore system of these samples is likely dominated by ink-bottle pores with relatively uniform pore structures, while the pore development of LJP615-3M is significantly weaker (Figure 4b). In contrast, the 620 working face is classified overall as Type III, because the majority of its samples exhibit Type III isotherms with very limited pore development. These samples show low adsorption at low relative pressure and negligible hysteresis, indicating weak adsorbate–adsorbent interactions and a pore system dominated by macropores or fractures rather than micropores. This inference is locally supported by the SEM image (Figure 2f), which shows stacked plate-like particles and slit-shaped or fracture-like voids, consistent with a fracture-dominated pore structure in these samples.
Figure 4.
Pore-size distribution characteristics of coal samples from different working faces based on nitrogen adsorption. (a) b4 working face; (b) 615 working face; (c) 620 working face.
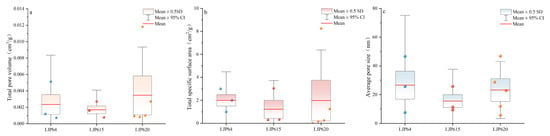
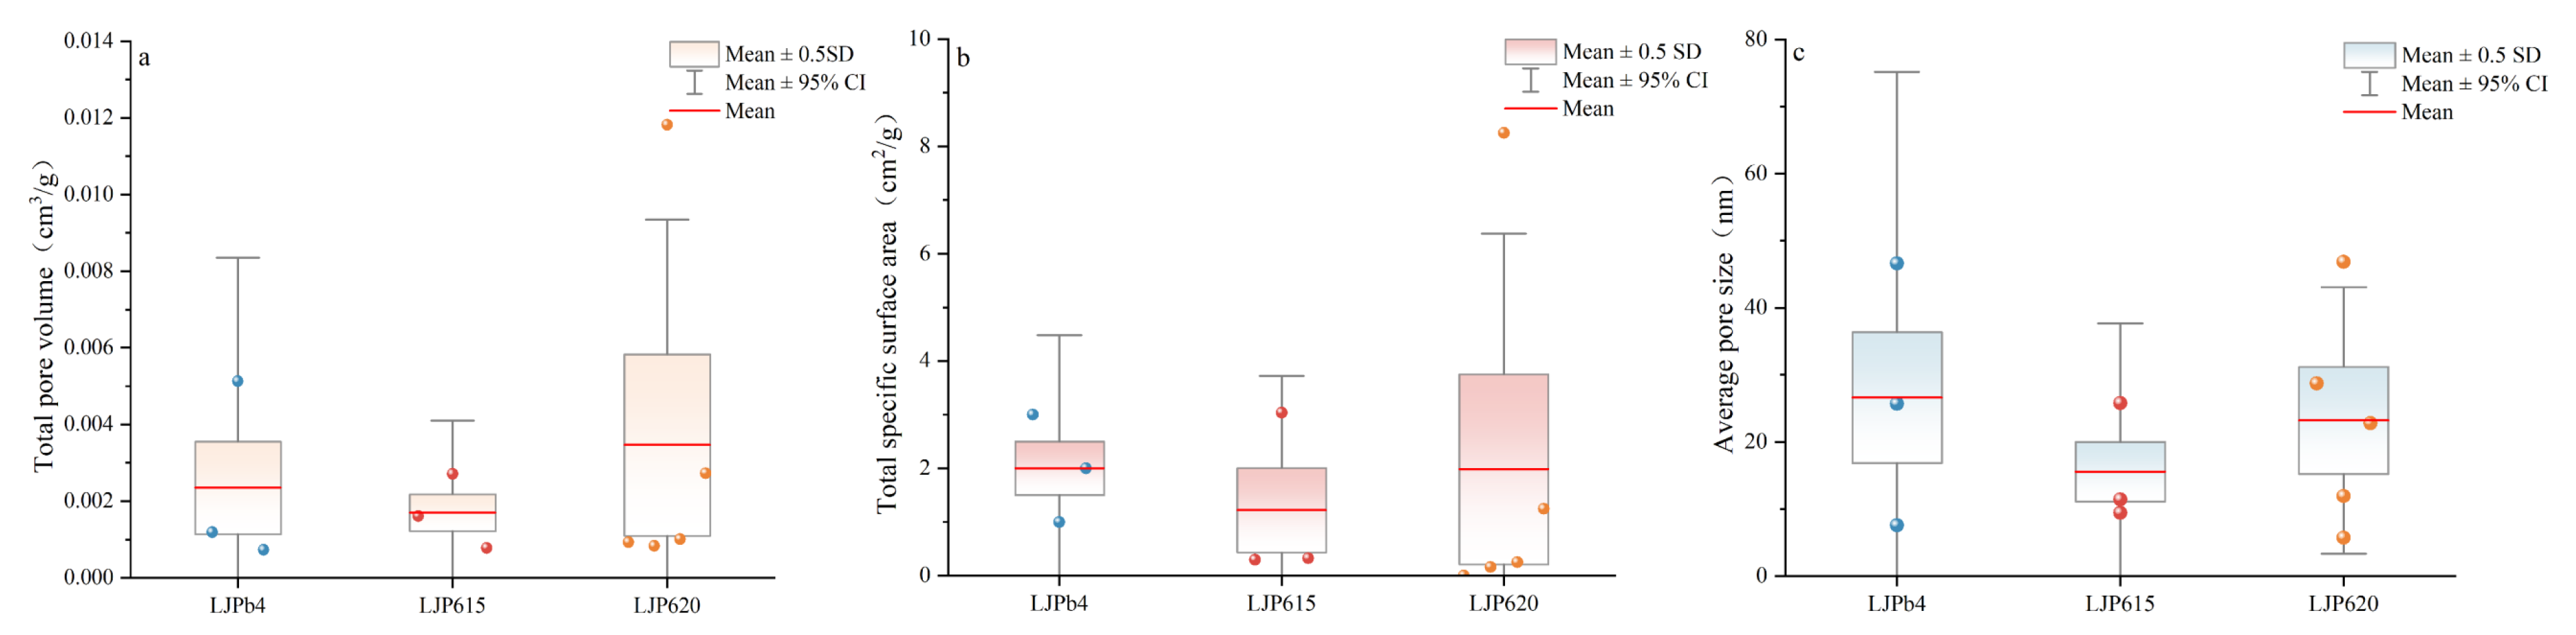
Quantitative comparison of the pore structure parameters obtained from nitrogen adsorption experiments reveals the differences in pore structure among coal seams from different working faces in the Longjiapu Mining Area (Table S2). The results show significant quantitative differentiation among the pore systems of the working faces within the nitrogen-accessible range. The b4 transportation roadway face coal seam has a relatively large average pore size, although its total pore volume and specific surface area are relatively low, indicating a moderate level of pore development within the nitrogen-accessible range (Figure 5a). The 615 working face exhibits the lowest total pore volume, total specific surface area, and average pore size, indicating the poorest pore development (Figure 5b). In contrast, the 620 working face exhibits the most favorable pore structure, with the highest total pore volume and total specific surface area, and a relatively large average pore size, indicating the most developed combination of micropores and transition pores within the measurable range (Figure 5c). It should be noted that because nitrogen adsorption has limited access to ultramicropores (<2 nm), the above evaluation is restricted to the measurable range, and further characterization of ultramicropores would require CO2 adsorption or other techniques.
Figure 5.
Pore characteristic parameters of coal samples from different working faces based on nitrogen adsorption. (a) total pore volume; (b) total specific surface area; (c) average pore size.
- (2)
- Pore Structure Characterization by High-Pressure Mercury Intrusion Porosimetry
The MIP results reveal that the pore structures of coal seams from different working faces in the Longjiapu Mining Area exhibit significant differences (Table S3). The b4 transportation roadway face coal seam has the lowest proportion of mesopores (49.35%), the highest proportion of transition pores (45.73%), and a relatively low proportion of macropores (1.47%), indicating a pore-size distribution skewed toward smaller pores and an overall relatively poor pore development. The 615 working face exhibits by the lowest proportion of macropores (1.10%), the highest proportion of mesopores (54.95%), and a transition-pore proportion of 41.20%; Its pore structure is dominated by mesopores and transition pores, showing a relatively concentrated distribution. The 620 working face has the highest proportion of macropores (1.79%), while the proportions of mesopores (50.43%) and transition pores (43.94%) are relatively well balanced, resulting in a more uniform pore-size distribution and the most favorable overall pore structure. Overall, the 615 and 620 working faces coal seams show relatively high combined macropore and mesopore proportions, whereas the b4 transportation roadway face coal seam shows a comparatively lower combined proportion (Figure 6).
Figure 6.
Pore-size distribution characteristics of coal samples from different working faces based on mercury intrusion porosimetry. (a) b4 working face; (b) 615 working face; (c) 620 working face.
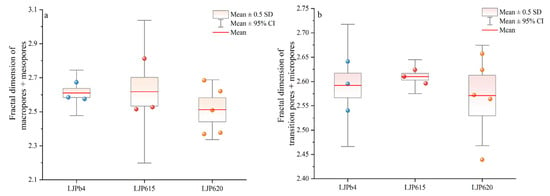
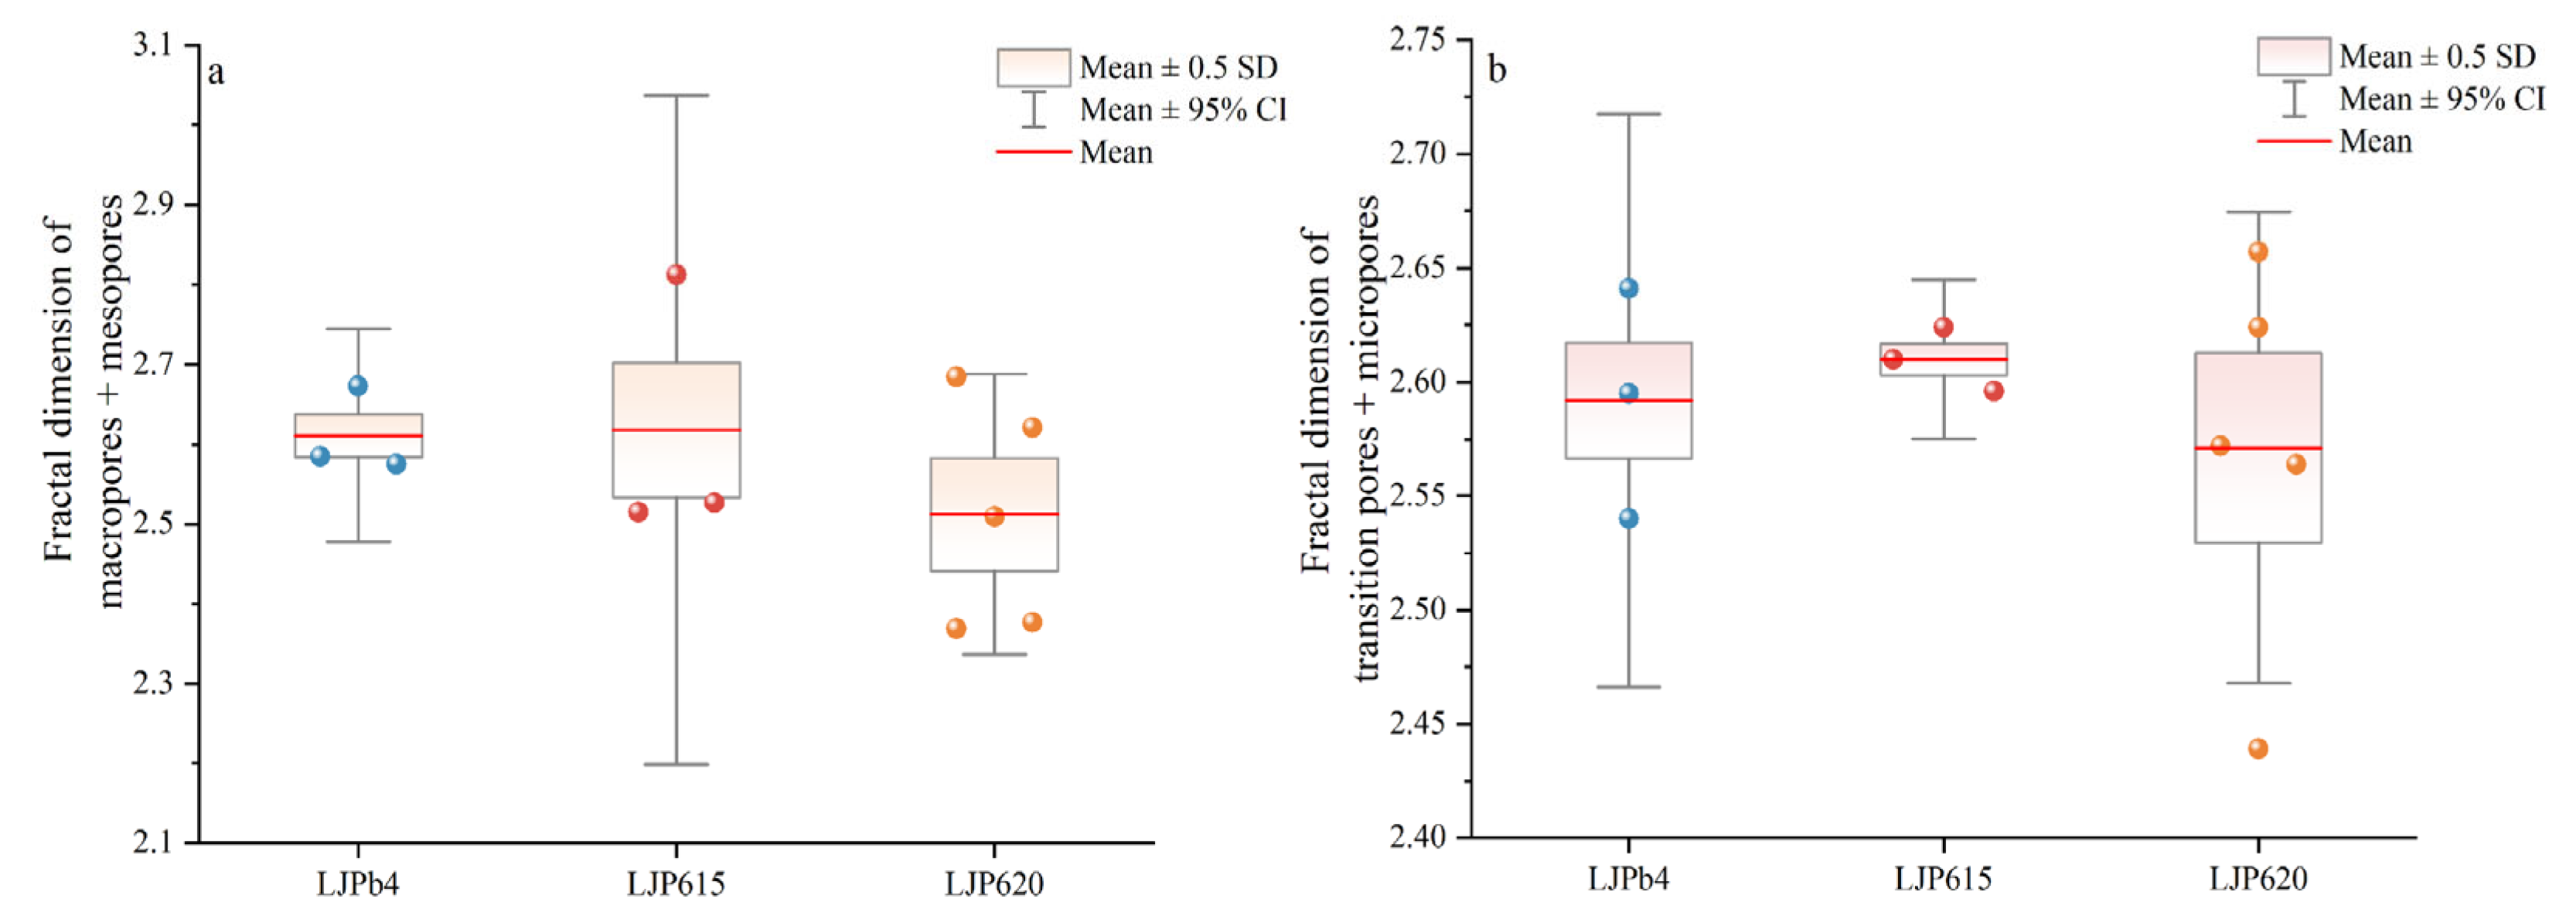
The Sierpinski model was applied to the MIP data to calculate the fractal dimensions [27]. The fractal dimensions of the macropore–mesopore and transition-pore–micropore ranges were determined for each working face coal seam (Table S4). The results show that the 620 working face has the lowest fractal dimensions in both pore-size ranges, indicating the best pore connectivity. In contrast, the fractal dimensions of the b4 transportation roadway face and 615 working faces are relatively similar, indicating comparatively poorer pore connectivity (Figure 7).
Figure 7.
Fractal dimension characteristics of coal samples from different working faces. (a) fractal dimension of macropores and mesopores; (b) fractal dimension of transition pores and micropores.
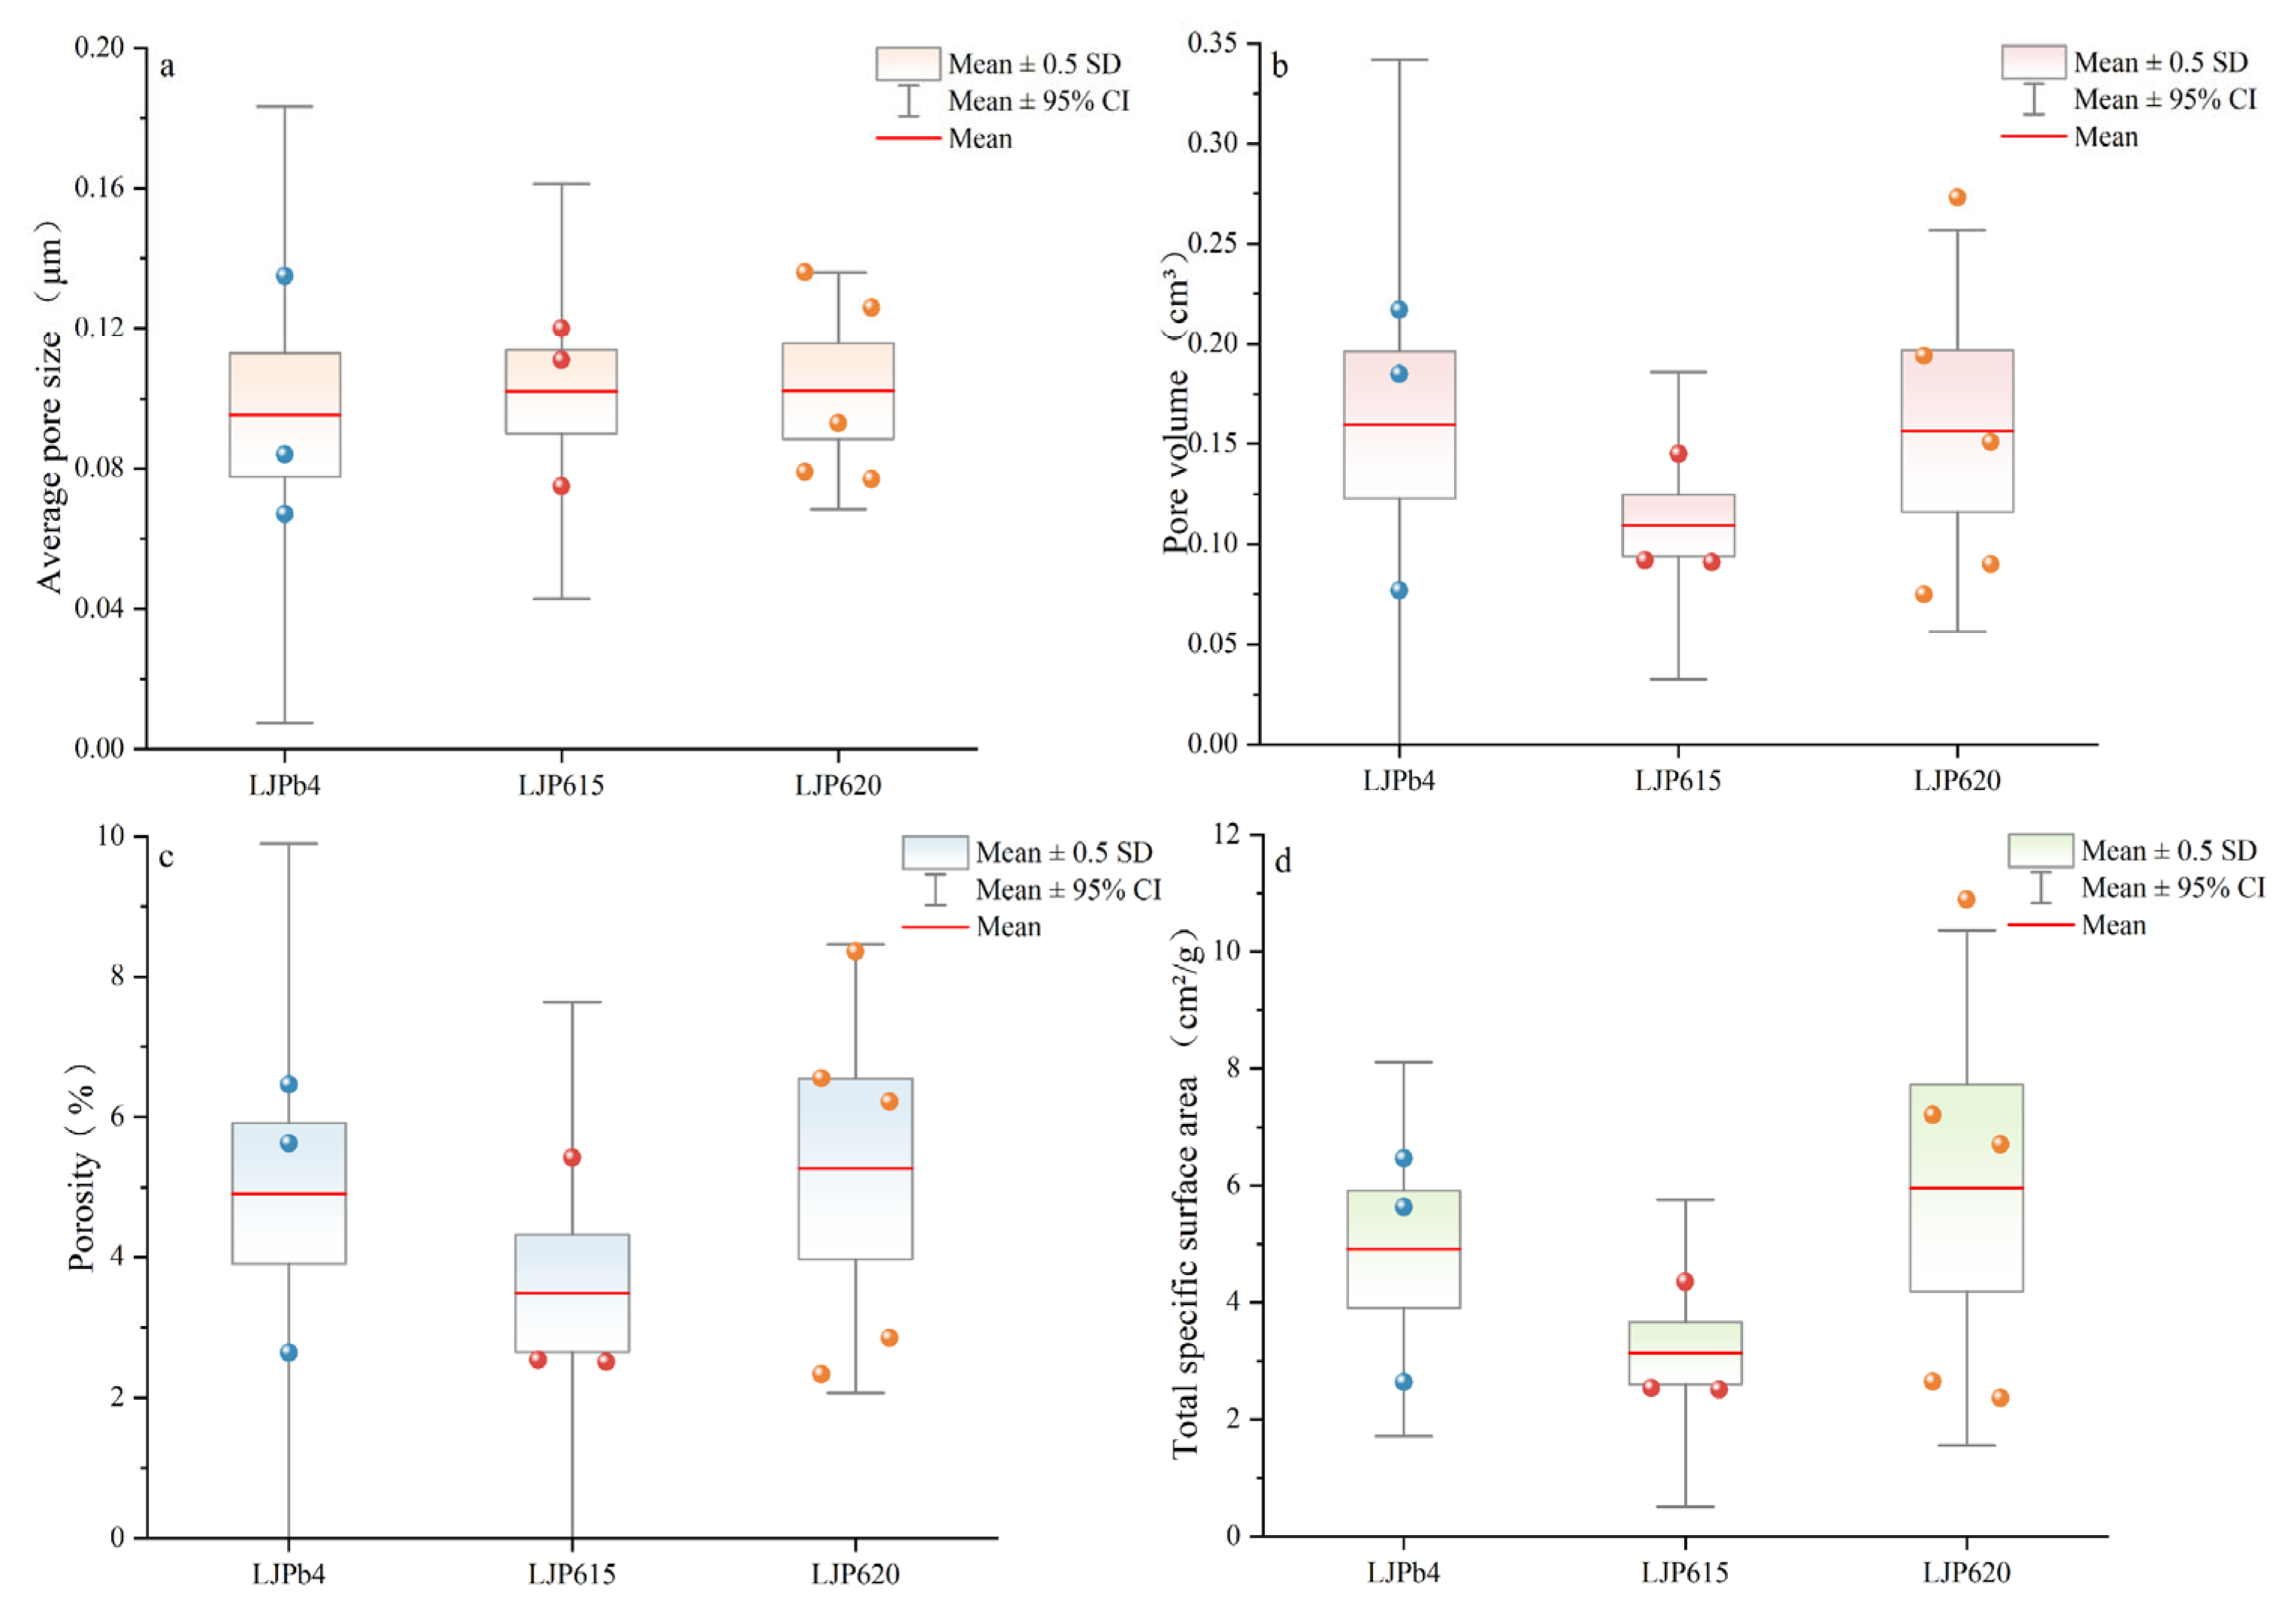
To further characterize the pore structure of the coal seams, key pore structure parameters were quantitatively analyzed to comprehensively evaluate the pore structure, as follows. The pore structure parameters of the b4 transportation roadway face coal seam are generally at moderate, indicating an intermediate overall pore structure potential. The 615 working face has the lowest pore volume, porosity, and total specific surface area, resulting in the poorest overall pore structure. In contrast, the 620 working face shows the most favorable pore structure characteristics, with its total pore volume, porosity, and total specific surface area all markedly higher than those of the other two working faces, indicating the most favorable overall pore structure (Figure 8). This is consistent with the fractal dimension analysis above, in which the lowest fractal dimension corresponds to the best pore connectivity.
Figure 8.
Pore characteristic parameters of coal samples from different working faces based on mercury intrusion porosimetry. (a) average pore size; (b) pore volume; (c) porosity; (d) total specific surface area.
4.3. Fracture Development Characteristics
4.3.1. Characteristics of Micron-Scale Fractures
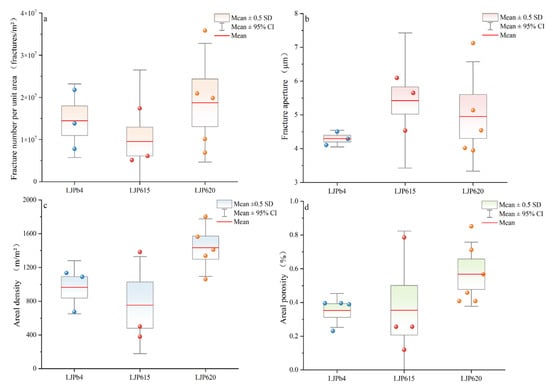
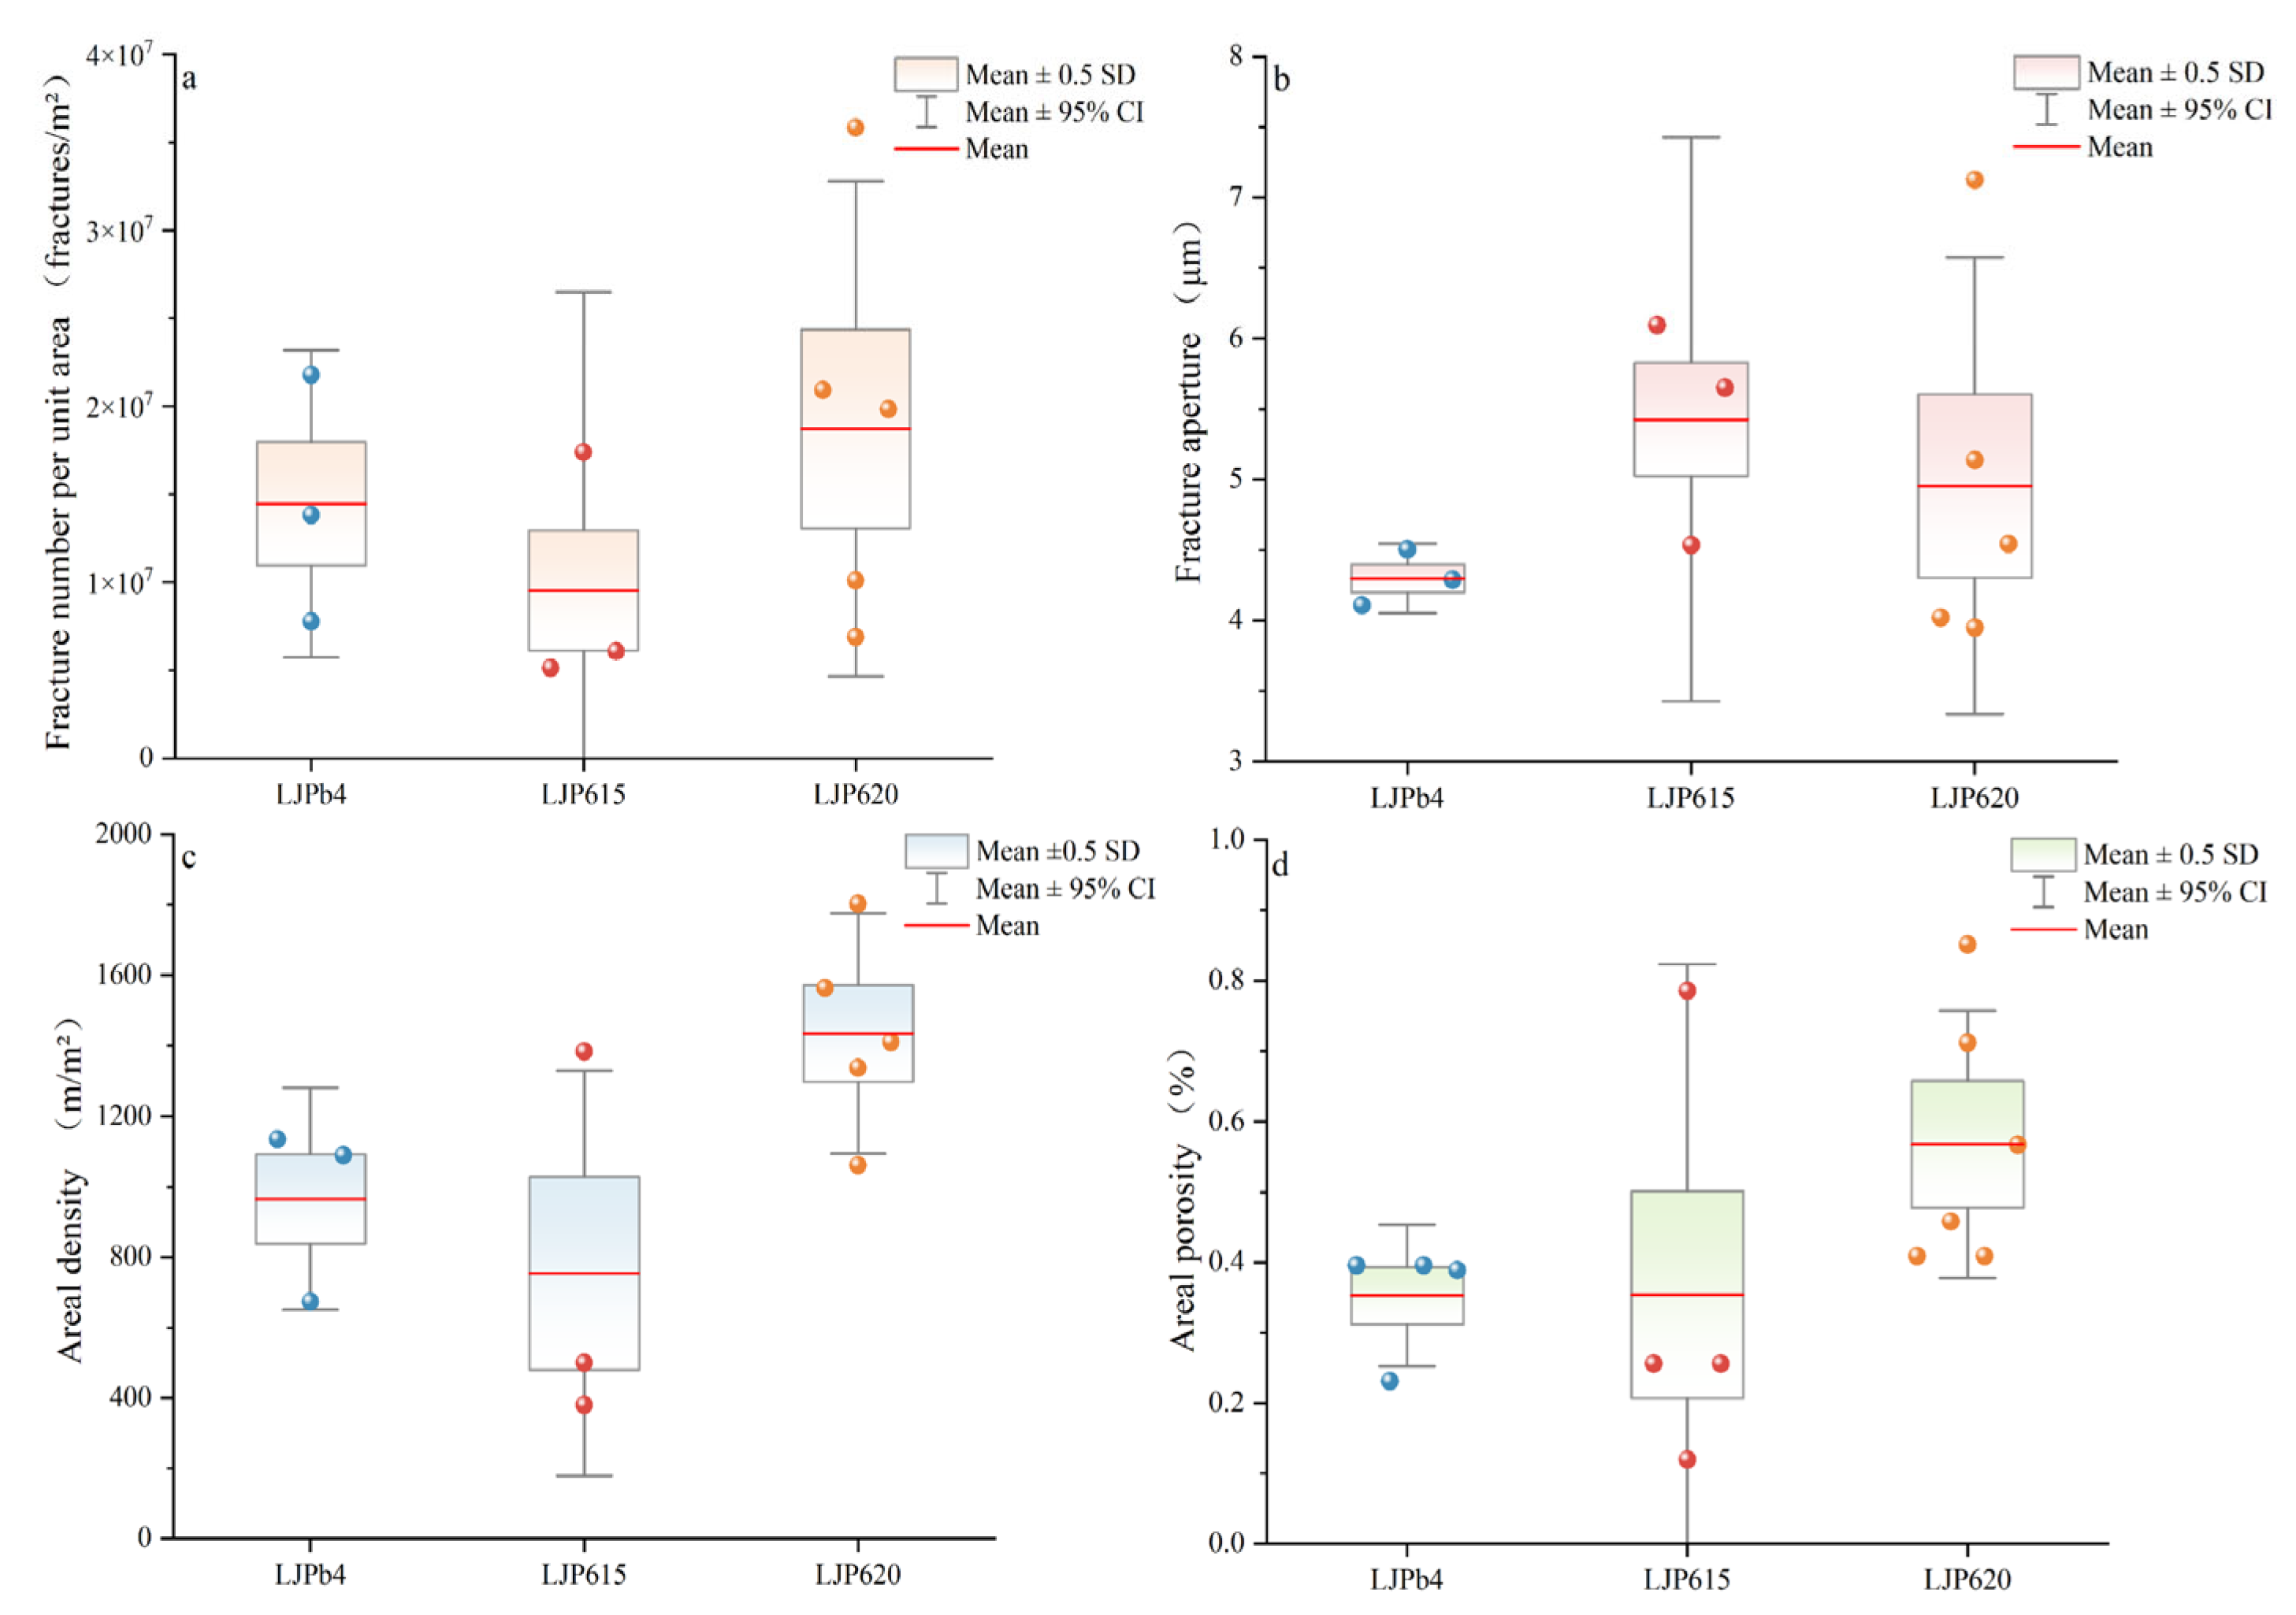
The fracture parameters used in this study are defined as follows: fracture number per unit area is the number of fractures per unit area (fractures/m2); fracture aperture is the average width of fractures (μm); areal density is the total length of fractures per unit area (m/m2); and areal porosity is the ratio of fracture area to the total observed area (%). These parameters reveal significant differences among the coal seams from different working faces in the Longjiapu Mining Area. The b4 transportation roadway face coal seam exhibits moderate fracture number per unit area and areal density, together with the smallest fracture aperture and the lowest areal porosity. The 615 working face has a moderate fracture number per unit area, the largest fracture aperture, and moderate areal density and areal porosity. In contrast, the 620 working face has the highest fracture number per unit area, a moderate fracture aperture, and the highest areal density and areal porosity (Figure 9).
Figure 9.
Micrometer-scale fracture development characteristics of coal and rock samples from different working faces. (a) fracture number per unit area; (b) fracture aperture; (c) areal density; (d) areal porosity.
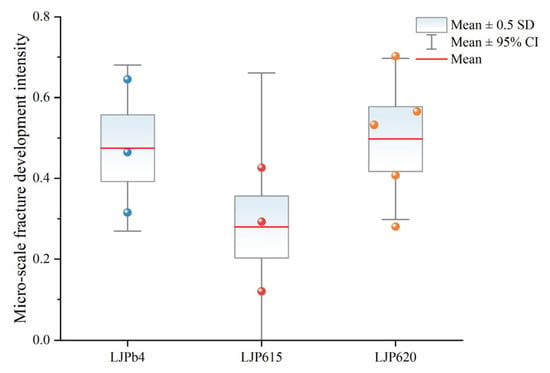
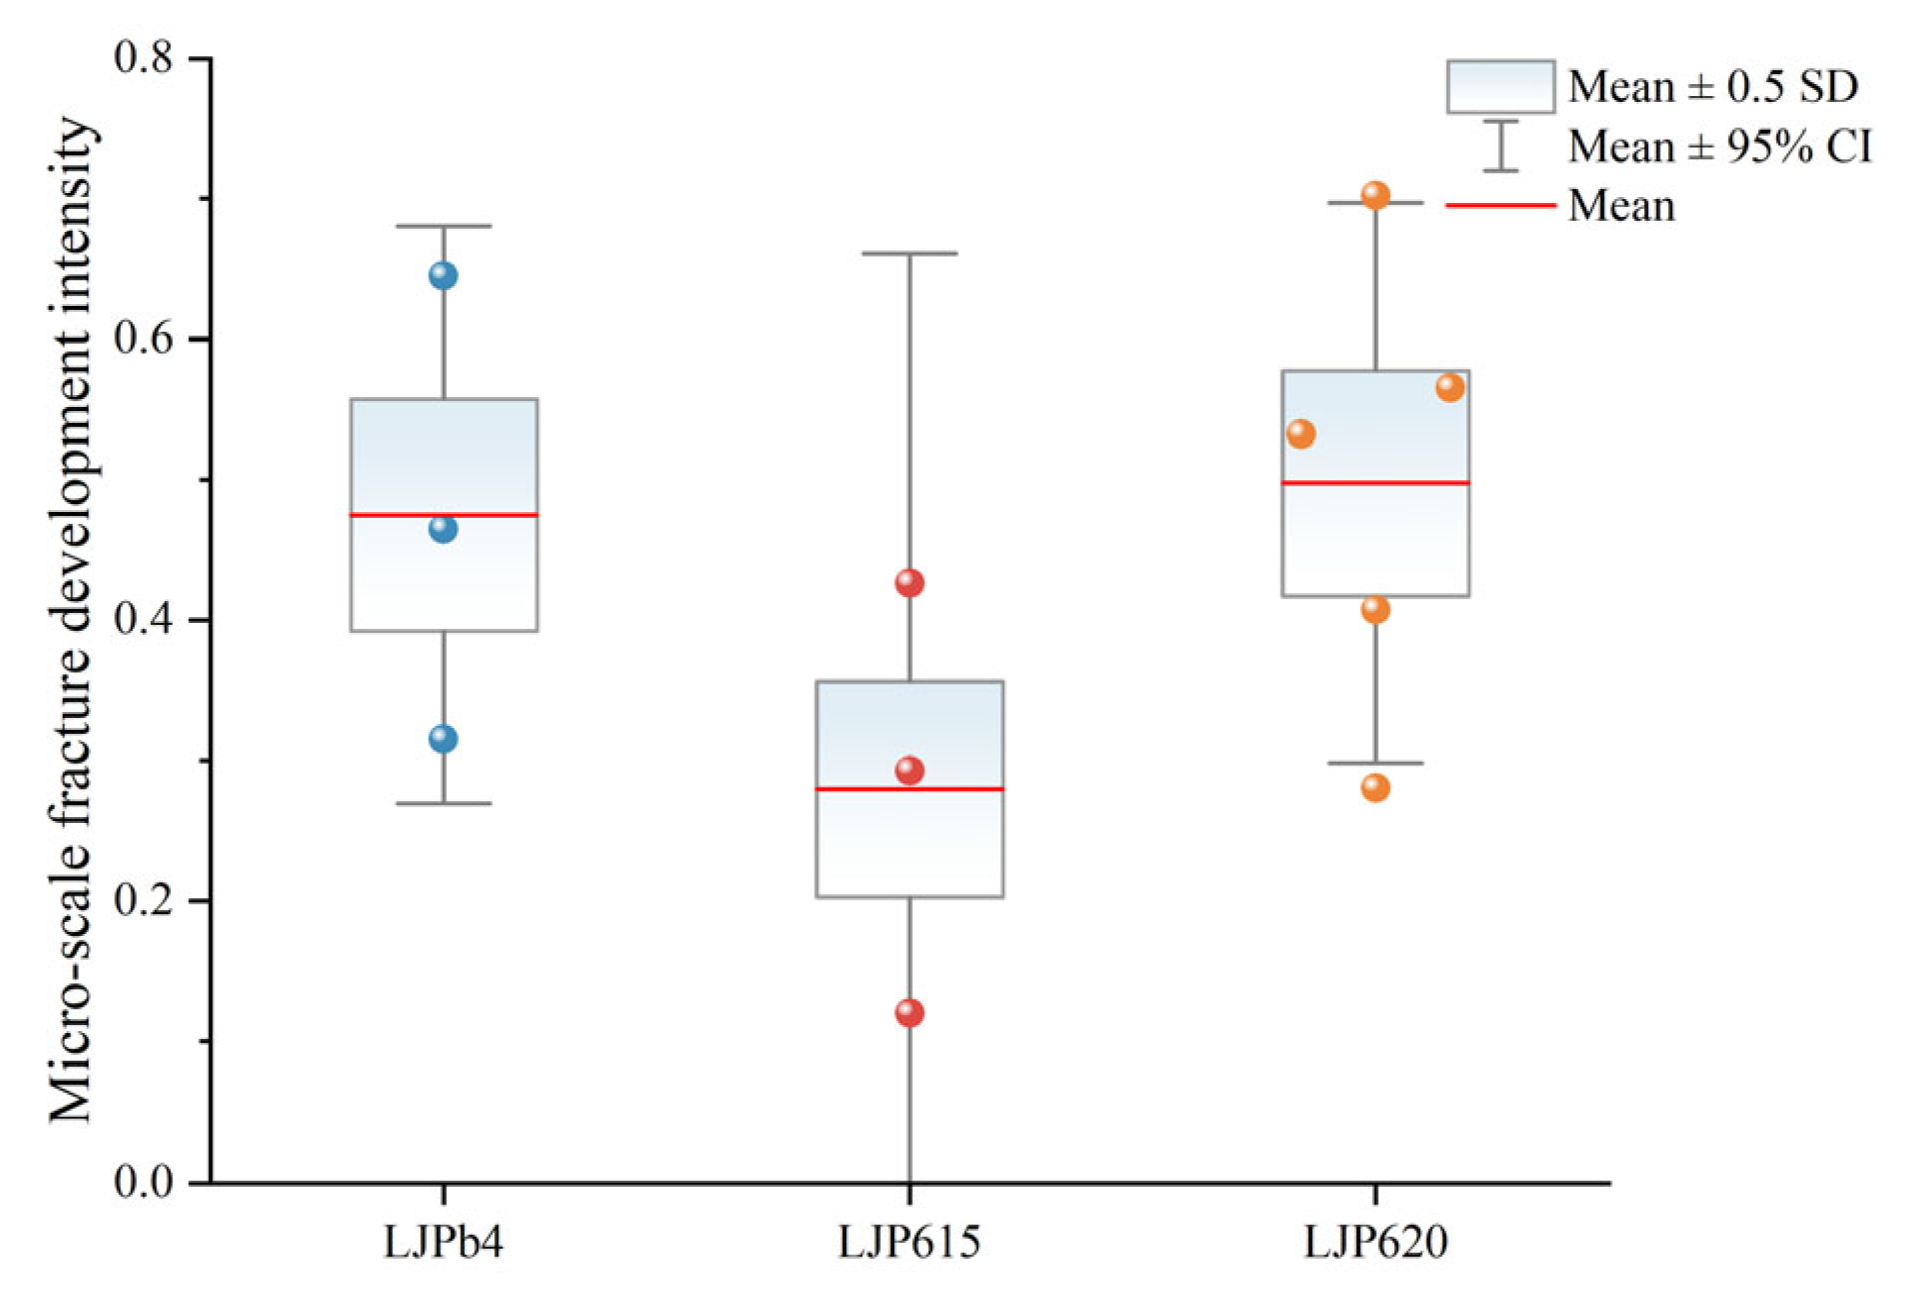
However, each individual parameter reflects only one aspect of fracture development and cannot fully represent the overall fracture development intensity. To comprehensively characterize fracture development intensity, the entropy weight method was employed to evaluate four indicators: fracture number per unit area, fracture aperture, areal density, and areal porosity. The calculation procedure follows the fracture development strength model established in our previous work [28]. The weights assigned were 0.15 for areal porosity, 0.17 for areal density, 0.39 for fracture number per unit area, and 0.29 for fracture aperture. The results indicate that the micron-scale fractures in the 620 working face exhibit the strongest development intensity, followed by those in the b4 transportation roadway face, whereas the 615 working face exhibits the weakest fracture development intensity (Figure 10; Table S5).
Figure 10.
Comparison of fracture development intensity among coal samples from different working faces.
4.3.2. Effects of Fracture Development on Pore Characteristics
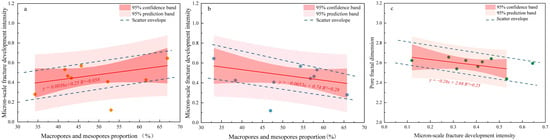
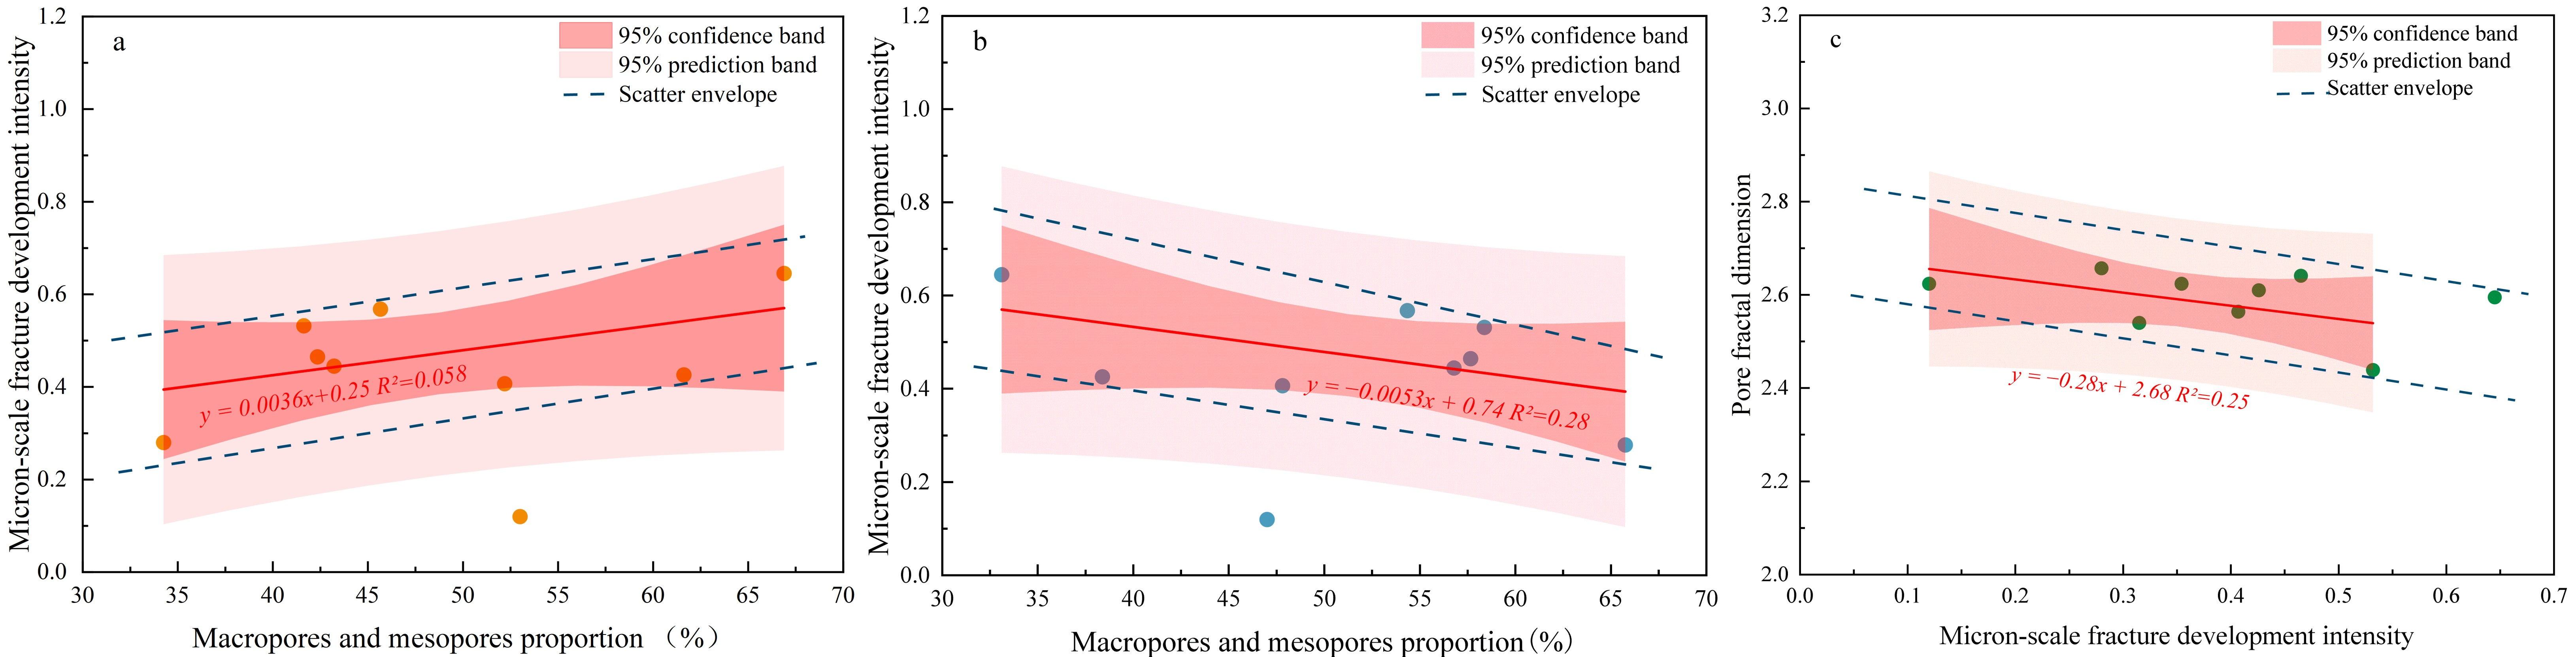
Correlation analysis indicates that fracture development intensity shows a relationship with pore-size distribution. Specifically, the development intensity of micron-scale fractures is weakly positively correlated with the combined proportion of macropores and mesopores, and weakly negatively correlated with the combined proportion of transition pores and micropores. It should be noted that these relationships were analyzed using an envelope approach (n = 9), and linear regression was performed as a supplementary check; the p-values are greater than 0.05, so the relationships are described as trends rather than statistically significant correlations. Overall, the widespread development of micron-scale fractures tends to increase macropore and mesopore contents (Figure 11a,b).
Figure 11.
Relationships between micron-scale fracture development intensity and (a,b) macropore–mesopore proportion, and (c) pore fractal dimension.
Quantitative analysis of the relationship between micron-scale fracture development intensity and pore fractal dimension reveals a significant negative correlation. The results show that as the development intensity of micron-scale fractures increases from 0.01 to 0.70, the pore fractal dimension decreases from 2.66 to 2.44 (Figure 11c). This trend suggests that fracture development may contribute to a more homogeneous pore structure and potentially improve pore connectivity. However, because fractal dimension and pore-size proportions are indirect indicators and do not directly measure effective connectivity, this interpretation is presented as a hypothesis rather than a proven conclusion. Previous studies have reported that improved pore connectivity is often accompanied by a reduction in fractal dimensions; for example, Chen et al. (2026) showed that after shock-wave and acidification treatments of coal, pore connectivity was enhanced while fractal dimensions decreased [29]. Based on this supporting evidence, the negative correlation between fracture development intensity and fractal dimension observed in this study may indicate improved pore connectivity, but permeability or other transport-based measurements would be required to confirm this hypothesis. Such measurements were not performed in this study.
4.4. Main Controlling Factors of Adsorption–Desorption Characteristics
4.4.1. Adsorption Characteristics and Their Main Controlling Factors
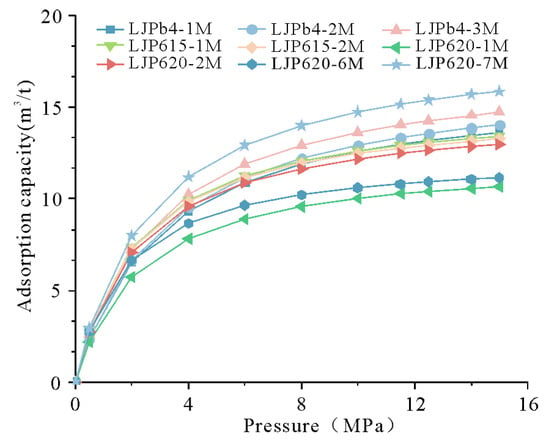
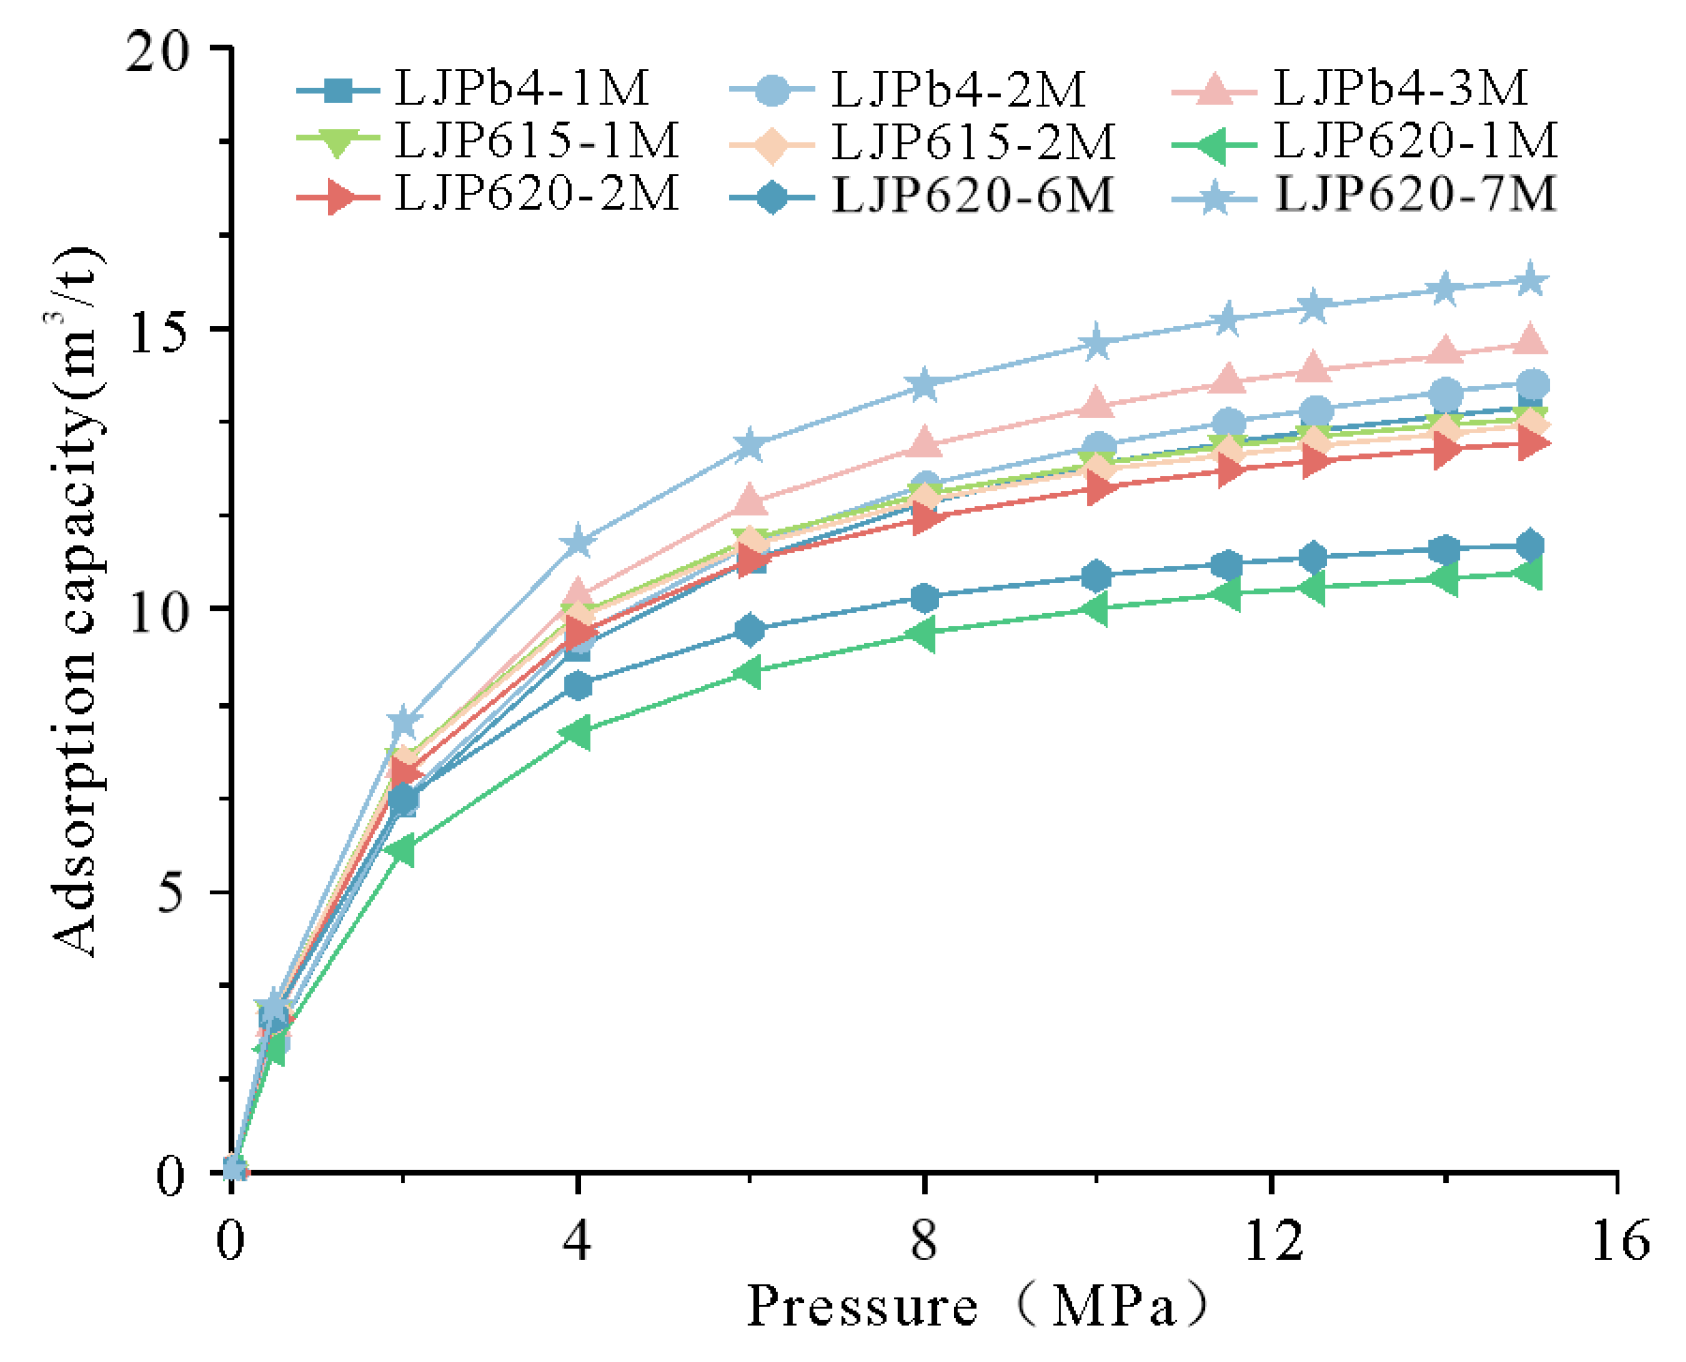
During the initial pressurization stage (0–4 MPa), all coal samples showed a rapid increase in gas adsorption, with the adsorption capacities of the 615 working face and b4 transportation roadway face remaining moderate. During the 4–11 MPa stage, the adsorption rates of all samples generally decreased, while the adsorption increments of these two coal seams were relatively limited. As the pressure increased to 11–15 MPa, the adsorption processes of all samples gradually approached saturation. Notably, sample LJP620-7M from the 620 working face exhibited the highest adsorption capacity, reaching 15.86 m3/t (the measured adsorption capacity at the highest experimental pressure), markedly exceeding that of the other samples (Figure 12).
Figure 12.
Isothermal adsorption curves of coal samples from different working faces.
The Langmuir volume (VL), a key parameter that represents the maximum adsorption capacity, was derived to evaluate the adsorption performance of the coal seam. The results show that the mean VL of the principal coal seam is 15.47 m3/t, indicating a moderate adsorption capacity. The b4 transportation roadway face coal seam has the highest mean VL (16.94 m3/t), followed by the 620 working face (15.91 m3/t), whereas the 615 working face has the lowest mean VL (12.40 m3/t) (Table 2). Accordingly, the 620 working face and b4 transportation roadway face coal seams exhibit stronger methane adsorption capacity than the 615 working face.
Table 2.
Langmuir parameters of coal samples from different working faces.
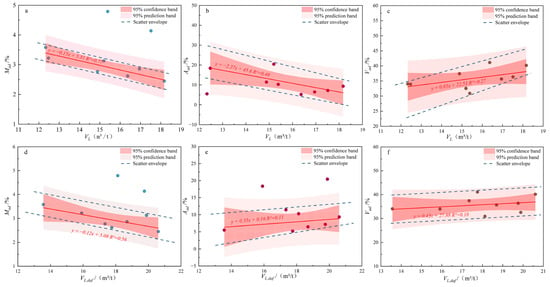
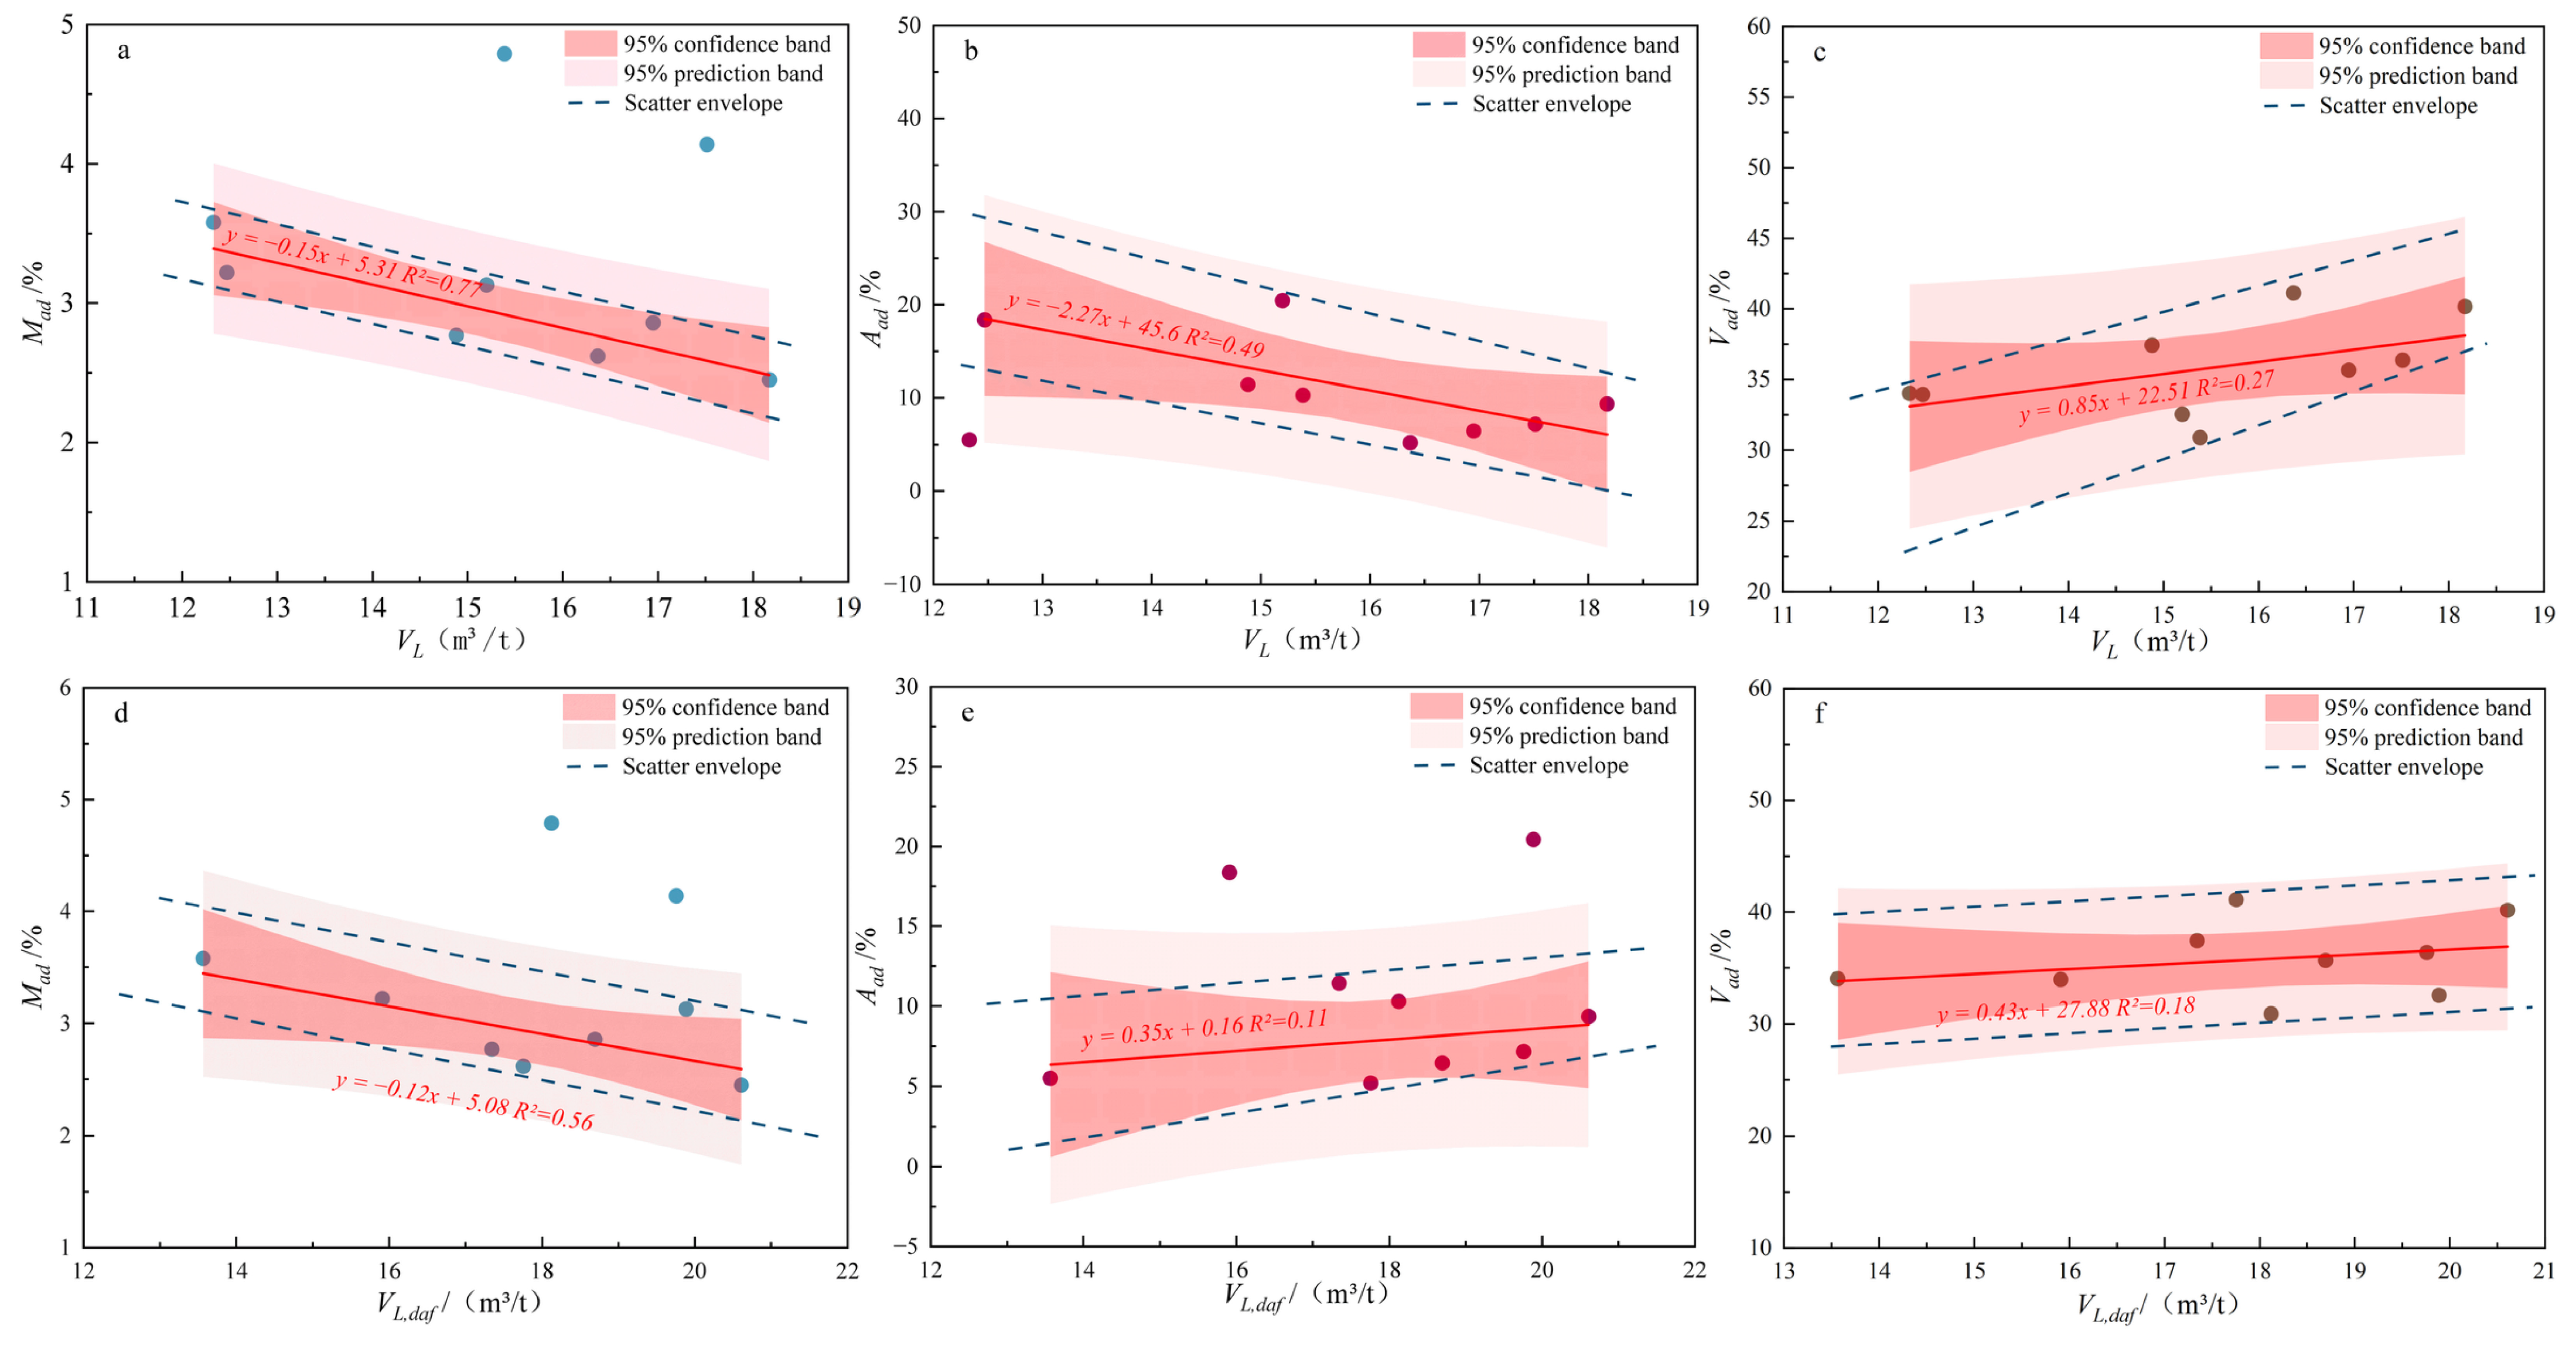
It should be noted that fixed carbon is calculated by difference and is therefore perfectly collinear with the other three proximate variables. To avoid misleading bivariate correlations, fixed carbon was excluded as an independent variable, and partial correlation analysis was applied to assess the independent effects of moisture, ash, and volatile matter on VL. In addition, VL was normalized to a dry ash-free basis as VL,daf = VL × 100/(100 − Mad − Aad) to separate mineral dilution from intrinsic adsorption behavior.
VL is negatively correlated with moisture content (Figure 13a) [30], attributable to competitive adsorption between water and methane. Water molecules are strongly polar, whereas methane molecules are nonpolar. The coal matrix surface, particularly regions rich in oxygen-containing functional groups, exhibits a stronger affinity for polar water molecules than for nonpolar methane molecules. Consequently, water preferentially occupies pore surfaces and effective adsorption sites, thereby competitively inhibiting methane adsorption through a site-occupation effect. As a result, VL decreases with increasing moisture content. After normalization, VL,daf remains negatively correlated with moisture, indicating that the inhibition of methane adsorption by moisture mainly originates from competitive adsorption rather than mineral dilution or mass-basis effects (Figure 13c).
Figure 13.
Fitting results between Langmuir volume and proximate analysis parameters. (a) VL vs. Mad; (b) VL vs. Aad; (c) VL vs. Vad; (d) VL,daf vs. Mad; (e) VL,daf vs. Aad; (f) VL,daf vs. Vad.
For ash, VL is negatively correlated with Aad (Figure 13b), because ash-forming minerals have weak methane adsorption capacity and their associated pores are mostly large, reducing the proportion of organic matter per unit mass. After normalization, VL,daf shows a weakly positive correlation with ash (Figure 13e), indicating that the original negative correlation was mainly due to mineral dilution rather than an intrinsic decrease in the adsorption capacity of the organic matter.
VL is positively correlated with volatile matter (Figure 13c), because volatile matter is an important organic component of coal and its content is closely related to micropore development and the abundance of adsorption sites. During coalification, the release of volatile matter is accompanied by the formation and development of abundant micropores, which provide a large specific surface area and serve as the primary adsorption sites for methane molecules. Therefore, a higher Vad generally corresponds to greater methane adsorption potential and thus a higher VL. After normalization to a dry ash-free basis, VL,daf also shows a positive correlation with Vad, indicating that the intrinsic adsorption capacity of the organic matter increases with volatile matter content, independent of mineral dilution (Figure 13f).
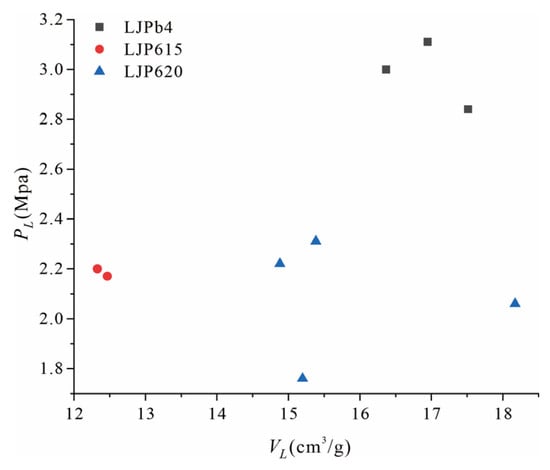
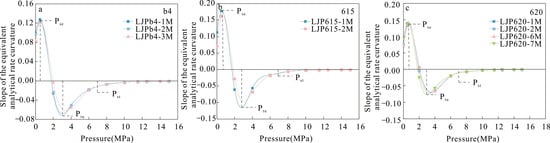
The relationship between VL and PL is shown in Figure 14. For all three working faces, VL and PL are negatively correlated, indicating a trade-off between adsorption capacity and adsorption affinity: a higher VL corresponds to a lower PL, meaning that a larger pressure drawdown is required to initiate desorption. This is consistent with the micropore-controlled adsorption mechanism, in which more developed micropores provide greater adsorption capacity but also stronger adsorption affinity. For CBM production, this trade-off implies that high-VL intervals may not necessarily be the most favorable production targets unless they are accompanied by well-developed fractures that can provide effective flow pathways and pressure-drawdown transmission. The 620 working face is a typical example: despite its relatively low PL, its well-developed fracture network compensates for the higher pressure drawdown required for desorption, resulting in the best desorption performance among the three working faces.
Figure 14.
Variation in Langmuir pressure with Langmuir volume for coal samples from different working faces.
4.4.2. Desorption Characteristics and Their Main Controlling Factors
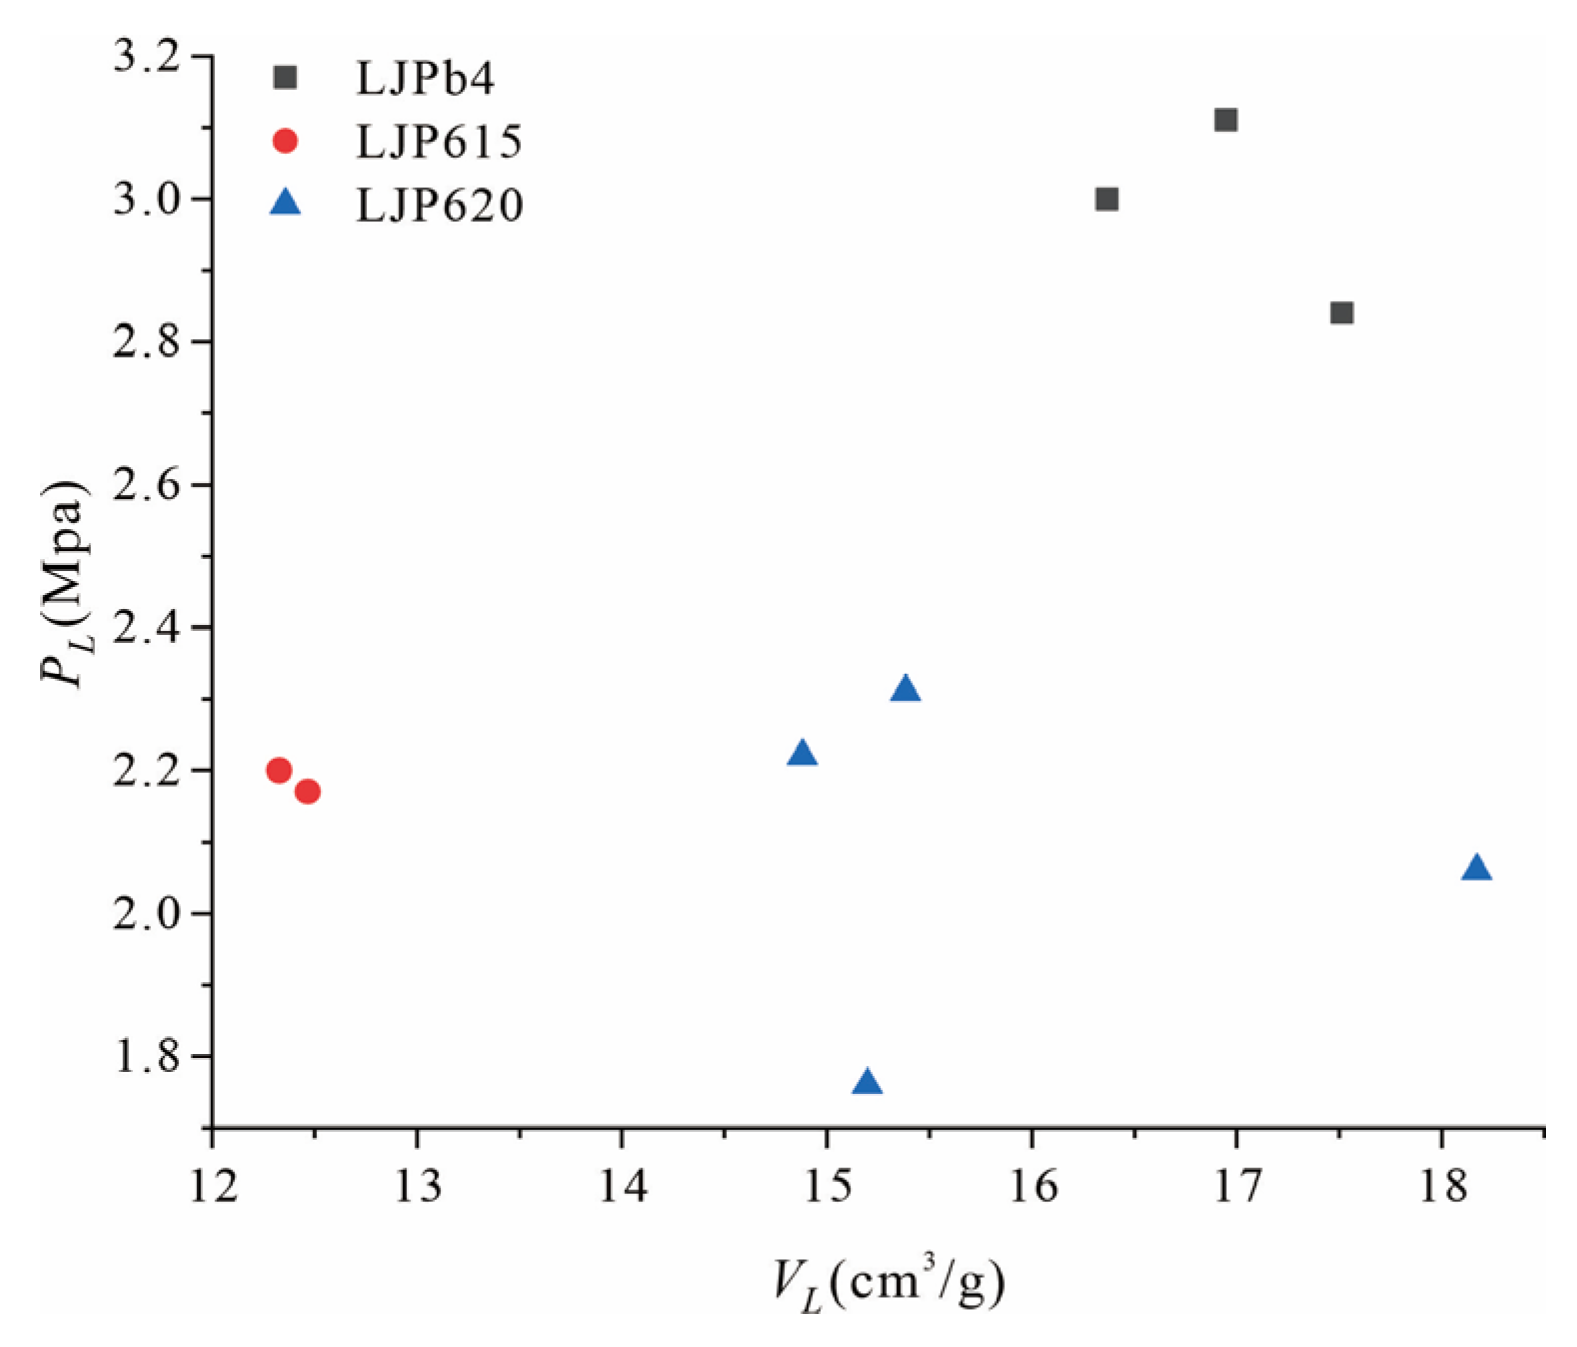
According to Meng et al. (2014), the desorption efficiency is defined as the amount of methane desorbed per unit mass of coal per unit pressure drop [10]. The starting pressure, transition pressure, and sensitive pressure are model-inferred pressure thresholds on the Langmuir desorption curve at which the desorption efficiency reaches fixed values of 0.55, 1.00, and 2.59 m3/(t·MPa), respectively. They are not measured critical desorption pressures. Because desorption efficiency increases monotonically as pressure decreases, a higher characteristic pressure means that the corresponding efficiency threshold is reached at a higher pressure. If the original reservoir pressures are identical or similar, higher characteristic pressures imply a higher theoretical desorption efficiency at the original reservoir pressure and a relatively earlier entry into the corresponding desorption stage in the pressure-domain sense. However, the original reservoir pressures of the three working faces were not measured in this study, and no time-dependent gas production measurements were performed. Therefore, these characteristic pressures cannot be used to calculate the actual pressure drawdown required for desorption or to demonstrate earlier gas production. The comparisons below are relative and model-inferred, and their field significance requires verification using reservoir pressure, gas content, permeability, in situ stress, and time-dependent production data.
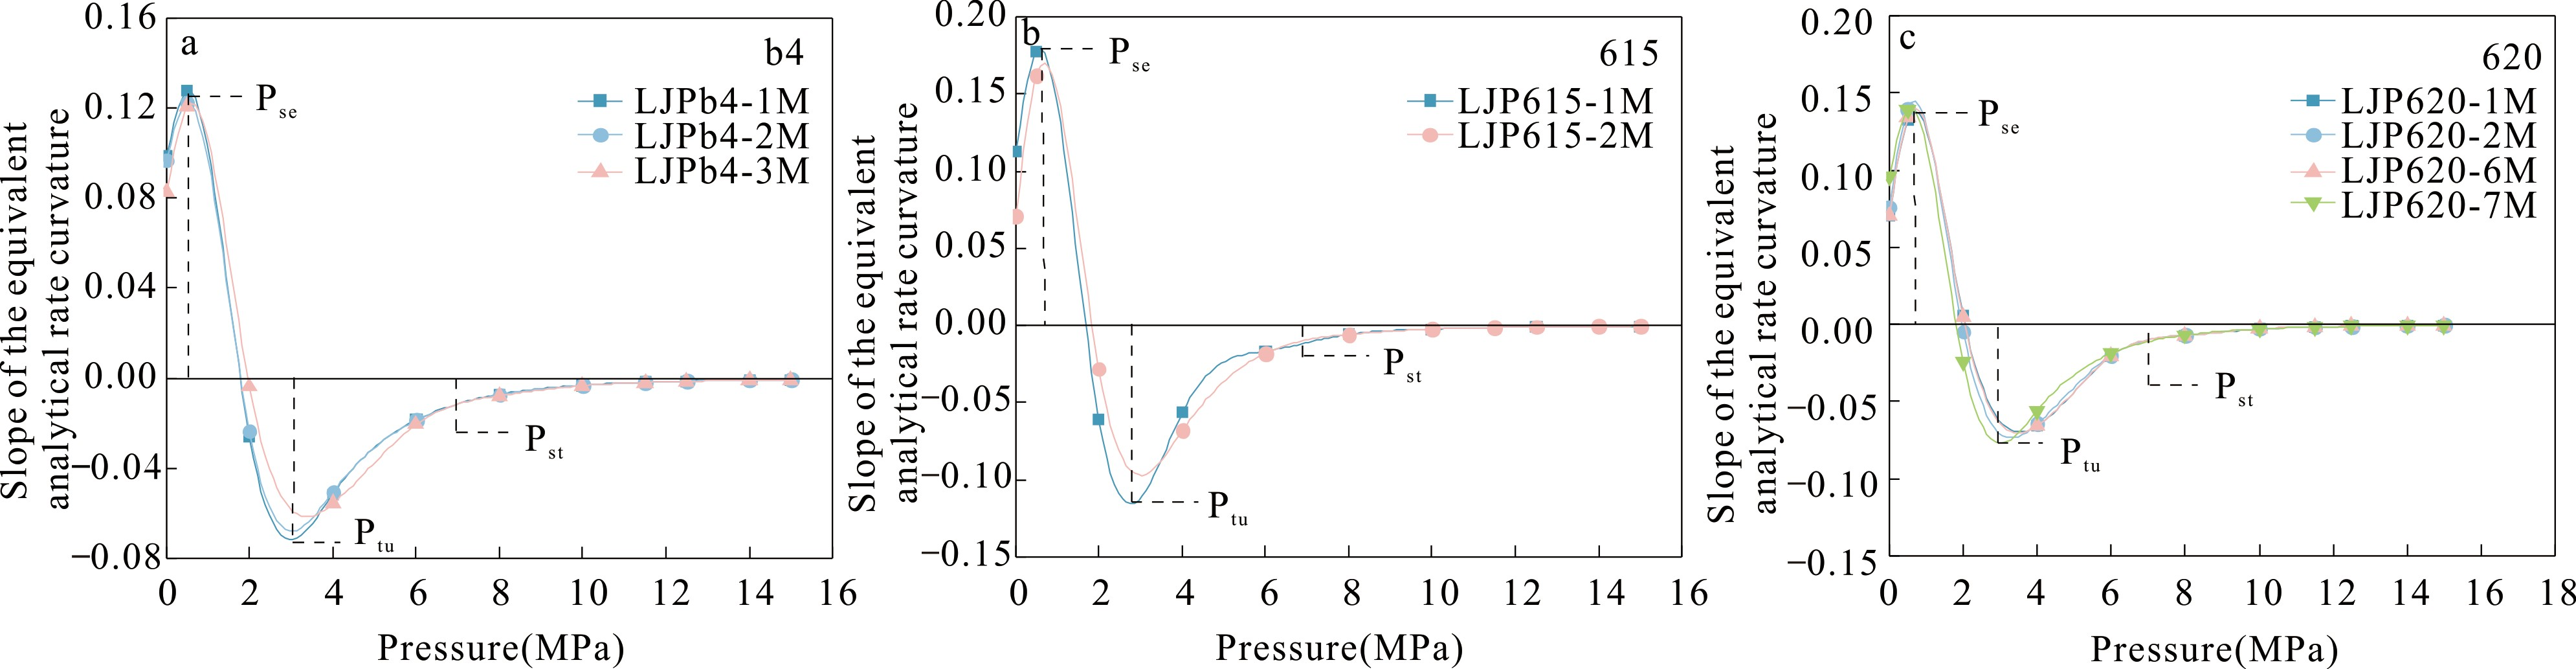
The test results show that the b4 transportation roadway face has the highest starting pressure (mean: 8.69 MPa, standard deviation: 0.156, standard error: 0.090, 95% confidence interval: 8.30–9.08 MPa), followed by the 620 working face (mean: 7.36 MPa, standard deviation: 0.535, standard error: 0.268, 95% confidence interval: 6.51–8.21 MPa), whereas the 615 working face has the lowest starting pressure (mean: 6.37 MPa, standard deviation: 0.007, standard error: 0.005, 95% confidence interval: 6.31–6.43 MPa). It should be noted that Pst here is a characteristic pressure derived from the curvature slope of the equivalent desorption rate curve, rather than the critical desorption pressure measured by canister desorption tests. A higher Pst indicates that a relatively small pressure drawdown is required to initiate desorption, which favors early gas production. For transition pressure, the b4 transportation roadway face has the highest value (mean: 4.12 MPa, standard deviation: 0.103, standard error: 0.059, 95% confidence interval: 3.87–4.37 MPa), followed by the 620 working face (mean: 3.66 MPa, standard deviation: 0.285, standard error: 0.143, 95% confidence interval: 3.21–4.12 MPa), while the 615 working face has the lowest value (mean: 3.02 MPa, standard deviation: 0.014, standard error: 0.010, 95% confidence interval: 2.89–3.15 MPa). Regarding sensitive pressure, the 620 working face has the highest value (mean: 1.49 MPa, standard deviation: 0.174, standard error: 0.087, 95% confidence interval: 1.21–1.77 MPa), followed by the b4 transportation roadway face (mean: 1.44 MPa, standard deviation: 0.098, standard error: 0.057, 95% confidence interval: 1.20–1.69 MPa), whereas the 615 working face has the lowest value (mean: 1.05 MPa, standard deviation: 0.014, standard error: 0.010, 95% confidence interval: 0.92–1.18 MPa). Overall, the 615 working face has the lowest starting and transition pressures, indicating that a larger pressure drawdown is required to initiate desorption and enter the rapid desorption stage. In contrast, the 620 and b4 working faces have higher characteristic pressures, among which the 620 working face has the highest sensitive pressure, indicating the most favorable desorption performance. Thus, the desorption conditions of the 620 and b4 working faces are generally better than those of the 615 working face (Figure 15).
Figure 15.
Curvature slopes of the equivalent desorption rate and model-inferred characteristic pressure points (Pst, Ptu, Pse) for coal samples from different working faces. (a) b4 working face; (b) 615 working face; (c) 620 working face.
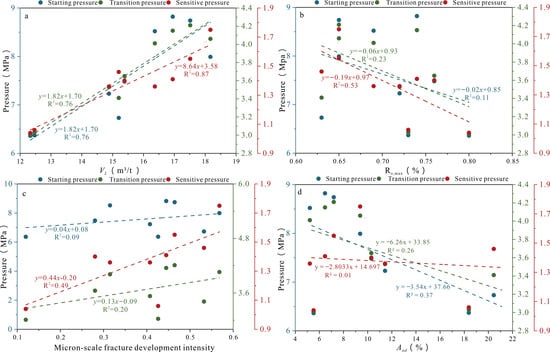
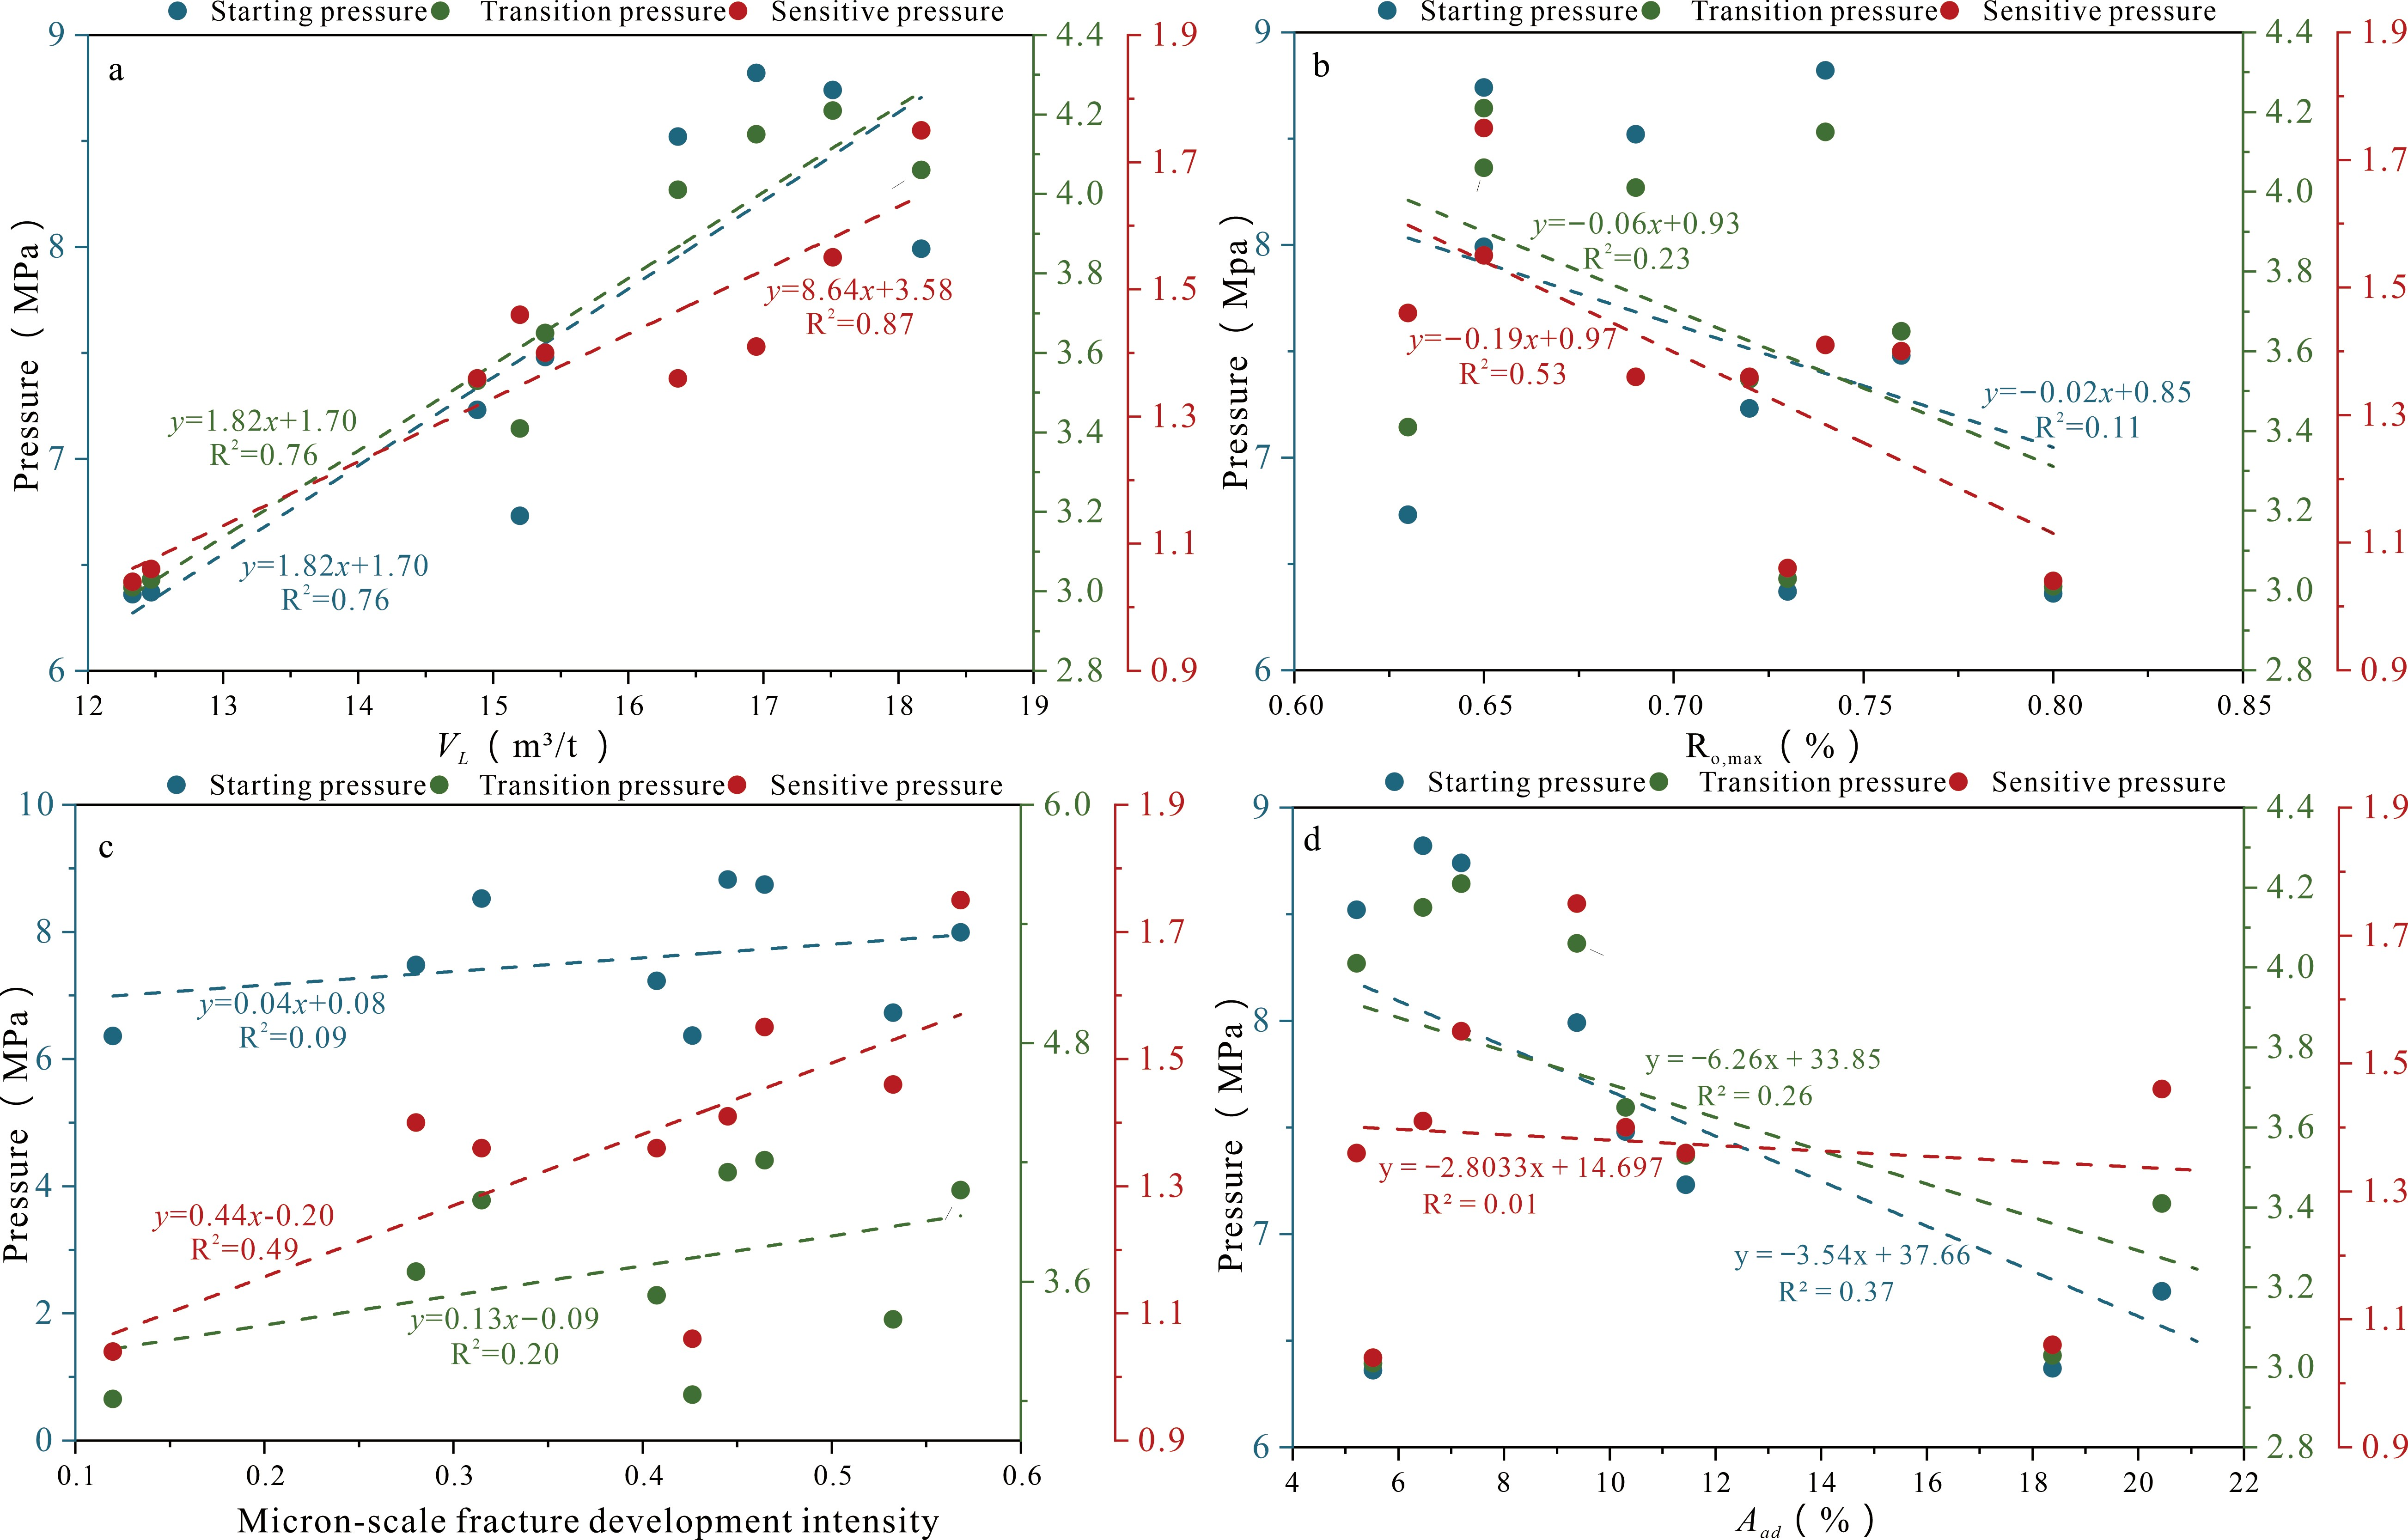
Based on the relationships between each factor and the three characteristic pressures shown in Figure 16, the controlling factors of desorption characteristic pressures in low-rank coal reservoirs and their production implications can be analyzed as follows. It should be clarified that in the theory of CBM desorption stage division, the starting pressure (Pst), transition pressure (Ptu), and sensitive pressure (Pse) are all considered to be “the higher, the better”: a higher Pst indicates earlier initiation of desorption; a higher Ptu indicates that the stage of markedly increased desorption rate arrives earlier; and a higher Pse indicates that the stage of highly efficient desorption appears earlier. Therefore, any factor that increases the characteristic pressures is favorable for CBM development, whereas any factor that decreases them is unfavorable for efficient desorption.
Figure 16.
Relationships between the three characteristic desorption pressures and their main controlling factors: (a) Langmuir volume (VL); (b) maximum vitrinite reflectance (Ro,max); (c) micro-scale fracture development intensity; (d) ash yield (Ad).
Overall positive control of VL on all three characteristic pressures. The figure shows that VL is positively correlated with the starting pressure, transition pressure, and sensitive pressure, indicating that VL is the dominant factor controlling the entire desorption process. VL represents the maximum adsorption capacity of micropores in the coal matrix. A higher VL corresponds to more developed micropores, deeper adsorption potential, and a higher adsorption equilibrium pressure. Consequently, the pressures required for the initiation, transition, and sensitive stages of desorption all increase accordingly. From a production perspective, a high VL not only indicates abundant resources but also raises all three characteristic pressures, which favors earlier initiation of desorption and earlier entry into the rapid and highly efficient desorption stages at relatively high pressures. It therefore provides a dual advantage of “strong gas storage capacity” and “early desorption initiation.” Thus, VL is the most important and most favorable controlling factor among the three characteristic pressures (Figure 16a).
Negative control of coal rank on the sensitive pressure. Coal rank is negatively correlated with the sensitive pressure, whereas its correlations with the starting pressure and transition pressure are not obvious. This indicates that an increase in coal rank mainly suppresses the sensitive pressure and delays the onset of the highly efficient desorption stage, which is unfavorable for production. The mechanism is that an increase in coal rank is generally accompanied by micropore shrinkage and densification of the pore structure. Although adsorption capacity may increase, the diffusion resistance of gas within the matrix also increases, making it difficult for the desorption rate to increase rapidly at relatively high pressures. In the present study area, the coal rank range is narrow (Ro,max = 0.63–0.80%), and the variation in coal rank is limited. Therefore, its negative effect on the characteristic pressures is generally weak, but it still suggests that the highly efficient desorption stage may be relatively delayed in intervals with higher coal rank (Figure 16b).
Positive control of micro-scale fracture development intensity on the sensitive pressure. The micro-scale fracture development intensity is positively correlated with the sensitive pressure, whereas its correlations with the starting pressure and transition pressure are not obvious. This indicates that fracture development intensity mainly controls the late, highly efficient stage of desorption. As the main channels for gas flow, fractures directly determine pressure transmission efficiency and gas migration capacity. The more developed the fractures, the faster the reservoir pressure is transmitted, and the methane released from the matrix can rapidly diffuse into fractures and migrate. As a result, the desorption rate can enter the rapidly increasing stage at a relatively high pressure, manifesting as a higher Pse. Therefore, fracture development intensity controls the sensitive desorption stage through its control on flow capacity; the more developed the fractures, the earlier the gas production peak is likely to occur (Figure 16c).
Weak negative control of ash yield. Ash yield shows a weak negative correlation with all three characteristic pressures. Ash represents the mineral content in coal, and minerals dilute the organic matter, reducing the adsorption capacity per unit mass of coal. Therefore, a higher ash yield corresponds to a lower VL and consequently lower characteristic pressures. Since lower characteristic pressures are unfavorable for early and efficient desorption, a higher ash yield has an adverse effect on production. However, ash mainly affects adsorption capacity and has little influence on flow channels and fracture development, therefore its negative control effect is relatively weak (Figure 16d).
Staged controlling mechanism and production implications. In summary, the characteristic pressures of CBM desorption are jointly controlled by multiple factors and exhibit clear stage-dependent characteristics. The early desorption stage (starting and transition stages) is mainly controlled by adsorption capacity (VL); the higher the VL, the higher the Pst and Ptu, and the more favorable it is for early desorption. The late desorption stage (sensitive stage) is simultaneously controlled by VL, coal rank, and fracture development intensity, among which VL and fracture development intensity are positive controlling factors, while coal rank is a negative controlling factor. The more developed the fractures and the higher the VL, the higher the Pse, and the more favorable it is for efficient desorption. Ash yield exerts a weak negative effect on the whole process by reducing VL. Therefore, in the selection of CBM development intervals, priority should be given to intervals with high VL, well-developed fractures, low ash yield, and moderate coal rank. Such intervals not only have strong gas storage capacity but also exhibit early desorption initiation and an early arrival of the highly efficient desorption stage, providing favorable geological conditions for achieving high and stable gas production.
Based on the above analysis of the controlling factors, the desorption performance of the three working faces can be comprehensively evaluated as follows. The b4 transportation roadway face has the highest VL and the lowest ash yield, which results in the highest starting pressure and transition pressure among the three working faces, indicating the earliest initiation of desorption and the earliest entry into the rapid desorption stage. However, its micro-scale fracture development intensity is moderate, so its sensitive pressure (1.44 MPa) is slightly lower than that of the 620 working face. The 620 working face has a relatively high VL and the highest micro-scale fracture development intensity, which gives it the highest sensitive pressure (1.49 MPa), indicating the earliest onset of the highly efficient desorption stage. Although its starting and transition pressures are slightly lower than those of the b4 working face, its overall desorption performance is the most favorable. The 615 working face has the lowest VL, the highest ash yield, and the weakest fracture development intensity, leading to the lowest values for all three characteristic pressures; consequently, it requires the largest pressure drawdown to initiate desorption and to enter the rapid and highly efficient desorption stages, and its desorption performance is the poorest. Therefore, in terms of CBM development potential, the 620 working face should be the primary target, followed by the b4 working face, whereas the 615 working face is the least favorable.
5. Conclusions
The No. II coal seam in the Longjiapu Mining Area is a low- to medium-rank bituminous coal. Its material composition is generally uniform, whereas the pore-fracture structure is strongly heterogeneous. Integrating pore volume, specific surface area, fractal dimension, and microfracture development intensity, the 620 working face has the most favorable pore-fracture structure, followed by b4, while 615 is the poorest.
Methane adsorption capacity is jointly influenced by moisture, ash, and volatile matter, but through different mechanisms: moisture competes for adsorption sites, ash mainly causes mineral dilution, and volatile matter reflects organic matter composition and micropore development. After ash-free normalization, the negative correlation between ash and VL largely disappears, indicating that ash is not the fundamental control; the positive correlation between volatile matter and VL indicates that organic matter composition and micropore development are the fundamental controls. Adsorption capacity is highest in b4, followed by 620 and then 615.
The three characteristic pressures governing the initiation, transition, and sensitivity stages of coalbed methane desorption are primarily controlled by the pore-fracture structure and fracture development intensity. It should be noted that these characteristic pressures are model-inferred values derived from the curvature slope of the equivalent desorption rate curve, and their absolute values should be further verified using field production data and canister desorption tests. The 615 working face has the lowest starting and transition pressures, indicating that a larger pressure drawdown is required to initiate desorption and enter the rapid desorption stage. In contrast, the 620 and b4 working faces have higher characteristic pressures, among which the 620 working face has the highest sensitive pressure, indicating the most favorable desorption performance. Overall, the desorption conditions of the 620 and b4 working faces are better than those of the 615 working face.
Considering the material composition, pore-fracture structure, and adsorption–desorption characteristics measured in this study, the coal seam at the 620 working face exhibits relatively favorable pore-fracture characteristics and model-inferred desorption characteristics among the tested samples in the Longjiapu Mining Area. Its well-developed microfractures and relatively favorable modeled desorption behavior suggest potentially favorable geological conditions for CBM exploration. However, this conclusion is limited to the measured pore-fracture and adsorption properties. Future evaluation of its commercial potential should incorporate in situ gas content, gas saturation, permeability, reservoir pressure, in situ stress, hydrogeological conditions, seam continuity, and production test data.
Supplementary Materials
The following supporting information can be downloaded at: https://www.mdpi.com/article/10.3390/pr14203357/s1, Table S1: Sample-by-method table showing the number of samples tested for each experimental analysis; Table S2: Pore structure parameters of coal samples from different working faces based on nitrogen adsorption; Table S3: Pore structure parameters of coal samples from different working faces based on high-pressure mercury intrusion porosimetry; Table S4: Fractal Dimensions and Fitted Equations of Coal Samples from Different Working Faces; Table S5: Sample-level values of the four fracture parameters and the calculated fracture development intensity.
Author Contributions
Writing—original draft preparation, S.L. and S.F.; methodology, H.G. and M.Y.; data curation, S.L.; writing—review and editing, S.L. and Y.H. All authors have read and agreed to the published version of the manuscript.
Funding
This work is jointly supported by the Geological Survey Project of the China Geological Survey (Grant No. DD20240201004), the National Natural Science Foundation of China (Grant No. U2244207), and the Regional Innovation Fund of the Northeast Geological Science and Technology Innovation Center, China Geological Survey (Grant No. QCJJ2022-37).
Data Availability Statement
The original contributions presented in this study are included in the article/Supplementary Materials. Further inquiries can be directed to the corresponding author.
Conflicts of Interest
The authors declare no conflicts of interest.
References
- Li, L.; Tang, D.; Xu, H.; Meng, Q.; Lin, H.; Yao, H. Genesis and Accumulation Mechanism of Low-Rank CBM: A Case Study in the Jiergalangtu Block of Erlian Basin, Northern China. ACS Omega 2023, 9, 1827–1837. [Google Scholar] [CrossRef] [Scilit]
- Chen, S.; Tao, S.; Tang, D.; Xu, H.; Li, S.; Zhao, Y.; Zhang, W. In situ coal permeability and favorable development methods for coalbed methane (CBM) extraction in China: From real data. Int. J. Coal Geol. 2024, 284, 104472. [Google Scholar] [CrossRef] [Scilit]
- Sun, F.; Li, W.; Sun, Q.; Sun, B.; Tian, W.; Chen, Y.; Chen, Z. Low-Rank Coalbed Methane Exploration in Jiergalangtu Sag, Erlian Basin. Acta Pet. Sin. 2017, 38, 485–492. [Google Scholar]
- Li, M.; Li, M.J.; Pan, J.; Gao, D.; Cao, Y. Coalbed methane accumulation, in-situ stress, and permeability of coal reservoirs in a complex structural region (Fukang area) of the southern Junggar Basin, China. Front. Earth Sci. 2023, 10, 1076076. [Google Scholar] [CrossRef] [Scilit]
- Zhang, B.; Deng, Z.; Fu, X.; Yin, K. A Study on Three-Phase Gas Content in Coal Reservoirs and Coalbed Methane-Water Differential Distribution in the Western Fukang Mining Area, Xinjiang, China. ACS Omega 2021, 6, 3999–4012. [Google Scholar] [CrossRef] [Scilit]
- Lu, X.; Liu, L.; Zhou, L.; Imani, G.; Liu, Z.; Wu, H.; Sun, H.; Fang, H. Research on the Multiscale Microscopic Pore Structure of a Coalbed Methane Reservoir. Energies 2024, 17, 1081. [Google Scholar] [CrossRef] [Scilit]
- Shen, Z.; Meng, Z.; Liu, Y.; Lei, J.; Shen, W.; Ren, H.; Gao, T.; Zhang, K.; Wang, Y.; Tan, L. Relationship between multiscale nanopore structure and coal connectivity during coalification process. Microporous Mesoporous Mater. 2023, 360, 112717. [Google Scholar] [CrossRef] [Scilit]
- Zhang, S.; Tian, H.; Tang, J.; Zhang, X. Quantitative Characterization of Coal Shale Pores and Fractures Based on Combined High-Pressure Mercury Pressure and Low-Temperature N2/CO2 Adsorption Methods. ACS Omega 2024, 9, 20927–20936. [Google Scholar] [CrossRef] [Scilit]
- Wang, L.; Liu, M.; Li, J.; Sun, Y.; Lv, B.; Ma, X.; Zhou, M.; Zhang, J. Investigation of methane adsorption mechanism in Low-Rank bituminous coal considering internal water Distribution: A molecular simulation and experimental study. Chem. Eng. J. 2024, 495, 153562. [Google Scholar] [CrossRef] [Scilit]
- Meng, Y.; Tang, D.; Xu, H.; Qu, Y.J.; Li, Y.; Zhang, W. Division of coalbed methane desorption stages and its significance. Pet. Explor. Dev. 2014, 41, 671–677. [Google Scholar] [CrossRef] [Scilit]
- Su, S.; Jiang, Y.; Liu, Y. Fault Development and Tectonic Evolution in the Lishu Depression, Songliao Basin, NE China. J. Earth Sci. 2026, 37, 593–607. [Google Scholar] [CrossRef] [Scilit]
- Ahmed, B.; Tang, H.; Qu, W.; Gao, Y.; Hu, J.; Tian, Z.; Bakht, S. Geological Evolution and Volcanostratigraphy of the Wangfu Fault Depression: Insights from Structural and Volcano-Sedimentary Analysis in the Songliao Basin. Minerals 2025, 15, 620. [Google Scholar] [CrossRef] [Scilit]
- Yang, Z.X.; Liu, W.H.; Sun, Y. Sedimentary environment and coal-accumulating characteristics of Yingcheng Formation in Longjiapu Mining Area of Yangcaogou Basin. Jilin Geol. 2013, 32, 64–69. [Google Scholar]
- GB/T 212-2008; Proximate Analysis of Coal. Standardization Administration of China (SAC): Beijing, China, 2008.
- GB/T 6948-2008; Method of Determining Microscopically the Reflectance of Vitrinite in Coal. Standardization Administration of China (SAC): Beijing, China, 2008.
- GB/T 15588-2013; Classification of Macerals for Bituminous Coal. Standardization Administration of China (SAC): Beijing, China, 2013.
- GB/T 21650.1-2008; Pore Size Distribution and Porosity of Solid Materials by Mercury Porosimetry and Gas Adsorption — Part 1: Mercury Porosimetry. Standardization Administration of China (SAC): Beijing, China, 2008.
- GB/T 19560-2025; Experimental Method of High-Pressure Isothermal Adsorption to Coal. Standardization Administration of China (SAC): Beijing, China, 2025.
- Chen, Y.; Yin, Z.; Sun, F.; Xu, H.; Wu, J.; Fu, F. Pyrolysis characteristics and microstructure evolution of different coal types. Energy Explor. Exploit. 2022, 41, 154–169. [Google Scholar] [CrossRef] [Scilit]
- Liu, T.; Lin, B.; Sang, S.; Yang, W.; Liu, T.; Liu, S.; Zheng, S.; Wang, T. Control Mechanisms of Macromolecular Compositions and Structures of Coals on the Evolution of Nanopores during Coalification. Energy Fuels 2024, 38, 13002–13018. [Google Scholar] [CrossRef] [Scilit]
- Li, R.; Jin, L.; Wang, S.; Liu, H.; Cui, Z.; Xiang, W. A New Mode of Visible Fracture System in Coal Seams and Its Implications for Coalbed Methane Seepage. Geofluids 2023, 2023, 2455954. [Google Scholar] [CrossRef] [Scilit]
- Patria, A.; Suhendra, R.; Anggara, F.; Agangi, A.; Obrochta, S.; Setiawan, I. Association and textural-compositional evolution of pyrite-organic matter in coals of the Tarakan, Barito, and Pasir Basins, Kalimantan, Indonesia. Int. J. Coal Geol. 2024, 282, 104442. [Google Scholar] [CrossRef] [Scilit]
- Du, S.; Long, E.; Qi, Y.; Ju, Y.; Wu, P.; Fu, Y.; Gu, S.; Zhang, H.; Li, Q. The Evolution of Sulfur during Coalification in Marine Land Interaction Environments Based on the Sequential Extraction of Different Sulfur Species. Mar. Pet. Geol. 2025, 173, 107266. [Google Scholar] [CrossRef] [Scilit]
- Wang, L.; Li, Z.; Li, J.; Chen, Y.; Zhang, K.; Han, X.; Xu, G. Changes in mineral fraction and pore morphology of coal with acidification treatment: Contribution of clay minerals to methane adsorption. Environ. Sci. Pollut. Res. 2023, 30, 114886–114900. [Google Scholar] [CrossRef] [Scilit]
- Li, Y.; Liu, W.; Song, D.; Ren, Z.; Wang, H.; Guo, X. Full-scale pore characteristics in coal and their influence on the adsorption capacity of coalbed methane. Environ. Sci. Pollut. Res. 2023, 30, 72187–72206. [Google Scholar] [CrossRef] [Scilit]
- Thommes, M.; Kaneko, K.; Neimark, A.V.; Olivier, J.P.; Rodriguez-Reinoso, F.; Rouquérol, J.; Sing, K.S.W. Physisorption of Gases, with Special Reference to the Evaluation of Surface Area and Pore Size Distribution (IUPAC Technical Report). Pure Appl. Chem. 2015, 87, 1051–1069. [Google Scholar] [CrossRef] [Scilit]
- Jiang, X.; Miao, B.; Zhang, J.; Xi, D.; Qin, Z.; Vandeginste, V. Quantitative Characterization of Pore-Fracture Structures in Coal Reservoirs by Using Mercury Injection-Removal Curves and Permeability Variation under Their Constraints. Processes 2024, 12, 1434. [Google Scholar] [CrossRef] [Scilit]
- Wang, B.; Yuan, D.; Li, J.; Li, S.; Xiao, F.; Tian, S.; Yin, M.; Yang, J. Fine Characterization of Micro-Nano Fractures and Analysis of Network Connectivity: Mechanistic Controls on Hydrocarbon Enrichment in Shale Reservoirs. Geosci. Front. 2026, 17, 102233. [Google Scholar] [CrossRef] [Scilit]
- Chen, F.; Yin, J.; Qu, Y.; Ma, L.; Jiang, P.; Cao, Z.; Yang, C.; Tian, M.; Li, B.; Song, Z. The Pore and Fracture Structure Evolution and Fractal Characteristics of Coal under the Coupling Effect of Shock Wave and Acidification. Fuel 2026, 409, 137929. [Google Scholar] [CrossRef] [Scilit]
- Zhang, J.; Cheng, Y.; Cheng, X.; Cheng, M.; An, H.; Yin, J.; Zhu, K. Effect of Adsorbed Phase Density on Excess Adsorption in Coal: An Experimental Study Based on High-Pressure Adsorption. Energy Fuels 2024, 38, 15270–15283. [Google Scholar] [CrossRef] [Scilit]

Disclaimer/Publisher’s Note: The statements, opinions and data contained in all publications are solely those of the individual author(s) and contributor(s) and not of MDPI and/or the editor(s). MDPI and/or the editor(s) disclaim responsibility for any injury to people or property resulting from any ideas, methods, instructions or products referred to in the content. |
© 2026 by the authors. Licensee MDPI, Basel, Switzerland. This article is an open access article distributed under the terms and conditions of the Creative Commons Attribution (CC BY) license.