


Abstract
The quantitative evaluation of the impact of wax-solid deposition on the CO2 displacement of high-pour-point oil has long been a challenge in gas-flooding experiments. This study employs slim tube experiments to simulate the displacement dynamics, and comprehensively evaluates the productivity/injectivity index formula and the GERG-2008 state equation. The results indicate that the fluctuations in this index remain stable within the 17–20 MPa range and become pronounced within the range of 30–40 MPa. The analysis of seepage velocity reveals an initial increasing trend for supercritical CO2 under the conditions of 30 MPa, 35 MPa, and 40 MPa, followed by inflection points at different time steps. The observed decline in seepage velocity inflection is associated with the occurrence of wax-solid deposition in high-pour-point oil. Notably, there is a significant surge in CO2 seepage velocity at 40 MPa during the latter stage of the experiment due to the release-blockage effect of supercritical CO2. To systematically analyze the influence of wax-solid on the CO2 displacement in high-pour-point oil, a methodological framework is established in this study. This approach enables precise analysis of displacement dynamic characteristics in the target areas and provides pressure parameters for oilfields.
1. Introduction
High-pour-point oil is a type of crude oil characterized by unique properties, notably its high wax content [1]. In the development of this type of crude oil, cold water displacement was revealed to be generally ineffective. Consequently, segmental displacement [2], supercritical CO2 displacement [3,4], or CO2 mixed displacement [5,6,7] emerged as viable alternatives for enhancing displacement efficiency. While CO2 displacement offers several advantages, such as reducing crude oil viscosity and interfacial tension [8,9], it is not without drawbacks. Wax-solid deposition poses significant challenges during development operations. Once precipitated, wax-solids tend to accumulate on reservoir rock surfaces and downhole equipment, blocking reservoir pores and thereby diminishing well productivity and elevating production and operational costs. From the perspective of flow mechanism analysis, the presence of wax-solids directly affects the fluid flow regime in porous media, which differs from the asphaltene deposition observed in heavy oil separation [10]. It is difficult to directly separate wax-solids, making the assessment of fluid flow states during CO2 oil displacement even more challenging. The intervention process of carbon dioxide is a complex physical and chemical process, during which changes in temperature and pressure conditions can affect wax precipitation, deposition, and seepage dynamics. In addition, during the occurrence of blockage, due to the high penetration, acidification, expansion, and displacement characteristics of carbon dioxide itself, a release-blockage effect may occur. This study employs slim tubes as carriers and integrates experimental displacement results with various equation-based simulation methods, offering a comprehensive evaluation of the wax-solid displacement process.
For the design and optimization of technologies such as enhanced oil recovery and carbon capture and storage, it is crucial to accurately capture the phase behavior of supercritical CO2. As the core tool for predicting supercritical carbon dioxide (SC-CO2) thermophysical properties, the accuracy and applicability of the equation of state directly affect the reliability of engineering solutions [11,12]. Currently, cubic state equations (such as the PR equation [13,14,15] and SRK equation [16,17,18]) are widely used to predict SC-CO2 density, fugacity coefficients, and phase equilibrium due to their simplicity and computational efficiency. Recently, multi-parameter state equations, such as GERG-2008 [19,20,21], have gained attention in oil and gas reservoir engineering, particularly for calculations involving CO2 containing impurities, CO2 in saline layers, multi-component phase equilibrium, and minimum miscibility pressure (MMP). These equations also demonstrate advantages in scenarios requiring high precision in phase transition calculations across varied applications [22,23,24]. This study aims to utilize the state equation to restore the parameters of supercritical CO2 under formation conditions, contributing to a deeper understanding of the displacement and seepage characteristics of high-pour-point oil.
2. Evaluation Parameters and Experimental Procedures
2.1. Index Calculation Formula
The oil recovery index refers to the daily oil production rate from a single well per unit pressure differential, reflecting well productivity while considering factors such as reservoir properties, fluid characteristics, and completion conditions. Another key parameter for evaluating production efficiency is the injectivity index. Based on displacement experiment data, the index formula of the oilfield site is converted into an index formula suitable for physical experiment environments to assess the displacement effects from the core spatial perspective. The formula is as follows:
Ip = Vp/Δp·t
Ii = Vi/Δp·t
In the formula, I is the index, p and i represent productivity and injectivity, respectively, both in cm3/(MPa·min), Vp and Vi are oil mining volume and injection volume, both in cm3, and Δp is pressure difference, MPa; t is time, min.
2.2. Preparation Work and Steps for Slim Tube Experiment
Block JG-2 of the Liaohe Oilfield is a typical high-pour-point oil area, in which the crude oil samples were collected. An active oil sample was prepared considering the composition of associated gas. The injected CO2 had a purity of 99.999%. Key parameters of the experimental equipment and sand-packed slim tube are listed in Table 1 and Table 2. Some reservoirs, especially special reservoirs, have a certain sensitivity to pressure changes. In the experimental process, for oil products with a certain proportion of medium and heavy components (Table 3), the pressure difference was maintained at around 1 MPa, while ensuring a linear pressure gradient state on the displacement path [25,26].
Table 1.
Main parameters of the slim tube experimental equipment.
Table 2.
Detailed properties and parameters of particle- and sand-packed slim tubes.
Table 3.
Properties and thermodynamic parameters of oil samples.
The experimental procedure includes the following:
- (1)
- Cleaning the slim tube with petroleum ether, drying it using high-pressure nitrogen in a high-temperature environment, and then evacuating the tube to a vacuum state.
- (2)
- Establishing the experimental temperature environment: the slim tube was placed in a constant-temperature oven with a temperature accuracy of 0.1 °C, and the experimental environment temperature was monitored and strictly controlled at 60 °C. The slim tube was saturated with petroleum ether, and the pressure was increased to the experimental level.
- (3)
- Replacing the petroleum ether with the configured active oil while observing the gas-oil ratio (GOR) at the outlet until it matches standard GOR parameters.
- (4)
- Conducting the displacement experiments using a constant-pressure method: the inlet and outlet pressures of the slim tube are controlled by a constant-pressure pump, the working pressure ranges of the pump range from 0.00 to 100.00 MPa, with a pressure accuracy of 0.1% FS, and the pressure difference required for displacement can be well stabilized within a certain range. During the experiment, injections were performed at intervals of 0.1 pore volume (PV) to measure produced oil, gas volume, and pump position (when the cumulative injection is 1.2 PV, displacement is halted). The reserve recovery is calculated for different injection volumes, and the relationship curve between reserve recovery and injection volume is plotted.
- (5)
- Utilizing test data to perform MMP tests via extrapolation, calibrating the PV number at breakthrough by analyzing GOR data, and calculating the oil recovery index and injection index using the relevant data.
3. Slim Tube Experiment Results
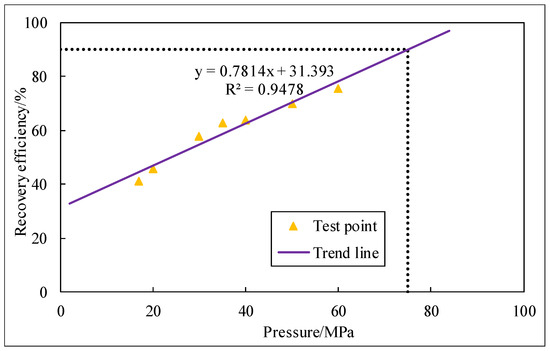
During the seven-point testing (Figure 1), it is observed that the minimum miscibility pressure of the crude oil sample was very high, exceeding 60 MPa (pressure-bearing limit of equipment). Therefore, the regression extrapolation on the curve of Formula (3) indicated that the minimum miscibility pressure at a recovery efficiency of 90% was 75 MPa.
y = 0.7814x + 31.3930, R2 = 0.9478
Figure 1.
Schematic diagram of minimum miscibility pressure extrapolation curve.
Considering the practical significance of engineering, the fracture pressure of reservoir rocks in the research area does not exceed 40 MPa. Therefore, the upper limit of pressure for subsequent research will be set at this level. According to the flow characteristics, the flow of SC-CO2 in the slim tube carrier can be divided into two stages: pre-breakthrough and post-breakthrough (associated with transition point and breakthrough point). The frequency and amount of contact between SC-CO2 and crude oil in space before breakthrough are higher, and this stage before breakthrough has a certain representativeness. Based on the experimental characteristics and gas–oil ratios, CO2 breakthrough positions were determined for each pressure condition, represented in PV numbers (Table 4).
Table 4.
Corresponding relationship table between breakthrough point and displacement pressure.
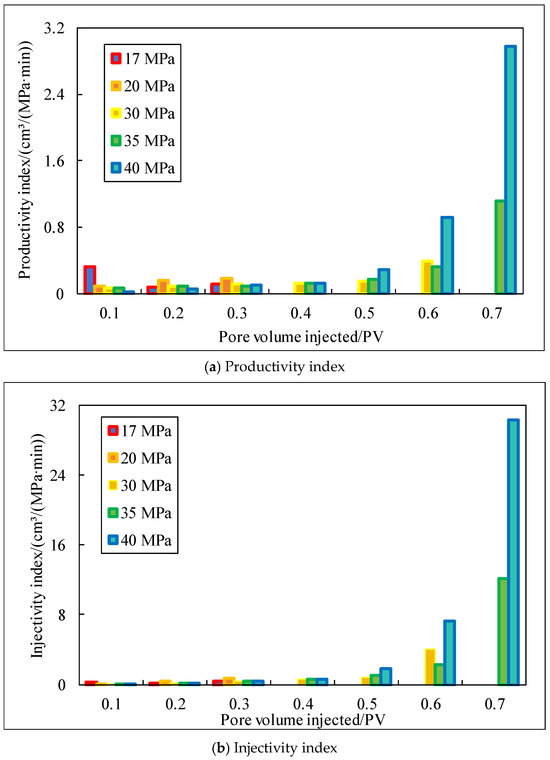
Before calibrating breakthrough PVs, test data was used to calculate the productivity index and injectivity index, which were then plotted as shown in Figure 2. Figure 2a illustrates the variation in the recovery index with PV. Higher pressures cause more pronounced fluctuations in this index, which is consistent with the trends in the injection index depicted in Figure 2b. Under the conditions of 17 MPa and 20 MPa, CO2 breakthrough occurred earlier, reaching 0.3 PV, and both the recovery index and injection index remained relatively stable. Under the condition of 30 MPa, these indices peaked at an injected PV of 0.6. Under the conditions of 35 MPa and 40 MPa, the productivity index and injectivity index also reached the maximum values at 0.7 PV. Based on the characteristics of index changes, pressure conditions are categorized into two distinct ranges: 17–20 MPa is the stable fluctuation pressure range and 30–40 MPa is the vigorous fluctuation pressure range. These two segments exhibit qualitatively different seepage characteristics. In the 17–20 MPa range, seepage is stable and uniform. In the 30–40 MPa range, although not reaching the minimum miscibility pressure, the oil sweep advantage of CO2 displacement is demonstrated.
Figure 2.
Productivity/injectivity index change characteristic chart.
4. Seepage Characteristics
4.1. Equation of State and Darcy’s Law
GERG-2008 (GERG-2008 Wide Range Equation of State) is a high-precision equation of state developed by the European Gas Research Organization (GERG) specifically to calculate the thermodynamic properties of natural gas and multi-component mixed fluids. It has certain advantages in calculating the relevant parameters of supercritical fluids. Through comparison and evaluation with experimental data, the calculation error of this equation of state for pure CO2 is determined to be less than 0.1% [27,28,29].
The functional form of GERG-2008 based on Helmholtz free energy is as follows:
The residual part is further divided into pure-component contributions and mixed correction terms, expressed as follows:
In the formula, δ represents the contrast density; τ is the reciprocal of the comparison temperature; x is the component mole fraction vector. The expression for the mixed correction term is as follows:
where Fij is the binary interaction coefficient, and αijr is the cross-term function.
Key information parameters of supercritical fluids are shown in Table 5.
Table 5.
Summary of supercritical fluid-related parameters.
The flow characteristics and flow state of the target fluid in the slim tube can be matched with Darcy’s law. We can use Darcy’s law to correlate the velocity and permeability characteristics of CO2, and these two parameters show a positive correlation. The permeability calculation formula based on Darcy’s law is as shown in Formula (7). Since this study uses a slim tube carrier instead of a traditional core carrier, the length of the carrier is equivalent to the length of the slim tube.
In the equation, K is the permeability of the supercritical state, D; Q is the flow volume per unit time condition, cm3/s; μ is the phase viscosity, mPa·s; L is the length of the carrier, cm; A is the cross-sectional area of the carrier, cm2; Δp is the pressure difference, 10−1 MPa.
In the displacement process of the slim tube experiment, the pressure difference and pressure gradient along the slim tube path were strictly controlled. Although the properties of the oil are unique, we still controlled the pressure difference at around 1 MPa to ensure the stable progress of the displacement process. Table 6 shows the parameters under the corresponding PVs conditions.
Table 6.
Statistical data of pressure difference under different pressure and PVs conditions.
4.2. Velocity Characteristics of SC-CO2
At the gas collection location, under the changing conditions of temperature and pressure, the precipitation of dissolved gas is usually inevitable, which also makes the properties of the collected gas usually the properties of a mixed gas—that is to say, under each pressure condition, the gas collected at the outlet contains not only CO2 but also dissolved gas. We can accurately convert the amount of dissolved gas released through the gas oil ratio, thereby indirectly obtaining the accurate carbon dioxide content. Since measurements occur under atmospheric rather than geological conditions, the GERG-2008 equation of state is applied to convert CO2 properties to reservoir conditions. Additionally, when utilizing mixed-gas measurement data from the outlet, the dissolved gas portion is subtracted by jointly calculating the specific quantity based on measured data from the oil samples collected at the outlet and dissolved GOR parameters.
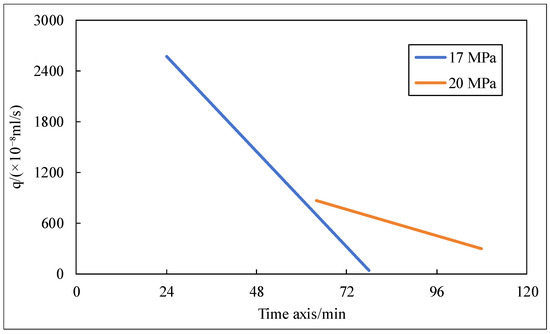
The study involves calculations under five pressure conditions: 17 MPa, 20 MPa, 30 MPa, 35 MPa, and 40 MPa. The CO2 velocity is calculated based on the displacement experiment time. After identifying the breakthrough points for each pressure condition, the corresponding transition point and pre-breakthrough curves are plotted. These plots are divided according to the partition of the stable fluctuation pressure range and relatively severe fluctuation pressure range; in situations with relatively severe fluctuations, the number of inflection points on the curve is greater than or equal to 1. As shown in Figure 3, under the relatively low-pressure conditions of 17 MPa and 20 MPa, CO2 breakthrough occurs earlier. This is primarily due to the significant difference in viscosity between CO2 and the oil phase at lower pressures, which results in more pronounced differences between CO2 flow rate and oil phase flow rate. Consequently, the higher the CO2 flow rate, the earlier the breakthrough occurs. It is noteworthy that under these relatively low-pressure conditions of 17 MPa and 20 MPa, the seepage velocity of supercritical CO2 does not increase but decreases directly before the rapid breakthrough. This is mainly because under the relatively low-pressure conditions, the dissolution rate is relatively slow, causing higher velocity values at the initial point. Over time, as the gas approaches breakthrough, its expansion capacity increases, enlarging the interaction volume between the injected CO2 and crude oil. This accelerates dissolution, causing a sudden rise in crude oil flow rate while the speed of supercritical CO2 declines.
Figure 3.
Velocity characteristics of SC-CO2 in the stable fluctuation pressure range.
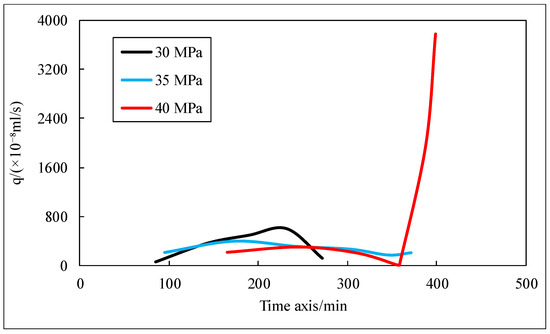
Figure 4 presents the statistical results of seepage velocity under relatively high-pressure conditions (30 MPa, 35 MPa, and 40 MPa). It can be seen that the seepage velocity of supercritical CO2 initially showed an increasing trend, but the increase was limited. When it reached a certain value, it showed a decreasing trend again, although the time of blockage was different. The decline in seepage velocity is related to the occurrence of wax-solid deposition in high-pour-point oil. Specifically, under these temperature and pressure conditions, wax-solid deposition and pore blockage occurred in the slim tube carrier and flow system. It is particularly noteworthy that the significant upward trend in the CO2 seepage velocity at the later stage under the 40 MPa condition is mainly due to the release-blockage effect of supercritical CO2. In other words, under certain temperature and pressure conditions, the CO2 crude oil flow system exhibits both blockage and release-blockage effects simultaneously.
Figure 4.
Velocity characteristics of SC-CO2 in the range of intense pressure fluctuations.
Figure 3 and Figure 4 illustrate two distinct types of seepage velocity performance, consistent with the pressure range classification results of the slim tube experiment. The results indicate that under different pressure conditions, the flow system displays two distinct fluctuation states: stable fluctuation and relatively severe fluctuation.
4.3. Permeability Characteristics
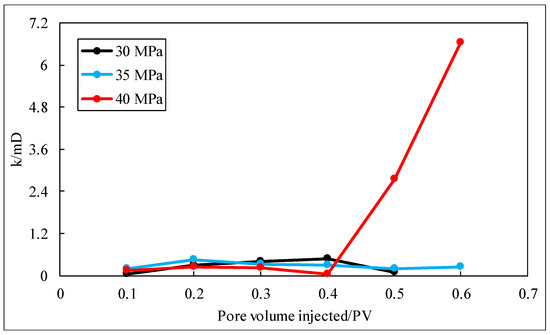
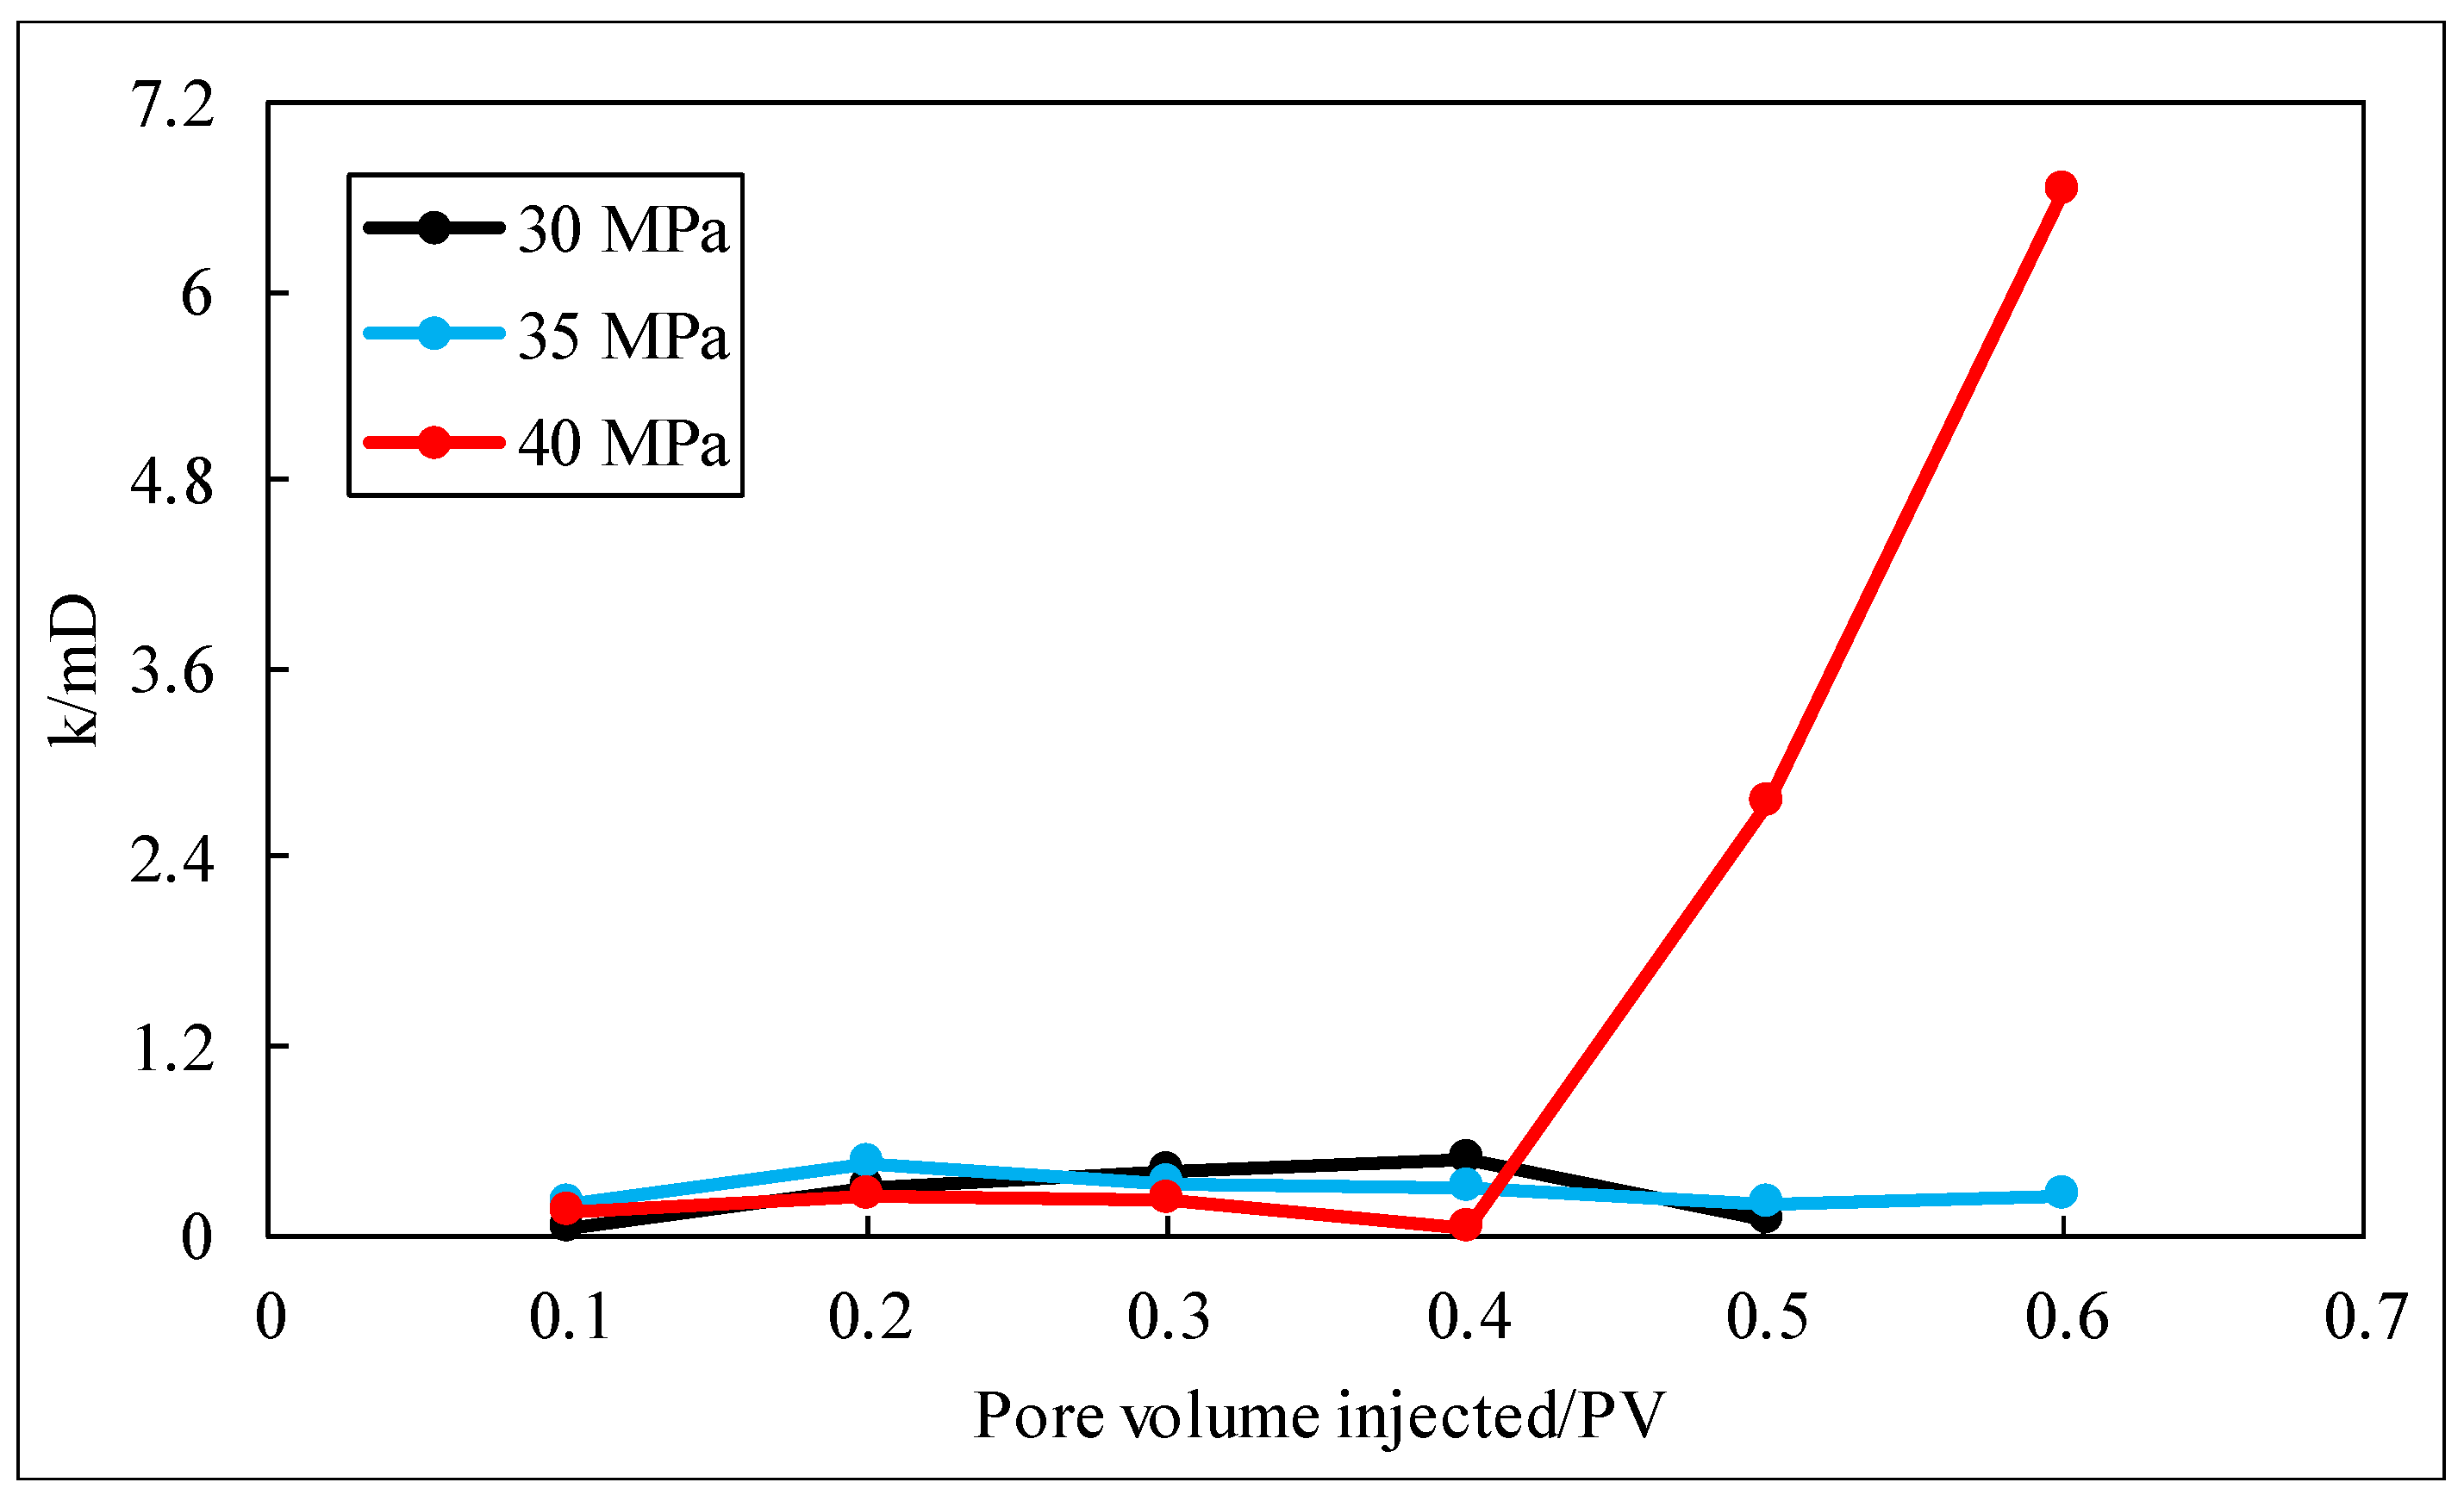
Based on the velocity characteristics of SC-CO2, three pressure points with more obvious variation features were selected to participate in the calculation of permeability characteristics, namely the pressure points in the range of relatively severe fluctuation pressure. By combining Darcy’s law with the calculation results of the GERG-2008 equation of state, the permeability of SC-CO2 under different pressures was simulated, and the results were plotted with PV numbers in Figure 5. The simulation results show that the permeability showed a trend of first increasing and then decreasing at 30 MPa and 35 MPa. At 40 MPa, the permeability showed a sudden upward trend after 0.4 PV, which aligns with the pattern exhibited by the seepage velocity.
Figure 5.
Characteristics of simulated permeability changes in SC-CO2.
5. Discussions
Usually, when testing the basic physical properties and wax precipitation characteristics of high-pour-point oil samples, there are many types of equipment and many different methods available for us to choose from, such as the density meter method, the vacuum cutting distillation method, DSC testing, and the rheological method. These methods have their own advantages in exploring the composition, wax precipitation characteristics, and thermal properties of oil samples. However, many methods cannot capture the dynamic characteristics of wax during complex dynamic displacement processes. As in the reservoir conditions, the CO2 displacement of high-pour-point oil by carbon dioxide occurs in porous media. When temperature and pressure reach critical levels, wax-solids precipitate and deposit, affecting fluid flow behavior. Given the similarities in thermodynamic properties and precipitation mechanisms between wax-solids and asphaltenes, their deposition processes are often interconnected. However, due to fundamental differences in material composition, the methods for evaluating their impact on fluid flow behavior differ significantly. Asphaltenes are soluble in toluene but insoluble in n-heptane, making it relatively easy to study their solubility characteristics and identify suitable solvents for extraction and separation analysis. In contrast, in wax-solids, it is difficult to find stripping solvents. It is very difficult to independently study the effect of wax-solids, which lack easily identifiable stripping solvents, making it challenging to independently assess their impact on the permeability behavior of porous media. To address this, innovative indirect detection methods are employed. For instance, the index formula on the oilfield site is converted into an index formula suitable for physical experimental environments, enabling the indirect detection and analysis of observed trends.
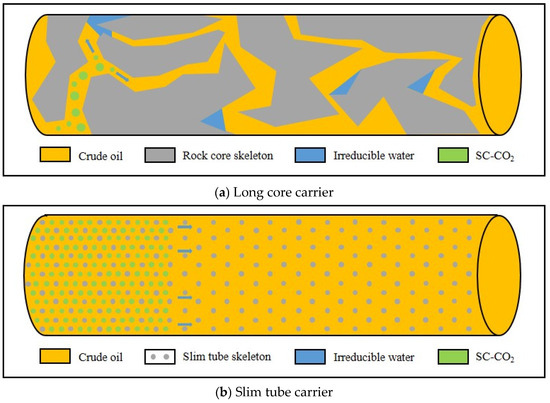
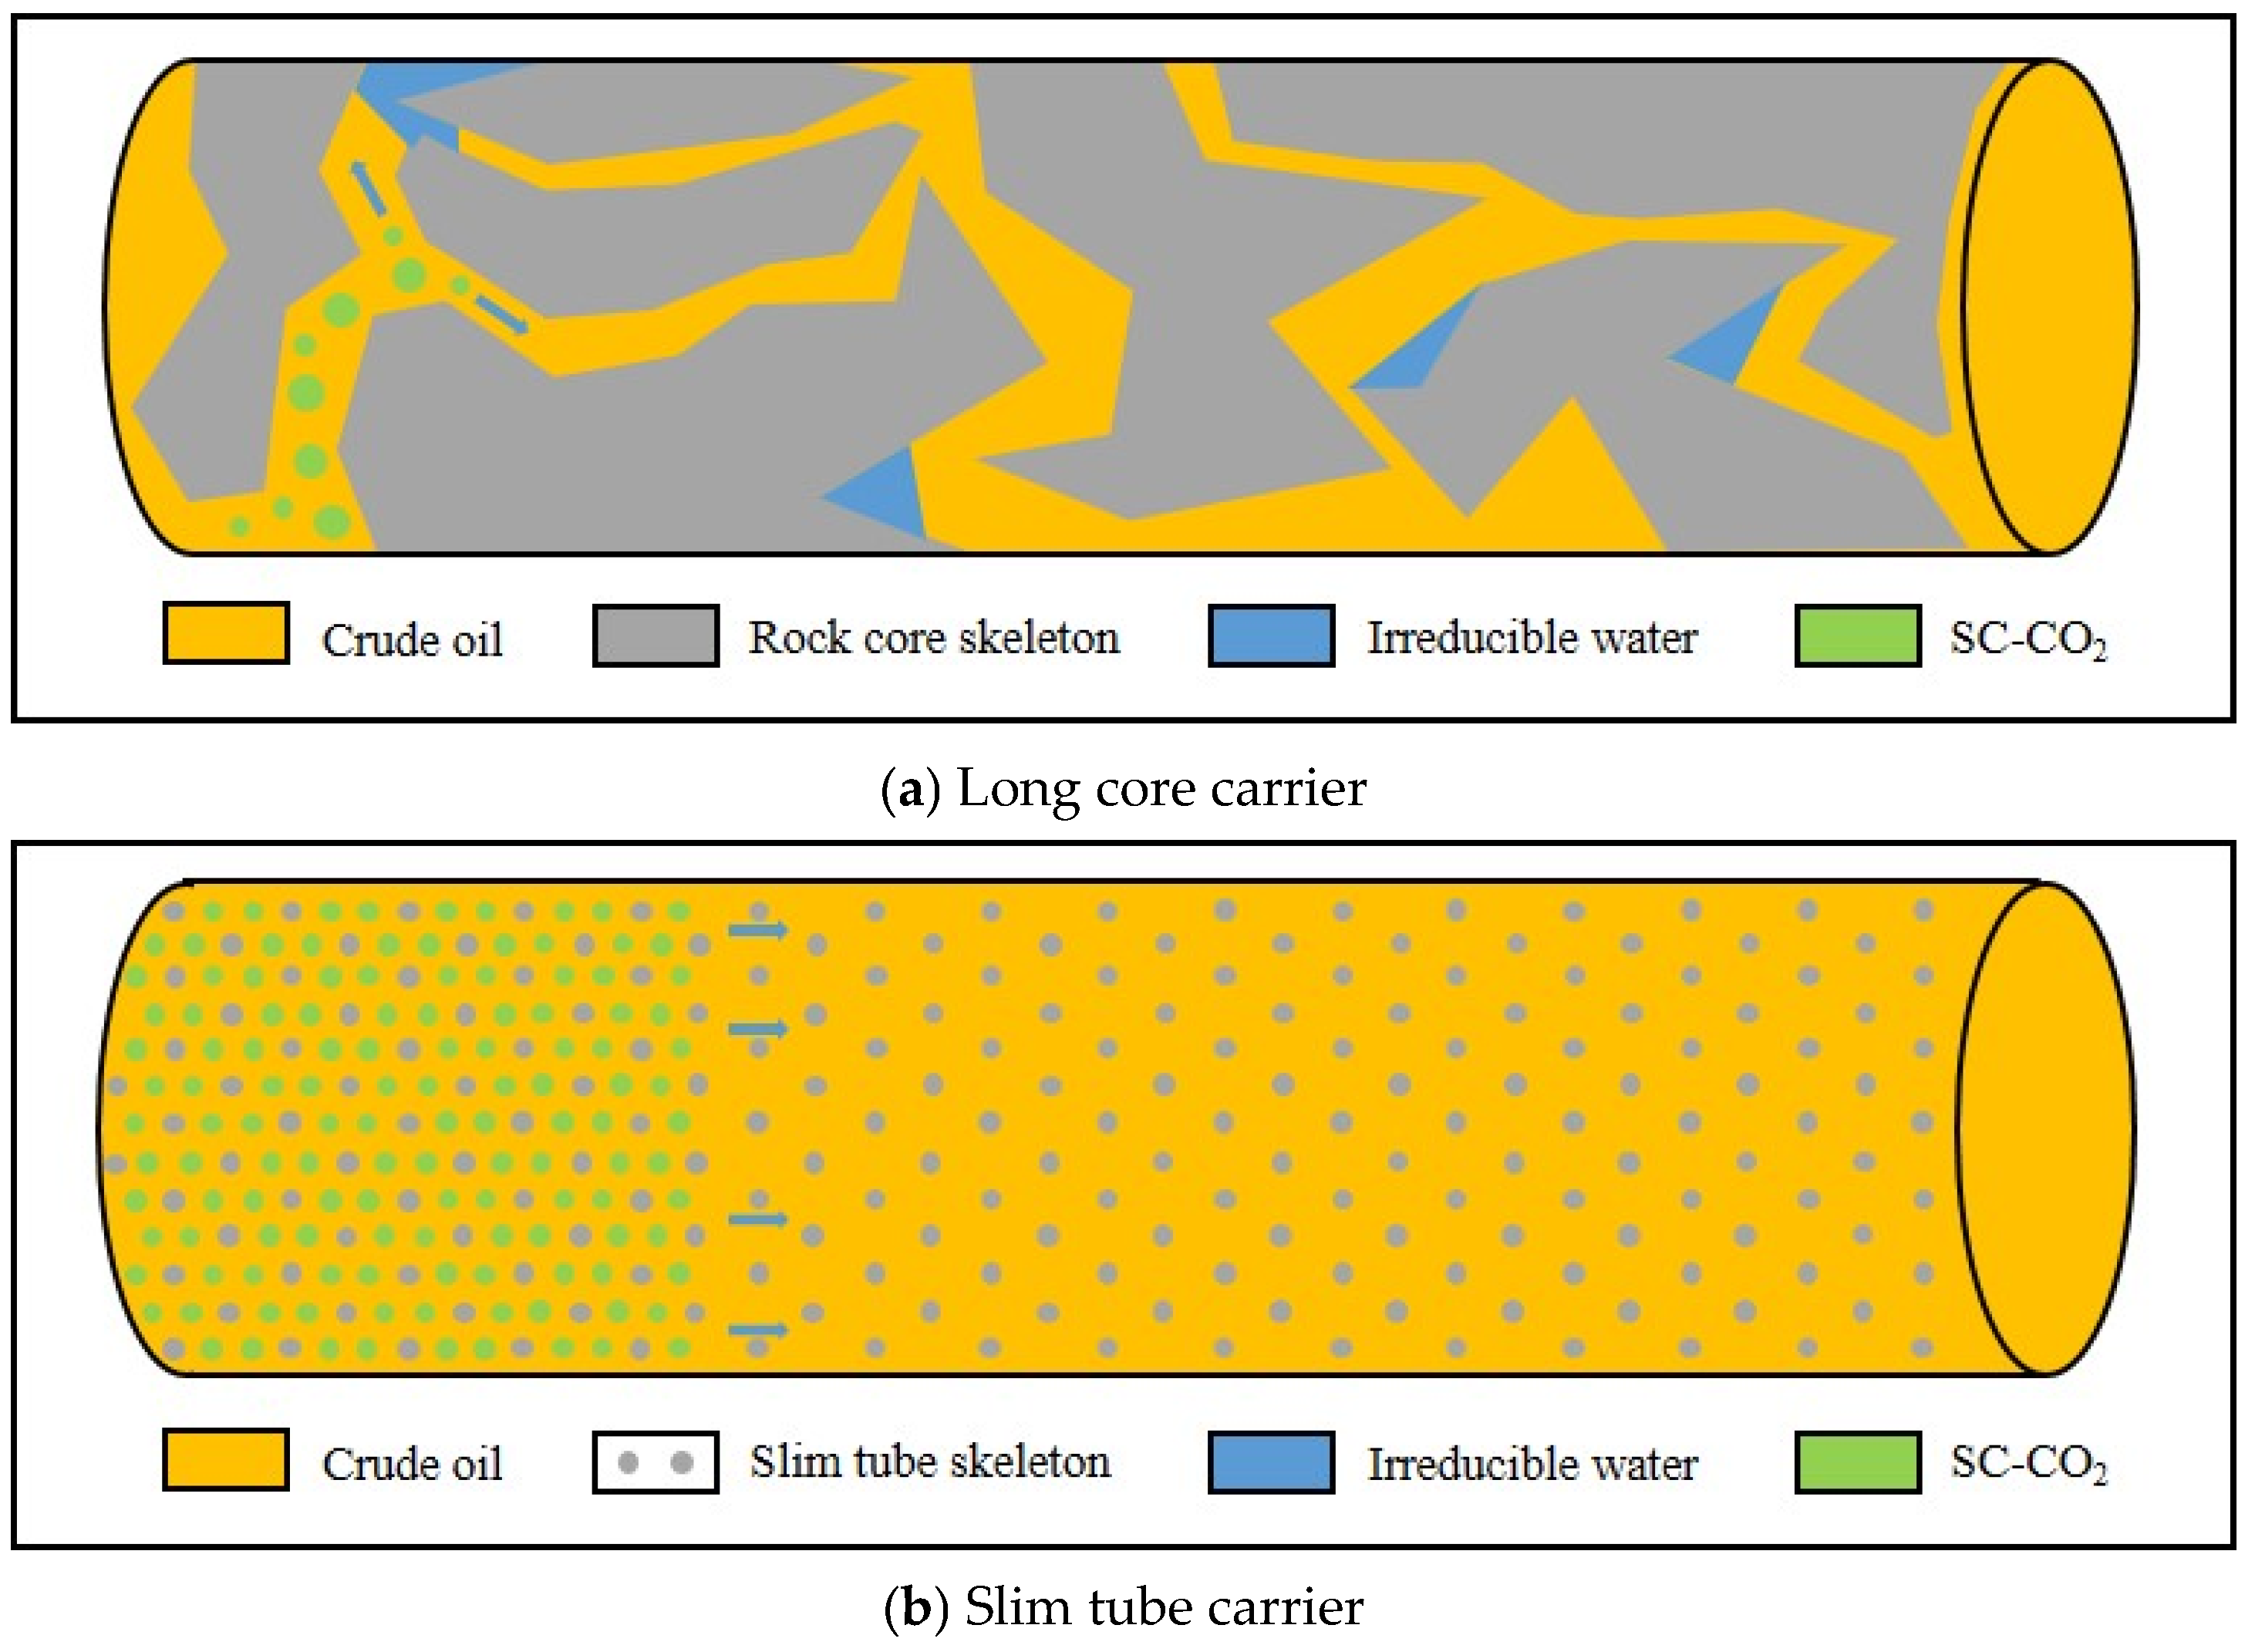
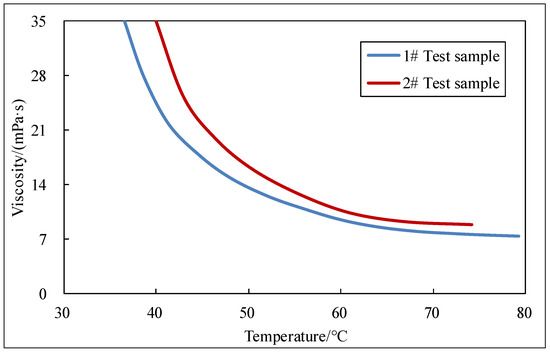
In addition, the heterogeneity of long rock cores and the combined effects of bound water can also interfere with research. Figure 6 highlights the differences between the long core and slim tube. As shown in Figure 6a, the results of this displacement experiment reflect not only wax deposition but also the combined effects of multiple elements, such as core skeleton and bound water. In the literature, papers by Yu (2023) [30] and Xu (2019) [31] studied the blockage during the CO2 displacement of high-pour-point oil, but did not focus on the separate detachment of wax-solid deposits. In contrast, this study employs a slim tube as a carrier, with a controllable sand filling environment inside (Figure 6b). Then, the injection of pure oil, the index calculation formula, and the state equation are further combined to evaluate the entire seepage process from multiple angles, effectively mitigating interference from heterogeneity, residual oil, and bound water. We focused more on the transition point and pre-breakthrough stage, precisely because carbon dioxide has not yet exerted its maximum extraction effect at this stage, and the relatively small extraction and integration effects offset each other. At the same time, observing the viscosity–temperature curve (Figure 7), the viscosity change in crude oil around 60 °C is not sensitive. Therefore, we believe that at approximately this stage, the seepage velocity is less affected by phase behavior and viscosity changes. We strictly followed the preset step sequence, strictly followed the standard operation in the experiment, and closely associated the seepage velocity with wax deposition at this stage. A relevant design is required before conducting CO2 displacement experiments with high-pour-point oil. This study establishes a rapid and accurate testing method system, providing crucial support for determining optimal experimental pressure conditions.
Figure 6.
Comparison diagram of elements between the long core carrier and slim tube carrier.
Figure 7.
Viscosity–temperature curve of test sample.
6. Conclusions
- (1)
- Based on the fluctuation characteristics of oil production index and injection index, the range of 17–20 MPa belongs to the stable fluctuation pressure range, while the range of 30–40 MPa belongs to the relatively severe fluctuation pressure range.
- (2)
- This experiment was conducted using homogeneous and waterless slim tubes as carriers. Throughout the entire process, we strictly followed industry standards to ensure the reliability of every step and link and tried to eliminate the influence of other factors (such as viscosity changes, phase behavior, experimental artifacts, etc.) to explore the flow characteristics. The flow velocity trend lines of supercritical CO2 under the conditions of 30 MPa, 35 MPa, and 40 MPa exhibit inflection points, indicating the occurrence of wax-solid deposition in the displacement system.
- (3)
- Under the condition of 40 MPa, the CO2 seepage velocity shows a significant upward trend in the later stage of the experiment, mainly due to the release-blockage effect of supercritical CO2. According to its strong penetrability and displacement expansion characteristics, CO2 can also undergo release-blockage under certain temperature and pressure conditions. It is certain that, at certain points, blockage and release-blockage phenomena occur together.
- (4)
- In the calculation of permeability, the flow of CO2 is related to Darcy’s law, and there is a positive correlation between the two corresponding parameters. The simulation of the permeability of supercritical CO2 under different pressure conditions shows a sudden upward trend after 0.4 PV at 40 MPa, indicating that the release-blockage effect impacts not only the flow velocity of CO2, but also the overall fluid flow capacity of the system.
- (5)
- With a slim tube as a carrier, the comprehensive evaluation model integrating the index formula and state equation achieves efficient and accurate data processing; based on slim tube testing, the test data is organically combined with state equations, index formulas, and Darcy’s law to fully understand the wax-solid deposition and release-blockage effect and propose optimization strategies, providing valuable guidance for oilfield gas-flooding production.
Funding
This work was supported by the National Natural Science Foundation of China [Grant numbers: 42202164], the Key Project for Cultivating Outstanding Young Teachers [Grant numbers: YQZD2023069] and the High Level Talent Research Launch Project [Grant numbers: WGKQ2022071].
Data Availability Statement
The original contributions presented in this study are included in the article. Further inquiries can be directed to the corresponding author.
Acknowledgments
I appreciate the Liaohe Oilfield Company of China National Petroleum Corporation for providing all related research samples and some of the geological data.
Conflicts of Interest
The author declares no conflicts of interest.
Nomenclature
| Fij | Binary interaction coefficient |
| Ii | Injectivity index (cm3/(MPa·min)) |
| Ip | Productivity index (cm3/(MPa·min)) |
| Vi | CO2 injection volume (cm3) |
| Vp | Oil mining volume (cm3) |
| αijr | Cross term function |
| Δp | Pressure difference (MPa) |
| τ | Comparison temperature |
| t | Displacement time (min) |
| x | Component mole fraction vector |
| δ | Contrast density |
Acronyms
| CO2 | Carbon dioxide |
| GOR | Gas oil ratio |
| MMP | Minimum miscibility pressure |
| PV | Pore volume |
| SC-CO2 | Supercritical carbon dioxide |
References
- Yu, P.; Zhang, S.Q. An Algorithm to Optimize Water Injection Temperature for Thermal Recovery of High Pour Point Oil. Petrophysics 2023, 64, 107–114. [Google Scholar] [CrossRef] [Scilit]
- Li, B.; Zhang, J.; Kang, X.; Wang, L.; Tang, E.G.; Zhou, W. Optimization of Oil Recovery and CO2 Sequestration in Tight Reservoirs During CO2 WAG Flooding with Hydraulic Fracture. Pet. Technol. 2022, 10, 81340. [Google Scholar] [CrossRef] [Scilit]
- Cui, M.; Lun, Z.; Wang, R.; Xiao, P. Experimental Research of the Characteristics of Microscopic Pore Production During CO2 Displacement in a Shale Oil Reservoir. J. Energy Eng. 2023, 149, 8. [Google Scholar] [CrossRef] [Scilit]
- Cheng, Y.; Qu, Y.; Cheng, X.; Ni, J.; Zhou, Z.; Lan, S.; Yang, Z.; Wei, L.; Wu, H.; Sun, W. Microscopic Mechanism of CO2 Displacement Oil in Different Pore Throat Radius Segments of Tight Sandstone Reservoirs. ACS Omega 2024, 9, 18. [Google Scholar] [CrossRef] [Scilit] [PubMed]
- Mathew, E.S.; Shaik, A.R.; Al-Sumaiti, A.; Alameri, W. Effect of Oil Presence on CO2 Foam Based Mobility Control in High Temperature High Salinity Carbonate Reservoirs. Energy Fuels 2018, 32, 2983–2992. [Google Scholar] [CrossRef] [Scilit]
- Wang, C.; Su, Y.; Wang, W.; Li, L.; Hao, Y. Experimental Study on Ethane-Dimethyl Ether Assisted CO2 Displacement to Improve Crude Oil Recovery in Tight Reservoirs. Energy Fuels 2024, 38, 9. [Google Scholar] [CrossRef] [Scilit]
- Shao, M.; Zhang, S.; Wu, B.; Fu, L.; Liao, K.; Chang, A.; Huang, B. Application and Research Progress of CO2 Foaming System for Oil Displacement in Oil and Gas Field Development: A Review and Prospect. J. Surfactants Deterg. 2025, 28, 1087–1104. [Google Scholar] [CrossRef] [Scilit]
- Pourafshary, P.; Taherkhani, M. Investigation of Pressure Pulse Distribution in Porous Media. J. Chem. Pet. Eng. 2012, 46, 41–52. [Google Scholar] [CrossRef] [Scilit]
- Fan, S.; Wang, X.; Dong, J.; You, Q.; Zhao, J. Research of Formation Protection Technology in Complex Fault Block Oilfield. In Proceedings of the International Petroleum Technology Conference, Beijing, China, 26–28 March 2019. [Google Scholar] [CrossRef] [Scilit]
- Cho, J.; Kim, T.H.; Lee, K.S. Compositional Modeling of Hybrid CO2 EOR with Intermediate Hydrocarbon Solvents to Analyze the Effect of Toluene on Asphaltene Deposition. J. Pet. Sci. Eng. 2016, 146, 940–948. [Google Scholar] [CrossRef] [Scilit]
- Pal, M.; Karaliūt, V.; Malik, S. Exploring the Potential of Carbon Capture, Utilization, and Storage in Baltic Sea Region Countries: A Review of CCUS Patents from 2000 to 2022. Processes 2023, 11, 605. [Google Scholar] [CrossRef] [Scilit]
- Wu, J.J.; Ansari, U. From CO2 Sequestration to Hydrogen Storage: Further Utilization of Depleted Gas Reservoirs. Reserv. Sci. 2025, 1, 19–35. [Google Scholar] [CrossRef] [Scilit]
- Yang, Z.L.; Yu, H.Y.; Chen, Z.W.; Cheng, S.Q.; Su, J.Z. A Compositional Model for CO2 Flooding Including CO2 Equilibria Between Water and Oil Using the Peng-Robinson Equation of State with the Wong-Sandler Mixing Rule. Pet. Sci. 2019, 4, 16. [Google Scholar] [CrossRef] [Scilit]
- Sun, Q.; Zhang, N.; Zhu, P.; Liu, W.; Guo, L.; Fu, S.; Bhusal, A.; Wang, S. Confined Fluid Interfacial Tension and Minimum Miscibility Pressure Prediction in Shale Nanopores. Fuel 2024, 364, 15. [Google Scholar] [CrossRef] [Scilit]
- Zhang, Z.; Bai, M.; Xu, L.; Du, S.; Liu, Y.; Yang, E.; Shan, J. Study on Oil Extraction Characteristics in Micropores of a Typical Terrestrial Shale Reservoir in China by CO2 Injection and Surfactant Imbibition. Energy Fuels 2024, 38, 11. [Google Scholar] [CrossRef] [Scilit]
- Ghamdi, B.N.A.; Tacha, C.P. Assessing Single EOS Predictability Using PVT Properties of a Wet-Gas Reservoir on a Compositional Simulator. In Proceedings of the SPE-Society of Petroleum Engineer Conference 2017, San Antonio, TX, USA, 9–11 October 2017. [Google Scholar] [CrossRef] [Scilit]
- Aly, H.; Sidra, C. Miscible CO2 Flooding for EOR in the Presence of Natural Gas Components in Displacing and Displaced Fluids. Energies 2018, 11, 391. [Google Scholar] [CrossRef] [Scilit]
- Medvedev, A.A.; Sadreev, E.A.; Ponomarenko, D.M.; Akhmerova, A.A.; Tkachev, I.V. Efficiency Estimation of Gas Injection at the Field of the Central Khoreyver Uplift with the Risk of Asphalt, Resin and Paraffin Deposits (Russian). Neft. Khozyaistvo 2023, 8, 5. [Google Scholar] [CrossRef] [Scilit]
- Verma, S.; Oakes, C.S.; Chugunov, N.; Ramakrishnan, T.S.; Hosseini, S.A.; Hovorka, S. Reservoir Fluid Monitoring in Carbon Dioxide Sequestration at Cranfield. Energy Procedia 2013, 37, 4344–4355. [Google Scholar] [CrossRef] [Scilit]
- Patel, M.J.; May, E.F.; Johns, M.L.; Lund, H.; Kaiser, M.J. High-Fidelity Reservoir Simulations of Enhanced Gas Recovery with Supercritical CO2. Energy 2016, 111, 548–559. [Google Scholar] [CrossRef] [Scilit]
- Achour, S.H.; Lawal, T.; Sheng, K.; Okuno, R. Thermodynamic Modeling of Aqueous Nanobubble Dispersion. SPE J. 2024, 29, 19. [Google Scholar] [CrossRef] [Scilit]
- Kunz, O.; Wagner, W. The GERG-2008 Wide-Range Equation of State for Natural Gases and Other Mixtures: An Expansion of GERG-2004. J. Chem. Eng. Data 2012, 57, 3032–3091. [Google Scholar] [CrossRef] [Scilit]
- Ahmad, M.; Gernert, J.; Wilbers, E. Effect of Impurities in Captured CO2 on Liquid-Vapor Equilibrium. Fluid Phase Equilibria 2014, 363, 149–155. [Google Scholar] [CrossRef] [Scilit]
- Varzandeh, F.; Stenby, E.H.; Yan, W. Comparison of GERG-2008 and Simpler EOS Models in Calculation of Phase Equilibrium and Physical Properties of Natural Gas Related Systems. Fluid Phase Equilibria 2017, 434, 21–43. [Google Scholar] [CrossRef] [Scilit]
- Chen, S.J.; Pan, Y.; Sun, L.; Si, Y.; Liang, F.; Gao, L. Mechanism of Enhanced Oil Recovery by CO2 Combination Flooding in Low Permeability and High Pour-Point Reservoir. Pet. Reserv. Eval. Dev. 2021, 11, 823–830. [Google Scholar] [CrossRef]
- Li, M.Y.; Liu, J.Y.; Xia, Y.F. Risk Prediction of Gas Hydrate Formation in the Wellbore and Subsea Gathering System of Deep-Water Turbidite Reservoirs: Case Analysis from the South China Sea. Reserv. Sci. 2025, 1, 52–72. [Google Scholar] [CrossRef] [Scilit]
- Yang, X.X. Highly Accurate PVTx Measurements on Supercritical CO2 Mixtures and the Analysis at the Vicinity of the Critical Point. Ph.D. Thesis, Tsinghua University, Beijing, China, 2015. [Google Scholar]
- Zhao, B.K. Density Characteristics of Multi-Component CO2/N2/CH4 Ternary Mixtures. Master’s Thesis, Dalian University of Technology, Dalian, China, 2022. [Google Scholar]
- Niu, Y.J.; Xie, X.Y.; Li, H.; Gao, X.X.; Feng, H.; Li, S.N.; Cao, J.H. Research of Impurity Components on the Decompression Plateau of CO2 based on the GERG equation of State. Pet. Tubul. Goods Instrum. 2024, 10, 61–65. [Google Scholar] [CrossRef]
- Yu, P. The Potential Blockage During CO2 Displacement in the High Pour Point Oil Reservoir. Pet. Sci. Technol. 2023, 41, 1574–1585. [Google Scholar] [CrossRef] [Scilit]
- Xu, Z.E.; Xin, W.M.; Liu, Y.; Rong, X.D.; Guan, L.; Wang, X.Y. Production Performance and Reservoir Damage Characteristics of CO2 Water-Alternating-Gas Injection After Continuous CO2 Injection for High Pour-Point Reservoir. Fault-Block Oil Gas Field 2019, 26, 613–616. [Google Scholar]

Disclaimer/Publisher’s Note: The statements, opinions and data contained in all publications are solely those of the individual author(s) and contributor(s) and not of MDPI and/or the editor(s). MDPI and/or the editor(s) disclaim responsibility for any injury to people or property resulting from any ideas, methods, instructions or products referred to in the content. |
© 2026 by the author. Licensee MDPI, Basel, Switzerland. This article is an open access article distributed under the terms and conditions of the Creative Commons Attribution (CC BY) license.