Abstract
The “Double High—Double Extra High” stage of offshore oilfields, where large pumps lift liquids, leads to a rapid rise in water concentration, which triggers a decrease in rock strength and exacerbates the risk of sand production; this leads to a blockage of the reservoir, thus restricting the release of production capacity. In this paper, for the typical weak cementation strength of unconsolidated sandstone of a Class I reservoir in the P oilfield, numerical simulation and indoor experimental methods are utilized to explore the plugging mechanism and law of the water-contenting conditions, with micro-sand and mud conditions, on the screen. Considering the combined effects of reservoir particulate transport plugging and near-well sand control media plugging, the additional pressure drop and skin factor calculation model is constructed, and a dynamic capacity prediction model for sand control wells is formed. By matching the physical properties of the target reservoir and optimizing the sand control method, the production capacity prediction model and the sand control optimization design method for the high water-content period of the unconsolidated sandstone reservoir are finally obtained. The results show that the median sand size of well A1 in the P oilfield Class I reservoir is 220 μm, the sand transportation diameter is about 15–20 m, the serious plugging area near the well is distributed in 2–2.5 m, and the predicted loss of production capacity is about 18%. The use of a foam metal screen can significantly reduce the plugging pressure and increase the flow of crude oil, which is 2.2 and 1.2 times higher than that of the precision mesh and pre-filled screen, respectively. These research results can provide technical support and theoretical guidance for the sustained, efficient, and stable production of sand reservoirs in the Bohai Oilfield.
1. Introduction
Offshore oilfields commonly adopt a development strategy characterized by a limited number of wells, high production rates, commingled production from multiple layers, and water flooding. Zhang Qilong et al. systematically summarized the development characteristics and patterns of such oilfields, including rapid water breakthrough, a rapid increase in water cut, and significant water production [1]. Fan Jiale et al. mechanistically investigated the underlying physical processes of formation particle (fines) initiation, migration, and plugging in unconsolidated sandstone reservoirs [2]. This strategy often leads reservoirs to enter a “high water-cut and extra-high production” stage. The resulting rapid rise in water cut, coupled with the water-induced weakening of rock strength, significantly exacerbates the risk of sand production [3,4,5]. The P oilfield is a typical weakly cemented unconsolidated sandstone reservoir, with fillers predominantly composed of clay minerals, exhibiting strong water sensitivity and velocity sensitivity, which further aggravates sand production and formation plugging issues during development [6,7,8]. After water breakthrough, increased fluid flow velocity causes weakly cemented particles to detach and migrate, resulting in pore throat blockage and reservoir damage, rapid decline in productivity, and serious constraints on efficient field development [9,10,11]. Sand production and fine particle migration in unconsolidated sandstone reservoirs are complex processes involving multiple coupled factors. Domestic and international scholars have conducted extensive research on their mechanisms, prediction, and control, focusing on key aspects such as the initiation conditions of particle migration, the influencing factors of migration behavior, the sand retention performance of sand control screens, and the optimization of productivity prediction models. Existing studies have explored critical parameters affecting particle migration and the structural design of sand control media, providing a foundation for understanding sand production and control mechanisms. However, although significant progress has been made in single-factor analysis or static sand control design, the dynamic plugging mechanism under multiphase flow conditions with high water cut and fine sand/mud content remains unclear, and the synergistic optimization of sand control measures and productivity prediction still requires further investigation.
To bridge this gap, this study presents a comprehensive investigation targeting the specific mechanisms of sand production and fines migration in offshore unconsolidated sandstone reservoirs during the high water-cut period. The novelty of this research lies in its focused examination of the synergistic effects of high water cut and high flow velocity on the mobilization of clay fines—a factor critically important yet often underestimated in existing models.
The reservoirs in the P oilfield can be classified into three categories. Among them, Class I reservoirs are characterized by great thickness, good physical properties, and continuity, accounting for 46% of the total reserves. These reservoirs generally have single-layer thickness greater than 5 m, sand-to-shale ratio above 0.30, porosity exceeding 26%, permeability over 500 mD, clay content ≤ 15%, and a flow coefficient above 200 mD·m/(mPa·s), demonstrating excellent storage and flow capacity [12]. This paper focuses on Class I reservoirs in the P oilfield, exploring the following: (1) the mechanisms and governing laws of particle transport under high-water-cut conditions; (2) the optimization of strategies to control sand and fines migration; and (3) the development of robust, long-term stable production measures for sand-prone wells. Furthermore, we investigate the performance of sand control screens under conditions of high water cut and low sand/mud content. The findings from this research are expected to provide a more accurate scientific basis for optimizing sand control parameters, ensuring their adaptability to actual downhole conditions. Ultimately, this study aims to enhance the reliability of sand management and productivity improvement strategies, thereby providing crucial technical support for the sustained, efficient, and stable production of weakly cemented, sand-prone reservoirs like the P oilfield.
2. Capacity Prediction Model for High Water Content Period in Unconsolidated Sand Reservoirs
In this paper, we carry out indoor simulation experiments to study the clogging mechanism and experiments of screen mud and sand transport under high water content and micro mud and sand conditions. By exploring the clogging mechanism, we establish a capacity prediction model for anti-sand media clogging and near-well reservoir clogging, correct the model, and finally establish a capacity prediction model for the high water-bearing period of unconsolidated sand reservoirs.
2.1. Experimental Program and Methodology
Experimental setup and methods: In order to simulate the transport blockage process of formation fluid carrying formation sand and intruding into the screen and gravel, a comprehensive sand prevention and replacement simulation and evaluation visualization experimental platform is used to visualize most of the sand-blocking and transport process. The flow chart is shown in Figure 1, and the physical figure is shown in Figure 2. The radial flow replacement simulation experiment device consists of the main body radial replacement device, liquid storage and mixing tank, sand collector, sand slurry pump, data acquisition sensor, control system, and so on. The main radial displacement device is the core component, with an inner diameter of 300 mm and a height of 250 mm, capable of accommodating short sections of sieve pipe with an outer diameter of 90–250 mm and a length of 245–248 mm [12,13,14,15,16,17]. The short section of the screen is placed in the center of the container and then closed at both ends to ensure that the sand-carrying fluid enters the screen from the side through the sand-blocking layer; the experimental fluid carries the formation sand from the six inlet ports distributed on the outer cylinder of the device into the container, which impacts the screen directly to simulate the sand discharge and the sand-blocking process at the bottom of the actual wells. During the experiment, the differential pressure through the screen is measured by 2–4 pairs of differential pressure sensors set inside and outside the screen at the bottom of the vessel and is collected in real time by a computer [18,19,20].
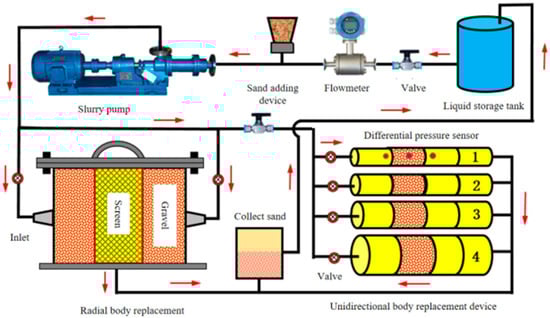
Figure 1.
Flow chart of the visualization experiment platform for simulation and evaluation of integrated sand prevention and drive replacement.
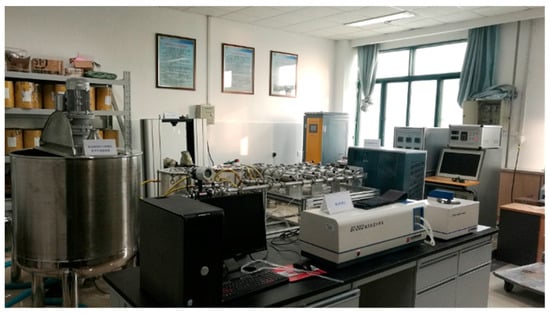
Figure 2.
Comprehensive sand control replacement simulation and evaluation visualization experimental platform.
In the process of preparing experimental materials, the screen stubs used in the experiment should be completely consistent with the actual screens used in the field in terms of parameters such as structure and diameter (except for screen length); the experimental sand configured for the experiment should be as consistent as possible with the produced sand from the original formation in terms of parameters such as median particle size and mud content. In terms of setting experimental conditions, the displacement rate should be aligned with actual production conditions, and the flow rate should be converted equivalently based on the production rate of actual production wells, while considering the impact caused by flow rate concentration; the concentration of sand-carrying fluid should be calculated mainly with reference to the sand content in the produced fluid of oil wells [21,22].
2.1.1. Experimental Conditions and Materials
The experiment is implemented under room temperature conditions (20 °C), the replacement fluid is water, the pipeline outlet pressure are atmospheric pressure 0.101325 MPa, and the actual pressure depends on the experimental displacement and the degree of blockage of sand-blocking media and flow resistance. The experiment is run according to the target reservoir parameters configuration of formation sand, mud content, composition ratio strict compounding, compounding sand samples, and a core sand grain size distribution curve compliance rate > 95%.
The experiment analyzes the dissociated original formation sand and measures the particle size before compounding the simulated sand [12,13]. The semi-logarithmic cumulative mass distribution curve comparison of the two is shown in Figure 3; the compounded sand has a higher degree of conformity and is able to initially simulate the grain size characteristics of the real formation core sand.
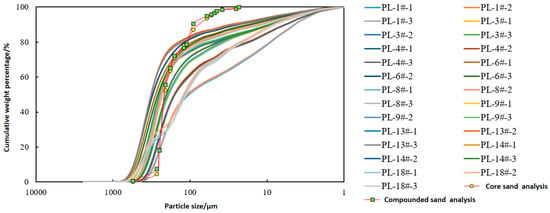
Figure 3.
Core/composite sand semi-logarithmic cumulative mass distribution curve.
In Figure 3, the curve marked with yellow dots represents the particle size curve of the compounded experimental sand sample used in the experiment, while the other curves represent the particle size curves obtained from testing multiple original formation samples.
The experimental test screens included a precision mesh screen, foam metal (nickel) screen, and gravel pre-filled screen. The screen short section sample types are specified in Table 1 and Figure 4.

Table 1.
Summary of screen type and accuracy comparison results.
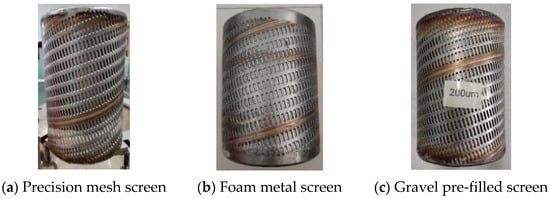
Figure 4.
Example samples of different types of sand control screen.
The experiments set the experimental fluid formulation and flow conditions according to the parameters of the target well’s fluid production, flow rate, and fluid physical properties.
2.1.2. Experimental Scheme
Regarding the planning of experiments for 38 groups, including 22 groups of sediment clogging experiments, 9 groups of screen clogging experiments, 7 groups of gravel clogging law experiments, and 6 groups of screen and gravel layer clogging mechanism analysis experiments, the specific arrangement is shown in Table 2.
Table 2.
Experimental arrangement of clogging mechanism and law of screen and gravel layer.
2.2. Experimental Process and Phenomena
In the unidirectional flow replacement simulation device in the short section of the high-density filling gravel particles, the initial end face and filling effect is shown in Figure 5. The experimental conditions include a liquid flow rate of 1.2 m3/h, liquid sand content rate of 1‰, median sand grain diameter of compound stratum of 220 μm, and ceramic grain filling compactness ≥ 98%.
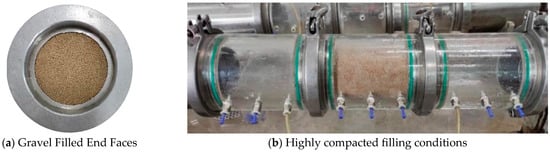
Figure 5.
Effect of gravel filling.
After the clogging equilibrium, the main unit of unidirectional flow replacement was disassembled, and the clogging pattern of the gravel layer was analyzed. As shown in Figure 6a, a large amount of silt particles were retained at the end face of the gravel layer; after removing the surface silt, the amount of silt retained decreased substantially after 5 mm from the end face of the gravel layer, and with the increase in the depth of the gravel layer, the amount of silt particles retained decreased gradually, as shown in Figure 6b–d.
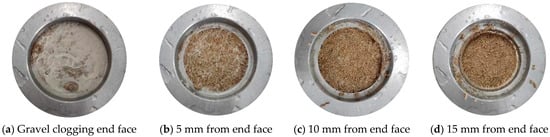
Figure 6.
Clogging of sediment particles at different depths in the gravel layer.
The liquid-phase carrying compound of the sand impact gravel layer, part of the fine and medium-quality particles in the mud sand, smoothly moves through the gravel layer surface and into the gravel layer deep inside, in which the larger particles are easily captured by the complex pore throat formed by the gravel, substantially reducing the diameter of the circulation pore. Fine components of the small part of the gravel layer can be successfully passed through the output of the small part of the gravel layer; most of the particles are narrowed down to the pore throat and are captured to form medium particles–fine particles of gravel of the graded bridge-clogging process.
At the same time, the coarse particles in the mud and sand cannot enter the internal pore throat of the gravel layer smoothly but are blocked on the surface of the gravel layer, which also plays a role in reducing the diameter of the flow channel, further clogging the mud and sand in the medium- and fine-particle screen to form a mixture of coarse, medium, and fine particles from the sorting of the bridge-clogging process.
After the formation of multi-level bridge clogging inside and on the surface of the gravel layer, respectively, the clogging process tends to stabilize. Under stable production conditions, the fluid passes through the 3-level bridge-clogging zone outside the gravel layer and the mixed clogging zone formed by the gravel layer and formation sand successively; then, it enters the wellbore through the screen. When the production conditions change, the original stable bridging structure may be damaged; along with the re-arrangement of the gravel layer, a new round of intra-layer bridging and extra-layer bridging is formed again.
Based on the short section simulation results, it can be seen that the sediment retention decreases with the increase in gravel layer depth. The process of screen clogging is similar to that of the gravel layer, and the phenomenon is shown in Figure 7, which shows that there exists a dynamic process of bridge clogging and sediment particle transportation. Mud sand easily forms mud sand deposits on the outside and bottom of the screen. Therefore, when the well is out of sand for a long time, the problem of sand burial may arise.

Figure 7.
Clogging pattern and sand deposition phenomenon outside the screen.
2.3. Analysis of Experimental Results
2.3.1. Mechanism of Clogging of Sand Control Screen
According to the experimental phenomenon and law of high water content and micro sand and mud conditions, the experiment analyzes the sand-blocking and clogging mechanism of two kinds of mud and sand in the independent screen, and its principle is shown in Figure 8.
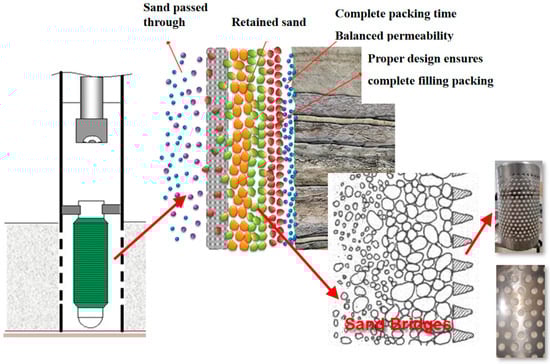
Figure 8.
Schematic diagram of screen clogging mechanism.
The mechanism of the screen’s external space-sorting bridge-filling blockage is to extend from the screen to the outside; the blocked particles become smaller and smaller in size, and their permeability drops lower and lower, which increases the flow resistance and causes the oil well to reduce production. The mechanism of clogging the bridge inside the sand-blocking medium of the screen is that the fine solid-phase particles enter into the sand-blocking porous medium; the irregularity and non-homogeneity of the pores of the sand-blocking medium make it difficult to discharge the solid-phase particles that enter into the sand-blocking medium, which are retained inside the sand-blocking medium, resulting in the reduction in permeability of the mechanical screen and the formation of a clog.
2.3.2. Mechanism of Gravel Filling Blockage
According to the experimental phenomenon and law of high water content and slight sand and mud content working conditions, the mechanism of a gravel filling sand blockage and its influence on production capacity is analyzed, and the principle is shown in Figure 9.
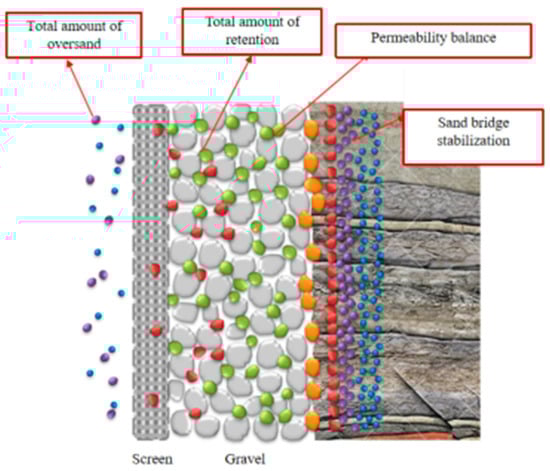
Figure 9.
Gravel-filled plugging mechanism.
From the mechanism analysis, it can be seen that the mechanism of sand intrusion and plugging in the gravel-filled layer of loose formation is that the formation sand intrudes into the fracture and is transported and plugged in the direction of the wellbore at a high flow rate, resulting in a permeability injury, which in turn affects the production capacity.
The productivity prediction model for sand control medium clogging and near-well reservoir clogging needs to focus on two mechanisms simultaneously: reservoir particle migration clogging and near-well sand control medium clogging. It is necessary to first construct the additional pressure drop and skin factor calculation models to characterize the degree of influence of particle migration on well fluid production and finally establish the productivity impact prediction model and methodology system for sand control wells. And the additional pressure drop is calculated in Equations (1) and (2).
Prediction of velocity-sensitive critical flow rate under water saturation conditions:
A particle detachment index is proposed as follows [14,15]:
where is particle detachment index (dimensionless), a quantitative indicator characterizing particle detachment conditions; is conversion coefficient; is fluid velocity (m/s); is fluid viscosity (Pa·s); is cementation/cohesive strength of reservoir rock (MPa); and is particle diameter (mm).
Based on velocity sensitivity tests conducted during the early development stage of the reservoir, the critical particle detachment index is determined as follows:
where S0 is initial cementation/cohesive strength of the reservoir (MPa); vfc0 is critical velocity-sensitive flow rate obtained from early-stage experiments (m/s); and μf0 is fluid viscosity used in the early-stage critical velocity experiment (Pa·s).
Model for analyzing the radius of particle migration and plugging:
Under increasing water saturation during production, the critical flow rate for particle migration (velocity sensitivity) in the reservoir is given by the following:
where μf1 is fluid viscosity of the reservoir (Pa·s); is the ratio of rock strength after water saturation increase to original rock strength. This parameter is determined experimentally. For typical medium-to-high-permeability unconsolidated sandstone reservoirs, generally ranges from 0.45 to 0.75.
Given well production conditions, the fluid velocity at a radial distance r from the wellbore center in the near-well reservoir is as follows [15]:
where is the bottomhole volumetric liquid production rate (m3/s); is reservoir porosity (dimensionless); r is radial distance from wellbore center (m); h is reservoir thickness (m); and v is fluid velocity at radius r (m/s).
The maximum radius of the particle migration zone is presented as follows [15].
Skin factor model within the particle migration and plugging radius:
The reservoir is discretized radially into N concentric cylindrical grid cells. The outer radius of the N-th cell corresponds to the boundary of the particle migration zone, calculated via Equation (5), while the inner radius of the first cell equals the wellbore radius (rw). The radial increment per grid cell is Δr = 0.1∼0.12 m.
The additional skin factor for the i-th grid cell is [15,16,17].
where sd(i), kd(i), rd(i) are additional skin factor, permeability (μm2), and outer radius (m) of the i-th grid cell, respectively; is turbulent flow coefficient; is reservoir fluid density (kg/m3); and is reservoir fluid viscosity (Pa·s).
The total skin factor accounting for both sand control media clogging and near-well reservoir plugging is calculated using Equation (7):
The pressure drop across the gravel pack consists of laminar and turbulent components, as described by Equations (8) and (9) [20]:
where is laminar-flow pressure drop in the gravel pack (MPa); is turbulent flow pressure drop in the gravel pack (MPa); is liquid production rate (m3/d); is fluid viscosity (mPa·s); is permeability of the gravel pack (mD); h is effective thickness of the packed zone (m); B is oil formation volume factor (m3/m3); re is drainage radius (m); rw is wellbore radius (m); ρ is fluid density (kg/m3); and βs turbulence coefficient (m − 1).
The skin factor was calculated as in Equations (10) and (11) [14]:
where is laminar-flow skin factor of the gravel pack (dimensionless); is turbulent flow skin factor of the gravel pack (dimensionless); and is reservoir permeability (D).
The skin factor of the gravel pack is given in Equation (12):
The gravel-filled shot hole orifice pressure drop and skin were calculated as in Equations (13)–(16) [21]:
where is laminar-flow pressure drop across the gravel pack within the perforation tunnel (MPa); is turbulent-flow pressure drop across the gravel pack within the perforation tunnel (MPa); is permeability of the gravel pack inside the perforation tunnel (mD); hp is thickness of the gravel pack in the perforation tunnel (m); SD is skin factor due to gravel packing within the perforation tunnel (dimensionless); rp is radius of the perforation tunnel (m); and is length of the perforation tunnel (m).
where is the laminar-flow skin factor of the gravel pack within the perforation tunnel (dimensionless); is the turbulent-flow skin factor of the gravel pack within the perforation tunnel (dimensionless); is the reservoir permeability (D).
The skin factor of the gravel pack within the perforation tunnel is given by Equation (17):
The capacity evaluation is calculated as in Equation (18):
where is the productivity ratio (dimensionless); is the productivity index accounting for clogging effects in both the sand control media and the near-well reservoir is the original reservoir productivity index (m3/(d·MPa)); S is the total skin factor induced by drilling (dimensionless); is the skin factor of the gravel pack within the perforation tunnel (dimensionless); is the skin factor of the main gravel pack (dimensionless); and is the additional skin factor due to combined clogging in the sand control media and the near-well reservoir (dimensionless).
Using the sand control well capacity evaluation method to predict and analyze the post-commissioning dynamic capacity of wells with high water content and slight sand and mud conditions in P oilfield, we analyze and compare them using the actual production dynamic data to reveal the main controlling factors of the capacity and to optimize the construction parameters.
This study constructed a model for predicting the dynamic permeability of formation sand intrusion plugging after the mechanical screen and gravel filling of unconsolidated sand reservoir is put into production and established a basic relationship model between the plugging permeability ratio and GSR, mud content, fluid viscous velocity index, closure pressure, and fracture slit width to predict the change in the dynamic permeability and inflow capacity.
The infiltration rate of gravel natural accumulation is calculated as in Equation (19):
where is the permeability of naturally packed gravel (D); D50 is the median grain size of the gravel (mm).
Kr was calculated from the experimentally fitted model.
where is the permeability reduction ratio for gravel with grain sizes ranging from 0.4 to 0.8 mm (dimensionless); is the permeability reduction ratio for gravel with grain sizes ranging from 0.6 to 1.2 mm (dimensionless); and P is the confining pressure applied on the gravel pack (MPa) [12].
where is the plugging equilibrium time (h); is the volume of the gravel pack (m3); is the porosity of naturally packed gravel (%); is the compressibility coefficient of the gravel (dimensionless); and is the volume fraction of formation sand capable of invading the gravel pack relative to the total produced sand (%).
where is the comprehensive plugging coefficient (dimensionless); is the weighting factor for the gravel-to-formation-sand median grain size ratio (dimensionless); is the gravel-to-formation-sand median grain size ratio (dimensionless); is the weighting factor for the clay content effect on plugging (dimensionless); is the clay content plugging influence coefficient (dimensionless); is the weighting factor for the fluid viscosity–velocity effect (dimensionless); and is the fluid viscosity–velocity plugging influence coefficient (dimensionless) [12].
where is the dynamic plugging permeability ratio (dimensionless); is the minimum plugging permeability ratio at equilibrium (dimensionless); and t is time (h).
where μf, GSR, VCL are experimental data obtained under actual production conditions; μ*f, G*SR, V*CL are the characteristic (reference) values used in the fitting correlation; and Buf, BWSR, BVCL are the corresponding fitting exponents. The recommended characteristic values (XUf, XGSR, XVCL) and corresponding fitting exponents are 7.0 and 0.25, 25% and 0.35, and 500 and 0.20 mPa·s, respectively.
According to the characteristics of the screen and gravel filling process of shot hole directional wells, this study constructed a model for calculating the skin coefficient in each region of sand control completions, which is used to calculate the sand control skin coefficient and the production capacity ratio and support the dynamic production capacity evaluation. The pressure drop and skin calculation of drilling in the contaminated zone in the stratum outside the screen is shown in Equations (1)–(4):
The capacity model constructed above mainly considers the influence of two aspects: on the one hand, the reservoir permeability injury within the near-well transport range caused by reservoir particle transport after the reservoir reaches the particle condition; on the other hand, the wellbore and the near-well sand control media clogging due to the formation particle transport.
3. Experimental Results
3.1. Plugging Mechanism and Law Experimental Results
The experimental results of the three kinds of screen were investigated for their sand control ability and anti-clogging ability as follows.
3.1.1. Precision Mesh Screen
The experiment uses 150 μm, 200 μm, and 300 μm precision mesh screens, the liquid flow rate is 1.2 m3/h, and the median size of sand in the sand control accuracy is 220 μm. The experimental pressure and permeability curves are shown in Figure 10.
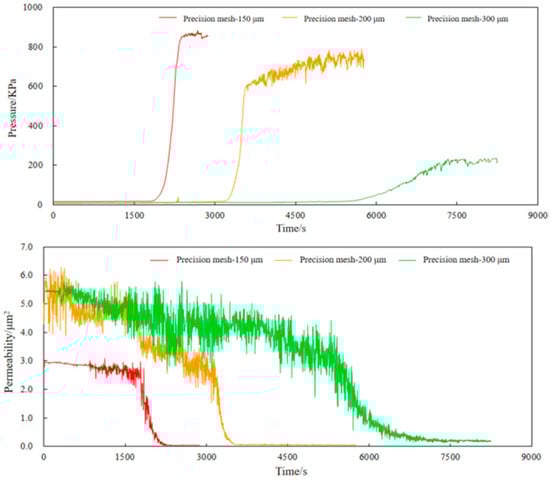
Figure 10.
Pressure and permeability change curves of different precision mesh screens.
From Figure 10, it can be found that the performance of precision mesh screens with different precision varies greatly, and as the precision decreases, the initial permeability of the screen decreases; the clogging speed is fast, the degree of clogging is high, and the time required to reach the clogging equilibrium is shorter. The initial permeability of 150 μm, 200 μm, and 300 μm precision mesh cloth screens was analyzed to be 2.943 μm2, 5.3148 μm2, and 5.451 μm2, respectively. The clogging permeability was 0.0615, 0.0697, and 0.2735, respectively, and the equilibrium permeability was 0.0454 μm2, 0.054 μm2, and 0.1877 μm2, respectively.
The sand-retaining medium of precision mesh screens is formed by overlapping and winding multiple layers of metal filter meshes, and the mesh diameter of the metal mesh is one of the key factors determining screen precision. Screens with higher precision (larger mesh diameter) allow the passage of formation sand particles with larger sizes, thus exhibiting better flow performance. In contrast, screens with lower precision can block more fine particles, leading to more severe clogging of the medium and lower permeability of the medium.
The output sand was collected during the experiment, and the sand retention rate is shown in Figure 11.
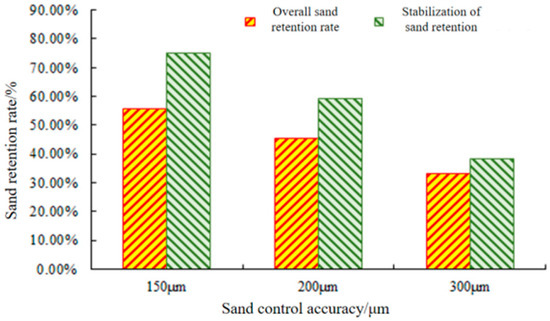
Figure 11.
Sand retention rate of different precision mesh screen and sand retention rate of stabilized sand retention layer.
As shown in Figure 11, the overall sand retention rates of 150 μm, 200 μm, and 300 μm precision mesh screens during the experiment were 55.67%, 45.43%, and 33.17%, and the sand retention rate of the stabilized sand retention layer formed by the mud and sand and the screen at the late stage of clogging was 75.12%, 59.24%, and 38.24%. With the decrease in precision, the sand-retaining capacity of the screen is gradually improved, and the overall sand retaining rate increases by 10–12% for every reduction in one grade of precision.
Generally speaking, the anti-clogging performance of the screen in the early stage of production under the experimental conditions is the best with the 200 μm screen, which is 35% and 23% higher than that of the 150 μm and 300 μm screens, respectively. Due to the weak sand-blocking ability of the 300 μm screen, the degree of clogging is low, so the accuracy of the screen circulation performance is strong, followed by the 200 μm screen. Sand blocking performance indicators with precision show that the 200 μm screen is lower than 150 μm screen 23% and the 200 μm screen is higher than 300 μm screen 27%.
3.1.2. Foam Metal Screen
The experiments were carried out using 100 μm, 200 μm, and 300 μm foam metal screens, with a liquid flow rate of 1.2 m3/h and a median grain size of 220 μm for the compounded stratum sand. The experimental pressure and permeability curves are shown in Figure 12.
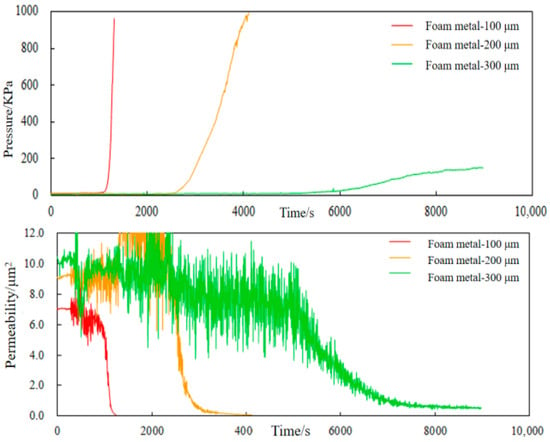
Figure 12.
Pressure and permeability change curves of foam metal screen with different accuracy.
From Figure 12, it can be seen that the performance of precision mesh screens with different precision varies greatly with the decrease in precision; the initial permeability of the screen decreases, the clogging speed is fast, and the clogging degree is high. Among them, the 100 μm foam metal screen pressure rise speed is extremely fast; the liquid level rise stage time period, the liquid level flooded screen, and clogging are extremely serious. The pressure rises rapidly but does not form a stable clogging equilibrium stage. Analysis results were obtained: 100 μm, 200 μm, and 300 μm precision mesh screen tube initial permeabilities were 7.0317 μm2, 9.1278 μm2, and 10.1559 μm2; clogging permeabilities were 0.0854 μm2, 0.2465 μm2, and 0.8103 μm2; and equilibrium permeabilities were 0.066 μm2, 0.061 μm2, and 0.5380 μm2, respectively.
The sand-retaining medium of foam metal screens is made of a special material called metal foam. Metal foam is characterized by a ”honeycomb-like” structure and high initial porosity, which enables it to accommodate more formation sand particles. Consistent with the rule applicable to precision mesh screens, foam metal materials with higher precision have larger flow channel diameters, allowing medium and fine particles to pass through; however, screens with lower precision still form clogs rapidly.
The output sand was collected during the experiment, and the sand retention rate is shown in Figure 13.
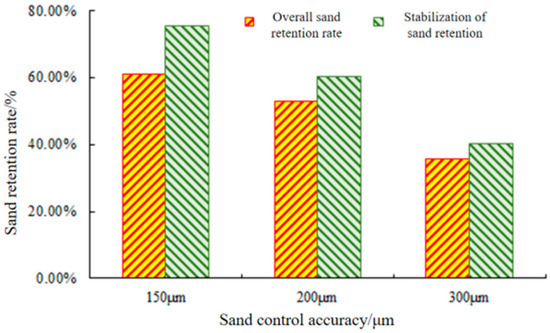
Figure 13.
Sand retention rate of foam metal screen with different accuracy, and sand retention rate of stabilized sand retention layer.
As shown in Figure 13, the overall sand-blocking rates of 150 μm, 200 μm, and 300 μm foam metal screens are 61.04%, 52.72%, and 35.74%, and the sand-blocking rates of the stable sand-blocking layer formed by the mud and sand and screen at the late stage of clogging are 75.42%, 60.27%, and 40.25%.
In general, the screen sand-blocking performance of the foam metal screens under the experimental conditions changes with the precision more obviously changed, and with the increase in precision, decreases significantly. The circulation and anti-clogging ability increases significantly under each precision. With every increase in the precision of the screen, the circulation and anti-clogging performance increase by 5.8% and 10.4%, respectively, and the sand-blocking performance decreases by about 12.7%. For 220 μm stratum sand, the 200 μm screen has better circulation performance while ensuring stronger sand-blocking ability, and its comprehensive sand prevention performance is higher than that of the 100 μm and 300 μm screens by 1.3% and 16.77%, respectively.
3.1.3. Gravel Pre-Filled Screen
The experiments used 150 μm, 200 μm, and 300 μm gravel pre-filled screens, with a liquid flow rate of 1.2 m3/h; the median diameter of the compound formation sand was 220 μm. The experimental pressure and permeability curves are shown in Figure 14.
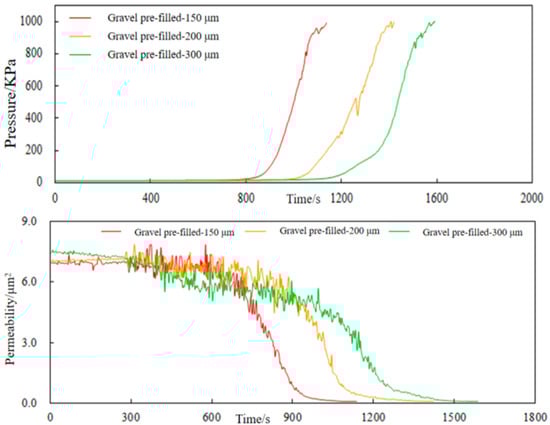
Figure 14.
Variation curves of pressure and permeability of pre-filled screen with different accuracy of gravel.
From Figure 14, it can be seen that the clogging law of a gravel pre-filled screen with precision mesh and foam metal has some differences. Three kinds of precision screens, with relatively similar precision enlargement and mud and sand clogging speed, are in the sand at the beginning of a relatively short period of time to form a serious clog; however, the clog accelerated the turning point of the rapid rise in pressure with the precision enlargement and then delayed it. The initial permeability of each precision ceramic pre-filled screen is similar: all are 7–7.5 μm2. Tubes with 100 μm, 200 μm, and 300 μm precision mesh sieves were analyzed. The initial permeabilities were 6.9516 μm2, 7.0604 μm2, and 7.4448 μm2; the clogging permeabilities were 0.2041 μm2, 0.2823 μm2, and 0.3211 μm2; the equilibrium permeabilities were 0.2041 μm2, 0.2823 μm2, and 0.3211 μm2; and the plugging permeabilities were 0.2041 μm2, 0.3212 μm2, and 0.3212 μm2, respectively. Equilibrium permeabilities waere 0.062 μm2, 0.0674 μm2, and 0.0695 μm2, respectively.
The sand-retaining medium of gravel pre-filled screens is formed by gravel filling, which is similar to the gravel filling working condition. The pore throat structure formed by gravel filling is relatively complex, but the overall rule remains that as the particle size decreases, the diameter of the connected pore throats also decreases. Controlled by this rule, smaller gravel particles result in faster clogging, and the permeability after final clogging is lower.
The production sand was collected during the experiment, and the sand retention rate is shown in Figure 15.
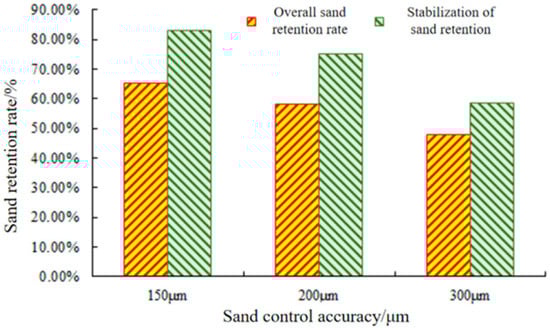
Figure 15.
Sand retention rate of gravel pre-filled screen with different accuracy and sand retention rates of stabilized sand retention layer.
As shown in Figure 15, the overall sand retention rates of 150 μm, 200 μm, and 300 μm precision foam metal screens ire 65.14%, 58.34%, and 47.97%, and the sand retention rates of the stabilized sand retention layer formed by the mud and the screen at the late stage of clogging are 82.96%, 75.33%, and 58.64%. Compared with the precision mesh screen and the foam metal screen, the gravel pre-filled screen has a stronger sand retention ability than the two screens; the overall sand retention rate is increased by 21.70% and 20.44%, and the stabilized layer is increased by 12.81% and 18.90%, respectively. Compared with the precision mesh and foam metal screens, the ceramic pre-filled screen has a stronger clogging ability, and the overall sand retention rate of the two screens is increased by 21.70% and 20.44%; the sand retention rate of the stabilized layer is increased by 12.81% and 18.90%, respectively. The pre-filled screen with different precision formed a serious clog in a short period of time after commissioning.
Overall, under the experimental conditions for 220 μm formation sand, the three types of screens exhibit similar ability to allow sand-carrying fluid to pass through the medium layer, i.e., their circulation ability is comparable. The difference in comprehensive sand control performance between the 150 μm and 200 μm screens is extremely small, and a reasonable selection can be made based on the requirements for sand-blocking and anti-clogging performance.
To summarize the three types of sand screens, for 220 μm formation sand conditions, foam metal screen have stronger circulation, 2.2 and 1.2 times as much as the precision mesh and pre-filled screens, respectively; precision mesh screens have the best anti-clogging performance, being higher than the foam metal and pre-filled screens by 38.0% and 33.7%, respectively. Pre-filled screens have stronger anti-sand performance, higher than the precision mesh and foam metal screens by 27.7% and 14.7%, respectively, but its clogging speed is faster. A comprehensive comparison shows that the circulation of the foam metal screen is better, and the circulation of the pre-filled and mesh screens is similar. The 200 μm precision screen has a more balanced sand-blocking and circulation ability and better applicability, so the foam metal screen has been chosen for the subsequent capacity calculation.
3.2. Calculation of Capacity Impact
Based on the constructed particle transport capacity prediction model for high water and slightly muddy sand conditions, fluid viscosity, average flow rate, outflow particle volume, permeability loss ratio, and additional skin and capacity loss distribution images under production conditions were simulated using the particle transport simulation method using the drilling and completion base information of the A1 and A2 well in the P oilfield. The base data are summarized in Table 3.
Table 3.
Basic information.
The model utilizes the above-mentioned base parameters to calculate the comparative fluid viscosity, average flow rate, outflow particle volume, permeability loss ratio, and additional skin and capacity loss. Calculating the permeability ratio over the range of particle transport under production conditions yields the distribution images shown in Figure 16 and Figure 17.
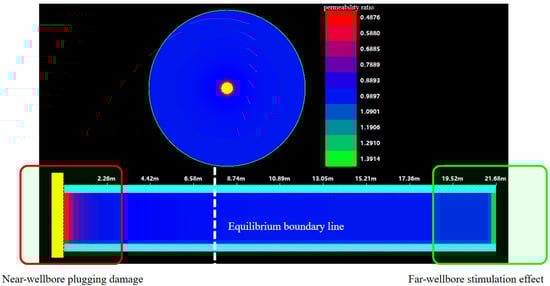
Figure 16.
Well A1 permeability ratio distribution image.
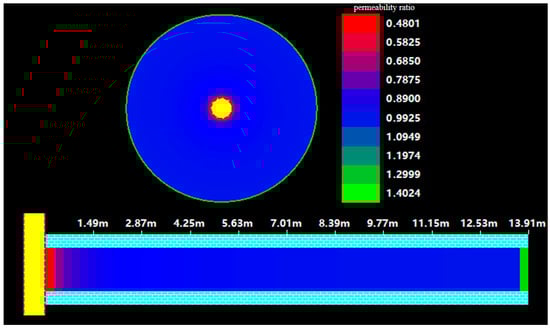
Figure 17.
Well A2 permeability ratio distribution image.
As can be seen from Figure 16, the initiation range of particulate transport in the A1 well is about 15–20 m, the radius of the plugging area is 6–7 m, and the severe plugging area is 2–2.5 m, which affects the production capacity by about 18%. The additional skin essentially does not change after more than 2 m near the well, indicating that the blockage in the range of 1–2 m near the well has the most serious effect on the fluid production. The water saturation increases, the critical flow rate for particle transportation decreases, the transportation range expands, and the transportation range exceeds 20 m when the water saturation exceeds 75%.
Similarly, the severe plugging range of well A2 is within 1.5 m, and reservoir permeability damage occurs at approximately 4–6 m. During the overall migration process, the near-wellbore additional pressure drop is 0.85 MPa, with a productivity loss of nearly 20%.
4. Conclusions
(1) The particle transport simulation and production capacity prediction model shows that the radius of particle transport initiation in the Class I reservoir of the P Oilfield is about 15–20 m, and the serious blockage area near the well is distributed in 2–2.5 m, resulting in an overall production capacity loss of about 18%. The additional skin formed by the particle transport plugging essentially changes very little after exceeding 2 m.
(2) The results of the sand control screen experiment show that for 220 μm formation sand conditions, the circulation of the foam metal screen is stronger than that of the precision mesh screen and pre-filled screen, which are 2.2 and 1.2 times higher than that of the precision mesh screen and pre-filled screen, respectively.
(3) The results of the anti-clogging experiments show that the precision mesh screen has the best anti-clogging performance, which is higher than the foam metal and pre-filled screens by 38.0% and 33.7% respectively; the pre-filled screen has stronger anti-sand performance, which is higher than the precision mesh and foam metal screens by 27.7% and 14.7%, respectively, but its clogging speed is faster. A comprehensive comparison of the overall experiment shows that the foam metal screen’s circulation is better.
Author Contributions
This manuscript was written through contributions of all authors. All authors have given approval to the final version of the manuscript. The authors J.L., C.D., B.C., M.S., and S.Z. contributed equally. All authors have read and agreed to the published version of the manuscript.
Funding
This research is financially supported by the National Natural Science Foundation of China (Grant No. 52474065), the National Science and Technology Major Projects of China (2024ZD1403800), the National Key Research & Development Program (2023YFC2811005), and Tianjin Branch, CNOOC, China.
Data Availability Statement
The data that support the findings of this study are available from the author, Jin Li.
Conflicts of Interest
Authors Jin Li Shuai Zhang, Bin Chen and Mengying Sun were employed by the company CNOOC China Limited Tianjin Branch. The remaining authors declare that the research was conducted in the absence of any commercial or financial relationships that could be construed as a potential conflict of interest.
References
- Zhang, Q.; Zhang, X.; Wang, X.; Gong, N.; Li, J.; Wang, F. Analysis of Water Production Law and Water Control Suggestions for High Water-cut Oilfields in Bohai Sea. Energy Environ. Prot. 2023, 45, 123–127+134. [Google Scholar] [CrossRef]
- Fan, J.; Hou, Y.; Cai, H.; Liu, B.; Xu, W. Mechanism of Fine Particle Migration in Unconsolidated Sandstone Reservoirs. J. Chongqing Univ. Sci. Technol. 2023, 25, 33–39. [Google Scholar] [CrossRef]
- Gao, Z.; Zhou, R.; Ouyang, Y.; Zhang, Y.; Li, Q.; Zhao, Y.; Wang, F. Analysis of Influencing Factors of Natural Decline Rate and Liquid Lifting Effect in Ultra-high Water-cut Period of Bohai Q Oilfield. Pet. Ind. Tech. Superv. 2023, 39, 12–16. [Google Scholar] [CrossRef]
- Tchistiakov, A.A.; Kottsova, A.K.; Shvalyuk, E.V.; Zitha, P.L.J. Physico-Chemical Factors of Clay Particle Migration and Formation Damage. Mosc. Univ. Geol. Bull. 2022, 77, 552–558. [Google Scholar] [CrossRef]
- Liu, C.; Hou, Y.; Li, S.; Fan, J.; Liu, S. Quantitative Judgment Method for Fine Particle Migration Damage in Unconsolidated Sandstone Reservoirs. J. Beijing Inst. Petrochem. Technol. 2023, 31, 16–20. [Google Scholar] [CrossRef]
- Zhang, J.; An, Y.; Li, Y.; Wang, G.; Liu, J. A Numerical Simulation Characterization Method for the Influence of Fine Particle Migration on Well Liquid Production Law. Complex Oil Gas Reserv. 2023, 16, 191–194. [Google Scholar] [CrossRef]
- Yun, J.; Tang, H.; Wang, Z.; Hung, L. Analysis of Grain Size and Reservoir Characteristics of Guantao Formation in Penglai 19-3 Oilfield. Petrochem. Technol. 2023, 30, 38–40. [Google Scholar]
- Gao, Y. Application Study on Chemical Sand Control Technology in Medium-high Water-cut Stage of Changcai Block in Chunguang Oilfield. Inn. Mong. Petrochem. 2023, 49, 114–116. [Google Scholar]
- Jia, P.; Cui, C.; Zhao, Y.; Wu, Z.; Zhang, Y. Study on Plugging Law of Sand Control Wells and Optimization of Filling Parameters in Fine Siltstone Reservoirs. J. Southwest Pet. Univ. 2023, 45, 136–144. [Google Scholar]
- Gao, Z. Quantitative analysis of skin factor for screen gravel packing completion. Pet. Ind. Tech. Superv. 2023, 39, 75–80. [Google Scholar] [CrossRef]
- Guan, D.; Qu, A.; Wang, Z.; Lv, X.; Li, Q.; Leng, S.; Xiao, B.; Zhang, L.; Zhao, J.; Yang, L.; et al. Fluid Flow—Induced Fine Particle Migration and Its Effects on Gas and Water Production Behavior From Gas Hydrate Reservoir. Appl. Energy 2023, 331, 120327. [Google Scholar] [CrossRef]
- Dong, C.; Zhang, Q.; Li, Z.; Li, G. A calculation method for pressure drop near the wellbore of slotted liner gravel - packed wells. J. Xian Pet. Inst. 2002, 17, 33–36. [Google Scholar]
- Dong, C.; Yan, Q.; Li, Y.L.; Xu, H.; Zhou, Y.; Shang, X.; Chen, Q.; Song, Y. Particle-scale numerical simulation of micro-sanding in natural gas hydrate reservoirs. J. China Univ. Pet. 2019, 43, 77–87. [Google Scholar]
- Dong, C.; Gao, K.; Zhou, C.; Zhi, Q.; Li, H.; Zhang, Q. Experiment on plugging laws of sand control media in sand control wells and a quantitative prediction model for plugging degree. J. Exp. Mech. 2017, 32, 351–360. [Google Scholar]
- Dong, C.; Jia, B.; Liu, C.; Wu, J.; Wang, D.; Sun, D.; Han, X. Blocking mechanism and blocking law experiments of sand retention media in mechanical sand control screens. J. China Univ. Pet. 2011, 35, 82–88. [Google Scholar]
- Zhou, Z.; Dang, W.; Wang, P.; Wang, R.; Sun, S. Treatment of sand production in old wells by small - screen gravel - packing with lightweight particles in Bohai S Oilfield. Petrochem. Technol. 2022, 29, 61–63. [Google Scholar]
- Zheng, J.; Hou, Y.; Shi, H.; Zhang, Z.; Gan, L. Analysis of influencing factors on productivity and its improvement measures for multi - layer unconsolidated sandstone reservoirs: A case study of Bohai L Oilfield. Pet. Geol. Eng. 2022, 36, 52–56. [Google Scholar]
- Peng, Z.; Hua, Z.; Li, Y.; Li, K.; Liu, A.; Han, F.; Guo, J. Research on a new chemical sand consolidation technology and its application in Bohai Oilfield. Liaoning Chem. Ind. 2022, 51, 1026–1029. [Google Scholar] [CrossRef]
- Zou, J.; Gao, S.; Liu, C.; Fu, Y.; Zhang, L. Research status and development trend of sand consolidation technologies for unconsolidated sandstone heavy oil reservoirs. Guangzhou Chem. Ind. 2022, 50, 24–26. [Google Scholar]
- Perkins, T.K.; Weingarten, J.S. Stability and failure of spherical cavities in unconsolidated sand and weakly consolidated rock. In Proceedings of the SPE Annual Technical Conference and Exhibition, Houston, TX, USA, 2–5 October 1988. SPE 18244-MS. [Google Scholar] [CrossRef]
- Cui, G.L.; Dilimulati, S.; Liu, Q.; Dong, C.; Gao, S.; Liu, H.; Wang, H. Solid particle production mechanism and prevention and control measures of screen fracturing wells in Bohai Oilfield. J. Shengli Coll. China Univ. Pet. 2022, 36, 76–82. [Google Scholar]
- Wang, Z.; Li, P.; Wei, F.; Wang, Y.; Liang, W. Progress of Chemical Sand Control Technology in Shengli Oilfield during the Ultra high Water Cut Period. Oilfield Chem. 2021, 38, 560–563. [Google Scholar] [CrossRef]
Disclaimer/Publisher’s Note: The statements, opinions and data contained in all publications are solely those of the individual author(s) and contributor(s) and not of MDPI and/or the editor(s). MDPI and/or the editor(s) disclaim responsibility for any injury to people or property resulting from any ideas, methods, instructions or products referred to in the content. |
© 2026 by the authors. Licensee MDPI, Basel, Switzerland. This article is an open access article distributed under the terms and conditions of the Creative Commons Attribution (CC BY) license.