


Abstract
In selective catalytic reduction (SCR) systems, urea-water solution (UWS) is injected upstream of the catalyst, where water evaporation, urea thermolysis, and isocyanic acid (HNCO) hydrolysis release the NH3 required for NOx reduction. Data at pressures of tens of bar combined with rapid temperature variation remain scarce. This study numerically evaluates the evaporation, decomposition, and NH3 formation potential of UWS sprays in an engine-like, non-combusting transient thermal environment. A motoring direct injection diesel engine model, validated against measured in-cylinder pressure, gave a peak mass-averaged temperature of about 851 K. A three-dimensional CFD model coupling a multicomponent droplet evaporation model with gas-phase urea thermolysis and HNCO hydrolysis was applied to four injection quantities of 11.5, 23.2, 28.2, and 33.1 mg/cycle. UWS injection lowered the peak pressure and temperature through the endothermicity of water evaporation and urea decomposition. The model predicted NH3 conversion, referenced to the urea content of the injected UWS, and decreased monotonically from about 43% to 17% as the injection quantity increased, while the wall film residue rose from 1% to 31% of the injected mass. Because deposit-forming side reactions are not included and high-pressure species formation was not independently validated, these values represent an upper bound of the model-predicted formation potential. The predicted NH3, therefore, represents a formation potential under non-firing conditions rather than an exhaust-gas concentration, since NH3 formed in the cylinder would be largely oxidised at firing temperatures.
1. Introduction
Selective catalytic reduction (SCR) is a widely used exhaust aftertreatment technology for reducing NOx emissions from marine diesel engines. In a typical marine SCR system, urea-water solution (UWS) is injected into the hot exhaust gas upstream of the catalyst. Within the injected droplets, water evaporates, and urea decomposes into NH3 and isocyanic acid (HNCO); HNCO is subsequently hydrolyzed to NH3 and CO2. The NH3 produced in the exhaust line then reduces NOx to N2 and H2O on the catalyst surface [1,2]. UWS injection, therefore, takes place in the after-treatment system and is separate from the in-cylinder combustion process.
Exhaust line UWS injection has two well-documented limitations: reduced conversion at low temperature and the formation of solid products. First, when the exhaust temperature is low, urea is not sufficiently converted to NH3. Urea to NH3 conversion efficiencies of about 37% at 573 K, 55% at 623 K, and 63% at 673 K have been predicted for such conditions [3], and low-temperature operation degrades SCR performance [4]. Marine engines readily experience low-exhaust temperatures during low-load operation or slow steaming in port, so urea conversion at low temperature is an important issue for marine SCR. Second, incomplete decomposition forms solid products, such as biuret and cyanuric acid, which cause injector clogging and wall deposits in the exhaust line [5,6,7]. Previous work has therefore addressed UWS spray modelling for SCR [8,9], droplet evaporation in hot gas flows [10,11], and spray wall interaction and deposit formation [5,6]. Urea melts at about 406 K, after which thermolysis and side reactions proceed depending on temperature and residence time [7,11]. Most of these studies, however, address near atmospheric exhaust line conditions, so data on UWS evaporation and decomposition under the simultaneous action of pressures of tens of bar and rapid temperature variation remain scarce.
Experimental studies of UWS evaporation and decomposition fall into three groups. Single-droplet experiments provide the most direct data. Wang et al. [12] suspended UWS droplets in a hot air stream and measured the two-stage D2 history at 573–673 K, identifying water evaporation, urea enrichment within the droplet, and a subsequent urea-dominated stage; these data are used for model validation in Section 4.1. Bernhard et al. [13] measured urea evaporation at atmospheric pressure and quantified the competition between vaporisation and condensation side reactions, and Schaber et al. [7] followed the decomposition of urea to biuret, cyanuric acid, and ammelide by thermogravimetry.
At the spray level, Lieber et al. [10] combined phase-Doppler and shadowgraph measurements with modelling and showed that the evaporation rate is governed by the coupled droplet-size distribution and the local gas temperature rather than by single-droplet behaviour alone, and Shahariar and Lim [5,6] visualised UWS impingement on heated surfaces and related film formation to the onset of solid deposits. In all of these studies, the ambient pressure is close to atmospheric, and the gas temperature is nominally steady.
The introduction of urea into the combustion process itself has also been examined, although only to a limited extent. Fontanarosa et al. reported that a jet emulsion fuel containing 2.5 wt.% water and 2 wt.% urea reduced NOx without a significant loss of combustion performance in a 300 kW swirl combustor [14]. That configuration emulsified a small amount of urea and water into the fuel and differs from the direct injection of 32.5 wt.% UWS into an engine combustion chamber in properties, dosing quantity, and reaction pathway. It therefore cannot be taken as evidence supporting the feasibility of in-cylinder direct UWS injection.
The present study addresses the evaporation, thermolysis, and NH3 formation behaviour of UWS sprays exposed to the pressure and temperature history of a motoring (non-combusting) engine. The peak pressure and peak mean temperature of the baseline condition are about 43 bar and 851 K, respectively, which represent a substantially higher-pressure regime than near-atmospheric exhaust line conditions. In-cylinder UWS injection is not proposed here as a practical SCR configuration; it is used as a computational means of realizing a high-pressure transient thermal environment. Accordingly, oxidation of the generated NH3 during combustion, its reaction with NOx, and its transport to a downstream catalyst are outside the scope of this study.
NH3 is not a stable species at flame temperature. In the burned gas of a firing engine, at about 1500–2100 K, NH3 is oxidised by O2 and OH and can also dissociate to N2 and H2, so NH3 formed in the cylinder before top dead centre would be largely consumed if combustion were present. The quantity evaluated in this work is therefore the NH3 formation potential of the spray, defined as the extent to which water evaporation, urea thermolysis, and HNCO hydrolysis proceed at a pressure of tens of bar and a heating rate of the order of 104 K/s, and not an NH3 concentration available in the exhaust gas.
Experiments that inject UWS and resolve species under high-pressure transient thermal environments are difficult to control and diagnose, so CFD is a practical route for isolating the thermochemical behaviors. Under firing conditions, heat release and radical chemistry occur simultaneously with UWS evaporation and decomposition, making the individual contributions difficult to separate; non-combusting conditions were therefore chosen to exclude these effects. A three-dimensional CFD model was built on the discrete phase model (DPM) of ANSYS Fluent, and a user-defined multicomponent evaporation model incorporating the Poynting factor and the gas-phase fugacity coefficient was coupled with urea thermolysis and HNCO hydrolysis. The engine flow and thermodynamic model were checked against measured motoring in-cylinder pressure, and the evaporation behaviors, wall film, and NH3 formation were analyzed for four injection quantities of 11.5, 23.2, 28.2, and 33.1 mg/cycle; the 28.2 mg/cycle case was added to resolve the intermediate behaviors between 23.2 and 33.1 mg/cycle. Comparable experimental and numerical approaches have been applied to other jet-dominated flows, including active control of a shock/shock interaction by a SparkJet array [15] and reinforcement-learning-based optimisation of synthetic-jet actuation [16].
The contributions of this study are threefold: (i) the evaporation and NH3 formation potential of UWS is predicted under transient conditions reaching about 43 bar using a motoring engine model whose baseline validity was established against measured pressure; (ii) the relationship between wall film residue and gas-phase decomposition is compared over the range 11.5–33.1 mg/cycle; and (iii) the analysis scope and technical limitations of in-cylinder direct injection are stated explicitly. The results are intended as baseline data for extending and validating UWS evaporation and decomposition models under high-pressure transient conditions.
2. Materials and Methods
Two experiments were carried out to provide input conditions and baseline validation data for the numerical analysis. First, the engine was operated in motoring mode to measure in-cylinder pressure, which provides the baseline data for the engine flow and thermodynamic model (Section 3.3). Second, an atmospheric-pressure visualization test, in which diesel fuel and UWS were injected through the same nozzle, was used to compare the spray shapes of the two liquids and to obtain the UWS spray angle and penetration. In the motoring test, the engine was driven by an electric motor, and neither fuel nor UWS was supplied; the spray visualization test was performed on a separate bench apparatus. Neither experiment injected UWS into a firing engine cylinder, and all in-cylinder UWS injection results reported in this paper are CFD predictions.
2.1. Test Engine and Motoring Experiment
The three-cylinder, four-stroke, direct injection diesel engine with a rated power of 35 kW was used. Its main specifications are listed in Table 1.
Table 1.
Main specifications of the test engine.
Crank angles are referenced to 0 °CA at the intake stroke top dead center, so that combustion top dead center corresponds to 360 °CA. BTDC, before top dead center; ABDC, after bottom dead center; BBDC, before bottom dead center; ATDC, after top dead center.
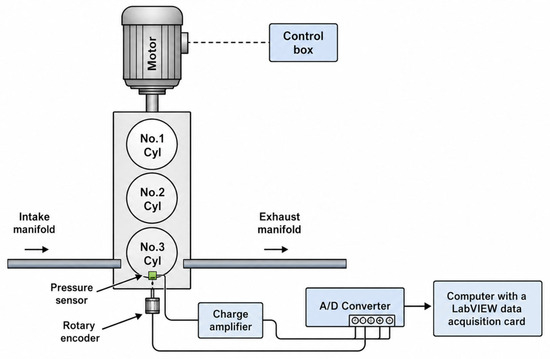
Figure 1 shows the configuration of the motoring test apparatus. The engine was connected to an electric motor through the drive shaft and operated under non-combusting conditions. In-cylinder pressure was measured with a piezoelectric pressure sensor (Kistler 6051A, Kistler Instrument, Winterthur, Switzerland) and a charge amplifier (Kistler 5018A, Kistler Instrument, Winterthur, Switzerland), and the crank position was resolved with an Omron E6C2-CWZ3E incremental rotary encoder (OMRON Corporation, Kyoto, Japan) of 720 pulses per revolution, corresponding to 0.5 °CA per increment. Pressure and crank angle signals were acquired synchronously through a National Instruments USB-4431 24-bit A/D board (National Instruments Corporation, Austin, TX, USA) using LabVIEW (version 2018, National Instruments, Austin, TX, USA) at a sampling rate of 100 kS/s, which corresponds to a sample spacing of about 0.054 °CA at 900 rpm.
Figure 1.
Schematic of the non-combusting motoring operation and the in-cylinder pressure measurement system.
2.2. Spray Visualisation Experiment and Injection Conditions
The spray visualization experiment compared the spray shapes of diesel fuel and UWS injected through the same diesel injector and provided reference values of the UWS spray angle and penetration used to set the CFD injection conditions. Because UWS has properties that differ from those of diesel fuel, its breakup and penetration characteristics in a diesel injector may also differ, so the shape of a representative plume was measured under atmospheric conditions. This test does not reproduce the high-pressure, high-temperature in-cylinder environment; it was therefore used for qualitative comparison and for setting model inputs, not as direct validation data for the in-cylinder spray model.
Diesel fuel and UWS with a urea concentration of 32.5 wt.% were injected under identical injection pressure and ambient conditions on a bench spray test apparatus. Both liquids were injected into quiescent air at room temperature and atmospheric pressure, and the ambient gas was not heated. Table 2 summarizes the representative properties of the two liquids.
Table 2.
Representative properties of diesel fuel and UWS used in the spray behaviour analysis.
The two liquids are quoted at different reference temperatures, so the values should be compared qualitatively rather than as property differences at a matched temperature. The densities were therefore also measured directly at room temperature by weighing a known volume of each liquid, giving 812.5 kg/m3 for the diesel fuel and 1064.5 kg/m3 for the UWS.
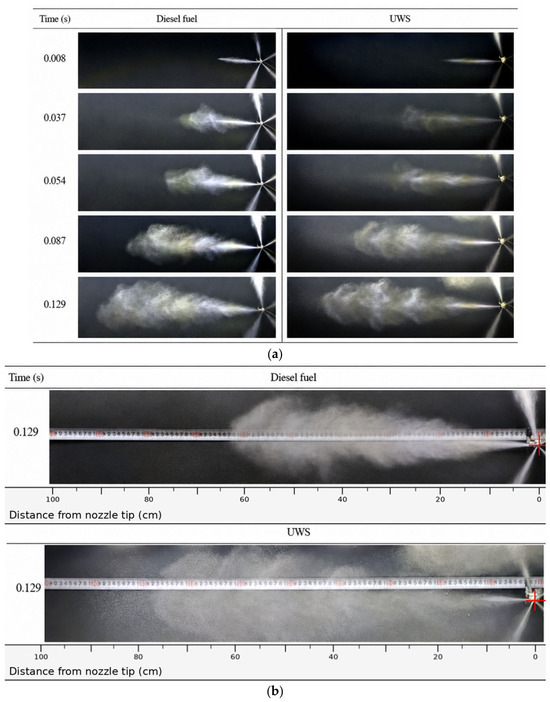
The opening pressure of the fuel injection valve was 178 bar, and the maximum injection pressure for both diesel fuel and UWS was measured as about 190 bar. Figure 2 compares the spray shapes of the two liquids, recorded at a frame rate of 240 fps. The images have a resolution of 1280 × 720 pixels; at 240 fps, the inter-frame interval is 4.17 ms, which resolves the overall plume shape and the position of the spray tip, but not primary breakup or individual droplets, so no droplet-size information was extracted from these images.
Figure 2.
Spray visualisation results for diesel fuel and UWS at an ambient pressure of 1 atm: (a) temporal development of the diesel spray (left) and the UWS spray (right); (b) comparison of the maximum spray penetration of diesel fuel (top) and UWS (bottom) at 0.129 s after the start of injection. The red cross marks the position where the spary was initiated.
The diesel spray spread more widely in the radial direction, whereas the UWS spray penetrated farther in the axial direction. UWS has a higher density and surface tension and a lower viscosity than diesel fuel, so the injection velocity, momentum flux, Weber number, and Ohnesorge number can all differ even under the same injector settings. The narrower spray angle and longer penetration observed for UWS are consistent with these combined differences in properties and injection dynamics, but cannot be attributed to any single property.
Spray penetration and spray angle were determined from the visualization images. Penetration was defined as the axial distance from the nozzle tip to the farthest spray boundary along the nominal spray direction, and the spray angle was obtained by MATLAB (R2018a, version 9.4, The MathWorks, Inc., Natick, MA, USA)-based image processing with edge detection. One representative plume within the camera field of view, out of the five nozzle holes, was analyzed. The maximum spray angle was 19° for diesel fuel and 18° for UWS, and the maximum penetration was about 52 cm and 67 cm, respectively.
The measured UWS spray angle was applied as the cone angle of the conical DPM injection. The penetration from the atmospheric pressure test was used only as a qualitative check that the KH-RT breakup model reproduced the observed axial development. Because the ambient pressure and temperature differ from the in-cylinder conditions, this comparison is not a quantitative validation of the high-pressure spray model.
The conditions that varied between the injection cases were the injection quantity per cycle and the associated injection duration. Four cases were defined by measuring the injection quantity and duration on a bench apparatus consisting of a high-pressure pump and the injector, as summarized in Table 3. An engine speed of 900 rpm was applied to all experiments and simulations, and the quantities and timings in Table 3 were used directly as the CFD injection boundary conditions.
Table 3.
UWS injection quantity and injection timing conditions.
Crank angles in this table are referenced to compression top dead center (0 °CA ATDC). The start of injection is nominally identical for all cases, so the cases differ mainly in injection duration.
2.3. Instrumentation and Measurement Uncertainty
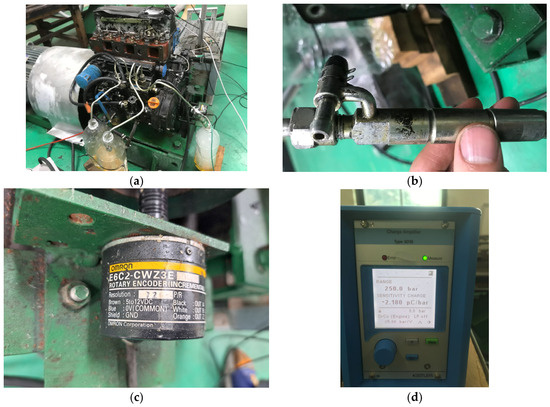
The instruments used in the two experiments are listed in Table 4, and the principal items are shown in Figure 3.
Table 4.
Instrumentation of the motoring and spray visualisation experiments and the resulting measurement uncertainties.
Figure 3.
Experimental apparatus: (a) motoring test bench; (b) injector holder and nozzle; (c) crank-angle encoder; (d) charge amplifier.
The uncertainty of the quantities derived from these measurements was estimated by the root-sum-square rule. The principal derived quantity is the in-cylinder gas temperature obtained from the measured pressure (Section 3.5), for which u(T)/T = [(u(P)/P)2 + (u(V)/V)2 + (u(m)/m)2]1/2. The pressure contribution is dominated by the sensor linearity, ±0.4% of the 250 bar full scale, which is ±1.0 bar or ±2.5% of the measured peak pressure, while the cylinder volume at top dead centre and the trapped mass are estimated to be accurate to ±1.0% and ±2.0%, respectively. The combined value is ±3.4%, i.e., ±27 K at the pressure-derived peak temperature of about 805 K.
3. Numerical Methods
The evaporation and decomposition of UWS injected into the cylinder were analyzed with ANSYS Fluent (R2018, ANSYS, Inc., Canonsburg, PA, USA). Air was treated as the continuous phase and solved in an Eulerian framework, while the UWS spray was treated as the discrete phase, and its droplet trajectories and evaporation were tracked in a Lagrangian framework. Droplet breakup was modelled with the KH-RT model, and two-way coupling between the continuous and discrete phases was applied. Heat and mass transfer of the multicomponent UWS droplets was computed with a convection diffusion-controlled evaporation model implemented as a user-defined function (UDF), and the droplets were assumed spherical. Thermolysis of vaporized urea and hydrolysis of HNCO were treated as gas-phase volumetric reactions.
The behaviors of UWS droplets after impingement on the cylinder wall was treated with a wall film model, and film evaporation was modelled with the O’Rourke model [17]. The mass and energy source terms due to film evaporation were coupled to the continuous phase equations so that the effect of wall impingement and liquid residue on subsequent evaporation and gas-phase reaction was retained.
3.1. Computational Domain and Solver Settings
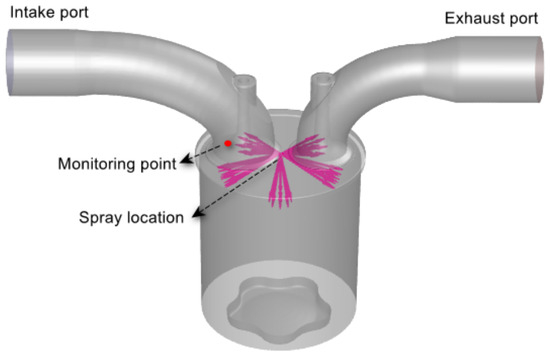
Figure 4 shows the three-dimensional computational domain corresponding to the motoring experiment. The domain comprises the intake port, a single cylinder, and the exhaust port; the UWS injector location, the nominal spray direction, and the velocity monitoring point used in the grid-dependence study are indicated. The injection conditions are those of Table 3.
Figure 4.
Three-dimensional computational domain for the non-combusting engine analysis, showing the UWS injector location, the nominal spray direction, and the velocity monitoring point near the intake valve.
A pressure-based transient solver was used with the PISO pressure-velocity coupling algorithm, and identical continuous phase solver settings were applied to the non-injection motoring analysis and to the UWS injection analysis. Turbulence was modelled with the realisable k-ε model together with scalable wall functions, which is a standard choice for engine gas exchange and compression calculations in which the near-wall grid resolution varies as the mesh deforms. Pressure was discretized with the PRESTO! scheme; first-order upwind differencing was applied to the turbulent kinetic energy and dissipation rate, and second-order upwind differencing to the density, momentum, energy, and species transport equations. The time step was set to 1.0 × 10⁻⁵ s, which corresponds to about 0.054 °CA at 900 rpm and was selected based on the CFL condition and the temporal resolution of the pressure measurement. Convergence at each time step was judged by scaled residuals of 1 × 10⁻⁶ for all transport equations.
All pressures reported in this paper are absolute pressures unless stated otherwise, and the pressures used in the Poynting correction and in the fugacity coefficient are local absolute pressures.
The initial and boundary conditions were as follows. The engine was motored for 15 min before the experiment, and a representative wall temperature was confirmed to stabilize at about 323 K; this value was applied as the initial wall temperature in the analysis. The intake and exhaust boundaries were set to atmospheric pressure and ambient temperature, corresponding to the naturally aspirated, non-firing operation of the test engine.
3.2. Evaporation Model for UWS Droplets
The rapid mixing (RM) model and the diffusion limited (DL) model are the two approaches commonly used for UWS droplet evaporation [18,19,20]. Birkhold et al. [21] reported that the predictions of the two models differ little at about 673 K, and Abu Ramadan et al. [22] likewise found that the difference decreases as the ambient temperature increases. Because the mean gas-phase temperature at the start of injection (about 21 °CA BTDC) is predicted to be about 650 K in this study, the RM model was adopted. Evaporative cooling can nevertheless steepen the internal temperature and concentration gradients of a droplet, so the mean gas-phase temperature alone does not guarantee the validity of the RM assumption; this limitation is assessed together with the single-droplet results in Section 4.1.
Under the RM assumption, droplet evaporation was described using film theory. The instantaneous mass transfer rates of the water and urea components were computed separately and summed, giving the total mass loss rate of the droplet in Equation (1) [23]:
In the droplet energy balance, the heat transferred from the surrounding hot gas is consumed by the rise in droplet temperature and by the latent heat of multicomponent evaporation. Using the total mass transfer rate from Equation (1) and the mixture properties, the net heat transfer rate to the droplet is given by Equation (2) [23]:
Vapour–liquid equilibrium was assumed at the droplet surface. At equilibrium, the fugacity of each species is equal in the gas and liquid phases (); if the gas is treated as ideal and the pressure correction is neglected, the partial pressure of vapour species i at the droplet surface follows the activity coefficient-corrected Raoult law, [24]. At the pressures of tens of bar considered here, however, two real-fluid effects must be retained: the effect of the high total pressure on the escaping tendency of the liquid-phase component and the departure of the gas phase from ideal-gas behaviors.
The pressure correction for the liquid phase was introduced through the Poynting factor, Equation (3) [25], which accounts for the change in liquid-phase fugacity when the liquid is compressed from its saturation pressure to the total system pressure:
When the real gas behaviour of the gas phase is also included, the equilibrium partial pressure of vapour species i at the droplet surface becomes Equation (4):
where is the gas-phase fugacity coefficient, which quantifies the departure of the real gas from ideal-gas behaviour. At low pressures , whereas at high pressure, it must be evaluated from an equation of state; the Peng–Robinson equation of state [26] was used in the present model.
Pressure affects evaporation mainly through gas-side mass transfer in the vapour film surrounding the droplet. First, the gas-phase diffusion coefficient obtained from the Fuller correlation decreases as pressure increases, so the diffusive escape of vapour slows [27]. Second, under the ideal-gas approximation, the vapour film density increases as , whereas the vapour mole fraction at the droplet surface follows Dalton’s law, . At the same surface partial pressure, an increase in total pressure therefore lowers the vapour mole fraction, and this dilution reduces the Spalding mass transfer number . The term consequently decreases, and the evaporation rate is lowered. Increasing pressure thus suppresses the evaporation of UWS droplets.
3.3. Urea Thermolysis and HNCO Hydrolysis
Urea melts at about 406 K [13,28,29]; on further heating, it undergoes not only vaporisation but also thermolysis and polymerisation or condensation side reactions. The present model uses a simplified pathway in which liquid urea first vaporises and then decomposes in the gas phase as NH2-CO-NH2 → NH3 + HNCO. A urea vaporisation enthalpy of 87.4 kJ·mol−1 was applied [30]. Gas-phase urea was set to decompose once its temperature exceeded about 423 K [31], with a reaction enthalpy of 98.1 kJ·mol−1 [32]. The thermolysis rate was calculated from Equation (5):
where Ath = 940 s−1 and Eth = 2.94 × 10⁷ J/kmol. Equation (5) represents gas-phase thermolysis only; it is not a mechanism that includes the solid- and liquid-phase side reactions of actual urea decomposition.
Schaber et al. [7] reported a change in product composition, including CO2, at about 548 K, indicating that secondary reactions proceed alongside primary urea thermolysis. In this study, HNCO hydrolysis (HNCO + H2O → NH3 + CO2) was modelled with the rate constants proposed by Yim et al. [33] and applied by Birkhold et al. [34]. The enthalpy change of hydrolysis was set to −96 kJ·mol−1 [35], and the reaction rate was calculated from Equation (6):
where Ahy = 2.5 × 10⁵ s−1 and Ehy = 6.22 × 10⁷ J/kmol.
3.4. Grid Dependence Study
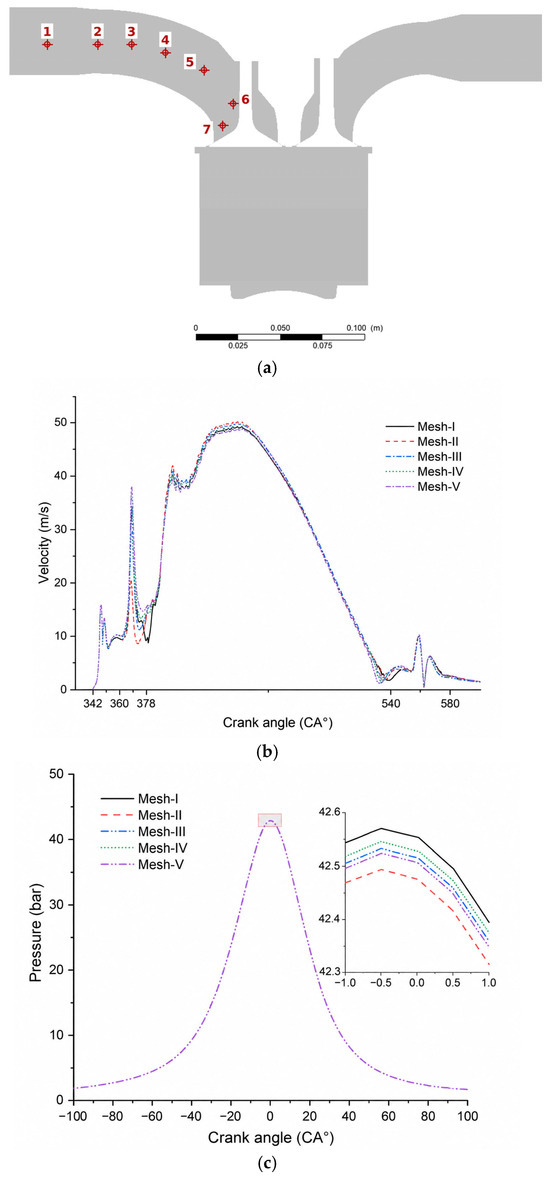
The grid dependence study was carried out in two stages. In the first stage, the mean cell size of the intake port was fixed at 1.75 mm, and the cell size of the cylinder region was varied while the in-cylinder pressure history was compared. After the cylinder grid had been selected, the mean cell size of the cylinder region was fixed at 0.896 mm in the second stage, and the intake port grid was varied; in this stage, the instantaneous velocity at the seven monitoring points along the intake port shown in Figure 5a was compared because the local velocity gradient near the valve seat is large and directly affects the trapped mass. The grid configurations are listed in Table 5, and the results are shown in Figure 5. The five grids give indistinguishable velocity histories at the points farthest from the valve, and the largest difference occurs at point 7, immediately upstream of the valve seat, which is therefore the point reported in Figure 5b.
Figure 5.
Grid dependence results for Mesh-I to Mesh-V: (a) positions of the seven velocity monitoring points along the intake port, point 7 lying immediately upstream of the intake valve seat; (b) instantaneous velocity at monitoring point 7; (c) in-cylinder pressure, with the region near top dead center shown in the inset. In (a), the meshed domain is shown as an outline because the individual cells are not distinguishable when the mesh itself is displayed.
Table 5.
Grid configurations used in the two-stage grid dependence study.
The mean cell sizes are those of the undeformed mesh at the reference crank angle. The peak pressures listed here were obtained with the continuous phase alone, that is, without the discrete phase, wall film, and species transport equations.
When the mean cell size of the cylinder region was reduced from 0.896 mm to 0.640 mm and 0.512 mm, the change in peak cylinder pressure was below 0.01 bar, while the cell count increased by a factor of about 2.5. The mean cell size of the cylinder region was therefore set to 0.896 mm. Reducing the mean cell size of the intake port from 1.024 mm to 0.896 mm changed neither the monitored velocity nor the peak cylinder pressure appreciably, so 1.024 mm was selected for the intake and exhaust ports. The final grid contained about 1.7 million cells. The peak pressure varied by at most 0.08 bar (0.19%) across all 10 grids in Table 5, so the continuous phase solution is insensitive to the grid in the range examined. The grid dependence calculations were run with the continuous phase alone; the corresponding peak pressure of 42.53 bar, therefore, differs from the reference case used in Section 4.3, which was computed with the full injection setup. The grid was varied for the continuous phase only; the sensitivity of the Lagrangian spray, wall film, and evaporation predictions to the grid was not examined and is noted among the limitations in Section 3.6.
3.5. Baseline Validation Against the Motoring Pressure Measurement
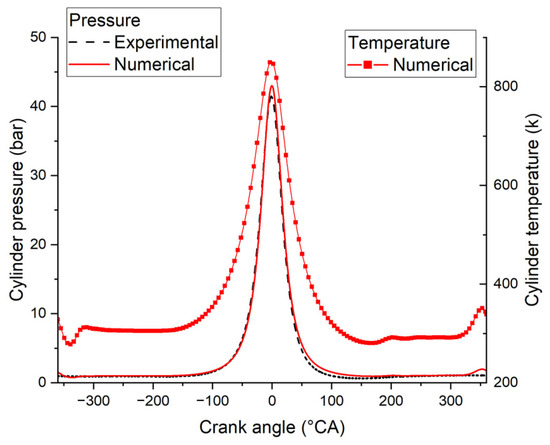
The numerical analysis was performed at the same 900 rpm condition as the experiment. Figure 6 compares the measured and computed in-cylinder pressure histories together with the mean in-cylinder temperature history. The simulation reproduced the overall pressure variation during compression and expansion, but the peak pressure near top dead center was about 1.4 bar (about 3.3%) higher than the measured value, and the computed pressure remained slightly higher during expansion. This deviation is attributed to the combined effects of uncertainty in the wall heat transfer model and the thermal boundary conditions, blow-by that was not modelled, and pressure measurement error. The comparison therefore shows that the baseline engine model reproduces the trend of the pressure history; it should not be read as a quantitative validation of the individual heat-loss mechanisms.
Figure 6.
Comparison of measured and computed in-cylinder pressure under non-injection motoring conditions (left axis), together with the computed mass-averaged in-cylinder temperature (right axis). Both computed curves are from the same simulation; the temperature was not measured. 0 °CA corresponds to compression top dead center.
The in-cylinder temperature under motoring conditions changes rapidly during compression and cannot be measured directly with the instrumentation used here, so the mass-averaged in-cylinder temperature computed by the model is reported instead. It is plotted on the right axis of Figure 6 and is taken from the same simulation as the computed pressure trace; it is therefore a model output rather than a measured or independently derived quantity, and its reliability rests on the pressure comparison presented above. Using the simulated temperature, rather than a value obtained from the measured pressure through the ideal-gas relation, avoids the assumption of a constant in-cylinder mass, which does not hold during gas exchange.
The peak mass-average temperature was about 851 K, and the temperature exceeded about 423 K the urea thermolysis onset criterion of the present reaction model from about 60 °CA BTDC to 60 °CA ATDC. Thermal conditions permitting UWS evaporation and urea decomposition are therefore established over this interval, although the extent of reaction achieved depends on droplet temperature, mixing, and residence time. Because the model overpredicts the peak pressure by about 3.3%, the peak temperature is expected to be overpredicted by a comparable relative amount. The value of 851 K should therefore be treated as an upper estimate of the thermal environment to which the spray is exposed, which is consistent with the way the NH3 formation results are interpreted throughout this paper.
The computed temperature can also be checked against the measurement through the ideal-gas relation P·V = m·R·T, which, applied over the closed part of the cycle, gives Equation (7):
where V(θ) is the instantaneous cylinder volume obtained from the geometry of Table 1, mtrap is the trapped charge mass, and R = 287 J·kg−1·K−1. With the clearance volume of 5.20 × 10⁻⁵ m3 and the trapped charge of 0.032 mol used in Section 4.3, the measured peak pressure gives about 805 K at top dead centre, and the computed peak pressure gives 832 K. The difference of 27 K is within the ±27 K measurement uncertainty given in Section 2.3, so the computed temperature level is consistent with the measurement.
Texp(θ) = Pexp(θ) V(θ)/(mtrap R)
This comparison establishes the baseline validity of the engine flow and thermodynamic model only. It does not validate UWS droplet evaporation or the NH3 formation reactions, whose validation scope is addressed separately in Section 4.1. Like the grid dependence calculations of Section 3.4, the case shown in Figure 6 was computed with the continuous phase alone because its purpose is to verify the gas exchange and compression behaviors of the engine model against the measurement. The reference case used in Section 4.3 is a separate calculation and is described there.
3.6. Scope and Limitations of the Numerical Model
The computational configuration differs from a commercial SCR system in four respects. First, an SCR system injects UWS into the exhaust line upstream of the catalyst, whereas no catalyst is present in this computation. Second, no NOx is present in the non-combusting cylinder, so no NOx reduction reaction occurs. Third, the extent to which in-cylinder NH3 would be oxidised under firing conditions, and the fraction that would reach a downstream catalyst, are outside the scope of this study. Fourth, the reaction mechanism includes only urea thermolysis and HNCO hydrolysis and excludes deposit-forming pathways such as biuret and cyanuric acid formation. The predicted NH3 formation is therefore an upper bound for the included reaction pathways, and the wall film mass is interpreted not as a deposit mass but as an indirect indicator of deposit-formation risk. Finally, the grid dependence study of Section 3.4 was carried out for the continuous phase only, so the sensitivity of the spray, wall film, and evaporation predictions to the grid resolution has not been quantified.
4. Results and Discussion
4.1. Validation of the Single-Droplet Evaporation Model
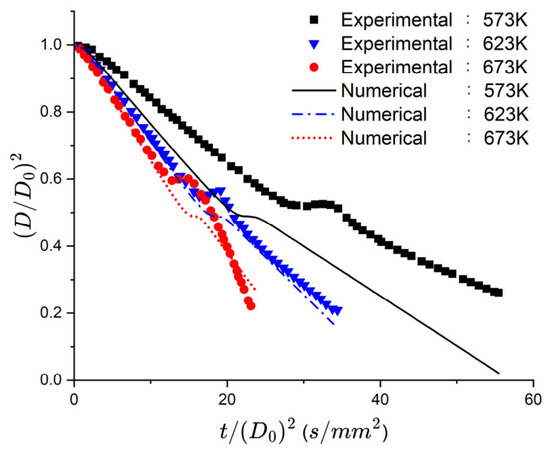
To assess the evaporation model, the single UWS droplet evaporation experiment of Wang et al. [12] was reproduced numerically, and the results were compared with the reported data. The single-droplet calculation was performed under quiescent conditions with the ambient air treated as laminar. Figure 7 shows the normalised squared diameter against the normalised time for three ambient temperatures = 573, 623, and 673 K.
Figure 7.
Normalised squared diameter of a single UWS droplet as a function of normalised time at ambient temperatures of 573, 623, and 673 K: comparison between the present calculation and the experimental data of Wang et al. [12].
At 623 K and 673 K, the computed curves agreed with the experimental data, and the model reproduced the trend of a progressively delayed transition to the two-stage evaporation regime as the ambient temperature decreases. At 573 K, the deviation from the experiment grew in the early stage. This is attributed to the steeper internal temperature and concentration gradients that develop at low ambient temperature, which reduce the applicability of the RM model and its assumption of a uniform droplet interior.
As the ambient temperature falls, the Spalding transfer numbers and the evaporation rate decrease while the droplet remains cooler, so the internal diffusion time becomes comparable with the evaporation time and a urea-enriched layer forms at the droplet surface; the computed evaporation rate then exceeds the measured one in the early stage, where the surface gradient is steepest. Birkhold et al. [21] and Abu-Ramadan et al. [22] report the same trend, the RM and diffusion-limited predictions converging as the ambient temperature increases, and the in-cylinder gas temperature of the present analysis lies between about 650 and 851 K, where the model reproduced the measurement.
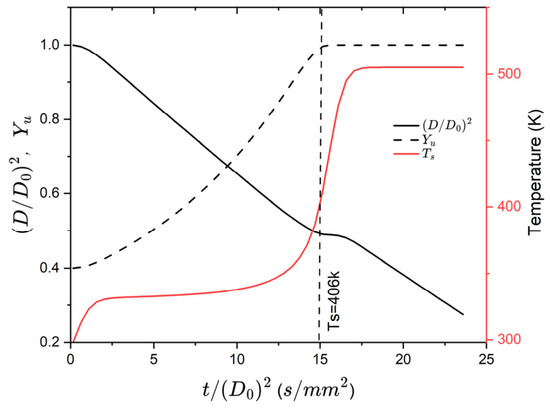
Figure 8 shows the computed evaporation process of a single UWS droplet at 673 K, the condition at which calculation and experiment agreed most closely.
Figure 8.
Computed evolution of the normalized squared diameter, the urea mass fraction Yu, and the droplet surface temperature Ts for a single UWS droplet in quiescent air at 673 K. The dashed vertical line marks the urea melting point, Ts = 406 K.
The initial decrease in is caused mainly by water evaporation, and the accompanying rise in the urea mass fraction shows that urea is concentrated within the droplet. In this model, urea vaporization begins only once the droplet temperature exceeds the urea melting point, and under the present condition, that criterion is met before the water has fully evaporated; urea vaporization therefore proceeds concurrently with the final stage of water evaporation and contributes to the loss of droplet mass. The droplet of this validation case has an initial urea mass fraction of 0.40, which differs from the 32.5 wt.% concentration of the UWS used in the engine calculations.
The droplet temperature first rises through sensible heating and then enters a stage dominated by water evaporation, in which most of the transferred heat is consumed as latent heat, so the droplet temperature remains low while the urea mass fraction increases. Once the droplet surface temperature reaches the urea melting point of about 406 K, the droplet enters a later stage dominated by urea vaporization, in which the droplet temperature rises rapidly while continues to decrease, showing that mass is still lost in the urea-dominated stage. These results support the use of the UDF-based RM model for the in-cylinder analysis under the high-temperature, non-combusting conditions of this study.
The single-droplet validation is nevertheless restricted to the diameter history at atmospheric pressure. The high-pressure applicability of the Poynting correction and the gas-phase fugacity coefficient, and the NH3 formation reactions themselves, were not validated against independent experimental data. The NH3 formation reported in the following sections should therefore be read as a model prediction conditioned on the assumed properties and reaction mechanism.
4.2. In-Cylinder Spray Evaporation and NH3 Formation
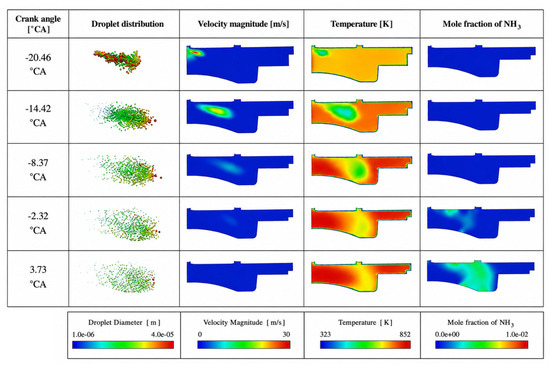
The UDF-based RM model assessed in Section 4.1, with the high-pressure correction active, was used to predict the evaporation and decomposition behaviors of the in-cylinder UWS spray. Figure 9 shows the crank-angle evolution of the droplet distribution and of the velocity magnitude, temperature, and NH3 mole fraction fields for the 11.5 mg/cycle case.
Figure 9.
Evolution of the droplet distribution and of the velocity magnitude, temperature, and NH3 mole fraction fields on a cut plane through the spray axis for the 11.5 mg/cycle UWS injection case. Crank angles are referenced to compression top dead center.
In the early injection stage (−20.46 °CA to −14.42 °CA), relatively large droplets were distributed along the spray centerline and at the leading edge. Because the droplets retained a large axial momentum immediately after injection, the high-velocity region was confined to the spray core. The low-temperature region also formed in the droplet dense spray core, indicating pronounced evaporative cooling. Water evaporation and droplet heating dominated in this interval, and the local temperature was low, so NH3 formation was limited.
In the development stage after the end of injection (−14.42 °CA to −8.37 °CA), the spray continued to advance axially, but the velocity magnitude decreased as the leading edge lost momentum. Droplets with reduced diameter and inertia deviated from the centerline under the combined action of ambient gas entrainment, shear, and turbulent dispersion, widening the spray, and the low-temperature region expanded through convection and turbulent mixing. A large fraction of the transferred heat was again consumed by water evaporation and droplet heating, so the NH3 mole fraction remained low.
In the late-development stage (−8.37 °CA to 3.73 °CA), droplets reached the wall and formed a film. High-inertia droplets impinged first, so the liquid residue near the wall increased, while the high-velocity region disappeared as the spray momentum dissipated. After −2.32 °CA, the NH3 mole fraction increased in the spray tail and near the wall. This is interpreted as vaporized urea being transported from the strongly cooled spray core into the surrounding higher temperature region, where thermolysis and HNCO hydrolysis proceeded. The spatial fields in Figure 9 alone, however, cannot separate the contributions of the two reaction pathways.
Turbulence affects the behaviour described above in three ways. Once the droplets have lost diameter and momentum, their trajectories are increasingly governed by the fluctuating gas velocity rather than by the injection momentum, which is the mechanism behind the radial widening of the spray in the development stage. Turbulent dispersion also broadens the impingement footprint and thereby reduces the local film thickness, while the associated near-wall convection increases the heat flux to the film. Finally, because thermolysis and hydrolysis are Arrhenius-limited and the spray core is the coldest region of the charge, the rate at which turbulent diffusion transports vaporised urea out of the core into the surrounding hotter gas controls the conversion; this is the transport step responsible for the increase in NH3 mole fraction in the spray tail and near the wall after −2.32 °CA.
4.3. Effect of Injection Quantity on Wall Film, Thermodynamic State, and NH3 Formation
The wall film mass at the end of the computation, taken as 100 °CA ATDC, was evaluated to compare the effect of injection quantity on liquid residue. The film mass was about 0.13, 3.2, 8.2, and 10.4 mg for the 11.5, 23.2, 28.2, and 33.1 mg/cycle cases, corresponding to about 1%, 14%, 29%, and 31% of the injected quantity. The film fraction increased sharply between 23.2 and 28.2 mg/cycle, indicating that a large part of the additionally injected UWS did not evaporate into the gas phase within the computation time and remained on the wall.
For the 28.2 and 33.1 mg/cycle cases, 29–31% of the injected UWS remained as a film. A film with a high urea concentration exposed to repeated heating and cooling can promote the formation of solid deposits, such as biuret and cyanuric acid [5,6,7]. Because the present mechanism excludes these pathways, the deposit mass cannot be predicted directly, and the film mass is used only as an indirect indicator of risk.
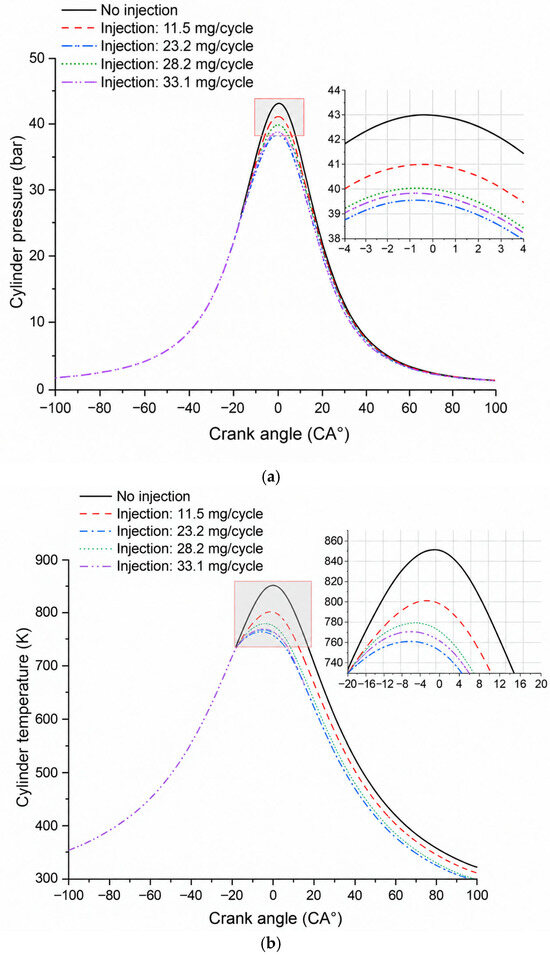
Figure 10 compares the in-cylinder pressure and mean temperature histories of the non-injection condition and the four injection cases.
Figure 10.
In-cylinder histories for the non-injection condition and the four UWS injection cases: (a) pressure and (b) mean temperature. The insects magnify the region near top dead center.
The reference case in Figure 10 is not the continuous phase calculation of Section 3.5. To keep the comparison internally consistent, it was computed with the same numerical setup as the four injection cases, the discrete phase model, the wall film model, and the species transport equations, all active with the injected mass set to zero. The additional transport equations and the associated property evaluation raise the computed peak pressure from 42.53 bar for the continuous-phase calculation (Table 5) to 43.0 bar for this reference case, a difference of about 1.1%. The two values, therefore, refer to different numerical configurations and are used for different purposes: 42.53 bar for the grid dependence study and the comparison with the pressure measurement and 43.0 bar as the zero-injection reference against which the injection cases are evaluated.
With UWS injection, both the peak pressure and the peak mean temperature fell below the reference values. The peak pressure decreased from 43.0 bar without injection to 41.0, 39.7, 40.0, and 39.9 bar for the 11.5, 23.2, 28.2, and 33.1 mg/cycle cases, corresponding to reductions of 2.0, 3.3, 3.0, and 3.1 bar, and the peak mean temperature decreased from 851 K to 802, 772, 779, and 776 K, i.e., by 49, 79, 72, and 75 K, respectively. The reduction is caused by the latent heat of water evaporation together with the endothermicity of urea phase change and decomposition, both of which remove heat from the charge during the second half of compression.
Doubling the injection quantity from 11.5 to 23.2 mg/cycle lowered the peak temperature by a further 30 K and the peak pressure by a further 1.3 bar, showing that evaporative cooling and the endothermic contribution both intensify over this range. Beyond 23.2 mg/cycle, however, the thermodynamic state ceases to respond to additional injected mass: the 28.2 and 33.1 mg/cycle cases give peak temperatures of 779 K and 776 K and peak pressures of 40.0 bar and 39.9 bar, all within 7 K and 0.3 bar of the 23.2 mg/cycle values despite injection quantities that are 22% and 43% larger. This saturation coincides with the sharp rise in the wall film fraction from 14% at 23.2 mg/cycle to 29% and 31% at 28.2 and 33.1 mg/cycle: liquid retained on the wall does not contribute to gas-phase evaporative cooling within the time available, so the additional UWS is largely removed from the charge cooling process.
The peak values of the three largest injection quantities are not strictly monotonic, but the spread between them is only 7 K and 0.3 bar. Given that the injection duration and the end of injection also differ between these cases, and that a spread of this magnitude is comparable to the uncertainty associated with the spray, wall film, and evaporation submodels, the ordering within this group should not be interpreted as a resolved physical trend. The robust observation is the saturation of the thermodynamic response above about 23 mg/cycle, not the existence of a minimum at a particular injection quantity.
The pressure and temperature peaks of the injection cases occurred up to about 0.5 °CA and 2–3 °CA earlier, respectively, than those of the reference case, showing that evaporation and the associated heat absorption in the second half of compression shift the thermodynamic peaks. Because the injection duration and end of injection differ between cases, this shift should not be interpreted as a function of injection quantity alone.
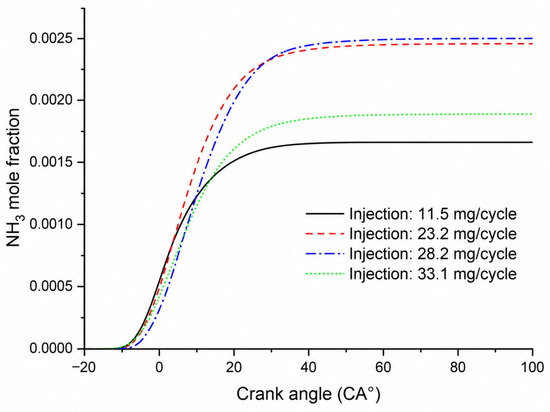
Figure 11 shows the mean in-cylinder NH3 mole fraction for the four injection cases. The values at the end of the computation were about 1.6 × 10⁻³, 2.4 × 10⁻³, 2.5 × 10⁻³, and 1.8 × 10⁻³ for the 11.5, 23.2, 28.2, and 33.1 mg/cycle cases. The value for 28.2 mg/cycle was only marginally higher than that for 23.2 mg/cycle despite the larger injected mass, and it decreased at 33.1 mg/cycle. This behaviour is consistent with the increase in wall film residue with injection quantity, which reduces the fraction of urea that enters the gas phase.
Figure 11.
Mean in-cylinder NH3 mole fraction histories for the four UWS injection cases.
The NH3 conversion was evaluated as the number of moles of NH3 formed divided by the theoretical maximum obtainable if all urea in the injected UWS were decomposed and hydrolysed, using the stoichiometry of 2 mol NH3 per mole of urea. The moles of NH3 formed were obtained from the mean in-cylinder mole fraction of Figure 11 and the trapped charge, so that
where is the mean in-cylinder NH3 mole fraction at the end of the computation, ncyl is the number of moles of gas trapped in the cylinder, and nurea,inj is the number of moles of urea injected. Both Figure 11 and Equation (8) refer to the cylinder volume only; the intake and exhaust ports are excluded. The exhaust valve opens at 130 °CA ATDC, so the cylinder is closed over the whole interval plotted in Figure 11, and ncyl is constant apart from the small contribution of the evaporated UWS. The terms of Equation (8) are listed for each case in Table 6.
Table 6.
Terms of Equation (8) and the resulting NH3 conversion for the four injection cases.
A trapped charge of ncyl = 0.032 mol was used for all four cases. It was obtained from the cylinder volume at intake valve closing, 8.41 × 10⁻⁴ m3 for the geometry of Table 1, with the trapped gas at atmospheric pressure and 320 K. The conversion is directly proportional to ncyl, so all four values in the last column scale by the same factor if a different trapped charge is assumed.
The conversion decreased monotonically with injection quantity, from about 43% at 11.5 mg/cycle to 17% at 33.1 mg/cycle. This decline mirrors the monotonic growth of the wall film from 1% to 31% of the injected mass, but the wall film does not account for it entirely. Normalizing the conversion by the fraction of urea that entered the gas phase gives about 43%, 36%, 37%, and 25% for the four cases, so even the urea that evaporated was converted less completely at the larger injection quantities. This is consistent with the lower charge temperature of those cases (Figure 10b) and with the later end of injection, both of which shorten the time during which the vaporized urea is held above the thermolysis onset temperature of the reaction model. Wall film retention and reduced gas-phase conversion therefore act together, and the two contributions cannot be separated from the present results alone.
These values are not experimentally validated conversions, but the NH3 formation potential predicted by the assumed model, and they should be read together with the limitations stated in Section 3.6.
A direct quantitative comparison with published exhaust line conversion data is not possible because the present configuration differs in pressure, wall boundary conditions, and the absence of a hydrolysis catalyst. For orientation, urea-to-NH3 conversion efficiencies of about 37%, 55%, and 63% have been predicted for exhaust line conditions at 573, 623, and 673 K [3]. Those predictions apply near atmospheric pressure and without appreciable wall wetting. In the present configuration, the pressure reaches about 43 bar, which suppresses droplet evaporation through the mechanisms described in Section 3.2, and 1–31% of the injected UWS is deposited on the cylinder wall, while the charge stays above the 423 K thermolysis threshold for about 120 °CA, or about 22 ms at 900 rpm. The lower conversions obtained here are therefore consistent with the higher pressure and the wall wetting rather than indicating a deficiency of the reaction mechanism, but the two sets of values are not directly comparable.
4.4. Comparison with Published Data and Statistical Assessment
Table 7 compares the present predictions with published UWS evaporation and decomposition data. A quantitative comparison is possible only for the single-droplet case since no published dataset combines UWS injection with a pressure of tens of bar.
Table 7.
Comparison of the present predictions with published UWS evaporation and decomposition data.
The standard deviation of the peak cylinder pressure across the 10 grid configurations of Table 5 is 0.026 bar, two orders of magnitude smaller than the 2.0–3.3 bar reduction caused by UWS injection, so the differences between the injection cases are resolved by the present grid. Over the four injection cases, the NH3 conversion decreases linearly with the injection quantity q in mg/cycle, η (%) = 57.1–1.16 q with r2 = 0.98, and is anti-correlated with the wall film fraction (r = −0.95), whereas the peak charge temperature differs by only 7 K among the three largest injection quantities.
4.5. Limitations for Practical Application
Although NH3 formation was predicted under non-combusting conditions, this result cannot be interpreted as evidence for the practicality of in-cylinder direct UWS injection for four reasons.
First, deposit formation and injector clogging. At the higher injection quantities, the wall film reached 29–31% of the injected mass. A film with a high urea concentration can form solid by-products, such as biuret and cyanuric acid, under repeated heating and cooling [5,6,7], and in a combustion chamber, it could accumulate on the piston, liner, and injector tip. Because the present mechanism excludes these side reactions, the NH3 formation is an upper bound, and the deposit risk was not quantified.
Second, the effect of water on combustion. A 32.5 wt.% UWS contains 67.5 wt.% water. Injecting tens of milligrams of UWS per cycle during compression causes local cooling and charge dilution; even in the present non-combusting analysis, the peak mean temperature fell by 49–79 K. Under firing conditions, this could lengthen the ignition delay, degrade combustion stability, and increase unburned emissions, none of which were quantified here.
Third, the fate of the generated NH3. Under motoring conditions, there is neither NOx to be reduced nor a catalyst. Under firing conditions, NH3 formed before top dead center would be exposed to the high temperature flame and could be oxidized, and the fraction reaching a downstream catalyst was not determined. The present results, therefore, cannot be used to evaluate NOx reduction performance.
Fourth, hardware durability. The atmospheric-pressure spray test shows only that a diesel injector can deliver UWS for a short period. Urea crystallizations, corrosion by UWS and its thermolysis products, and nozzle clogging and wear during long-term operation were not evaluated.
The present results are accordingly limited to model-based data for understanding the evaporation and decomposition behaviors of UWS in high-pressure, engine-like transient environments. Practical urea-based NOx reduction is performed by exhaust line UWS injection upstream of the SCR catalyst, and low-temperature conversion is more appropriately improved through close-coupled SCR, hydrolysis catalysts, mixer design, and deposit-suppression technologies.
The evaporation and reaction models used here can also be applied to exhaust line injection, but the conversion efficiencies and wall film fractions reported above apply only to the present configuration.
4.6. Model Limitations and Future Work
The limitations of the model are stated in Section 3.6 and Section 4.5, the most important being the absence of the deposit-forming reactions and the lack of high-pressure validation data.
Future work should therefore measure UWS evaporation in a constant-volume chamber at 10–50 bar, measure NH3 and HNCO under the same conditions, and extend the reaction mechanism to the deposit-forming reactions so that the deposit mass can be predicted.
5. Conclusions
This study numerically evaluated the evaporation, decomposition, and NH3 formation potential of UWS sprays in an engine-like, high-pressure, non-combusting transient thermal environment. In-cylinder UWS injection was used as a computational means of realizing that environment and not as a proposed SCR strategy, so the results cannot be read as proof of practical feasibility. The main conclusions are as follows.
- (1)
- The peak mass-averaged in-cylinder temperature computed by the motoring engine model, whose baseline validity was established against measured pressure, was about 851 K, and the temperature exceeded the 423 K thermolysis onset criterion of the reaction model from about 60 °CA BTDC to 60 °CA ATDC. This temperature is a model output rather than a measurement; since the model overpredicts the peak pressure by about 3.3%, it should be treated as an upper estimate of the thermal environment. The ideal-gas relation of Equation (7) applied to the measured and the computed peak pressure gives temperatures that differ by 27 K, which is within the measurement uncertainty.
- (2)
- With UWS injection, the peak pressure decreased from 43.0 bar for the zero-injection reference case to 41.0, 39.7, 40.0, and 39.9 bar for the 11.5, 23.2, 28.2, and 33.1 mg/cycle cases, and the peak mean temperature decreased from 851 K to 802, 772, 779, and 776 K. The pressure and temperature peaks occurred up to about 0.5 °CA and 2–3 °CA earlier than in the reference case. The thermodynamic response saturates above about 23 mg/cycle: the three largest injection quantities differ by only 7 K and 0.3 bar, which is consistent with the growth of the wall film from 14% to 31% of the injected mass. The ordering within this group is not resolved by the present calculations because the injection duration and end of injection also differ between the cases.
- (3)
- The model-based NH3 conversion decreased monotonically with injection quantity, from about 43% at 11.5 mg/cycle to 31%, 26%, and 17% at 23.2, 28.2, and 33.1 mg/cycle, while the wall film mass at the end of the computation was about 0.13, 3.2, 8.2, and 10.4 mg, corresponding to about 1%, 14%, 29%, and 31% of the injected quantity. Normalizing by the urea that entered the gas phase shows that wall film retention alone does not explain the decline; the lower charge temperature at the larger injection quantities also reduces gas phase conversion. Because the reaction mechanism excludes deposit-forming side reactions and the high-pressure NH3 formation was not independently validated, the conversion is not an actual performance value, but an upper bound of the model-predicted formation potential.
- (4)
- Assessing the feasibility of in-cylinder direct UWS injection would require the joint evaluation of crystallization and deposit formation, injector clogging and corrosion, wall film residue, the effect of water on ignition and combustion, and the high-temperature oxidation and downstream transport of the generated NH3. These items lie outside the scope of the present non-combusting analysis.
- (5)
- Future work should first extend the validation of the high-pressure evaporation model and of the thermolysis and hydrolysis reactions to exhaust line UWS injection conditions. The analysis framework presented here can then be applied to close-coupled SCR, hydrolysis catalysts, mixer and injection-control optimization, and deposit-suppression studies. If the in-cylinder injection concept is pursued further, combustion analysis, including NH3 oxidation and deposit-forming reactions, together with NH3 and HNCO measurements, should be undertaken first.
Author Contributions
Conceptualization, J.C. and C.-C.L.; methodology, C.-C.L.; software, C.-C.L.; validation, J.C.; formal analysis, J.C.; investigation, J.C.; resources, C.-C.L.; data curation, C.-C.L.; writing—original draft, C.-C.L.; writing—review and editing, J.C.; visualization, C.-C.L.; supervision, J.C.; project administration, J.C.; funding acquisition, J.C. All authors have read and agreed to the published version of the manuscript.
Funding
This research was supported by Korea Institute of Marine Science & Technology Promotion (KIMST) funded by the Ministry of Oceans and Fisheries (RS-2022-KS221683, Improvement of legal system and development of IMO standard agenda for commercialization of ecofriendly ships).
Data Availability Statement
The raw data supporting the conclusions of this article will be made available by the authors on request.
Conflicts of Interest
Author Jeongmin Cheon was employed by Fire Insurers Laboratories of Korea. The remaining author declares that the research was conducted in the absence of any commercial or financial relationships that could be construed as a potential conflict of interest.
References
- Forzatti, P. Present Status and Perspectives in De-NOx SCR Catalysis. Appl. Catal. A Gen. 2001, 222, 221–236. [Google Scholar] [CrossRef] [Scilit]
- Gabrielsson, P.L.T. Urea-SCR in Automotive Applications. Top. Catal. 2004, 28, 177–184. [Google Scholar] [CrossRef] [Scilit]
- Kim, J.Y.; Ryu, S.H.; Ha, J.S. Numerical Prediction on the Characteristics of Spray-Induced Mixing and Thermal Decomposition of Urea Solution in SCR System. In Proceedings of the ASME Internal Combustion Engine Division Conference; ASME: New York, NY, USA, 2008; pp. 165–170. [Google Scholar] [CrossRef] [Scilit]
- Sluder, C.S.; Storey, J.M.E.; Lewis, S.A.; Lewis, L.A. Low Temperature Urea Decomposition and SCR Performance. In Proceedings of the SAE 2005 World Congress & Exhibition; SAE International: Warrendale, PA, USA, 2005; pp. 373–382. [Google Scholar] [CrossRef] [Scilit]
- Shahariar, G.M.H.; Lim, O.T. A Study on Urea-Water Solution Spray-Wall Impingement Process and Solid Deposit Formation in Urea-SCR de-NOx System. Energies 2019, 12, 125. [Google Scholar] [CrossRef] [Scilit]
- Shahariar, G.M.H.; Wardana, M.K.A.; Lim, O.T. Investigation of Urea-Water Solution Spray Impingement on the Hot Surface of Automotive SCR System. J. Mech. Sci. Technol. 2018, 32, 2935–2946. [Google Scholar] [CrossRef] [Scilit]
- Schaber, P.M.; Colson, J.; Higgins, S.; Thielen, D.; Anspach, B.; Brauer, J. Thermal Decomposition (Pyrolysis) of Urea in an Open Reaction Vessel. Thermochim. Acta 2004, 424, 131–142. [Google Scholar] [CrossRef] [Scilit]
- Ström, H.; Lundström, A.; Andersson, B. Choice of Urea-Spray Models in CFD Simulations of Urea-SCR Systems. Chem. Eng. J. 2009, 150, 69–82. [Google Scholar] [CrossRef] [Scilit]
- Rogóż, R.; Kapusta, Ł.J.; Bachanek, J.; Vankan, J.; Teodorczyk, A. Improved Urea-Water Solution Spray Model for Simulations of Selective Catalytic Reduction Systems. Renew. Sustain. Energy Rev. 2020, 120, 109616. [Google Scholar] [CrossRef] [Scilit]
- Lieber, C.; Koch, R.; Bauer, H.-J. Spray Evaporation of Urea-Water Solution: Experiments and Modelling. Exp. Therm. Fluid Sci. 2020, 116, 110108. [Google Scholar] [CrossRef] [Scilit]
- Ryddner, D.T.; Trujillo, M.F. Modeling Urea-Water Solution Droplet Evaporation. Emiss. Control Sci. Technol. 2015, 1, 80–97. [Google Scholar] [CrossRef] [Scilit]
- Wang, T.J.; Baek, S.W.; Lee, S.Y.; Kang, D.H.; Yeo, G.K. Experimental Investigation on Evaporation of Urea-Water-Solution Droplet for SCR Applications. AIChE J. 2009, 55, 3267–3276. [Google Scholar] [CrossRef] [Scilit]
- Bernhard, A.M.; Czekaj, I.; Elsener, M.; Wokaun, A.; Kröcher, O. Evaporation of Urea at Atmospheric Pressure. J. Phys. Chem. A 2011, 115, 2581–2589. [Google Scholar] [CrossRef] [Scilit] [PubMed]
- Fontanarosa, D.; De Giorgi, M.G.; Ciccarella, G.; Pescini, E.; Ficarella, A. Combustion Performance of a Low NOx Gas Turbine Combustor Using Urea Addition into Liquid Fuel. Fuel 2021, 288, 119701. [Google Scholar] [CrossRef] [Scilit]
- Xie, W.; Luo, Z.; Wang, H.; Zhou, Y.; Liu, Q.; Zhu, Y. Experimental Investigation on Double Wedge Type-V Shock/Shock Interaction Control Subject to SparkJet Array. Acta Mech. Sin. 2026, 42, 125207. [Google Scholar] [CrossRef] [Scilit]
- Liu, T.; Zhou, Y.; Zhao, Z.; Luo, Z.; Wang, H.; Deng, X.; Liu, Q. Lift Enhancement Optimization for an Airfoil with Distributed Dual Synthetic Jets Based on Deep Reinforcement Learning. Chin. J. Aeronaut. 2026; in press. [CrossRef] [Scilit]
- O’Rourke, P.J.; Amsden, A.A. A Particle Numerical Model for Wall Film Dynamics in Port-Injected Engines. In Proceedings of the 1996 SAE International Fall Fuels and Lubricants Meeting and Exhibition; Technical Paper No. 961961; SAE International: Warrendale, PA, USA, 1996. [Google Scholar] [CrossRef] [Scilit]
- Abu-Ramadan, E.; Saha, K.; Li, X. Modeling the Depleting Mechanism of Urea-Water-Solution Droplet for Automotive Selective Catalytic Reduction Systems. AIChE J. 2011, 57, 3210–3225. [Google Scholar] [CrossRef] [Scilit]
- Venkata Koti, M.; Saha, K. Modeling and Prediction of Urea-Water-Solution Droplet Evaporation Behavior Under a Convective Environment. J. Heat Mass Transf. 2026, 148, 041604. [Google Scholar] [CrossRef] [Scilit]
- Kuternowski, F.; Staszak, M.; Staszak, K. Modeling of Urea Decomposition in Selective Catalytic Reduction (SCR) for Systems of Diesel Exhaust Gases Aftertreatment by Finite Volume Method. Catalysts 2020, 10, 749. [Google Scholar] [CrossRef] [Scilit]
- Birkhold, F.; Meingast, U.; Wassermann, P.; Deutschmann, O. Modeling and Simulation of the Injection of Urea-Water-Solution for Automotive SCR DeNOx-Systems. Appl. Catal. B Environ. 2007, 70, 119–127. [Google Scholar] [CrossRef] [Scilit]
- Abu-Ramadan, E.; Saha, K.; Li, X. Modeling of the Injection and Decomposition Processes of Urea-Water-Solution Spray in Automotive SCR Systems. In Proceedings of the SAE 2011 World Congress & Exhibition, Detroit, MI, USA, 11–14 April 2011. [Google Scholar] [CrossRef] [Scilit]
- Mikhil, S.; Bakshi, S.; Anand, T.N.C. A Computational Model for the Evaporation of Urea-Water-Solution Droplets Exposed to a Hot Air Stream. Int. J. Heat Mass Transf. 2021, 168, 120878. [Google Scholar] [CrossRef] [Scilit]
- Beti, D.R.; Panja, P.; Jiang, C.; Milovic, M.; Robinson, R.; Ring, T.A.; Levey, R. Change in Hydrocarbon Composition in Rock Samples as a Function of Time: A Thermodynamic Evaporation Model. J. Nat. Gas Sci. Eng. 2020, 77, 103238. [Google Scholar] [CrossRef] [Scilit]
- Kjelstrup, S.; Bedeaux, D. Applied Non-Equilibrium Thermodynamics. In Non-Equilibrium Thermodynamics for Engineers and Scientists; World Scientific Publishing: Singapore, 2010. [Google Scholar]
- Peng, D.-Y.; Robinson, D.B. A New Two-Constant Equation of State. Ind. Eng. Chem. Fundam. 1976, 15, 59–64. [Google Scholar] [CrossRef] [Scilit]
- Fuller, E.N.; Schettler, P.D.; Giddings, J.C. A New Method for Prediction of Binary Gas-Phase Diffusion Coefficients. Ind. Eng. Chem. 1966, 58, 18–27. [Google Scholar] [CrossRef] [Scilit]
- Sangster, J. Phase Diagrams and Thermodynamic Properties of Binary Systems of Drugs. J. Phys. Chem. Ref. Data 1999, 28, 889–930. [Google Scholar] [CrossRef] [Scilit]
- Emel’yanenko, V.N.; Kabo, G.J.; Verevkin, S.P. Measurement and Prediction of Thermochemical Properties: Improved Increments for the Estimation of Enthalpies of Sublimation and Standard Enthalpies of Formation of Alkyl Derivatives of Urea. J. Chem. Eng. Data 2006, 51, 79–87. [Google Scholar] [CrossRef] [Scilit]
- Nishad, K.; Sadiki, A.; Janicka, J. Numerical Investigation of AdBlue Droplet Evaporation and Thermal Decomposition in the Context of NOx-SCR Using a Multi-Component Evaporation Model. Energies 2018, 11, 222. [Google Scholar] [CrossRef] [Scilit]
- Vikas, R.; Mallikarjuna, J.M.; Ganesan, V. 3-D Numerical Study of Effect of Flow Parameters upon the Uniformity of NH3 in Urea-SCR. Adv. Mater. Res. 2012, 505, 175–179. [Google Scholar] [CrossRef] [Scilit]
- Lundström, A.; Waldheim, B.; Ström, H.; Westerberg, B. Modelling of Urea Gas Phase Thermolysis and Theoretical Details on Urea Evaporation. Proc. Inst. Mech. Eng. Part D J. Automob. Eng. 2011, 225, 1392–1398. [Google Scholar] [CrossRef] [Scilit]
- Yim, S.D.; Kim, S.J.; Baik, J.H.; Nam, I.S.; Mok, Y.S.; Lee, J.H.; Cho, B.K.; Oh, S.H. Decomposition of Urea into NH3 for the SCR Process. Ind. Eng. Chem. Res. 2004, 43, 4856–4863. [Google Scholar] [CrossRef] [Scilit]
- Birkhold, F.; Meingast, U.; Wassermann, P.; Deutschmann, O. Analysis of the Injection of Urea-Water-Solution for Automotive SCR DeNOx-Systems: Modeling of Two-Phase Flow and Spray/Wall-Interaction. In Proceedings of the SAE 2006 World Congress & Exhibition, Detroit, MI, USA, 3–6 April 2006. [Google Scholar] [CrossRef] [Scilit]
- Koebel, M.; Elsener, M.; Kleemann, M. Urea-SCR: A Promising Technique to Reduce NOx Emissions from Automotive Diesel Engines. Catal. Today 2000, 59, 335–345. [Google Scholar] [CrossRef] [Scilit]












Disclaimer/Publisher’s Note: The statements, opinions and data contained in all publications are solely those of the individual author(s) and contributor(s) and not of MDPI and/or the editor(s). MDPI and/or the editor(s) disclaim responsibility for any injury to people or property resulting from any ideas, methods, instructions or products referred to in the content. |
© 2026 by the authors. Licensee MDPI, Basel, Switzerland. This article is an open access article distributed under the terms and conditions of the Creative Commons Attribution (CC BY) license.