


Abstract
In chemical industrial parks, evacuation during LPG tank leakage is governed not only by travel distance but by the loss of safe corridors, failed exits, and congestion induced by spatially coupled vapor exposure, explosion overpressure, and thermal radiation. Existing consequence assessment studies usually delineate hazardous zones, while evacuation models often optimize routes on a fixed network with available exits and simplified capacity constraints; the coupling between multi-hazard consequence fields and capacity-constrained evacuation assignment remains insufficient. This study proposes a spatially constrained, congestion-aware evacuation optimization framework. ALOHA-derived AEGL exposure, vapor cloud explosion overpressure, and jet fire radiation zones are mapped onto the plant network to identify unsafe nodes, unavailable links, and failed exits. A capacity-constrained model is then established to minimize system-level RSET under an ASET constraint, and a congestion-aware ant colony algorithm balances evacuees among available exits by incorporating risk and density penalties. In a petrochemical plant case with 717 evacuees and 74 nodes, Gate 3 failure makes the nearest-exit strategy infeasible, whereas the proposed strategy reduces RSET from 560.8 to 504.9 s. The framework links accident consequence assessment with actionable evacuation routing for chemical parks.
1. Introduction
Liquefied petroleum gas (LPG) is widely used as a fuel and petrochemical feedstock because it can be stored and transported efficiently under pressure. In chemical industrial parks, however, the concentration of LPG storage facilities means that a single loss-of-containment event can affect multiple plant zones, evacuation corridors, and gates. Once released, LPG can vaporize rapidly and form a dense flammable cloud near the ground. Under unfavorable meteorological and layout conditions, the cloud may disperse through equipment-dense areas and, after ignition, develop into a flash fire, vapor cloud explosion, jet fire, or cascading accident scenario [1,2]. Therefore, evacuation during LPG accidents is not a simple shortest path problem. It is a time critical decision problem constrained by spatially non-uniform vapor exposure, explosion overpressure, thermal radiation, and changing exit availability [3,4,5].
Previous studies have improved the prediction of hazardous consequences from LPG and other flammable materials releases. Computational fluid dynamics and engineering consequence models have been used to quantify the effects of tank spacing, leakage aperture, wind conditions, obstacle congestion, and ignition location on vapor cloud size and explosion overpressure [3,4]. Recent studies have also shown that equipment layout can amplify overpressure and that wind effects on the extent of flammable clouds may be non-monotonic [5,6]. These studies provide useful tools for defining dangerous zones, but their results are often used as stand-alone consequence maps. For evacuation planning, the key unresolved issue is how such maps should be converted into operational constraints on nodes, links, and exits in an evacuation network.
Research on multi-hazard and domino-risk assessment has further shown that vapor release, fire, explosion, and thermal radiation may interact spatially and temporally, increasing the overall accident risk [7,8,9,10]. These findings are directly relevant to evacuation because a route that is feasible in a pre-accident network may become unsafe when hazardous vapor exposure, blast overpressure, and thermal radiation overlap. However, many multi-hazard studies still focus mainly on accident evolution and vulnerability quantification, while the explicit translation of consequence zones into failed exits, unavailable links, and restricted corridors remains insufficient.
Emergency evacuation in chemical accidents has been studied through toxic gas dispersion coupling, risk-based path planning, shelter location optimization, surrogate modeling, and agent-based simulation [11,12,13,14,15]. These approaches mark clear progress beyond simple shortest path planning. Nevertheless, three limitations remain important for LPG accidents in chemical industrial parks. First, accident consequence assessment and evacuation assignment are often treated as weakly coupled modules. Second, exits are frequently assumed to remain usable unless manually removed. Third, the balance among route safety, route capacity, and density-induced congestion is often secondary to individual path cost [16,17,18].
The scientific issue addressed in this study is therefore not simply how to simulate LPG consequences or how to find a short evacuation route. The key issue is how to integrate spatially heterogeneous multi-hazard consequences with capacity-constrained evacuation assignment so that route safety, exit availability, and congestion evolution are considered simultaneously. To address this issue, this study develops a spatially constrained and congestion-aware evacuation route optimization framework for LPG leakage accidents in chemical industrial parks. The framework maps ALOHA-derived consequence zones onto the evacuation network, identifies failed exits and unavailable links, applies a congestion-aware ant colony optimization algorithm, and validates the optimized assignment by Pathfinder simulation (version: 2025.1.0826).
The value of this work lies in linking accident consequence analysis and evacuation decision making at the network-constraint level. Compared with risk maps alone, the proposed framework converts multi-hazard zones into usable routing constraints. Compared with the nearest-exit or shortest-path evacuation strategy, it explicitly considers failed exits, unavailable links, route capacity, and density-induced congestion. Compared with microscopic simulation alone, it provides an optimization layer that generates coordinated route assignments before simulation validation.
The novelty of this study lies in the explicit conversion of multi-hazard accident consequences into operational evacuation network constraints and in the subsequent system-level assignment of evacuees under capacity and congestion limits. Previous LPG consequence studies have mainly focused on the prediction of vapor dispersion, explosion overpressure, or thermal radiation footprints, whereas the evacuation implications of these footprints are often left as qualitative risk interpretation. Existing evacuation optimization studies have improved route planning under toxic gas or multi-hazard conditions, but many of them still optimize on a pre-defined network in which exit failure, link unavailability, and congestion-induced redistribution are not simultaneously embedded in the routing model. In contrast, the proposed framework first maps ALOHA-derived AEGL exposure, vapor cloud explosion overpressure, and jet fire thermal radiation zones onto the plant network to identify unsafe nodes, unavailable links, and failed exits. It then applies a congestion-aware ant colony optimization algorithm to generate coordinated route assignments and validates the optimized evacuation performance using Pathfinder. Therefore, the contribution of this work is not only a route search algorithm but also an integrated consequence-to-network decision framework for LPG leakage evacuation in chemical industrial parks.
2. Materials and Methods
2.1. Study Framework
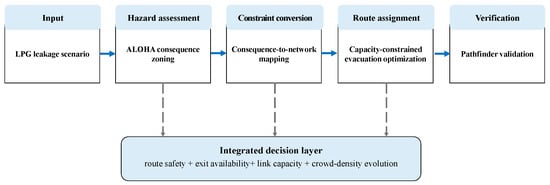
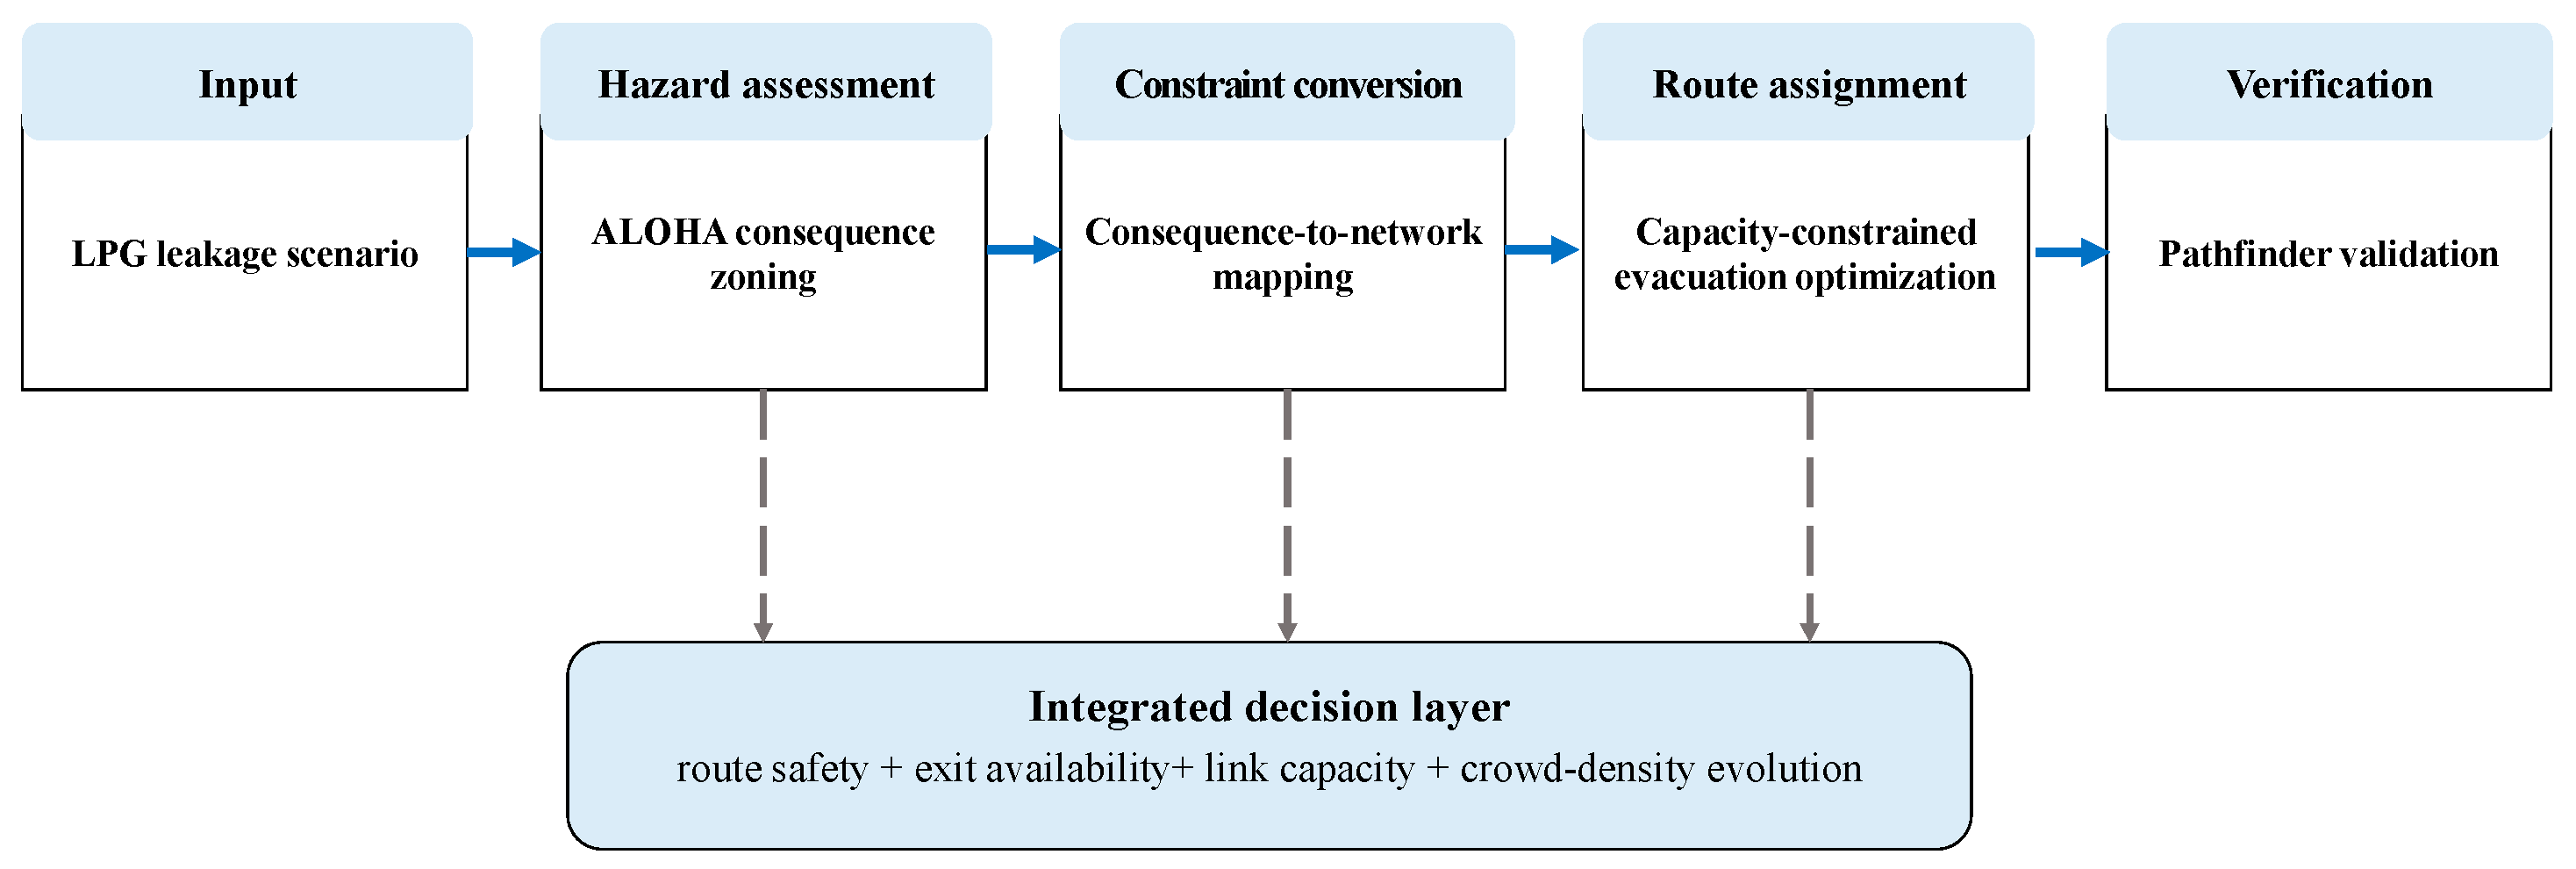
This study proposes a spatially constrained and congestion-aware evacuation optimization framework for LPG leakage accidents in chemical industrial parks. The framework contains four steps. First, ALOHA is used to estimate the consequence zones of hazardous vapor exposure, vapor cloud explosion overpressure, and jet fire thermal radiation under a conservative leakage scenario. Second, the consequence zones are overlaid on the plant evacuation network to identify unsafe nodes, unavailable links, and failed exits. Third, a capacity-constrained evacuation model is established to minimize system-level Required Safe Egress Time (RSET) under the Available Safe Egress Time (ASET) constraint. Fourth, a congestion-aware ant colony optimization algorithm generates coordinated route assignments, which are independently validated in Pathfinder. The overall logic of the proposed method is illustrated in Figure 1. The figure shows how LPG consequence modeling, network-constraint conversion, route optimization, and Pathfinder validation are connected into a single workflow. This structure ensures that evacuation planning is performed on the scenario-specific feasible network rather than on the original pre-accident network.
Figure 1.
Workflow of the proposed spatially constrained and congestion-aware evacuation optimization framework.
2.2. Multi-Hazard Consequence-to-Network Mapping
In LPG leakage accidents, the hazardous effects that most directly influence evacuation planning include hazardous vapor exposure, vapor cloud explosion overpressure, and jet fire thermal radiation. These effects have different spatial characteristics. Hazardous vapor clouds may spread downwind and accumulate near the ground, especially in low-lying or equipment-dense areas. Explosion overpressure may affect a broader area around the flammable cloud and can damage exits, roads, or nearby structures. Thermal radiation is usually more localized near the release or flame source, but it may immediately threaten personnel and block nearby routes.
Let H denote the set of hazardous effects considered in this study:
where hv, hp, and hr represent hazardous vapor exposure, explosion overpressure, and thermal radiation, respectively. For each hazardous effect h ∈ H, a spatial consequence zone Ωh is obtained according to the corresponding safety threshold. The excluded high-risk zone is defined as the union of all unacceptable consequence zones:
The evacuation environment is abstracted as a directed graph:
where V is the node set, and E is the link set. The node set includes personnel origin nodes, intermediate intersection nodes, and candidate exit nodes. Each node I ∈ V has a spatial coordinate xi, and each link (i,j) ∈ E is represented by a road or corridor segment Γij.
A binary safety indicator is defined for each node:
where yi = 1 means that node i is feasible for evacuation, and yi = 0 means that the node is unsafe and should be removed from the feasible network.
Similarly, the feasibility of each link is defined as:
where zij = 1 indicates that link (i,j) does not pass through an excluded high-risk zone. A link is retained in the feasible evacuation network only when both of its end nodes are feasible and the link itself does not intersect the excluded consequence zones. Therefore, the feasible link set is expressed as:
For each candidate exit e, its availability is determined by both its own safety condition and the feasibility of its connected links:
where ae = 1 means that exit e remains available, and ae = 0 means that the exit fails under the considered accident scenario. The available exit set is then defined as:
where S is the set of all candidate exits. This mapping procedure converts multi-hazard consequence fields into explicit network constraints. It prevents the optimization algorithm from selecting mathematically short but physically unsafe routes.
2.3. Capacity-Constrained Evacuation Network Model
After consequence-to-network mapping, the evacuation problem is solved on the feasible graph:
where Vf and Ef are the feasible node and link sets after unsafe nodes, unavailable links, and failed exits have been removed.
Let K denote the set of evacuees or evacuee groups. Each evacuee k ∈ K starts from an origin node ok and must be assigned to one available exit e ∈ Sf. The evacuation route of evacuee k is denoted by rk. A route is feasible only if it is fully composed of feasible links and terminates at an available exit:
The evacuation objective is to minimize the completion time of the last evacuee. This system-level completion time is defined as the Required Safe Egress Time:
where Tkarr is the arrival time of evacuee k at a safe exit. Unlike the average evacuation time, RSET directly reflects whether the whole population can complete evacuation within the available safety time window. Therefore, the optimization objective is:
The evacuation must also satisfy the scenario-specific safety time constraint:
where ASET is the Available Safe Egress Time determined by the accident scenario and safety threshold. If the optimized RSET exceeds ASET, the evacuation scheme is judged to be infeasible for the considered scenario.
In addition to time feasibility, crowd movement is constrained by link capacity. Let nij(t) denote the number of evacuees located on link (i,j) at time t, and let Nijmax be the maximum number of evacuees that can be safely accommodated on that link. The link-capacity constraint is written as:
The corresponding crowd density constraint is:
where ρij(t) is the crowd density on link (i,j), Aij is the effective walkable area of the link, and ρmax is the maximum allowable density. This constraint is introduced to avoid unrealistic route assignments that overload a narrow corridor or a limited exit.
The above formulation indicates that evacuation success depends not only on route length but also on the interaction among route safety, exit availability, passage capacity, and density-induced delay. Under LPG accident conditions, a route with a short physical distance may become infeasible if it crosses a high-risk zone, terminates at a failed exit, or causes excessive congestion at a remaining exit.
2.4. Congestion-Aware Ant Colony Optimization Algorithm
The evacuation assignment problem under multi-hazard spatial constraints and capacity limits is a constrained combinatorial optimization problem. As the number of evacuees, origins, links, and candidate exits increases, exact solution methods may become computationally expensive. Therefore, this study adopts an ant colony optimization algorithm and modifies it according to the physical characteristics of evacuation under chemical accident conditions. The congestion-aware ant colony optimization algorithm was implemented in Python 3.11.
In standard ant colony optimization, artificial ants construct paths by moving from one node to another according to pheromone intensity and heuristic information. For evacuee or ant k, the transition probability from node i to node j at iteration t is defined as:
where τij(t) is the pheromone intensity on link (i,j), ηij(t) is the heuristic value, α is the pheromone weight parameter, β is the heuristic weight parameter, and allowedk is the feasible node set that ant k can visit next.
In this study, the heuristic value is not determined by distance alone. To reflect both route safety and congestion risk, the heuristic function is modified as:
where lij is the physical length of link (i,j), Rij is the risk penalty of the link, Cij(t) is the dynamic congestion factor, and λ and μ are weighting coefficients. Links located in excluded high-risk zones are not included in the feasible search space. For links near restricted zones or with relatively high exposure risk, Rij increases their route cost and reduces their probability of being selected.
The congestion factor is defined as:
where ρ0 is the congestion-perception threshold, and ρmax is the maximum allowable crowd density. When the density on a link is lower than ρ0, the congestion penalty is not activated. When the density exceeds ρ0, the attractiveness of the link decreases gradually, which guides subsequent ants to select alternative routes. This mechanism helps prevent excessive convergence toward a single road segment or exit.
After all ants complete one route construction cycle, the pheromone intensity is updated as follows:
where φ is the pheromone evaporation coefficient, Q is a constant, and Jk is the route cost associated with ant k. In this study, Jk is evaluated by considering travel time, risk penalty, and congestion penalty. Routes that reduce system-level RSET and avoid overloaded links receive stronger pheromone reinforcement.
The main procedure of the congestion-aware ant colony algorithm is as follows.
Step 1: Generate the feasible evacuation network Gf based on the multi-hazard consequence-to-network mapping results.
Step 2: Initialize the pheromone intensity on all feasible links and set algorithm parameters, including the number of ants, maximum iterations, pheromone evaporation coefficient, and weighting coefficients.
Step 3: For each origin node, ants construct candidate routes to available exits according to the modified transition probability.
Step 4: During route construction, update the virtual link load and crowd density, and calculate the dynamic congestion factor for each link.
Step 5: Evaluate each candidate evacuation assignment according to RSET, route feasibility, link capacity, crowd density, and exit load balance.
Step 6: Update pheromone intensity. Better route combinations with lower RSET and fewer congestion penalties receive stronger pheromone reinforcement.
Step 7: Repeat Steps 3–6 until the maximum number of iterations is reached or the best RSET remains stable for several consecutive iterations.
Through the above procedure, the proposed algorithm searches for a coordinated evacuation assignment rather than independent shortest routes. It is therefore suitable for accident scenarios in which one or more exits fail, and evacuees must be redistributed among the remaining exits.
To improve reproducibility, the hyperparameters used in the congestion-aware ant colony optimization algorithm are reported in Table 1. The parameter values were selected through preliminary calibration runs on the same feasible evacuation network. During calibration, the pheromone evaporation coefficient, the risk weighting coefficient, the congestion weighting coefficient, and the congestion perception threshold were varied within reasonable ranges. The final parameter set was selected according to three criteria: stable convergence within 100 iterations, minimization of system-level RSET, and avoidance of excessive load concentration on any single exit or link.
Table 1.
Hyperparameters used in the congestion-aware ant colony optimization algorithm.
The values of λ, μ, and ρ0 were further checked through sensitivity tests because they directly influence the trade-off between shorter routes and congestion avoidance. When μ was too small, the algorithm tended to assign too many evacuees to Gate 2, which increased queuing delay. When μ was too large, evacuees were excessively diverted to longer routes, which increased walking time. In the calibration tests, μ values of 0.30, 0.60, and 0.80 produced optimized RSET values of 528.7 s, 504.9 s, and 516.2 s, respectively. Therefore, μ = 0.60 was selected. Similarly, ρ0 values of 1.5, 2.0, and 2.5 persons/m2 produced RSET values of 511.8 s, 504.9 s, and 522.4 s, respectively. The selected value ρ0 = 2.0 persons/m2 allowed the algorithm to perceive congestion before severe queuing occurred, while avoiding excessive diversion to longer routes.
2.5. Plant Layout and Evacuation Network
A petrochemical plant located in a coastal city of Shandong Province, China, is selected as the case study. The plant covers approximately 532,200 m2 and contains nine functional zones, including the storage area, power supply and monitoring area, supply area, tank area, process area, safety facility area, office area, living area, and reserved area. Four main gates are used for daily traffic and emergency evacuation and are denoted as Gate 1, Gate 2, Gate 3, and Gate 4.
The evacuation population is 717 persons. The free horizontal walking speed is set to 1.2 m/s. For route optimization, the physical plant layout is converted into a directed graph with 74 nodes, including 23 personnel origin nodes, intermediate road intersection nodes, and four candidate exit nodes. Network links represent roads or walkable corridors, and each link is assigned a physical length and a maximum passage capacity.
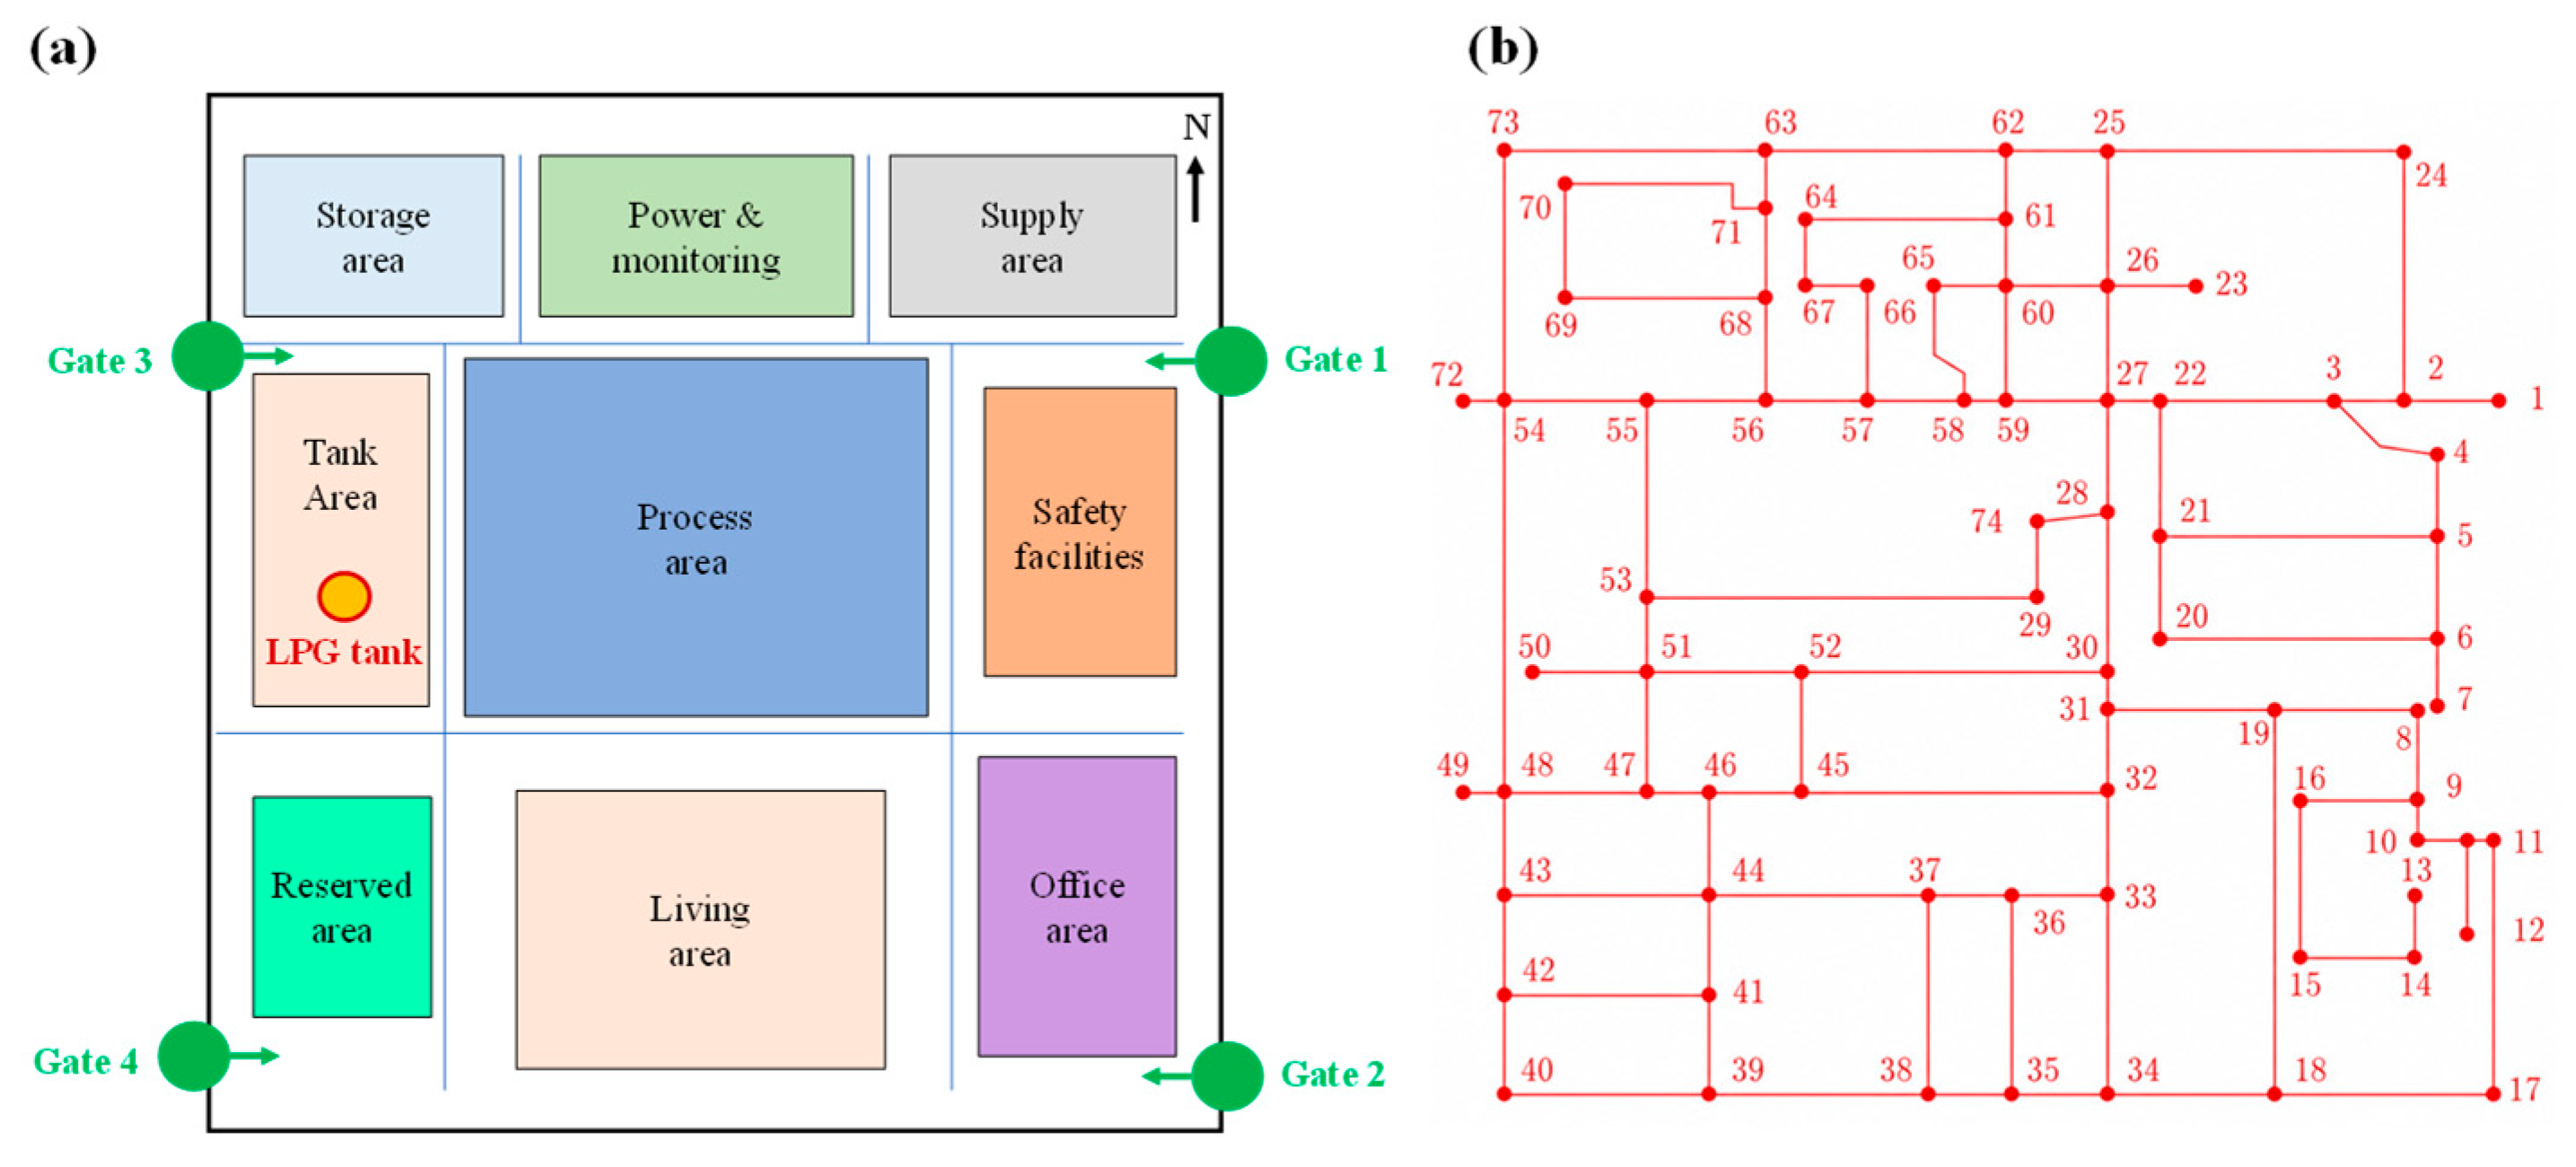
The No. 5 LPG spherical tank located in the northwestern tank area was selected as the accident source because it is close to important internal roads and candidate evacuation routes. A leakage event at this location can therefore affect both accident-consequence distribution and evacuation-network feasibility. The case-study plant layout and its corresponding evacuation-network representation are shown in Figure 2. Figure 2a presents the spatial arrangement of the main functional areas, the selected LPG tank, and the four candidate evacuation exits, whereas Figure 2b shows the directed graph constructed from the plant road and walkway system for subsequent consequence mapping and route optimization.
Figure 2.
Case study: plant layout and evacuation network representation. (a) Simplified spatial layout of the petrochemical plant, including major functional areas, the selected No. 5 LPG tank leakage source, and Gates 1–4 as candidate evacuation exits. (b) Directed evacuation network representation constructed from the plant road system.
2.6. LPG Leakage Scenario and Safety Thresholds
The accident scenario assumes continuous leakage from an LPG storage tank during normal operation. ALOHA (version 5.4.7) is used to estimate hazardous vapor exposure, vapor cloud explosion overpressure, and jet fire thermal radiation zones. The purpose is to obtain spatial consequence boundaries for evacuation planning rather than to reproduce all details of ignition timing, flame development, or transient accident evolution.
The meteorological and release parameters are selected to represent conservative conditions for emergency planning. Under such conditions, released LPG vapor may spread downwind, accumulate near the ground, and form hazardous areas that overlap with evacuation corridors. Immediate ignition and delayed ignition are both considered at the scenario definition level, so that jet fire thermal radiation and vapor cloud explosion effects can be included in the subsequent network screening process. The main input parameters for the consequence assessment are summarized in Table 2.
Table 2.
Main input parameters for the LPG leakage consequence assessment.
This scenario definition provides a unified accident basis for the following analyses. In the consequence analysis stage, the hazardous vapor exposure zone, explosion overpressure contour, and thermal radiation zone are generated separately. In the evacuation optimization stage, these zones are not treated as descriptive risk maps only; instead, they are mapped onto the evacuation graph to determine which nodes, links, and exits remain feasible.
To translate accident consequences into evacuation constraints, safety thresholds are defined for each hazardous effect. The basic rule is conservative: if a node, link, or exit is located within a severe injury or fatality zone of any considered hazardous effect, it is removed from the feasible evacuation network. This rule ensures that the optimization algorithm does not select routes that are mathematically short but physically unsafe. The threshold criteria and their network interpretations are listed in Table 3. These thresholds define the boundary conditions for subsequent consequence mapping, route optimization, and Pathfinder validation.
Table 3.
Safety thresholds and their network-screening rules.
The ASET value used in this study was not assumed as a generic constant. It was determined from the LPG accident consequence assessment and the corresponding safety thresholds. For evacuation feasibility, ASET was defined as the earliest time at which any critical evacuation corridor, exit, or adjacent waiting area became untenable under the selected LPG leakage scenario. Specifically, three limiting times were considered: the time at which the hazardous vapor exposure threshold reached a critical network element, the time associated with the vapor cloud explosion overpressure threshold, and the time at which jet fire thermal radiation made the near-source evacuation area untenable. Therefore, the scenario-specific ASET was calculated as:
where tAEGL is the limiting time associated with the AEGL exposure threshold, tVCE is the limiting time associated with the 3.5 psi overpressure threshold, and tRAD is the limiting time associated with the 10 kW/m2 thermal radiation threshold. The three hazard-specific limiting times and the determination of the final scenario-specific ASET are summarized in Table 4.
Table 4.
Derivation of the scenario-specific ASET from hazard-specific limiting times.
In the base scenario, the earliest limiting time was obtained as 532 s. Therefore, ASET = 532 s was used as the system-level safety time constraint. This value represents the available time window for all evacuees to reach safe exits before the selected accident consequence becomes untenable for evacuation.
2.7. Pathfinder-Based Simulation Validation
The optimized route assignment is further validated using Pathfinder (version 2025.1.0826). Pathfinder is used as an independent microscopic evacuation simulation tool to evaluate whether the optimized assignment can reduce congestion and satisfy the ASET constraint under realistic pedestrian interaction conditions. It does not participate in the route optimization process, and its simulation results are not fed back into the ant colony algorithm.
Two comparative evacuation scenarios are designed. In the first scenario, evacuees select the nearest available exit after failed exits and unsafe links have been removed. This scenario represents a common but uncoordinated evacuation strategy. In the second scenario, evacuees follow the route assignment generated by the proposed congestion-aware ant colony optimization algorithm. The two scenarios use the same plant layout, population distribution, walking speed setting, unavailable exits, and feasible network constraints. Therefore, the difference in evacuation performance can be attributed to the route assignment strategy.
The validation focuses on three indicators: the final RSET, the satisfaction of the ASET constraint, and the spatial distribution of congestion at key links and exits. If the optimized assignment produces a lower RSET, reduces severe queuing at bottleneck exits, and satisfies the ASET constraint, it can be considered more effective than the nearest-exit strategy under the selected LPG accident scenario.
3. Results
3.1. Multi-Hazard Consequence Mapping and Failed Exit Identification
The ALOHA simulation results showed that the selected LPG leakage scenario produced three spatially different hazardous consequence zones. Hazardous vapor exposure spread mainly in the downwind direction and could accumulate near the ground because LPG vapor is denser than air. The severe exposure zone was concentrated near the release source and the main downwind side, indicating that personnel should not be guided through this area during evacuation.
The vapor cloud explosion overpressure field affected a broader region around the flammable cloud. The 3.5 psi overpressure contour was used as the severe injury and structural damage threshold. Several roads, nodes, and exits near the northwestern tank area fell within or close to this contour, making them unreliable for evacuation. The jet fire thermal radiation zone was more localized, but the near-source radiation intensity was high enough to threaten personnel located close to the No. 5 LPG tank.
Overall, hazardous vapor exposure mainly controlled downwind evacuation safety, explosion overpressure affected exit and road availability, and thermal radiation controlled the near-source exclusion area. Their combined effect changed the plant evacuation network from a complete pre-accident network into a scenario-specific feasible network.
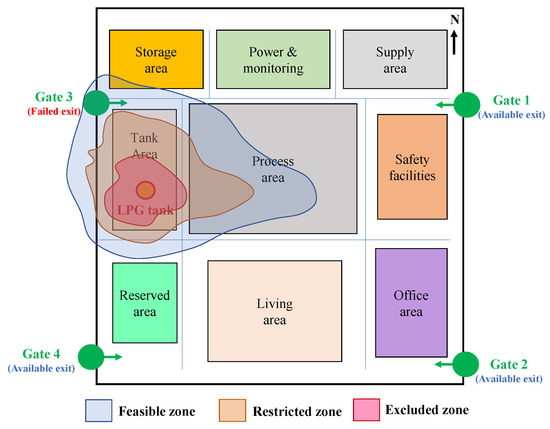
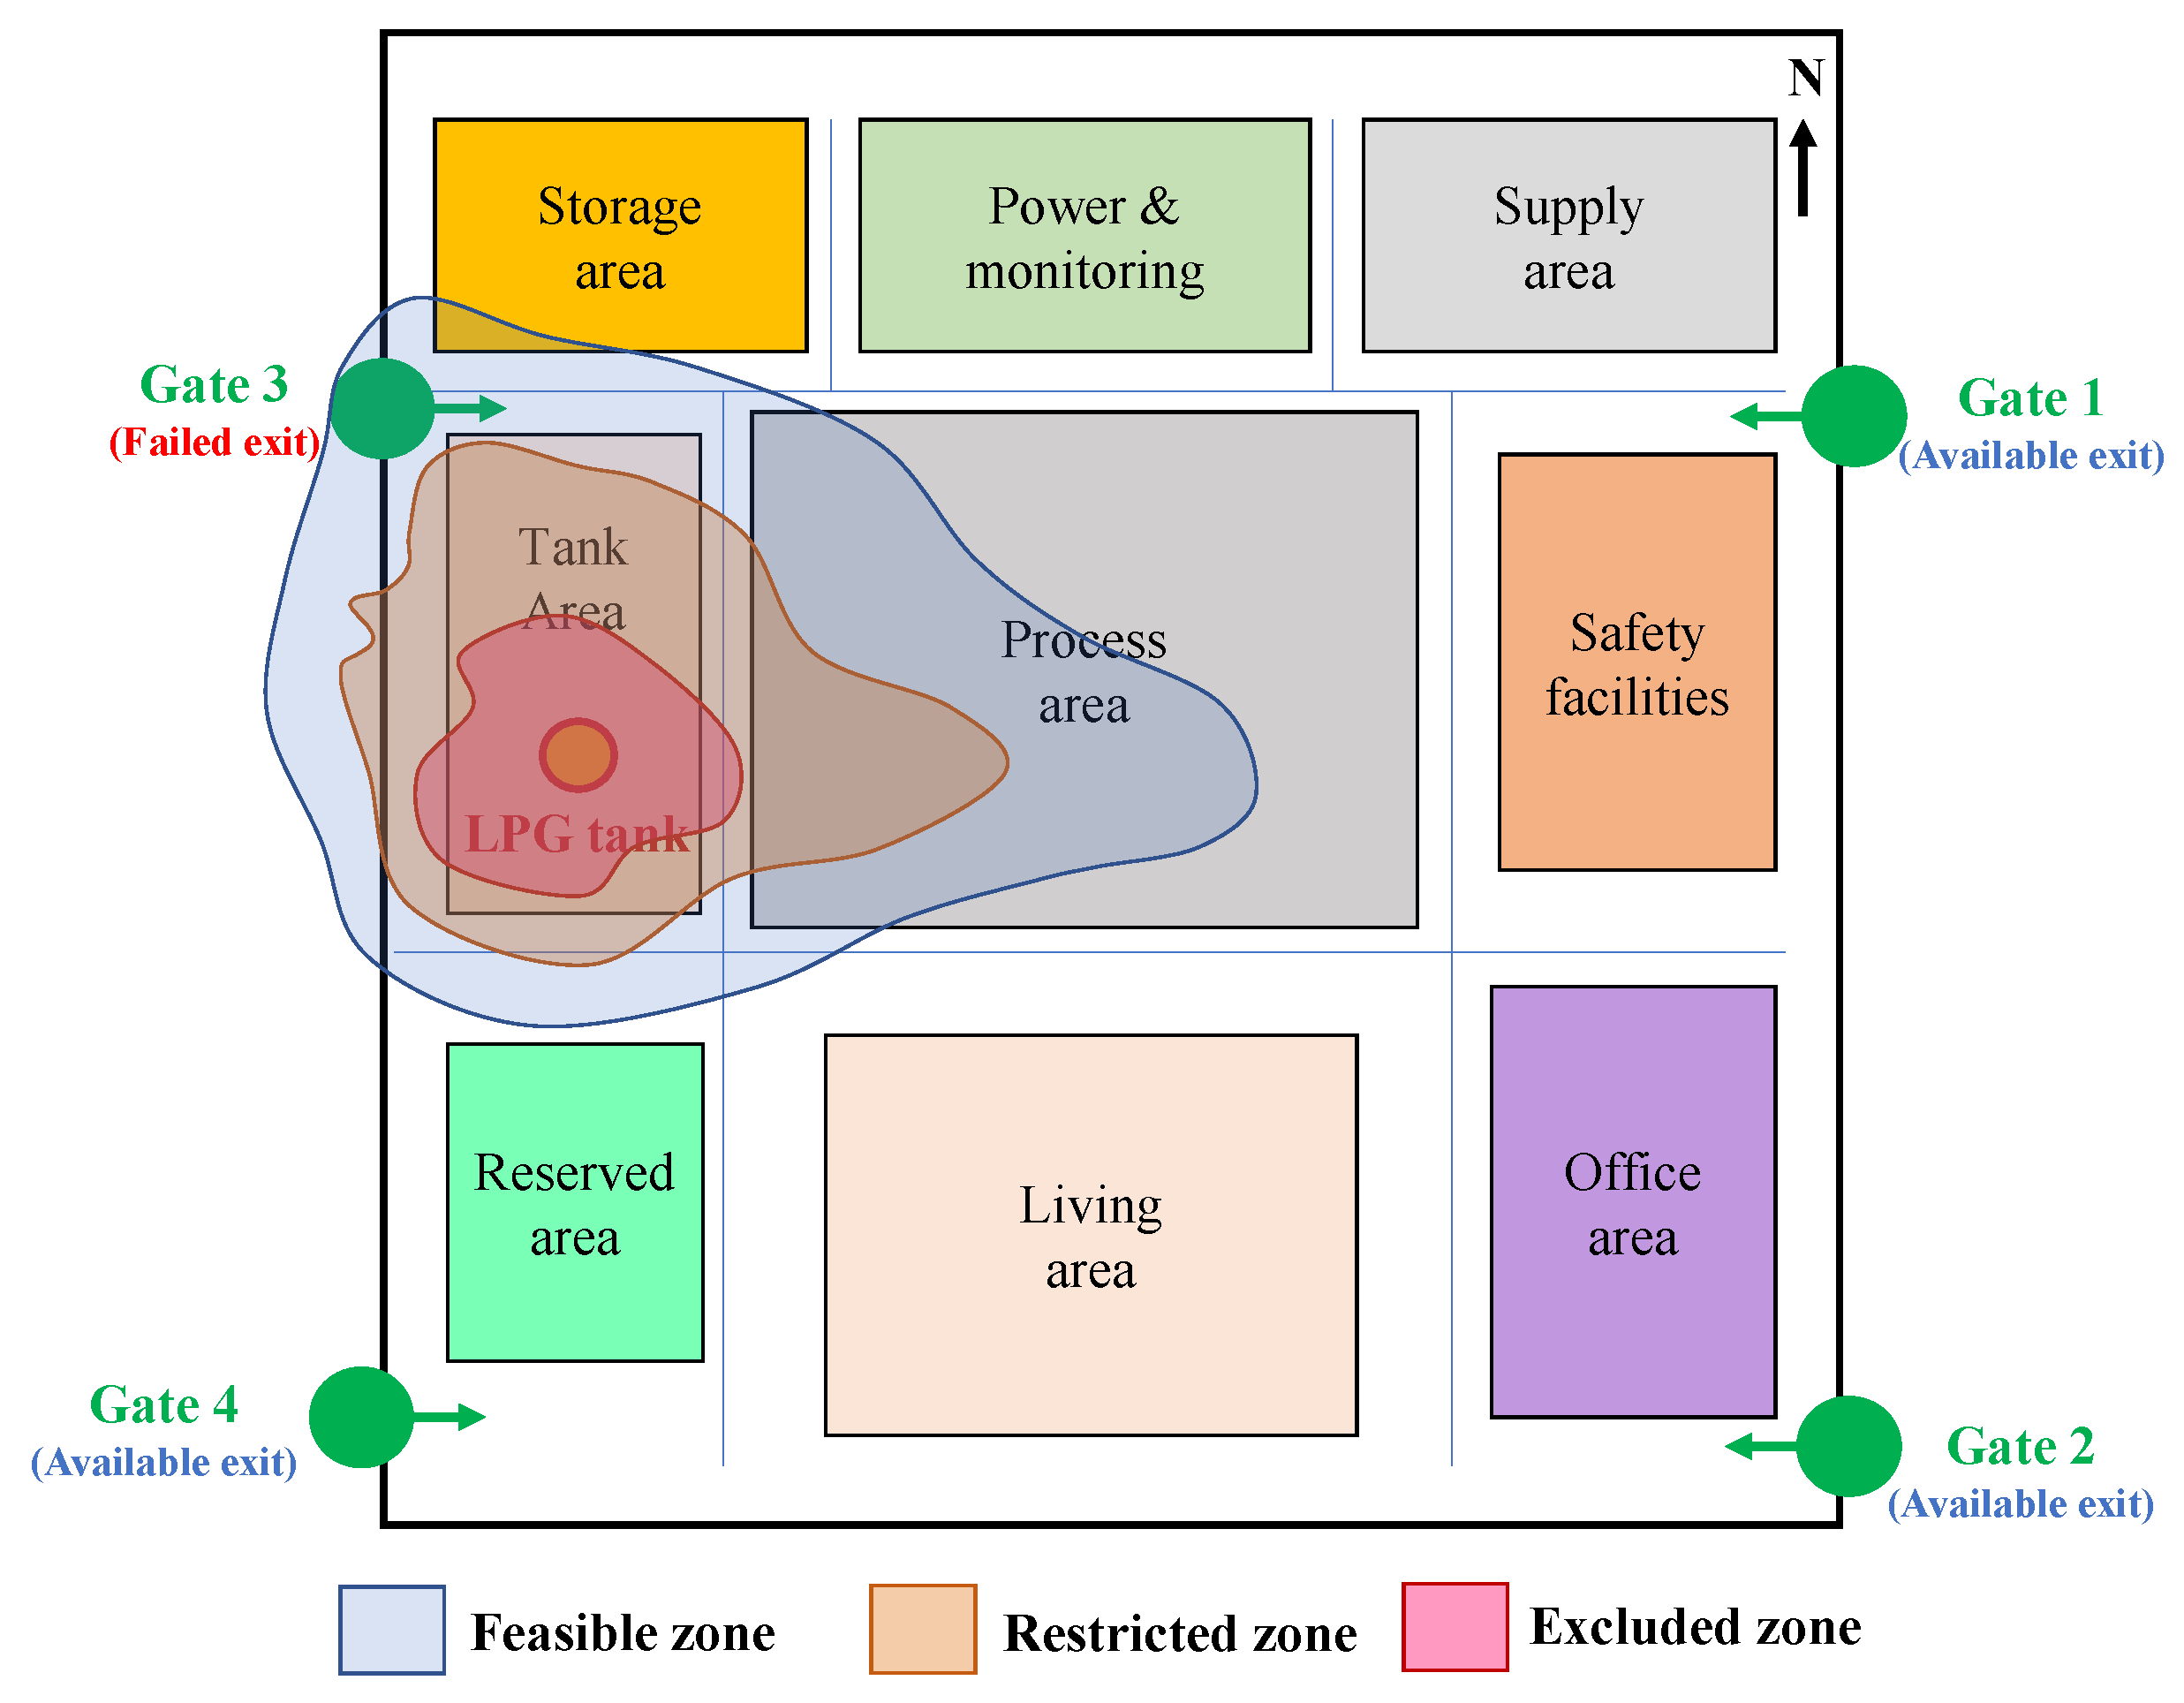
The spatial relationship between accident consequence zones and the plant layout is shown in Figure 3. The AEGL exposure zone, 3.5 psi overpressure contour, and 10 kW/m2 radiation zone overlap around the northwestern tank area. As a result, Gate 3 is classified as a failed exit, while Gates 1, 2, and 4 remain available for evacuation.
Figure 3.
Spatial mapping of LPG leakage consequence zones onto the plant layout.
The consequence zones were overlaid on the plant evacuation network to identify unsafe nodes, unavailable links, and failed exits. In the case study, Gate 3 and its adjacent links were located within the overlapping influence region of severe vapor exposure and explosion overpressure. Therefore, Gate 3 was classified as unavailable. Gates 1, 2, and 4 remained physically available. However, Gate 2 was close to several origin nodes and became congestion-sensitive after Gate 3 failed.
The consequence mapping result changed the available exit set from the original four-gate system to a three-gate system consisting of Gates 1, 2, and 4. Under this scenario, all 717 evacuees had to be evacuated through the remaining available exits, and the evacuation strategy was feasible only if RSET ≤ 532 s. This mapping result also explained why nearest-exit evacuation could fail. After Gate 3 was removed, the local shortest paths of many origin nodes shifted toward Gate 2. Although Gate 2 remained available, excessive convergence toward this exit could produce queuing delay that offsets the benefit of shorter walking distance.
3.2. Optimization Convergence and Comparative Simulation Results
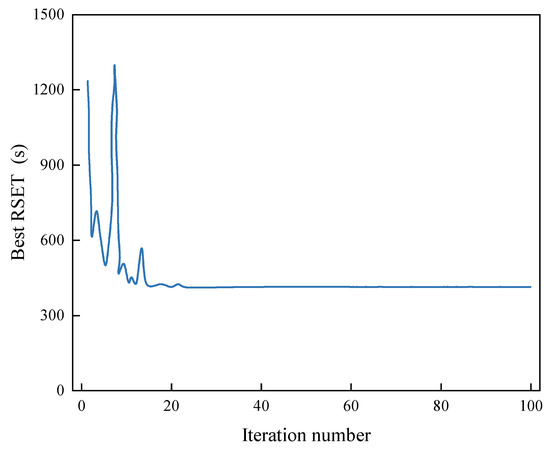
The congestion-aware ant colony optimization algorithm was applied only to the feasible network obtained after consequence-to-network mapping. Routes crossing excluded zones, terminating at failed exits, or violating hard feasibility constraints were discarded during route construction and were not accepted as valid evacuation assignments. Therefore, the high RSET values observed in the early iterations of Figure 4 do not represent unsafe routes through hazardous zones. Instead, they represent high-cost but feasible route assignments generated before the pheromone distribution and congestion penalty had guided evacuees away from overloaded links and exits. During the first 20 iterations, many feasible assignments still concentrated excessive flow at Gate 2 or produced long detours. As the pheromone update and congestion penalty progressively improved route selection, the best RSET decreased rapidly and then stabilized after approximately 40 iterations.
Figure 4.
Convergence of the congestion-aware ant colony optimization algorithm. The early high RSET values correspond to feasible but poorly balanced route assignments with excessive exit load concentration or long detours. Routes crossing excluded hazard zones, using unavailable links, or terminating at failed exits were excluded throughout the optimization process.
Pathfinder simulation was then used to validate the optimization results. In Scenario A, the nearest-exit strategy caused a strong concentration of pedestrian flow toward Gate 2. After Gate 3 was removed, many origin nodes in the process and office areas became closer to Gate 2 than to Gates 1 and 4. As a result, evacuees from multiple directions moved toward the same exit simultaneously. Pathfinder showed that a severe queue formed in front of Gate 2, and the effective discharge rate decreased as local density increased. The final RSET was 560.8 s, exceeding the ASET of 532 s by 28.8 s. Therefore, the nearest-exit strategy failed under the selected scenario.
In Scenario B, the optimized assignment redistributed evacuees among Gates 1, 2, and 4. Approximately 45% of evacuees were assigned to Gate 2, while the remaining evacuees were diverted to Gates 1 and 4. This distribution did not minimize every individual’s walking distance, but it reduced excessive load concentration at the most attractive exit. The final RSET was 504.9 s, which was lower than the ASET of 532 s. Compared with Scenario A, RSET was reduced by 55.9 s, corresponding to a 9.97% improvement. The Pathfinder validation results are summarized in Table 5. The two scenarios used the same physical exit set, failed exit condition, population size, walking speed setting, and ASET threshold. Therefore, the difference in evacuation performance could be attributed mainly to the route assignment strategy.
Table 5.
Comparison of evacuation performance between the two strategies.
3.3. Gate 2 Queuing Dynamics and RSET Composition
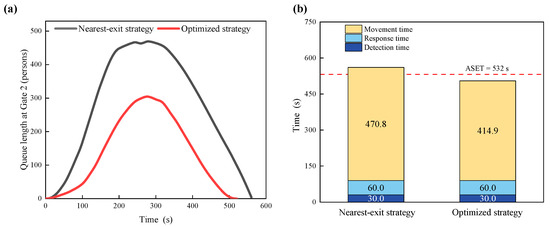
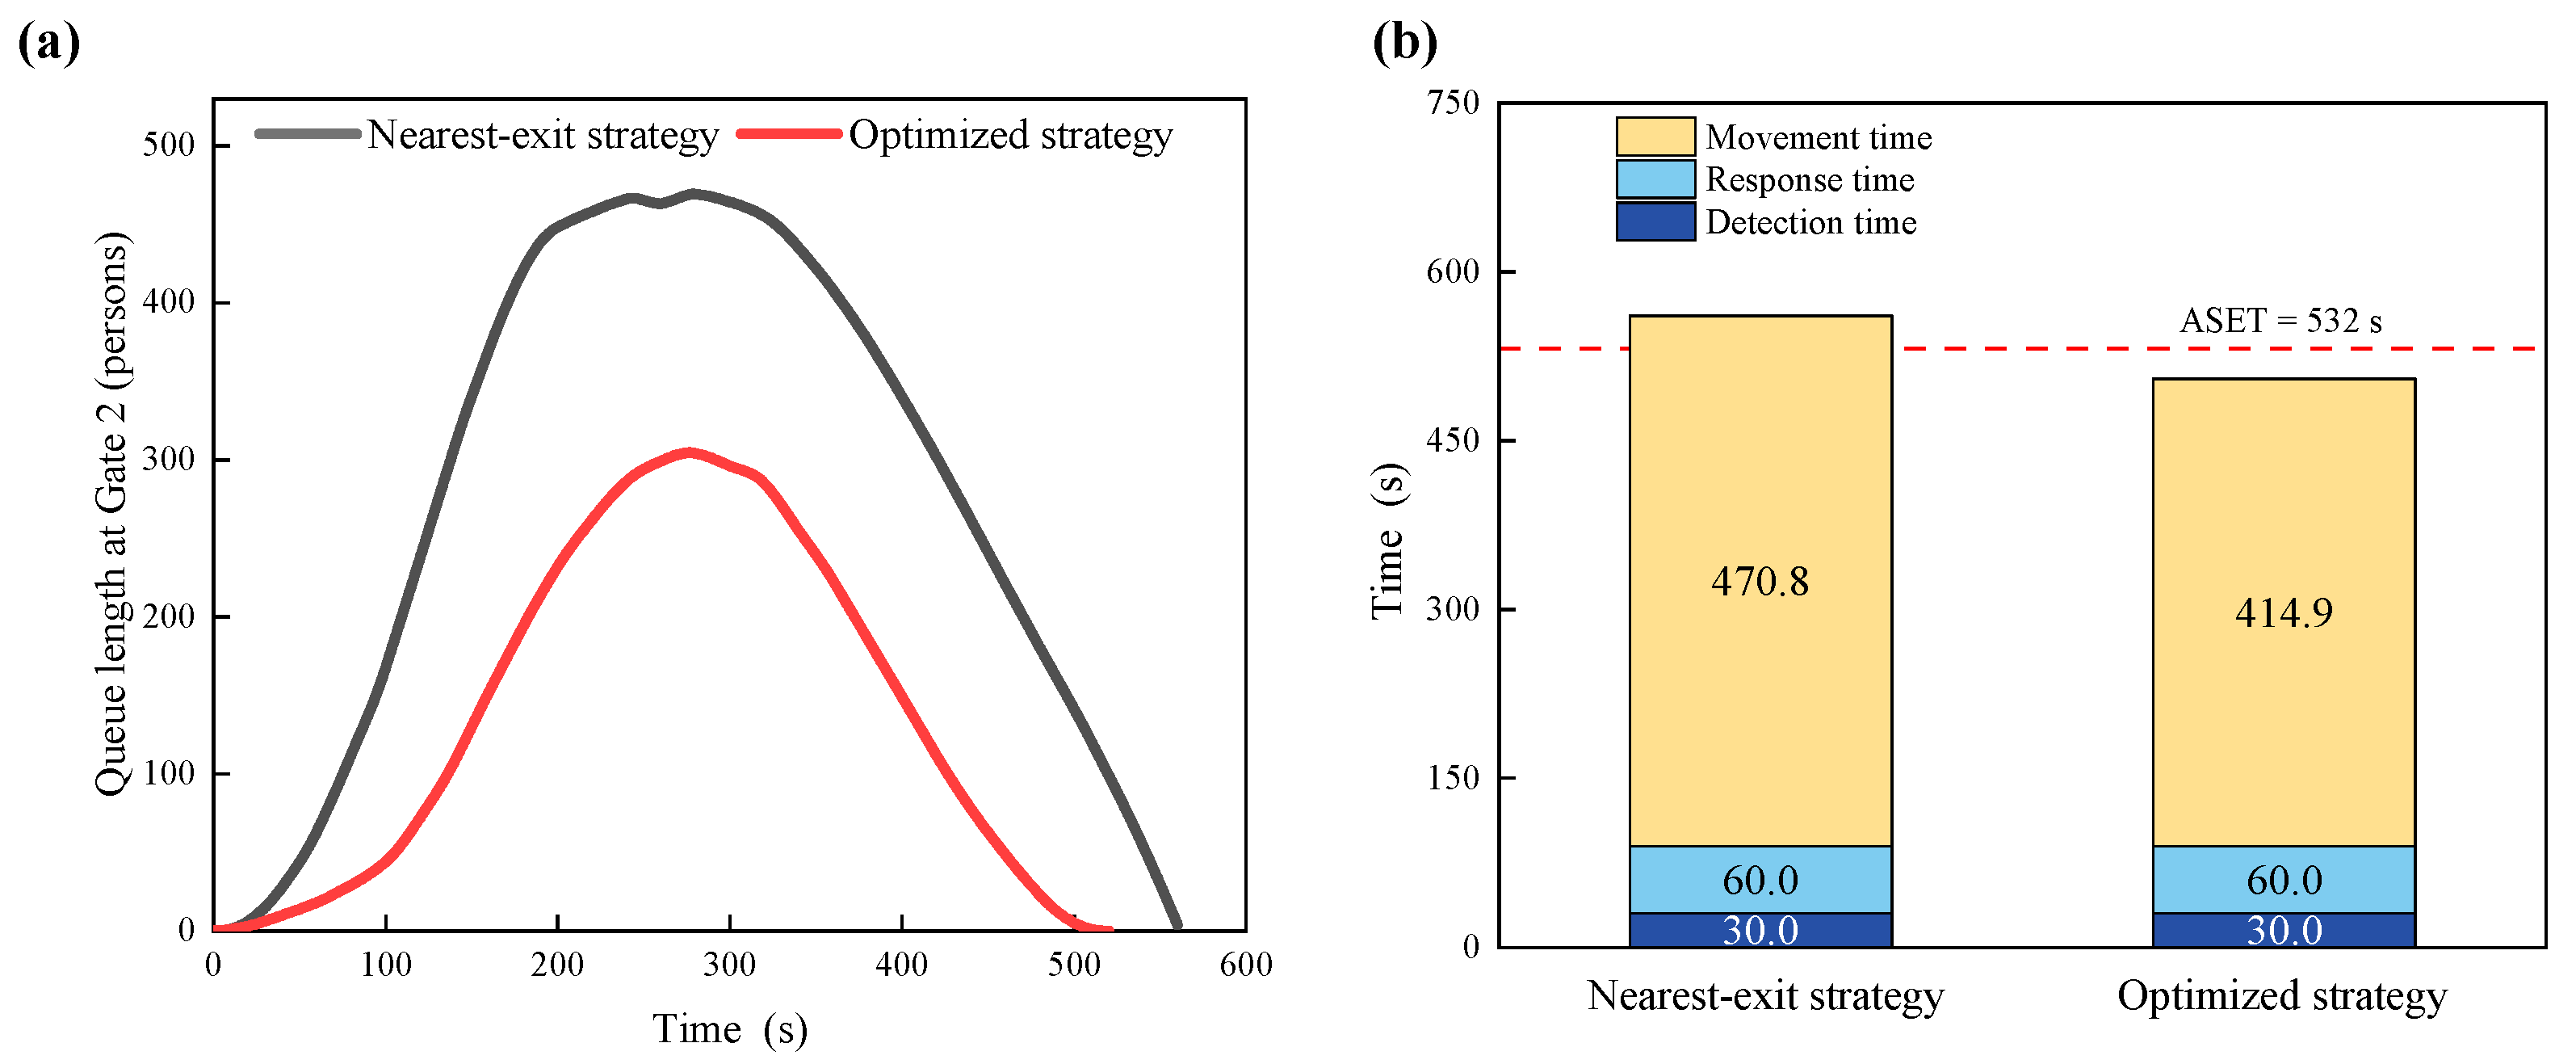
To further explain the RSET reduction mechanism, Figure 5 compares the queuing dynamics at Gate 2 and the RSET composition before and after optimization. Specifically, Figure 5a shows the temporal evolution of the queue length at Gate 2 under the nearest-exit and optimized strategies, whereas Figure 5b compares the corresponding RSET components, including detection time, response time, and movement-and-queuing time. The results show that the reduction in RSET was mainly achieved by shortening the movement and queuing stage rather than by changing detection or response time. Under the nearest-exit strategy, the queue length at Gate 2 increased rapidly after approximately 80 s and remained at a high level between 200 and 330 s, with a peak close to 470 persons. This indicates that Gate 2 became the dominant bottleneck after Gate 3 failed. In contrast, the optimized strategy suppressed the peak queue length to about 300 persons and shortened the duration of congestion, showing that part of the evacuation flow was effectively redistributed to Gates 1 and 4.
Figure 5.
Comparison of evacuation dynamics before and after optimization: (a) temporal evolution of the queue length at Gate 2 under the nearest-exit and optimized strategies; (b) composition of RSET, including detection time, response time, and movement-and-queuing time, under the two evacuation strategies.
The RSET composition further showed that the difference between the two strategies mainly lay in the movement and queuing stage. The detection time and response time were the same in both scenarios, namely 30 s and 60 s, respectively. However, the movement and queuing time decreased from 470.8 s under the nearest-exit strategy to 414.9 s under the optimized strategy. Consequently, total RSET decreased from 560.8 s to 504.9 s. The nearest-exit strategy exceeded the ASET threshold, whereas the optimized strategy remained below it.
3.4. Sensitivity Assessment Under Alternative Accident and Network Conditions
To examine the robustness of the proposed framework, additional sensitivity tests were conducted by varying leakage size, meteorological conditions, and exit failure patterns. The same consequence-to-network mapping procedure and the same congestion-aware ant colony optimization algorithm were used in all tests. The purpose of this analysis was not to exhaust all possible LPG accident evolutions, but to evaluate whether the proposed framework remained effective when the spatial consequence field and the available exit set changed. The sensitivity results are summarized in Table 6.
Table 6.
Sensitivity analysis under alternative leakage, weather, and exit failure scenarios.
The sensitivity results show that the proposed framework can be applied to different accident and network conditions because the evacuation graph is reconstructed according to the scenario-specific consequence zones. In S1, the smaller leakage size resulted in a larger ASET and preserved all four exits, so both evacuation strategies satisfied the time constraint. In S2 and S3, the hazardous footprint expanded or the available safety time decreased, and the optimized strategy reduced RSET but could not fully satisfy the ASET constraint. This indicates that route optimization alone cannot compensate for all severe accident conditions and should be combined with source control, emergency sheltering, or staged evacuation when the available time window is too short. In S4 and S5, the failed exit pattern changed, but the proposed algorithm still redistributed evacuees among the remaining exits and maintained a lower RSET than the nearest-exit strategy. In S6, only two exits remained available, and both strategies failed, although the optimized assignment reduced RSET by 62.5 s compared with the nearest-exit strategy. These results demonstrate that the framework is resilient in the sense that it can update failed exits, unavailable links, and route assignments when the accident scenario changes, while also identifying conditions under which evacuation routing alone is insufficient.
3.5. Benchmarking the Proposed Strategy Against Alternative Methods
To further evaluate the effectiveness of the proposed strategy, it was compared with alternative routing and optimization methods. The comparison included the nearest-exit strategy, a shortest-path strategy on the feasible network, a risk-weighted shortest-path strategy, a standard ant colony optimization algorithm without a congestion penalty, and the proposed congestion-aware ant colony optimization algorithm. All methods used the same feasible network, population distribution, failed exit condition, and ASET value. Therefore, the performance differences reflect the influence of the route assignment logic rather than differences in accident assumptions. The quantitative evacuation performance of the five methods under the base scenario is summarized in Table 7.
Table 7.
Evacuation performance of different routing and optimization methods under the base scenario.
The comparison demonstrates that simply removing unsafe links and applying the shortest-path routing is insufficient when the remaining exit capacity is unevenly distributed. The shortest-path strategy produced a slightly lower RSET than the nearest-exit strategy, but it still concentrated many evacuees at the geometrically attractive Gate 2. The risk-weighted shortest-path strategy further reduced RSET by avoiding links close to restricted zones, but the absence of explicit density feedback meant that exit-load imbalance remained unresolved. Standard ACO improved the route search process but still tended to converge toward high-attractiveness links and exits because congestion was not directly penalized in the heuristic function. Only the proposed congestion-aware ACO satisfied the ASET constraint. Compared with the standard ACO, the proposed method reduced RSET by 30.3 s. This confirms that the main benefit of the proposed framework comes from integrating spatial consequence constraints with dynamic congestion-aware route redistribution.
4. Discussion
4.1. Why Shortest-Distance Evacuation Is Insufficient
The results show that shortest-distance evacuation is not necessarily the safest or most efficient strategy under chemical accident conditions. In a normal plant environment, the nearest exit is often regarded as the most intuitive choice because it reduces individual walking distance. However, after the LPG leakage, the evacuation network is no longer the original complete network. Hazardous vapor exposure, explosion overpressure, and thermal radiation may remove specific nodes, links, and exits from the feasible space.
In the case study, Gate 3 became unavailable after consequence mapping, while Gate 2 remained geographically attractive to many origin nodes. Under the nearest-exit strategy, evacuees from several areas moved toward Gate 2 simultaneously. Although this choice reduced walking distance for many individuals, it generated severe queuing at a limited-capacity exit. Because system-level evacuation success was determined by the last evacuee reaching safety, the waiting time caused by congestion became more important than the walking time saved by selecting the nearest exit.
4.2. Engineering Value of Consequence-to-Network Mapping
A key contribution of this study is the conversion of accident consequence zones into evacuation network constraints. In many emergency planning applications, consequence assessment results are presented as independent risk maps. These maps are useful for understanding hazardous vapor exposure, explosion overpressure, and thermal radiation, but they do not directly answer operational evacuation questions: which roads can still be used, which nodes should be avoided, and which gates should be treated as failed exits.
The proposed mapping procedure addresses this gap by translating physical accident effects into route-planning constraints. Nodes located in severe consequence zones are removed, links intersecting unacceptable hazard zones are treated as unavailable, and exits affected by severe consequences are classified as failed. This conversion is particularly valuable for chemical industrial parks because hazardous effects are spatially non-uniform. Vapor exposure may extend mainly along the downwind direction, explosion overpressure may affect a broader region around the flammable cloud, and thermal radiation may dominate near the leakage source. Embedding these consequences into the evacuation network allows evacuation planning to reflect the actual spatial distribution of accident impacts.
4.3. Influence of the Static Hazard-Zone Assumption and Model Limitations
The proposed framework treats the ALOHA-derived consequence zones as static spatial constraints during evacuation optimization. This assumption has both practical value and limitations. Its practical value is that it provides a conservative and easily implementable decision layer for emergency planning. By using the envelope of severe vapor exposure, explosion overpressure, and thermal radiation zones, the model prevents evacuees from being assigned to routes that may become unsafe under the selected accident scenario. This is useful for early-stage emergency planning, especially when real-time dispersion data are unavailable.
However, LPG accident consequences are inherently dynamic. Vapor cloud dispersion changes with release rate, wind direction, atmospheric stability, terrain roughness, and equipment congestion. Ignition timing may also change the dominant hazard from vapor exposure to explosion overpressure or thermal radiation. Therefore, a static consequence envelope may overestimate the unsafe area in some locations and underestimate time-dependent risk in others. For example, a corridor outside the initial severe exposure zone may become unsafe later if the vapor cloud continues to migrate downwind. Conversely, a route inside the conservative envelope may remain usable for a short period before the hazard reaches it. These effects may influence route availability, evacuation timing, and the calculated margin between RSET and ASET.
The current static treatment should therefore be interpreted as a conservative screening approach rather than a fully dynamic accident evacuation coupling model. It is suitable for comparing route assignment strategies under a defined emergency planning scenario, but it cannot fully represent real-time hazard migration. Future work should incorporate time-dependent consequence fields, dynamic link state updating, and rolling route reassignment. In such a dynamic framework, each link would have a time-dependent feasibility indicator, and the transition probability in the ant colony algorithm could be updated according to the evolving vapor concentration, overpressure risk, or thermal radiation intensity.
Several other limitations should also be noted. First, ALOHA is appropriate for rapid screening, but it cannot fully resolve detailed dense gas dispersion around complex equipment, buildings, and local obstacles. High-risk facilities should combine ALOHA screening with CFD-based consequence refinement. Second, the current study assumes that evacuees follow assigned routes effectively. In real emergencies, compliance may be influenced by panic, visibility, alarm credibility, route familiarity, and group behavior. Third, the base case focuses on one representative LPG leakage scenario. Although additional sensitivity tests were conducted, a broader scenario library covering different leakage sizes, weather conditions, ignition modes, personnel distributions, and multi-exit failure combinations is still needed before site-wide emergency plans can be finalized.
5. Conclusions
This study developed a spatially constrained and congestion-aware evacuation route optimization framework for LPG leakage accidents in chemical industrial parks. The essential contribution is to connect accident consequence assessment with evacuation decision making at the network constraint level. Instead of treating hazardous vapor exposure, vapor cloud explosion overpressure, and jet fire thermal radiation as independent risk maps, the proposed framework maps their consequence zones onto the evacuation network to identify unsafe nodes, unavailable links, and failed exits. Evacuation planning is therefore formulated as a capacity-constrained system-level assignment problem rather than a conventional shortest-distance routing problem.
The case study demonstrated that nearest-exit evacuation can be unsafe under failed exit conditions. Gate 3 becomes unavailable after multi-hazard consequence mapping, which redirects many evacuees toward Gate 2. This uncoordinated flow concentration produces severe queuing and results in an RSET of 560.8 s, exceeding the ASET of 532 s. In contrast, the proposed congestion-aware ant colony optimization algorithm redistributes evacuees among Gates 1, 2, and 4, reduces the dominant bottleneck at Gate 2, and decreases RSET to 504.9 s. The 55.9 s reduction changes the evacuation outcome from failure to success under the same accident condition and physical exit set. The sensitivity assessment and the comparison with alternative routing methods further indicate that the proposed framework is not limited to the nearest-exit benchmark; it can update route assignments under changed leakage conditions, weather conditions, and exit failure patterns, while also identifying severe scenarios in which routing optimization alone is insufficient and additional emergency measures are required.
These results indicate that evacuation efficiency in chemical industrial parks is governed not only by geometric distance but also by the coordination between accident-induced spatial constraints and remaining network capacity. The proposed framework can support emergency plan preparation and early-stage response by identifying failed exits, restricted routes, congestion-sensitive corridors, and feasible coordinated evacuation assignments.
Funding
This research received no external funding.
Data Availability Statement
The data supporting this study are available from the author upon reasonable request.
Acknowledgments
The author thanks the case-study plant for providing layout information and evacuation-related data support.
Conflicts of Interest
The author declares no conflicts of interest.
References
- Ardila-Suarez, C.; Lacoursière, J.P.; Soucy, G.; Rego de Vasconcelos, B. Consequence analysis of LPG-related hazards: Ensuring safe transitions to cleaner energy. Fuels 2025, 6, 45. [Google Scholar] [CrossRef] [Scilit]
- Terzioglu, L.; Iskender, H. Modeling the consequences of gas leakage and explosion fire in liquefied petroleum gas storage tank in Istanbul Technical University, Maslak campus. Process Saf. Prog. 2021, 40, 319–326. [Google Scholar] [CrossRef] [Scilit]
- Wang, Q.; Sun, Y.; Shu, C.M.; Jiang, J.; Zhang, M.; Wang, Q.; Wang, X. Effect of separation distance on gas dispersion and vapor cloud explosion in a storage tank farm determined using computational fluid dynamics. J. Loss Prev. Process Ind. 2020, 68, 104282. [Google Scholar] [CrossRef] [Scilit]
- Hu, Q.; Qian, X.; Shen, X.; Zhang, Q.; Ma, C.; Pang, L.; Liang, Y.; Feng, H.; Yuan, M. Investigations on vapor cloud explosion hazards and critical safe reserves of LPG tanks. J. Loss Prev. Process Ind. 2022, 80, 104904. [Google Scholar] [CrossRef] [Scilit]
- Barros, P.L.; Luiz, A.M.; Nascimento, C.A.; Neto, A.T.P. On the non-monotonic wind influence on flammable gas cloud from CFD simulations for hazardous area classification. J. Loss Prev. Process Ind. 2020, 68, 104278. [Google Scholar] [CrossRef] [Scilit]
- Luo, Z.; Wu, G.; Cheng, F.; Wang, T. The effect of favorable conditions within chemical process units on vapour cloud explosion overpressures. J. Loss Prev. Process Ind. 2025, 96, 105617. [Google Scholar] [CrossRef] [Scilit]
- Chen, C.; Khakzad, N.; Reniers, G. Dynamic vulnerability assessment of process plants with respect to vapor cloud explosions. Reliab. Eng. Syst. Saf. 2020, 200, 106934. [Google Scholar] [CrossRef] [Scilit]
- He, Z.; Chen, C.; Weng, W. Multi-hazard risk assessment in process industries: State-of-the-art. J. Loss Prev. Process Ind. 2022, 76, 104672. [Google Scholar] [CrossRef] [Scilit]
- Chen, C.; Reniers, G.; Khakzad, N. A dynamic multi-agent approach for modeling the evolution of multi-hazard accident scenarios in chemical plants. Reliab. Eng. Syst. Saf. 2021, 207, 107349. [Google Scholar] [CrossRef] [Scilit]
- Men, J.; Ji, H.; Chen, Z.; Xie, W.; Zhang, L. Study of the situation deduction of a domino accident caused by overpressure in LPG storage tank area. J. Loss Prev. Process Ind. 2021, 72, 104525. [Google Scholar] [CrossRef] [Scilit]
- He, Z.; Shen, K.; Lan, M.; Weng, W. The effects of dynamic multi-hazard risk assessment on evacuation strategies in chemical accidents. Reliab. Eng. Syst. Saf. 2024, 246, 110044. [Google Scholar] [CrossRef] [Scilit]
- He, Z.; Shen, K.; Lan, M.; Weng, W. An evacuation path planning method for multi-hazard accidents in chemical industries based on risk perception. Reliab. Eng. Syst. Saf. 2024, 244, 109912. [Google Scholar] [CrossRef] [Scilit]
- Wang, J.; Yu, X.; Zong, R.; Lu, S. Evacuation route optimization under real-time toxic gas dispersion through CFD simulation and Dijkstra algorithm. J. Loss Prev. Process Ind. 2022, 76, 104733. [Google Scholar] [CrossRef] [Scilit]
- Zhang, D.; Mao, Z.; Gong, M.; Ren, J.; Zuo, S.; Chen, X. Study on optimization of shelter locations and evacuation routes of gas leakage accidents in chemical industrial park. Process Saf. Environ. Prot. 2023, 177, 556–567. [Google Scholar] [CrossRef] [Scilit]
- Seo, S.K.; Yoon, Y.G.; Lee, J.S.; Na, J.; Lee, C.J. Deep neural network-based optimization framework for safety evacuation route during toxic gas leak incidents. Reliab. Eng. Syst. Saf. 2022, 218, 108102. [Google Scholar] [CrossRef] [Scilit]
- Li, C.; Hou, J.; Cheng, W.; Gai, W. A multiagent-based modeling approach for emergency evacuation plan optimization during toxic gas releases within chemical plants. Process Saf. Environ. Prot. 2022, 160, 443–456. [Google Scholar]
- Mizuta, Y.; Sumino, M.; Kunito, Y.; Shiota, K.; Miyake, A. Emergency evacuation model assuming leakage of toxic substances in a chemical plant. J. Loss Prev. Process Ind. 2020, 68, 104287. [Google Scholar] [CrossRef] [Scilit]
- Shen, Y.; Wang, Q.; Yan, W.; Sun, J. An evacuation model coupling with toxic effect for chemical industrial park. J. Loss Prev. Process Ind. 2015, 33, 258–265. [Google Scholar] [CrossRef] [Scilit]

Disclaimer/Publisher’s Note: The statements, opinions and data contained in all publications are solely those of the individual author(s) and contributor(s) and not of MDPI and/or the editor(s). MDPI and/or the editor(s) disclaim responsibility for any injury to people or property resulting from any ideas, methods, instructions or products referred to in the content. |
© 2026 by the author. Licensee MDPI, Basel, Switzerland. This article is an open access article distributed under the terms and conditions of the Creative Commons Attribution (CC BY) license.