


Abstract
Microfluidic fuel cells offer a promising route for portable power generation; however, scaling paper-based systems remains challenging because capillary-driven flow can limit fuel distribution and electrochemical performance. This work investigates the experimental performance and computational fluid dynamics (CFD) behavior of air-breathing paper-based microfluidic fuel cell (FCs) stacks powered directly by commercial tequila (35 vol.% ethanol). Single cells with electrode areas ranging from 0.5 cm × 0.5 cm to 3 cm × 3 cm were evaluated to determine the optimal design, followed by the construction of 4-cell and 6-cell series-parallel stacks. The smallest electrode (0.5 cm × 0.5 cm) achieved the highest power density (0.142 mW cm−2) and open-circuit voltage (0.92 V). Scaling to a 6-cell stack increased the maximum power density to 3.20 mW cm−2 and the voltage to 1.39 V, outperforming the 4-cell configuration (1.09 mW cm−2 and 1.07 V). Computational Fluid Dynamics simulations revealed that fuel velocity decreased from 2.8 × 10⁻² m s−1 near the inlet to approximately 1.0 × 10⁻⁶ m s−1 in the final cells because of porous-medium resistance, explaining the observed mass-transport limitations. The results demonstrate that tequila can be directly used as a sustainable fuel source and that optimized stack architectures significantly enhance power generation in paper-based microfluidic fuel cells.
1. Introduction
Microfluidic fuel cells (FCs), particularly those fabricated on paper substrates, have attracted considerable attention as portable power sources and highly sensitive analytical platforms. These devices offer key advantages, including compact size, low fuel consumption, membraneless operation, and low-cost fabrication via simple patterning techniques on cellulose paper. The system delivered power outputs of up to 7.5 mW, and the parallel connection achieved an efficiency of 95% [1,2,3,4]. Among organic fuels, ethanol stands out for direct ethanol fuel cells (DEFCs) due to its high energy density, low toxicity, and straightforward storage and handling. The experimental power density was 0.375 mW cm−2 for methanol and 0.125 mW cm−2 for ethanol [5,6,7]. A particularly compelling application is the use of paper-based FCs as self-powered sensors for real-time ethanol determination in commercial alcoholic beverages. The ethanol content in beverages such as wine, beer, liquor, and tequila can be used directly as fuel. In the biofuel cell using wine as fuel, a maximum power density of 1.78 mW cm−2 was achieved, enabling the dual function of energy generation and analytical detection. Previous studies have successfully demonstrated membraneless FCs and enzymatic biofuel cells for the quantification of ethanol in real alcoholic samples, including tequila and other spirits, showing good correlation with conventional methods such as gas chromatography [5,6,7]. However, the practical performance of paper-based microfluidic fuel cells is strongly governed by hydrodynamics within the porous channels and the overall device architecture. Geometric parameters, including electrode active area, channel dimensions, and stacking configuration, play a critical role in minimizing mass transport limitations and internal resistance [8,9,10,11]. In this context, Computational Fluid Dynamics (CFD) simulation has become an essential tool for modeling velocity profiles, species transport, and reactant distribution in microchannels, porous electrodes, and inlet/outlet regions, thereby enabling systematic design optimization before experimental fabrication, the model predicts theoretical efficiencies of up to 77% and power densities reaching 193 mW cm−2 [12,13,14]. In paper-based systems, velocity profiles are primarily driven by capillary flow, producing characteristic laminar distributions that can be tuned through strategic modifications in channel geometry and cell arrangement [15,16]. While stacked configurations combining cells in series and parallel can, in theory, increase output voltage and/or current, improve fuel utilization, and deliver higher total power than single cells, scaling in capillary-driven paper matrices presents unique challenges. Limited fuel distribution, non-uniform capillary flow, and increased mass transport limitations may prevent proportional gains in efficiency and power density as the number of cells increases [9,12,17,18]. For example, ref. [9] achieved on a single cell (fuel: 4 M KCOOH; oxidant: air; electrolyte: 1 M KOH; catalyst: 0.2 mg/cm−2 Pd/C on 0.15 cm2 graphite foil) a maximum power density of 7.10 mW cm−2; ref. [17] reached a peak power of 13.9, 16.1, 23.1, and 24.9 mW cm−2 and the peak power density of 135.08 mW·cm−2 and the limiting current density of 615.38 mA·cm−2, were values reached by [18]. Computational Fluid Dynamics (CFD) has become a crucial tool for understanding the transport phenomena governing the performance of direct alcohol fuel cells [19,20,21]. Numerical models have been widely employed to investigate the influence of operating conditions, flow-field configurations, porous-media properties, and geometric parameters on reactant distribution and overall cell behavior. Three-dimensional CFD simulations have shown that variables such as fuel flow rate, temperature, membrane thickness, porosity, and cathode pressure affect the hydrodynamic and electrochemical performance of direct ethanol fuel cells [21,22], highlighting the importance of transport processes in optimizing fuel-cell operation. Moreover, these studies have shown that CFD provides valuable insight into local velocity fields, pressure distributions, and reactant transport that are difficult to obtain experimentally. Despite these advances, CFD investigations specifically addressing paper-based direct ethanol fuel cells remain scarce [23]. Most published studies on paper-based fuel cells have focused on device fabrication, catalyst development, and experimental electrochemical characterization, whereas relatively few have examined capillary-driven fuel transport through porous cellulose substrates. Consequently, the hydrodynamic mechanisms governing spontaneous fuel distribution in stacked paper architectures are still not fully understood. In this work, we present a CFD simulation study of two paper-based microfluidic fuel cell stacks operated with tequila as fuel (exploiting its ethanol content). The hydrodynamic behavior and velocity profiles are evaluated and compared against a single-cell configuration for a 4-series/parallel stack vs. a 6-series/parallel stack. Through detailed CFD analysis of fluid flow and species transport (governed by Navier–Stokes equations in channels and Darcy’s law in the porous paper matrix), this study evaluates whether increasing the number of cells significantly enhances power output or whether fuel distribution constraints inherent to paper substrates limit overall efficiency. By identifying the optimal stack architecture that maximizes fuel delivery while minimizing concentration polarization, this work aims to advance the rational design of scalable, low-cost paper-based FC stacks for portable power generation and ethanol sensing applications. This computational approach provides valuable insights into the practical limits and opportunities of cell stacking in capillary-driven systems, contributing to the development of sustainable and effective energy-harvesting/sensing devices.
The main contributions of this paper are as follows:
- Electrode design optimization for capillary flow: A reduced electrode area (0.5 × 0.5 cm−2) was found to maximize power density by mitigating concentration polarization and improving mass transport in capillary-driven systems.
- Demonstration of increased power: The study validates the achievement of a maximum power density of 3.2 mW cm−2 in an air-breathing paper-based FC 6-series/parallel stack configurations using commercial tequila (35% vol.).
- Correlation between Computational Fluid Dynamics modeling and stack performance: A detailed CFD analysis is provided that links fluid velocity profiles to the electrical performance of series-parallel architectures, establishing a basis for the efficient scaling of paper-based microfluidic fuel cells.
To provide a comprehensive overview of the current state of microfluidic fuel cells and the contribution of this work, the article is organized as follows. Section 1 provides the theoretical background and motivation for using paper-based microfluidic fuel cells powered by alternative fuels, such as tequila. Section 2 describes the experimental methodology, including the assembly of the single cells and stacks, the preparation of the catalytic inks, and the parameters used for the CFD simulations. Section 3 presents the results and discussion, covering the electrochemical performance of electrodes with different sizes, the evaluation of 4- and 6-series/parallel stacks, the morphological characterization of the electrodes via SEM, and the analysis of the velocity profiles and pressure contours obtained via CFD. Finally, the conclusions summarize the main findings and the potential of this technology for portable power and sensing applications.
2. Materials and Methods
2.1. Assembly and Performance of an Air-Breathing Paper-Based Microfluidic Fuel Cell
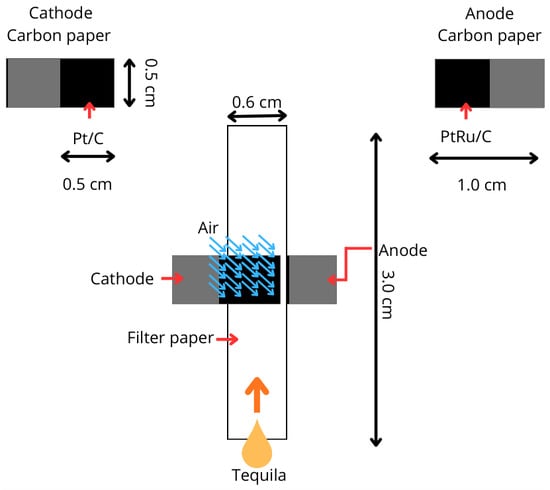
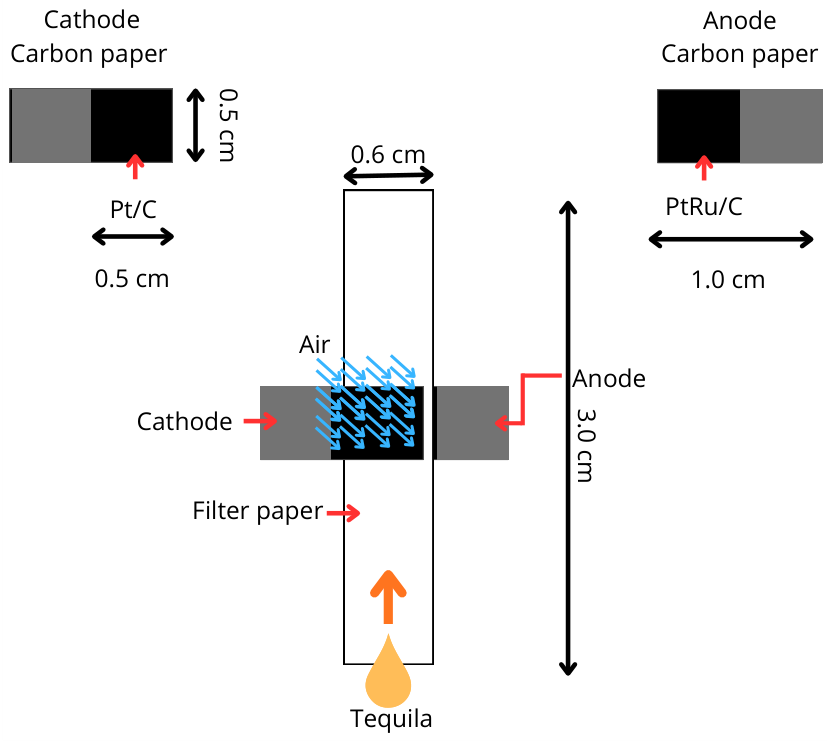
To define the fuel design based on electrode size that offers the best power performance and to subsequently build and evaluate air-breathing paper-based microfluidic fuel cell stacks, four electrode sizes (anodes and cathodes) in a single air-breathing paper-based FC were evaluated: 0.5 × 0.5 cm; 1.0 × 1.0 cm; 2.0 × 2.0 cm, and 3.0 × 3.0 cm, to identify the optimal electrode size for energy generation. Each anode or cathode was constructed using a piece of carbon paper (Toray Technoquip Co., Inc., Tokyo, Japan, TGPH-120) of the same size (0.5 × 0.5 cm; 1.0 × 1.0 cm; 2.0 × 2.0 cm and 3.0 × 3.0 cm) and covered with a catalytic ink of PtRu/C (20 wt.% on Vulcan XC-72, E-TEK) or Pt/C (30 wt.% on Vulcan XC-72, E-TEK) for anodes or cathodes, respectively. Both inks were prepared by mixing μL of isopropyl alcohol (J. T. Baker, Phillipsburg, NJ, USA) with μL of Nafion (5%. Sigma-Aldrich, St. Louis, MO, USA) per gram of catalyst (PtRu/C or Pt/C), and then applied using an airbrush to the surfaces of the anodes and cathodes, respectively. Finally, a catalytic charge of 1 mg cm−2 was obtained on each electrode. In each air-breathing paper-based FC, the anode and cathode were placed in a sandwich configuration between a strip of absorbent paper (Whatman No. 5) of the same size as the electrodes. The cathode was located at the top, allowing air to flow through it because it is constructed of porous carbon paper. The air-breathing paper-based FCs with electrode sizes of 0.5 × 0.5 are shown in Figure 1. Each of the four air-breathing paper-based FCs was fed with tequila (José Cuervo ESPECIAL® 35% Vol. Tequila, Jalisco, Mexico).
Figure 1.
Air-breathing paper-based microfluidic fuel cell with electrodes with an area covered by a catalyst of 0.5 × 0.5 cm.
2.2. Assembly and Performance of a Linear Series/Parallel Air-Breathing Paper-Based Microfluidic Fuel Cell Stack
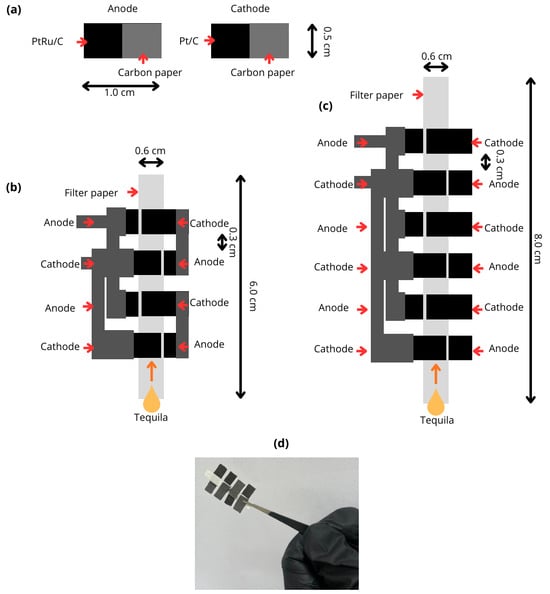
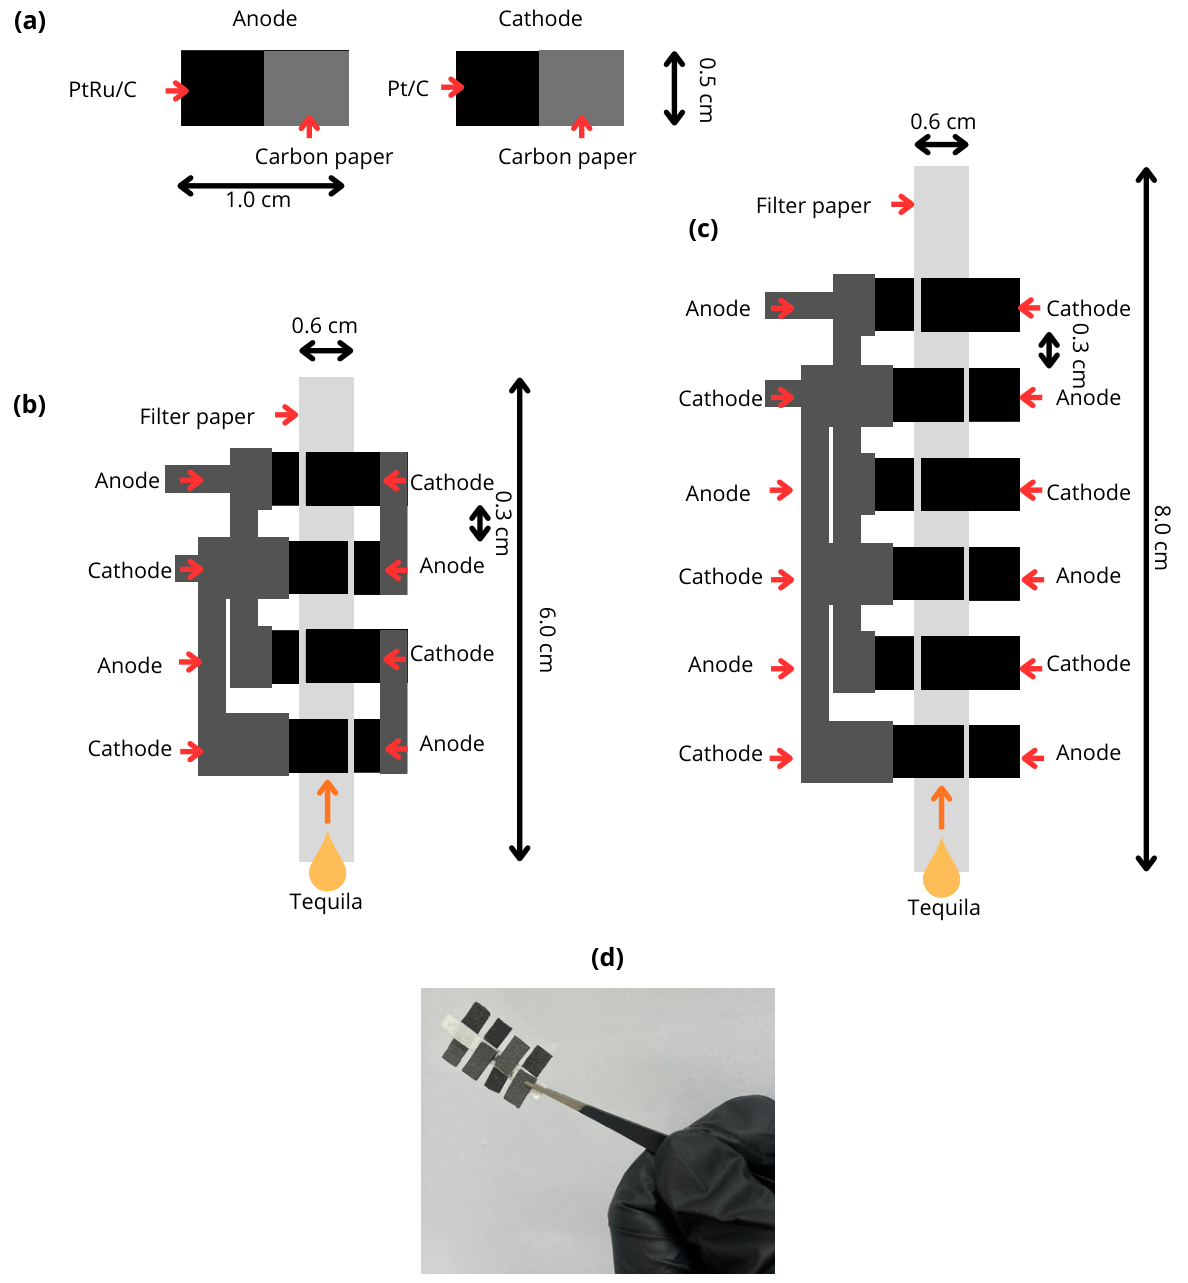
The design of the air-breathing paper-based FC 4 and 6-series/parallel stack is presented in Figure 2b,c. In both stacks, the anodes were constructed from 1.0 × 0.5 cm carbon paper rectangles (Figure 2a), with a 0.5 × 0.5 cm area coated with PtRu/C catalytic ink. For the cathodes, 1.0 × 0.5 cm carbon paper rectangles were used (Figure 2a), and each was coated with a 0.5 × 0.5 cm area of Pt/C catalytic ink. In all electrodes, a catalytic charge of 1 mg cm−2 was achieved. The anodes and cathodes were collocated in series/parallel sandwich configurations, with a strip of paper measuring 0.6 × 6.0 cm for the 4-series/parallel stack (Figure 2b) and 0.6 × 8.0 cm for the 6-series/parallel stack (Figure 2c). As described in the previous section, the anodes were collocated at the bottom of both stacks, and the cathodes at the top. The stacks were evaluated using μL of tequila as fuel.
Figure 2.
Microfluidic fuel cell stack. (a) Anode and cathode configuration. (b) 4-series/parallel air-breathing paper-based microfluidic fuel cell stack diagram. (c) 6-series/parallel air-breathing paper-based microfluidic fuel cell stack. (d) Photograph: 4-series/parallel air-breathing paper-based microfluidic fuel cell stack.
2.3. Numerical Method for an Air-Breathing Paper-Based Microfluidic Fuel Cell Stack
The microfluidic fuel cell and stacks were simulated in ANSYS Workbench 2022. The CFD simulations were performed using a transient pressure-based solver in ANSYS Fluent. Fuel transport through the paper substrate was modeled as flow through a porous medium governed by Darcy’s law. The porous region was assigned a porosity of and a permeability of 5 × 10⁻¹¹ m2. The inlet boundary condition was defined using a mass flow rate of 4.5 × 10⁻⁶ kg s−1, estimated from the experimentally measured capillary imbibition rate. The fuel droplet was assumed to rapidly wet the paper surface, and the resulting transport within the paper matrix was modeled as a continuous porous-media flow. The outlet boundary was specified as a pressure outlet at atmospheric pressure (101,325 Pa).
The simulations were initialized with the porous medium saturated with air at ambient conditions. A transient formulation was employed using an adaptive time-stepping scheme with an initial time step of 1 × 10⁻⁶ s, and convergence was achieved when residuals for continuity and momentum equations decreased below 10−6.
The Geometry, Mesh, and SetUp are shown in Section 3. The assumptions in the models were as follows: ethanol (Tequila) as the fluid and a laminar flow regime. As a simplifying assumption in the CFD model, the secondary phase was modeled using the physical properties of pure ethanol to evaluate the baseline capillary-driven front propagation, leaving multi-component transport parameters (water-ethanol mixtures) for future computational work. Due to the high computational cost of simulating a falling droplet, a circular injection zone with a diameter of 1 mm was defined. This approach accounts for the droplet volume and assumes a rapid impact time of 0.01 s. The velocity was estimated based on the paper characteristics, specifically a Herzberg permeability of 1420 s/100 mL, and the paper area (0.6 cm × 3 cm). This yielded a theoretical velocity of 3.3 × 10⁻⁴ m s−1, which does not account for losses arising from fluid-mechanical effects. Experimentally, a higher velocity of 3.3 × 10⁻³ m s−1 was obtained. A Volume of Fluid (VOF) model was employed, with air as the primary phase and ethanol as the secondary phase over a three-dimensional control volume. The simulation was conducted under transient conditions to capture the droplet’s temporal evolution as it penetrates the paper. All boundaries were set to walls, except for the injection region (Inlet) and the Outlet.
According to the paper characteristics: Manufacturer/trade name: Whatman 1005-125, Whatman, Item No. 28414042 (US reference). The porosity of a typical filter paper of 0.7 was used. The Carman–Kozeny equation was used for permeability.
where K is the permeability, is the porosity, and is the pore size of μm. From which, with the characteristics of the paper, a initial permeability value of was obtained, a viscosity of was used, and a contact angle of 20° due to the characteristics of the alcohol with the cellulose. Due to the interest in determining the inhibition front, a 3D transient analysis was performed using a VOF model. Air was defined as the primary phase and alcohol as the secondary phase, with a surface tension of 0.022 N m−1. The transient analysis was conducted to determine the alcohol migration through the paper over time. Initially, the control volume representing the paper contained only air. All surfaces were defined as walls, except for the injection zone, using the previously calculated mass flow rate and a volume fraction of 1 for ethanol.
2.4. Governing Equations
According to the first conservation law, the 3D multiphase single-fuel-cell model includes the mass conservation equation and the momentum conservation equation, which can be used to describe the air and liquid flowing through the porous media [21]. The mass conservation equation is the following:
where , , , t, s, and are the gas density in our case, air (kg m−3), porosity, gas velocity (m s−1), time (s), liquid saturation, and the source term of mass transfer. The momentum conservation equation is written as follows:
where , , and are gas dynamic viscosity (kg m−1 s−1), gas pressure (Pa), and the source term of gas velocity [21].
The capillary pressure is the main driving force for ethanol in the porous structures in the Microfluidic Fuel Cell, and the liquid pressure equation is written as follows [21]:
where , K, , and are liquid density (kg m−3), intrinsic permeability (m2), relative permeability of ethanol (m2), liquid dynamic viscosity (kg m−1 s−1) and liquid pressure (Pa).
Subscripts g and l represent air and ethanol, respectively. All the final parameters in the simulation are introduced in Table 1. The CFD simulation performed in this work was calibrated using the experimentally measured tequila imbibition rate through the paper substrate to reproduce the hydrodynamic behavior of the system. The objective of the model was not to predict electrochemical performance directly, but rather to analyze fuel distribution, velocity gradients, and pressure variations within the different stack configurations. The simulation results showed that the 6-cell stack maintained more favorable fuel transport conditions, characterized by higher local velocities and enhanced wetting of the active regions. These hydrodynamic trends were consistent with the experimentally observed improvement in power output, suggesting that fuel distribution plays a significant role in the performance of the proposed architecture.
Table 1.
Parameters used in the numerical simulation.
3. Results
3.1. Performance of Air-Breathing Paper-Based Microfluidic Fuel Cell
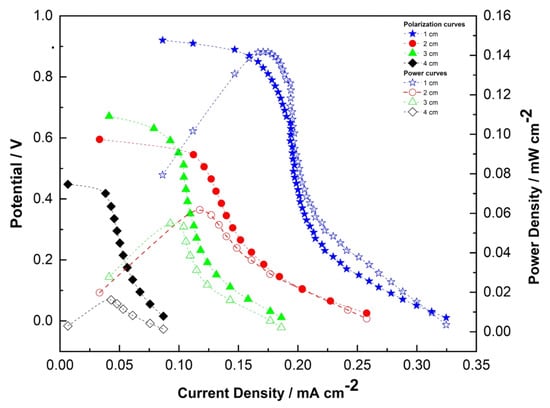
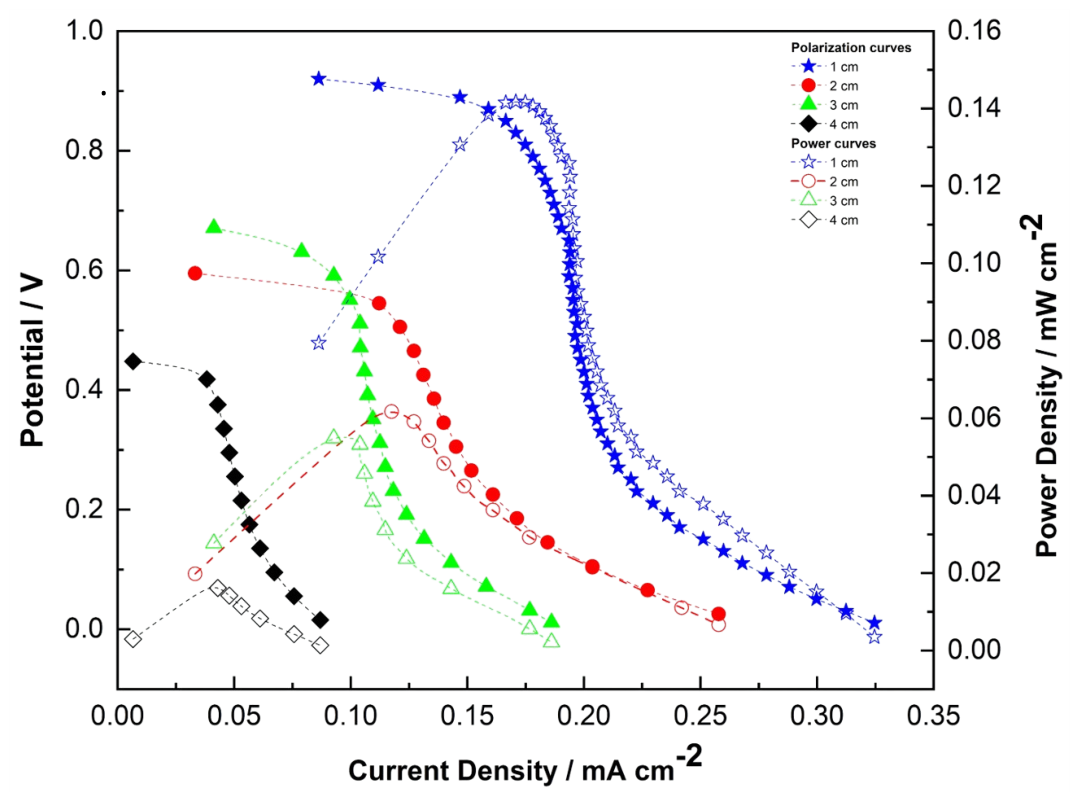
The transport of fuel in paper-based microfluidic fuel cells (FCs) by capillary action is critical to fuel cell efficiency; in this context, electrode design and size could be key to improving cell performance. Figure 3 presents the polarization and power curves of the paper-based microfluidic fuel cells (FCs) for different electrode sizes. As shown, the single air-breathing paper-based microfluidic fuel cell with the smallest electrode area (0.5 cm × 0.5 cm) delivered the highest open-circuit voltage (OCV), current density, and power density compared to the larger electrodes (1.0 cm, 2.0 cm, and 3.0 cm). This superior performance is primarily attributed to enhanced mass transport and reduced concentration polarization in the smaller active area. In paper-based systems, capillary-driven flow is relatively slow and non-uniform; larger electrodes create significant reactant-depletion zones farther from the inlet, increasing diffusion limitations and lowering the normalized current density. In contrast, the smaller electrode benefits from proximity to the incoming fuel stream, a more uniform reactant distribution, and lower in-plane ohmic resistance, resulting in higher utilization of the available ethanol from tequila. These findings align with previous studies that highlight the critical role of optimal electrode sizing in capillary-driven paper-based microfluidic fuel cells to maximize power density [8,9,17,18,23].
Figure 3.
Polarization and power curves of the simple microfluidic fuel cell with different electrode sizes.
3.2. Performance of Air-Breathing Paper-Based Microfluidic Fuel Cell Stack
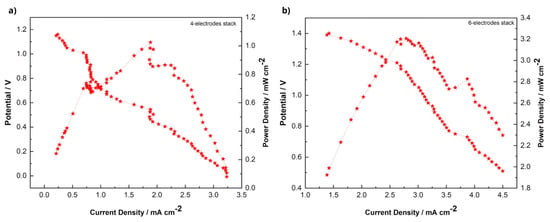
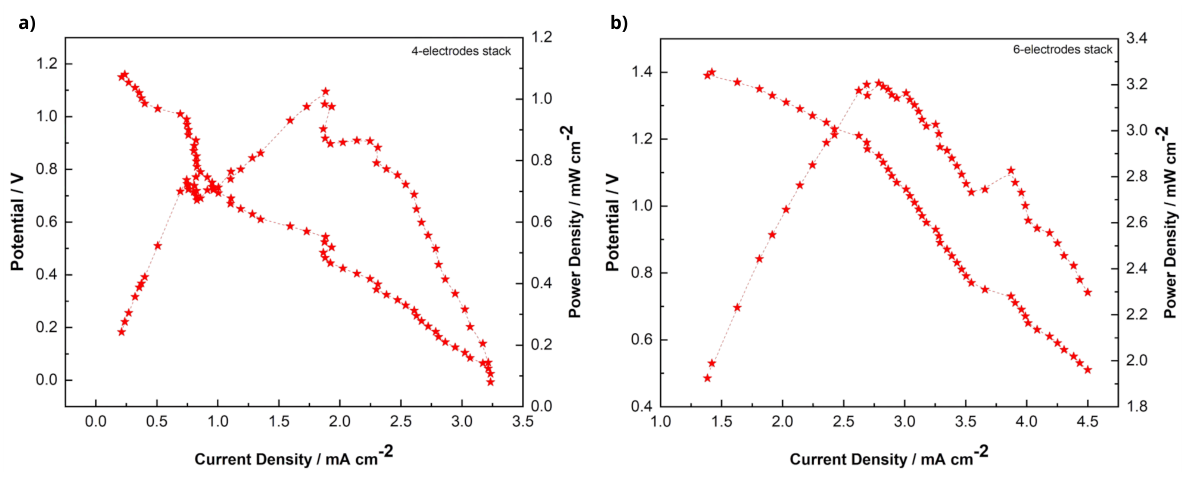
Figure 4a,b show the polarization and power density curves for the 4- and 6-series/parallel air-breathing paper-based FC stack, respectively. They demonstrate the benefits of scaling via series/parallel configurations, using the optimal 0.5 cm × 0.5 cm electrode size identified in single-cell tests. The 6-electrode stack (two parallel arrays of three cells in series) achieved a significantly higher current density (up to approximately 4.5 mA cm−2) and a maximum power density of 3.2 mW cm−2, compared with the 4-electrode stack (two parallel arrays of two cells in series), which reached about 3.2 mA cm−2 and 1.1 mW cm−2 (Table 2). As expected from the series connection, the open-circuit voltage and operating potential increased in the 6-cell stack; however, the voltage gain was less pronounced than the current enhancement. This behavior is attributed to the parallel arrangement, which reduces the total internal resistance, while the additional cells in series increase the voltage. Overall performance remains limited by non-uniform capillary fuel distribution and mass-transport constraints inherent to the porous paper matrix. The longer flow path in the 6-cell stack still allows sufficient reactant delivery to the additional electrodes without severe depletion, leading to a net increase in power output. It is worth noting that commercial tequila typically contains around 35 vol.% ethanol, meaning the fuel is not fed in its pure state. Despite the significant fraction of water and trace constituents, the ethanol electro-oxidation reactions successfully take place at the catalytic layers. This capability to operate with unpurified complex fuels highlights why the 6-cell stack configuration successfully capitalizes on the available active area compared to the 4-cell stack; it mitigates the impact of fuel dilution through an optimized series-parallel distribution that drives efficient reactant utilization and yields higher power densities (3.2 mW cm−2).
Figure 4.
Polarization and power curves. (a) The 4-series/parallel air-breathing paper-based µFC stack. (b) The 6-series/parallel air-breathing paper-based µFC stack.
Table 2.
Performance parameters of an air-breathing paper-based microfluidic fuel cell with different-sized electrodes.
Regarding the scalability limits of the proposed architecture, increasing the number of cells beyond the current 6-cell configuration presents critical engineering challenges and performance trade-offs, which are key to evaluate since these stacks are envisioned for low-power portable electronic devices, such as medical diagnostic applications and environmental sensors. Theoretically, larger stacks would increase nominal power output; however, in a linear capillary-driven paper channel, fluid velocity significantly drops as the flow path extends due to the cumulative porous-medium resistance, exacerbating fuel depletion and mass-transport limitations in the farthest downstream cells. Furthermore, expanding the stack introduces risks of voltage imbalances across series-connected cells and increases cumulative internal resistance, which can severely degrade overall system efficiency. To overcome these scalability constraints and meet the strict efficiency demands of portable electronics, future designs must move away from simple linear tracks and explore alternative multi-directional geometries, such as circular or radial configurations, which allow a more uniform fuel distribution from a centralized inlet. Additionally, structural performance can be enhanced by optimizing the spatial arrangement of the series-parallel interconnections to balance voltage/current generation while maintaining precise mechanical compression to reduce contact resistance between the electrodes and conductor materials. Finally, ongoing development of highly active anodic and cathodic catalysts remains vital to accelerate electro-oxidation kinetics under severe fuel dilution conditions.
The electrochemical performance obtained in this work demonstrates that tequila can be successfully used as fuel in paper-based air-breathing microfluidic fuel cell stacks. The 6-series/parallel configuration achieved a maximum power density of 3.20 mW cm−2 and a voltage of 1.39 V, outperforming the 4-series/parallel stack, which reached 1.09 mW cm−2 and 1.07 V. The improved performance is associated with the higher number of cells connected in series, which increased the overall voltage, while the parallel arrangement contributed to reducing internal resistance and improving current delivery.
Compared with previous studies summarized in Table 3, it is important to note that direct quantitative comparisons are limited due to significant differences in experimental conditions, including catalyst loading, fuel composition and concentration, electrode architecture, active area, and operating configurations (single cell vs. stacks). Therefore, the comparison should be interpreted in terms of general performance trends rather than absolute ranking.
Within this context, studies employing methanol or ethanol solutions with optimized noble metal catalysts, such as Moreno-Zuria et al. [3], report higher power densities (15.20 and 9.96 mW cm−2), which can be attributed not only to faster electro-oxidation kinetics but also to controlled fuel concentration and optimized electrode/catalyst configurations. Similarly, Chandra et al. [24] and Galindo et al. [25] achieved 6.32 and 5.93 mW cm−2, respectively, under optimized ethanol oxidation conditions and tailored catalytic systems. In contrast, the present work employs a commercially available alcoholic beverage without prior purification or fuel optimization, together with a simplified paper-based architecture, which inherently introduces additional mass transport limitations and fuel variability. Despite these constraints, the obtained performance remains in the same order of magnitude as several reported ethanol-based systems and demonstrates the feasibility of using complex real fuels in microfluidic fuel cell stacks. Furthermore, the proposed configuration shows improved performance compared to low-cost or enzymatic systems reported in the literature, such as those developed by Lau et al. (0.0355 mW cm−2) and Rao et al. (0.0726 mW cm−2), although these systems operate under fundamentally different electrochemical mechanisms and design constraints, making direct comparison non-equivalent. Finally, the performance approaches that of more engineered catalytic systems such as NiCo@ZSM-5/AC (4.47 mW cm−2), suggesting that stack design and hydrodynamic optimization can partially compensate for lower fuel purity and simplified materials. CFD analysis further supports these findings, showing improved fuel distribution in the 6-series/parallel configuration, although velocity gradients toward downstream electrodes confirm persistent mass transport limitations inherent to capillary-driven paper microfluidics.
Table 3.
Comparison of the performance of air-breathing paper-based microfluidic fuel cells using alcohol-based fuels. Not specified data (ns).
3.3. Morphological Electrode Characterization
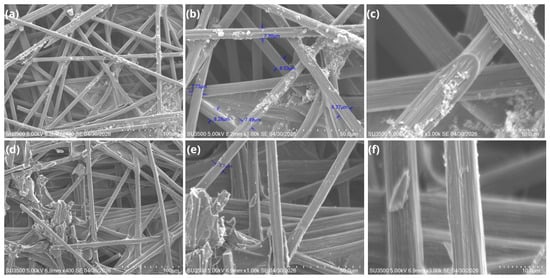
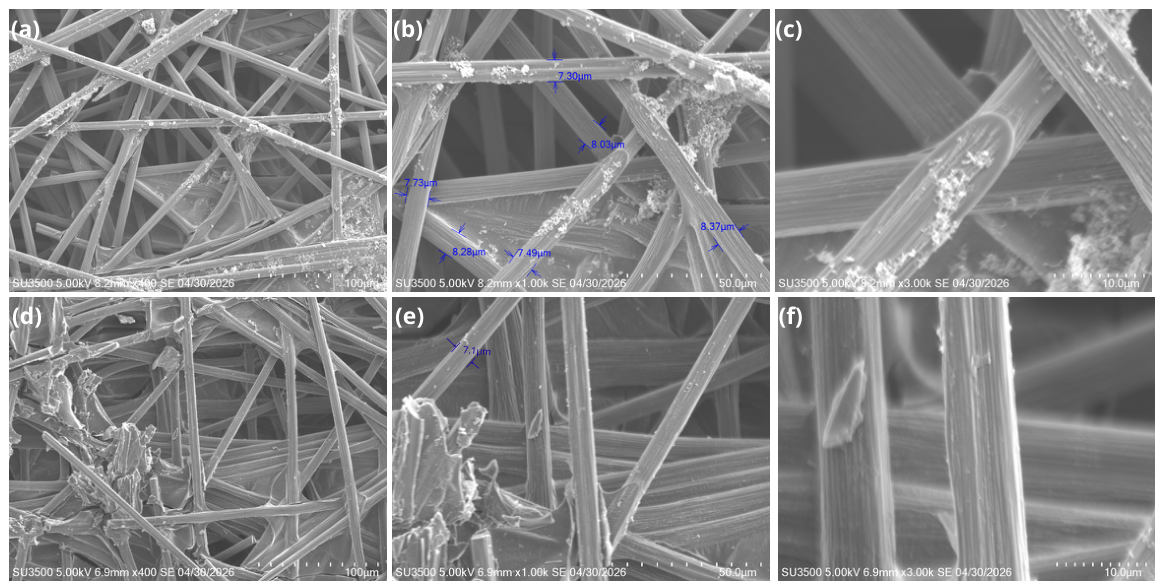
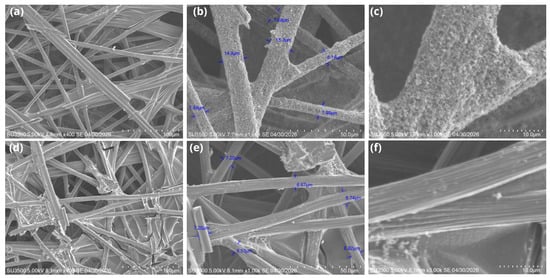
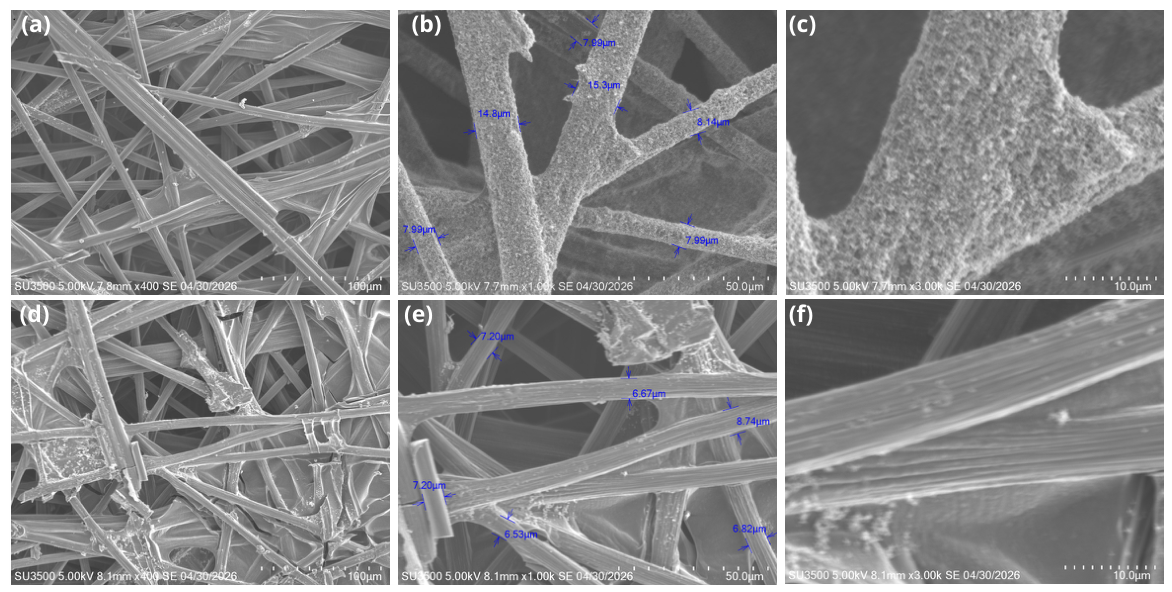
The morphology of fresh and used PtRu/C anodes and Pt/C cathodes was examined by scanning electron microscopy (SEM) to assess structural changes after operation with tequila as fuel. In the fresh PtRu/C anodes (Figure 5a–c), the carbon fiber network shows the distribution of catalyst particles on its surface. Also, Figure 6b shows the fiber diameters, ranging between μm and μm, indicating a relatively uniform microstructure and catalyst distribution. After a short-term operation of (less than 10 min) (Figure 5d–f), the electrodes appear cleaner compared to their initial state before cell assembly. The post-test fibers exhibit an approximate diameter of μm (Figure 5e), fewer visible particles, and a smoother surface, suggesting partial dissolution or redistribution of loosely bound catalyst material during ethanol oxidation. Nevertheless, the overall fibrous structure remains well preserved, suggesting it maintains good electronic conductivity and active-site accessibility. For the Pt/C cathodes (Figure 6a–c), the fresh electrodes exhibit a highly porous carbon fiber matrix with well-dispersed platinum nanoparticles; the fibers exhibit a surface coating; when this layer is taken into account, their diameters range from μm to μm (Figure 6b). After use (Figure 6d–f), some surface deposits and slight fiber degradation are visible, consistent with the oxygen reduction reaction in an air-breathing configuration and possible crossover of organic species from the anode. These morphological observations align with the electrochemical performance: the relatively minor degradation supports the stable operation observed in the polarization curves and explains why the 6-fuel-cell stack maintained a high power density (3.2 mW cm−2), in the fiber, as shown in Figure 6e, the diameters range from μm to μm, it is possible to make a general assumption that the platinum layer deposited on the carbon fiber may reach a thickness of up to μm. The preservation of the porous network after fuel cell testing confirms the mechanical and chemical robustness of the commercial catalysts in the paper-based architecture when operated with alcoholic fuels.
Figure 5.
Representative SEM images of PtRu/C cathodes. Where (a–c) are before and (d–f) are after the operation in the air-breathing paper-based microfluidic fuel cell stack using tequila as fuel. Images show increasing magnification from left to right (×400, ×1000, and ×3000).
Figure 6.
Representative SEM images of Pt/C cathodes. Where (a–c) are before and (d–f) are after the operation in the air-breathing paper-based microfluidic fuel cell stack using tequila as fuel. Images show increasing magnification from left to right (×400, ×1000, and ×3000).
3.4. Computational Fluid Dynamics of Air-Breathing Paper-Based Microfluidic Fuel Cell and Stack
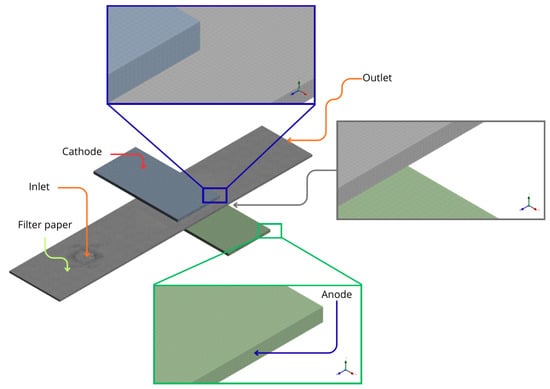
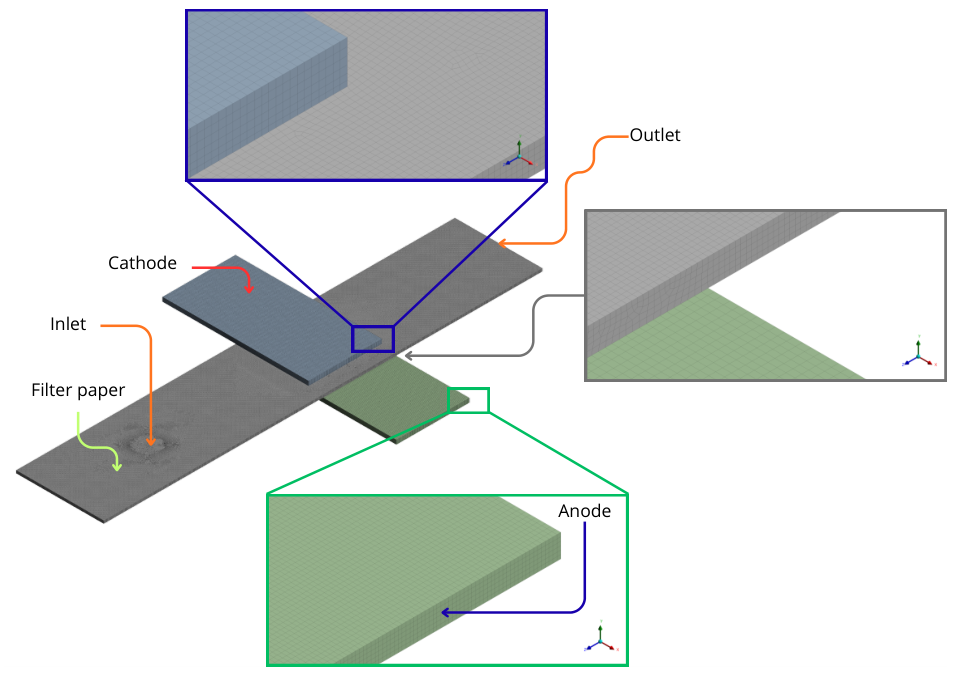
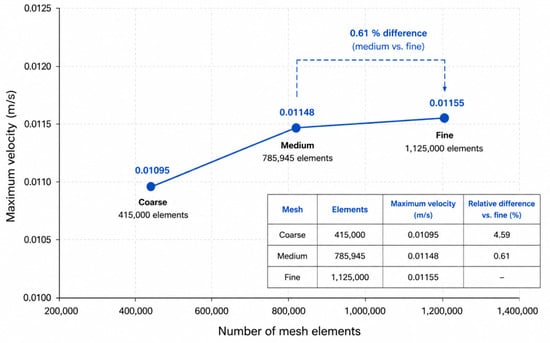
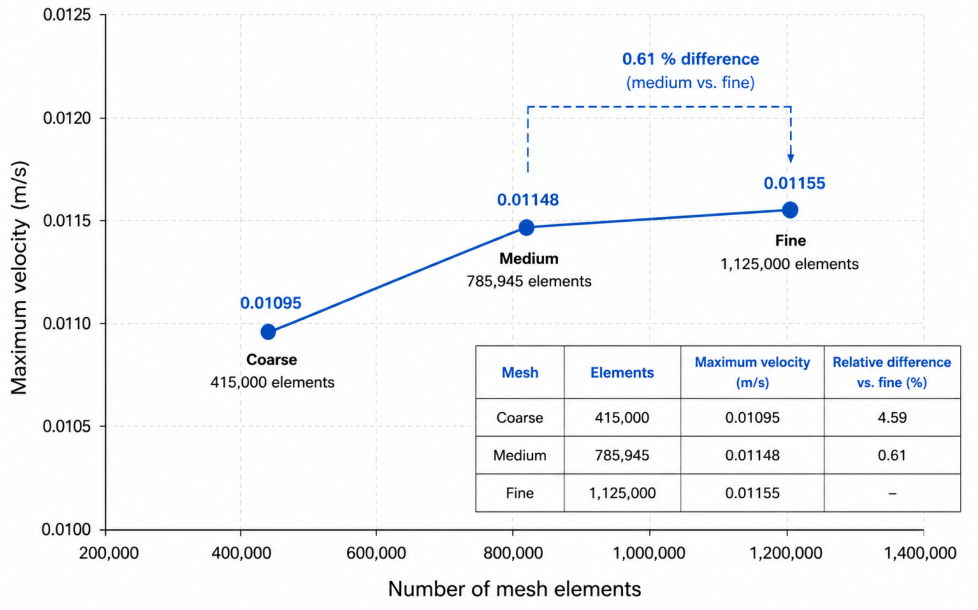
The mesh consisted of 785,945 hexahedral elements and 893,656 nodes, with local refinement across the paper thickness, which represents the smallest characteristic dimension of the model. As shown in Figure 7, the regions corresponding to the filter paper, anode, and cathode are clearly identified. At least six computational nodes were distributed across the μm thickness to adequately resolve velocity and pressure gradients within the porous medium. A mesh independence study was conducted to evaluate the influence of spatial discretization on the numerical solution. Three computational meshes containing approximately 415,000, 785,945, and 1,125,000 elements were generated and tested under identical operating conditions. The maximum velocity predicted by the CFD model was selected as the monitoring variable. As summarized in Figure 8, the relative difference between the medium and fine meshes was only 0.61%, indicating that further mesh refinement produced negligible changes in the numerical solution. Therefore, the mesh containing 785,945 elements was selected for all subsequent simulations, providing an appropriate compromise between numerical accuracy and computational cost.
Figure 7.
Mesh of an Air-breathing paper-based microfluidic fuel cell with electrode.
Figure 8.
Mesh independence study.
Based on the experimental value obtained from the path of the alcohol droplet in a specific time, it was found that a droplet of alcohol travels approximately 10 mm in 3 s.
With this information, a test model was created to adjust the permeability and mass flow parameters to the droplet’s path using the experimental data and to validate that the propagation of alcohol within the numerically defined porous medium follows the trend according to Washburn’s law:
where L is the length and t is the time.
The permeability obtained from the Carman–Kozeny equation (approximately ) was considered only as an initial theoretical estimate because this relationship assumes an idealized porous structure composed of uniformly packed spherical particles. Such assumptions are not representative of cellulose filter paper, which exhibits anisotropic fiber orientation, heterogeneous pore-size distribution, fiber swelling after wetting, and preferential capillary pathways. Therefore, the permeability was treated as a calibration parameter. Several permeability values were evaluated, as summarized in Table 4, until the simulated ethanol-front propagation reproduced the experimentally measured imbibition distance of approximately after . The calibrated permeability value of provided the closest agreement with the experimental observations while preserving the expected Washburn behavior, expressed as . Consequently, this calibrated permeability was adopted without further modification for all subsequent CFD simulations, including the single-cell, four-cell, and six-cell stack configurations.
Table 4.
Calibration of intrinsic permeability based on ethanol penetration experiments used for CFD model parameterization.
Following the calibration stage, the permeability was fixed at the calibrated value and subsequently applied without modification to all computational cases. Likewise, the porosity, capillary pressure formulation, boundary conditions, and numerical discretization schemes were kept identical for the single-cell, four-cell, and six-cell configurations. Therefore, the CFD model was not recalibrated for individual geometries, allowing the same parameter set to be transferred across all simulated stack architectures. This modeling strategy ensures that the differences observed in the numerical results are exclusively associated with the geometric configuration of the stacks, thereby providing a consistent framework for comparative hydrodynamic analysis while avoiding geometry-dependent parameter fitting.
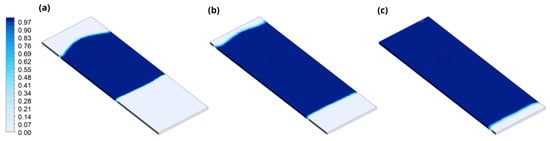
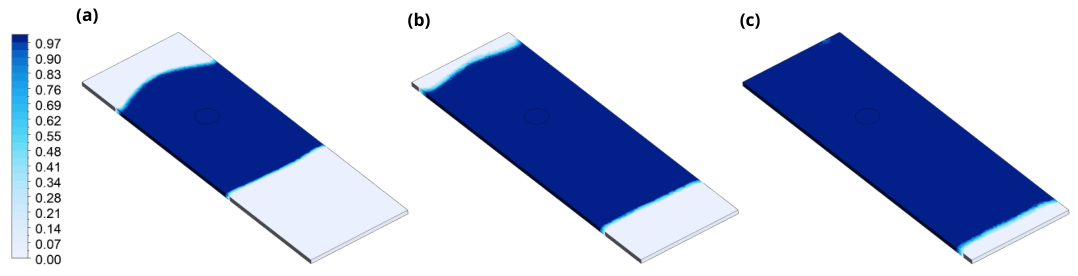
Figure 9 shows the volume fraction of ethanol at different times: (a) 1 s, (b) 2 s, and (c) 3 s for the test model. The test model is 5 mm wide by 15 mm long and μm thick.
Figure 9.
Volume fraction of alcohol at different times: (a) 1 s, (b) 2 s, and (c) 3 s.
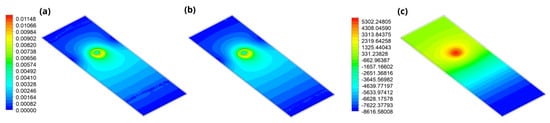
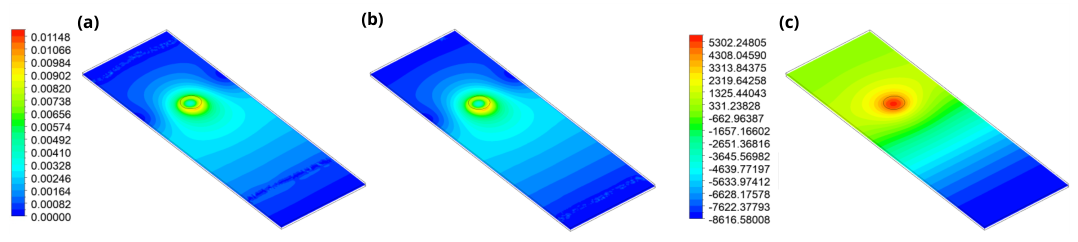
Figure 10a,b show how the velocity profile in m s−1 is higher in the volume where it is already completely occupied by ethanol, and the value is very low in the volume where it is displacing air. Figure 10c shows the pressure contour in Pa, where at the entrance, it reaches the highest-pressure value, and in the area where the air is located, the minimum pressure value.
Figure 10.
Velocity (m s−1) contour at (a) 2 s, (b) 3 s, and (c) pressure (Pa) contour at 3 s.
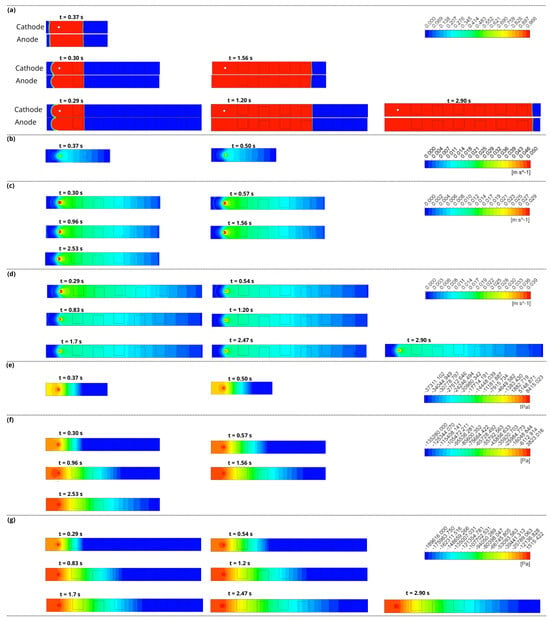
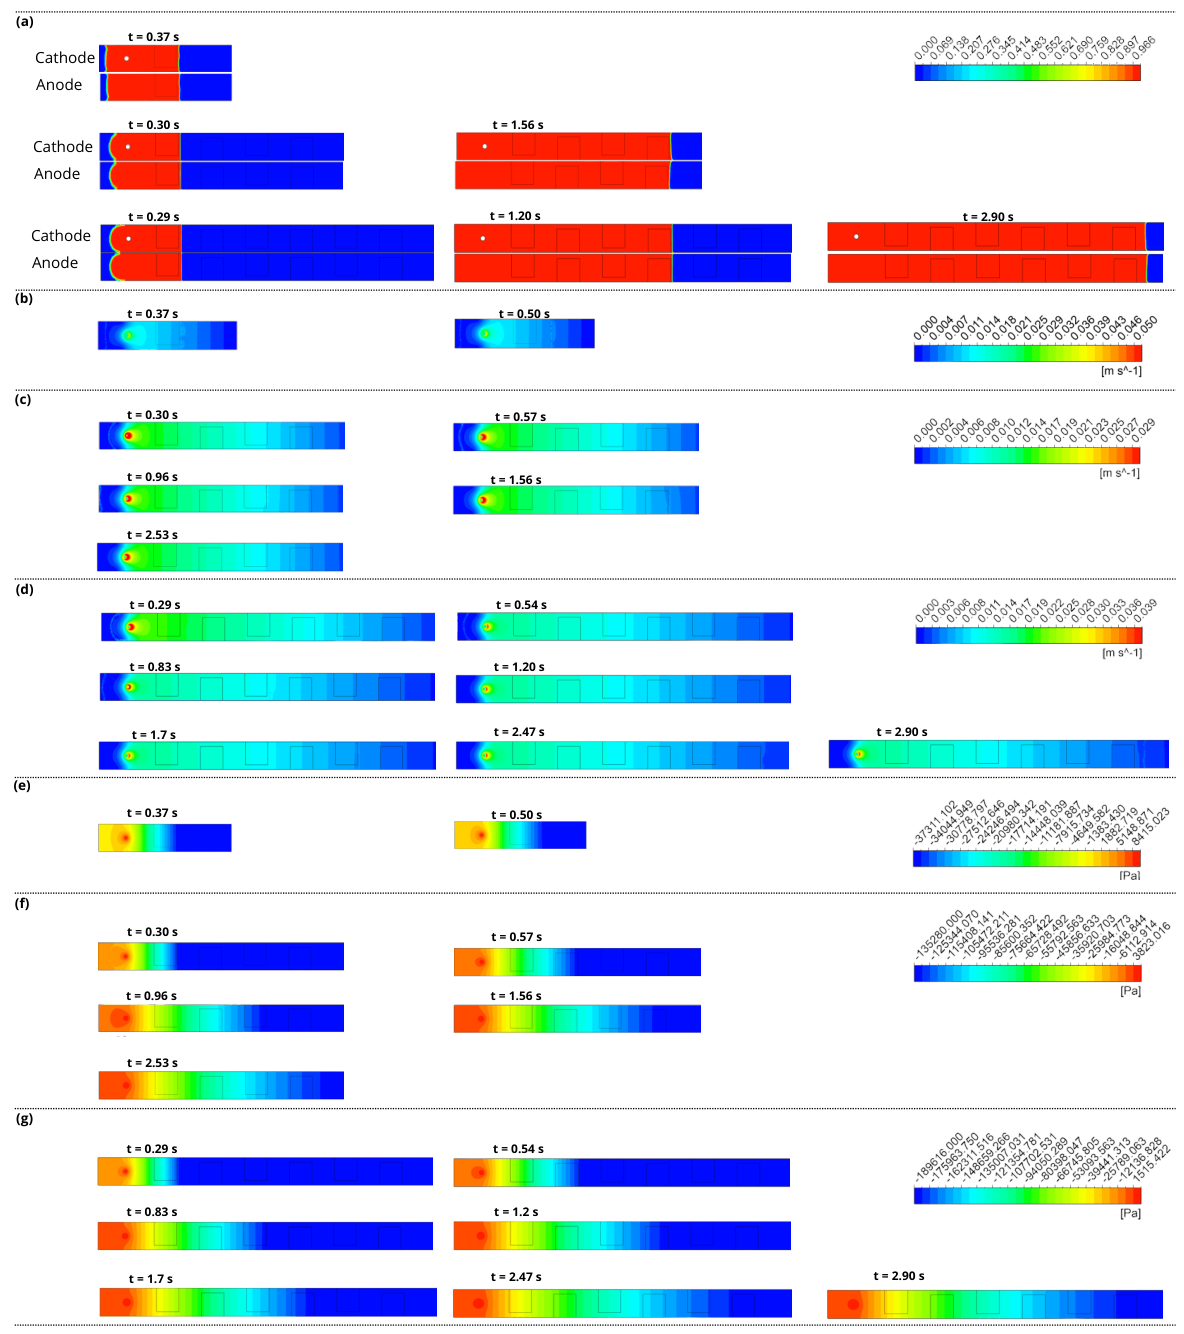
The fuel velocity in the air-breathing paper-based microfluidic fuel cell stacks presented in this work was experimentally determined by measuring the flow rate of tequila on the paper strip (0.0033 m s−1). The pressure was considered the atmospheric pressure (101,325 Pa) because the entire system is open and the cathode breathes oxygen from ambient air. Figure 11a–g shows the volumetric fraction, velocity, and pressure contours obtained from a simulation of the air-breathing paper-based microfluidic fuel cell stacks using ANSYS 2022 R1.
Figure 11.
Temporal evolution of: (a) volume fraction; (b) velocity profile at monocell; (c) velocity profile at 4-stack cell; (d) velocity profile at 6-stack cell; (e) pressure contour at monocell; (f) pressure contour at 4-stack cell, and (g) pressure contour at 6-stack cell.
This variation is reflected in the distribution of tequila across the entire paper strip. Low-pressure variation along the paper strip is unlikely to favor catalytic activity at the last electrodes. The above could be improved with a new design.
The CFD results suggest that the six-cell stack promotes a more uniform fuel distribution within the porous substrate. Although local velocities decrease significantly due to capillary dissipation and porous-medium resistance, the experimental results indicate that the overall architecture facilitates effective fuel delivery to the active regions. Since concentration fields and electrochemical reactions were not included in the CFD model, the observed performance enhancement cannot be attributed solely to the simulated velocity distribution. Figure 11 presents the velocity profiles for the three configurations: the single-cell (Figure 11b), four-cell microfluidic stack (Figure 11c), and six-cell stack (Figure 11d). In the inlet region, located at the upper part of the filter paper, velocities on the order of 2.8 × 10⁻² m s−1 are observed. Under these conditions, the flow regime is considered laminar, consistent with the microfluidic scale of the system. As the fluid flows through the filter paper, its velocity decreases, mainly due to the hydraulic resistance of the porous medium. In Figure 11a, it can be observed that as the fuel moves forward, the velocity significantly decreases, for example, in an intermediate region (equivalent to the fourth cell), it reaches values close to 8 × 10⁻⁴ m s−1, while toward the outlet (sixth cell), it drops to approximately 1 × 10⁻⁶ m s−1. This velocity gradient indicates a non-uniform flow distribution across the filter paper, suggesting reduced effective fuel transport farther from the inlet. As a result, limitations in reactant supply arise, potentially affecting the efficiency of the oxidation–reduction reactions within the microcell. The four-cell stack (Figure 11c) exhibits similar velocity values at the inlet, on the order of 2.8 × 10⁻² m s−1. However, as the fluid progresses, a gradual decrease is observed, reaching approximately 8.4 × 10⁻⁴ m s−1 in the third cell and values close to 1 × 10⁻⁵ m s−1 in the fourth cell.
Similarly, in Figure 11b, corresponding to the single cell, the same trend is maintained. The inlet velocity is on the order of 2.8 × 10⁻² m s−1, while in the first cell it decreases to approximately 1 × 10⁻³ m s−1, continuing to decline along the system due to the cumulative effect of friction losses and the resistance of the porous medium. The capillary resistance becomes more pronounced as the flow path increases Comparing the pressure contours in Figure 11e–g, it can be observed that the highest inlet pressure is in the 1-stack cell, followed by the 4-stack cell, and finally the 6-stack cell, which has the lowest inlet pressure. However, the latter has the lowest pressure values, which is reflected in the higher velocity achieved by the ethanol moving along the 6-stack paper strip. This negative pressure value would help to extract a greater amount of air present in the cell’s surroundings. This behavior can enhance the effective wetting of the catalytic layers and partially compensate for the velocity losses caused by friction inside the porous medium.
4. Conclusions
This study demonstrates the technical and operational feasibility of utilizing commercial tequila as a direct, sustainable fuel in paper-based air-breathing microfluidic fuel cells (FCs). By integrating experimental characterization with Computational Fluid Dynamics (CFD) results, which were used to identify hydrodynamic trends and fuel-distribution characteristics that may influence cell operation, the electrical performance metrics are derived exclusively from experimental measurements.
Experimental results for individual cells indicated that electrode dimensions are a critical determinant of efficiency. Smaller electrode configurations (0.5 × 0.5 cm) exhibited superior performance, achieving a maximum power density of 0.142 mW cm−2 and an open-circuit voltage of 0.92 V. This suggests that reduced active areas mitigate concentration polarization and optimize mass transport within capillary-driven systems. In contrast, scaling the system into a 6-cell series-parallel stack significantly enhanced the total output, reaching a maximum power density of 3.2 mW cm−2 and a current density of 4.5 mA cm−2, outperforming the 4-cell configurations. The Computational Fluid Dynamics simulations provided essential insights into the correlation between flow velocity and electrode placement. A direct correspondence was found between the velocity gradient and the resulting power generation; as the fuel moves through the porous medium, the velocity decreases from 2.8 × 10⁻² m s−1 at the inlet to approximately 1 × 10⁻⁶ m s−1 at the most distal cell. Despite this drastic reduction, the simulations and experimental observations confirm that the fluid successfully reaches the outlet in both stack configurations. This ensures that oxidation-reduction reactions occur across all electrodes, explaining the increased current and voltage observed in the 6-cell stack compared to the 4-cell arrangement. However, this improvement is not directly proportional to the number of cells, as performance is mitigated by internal ohmic resistances, the non-uniform fuel distribution inherent to capillary-driven flow in the porous matrix, and mass-transport limitations observed in the final stages of the stack, underscoring the need for optimized hydraulic distribution in future designs. Another variable that defines cell performance is pressure, which indicates that the highest negative pressure value ensures that the ethanol completely occupies the cell walls, improving contact with the cathode and anode, which results in a higher current density. The successful use of tequila as a fuel source emphasizes the versatility of paper-based microfluidic fuel cells for biomass-derived energy applications. The high ethanol content and the beverage’s specific chemical composition were effectively utilized, demonstrating its potential for low-cost, portable power generation and ethanol-sensing technologies. In summary, the correlation between experimental performance and computational modeling confirms that optimizing electrode geometry and managing fluidic profiles are critical for developing high-efficiency paper-based fuel cell stacks. These findings provide a robust framework for the rational design of decentralized energy devices using non-conventional, sustainable fuels.
Author Contributions
Conceptualization, A.D. and I.L.V.E.; methodology, A.D.; software, J.E.E.G.-D.; validation, I.L.V.E. and J.M.O.-R.; formal analysis, A.D.; investigation, J.R.R.; resources, A.D.; data curation, A.D. and J.E.E.G.-D.; writing—original draft preparation, J.M.O.-R. and J.E.-N.; writing—review and editing, J.M.O.-R. and J.R.R.; visualization, J.M.O.-R. and J.E.E.G.-D.; supervision, I.L.V.E.; project administration, J.M.O.-R.; funding acquisition, J.M.O.-R. All authors have read and agreed to the published version of the manuscript.
Funding
The authors want to thank SECIHTI through the project: “Cátedra CONAHCYT project 513” and the program “Estancias Posdoctorales por México project 2517439”.
Data Availability Statement
The original contributions presented in this study are included in the article. Further inquiries can be directed to the corresponding authors.
Acknowledgments
The authors want to thank: Alicia Primero Álvarez, Nallely del Ángel Mejia, and Reyna Andrea Rincón López, for reviewing and preparing the figures.
Conflicts of Interest
The authors declare no conflicts of interest.
References
- Kjeang, E. Microfluidic Fuel Cells and Batteries; Springer International Publishing: Berlin/Heidelberg, Germany, 2014. [Google Scholar] [CrossRef] [Scilit]
- Zhao, T. Micro Fuel Cells; Elsevier: Amsterdam, The Netherlands, 2009. [Google Scholar] [CrossRef] [Scilit]
- Moreno-Zuria, A.; Ortiz-Ortega, E.; Gurrola, M.; Chávez-Ramírez, A.; Ledesma-García, J.; Arriaga, L. Evolution of microfluidic fuel stack design as an innovative alternative to energy production. Int. J. Hydrogen Energy 2017, 42, 27929–27939. [Google Scholar] [CrossRef] [Scilit]
- Salloum, K.S.; Posner, J.D. A membraneless microfluidic fuel cell stack. J. Power Sources 2011, 196, 1229–1234. [Google Scholar] [CrossRef] [Scilit]
- Tomassetti, M.; Angeloni, R.; Merola, G.; Castrucci, M.; Campanella, L. Catalytic fuel cell used as an analytical tool for methanol and ethanol determination. Application to ethanol determination in alcoholic beverages. Electrochim. Acta 2016, 191, 1001–1009. [Google Scholar] [CrossRef] [Scilit]
- Deng, L.; Shang, L.; Wen, D.; Zhai, J.; Dong, S. A membraneless biofuel cell powered by ethanol and alcoholic beverage. Biosens. Bioelectron. 2010, 26, 70–73. [Google Scholar] [CrossRef] [Scilit] [PubMed]
- Rao, L.T.; Dubey, S.K.; Javed, A.; Goel, S. Stacked Microfluidic Paper Ethanol Fuel Cell with a Variety of Rapidly Prototyped Electrodes: Optimization and Performance Investigation. Energy Technol. 2022, 10, 2200073. [Google Scholar] [CrossRef] [Scilit]
- Lee, J.; Lim, K.G.; Palmore, G.T.R.; Tripathi, A. Optimization of Microfluidic Fuel Cells Using Transport Principles. Anal. Chem. 2007, 79, 7301–7307. [Google Scholar] [CrossRef] [Scilit] [PubMed]
- Shen, L.L.; Zhang, G.R.; Venter, T.; Biesalski, M.; Etzold, B.J. Towards best practices for improving paper-based microfluidic fuel cells. Electrochim. Acta 2019, 298, 389–399. [Google Scholar] [CrossRef] [Scilit]
- Thorson, M.R.; Brushett, F.R.; Timberg, C.J.; Kenis, P.J. Design rules for electrode arrangement in an air-breathing alkaline direct methanol laminar flow fuel cell. J. Power Sources 2012, 218, 28–33. [Google Scholar] [CrossRef] [Scilit]
- Yang, X.; Liu, C.; Liu, L. Numerical Simulation of the Influence of Structural Parameters on the Performance of a Direct Sodium Formate/Sodium Persulfate Microfluidic Fuel Cell. ACS Omega 2026, 11, 25156–25170. [Google Scholar] [CrossRef] [Scilit] [PubMed]
- Wu, B.; Xu, X.; Dong, G.; Zhang, M.; Luo, S.; Leung, D.Y.; Wang, Y. Computational modeling studies on microfluidic fuel cell: A prospective review. Renew. Sustain. Energy Rev. 2024, 191, 114082. [Google Scholar] [CrossRef] [Scilit]
- Krishnamurthy, D.; Johansson, E.O.; Lee, J.W.; Kjeang, E. Computational modeling of microfluidic fuel cells with flow-through porous electrodes. J. Power Sources 2011, 196, 10019–10031. [Google Scholar] [CrossRef] [Scilit]
- Ouyang, T.; Lu, J.; Xu, P.; Hu, X.; Chen, J. Mechanism study and evaluation of high efficiency paper-based microfluidic fuel cell coupled with capillary force. J. Power Sources 2022, 520, 230807. [Google Scholar] [CrossRef] [Scilit]
- Sadeghi, P. Numerical Modelling of Paper-Based Microfluidic Flow Cells. Ph.D. Thesis, Simon Fraser University, Burnaby, BC, Canada, 2021. [Google Scholar]
- Takken, M.; Wille, R. Accelerated Computational Fluid Dynamics Simulations of Microfluidic Devices by Exploiting Higher Levels of Abstraction. Micromachines 2024, 15, 129. [Google Scholar] [CrossRef] [Scilit] [PubMed]
- Khabbazi, A.E.; Richards, A.; Hoorfar, M. Numerical study of the effect of the channel and electrode geometry on the performance of microfluidic fuel cells. J. Power Sources 2010, 195, 8141–8151. [Google Scholar] [CrossRef] [Scilit]
- Bazylak, A.; Sinton, D.; Djilali, N. Improved fuel utilization in microfluidic fuel cells: A computational study. J. Power Sources 2005, 143, 57–66. [Google Scholar] [CrossRef] [Scilit]
- d’Adamo, A.; Haslinger, M.; Corda, G.; Höflinger, J.; Fontanesi, S.; Lauer, T. Modelling Methods and Validation Techniques for CFD Simulations of PEM Fuel Cells. Processes 2021, 9, 688. [Google Scholar] [CrossRef] [Scilit]
- Sokmez, E.; Taymaz, I.; Eker Kahveci, E. Performance evaluation of direct ethanol fuel cell using a three-dimensional CFD model. Fuel 2022, 313, 123022. [Google Scholar] [CrossRef] [Scilit]
- Liu, Z.; Sun, T.; Bai, F. Numerical Study on Effect of Flow Field Configuration on Air-Breathing Proton Exchange Membrane Fuel Stacks. Energies 2024, 17, 2501. [Google Scholar] [CrossRef] [Scilit]
- An, L.; Zhao, T. Transport phenomena in alkaline direct ethanol fuel cells for sustainable energy production. J. Power Sources 2017, 341, 199–211. [Google Scholar] [CrossRef] [Scilit]
- Tanveer, M.; Kim, K.Y. Flow Configurations of Membraneless Microfluidic Fuel Cells: A Review. Energies 2021, 14, 3381. [Google Scholar] [CrossRef] [Scilit]
- Chandra, S.; Lal, S.; Janardhanan, V.M.; Sahu, K.C.; Deepa, M. Ethanol based fuel cell on paper support. J. Power Sources 2018, 396, 725–733. [Google Scholar] [CrossRef] [Scilit]
- de-la Rosa, J.G.; Álvarez, A.; Gurrola, M.P.; Rodríguez-Morales, J.A.; Oza, G.; Arriaga, L.; Ledesma-García, J. Alcohol Dehydrogenase Immobilized on TiO2 Nanotubes for Ethanol Microfluidic Fuel Cells. ACS Sustain. Chem. Eng. 2020, 8, 10900–10910. [Google Scholar] [CrossRef] [Scilit]
- Moreno-Zuria, A.; Rivera, J.; Chávez-Ramírez, A.; Mohamedi, M. Filter paper as electrolyte flow transport using vaporized methanol as fuel in a microfluidic fuel cell: Experimental and numerical simulation. DeCarbon 2024, 4, 100046. [Google Scholar] [CrossRef] [Scilit]
- Esquivel, J.P.; Campo, F.J.D.; de la Fuente, J.L.G.; Rojas, S.; Sabaté, N. Microfluidic fuel cells on paper: Meeting the power needs of next generation lateral flow devices. Energy Environ. Sci. 2014, 7, 1744–1749. [Google Scholar] [CrossRef] [Scilit]
- Lau, C.; Moehlenbrock, M.J.; Arechederra, R.L.; Falase, A.; Garcia, K.; Rincon, R.; Minteer, S.D.; Banta, S.; Gupta, G.; Babanova, S.; et al. Paper based biofuel cells: Incorporating enzymatic cascades for ethanol and methanol oxidation. Int. J. Hydrogen Energy 2015, 40, 14661–14666. [Google Scholar] [CrossRef] [Scilit]
- Baruah, S.; Kumar, A.; Peela, N. Advancing paper-based microfluidic ethanol fuel cells with gel-assisted dual electrolytes: A step towards scalable power solutions. Energy Convers. Manag. 2025, 332, 119767. [Google Scholar] [CrossRef] [Scilit]

Disclaimer/Publisher’s Note: The statements, opinions and data contained in all publications are solely those of the individual author(s) and contributor(s) and not of MDPI and/or the editor(s). MDPI and/or the editor(s) disclaim responsibility for any injury to people or property resulting from any ideas, methods, instructions or products referred to in the content. |
© 2026 by the authors. Licensee MDPI, Basel, Switzerland. This article is an open access article distributed under the terms and conditions of the Creative Commons Attribution (CC BY) license.