


Abstract
Seawater intrusion remains a critical threat to coastal groundwater, where subsurface cut-off walls are commonly used for mitigation. This study employs 2D variable-density numerical modeling to investigate the impacts of hydraulic conductivity anisotropy (rk = 0.02–50) and seasonal inland groundwater fluctuations on residual saltwater desalination, quantified by means of RRSM and RRSL. Our results revealed that rk is inversely correlated with final desalination efficiency. Lower rk values (0.02–0.1) achieve exhaustive salt removal despite requiring longer flushing durations. Conversely, higher rk values significantly suppress efficiency and induce violent oscillations in desalination rates under seasonal forcing. A critical failure mechanism was identified: intensified vertical flow dynamics allow saltwater to “overtop” the barrier during low inland groundwater stages, triggering severe secondary intrusion. These findings underscore that conventional cut-off wall designs may be inadequate under dynamic boundaries, necessitating taller barrier configurations and precise anisotropy assessments to ensure long-term functional resilience in coastal aquifer management.
1. Introduction
Seawater intrusion is now recognized as a global hydrogeological concern. Using numerical modeling, geophysical methods, and experimental approaches, researchers have conducted in-depth investigations into various aspects of seawater intrusion, including its driving mechanisms and impacts, monitoring and assessment, and trend prediction [1,2,3]. Subsurface cut-off walls, a common physical barrier technology, can effectively mitigate or prevent seawater intrusion into inland aquifers [4,5].
Moreover, subsurface cut-off walls can be constructed in various configurations to accommodate diverse hydrogeological conditions. Once emplaced, they remain stable over long periods and provide continuous seepage control. Consequently, owing to these advantages in protecting coastal groundwater resources, cut-off walls have been widely adopted for seawater intrusion management [6,7,8]. However, the construction of cut-off walls also affects the groundwater environment, in particular the desalination of residual saltwater. Therefore, reliable numerical models are required to evaluate the performance of cut-off walls and their influence on groundwater flow fields and water quality [9].
The permeability performance and installation location of subsurface cut-off walls are key factors in preventing and controlling seawater intrusion. Defects and cracks in the cut-off wall itself can significantly shorten the seepage path, thereby increasing leakage and reducing the wall’s effectiveness in blocking seawater intrusion. In addition, the depth and location of the cut-off wall are critical indicators for regulating the seawater intrusion regime: excessive wall depth substantially increases construction costs, whereas insufficient depth makes it difficult to effectively block seawater intrusion and to discharge residual saltwater [10]. Previous investigations of the dynamic behavior of groundwater environments under the influence of seawater intrusion and subsurface cut-off walls have mostly been conducted using numerical models that focus on various thermal conditions and influencing factors. However, natural underwater environments are perennially disturbed by seasonal variations and human activities, resulting in complex and variable hydrogeological conditions. Consequently, the applicability of the aforementioned studies remains limited, and they are insufficient to optimize the construction of subsurface cut-off walls [11].
Coastal regions are core areas of global population concentration and socio-economic development, and their groundwater systems are under increasing pressure from both climate change and human activities [12,13]. Climate change causes a progressive rise in global mean sea level. This lowers the groundwater level relative to sea level and shifts the seawater–groundwater interface landward, thereby exacerbating seawater intrusion in coastal areas [14,15]. Meanwhile, growing populations and economic development increase the demand for groundwater, leading to over-extraction. This, in turn, causes geo-environmental problems such as land subsidence and seawater intrusion, affecting agricultural production and coastal modernization [16]. These phenomena may alter the hydraulic conductivity and dispersivity of the coastal groundwater environment, thereby modifying the local hydrodynamic conditions and affecting seawater intrusion control and residual saltwater desalination [17].
To date, investigations into the dynamic behavior of seawater intrusion and residual saltwater behind subsurface cut-off walls have been conducted primarily under homogeneous and isotropic aquifer conditions, with hydrogeological parameters assigned and calibrated. However, the effect of hydraulic conductivity anisotropy on residual saltwater in the context of seasonal groundwater level fluctuations remains unexplored. Furthermore, recent evidence suggests that the interaction between wall placement and tidal or seasonal dynamics can significantly alter the flushing timescales of trapped saline wedges. Therefore, research methods and numerical models must be continuously improved to more accurately evaluate the impact of subsurface cut-off wall construction on the groundwater environment, thereby providing a more scientific basis for optimizing cut-off wall design and construction.
Given the limitations of previous studies, this paper, based on an established numerical model, aims to achieve the following: (1) simulate seawater intrusion and residual saltwater behind a subsurface cut-off wall; (2) examine the influence of hydraulic conductivity anisotropy on the desalination process of residual saltwater; and (3) explore the dynamic behavior and desalination process of residual saltwater in combination with seasonal groundwater level fluctuations.
2. Method
2.1. Concept Model
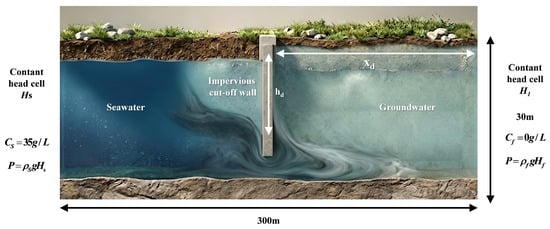
This study investigates the processes of seawater intrusion and subsequent desalination behind the impervious cut-off wall. Figure 1 illustrates a hypothetical conceptual model of a coastal unconfined aquifer. To simplify the physical system, the following assumptions are invoked: the aquifer is unconfined, homogeneous, and isotropic; fluid density is solely governed by solute concentration; the porous medium is fully saturated; and the fluid is compressible and the solid matrix is incompressible. Based on these constitutive assumptions, a series of scenarios are developed within a two-dimensional (2D) cross-sectional domain, incorporating varying aquifer parameters, boundary conditions, and subsurface dam configurations.
Figure 1.
Conceptual model.
Figure 1 illustrates the hypothetical model configuration, defining a simulation domain of 300 × 30 m2. Neumann no-flow boundaries are prescribed at both the top and bottom of the flow and transport zones to simulate impermeable confining layers. The hydraulic heads of the unconfined aquifer are set at 28.5 m at the seaward boundary and 29.7 m at the inland groundwater boundary [18]. A Dirichlet-type mass boundary is applied, with a constant salt concentration (CS) of 35 g/L and a fresh water concentration (Cf) of 0 g/L, corresponding to fluid densities of 1025 and 1000 kg/m3 for seawater and fresh groundwater, respectively. The origin of the Cartesian coordinate system (X, Z) is situated at the base of the aquifer, representing the horizontal and vertical axes. An impervious cut-off wall, with a height of Hd and a thickness of 1 m, is incorporated into the conceptual model. It is situated at a distance Xd from the specified origin along the positive X-axis. For the purpose of this simulation, the wall is assumed to be completely impermeable to fluid flow [19].
The governing equation for two-dimensional (2D), variable-density groundwater flow, expressed in terms of the equivalent freshwater head, is formulated as follows:
In Equation (1), z denotes the vertical orthogonal coordinate axis aligned with the principal directions of permeability; Kf is the equivalent freshwater hydraulic conductivity (LT−1); Sf is the equivalent freshwater specific storage (L−1); t represents time (T); θ is the effective porosity [dimensionless]; C is the solute concentration (ML−3); and hf is the equivalent freshwater head (L). Furthermore, ρf represents the density of freshwater (ML−3); ρ is the fluid density (ML−3), ρs is the fluid density at sources and sinks (ML−3), and qs denotes the volumetric flow rate of sources and sinks per unit volume of the aquifer (T−1) [20]. Salt transport occurs through advection, molecular diffusion, and mechanical dispersion; notably, chemical reactions are neglected in this study. The migration of salt during seawater intrusion can be described by the following advection–dispersion equation:
In Equation (2), D represents the hydrodynamic dispersion tensor (L2T−1); is the seepage velocity (LT−1); and Cs denotes the concentration at sources and sinks (ML−3).
The effects of fluid pore pressure and temperature on density are assumed to be negligible. In this study, chemical reactions are not taken into account. Consequently, fluid density is primarily influenced by the solute concentration, and saltwater density can be approximated as an empirical function of concentration:
In Equation (3), E is a dimensionless constant with an approximate value of 0.7143, assuming saltwater concentrations ranging from zero to that of standard seawater (35 g/L).
In this model, the impervious cut-off wall is positioned 50 m from the coastline with a height of 9.15 m. This height corresponds to the elevation of the saltwater wedge at the 50% concentration isoline, which has been demonstrated to effectively prevent seawater intrusion while managing residual saltwater [21,22]. The aquifer parameters are specified as follows: the hydraulic gradient is 4‰, the horizontal hydraulic conductivity is 2.5 × 10⁻⁴ m/s, and the longitudinal dispersion is 1 m. Hydraulic conductivity anisotropy is defined as the ratio of vertical to horizontal hydraulic conductivity.
Hydraulic conductivity isotropy is represented by the ratio rk = 1. In this study, the hydraulic conductivity anisotropy is adjusted by maintaining a constant horizontal conductivity (Kx = 2.5 × 10⁻⁴ m/s) while varying the vertical conductivity (Kz), resulting in rk values ranging from 0.02 to 50 [23]. The anisotropy ratio is defined as rk = Kz/Kx. rk < 1 indicates that horizontal hydraulic conductivity dominates, reflecting hydrogeological conditions characterized by sedimentary bedding. rk > 1 indicates that vertical hydraulic conductivity dominates, which may reflect the development of vertical fractures or the connectivity of interlayer high-permeability pathways. The simulated range of 0.02 to 50 in this study covers a wide spectrum of geological scenarios, ranging from extreme horizontal dominance to extreme vertical dominance.
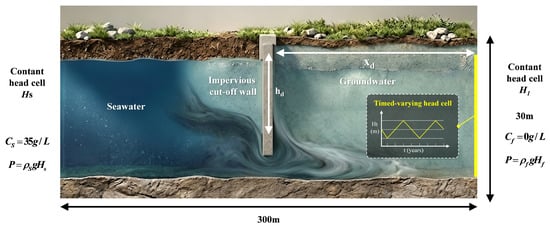
By modulating these relevant parameters, the spatiotemporal distribution characteristics of residual saltwater under various anisotropic conditions are systematically investigated. In this study, seasonal fluctuations of the inland groundwater level are simulated by implementing a time-dependent hydraulic head at the right boundary of the model, which periodically oscillates between high and low groundwater stages (Figure 2). The time-varying head at the inland boundary is characterized as a triangular periodic function, Ht, with a period T, a mean water level Hf, and an amplitude A [24]. Additionally, a constant freshwater concentration boundary (Cf = 0 kg/m3) is prescribed at the inland boundary to represent the terrestrial recharge source.
Figure 2.
Conceptual model of seasonal fluctuations in the inland groundwater levels.
2.2. Simulation Configurations
To systematically characterize the occurrence of seawater intrusion and the resulting dynamics of residual saltwater, this study develops four sets of numerical simulations with distinct boundary conditions and parameter configurations. The model used in this study was constructed using Comsol software (6.3) employing both Darcy’s Law and the Permeability modules to simulate the hydrological environment of the subsurface cut-off wall. The simulation workflow is partitioned into two functional stages, with Stage 1 focused on the natural process of seawater intrusion in the absence of a barrier. A simulation period of 10,000 days was prescribed for this initial stage, ensuring that both hydraulic heads and salinity distributions reach a steady state across all scenarios. Subsequently, the steady-state results obtained from Stage 1 are utilized as the initial conditions for the second stage. At the onset of Stage 2, the impervious cut-off wall is introduced into the model under the assumption of instantaneous completion. This simplification is justifiable as the construction duration of an impervious cut-off wall is typically negligible compared to the extensive time scales required for the complete flushing of residual saltwater. The simulation duration for Stage 2 extends from 20,000 to 80,000 days (approximately 54 to 220 years), ensuring the attainment of a new steady-state or quasi-steady-state equilibrium following the intervention.
The second set of simulations specifically examines the impact of hydraulic conductivity anisotropy on the formation and subsequent natural flushing of residual saltwater behind the impervious cut-off. In this scenario, the anisotropy ratio is prescribed across five representative gradients: 0.02, 0.1, 1, 10, and 50. The removal efficiency of the residual saltwater under these varying anisotropic conditions is systematically evaluated using the quantitative indexes defined in Section 2.3.
In the third set of simulations, the inland boundary condition is transitioned from a constant head (CH) to a fluctuating head (FH) setting to reassess the scenarios from the previous groups under seasonal groundwater oscillations. This adjustment allows for a comparative evaluation of the dynamic changes in the quantitative indexes defined in Section 2.3 under the influence of seasonal variations.
2.3. Quantitative Indexes
To evaluate the natural desalination efficiency of the residual saltwater behind the cut-off wall, two specialized metrics proposed by Yin [20] were adopted. These indicators comprise the Relative Reduction of Residual Salt Mass (RRSM) and the Relative Reduction of Residual Saltwater Length (RRSL).
The RRSM* is defined as follows:
In this context, RRSM0 represents the initial total mass of the saltwater sequestered behind the cut-off wall at the time of its installation. RRSM is the mass of residual salt in the inland aquifer at a given time. The RRSM* can be used to assess the removal efficiency of residual saltwater.
The RRSL* is defined as follows:
In this expression, RRSL0 represents the initial length of the saltwater wedge, and RRSL denotes the distance between the toe of the residual saltwater wedge and the impervious cut-off wall. In this study, the position of the saltwater toe is defined by the 10% salinity isoline [25]. The RRSL* metric is utilized to assess the extent of seawater intrusion and the spatial positioning of the saltwater wedge. Both the RRSL* and RRSM* can quantitatively demonstrate and compare the saltwater dynamic distribution and removal effects of residual saltwater in various settings.
3. Results
3.1. Formation of Seawater Intrusion and Residual Saltwater Behind the Impervious Cut-Off Wall
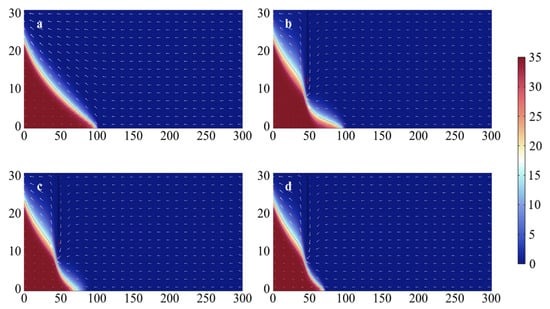
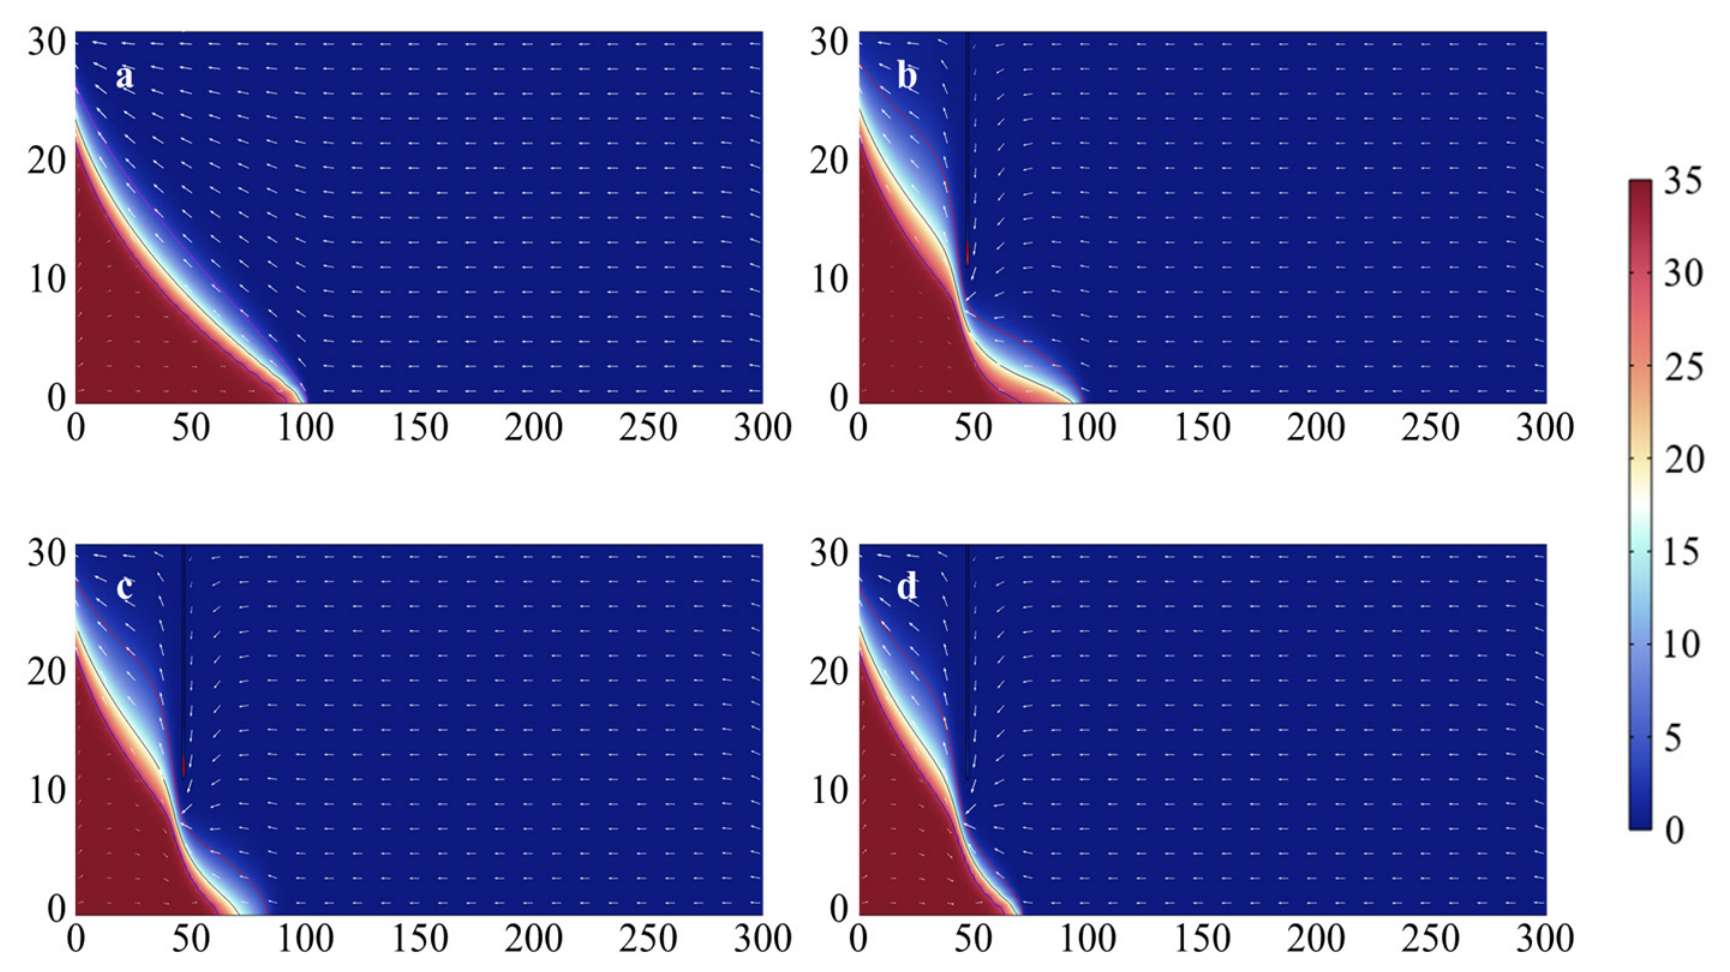
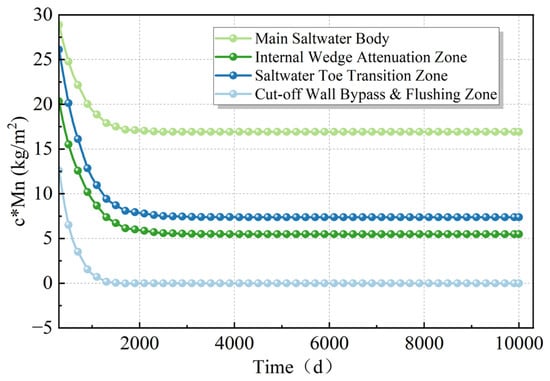
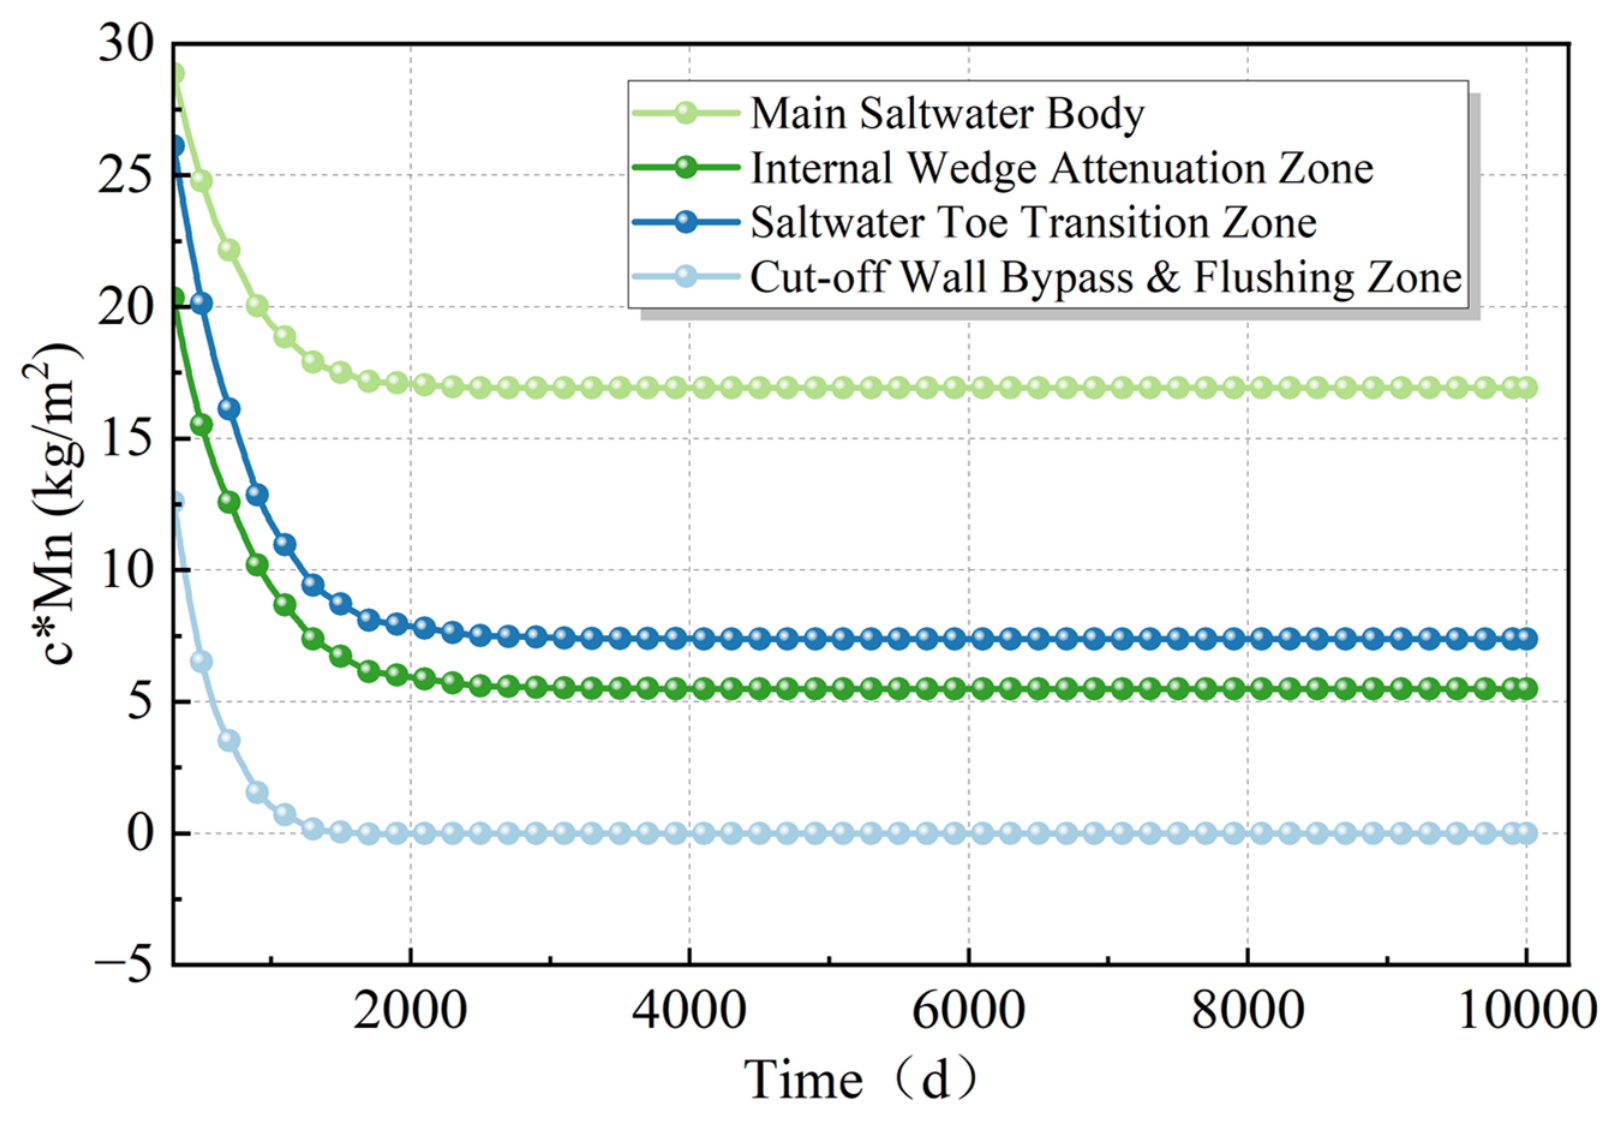
Figure 3 illustrates the natural distribution of saltwater after 10,000 days of simulation, at which point a steady-state condition has been achieved. To robustly demonstrate that the system has reached a steady state after the 10,000-day simulation period, four representative observation points—(10, 5), (20, 5), (35, 2), and (50, 2)—were selected to monitor the time series of salinity. These points were strategically chosen to capture the full spatial gradient of the saltwater wedge, extending from the main saltwater body near the sea boundary to the highly dynamic bypass zone directly beneath the cut-off wall. As shown in Figure 4, while the salinity at these locations experiences distinct decay trajectories due to the density-driven flow and freshwater flushing, all four curves completely level off and remain constant during the later stages of the simulation. This confirms that the entire coastal aquifer system, including the critical transition and mixing zones, has achieved a thorough dynamic equilibrium.
Figure 3.
Evolution of seawater intrusion and subsequent desalinization of residual saltwater behind the cut-off wall. (a) t = 0 d, (b) t = 200 d, (c) t = 400 d, (d) t = 800 d.
Figure 4.
Time-series profiles of solute concentration at four representative spatial locations along the saltwater wedge.
At this stage, the length of the saltwater toe extends to 105.2 m. The 10% (3.5 g/L, red), 50% (17.5 g/L, black), and 90% (31.5 g/L, blue) salinity isolines are distributed in parallel along the interface of the saltwater wedge [26], suggesting that the implementation of a cut-off wall can effectively prevent seawater intrusion while maximizing freshwater discharge.
The Modified Equivalent Freshwater Head (MEDH) varies with different locations (xd) of the cut-off wall, and the critical wall height required to arrest saltwater typically corresponds to the elevation of the 15–20% salinity isolines of the saltwater wedge. To evaluate the time scales and efficacy of residual saltwater desalination (quantified by means of RRSL and RRSM) in the unconfined aquifer, a cut-off wall was implemented at xd = 50 m with a height of hd = 9.15 m, consistent with the elevation of the 50% concentration isoline. Figure 3b–d illustrate the natural desalination process of the residual saltwater. Following the installation of the cut-off wall, the influence of the hydraulic gradient on the saltwater behind the wall is attenuated; consequently, the continuous groundwater flow leads to progressive salt flushing and the subsequent desalination of the residual saltwater [27]. The phenomena of seawater intrusion and saltwater wedge evolution captured in this model have been further validated by laboratory-scale sandbox experiments conducted by Chang and Fan [25,28]. The RRSM* reached 60.67% at 300 days and 76.92% at 600 days, with the residual salt being essentially eliminated by 1000 days as the RRSM* reached 78.65%. The RRSL* was recorded at 49.71% at 200 days and 68.64% at 500 days, approaching nearly 75.5% by the 1000-day mark. These results demonstrate that the selected evaluation metrics can effectively characterize the desalination dynamics of the residual saltwater. The RRSM* exhibits higher desalination efficiency during the initial stages of the flushing process. In contrast, the RRSL* undergoes more pronounced and rapid changes during the later stages of the desalination process.
3.2. The Effect of Hydraulic Conductivity Anisotropy on Residual Saltwater Desalination
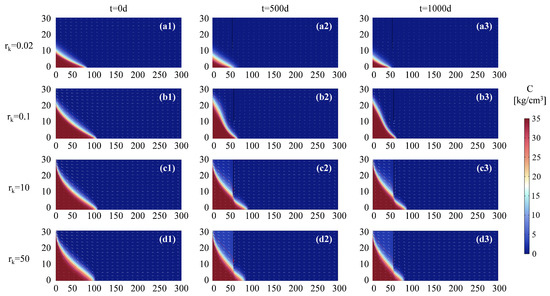
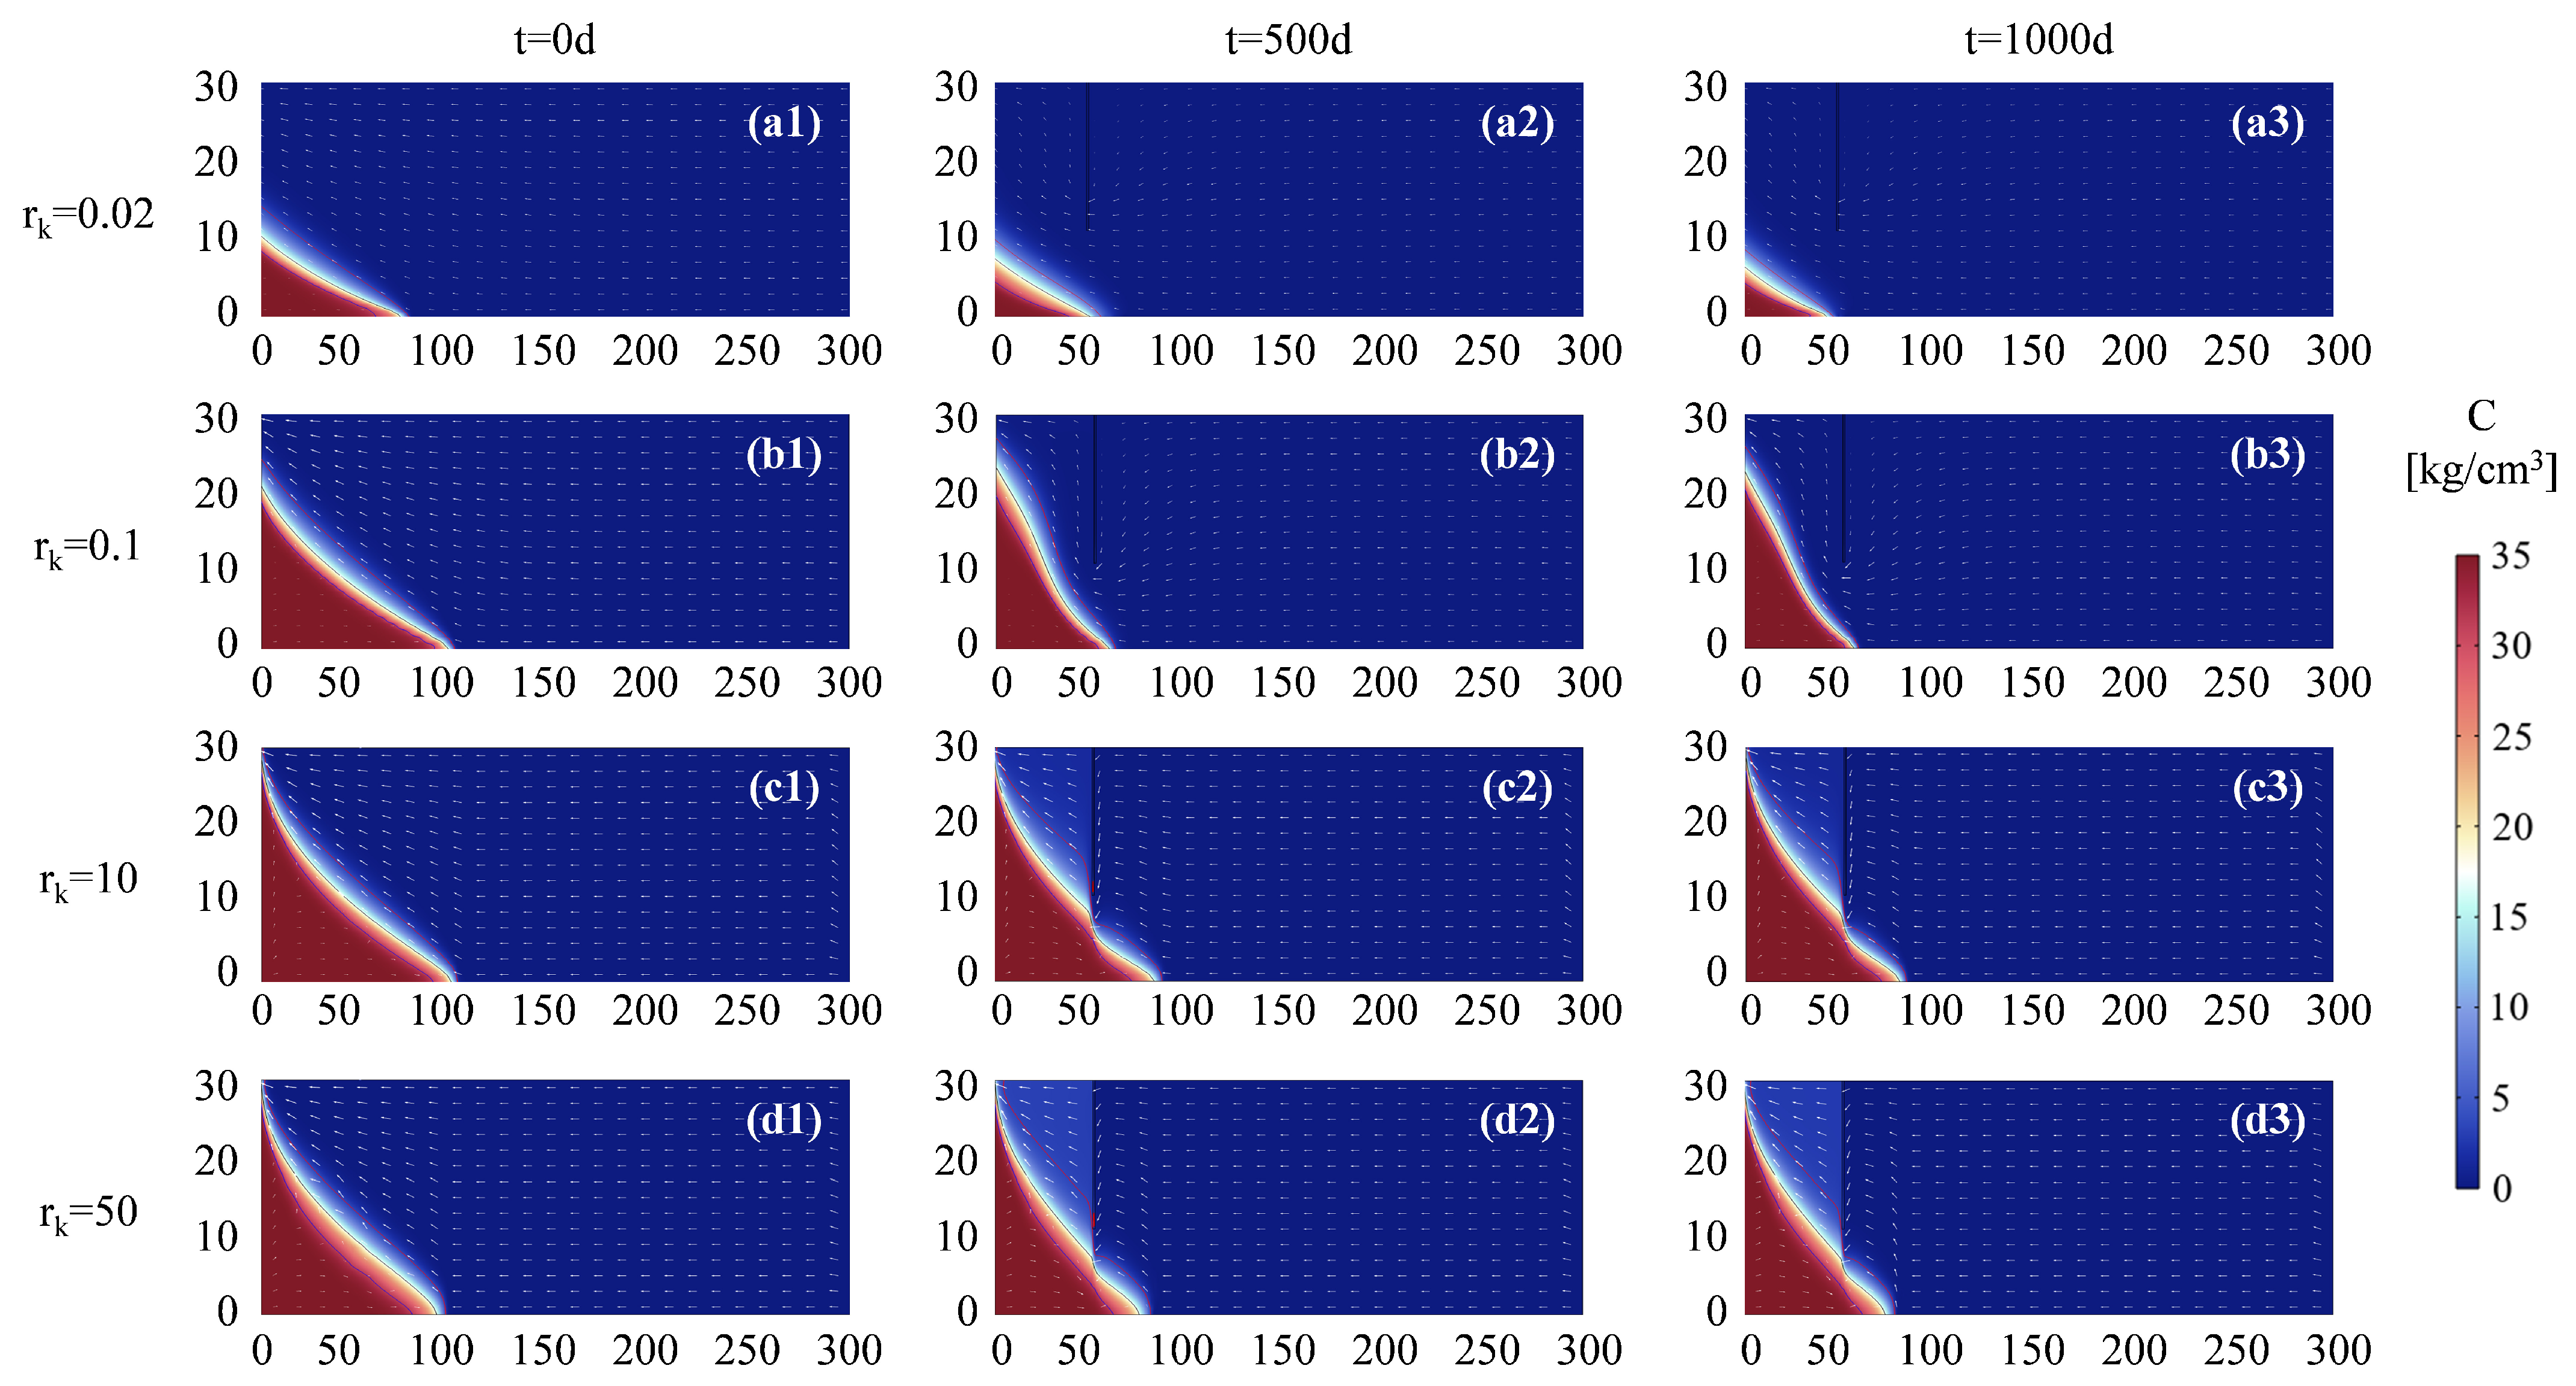
In this section, the impacts of varying rk values on the desalination of residual saltwater are compared, as illustrated in Figure 5.
Figure 5.
The effect of hydraulic conductivity anisotropy on the formation and desalination of residual saltwater. (a) rk = 0.02; (b) rk = 0.1; (c) rk = 10; (d) rk = 50. In each row, the columnsrepresent different simulation times: t = 0 d, t = 500 d, and t = 1000 d, respectively. Each subfigure (a1–a3,b1–b3,c1–c3,d1–d3) shows the spatial distribution of salinity undercombined conditions of anisotropy and time evolution.
In aquifers with diverse hydraulic conductivity anisotropy, the height of the saltwater wedge and the position of the saltwater toe exhibit significant fluctuations upon reaching a natural steady state. At rk = 0.02, the saltwater wedge reaches a height of 10.11 m with a toe distance of 78.8 m. As rk increases to 0.1, the height of the saltwater wedge rises to 100.4 m, accompanied by an extended toe distance of 104.6 m. As rk continues to increase, the height of the saltwater wedge further elevates, whereas the toe distance (intrusion length) exhibits a paradoxical decrease. At rk = 10, the height of the saltwater wedge reaches 27.81 m, while the toe distance recedes to 101.6 m. When rk increases to 50, the saltwater wedge height rises slightly to 29.7 m, but the toe distance significantly drops to 95.5 m.
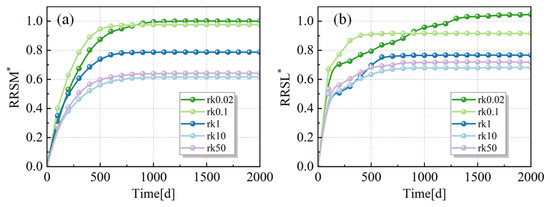
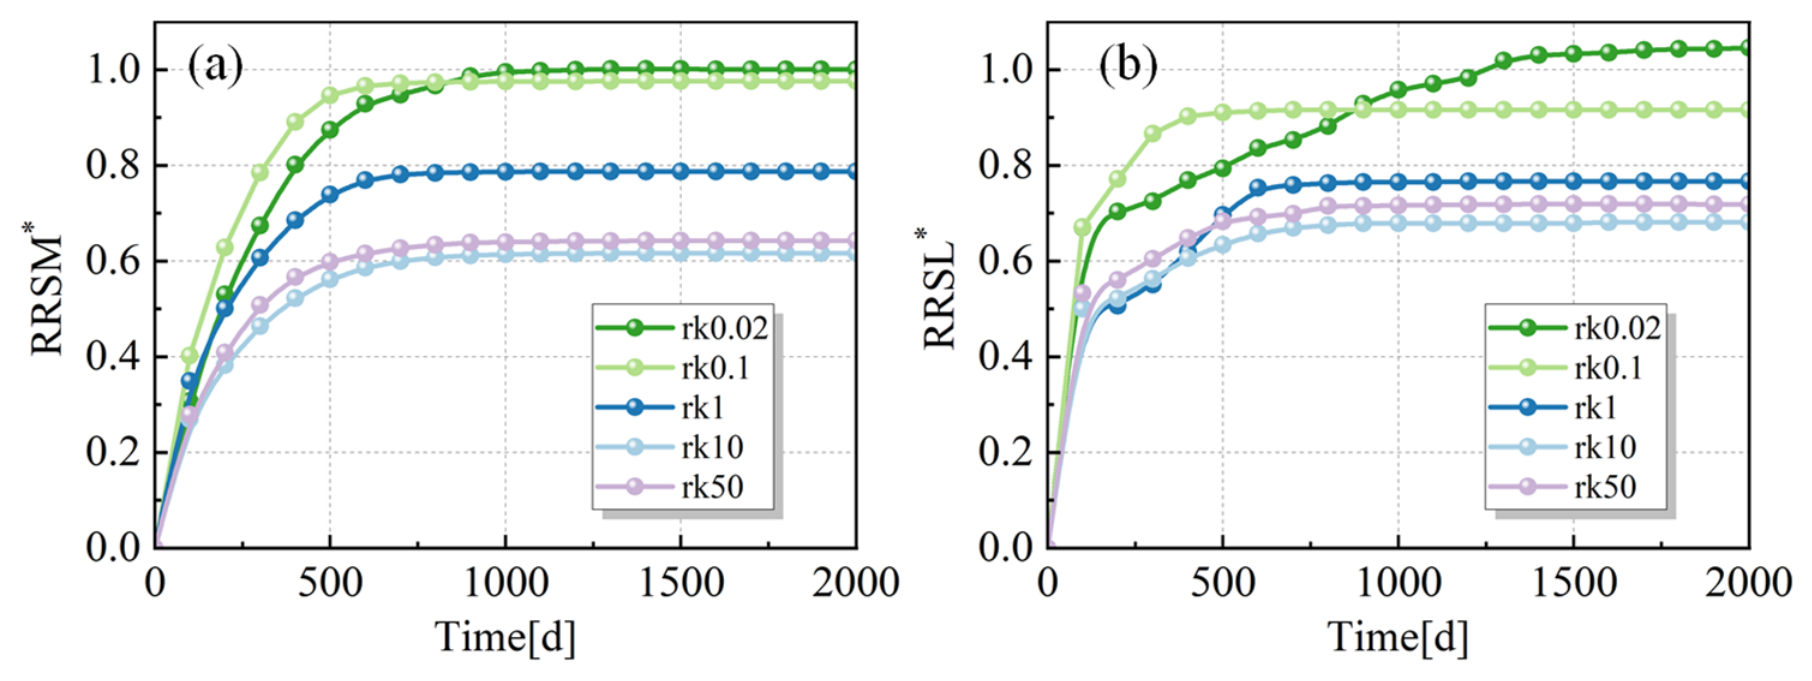
Following the installation of the cut-off wall, the time scales and efficacy of residual saltwater desalination are significantly influenced by the hydraulic conductivity anisotropy, as illustrated in Figure 6. Observations indicate that both the ultimate RRSM* and the time required to reach a steady state vary markedly with the increase in rk (Figure 6a). This trend is characterized by the fact that for rk = 50, the RRSM* reaches 56.69% within approximately 400 days and approaches 63.97% after 1000 days. However, for rk = 10, the RRSM* reaches 61.39% at 1000 days and stabilizes at 61.70%, whereas for rk = 0.1, the RRSM* attains 97.57% after approximately 1200 days. The RRSL exhibits a comparable trend in Figure 6b, revealing that the increase in rk drives a spatial shift in the position of the 10% salinity isoline.
Figure 6.
RRSM* (a) and RRSL* (b) changes with time in various rk situations.
Both RRSM* (Figure 5a) and RRSL* (Figure 5b) exhibit a common fundamental behavior: they increase rapidly during the initial phase and eventually plateau to a steady-state value over the 2000-day period. The final steady-state values are inversely related to the parameter rk. Smaller rk values lead to higher final stabilization levels, while larger rk values heavily suppress the maximum attainable values of both RRSM* and RRSL*. For example, rk = 0.02 reaches values ≥ 1.0, whereas rk = 50 plateaus at the lowest levels (around 0.60–0.68). An interesting non-linear dynamic occurs between the two lowest values, rk = 0.1 and rk = 0.02. In the early to mid-stages (roughly 0 to 600 days), the rk = 0.1 curve (teal) shows the steepest initial growth rate, maintaining the highest values among all groups. However, the rk = 0.02 curve (dark blue), despite a slightly slower initial climb, sustains its growth over a longer period. It eventually crosses the rk = 0.1 curve (around day 800 for RRSM* and day 900 for RRSL*) and claims the absolute highest final positions. Notably, in the RRSL* chart, rk = 0.02 is the only condition that eventually exceeds the 1.0 threshold (reaching approximately 1.05). The time required to reach a steady state is highly dependent on rk. Higher values (rk = 1, 10, 50) reach their respective horizontal plateaus relatively early (before 1000 days). In contrast, the lowest value (rk = 0.02) requires a significantly longer duration (around 1500 days) to fully stabilize its trajectory.
3.3. Effect of Fluctuating Inland Groundwater Levels on Residual Saltwater Desalination
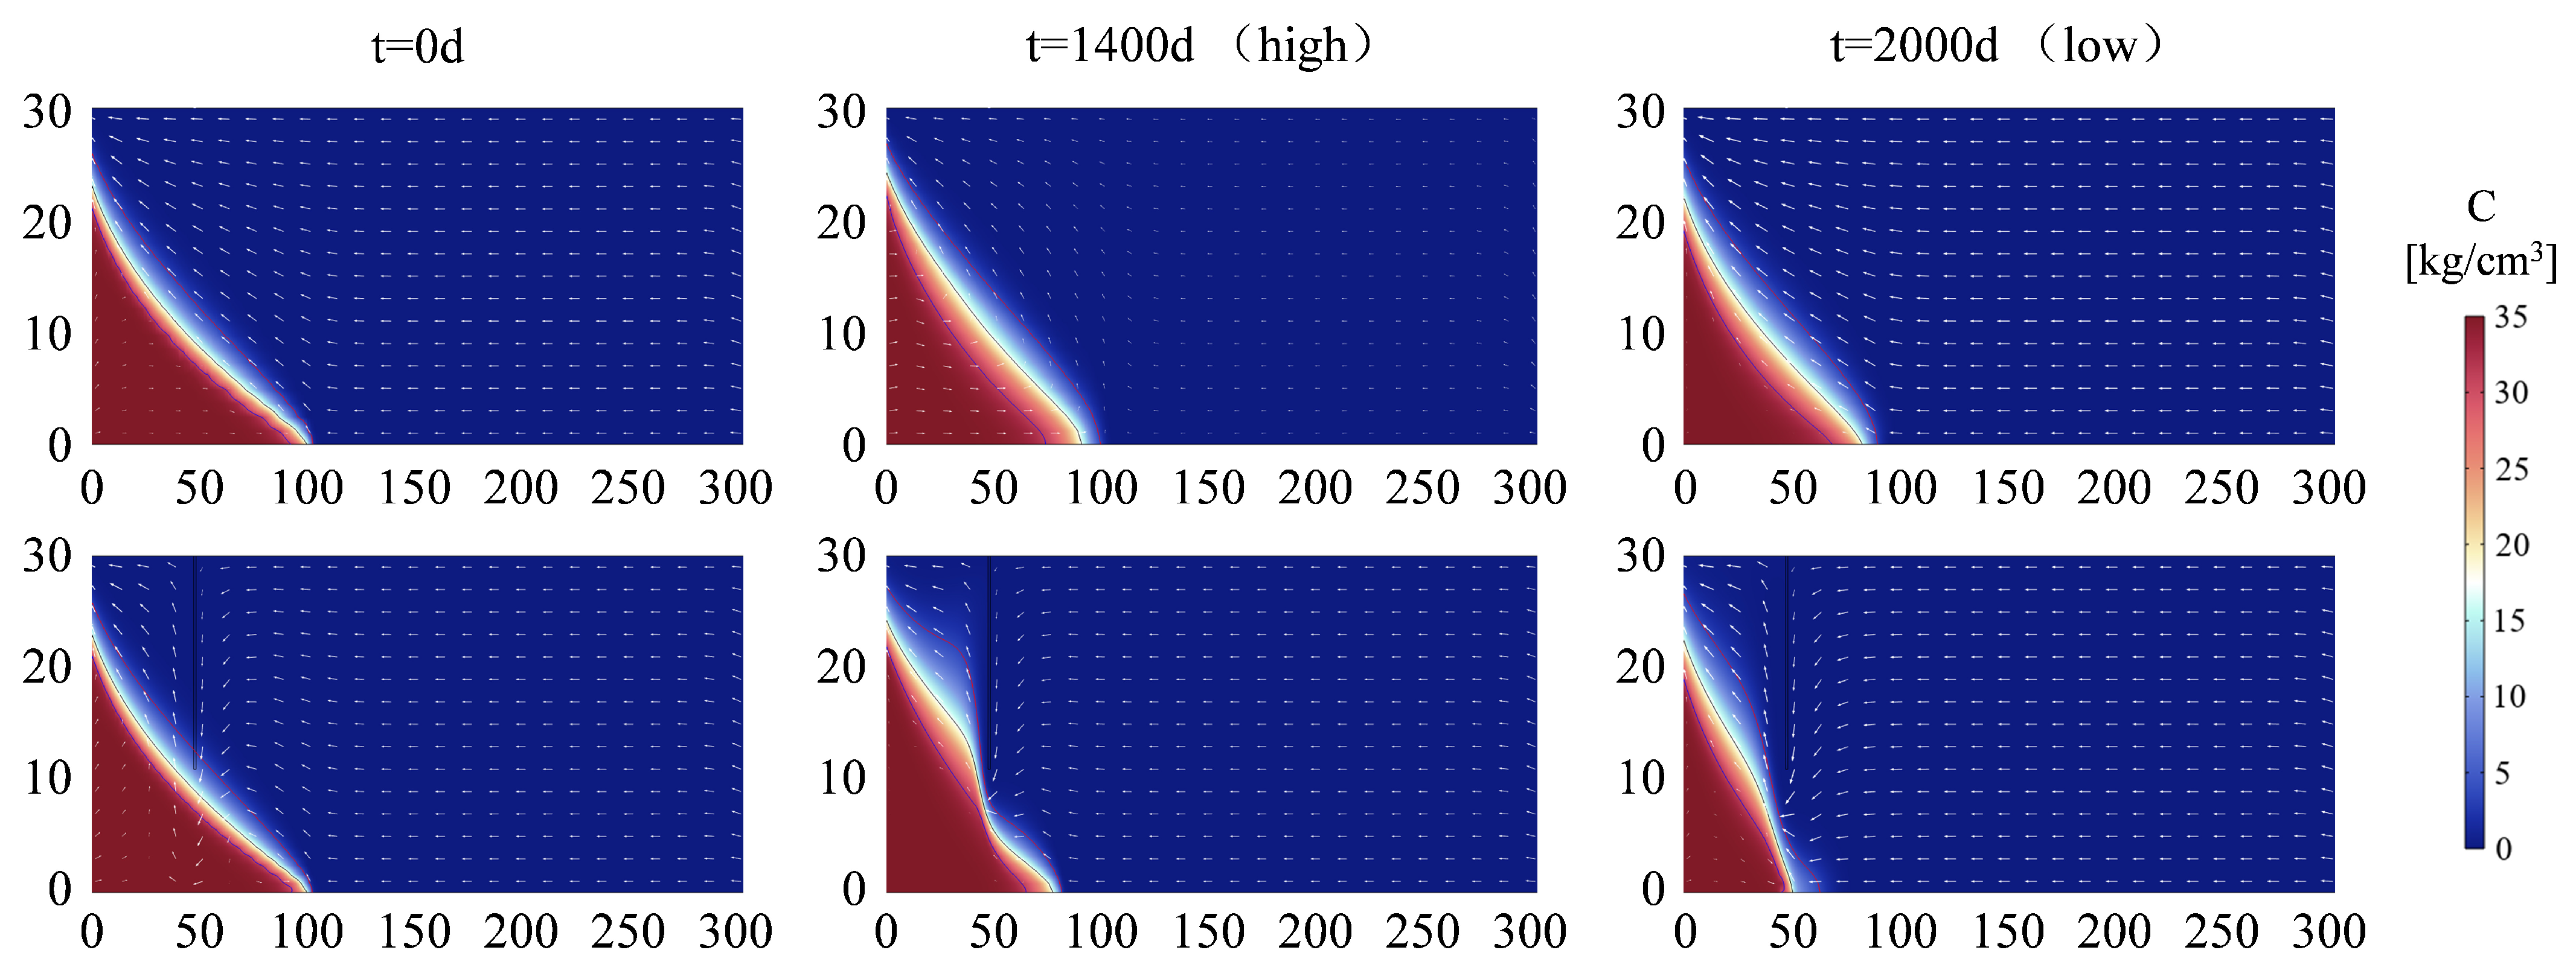
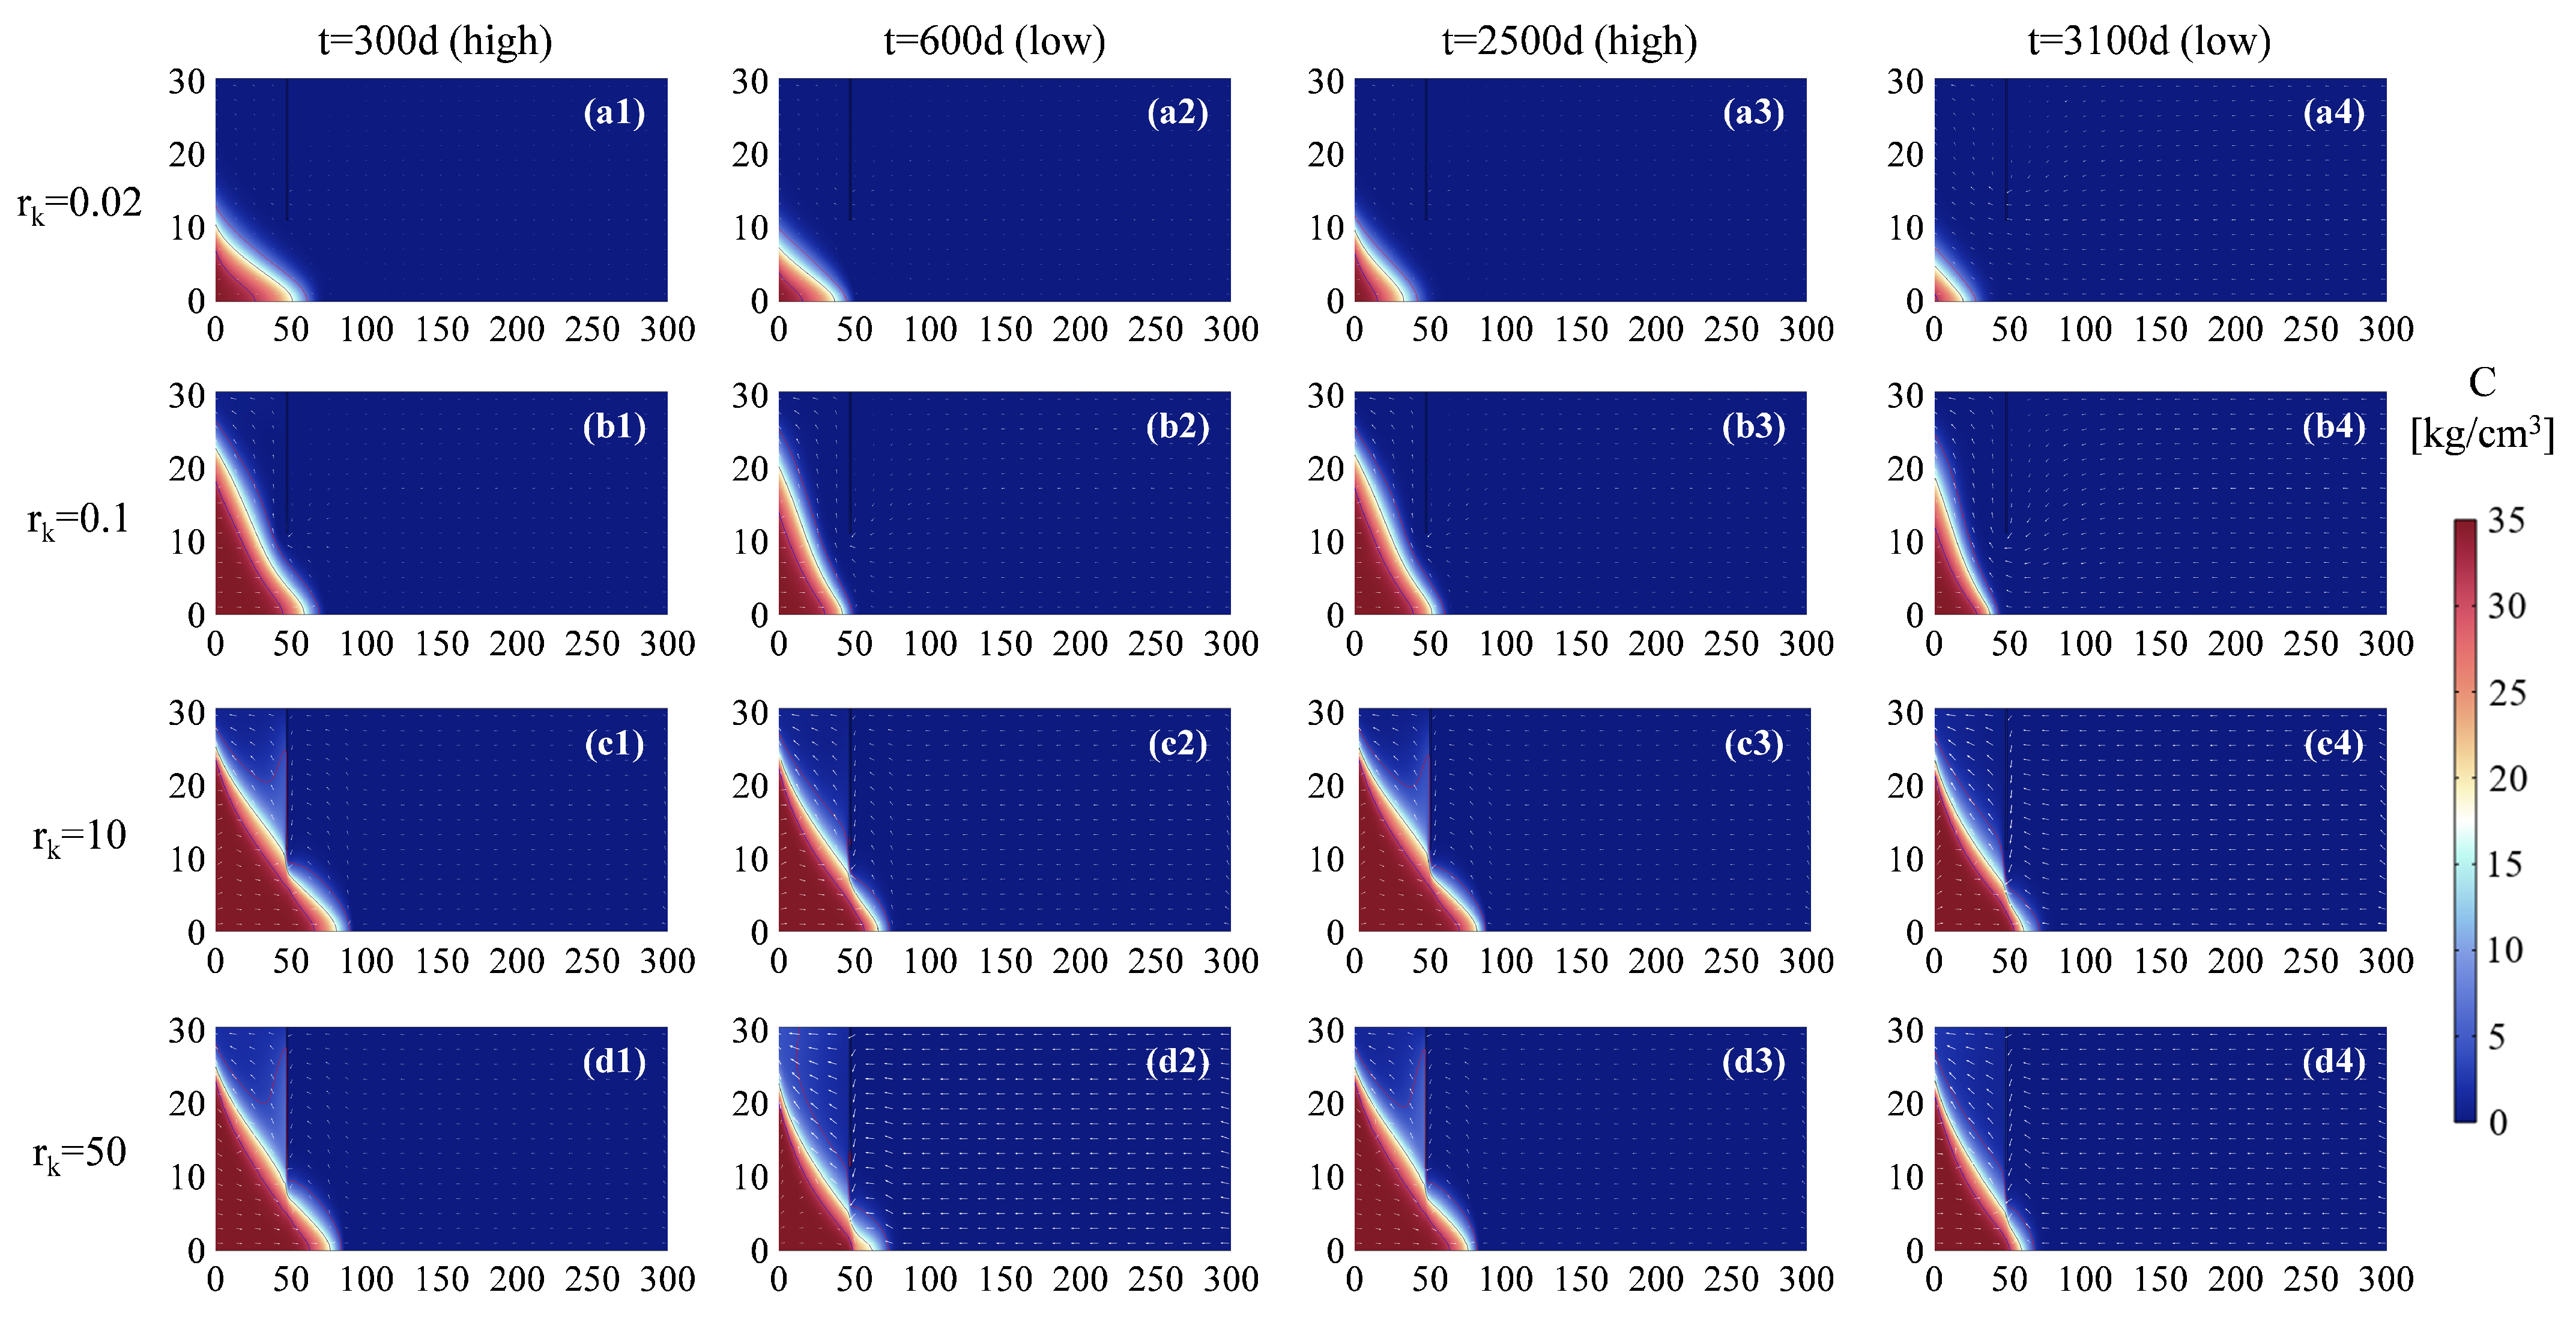
In this section, once the saltwater wedge achieves its natural steady state, the inland boundary condition is transitioned to incorporate seasonal groundwater head fluctuations. Figure 7 illustrates the groundwater flow fields and saltwater distributions during two representative periods, specifically the high and low inland groundwater stages. Observations reveal that the natural morphology of the saltwater wedge undergoes dynamic deformation in response to the varying inland hydraulic head. Although the general direction of groundwater flow remains largely unaltered, the flow velocity is significantly amplified during periods of high inland groundwater levels. Driven by seasonal groundwater fluctuations, the natural distribution of saltwater within the aquifer is characterized by a more extended saltwater toe during high inland groundwater stages and a relatively retracted toe during low groundwater stages.
Figure 7.
The effect of fluctuating inland groundwater head on the formation and desalination of residual saltwater.
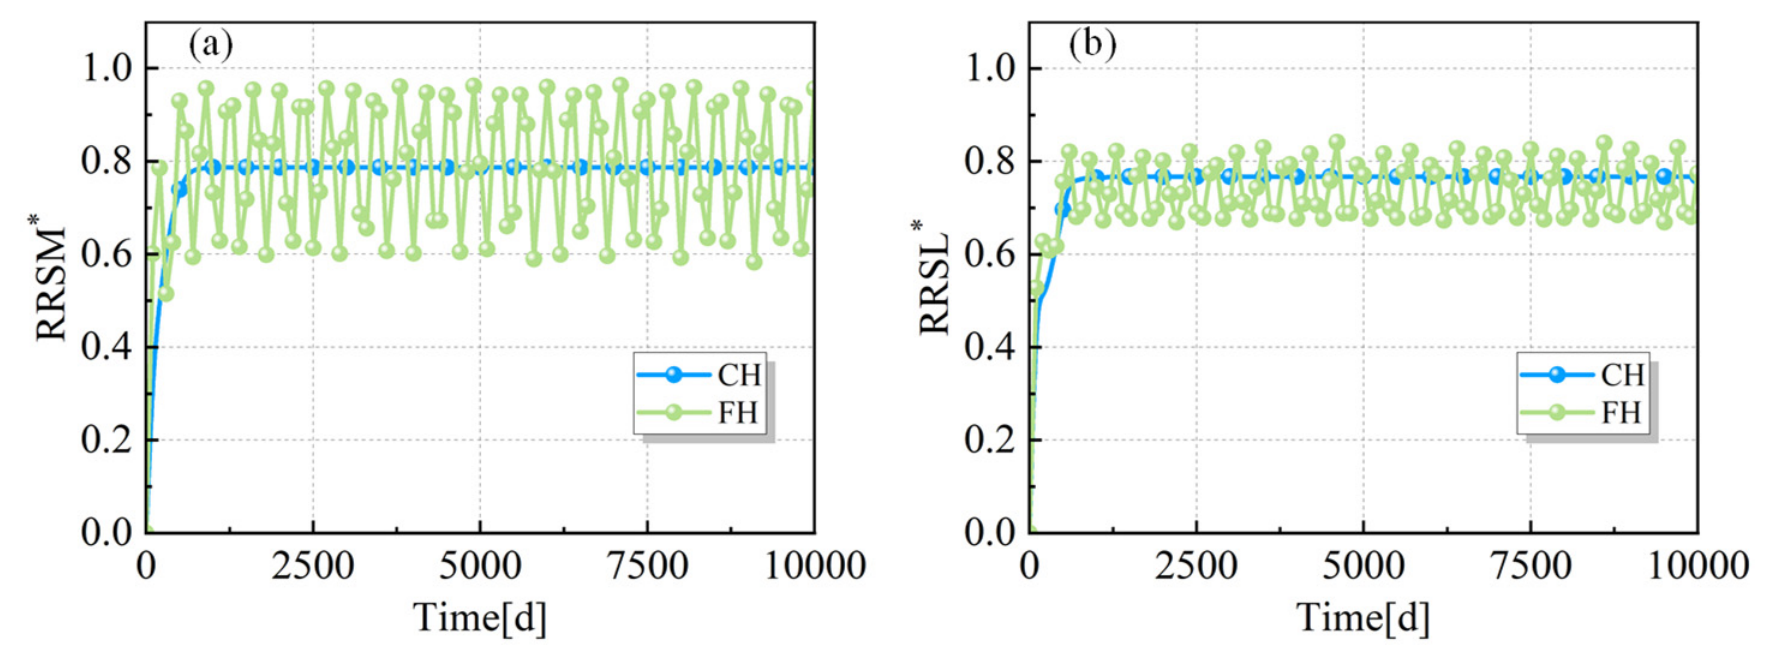
Under the combined influence of groundwater level fluctuations and the physical barrier of the cut-off wall, the morphology of the saltwater wedge exhibits significant dynamic variations. As illustrated in Figure 8, during the high inland groundwater stage (t = 1400 d), the residual salt mass sequestered behind the wall is 3213.56 kg, with a saltwater toe length of 82.2 m (corresponding to an RRSM* of 61.61% and an RRSL* of 69.22%). Subsequently, as the inland groundwater level recedes to the low stage (t = 2000 d), the total salt mass behind the wall decreases to 411.19 kg, and the saltwater toe length contracts to 70.8 m (with an RRSM* of 95.11% and an RRSL* of 80.11%, respectively).
Figure 8.
RRSM* (a) and RRSL* (b) changes with time under CH and FH scenarios.
However, the residual salt has not been completely flushed out, even as the inland groundwater has recovered to a higher stage. Consequently, to effectively prevent seawater intrusion exacerbated by seasonal groundwater fluctuations, a taller cut-off wall is required. As demonstrated in the preceding analysis, the time scales and efficacy of residual saltwater desalination behind the cut-off wall are significantly modulated by the hydraulic conductivity anisotropy of the aquifer.
A critical subsequent question arises: how do seasonal groundwater fluctuations at the inland boundary influence this established dynamic? By systematically varying the hydraulic conductivity anisotropy under conditions of seasonal inland groundwater fluctuations, the spatial distribution characteristics and the temporal desalination dynamics (encompassing both time scales and overall efficacy) of the sequestered residual saltwater can be explicitly determined. The corresponding simulation results are presented in Figure 9.
Figure 9.
The distribution of saltwater affected by the hydraulic conductivity anisotropy and seasonal groundwater fluctuations. (a1–a4) corresponds to rk = 0.02, (b1–b4) corresponds to rk = 0.1, (c1–c4) corresponds to rk = 10, (d1–d4) corresponds to rk = 50. Columns represent four characteristic stages of seasonal groundwaterfluctuation: t = 300 d (high water level), t = 600 d (low water level), t = 2500 d (high waterlevel), and t = 3100 d (low water level).
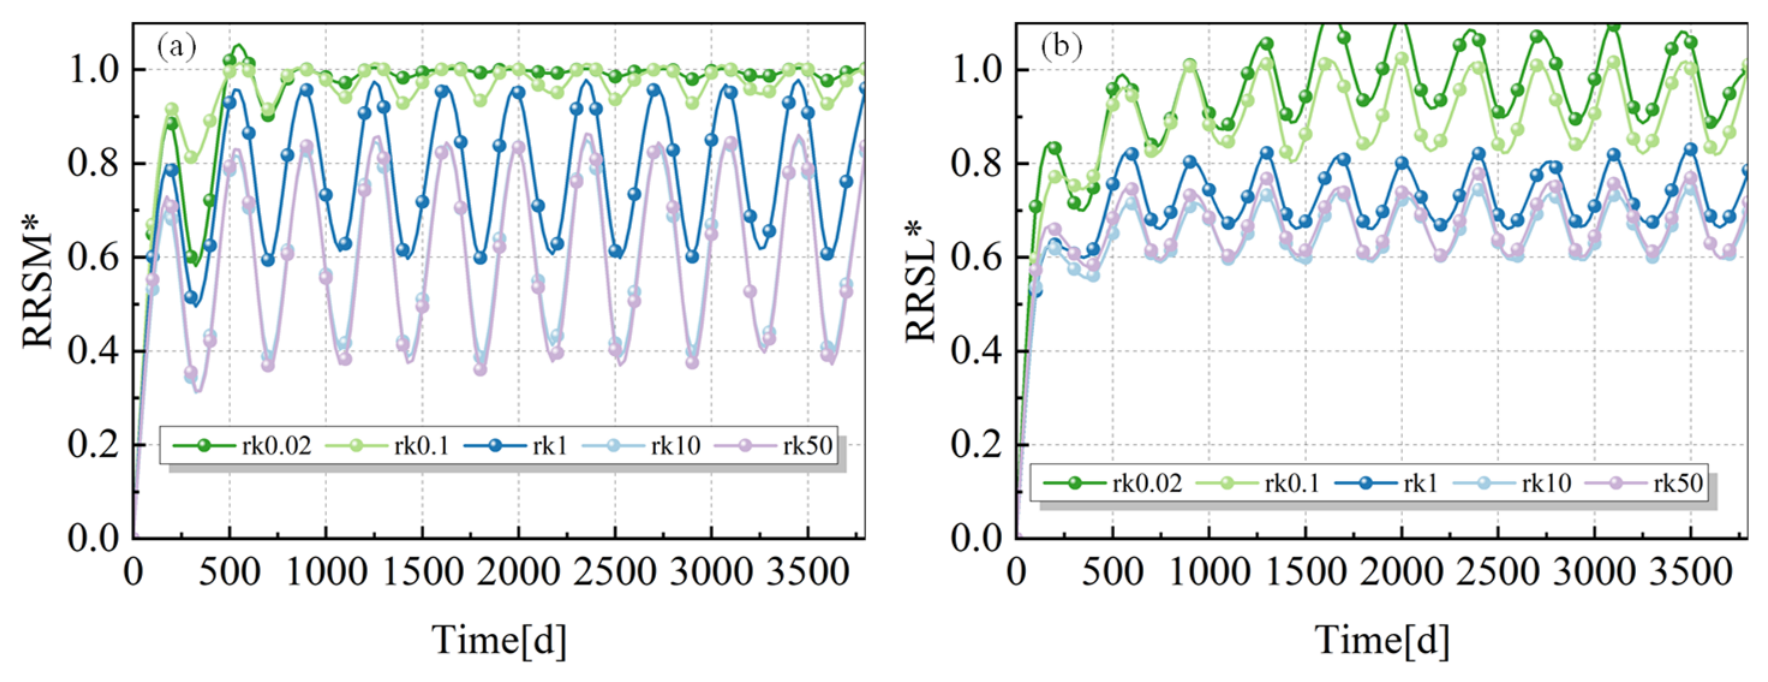
Figure 10 illustrates the temporal evolution of the Relative Reduction of Residual Salt Mass (RRSM*) and the Relative Reduction of Residual Saltwater Length (RRSL*) under seasonal groundwater fluctuations across various hydraulic conductivity anisotropy ratios (rk). All scenarios experience a rapid initial flushing phase during the early simulation period (approximately the first 500 days), characterized by a steep ascent in both RRSM* and RRSL*. Subsequently, the system transitions into a dynamic steady-state driven by seasonal water level variations, with both metric curves exhibiting regular, sinusoidal periodic fluctuations.
Figure 10.
RRSM* (a) and RRSL* (b) changes with time in various rk situations under FH scenarios.
The data clearly demonstrate that lower rk values (e.g., 0.02 and 0.1, represented by the dark blue and teal lines) correspond to the highest desalination efficiency, with the peaks of their RRSM* and RRSL* consistently maintained at high levels (approaching or reaching 1.0). Conversely, as rk increases to 1 and beyond (yellow, orange, and red lines), the overall baselines of both curves shift downward significantly. Notably, at rk = 50, the average RRSM* fluctuates around merely 0.6, indicating that strong vertical permeability severely hinders the complete eradication of residual salts. It is noteworthy that the oscillation amplitudes under high rk scenarios are markedly larger than those under low rk conditions. This visually corroborates the previous deduction: when vertical hydraulic conductivity dominates, the cut-off wall is prone to functional instability. This allows saltwater to “overtop” the barrier more easily during low-water stages, triggering severe secondary intrusion and resulting in violent fluctuations in desalination efficiency.
4. Discussion
4.1. Implications for Coastal Aquifer Management
Determining effective hydraulic head management strategies has been widely recognized as an effective approach for preventing seawater intrusion and facilitating the flushing of residual saltwater [18]. However, these barrier metrics are not static parameters; they are highly sensitive to both intrinsic hydrogeological conditions and external environmental forcings. For instance, Lu et al. [29] demonstrated that hydraulic conductivity anisotropy and stratification significantly alter the mixing zone and saltwater distribution, while Werner and Simmons [30] identified dynamic aquifer boundary conditions as another critical governing factor. Building upon these insights into the internal and external environments affecting cut-off wall design, the present study systematically investigates the combined effects of coastal aquifer properties (hydraulic conductivity and its anisotropy, rk) and dynamic boundary conditions (seasonal groundwater fluctuations) on seawater intrusion and residual saltwater desalination behind cut-off walls. Currently, persistent climate change and intensive human activities are profoundly altering coastal groundwater cycling and ambient geological environments [31]. Climate change directly impacts groundwater resources by modulating precipitation, evapotranspiration, recharge rates, and pumping demands [32]. This macro-scale trend fundamentally aligns with the scenarios of inland groundwater level fluctuations modeled in this study. Furthermore, large-scale offshore engineering activities—encompassing sand mining, channel dredging, offshore wind farm construction, and land reclamation—can significantly restructure the native aquifer-aquitard systems [33]. These structural modifications introduce anthropogenic heterogeneity, such as artificial stratification [34]. During land reclamation, reclaimed soils with limited hydraulic conductivity can impede groundwater discharge at the aquifer–ocean interface, thereby entirely disrupting groundwater flow paths and solute transport regimes [35]. These external environmental shifts, coupled with the alteration of native aquifer properties, imply that existing cut-off walls—designed under historical conditions—may ultimately fail to fully repel seawater intrusion or flush out residual salts, potentially trapping saltwater within the aquifer permanently. Therefore, it is of paramount importance to account for the ongoing impacts of climate change and offshore engineering perturbations when evaluating the long-term resilience and functional efficacy of coastal aquifers equipped with pre-existing cut-off walls.
4.2. Limitations
Determining the Modified Equivalent Freshwater Head (MEDH) has been widely recognized as an effective strategy for preventing seawater intrusion, while the construction of physical cut-off walls significantly facilitates the flushing of residual saltwater [36]. Under continuous groundwater flushing, the residual saltwater undergoes a natural desalination process; to quantitatively evaluate the temporal efficacy of this process, relative reduction metrics such as RRSM and RRSL have proven to be highly effective tools. The MEDH is not a static constant; it is strongly governed by both internal and external environmental factors [37]. For instance, Lv et al. [38] demonstrated that hydraulic conductivity anisotropy significantly alters the MEDH, while Heiss et al. [39] identified dynamic boundary conditions as another critical governing factor.
The findings of this study offer critical practical implications for coastal cut-off wall engineering. In regions with stable groundwater levels, wall design should focus on the vertical geological characteristics of the aquifer, whereas in regions with severe groundwater fluctuations, a rigorous evaluation of anisotropy is imperative to accurately establish the MEDH and adjust the construction height of the barrier accordingly. Currently, persistent climate change and intensive human activities are profoundly altering coastal groundwater cycling patterns and ambient geological environments [40]. In particular, large-scale offshore engineering and land reclamation significantly alter the native structure of aquifer systems and introduce anthropogenic heterogeneity [41]. For example, low-permeability reclaimed soils can severely impede groundwater discharge to the ocean, thereby fundamentally disrupting coastal groundwater flow paths and solute transport trajectories [42].
Although this study provides important insights into the desalination dynamics behind cut-off walls, the model retains certain limitations: inland water levels were simplified as triangular fluctuations, and the impacts of tidal pumping and sea-level rise were omitted. Tidal forcing is a core mechanism governing nearshore freshwater–saltwater mixing and the spatial distribution of the saltwater wedge [43]. Neglecting these dynamic ocean-side boundaries may introduce evaluation biases when quantifying the residual salt mass. Therefore, future research must be dedicated to developing 3D models of real-world coastal aquifers that incorporate complex spatial heterogeneity. Only by deeply integrating compounding stressors—such as climate change, sea-level rise, and anthropogenic engineering interventions—can we more accurately and robustly manage the long-term clearance of residual saltwater in vulnerable coastal systems [44].
5. Conclusions
This study elucidates the impacts of hydraulic conductivity anisotropy on the desalination of residual saltwater behind cut-off walls under conditions of seasonal groundwater fluctuations. A numerical modeling approach was employed to quantitatively evaluate the in situ desalination dynamics of the sequestered residual saltwater. The results reveal that seasonal variations in groundwater levels, coupled with hydraulic conductivity anisotropy, not only dictate the critical effective height of the cut-off wall but also significantly govern the flushing and dilution efficiency of the residual saltwater. These insights are of paramount importance for the robust design and adaptive management of subsurface engineering in coastal aquifers subjected to the compounded impacts of climate change and anthropogenic activities. The principal findings of this study are summarized as follows:
- (1)
- The installation of the barrier substantially attenuates the direct influence of the inland hydraulic gradient, rendering continuous groundwater flushing the dominant driving mechanism for residual saltwater desalination. Quantitative assessments indicate that the Relative Reduction of Residual Salt Mass (RRSM*) exhibits a higher response efficiency during the initial flushing phase, whereas the Relative Reduction of Residual Saltwater Length (RRSL*) undergoes a more pronounced and rapid retreat during the later stages.
- (2)
- Under constant boundary conditions, rk is inversely correlated with the final steady-state desalination efficiency. Although lower rk values (e.g., 0.02, 0.1) necessitate a longer duration to achieve a steady state, they yield the most exhaustive desalination outcomes (with RRSM* and RRSL* peaks approaching or surpassing 1.0). Conversely, higher rk values (indicative of enhanced vertical permeability) severely suppress the maximum attainable desalination efficiency, resulting in a substantial mass of residual salt being perpetually sequestered within the aquifer.
- (3)
- Driven by fluctuating hydraulic heads, the desalination trajectory transitions into a quasi-steady-state oscillatory phase—governed by seasonal forcing—following an initial rapid flushing period. Crucially, residual salts cannot be completely eradicated even during high-stage periods of groundwater recovery. This underscores that under highly dynamic external boundary conditions, the conventional height of cut-off walls may be inadequate, necessitating taller barrier designs to effectively mitigate the exacerbation of seawater intrusion.
- (4)
- Under fluctuating conditions, elevated rk values not only substantially depress the overall baseline of desalination efficiency but also induce violent, large-amplitude oscillations in the process. These severe oscillations expose a critical failure mechanism: intensified vertical flow dynamics allow saltwater to easily “overtop” the barrier during low inland groundwater stages. This triggers severe secondary seawater intrusion, thereby profoundly compromising the defensive and remedial capabilities of coastal groundwater engineering infrastructures.
Author Contributions
J.Z.: Supervision, Methodology, Conceptualization, and Writing—review and editing. X.L.: Writing, Methodology, Data curation, and Software. All authors have read and agreed to the published version of the manuscript.
Funding
The research work was supported by the National Natural Science Foundation of China (Grant No. 52578414), the Shandong Natural Science Foundation (Three Gorges Innovation Development Joint Fund (No. ZR2025MS687)), and Qingdao Natural Science Foundation (No. 25-1-1-181-zyyd-jch). The research work is also supported by the “Elite Program” of Qingdao No. 2 Middle School of Shandong Province.
Data Availability Statement
Data will be made available upon request.
Acknowledgments
Declarations of generative AI and AI-assisted technologies in the writing process. During the preparation of this work, the authors used ChatGPT (5.4) for language refinement. After using this tool, the authors reviewed and edited the content as needed and take full responsibility for the content of the publication.
Conflicts of Interest
The authors declare that they have no known competing financial interests or personal relationships that could have appeared to influence the work reported in this paper.
References
- Polemio, M.; Walraevens, K. Recent Research Results on Groundwater Resources and Saltwater Intrusion in a Changing Environment. Water 2019, 11, 1118. [Google Scholar] [CrossRef] [Scilit]
- Ismail, M.; Pradhanang, S.M.; Boving, T.; Motta, S.; McCarron, B.; Volk, A. Review of Modeling Approaches at the Freshwater and Saltwater interface in Coastal Aquifers. Land 2024, 13, 1332. [Google Scholar] [CrossRef] [Scilit]
- Perdikaki, M.; Chrysanthopoulos, E.; Markantonis, K.; Kallioras, A. Groundwater Flow Model Calibration Using Variable Density Modeling for Coastal Aquifer Management. Hydrology 2024, 11, 59. [Google Scholar] [CrossRef] [Scilit]
- Luyun, R.; Momii, K.; Nakagawa, K. Effects of Recharge Wells and Flow Barriers on Seawater Intrusion. Groundwater 2011, 49, 239–249. [Google Scholar] [CrossRef] [Scilit]
- Mei, J.; Cao, H.; Luo, G.; Pan, H. Analytical Method for Groundwater Seepage through and Beneath a Fully Penetrating Cut-off Wall Considering Effects of Wall Permeability and Thickness. Water 2022, 14, 3982. [Google Scholar] [CrossRef] [Scilit]
- Zheng, T.; Gao, M.; Chang, Q.; Zheng, X.; Walther, M. Dynamic Desalination of Intruding Seawater After Construction of Cut-Off Walls in a Coastal Unconfined Aquifer. Front. Mar. Sci. 2022, 9, 857807. [Google Scholar] [CrossRef] [Scilit]
- Gao, S.B.; Zheng, T.Y.; Zheng, X.L.; Marc, W. Influence of layered heterogeneity on nitrate enrichment induced by cut-off walls in coastal aquifers. J. Hydrol. 2022, 609, 127722. [Google Scholar] [CrossRef] [Scilit]
- Emara, S.R.; Armanuos, A.M.; Zeidan, B.A. Numerical investigation of mixed physical barriers for saltwater removal in coastal heterogeneous aquifers. Environ. Sci. Pollut. Res. 2024, 31, 4826–4847. [Google Scholar]
- Chang, Q.; Gao, C.; Zheng, X.; Lin, Y.; Song, X. A novel subsurface adjustable dam for preventing active seawater intrusion in coastal aquifers. Front. Mar. Sci. 2024, 11, 1412052. [Google Scholar] [CrossRef] [Scilit]
- Zhao, S.; Su, X.J.; Zhang, W.B. Numerical simulation of thermal effects on seawater intrusion management by coastal cutoff walls. J. Environ. Manag. 2025, 381, 125262. [Google Scholar] [CrossRef] [Scilit]
- Abdoulhalik, A.; Abdelgawad, A.M.; Ahmed, A.A.; Moutari, S.; Hamill, G. Assessing the protective effect of cutoff walls on groundwater pumping against saltwater upconing in coastal aquifers. J. Environ. Manag. 2022, 323, 116200. [Google Scholar] [CrossRef] [Scilit]
- Sun, Q.M.; Gao, M.S.; Hou, G.H.; Liu, Z.L.; Liu, X.G.; Ren, R. Response of hydrodynamics and hydrochemistry at multiple-water quality interfaces to extreme rainfall on a muddy coast. J. Clean. Prod. 2025, 513, 145746. [Google Scholar] [CrossRef] [Scilit]
- Li, H.J.; Zhang, Y.W.; Dong, J.B.; Liu, H.T.; Pang, Y.X. Risk assessment of seawater intrusion disaster based on FDAHP-EWM method in coastal region of Jinzhou City, China. Hum. Ecol. Risk Assess. 2025, 31, 391–411. [Google Scholar] [CrossRef] [Scilit]
- Bosserelle, A.L.; Morgan, L.K. Transience of Coastal Water Table Rise in Response to Sea-Level Rise. Groundwater 2025, 63, 551–569. [Google Scholar]
- Seibert, S.L.; Greskowiak, J.; Oude Essink, G.H.P.; Massmann, G. Understanding Climate Change and Anthropogenic Impacts on the Salinization of Low-Lying Coastal Groundwater Systems. Earths Future 2024, 12, e2024EF004737. [Google Scholar]
- Guo, Q.N.; Liu, J.H.; Zhu, X.F.; Dai, Y.F. Groundwater level fluctuation caused by tide and groundwater pumping in coastal multi-layer aquifer system. Front. Mar. Sci. 2024, 11, 1382206. [Google Scholar] [CrossRef] [Scilit]
- Jiménez-Valera, J.A.; Alhama, I.; Trigueros, E. Quantification of Groundwater Vertical Flow from Temperature Profiles: Application to Agua Amarga Coastal Aquifer (SE Spain) Submitted to Artificial Recharge. Water 2023, 15, 1093. [Google Scholar] [CrossRef] [Scilit]
- Kaleris, V.K.; Ziogas, A.I. The effect of cutoff walls on saltwater intrusion and groundwater extraction in coastal aquifers. J. Hydrol. 2013, 476, 370–383. [Google Scholar] [CrossRef] [Scilit]
- Wu, H.Q.; Lu, C.H.; Kong, J.; Werner, A.D. Preventing Seawater Intrusion and Enhancing Safe Extraction Using Finite-Length, Impermeable Subsurface Barriers: 3D Analysis. Water Resour. Res. 2020, 56, e2020WR027792. [Google Scholar]
- Yin, J.N.; Wang, N.; Lu, C.H.; Tsai, F.T.C.; Chen, H.W. Fast desalinization of residual saltwater using subsurface dams combined with saltwater discharge or freshwater recharge. J. Hydrol. 2023, 619, 129282. [Google Scholar] [CrossRef] [Scilit]
- Chang, Q.P.; Zheng, T.; Zheng, X.; Zhang, B.; Sun, Q.; Walther, M. Effect of subsurface dams on saltwater intrusion and fresh groundwater discharge. J. Hydrol. 2019, 576, 508–519. [Google Scholar] [CrossRef] [Scilit]
- Takahashi, M.; Nakagawa, K.; Momii, K. Fresh and Saltwater Movement After Installation of Cut-Off Wall in Confined Aquifer. J. Jpn. Soc. Civ. Eng. Ser. B1 (Hydraul. Eng.) 2012, 67, I_601–I_606. [Google Scholar]
- Qu, W.J.; Li, H.L.; Wan, L.; Wang, X.S.; Jiang, X.W. Numerical simulations of steady-state salinity distribution and submarine groundwater discharges in homogeneous anisotropic coastal aquifers. Adv. Water Resour. 2014, 74, 318–328. [Google Scholar] [CrossRef] [Scilit]
- Wu, H.Q.; Lu, C.H. Seasonal fluctuations in the groundwater level accelerate the removal of residual saltwater upstream of subsurface dams. J. Hydrol. 2023, 625, 130026. [Google Scholar] [CrossRef] [Scilit]
- Yang, F.; Sun, H.; Zhi, C.S.; Wu, G.W.; Dong, Y.L.; Hu, B.X. Characterizing residual saltwater desalination behind subsurface dams influenced by seasonal groundwater fluctuations and hydraulic conductivity anisotropy in the coastal aquifers. Phys. Fluids 2025, 37, 056622. [Google Scholar] [CrossRef] [Scilit]
- Luyun, R.; Momii, K.; Nakagawa, K. Laboratory-scale saltwater behavior due to subsurface cutoff wall. J. Hydrol. 2009, 377, 227–236. [Google Scholar] [CrossRef] [Scilit]
- Zheng, T.Y.; Zheng, X.L.; Chang, Q.P.; Zhan, H.B.; Walther, M. Timescale and Effectiveness of Residual Saltwater Desalinization Behind Subsurface Dams in an Unconfined Aquifer. Water Resour. Res. 2021, 57, e2020WR028493. [Google Scholar] [CrossRef] [Scilit]
- Chang, Q.P.; Zheng, T.Y.; Chen, Y.Y.; Zheng, X.L.; Walther, M. Investigation of the elevation of saltwater wedge due to subsurface dams. Hydrol. Process. 2020, 34, 4251–4261. [Google Scholar] [CrossRef] [Scilit]
- Lu, C.H.; Chen, Y.M.; Zhang, C.; Luo, J. Steady-state freshwater-seawater mixing zone in stratified coastal aquifers. J. Hydrol. 2013, 505, 24–34. [Google Scholar]
- Werner, A.D.; Simmons, C.T. Impact of Sea-Level Rise on Sea Water Intrusion in Coastal Aquifers. Groundwater 2009, 47, 197–204. [Google Scholar]
- Taylor, R.G.; Scanlon, B.; Doll, P.; Rodell, M.; van Beek, R.; Wada, Y.; Longuevergne, L.; Leblanc, M.; Famiglietti, J.S.; Edmunds, M.; et al. Ground water and climate change. Nat. Clim. Change 2013, 3, 322–329. [Google Scholar]
- Jasechko, S.; Seybold, H.; Perrone, D.; Fan, Y.; Shamsudduha, M.; Taylor, R.G.; Fallatah, O.; Kirchner, J.W. Rapid groundwater decline and some cases of recovery in aquifers globally. Nature 2024, 625, 715–721. [Google Scholar] [CrossRef] [Scilit] [PubMed]
- Yang, M.Z.; Tang, G.P.; Jiang, T.; Chen, T.; Chen, X.H. The regular pattern and underlying mechanisms of seawater intrusion in the Modaomen channel in the Pearl River Estuary of China. Environ. Sci. Pollut. Res. 2021, 28, 60818–60832. [Google Scholar] [CrossRef] [Scilit]
- Luo, M.H.; Li, H.L.; Xiao, K.; Qu, W.J.; Mao, R. Groundwater and Salinity Responses to Land Reclamation in Jiaozhou Bay (China): Field Observations and Modeling. Water Resour. Res. 2025, 61, e2025WR039936. [Google Scholar] [CrossRef] [Scilit]
- Guo, H.P.; Jiao, J.J. Impact of coastal land reclamation on ground water level and the sea water interface. Groundwater 2007, 45, 362–367. [Google Scholar] [CrossRef] [Scilit]
- Roy, D.K.; Datta, B. Saltwater intrusion processes in coastal aquifers–modelling and management: A review. Desalination Water Treat. 2017, 78, 57–89. [Google Scholar]
- Olorunsaye, O.; Heiss, J.W. Stability of Saltwater-Freshwater Mixing Zones in Beach Aquifers with Geologic Heterogeneity. Water Resour. Res. 2024, 60, e2023WR036056. [Google Scholar]
- Lv, Y.C.; Yang, B.G.; Ai, H.J.; Yang, C.J.; Dong, J.; Kang, R.F.; Xu, W.X.; Yang, P. Effect of Anisotropy on Saline Groundwater Pumping Efficiency for Seawater Intrusion Control. Water 2025, 17, 2359. [Google Scholar] [CrossRef] [Scilit]
- Heiss, J.W.; Mase, B.; Shen, C.J. Effects of Future Increases in Tidal Flooding on Salinity and Groundwater Dynamics in Coastal Aquifers. Water Resour. Res. 2022, 58, e2022WR033195. [Google Scholar] [CrossRef] [Scilit]
- Peng, K.; Heiss, J.W.; Xie, X.J.; Yan, L.; Deng, Y.M.; Gan, Y.Q.; Li, Q.H.; Zhang, Y.P. Groundwater discharge and saltwater-freshwater mixing in a mangrove wetland over tidal cycles: A field and modeling study. J. Hydrol. 2023, 620, 129472. [Google Scholar] [CrossRef] [Scilit]
- Meng, X.Y.; Zheng, T.Y.; Zheng, X.L.; Luo, J. Time Scale of the Formation of Fresh Groundwater Lens on an Atoll Island under the Influence of Land Reclamation. ACS EST Water 2024, 4, 1472–1482. [Google Scholar] [CrossRef] [Scilit]
- Gao, C.C.; Zheng, T.Y.; Chang, Q.P.; Zheng, X.L.; Song, X.; Luo, J. Dynamics of Irregular Freshwater Lenses Evolution in Thin Aquifers of Reclaimed Circular Islands. Water Resour. Res. 2025, 61, e2024WR038880. [Google Scholar] [CrossRef] [Scilit]
- Hingst, M.C.; Housego, R.M.; He, C.; Minsley, B.J.; Ball, L.B.; Michael, H.A. Beyond the Wedge: Impact of Tidal Streams on Salinization of Groundwater in a Coastal Aquifer Stressed by Pumping and Sea-Level Rise. Water Resour. Res. 2024, 60, e2023WR035840. [Google Scholar]
- Stanic, S.; LeRoux, N.K.; Paldor, A.; Mohammed, A.A.; Michael, H.A.; Kurylyk, B.L. Saltwater Intrusion into a Confined Island Aquifer Driven by Erosion, Changing Recharge, Sea-Level Rise, and Coastal Flooding. Water Resour. Res. 2024, 60, e2023WR036394. [Google Scholar]
Disclaimer/Publisher’s Note: The statements, opinions and data contained in all publications are solely those of the individual author(s) and contributor(s) and not of MDPI and/or the editor(s). MDPI and/or the editor(s) disclaim responsibility for any injury to people or property resulting from any ideas, methods, instructions or products referred to in the content. |
© 2026 by the authors. Licensee MDPI, Basel, Switzerland. This article is an open access article distributed under the terms and conditions of the Creative Commons Attribution (CC BY) license.