Article

The Design and Research of a New Cavitation-Jet Blockage-Removal Tool

1
State Key Laboratory of Deep Geothermal Resources, Beijing 102206, China
2
Sinopec (Beijing) New Energy Technology Research Institute Co., Ltd., Beijing 102206, China
3
College of Safety and Ocean Engineering, China University of Petroleum-Beijing, Beijing 102249, China
4
CNPC Engineering Technology R & D Co., Ltd., Beijing 102206, China
*
Author to whom correspondence should be addressed.
Processes 2026, 14(13), 2138; https://doi.org/10.3390/pr14132138
Submission received: 5 June 2026 / Revised: 24 June 2026 / Accepted: 29 June 2026 / Published: 30 June 2026

Abstract

Wellbore plugging has become the primary constraint on gas production for numerous oil, gas, and geothermal wells in China. To enhance productivity in mature wells, a novel straight-swirling integrated jet (SSIJ) deplugging tool was designed, incorporating a converging-diverging jet (CDJ) nozzle. A combined approach of numerical simulation and experiments was employed to optimize the tool structure and evaluate the effects of different operational parameters on its blockage-removal performance. Structural optimization identified an impeller spinning angle of 540° and an impeller thickness of 12 mm as the optimal parameters, which significantly improve the three-dimensional velocity peaks and cavitation generation capability. Compared with the CDJ nozzle, the SSIJ tool produces substantially higher tangential and radial velocity components, with peak tangential and radial velocities reaching 22 m/s and 45 m/s, respectively, under the optimized conditions. The numerical results show that the peak impact pressure reaches 2.7 MPa at a standoff distance of 12 mm, while the optimal standoff distance, considering both impact magnitude and effective coverage area, is determined to be 16 mm (4 times the outlet diameter). Furthermore, indoor validation experiments under a pump pressure of 20 MPa demonstrate that the tool completely removes the artificial scale layer from the tubing inner wall within 2 min of continuous flushing, leaving no visible residue. This study provides a quantitative reference for the design and process optimization of jet blockage-removal tools.

1. Introduction

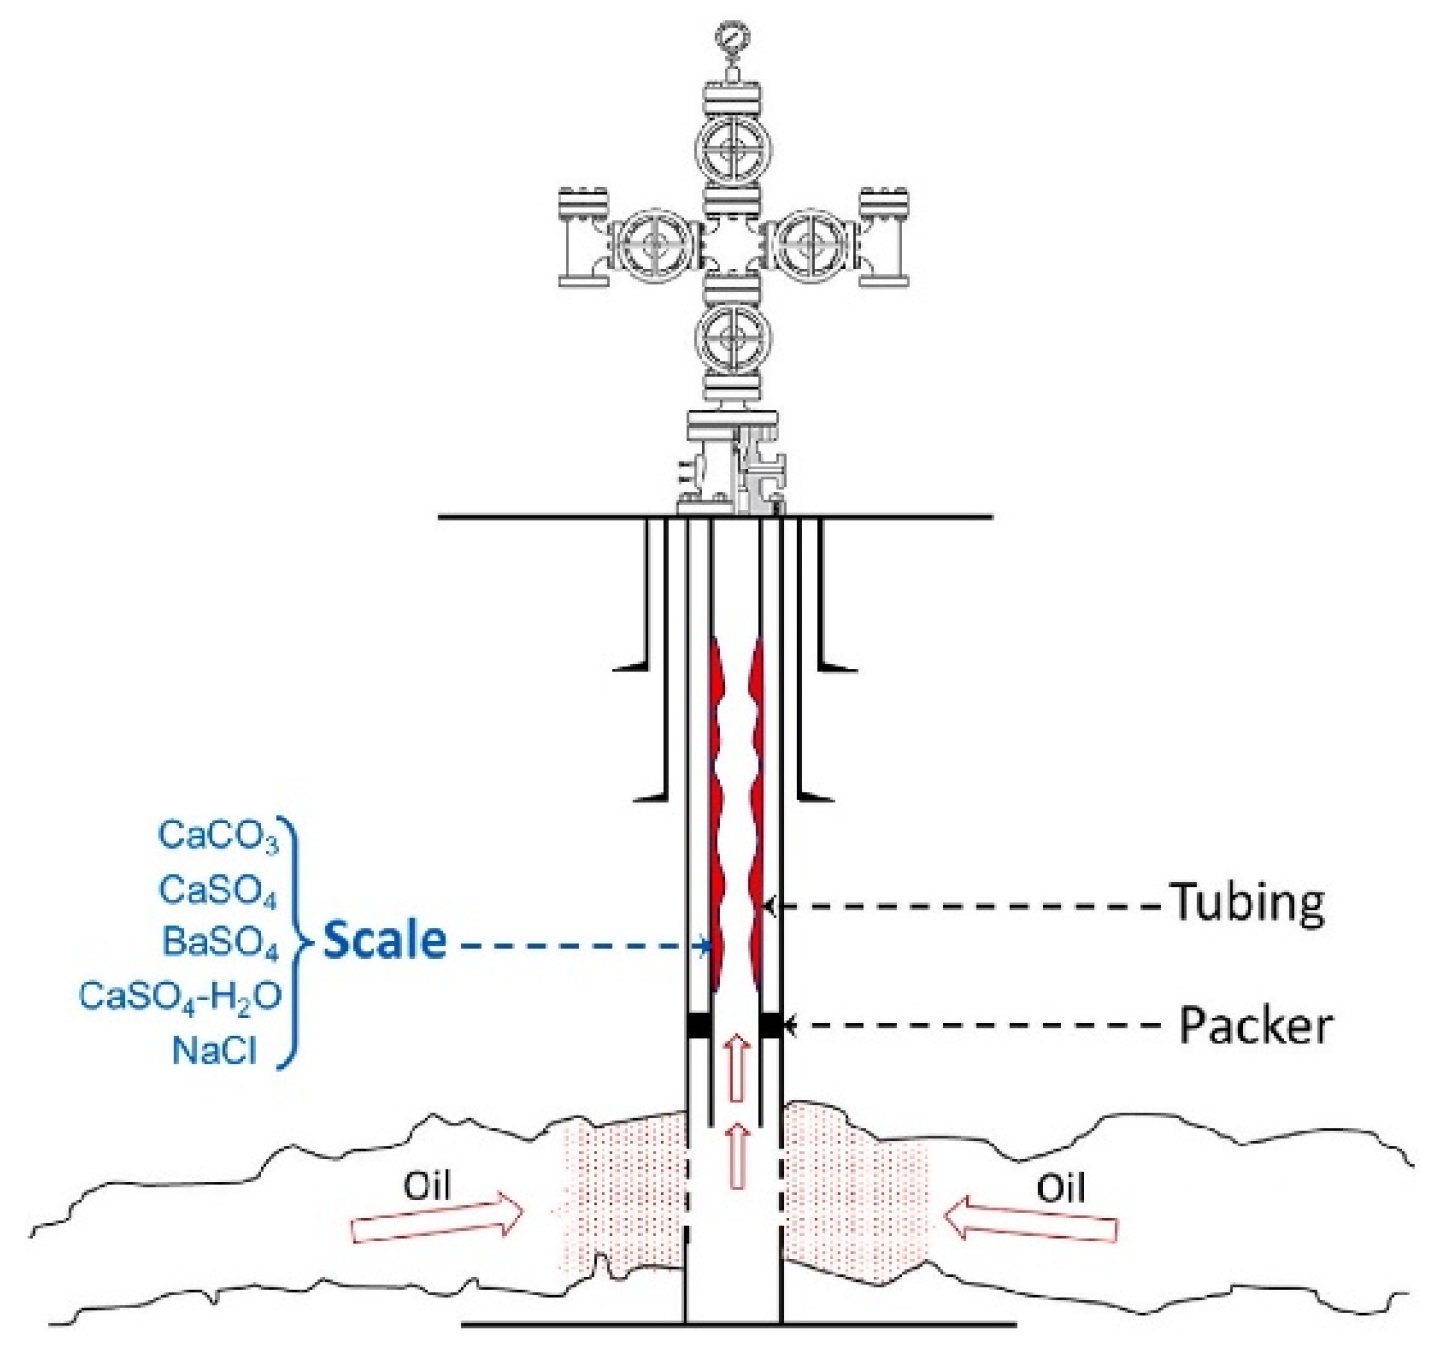
As the global energy landscape continues to evolve, natural gas, as a clean energy source, is emerging as a key component of China’s energy strategy, and natural gas plays an important role in the modern energy system [1]. Over the past two decades, China’s gas industry has rapidly developed, becoming the world’s second-largest gas producer after the United States, with extensive commercial development in the Sichuan Basin [2,3]. However, in the process of gas extraction, as the formation pressure of gas wells decreases, sanding, waxing, and scaling problems persist in wellbores [4]. As shown in Figure 1, hard acid-insoluble scaling forms on the inner surface of the wellbore, reducing the internal diameter. These problems lead to the decline of production capacity or even production stoppage. Therefore, there is an urgent need to design a new type of jet blockage-removal tool applicable to the old oil and gas wells to ensure stable production.
Wellbore unblocking methods can be broadly classified into chemical, mechanical, thermal, electrical or electromagnetic, laser-based, and hydraulic jetting techniques. Acidizing is a commonly used chemical method that removes blockages through dissolution reactions. However, it is generally ineffective for hard, acid-insoluble scale deposits on the inner wall of the wellbore, and may also introduce corrosion risks and environmental concerns during operation. Mechanical removal methods, such as milling, scraping, and drilling-based tools, are widely used for severe blockage conditions. However, they often require workover or tubular retrieval operations, leading to high operational cost and increased operational complexity [5]. Thermal and electromagnetic methods, including steam injection and electromagnetic heating, have also been explored to mitigate or remove deposition-related blockage. However, their effectiveness strongly depends on formation conditions and heat transfer limitations [6]. Laser-based descaling techniques have been investigated as a non-contact high-energy-density approach for scale removal and perforation enhancement, but their application remains largely at the experimental or early-development stage due to cost and operational constraints [7]. Among these methods, high-pressure water jetting is particularly attractive because it is compatible with coiled tubing operations, which are commonly used in gas wells containing high concentrations of hydrogen sulfide and completed with permanently integrated tubular columns [8]. Recent studies have shown that multi-orifice nozzle configurations can significantly improve jet stability and cleaning efficiency in coiled tubing operations [9]. Compared with other physical unblocking technologies that suffer from low efficiency, long operation times, and significant damage to the wellbore tubular column, high-pressure water jetting achieves comprehensive wellbore cleaning through the combined impact and shear effects of the high-pressure jet. Beyond relying solely on the jet’s physical action, it can be combined with targeted well-washing fluids during operations to further enhance effectiveness.
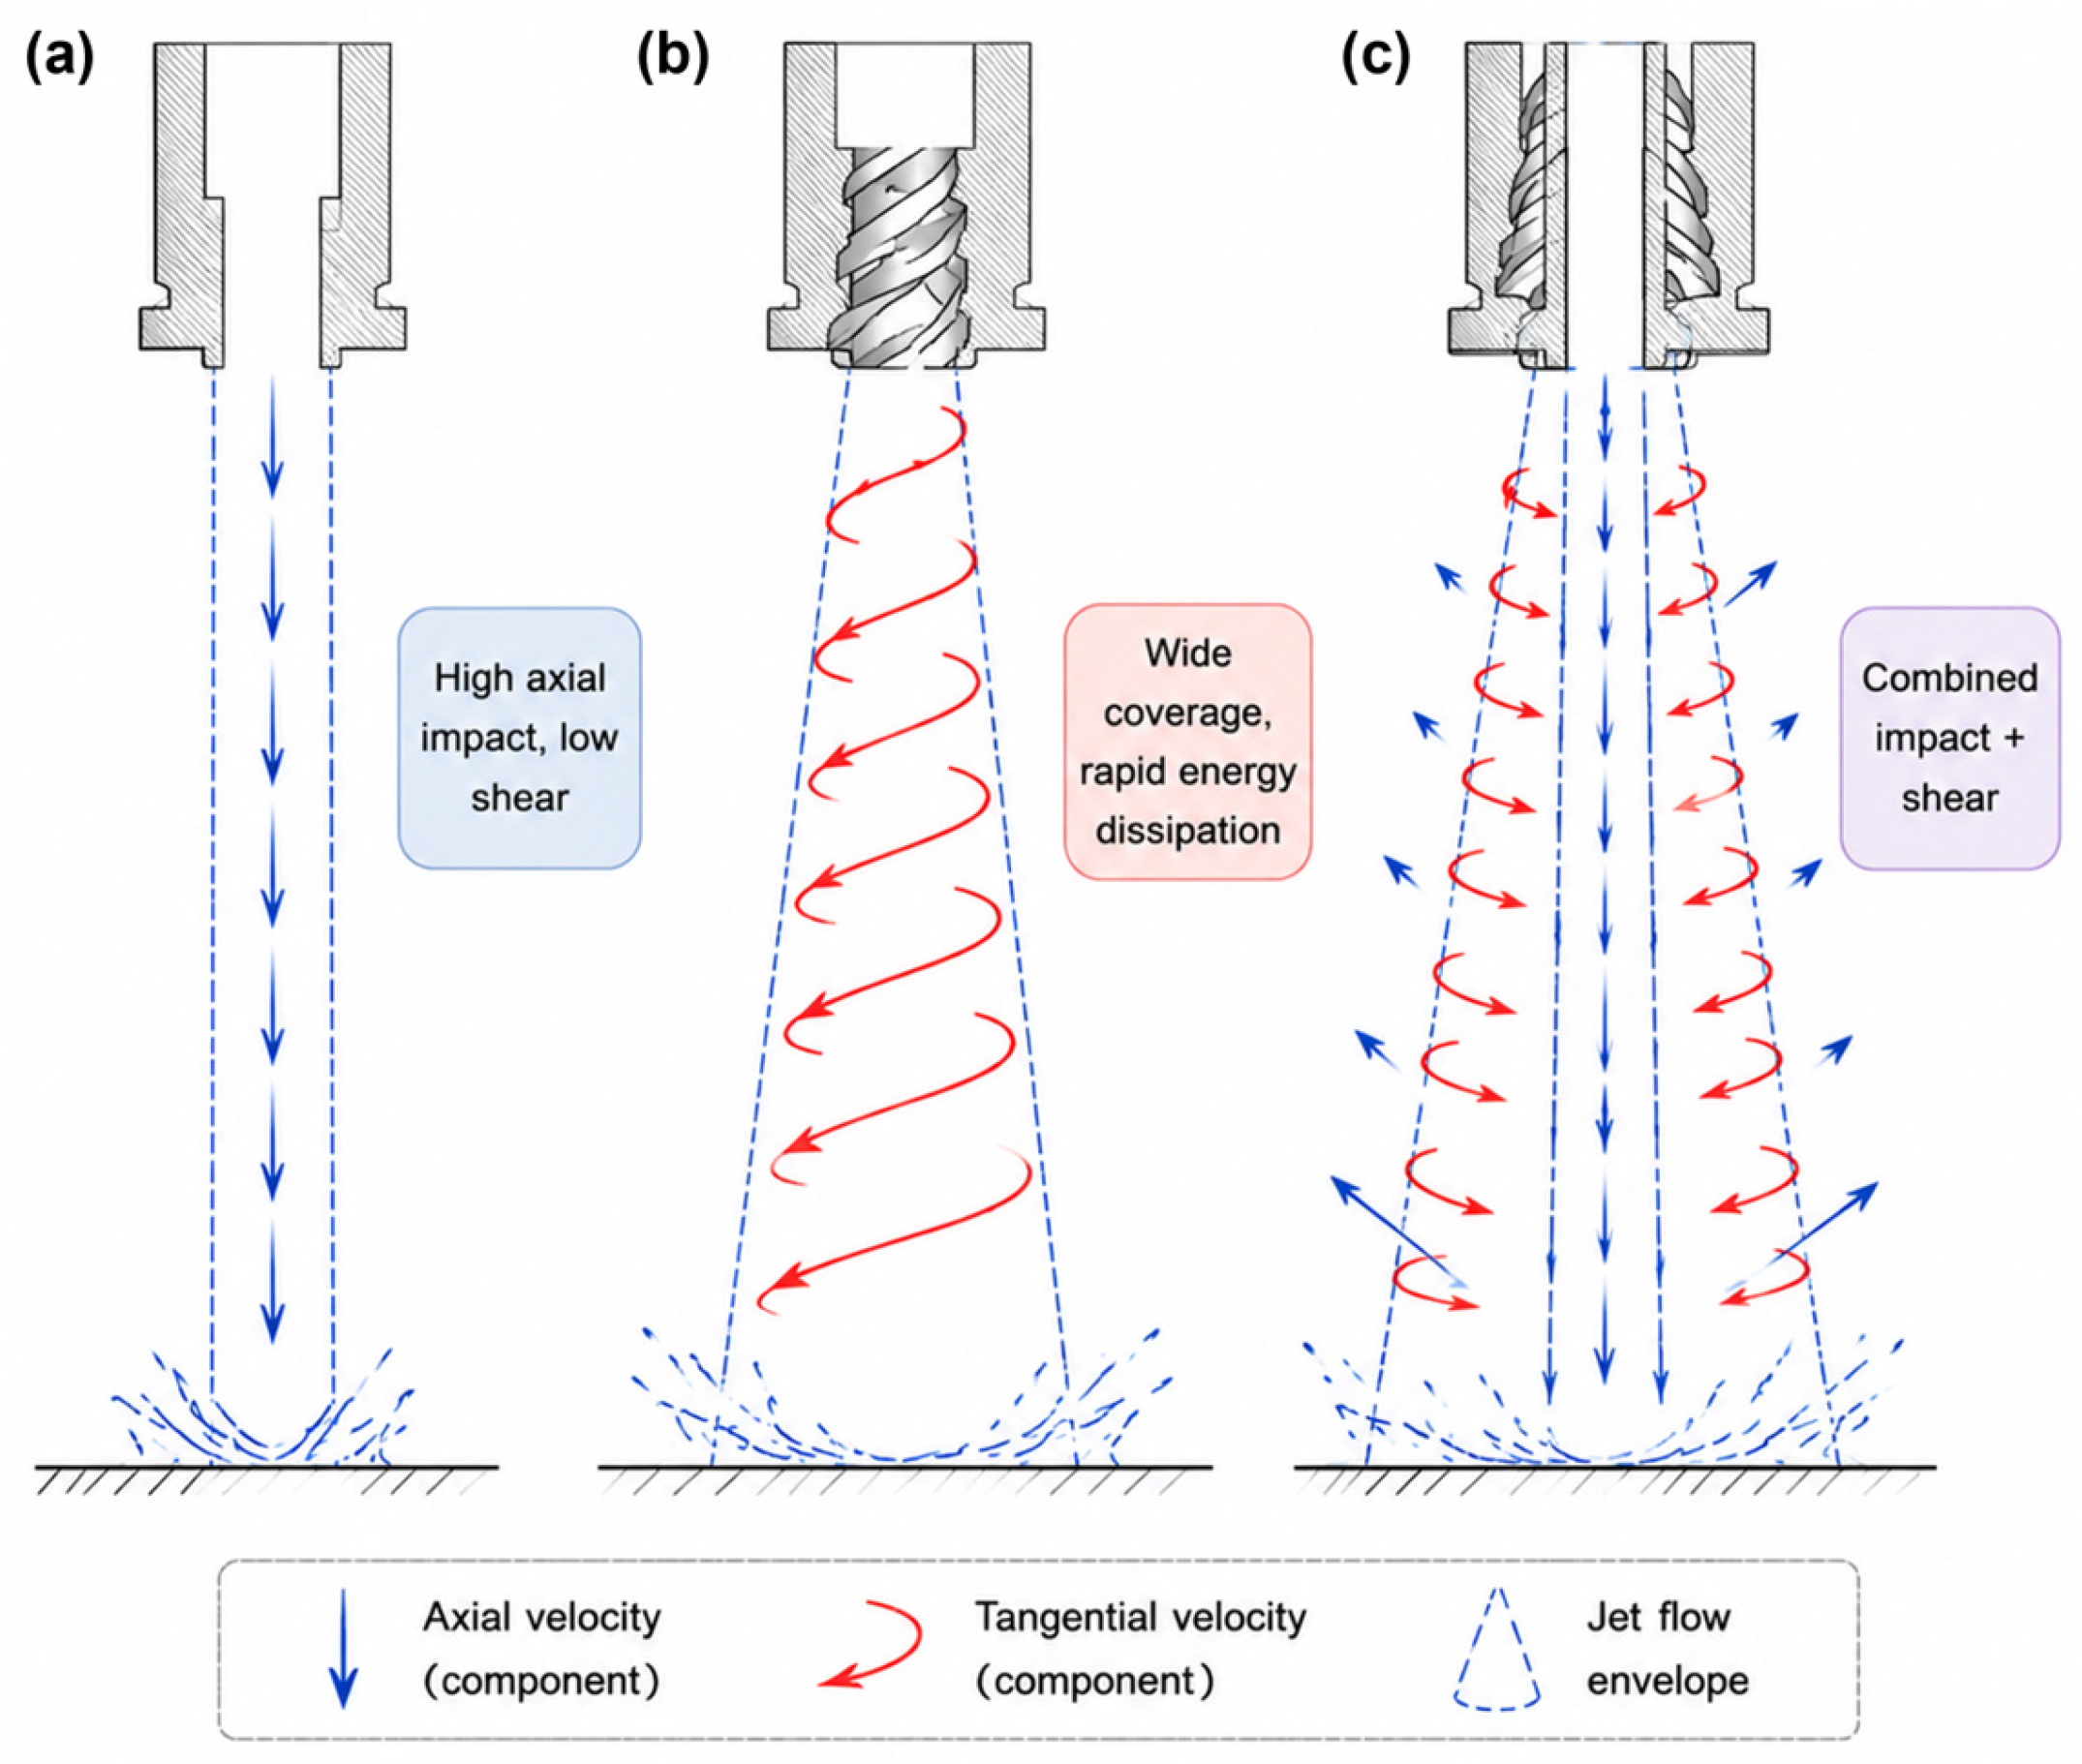
High-pressure water jet technology uses water as the medium, and its working principle involves converting pressurized liquid into mechanical energy through specific nozzles or pressurized equipment, before ejecting it through the nozzle to form a high-speed jet [10]. The structural parameters of the nozzle significantly influence high-pressure water jet performance. Consequently, domestic and international scholars have extensively researched novel nozzle designs, improving jet efficiency by optimizing internal channel structures and outlet geometries [11,12,13]. Based on jet flow field characteristics, existing high-pressure water jets can be broadly classified into three types: straight jets, rotating jets, and direct-rotating hybrid jets [14,15,16]. Different jet types correspond to distinct tool structures and nozzle designs, generating varied jet strengths and impact ranges with respective advantages, limitations, and applicable well conditions [17]. To better illustrate the differences among these three jet types, Figure 2 presents schematic diagrams of their flow patterns and velocity vector distributions. The straight jet produces a concentrated axial impact but lacks circumferential shear; the rotating jet provides a wide coverage area but suffers from rapid pressure decay; and the straight-swirling integrated jet (SSIJ) combines both axial impingement and tangential shearing actions, which is expected to be more effective for removing adhered scale layers.
In recent years, numerous scholars have conducted extensive research on novel nozzle designs to improve water jet performance by optimizing nozzle inner channel structures and outlet geometries [18,19]. Dickinson et al. [14] investigated conical jet bits for cleaning sedimentary scale in injection well tubing without rotation, identifying continuous tubing’s rated pressure and friction as key factors affecting cleaning efficiency. Meanwhile, Li et al. [15] developed a porous nozzle for radial jet drilling and analyzed how structural parameters affect its self-advancing capability. Du et al. [20] examined the external flow field of a straight-swirling integrated jet under non-submerged conditions, mapping hydraulic distributions and key structural parameter relationships. Lee et al. [21] experimentally studied rotating and dual coaxial jets, demonstrating that rotating jets significantly reduce impact pressure fluctuations compared to vortex-free jets. Zhang et al. [22] comparatively evaluated four nozzle structures: cone–straight, rotating, contraction–expansion, and straight-swirling integrated jet for hydrate erosion, establishing the hybrid nozzle’s superior performance. However, most existing unblocking tools are designed for large sizes and are incompatible with coiled tubing operations in small-diameter wells. Previous studies have demonstrated that nozzle configuration significantly influences jet structure and cleaning performance. For conventional straight jet nozzles, the flow is characterized by a highly concentrated axial momentum, which results in strong local impingement but limited radial coverage and rapid decay of effective impact intensity away from the jet centerline [10]. As a result, their cleaning efficiency is constrained to a relatively small effective area, requiring repeated repositioning in practical applications. In contrast, swirling or rotating jets have been widely investigated for improving flow dispersion and enhancing coverage area. However, as reported by Soyama [23], the introduction of swirl motion promotes faster energy dissipation and reduces peak stagnation pressure at the impingement surface, which may weaken their ability to remove strongly adhered deposits such as scale or hardened blockage.
These limitations indicate that neither purely straight nor purely swirling jet configurations can simultaneously achieve high impact intensity and wide-area coverage, highlighting the need for an integrated jet design capable of balancing axial momentum concentration and tangential shear effects. Currently, most existing unblocking tools are designed with large outer diameters, making them incompatible with coiled tubing operations. Therefore, there is an urgent need for a compact, high-efficiency unblocking tool suitable for small-diameter wells [24]. In response, this paper presents the design and numerical and experimental investigation of a new cavitation-jet unblocking tool based on the straight-swirling integrated jet principle [25]. The novelty of this work lies in the integration of swirling flow, cavitation, and axial impingement within a single compact tool designed specifically for coiled tubing operations in small-diameter wells, which distinguishes it from existing designs that typically address only one of these mechanisms. Specifically, unlike conventional rotating tools that suffer from rapid energy dissipation and reduced stagnation pressure, the proposed SSIJ tool maintains high axial impact pressure while generating tangential velocity for shear-induced scale removal, and incorporates a cavitation-enhancing nozzle geometry to compensate for the energy losses typically associated with swirling flows.

2. Materials and Methods

2.1. Tool Design and Field Working Principle

Water jet technology operates by converting the pressure energy of a high-pressure fluid into kinetic energy through a specially designed nozzle, thereby generating a high-velocity jet capable of impacting and eroding target deposits. In downhole descaling operations, the jetting tool is typically deployed by coiled tubing to the target depth. The high-velocity jet removes scale through a combination of impact, shear, and cavitation-enhanced erosion mechanisms. During operation, the injected fluid and detached debris are typically transported back to the surface through the annular space between the coiled tubing and production tubing under continuous fluid circulation. Depending on well conditions and tool configuration, coiled tubing jetting operations are commonly conducted under high-pressure and high-flow-rate conditions. These operational characteristics provide the basis for the numerical simulations and laboratory experiments conducted in this study [26].
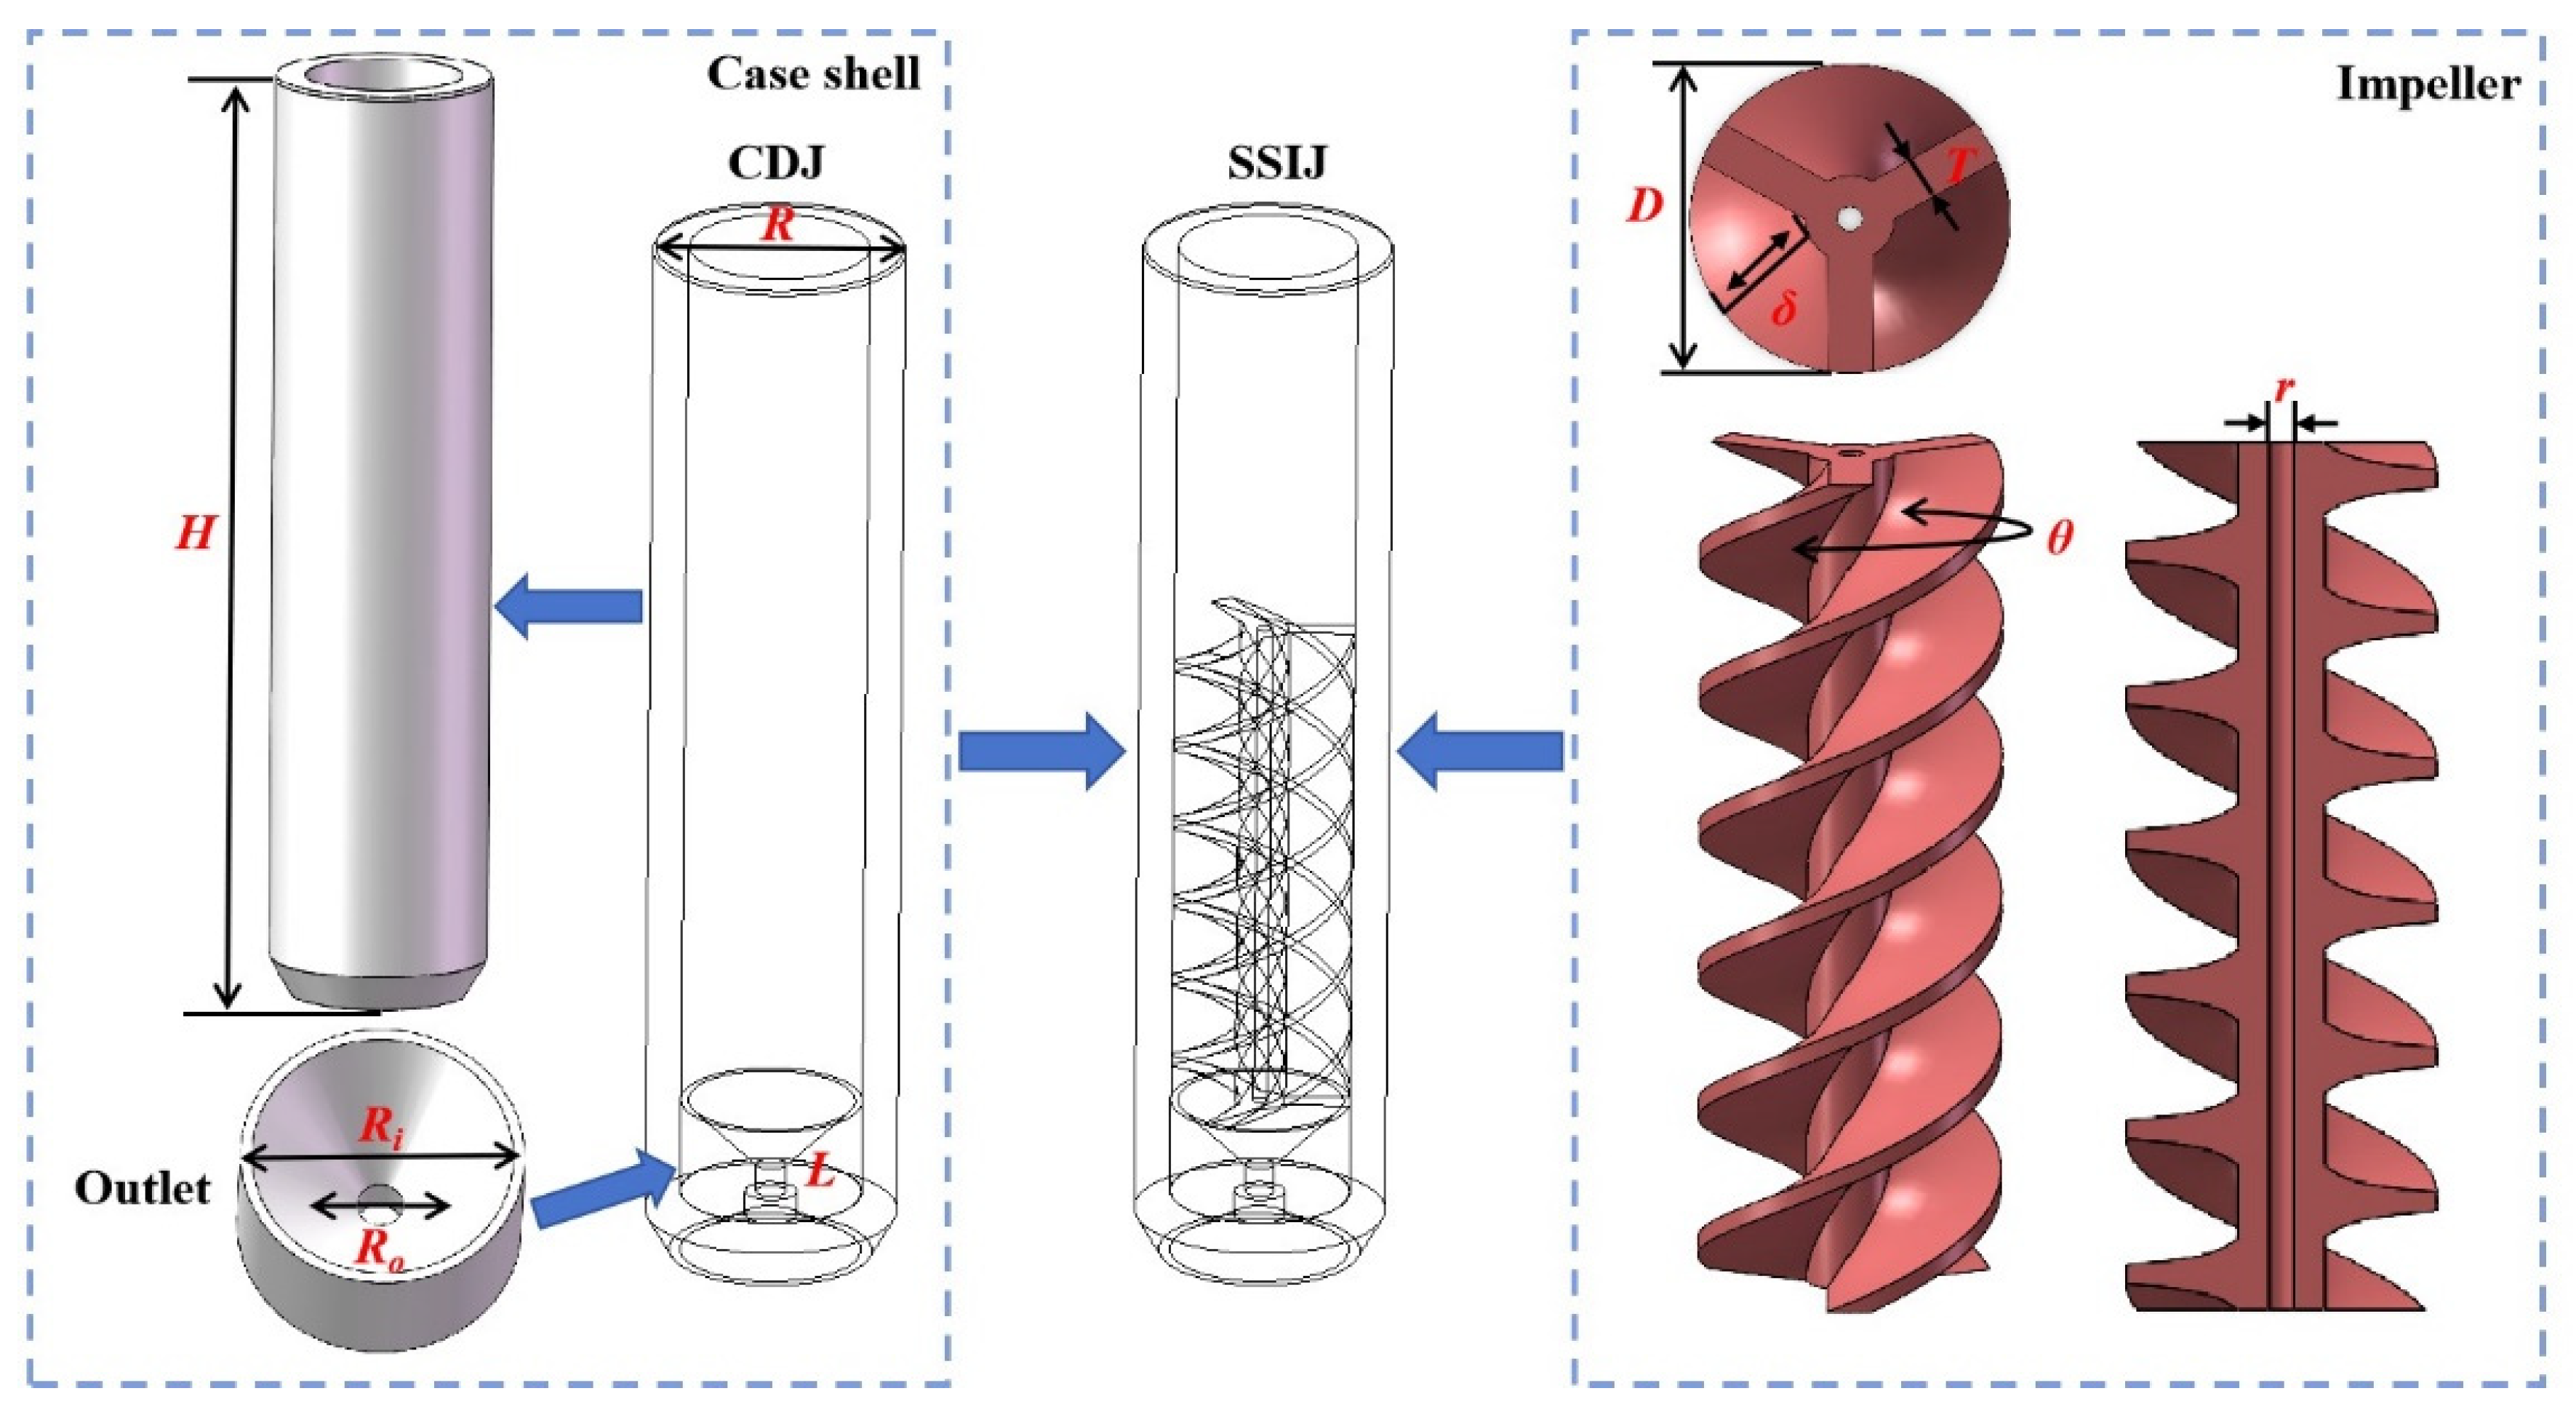
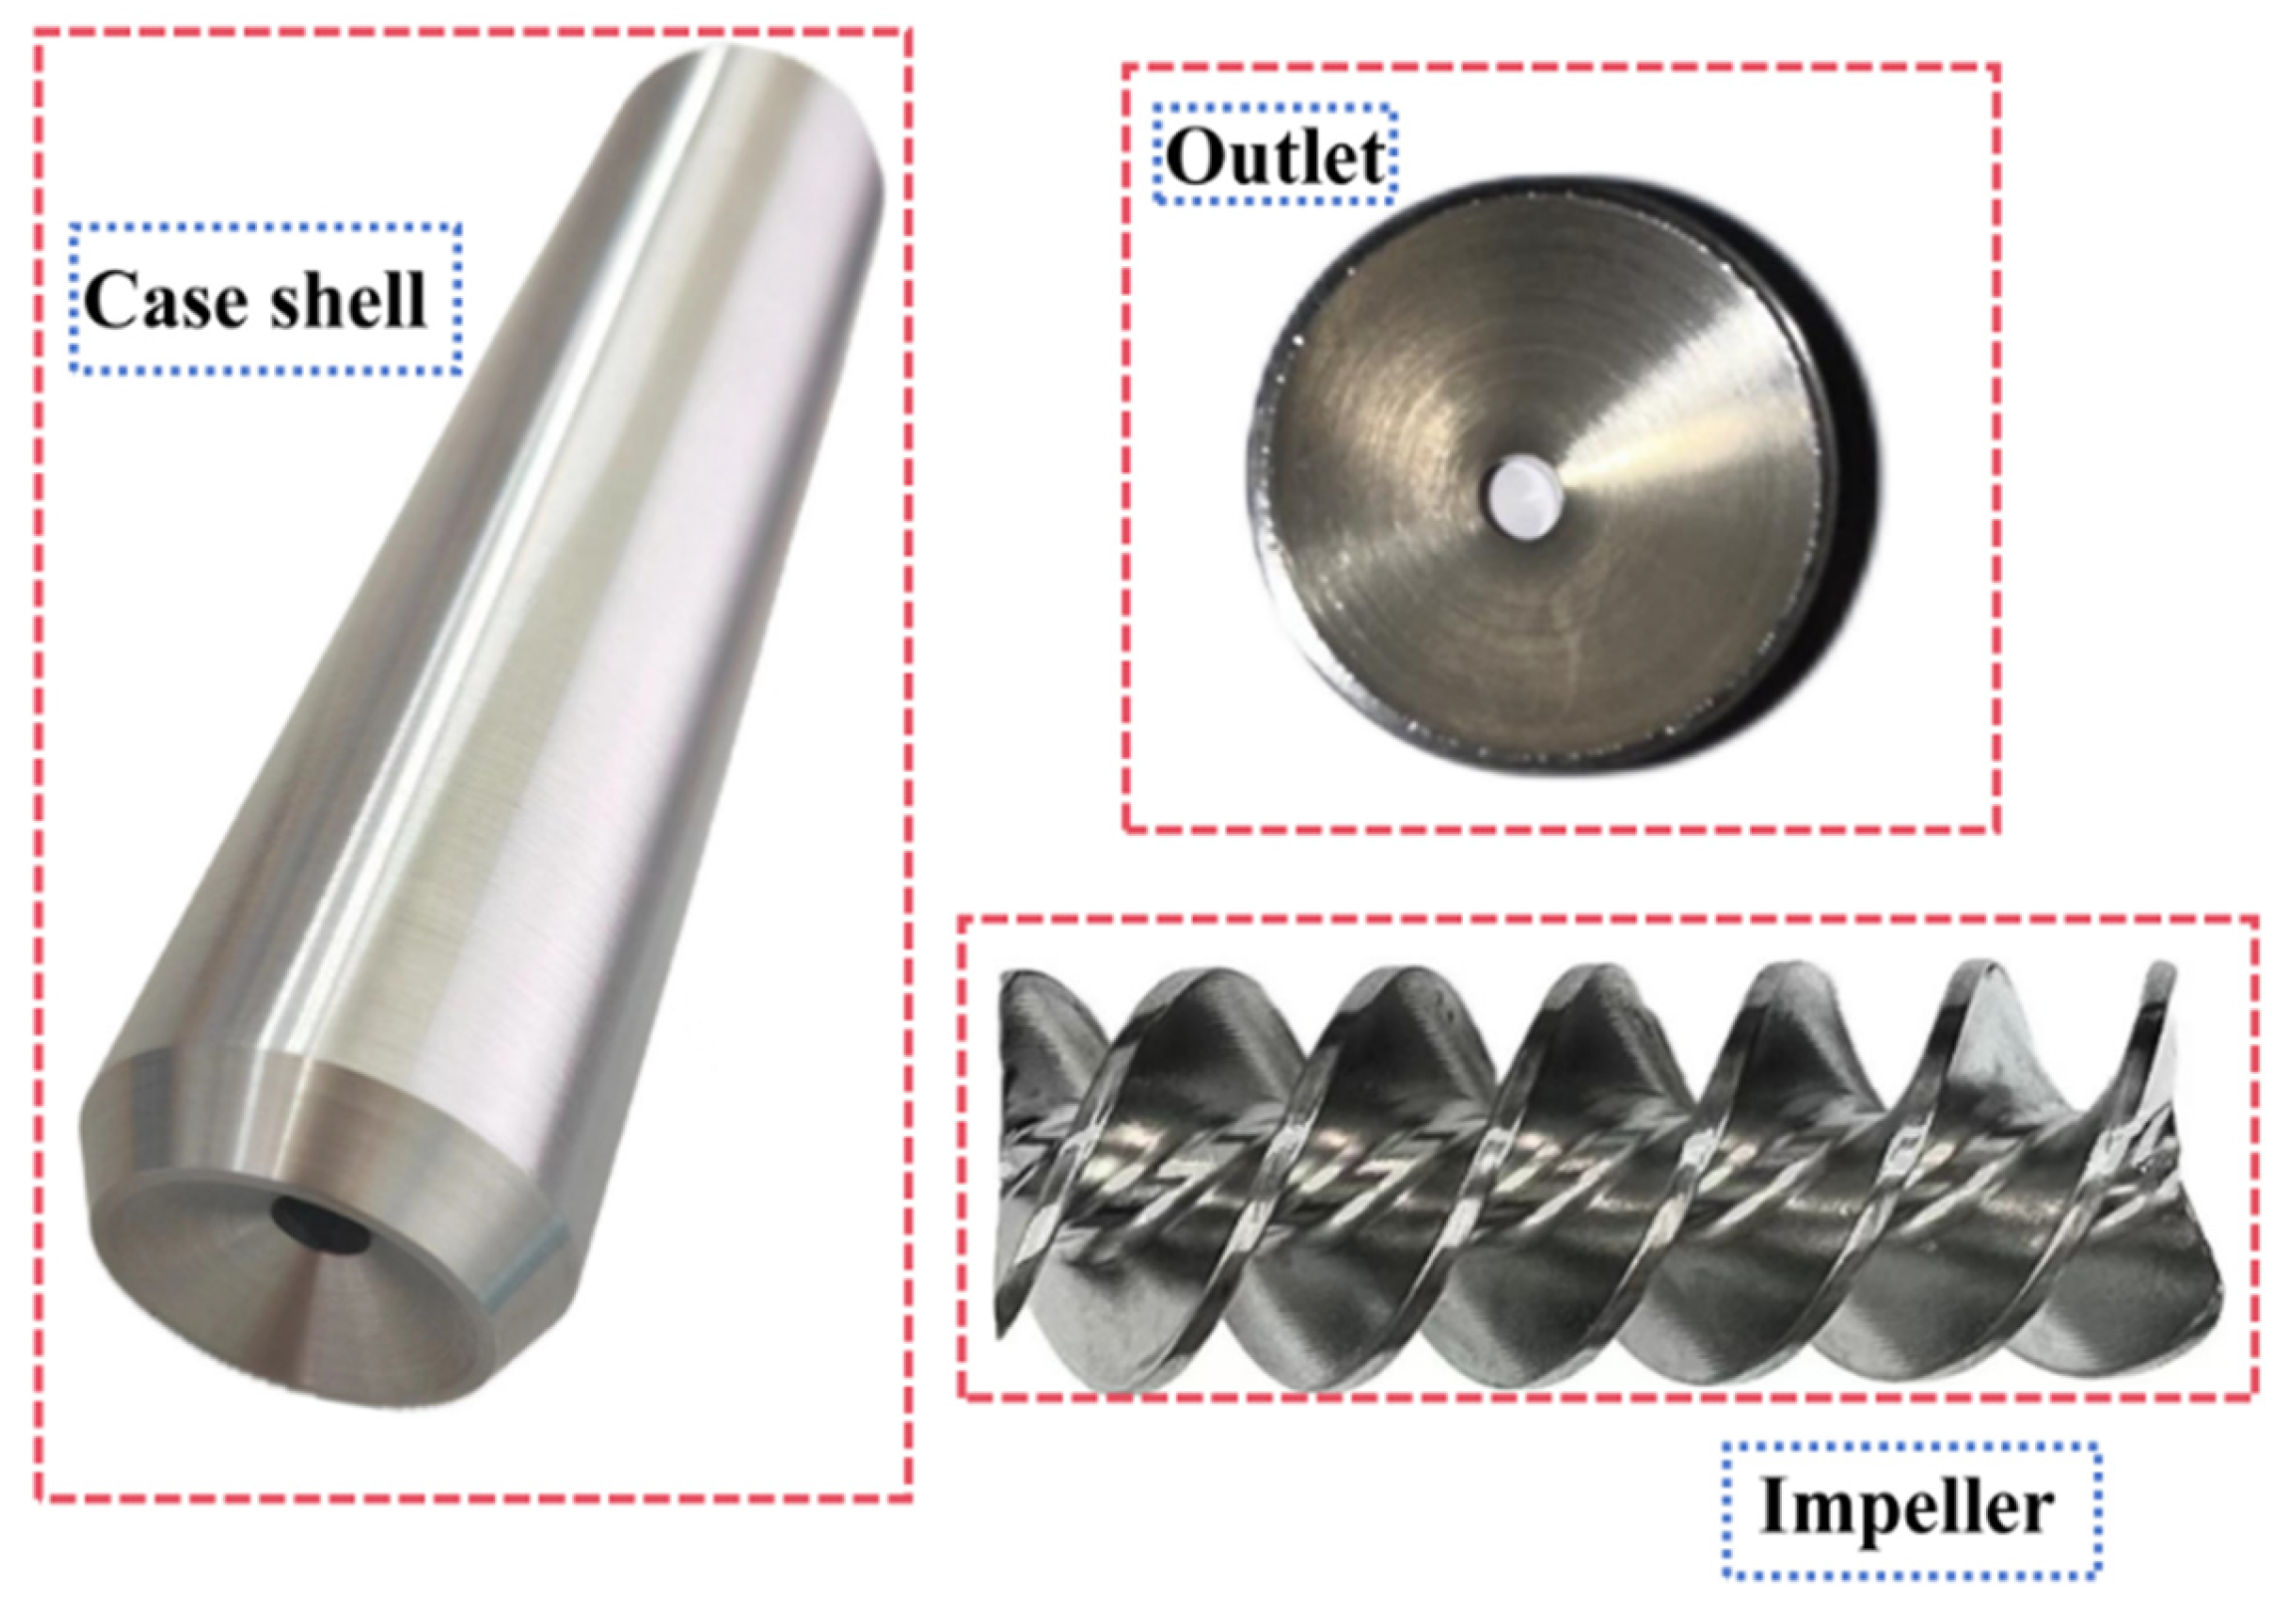
The geometric model and field operation principle of the SSIJ tool are first described to establish the physical context of this study. The geometric model of the tool is shown in Figure 3. The SSIJ tool consists of a shell, an impeller, and a CDJ nozzle. The impeller features a central hole. The geometric parameters of the tool are listed in Table 1, where H is the total length, R is the maximum outer diameter, R0 is the outlet diameter, D is the outer diameter of the impeller, L is the length of the contraction–expansion section, r is the diameter of the center hole, θ is the rotation angle of the impeller along the centerline, and δ is the thickness of the impeller. Figure 4 shows a schematic diagram of the physical tool. The tool was manufactured using 3D printing, and its surface was chrome-plated for anti-erosion treatment to ensure longevity in high-temperature and high-pressure environments.
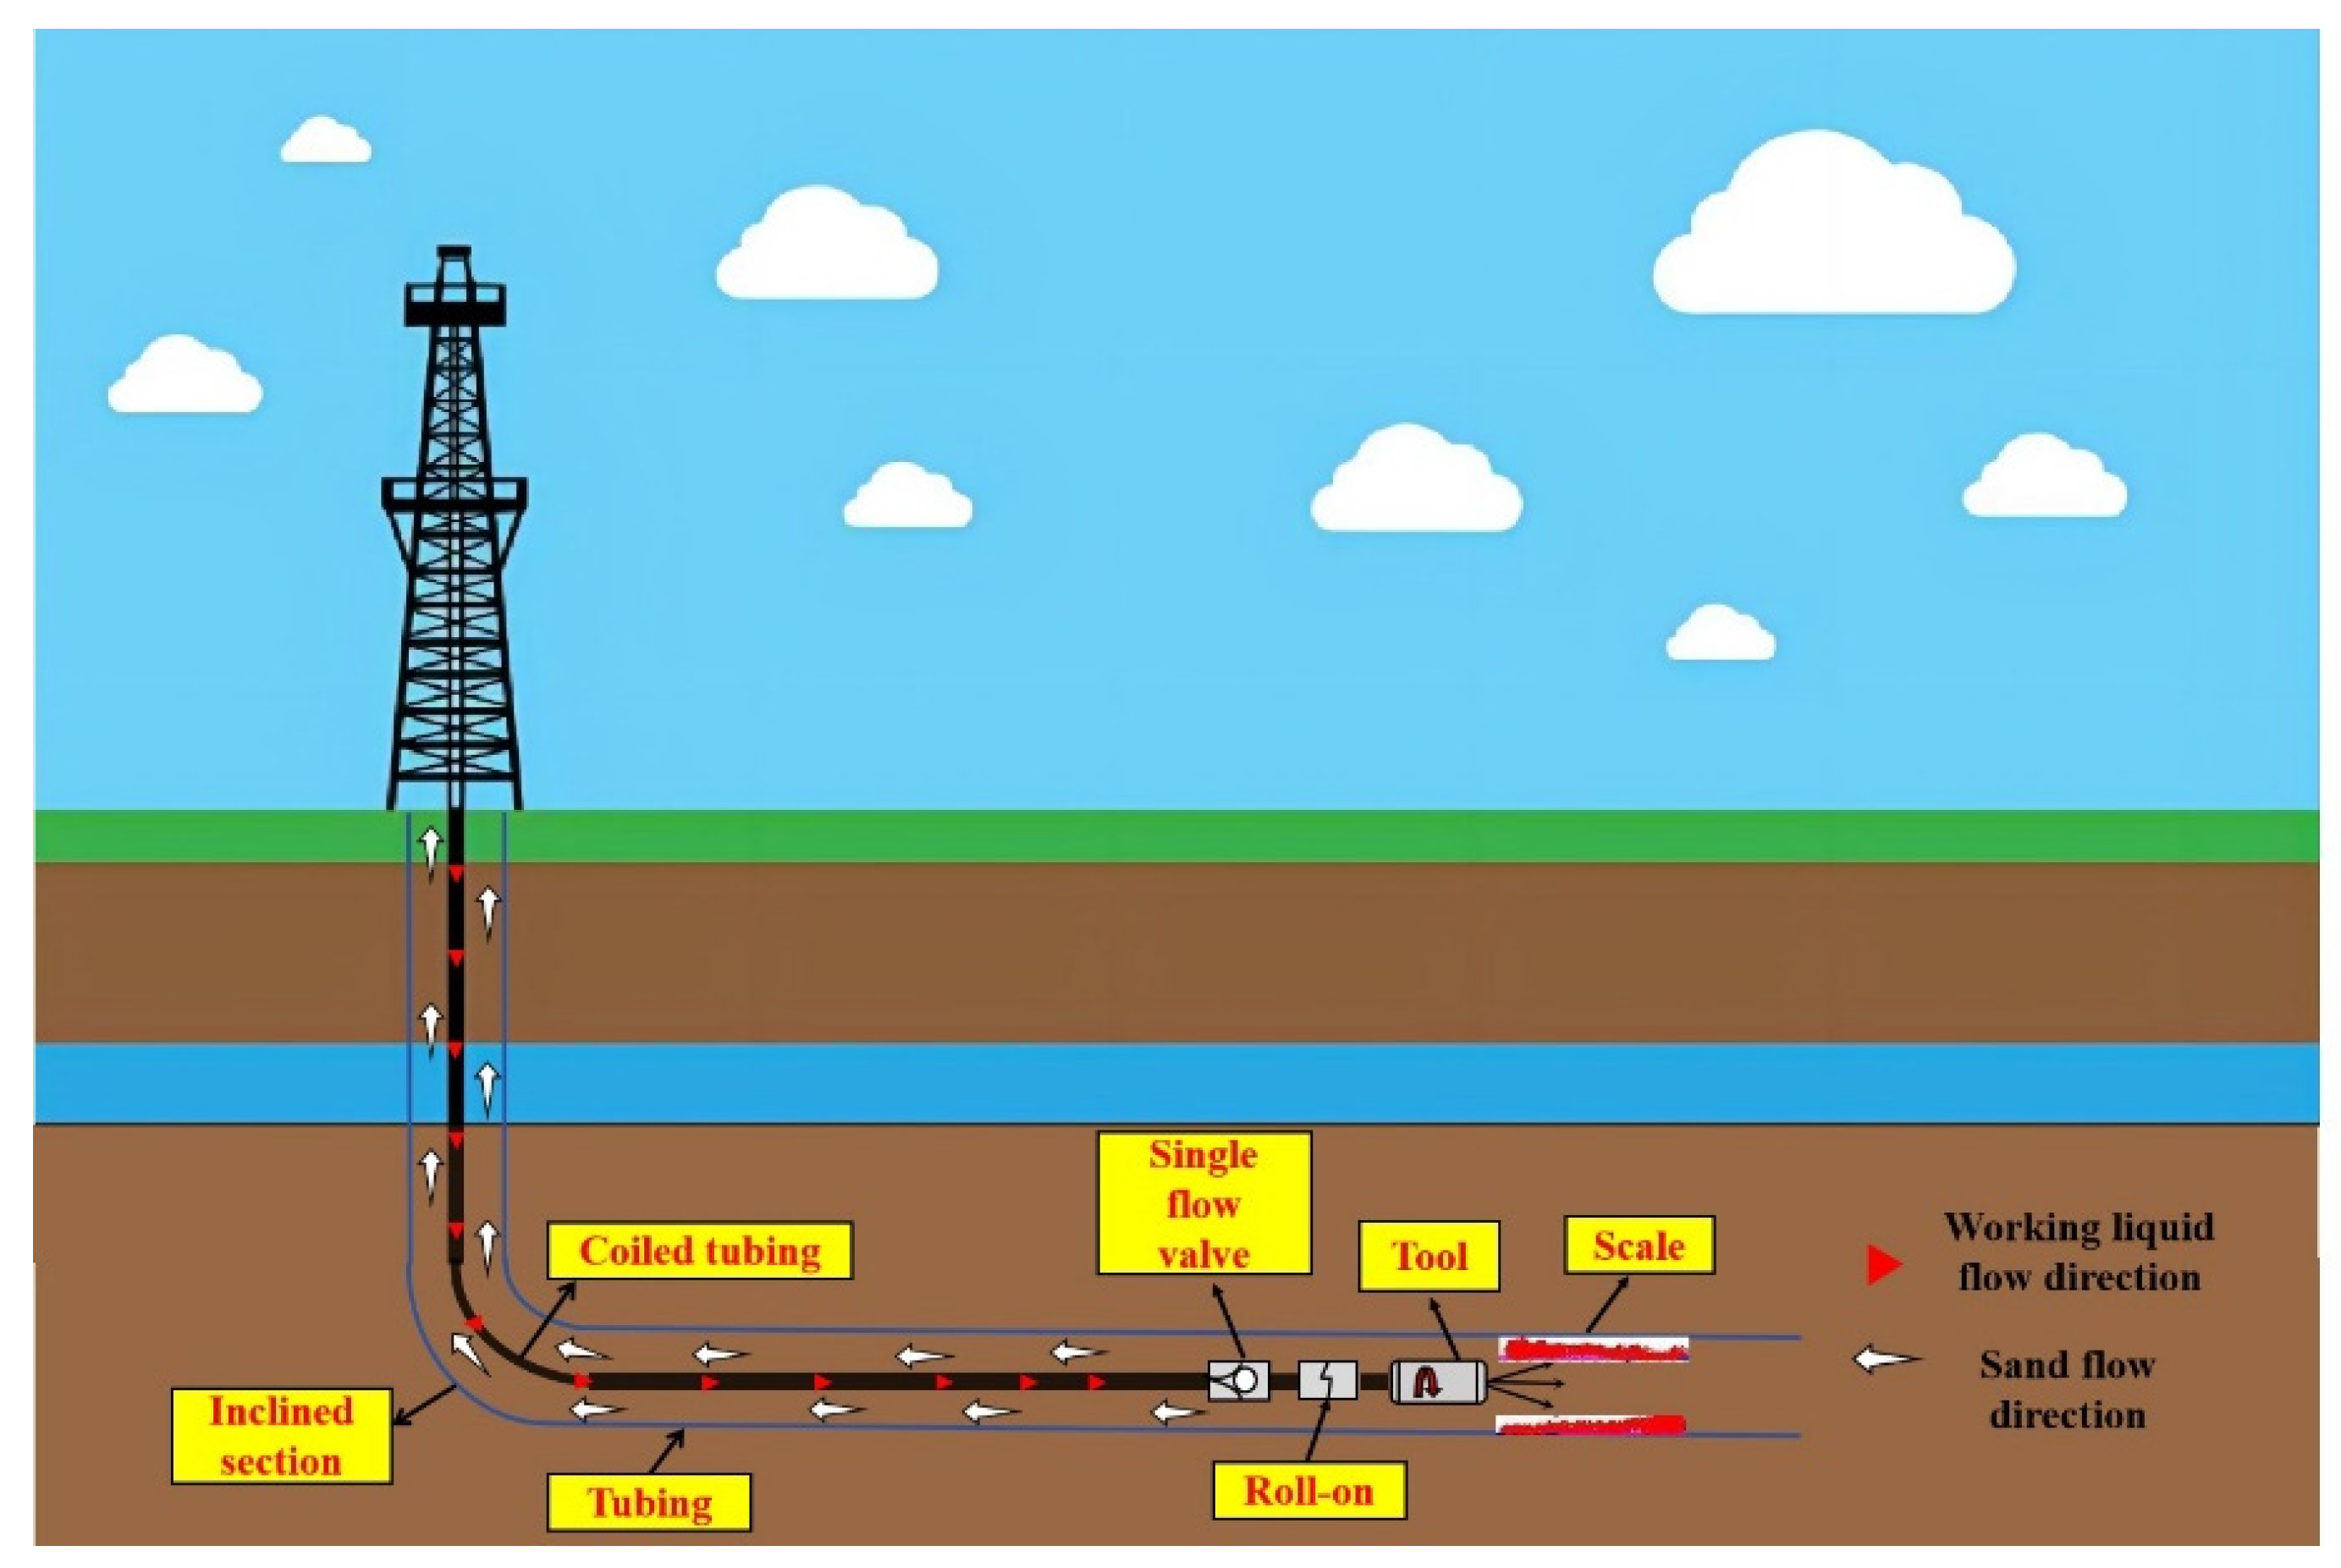
The on-site working principle of the SSIJ tool is shown in Figure 5: The SSIJ tool is connected to continuous tubing with an external diameter of 38.1 mm via a Roll-on fitting and a double-flap single-flow valve. It is then lowered at a predetermined speed to the scaling location within the tubing. A pumping truck provides power to establish fluid circulation. The SSIJ tool generates a straight-swirling integrated jet utilizing the cavitation effect and high-speed jet erosion to unblock the tubing.

2.2. CFD Model Setup

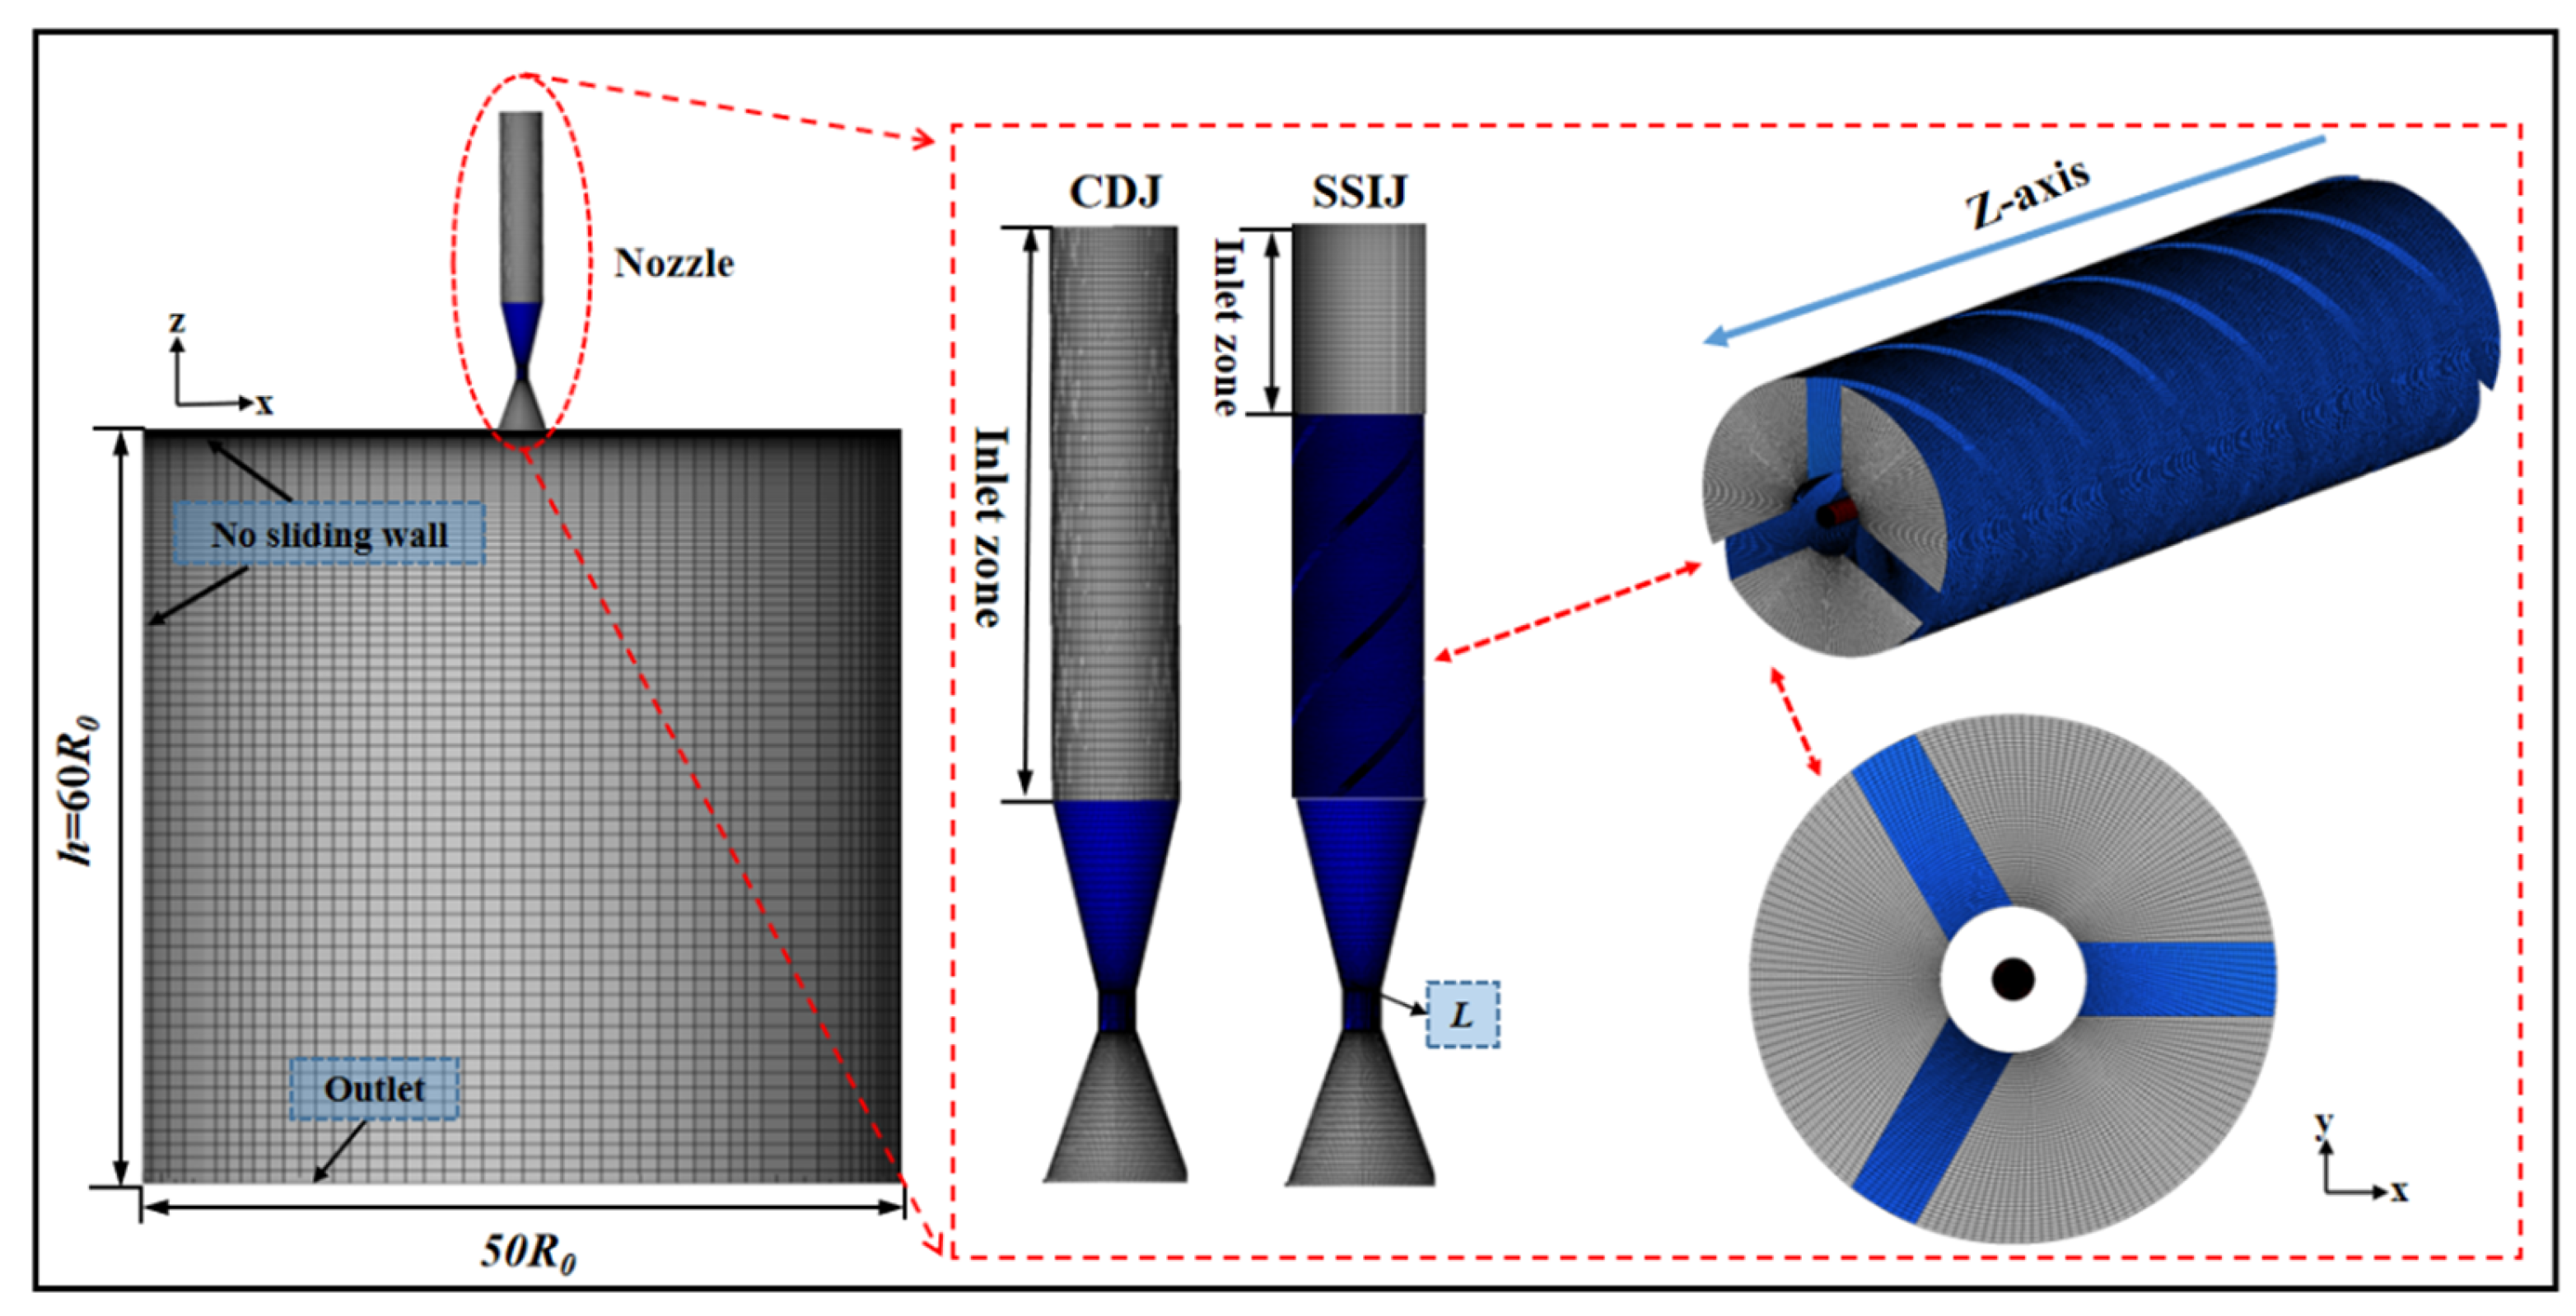
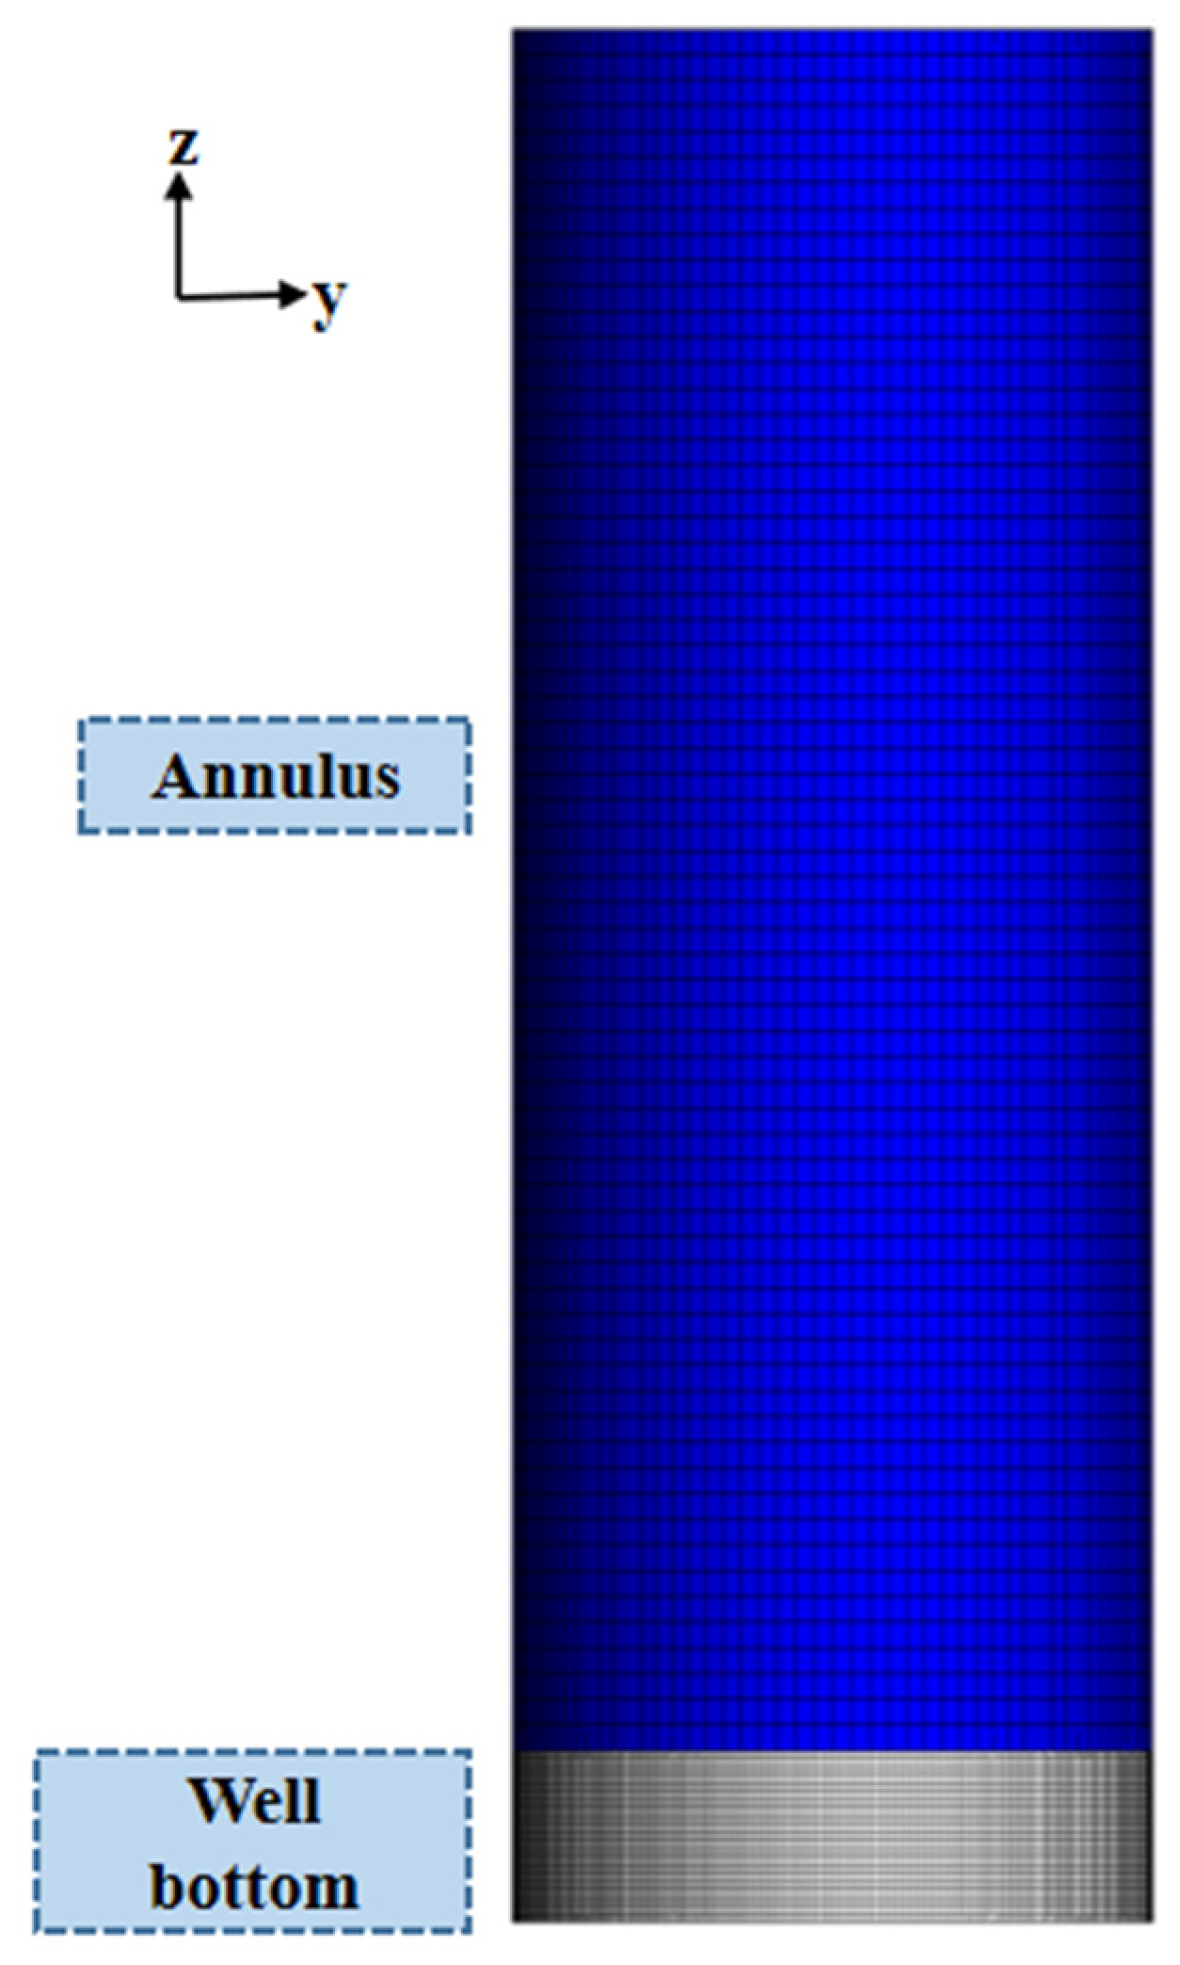
To numerically investigate the jet flow field and its blockage-removal performance, a three-dimensional CFD model was established. The computational domain, meshing strategy, and grid independence verification are presented in this subsection. In the numerical simulation process, mesh quality significantly impacts the accuracy of the calculation results. Figure 6 shows the outer flow field and mesh division for the descaling tool. The outer flow field is modeled as a cylinder with a diameter of 200 mm and a length of 240 mm. The selected domain length corresponds to approximately 60 times the nozzle outlet diameter. Under the investigated operating conditions, the jet flow is fully turbulent, with a Reynolds number on the order of 104–105. According to established turbulent jet theory, the potential core length of a round jet is typically about 6–8 nozzle diameters, while the velocity decay region develops over several tens of diameters. Therefore, the selected computational domain provides sufficient space for jet development before reaching the outlet boundary and minimizes the influence of boundary effects on the simulated flow field. Figure 7 shows the wellbore geometric model and mesh division required for the numerical simulation of tool-carried sand. A smooth cylinder with an inner diameter of 50.64 mm and an outer diameter of 60.3 mm is used to simulate the tubing. All computational models are spatially discretized using the O-grid scheme in ICEM CFD (ANSYS, Inc., Canonsburg, PA, USA) to generate structured hexahedral meshes. Additionally, considering the strong swirling flow present in the straight-swirling mixed jet flow field, the impeller section is subdivided into blocks and meshed with refined hexahedral cells to further improve computational accuracy [27].
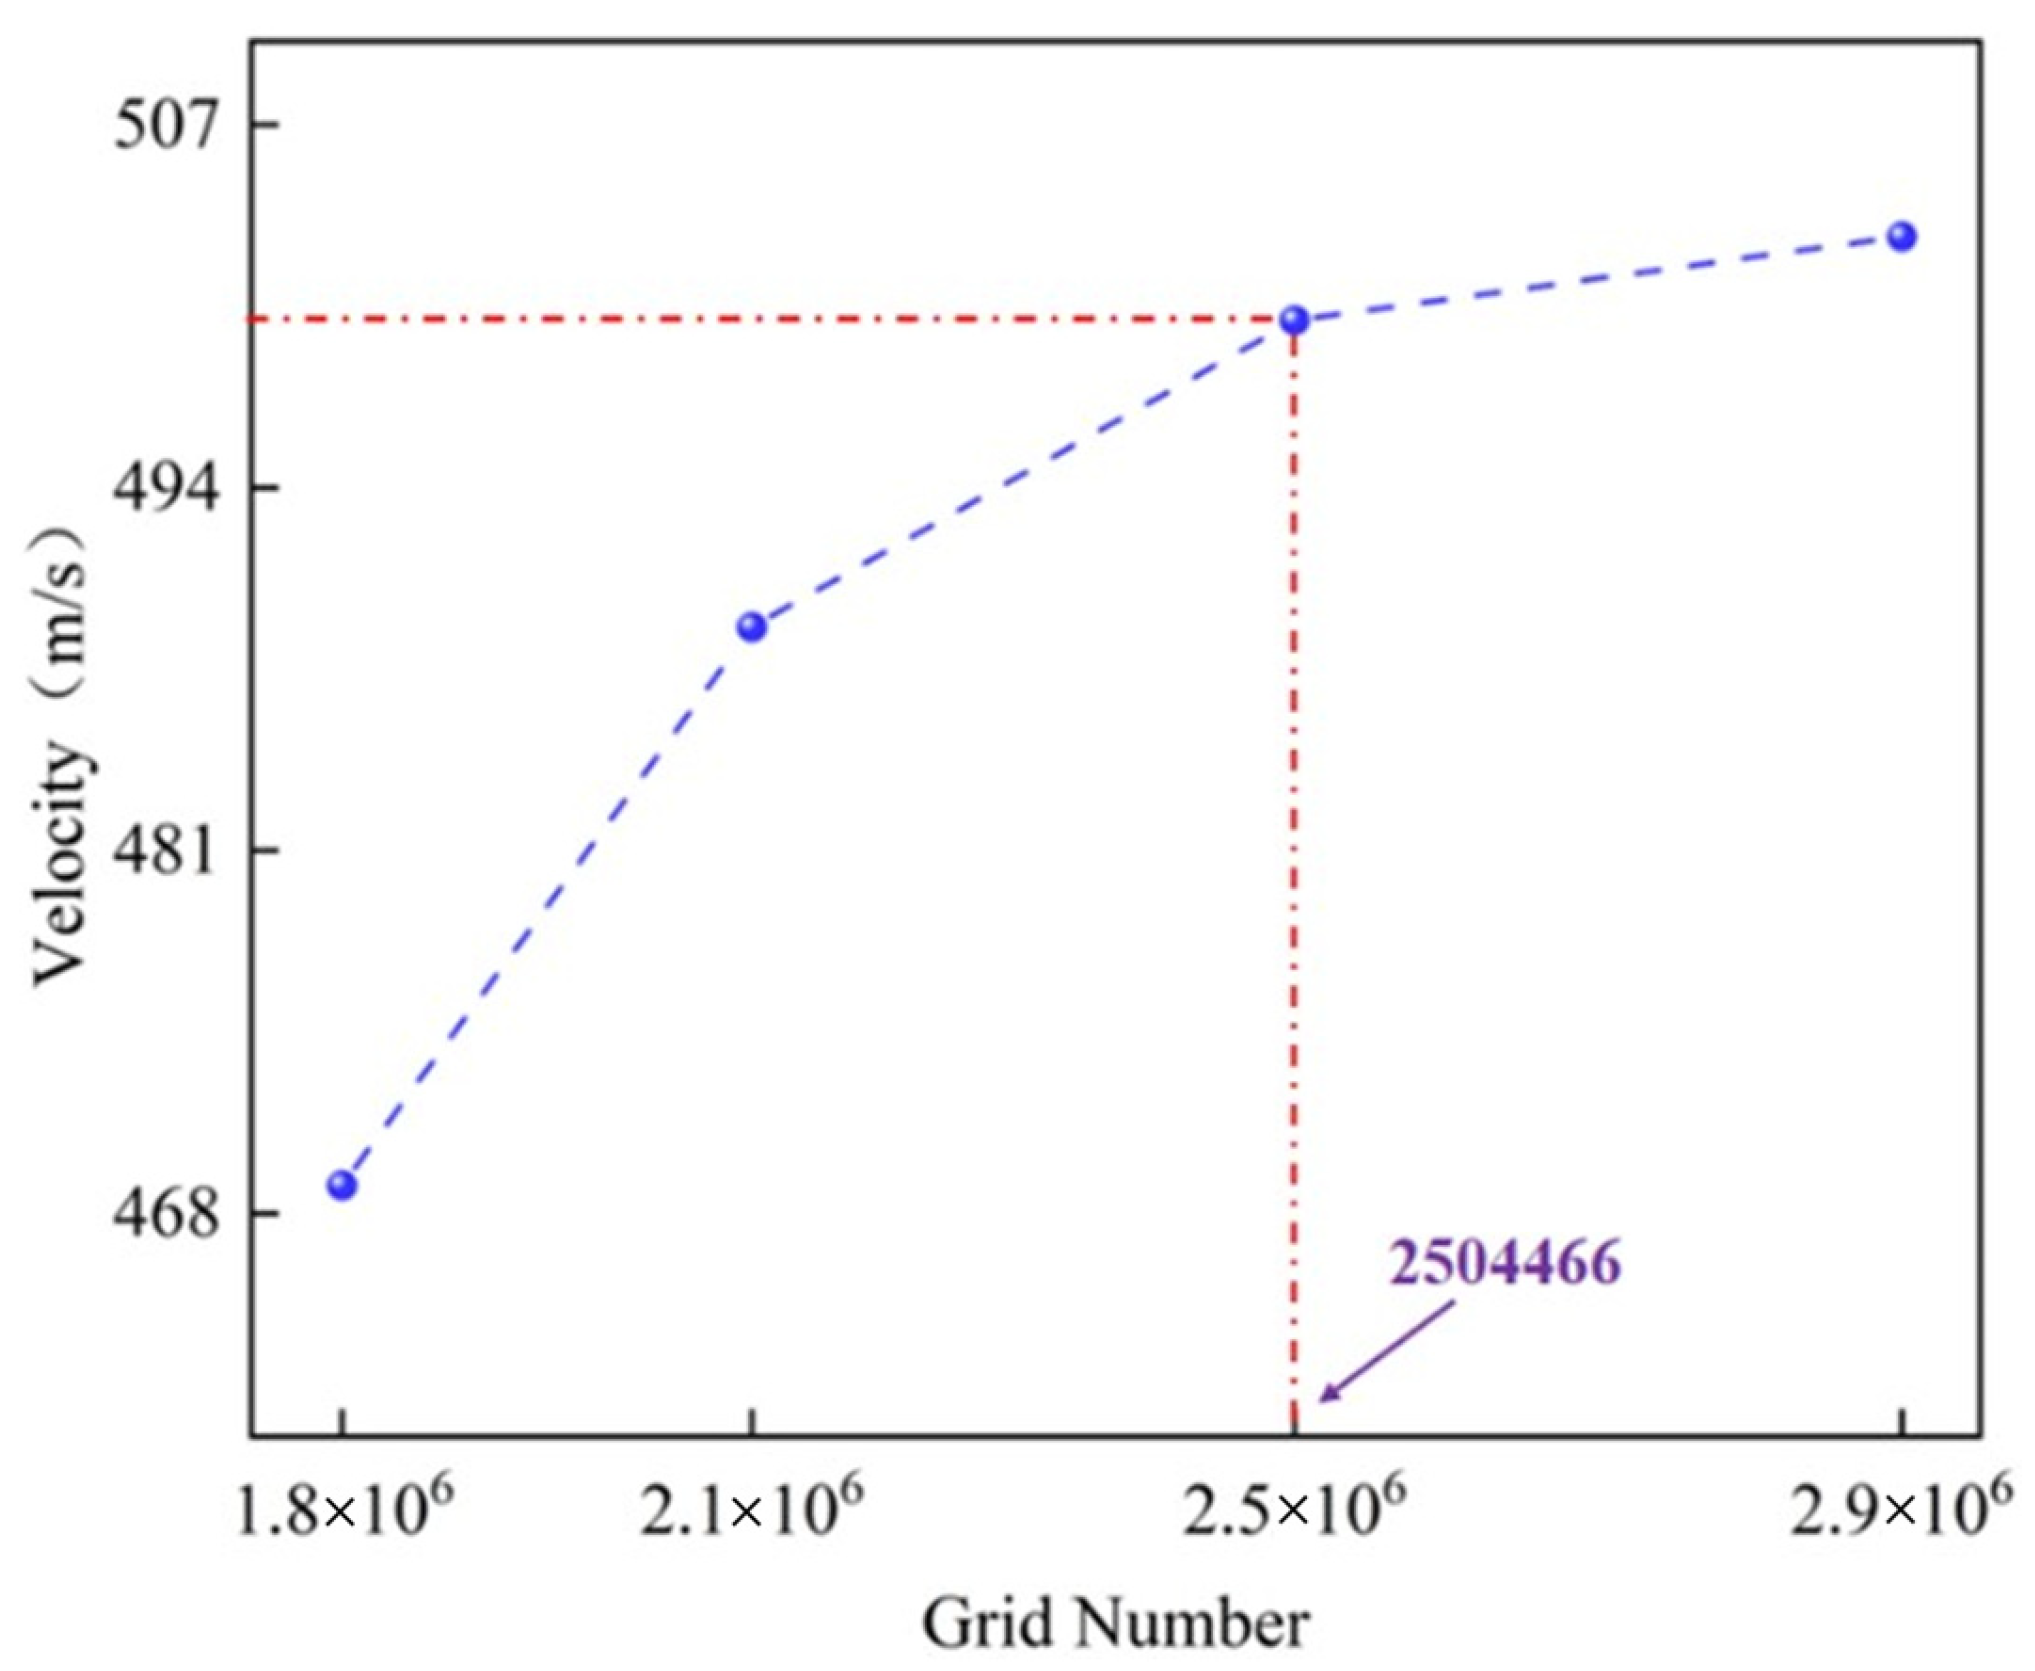
In the CFD solution process, mesh density is closely related to the computational results. However, increasing the number of mesh significantly increases computation time, and the improvement in accuracy tends to level off after exceeding a certain critical value. To evaluate mesh sensitivity, calculations were performed using different mesh sizes (1,815,635; 2,111,914; 2,504,466; and 2,943,549 elements) under identical boundary conditions. Using the peak velocity at the tool’s centerline cross-section as a benchmark, the results (Figure 8) indicate that the velocity change stabilizes beyond 2,504,466 elements. Therefore, considering both simulation accuracy and computational efficiency, a mesh size of 2,504,466 elements was selected for the simulations. Further mesh refinement does not significantly alter the cavitation volume fraction distribution, indicating that the selected mesh density is adequate for both velocity field and cavitation predictions.

2.3. Governing Equations and Boundary Conditions

It is important to clarify that two distinct multiphase flow models are employed in this study for different physical processes, and they are not coupled within a single simulation.
(1)
Cavitation flow (liquid–gas two-phase system): The cavitating jet flow is modeled using the Mixture model in ANSYS Fluent. In this framework, the liquid phase (water) and gas phase (vapor) are treated as interpenetrating continua with a shared velocity field, and the slip velocity between phases is assumed to be negligible due to the small size and close dynamic coupling of vapor bubbles. This model is used in Section 3.1 and Section 3.2 to capture jet structure, velocity distribution, and impact pressure characteristics without considering solid particles.
(2)
Sand-carrying process (liquid–solid two-phase system): The particle transport process is simulated using the Eulerian–Eulerian two-fluid model combined with the Kinetic Theory of Granular Flow (KTGF) [28,29]. Both the fluid phase and solid phase are treated as interpenetrating continua, while interphase momentum exchange is described through drag, lift, and granular interaction forces. Importantly, the solid phase is not modeled using a Lagrangian (DPM) approach; instead, a continuum granular phase formulation is adopted. The governing equations and closure relations (Equations (9)–(11)) correspond to this Eulerian–Eulerian–KTGF framework. This model is applied in Section 3.2 for evaluating particle transport and sand-carrying performance.
It should be emphasized that these two models are applied independently rather than simultaneously. The cavitation model focuses on jet structure optimization under gas–liquid conditions, whereas the sand-carrying model focuses on particle transport behavior under liquid–solid conditions. This decoupled modeling strategy is adopted to isolate the dominant physical mechanisms in each process. A fully coupled gas–liquid–solid three-phase model will be considered in future work. The liquid–solid simulation does not involve discrete particle tracking, and therefore all solid-phase results are interpreted in terms of phase volume fraction and transport characteristics rather than Lagrangian particle trajectories.
Before presenting the governing equations, the key assumptions adopted in this study are summarized as follows:
(1)
The flow is treated as incompressible and isothermal, as the temperature variation during jet impingement is negligible;
(2)
The working fluid (water) is considered a Newtonian fluid with constant properties;
(3)
The tubing wall is assumed to be rigid and smooth, with a no-slip boundary condition applied at the wall;
(4)
for the cavitation simulation, the vapor bubbles are assumed to be spherical and uniformly distributed, and the slip velocity between liquid and vapor phases is neglected; and
(5)
For the liquid–solid simulation, the solid phase is treated as a continuum with granular flow properties, and particle–particle interactions are modeled using the Kinetic Theory of Granular Flow.
Under the action of high-velocity jets, the laminar boundary layer transitions to turbulence due to instability. Simultaneously, low-pressure vortices, caused by velocity gradients and adverse pressure gradients, promote cavitation onset [30]. Due to the complexity of directly solving multiphase flow systems, macroscopic equations are typically derived, replacing local instantaneous variable descriptions with averaged descriptions of each phase [31]. Therefore, appropriate multiphase flow, turbulence, and cavitation models must be selected.
The Euler-Lagrange (E-L) method, which solves the continuous-phase Navier–Stokes equations and tracks dispersed-phase particles, is only suitable for dispersed-phase volume fractions below 10% [32]. Consequently, to accurately model the liquid–solid interaction, the Eulerian–Eulerian method is chosen for this study. Specifically, the Mixture model handles interphase slip and is suitable for problems with widely distributed dispersed phases or localized flows. It effectively models gas–liquid two-phase flow and cavitation bubble behavior, making it appropriate for cavitation-jet simulation [33,34]. In contrast, the Eulerian model is more commonly used for solid–liquid two-phase particulate flow. It solves separate momentum and continuity equations for each phase, achieving coupling through interphase drag forces and pressure exchange coefficients [35].
The expression for the continuity equation of the Mixture model is given below:
t ρ m + ρ m v m = m · v m = q = 1 n α q ρ q v q ρ m ρ m = q = 1 n α q ρ q
where ρm is the density of the mixed phase, vm is the mass-averaged velocity, ṁ is the mass transfer rate between phases, and αq, ρq, and vq are the volume fraction, density, and velocity of the qth phase, respectively.
The momentum equation expression for the Mixture model is given below:
t ρ m v m + ρ m v m v m = μ m v m + v m T + ρ m g + F + q = 1 n α q ρ q v dr , q v dr , q μ m = q = 1 n α q μ q v dr , q = v q v m
where F is the volume force, and μm is the mixed-phase viscosity. vdr,q is the slip velocity of the second phase, which is not taken into account in the cavitation-jet simulation, and the value is set to zero.
The gas-phase volume fraction equation can be obtained from the continuity equation as shown below:
t α q ρ q + α q ρ q v m = α q ρ q v d r , q
In the Eulerian model, both the solid and liquid phases are treated as interpenetrating continua. The model accounts for relative motion between particles, between particles and fluid, and turbulent diffusion. Each interaction type exhibits distinct dynamics and phase coupling mechanisms [36]. Particle–particle interactions, such as collisions and friction, are modeled using the Kinetic Theory of Granular Flow (KTGF) [37].
The mass conservation equation for the solid phase in the Eulerian model is expressed as follows:
t α q ρ q + α q ρ q ν q = 0
q = 1 n α q = 1
where αq and ρq are the volume fraction, density, and velocity of phase q, respectively.
The liquid phase momentum conservation equation is expressed as follows:
t α l ρ l ν l + α l ρ l ν l ν l = α l p + τ ¯ ¯ l + α l ρ l g + K s l ν s ν l
where α l , ρ l , ν l are the volume fraction, density, and velocity of the liquid phase, respectively. p are the mixed flow pressure, τ ¯ ¯ are the liquid stress-strain tensor, g are the gravitational acceleration, K s l are the liquid–solid momentum exchange coefficient, ν s are the solid-phase velocity.
The solid-phase momentum conservation equation is expressed as follows:
t α s ρ s ν s + α s ρ s ν s ν s = α s p p s + τ ¯ ¯ s + α s ρ s g + K l s ν g ν s + F s + F l i f t , s
where α s is the solid-phase volume fraction, ρ s is the solid-phase density. p s is the solid pressure, τ ¯ ¯ s is the solid stress-strain tensor, F s is the external force, F l i f t , s is the lift force. K l s is the solid–liquid momentum exchange coefficient, where there exists K l s = K s l .
The stress-strain tensor τq for the liquid or solid phase can be expressed by Equation (8).
τ ¯ ¯ q = α q μ q ν q + ν q T + α q λ q 2 3 μ q ν q I ¯
where λ q and μ q are the bulk and shear viscosities of phase q, respectively. I ¯ is the unit tensor. In this study, the resistance coefficient model was modeled using the Gidaspow model [38], which was combined with the Wen and Yu model [39] and the Ergun model [40].
K s l = 3 4 C D α s α l ρ l ν s ν l d s α l 2.65
C D = 24 α l R e s 1 + 0.15 α l R e s 0.687
R e s = ρ l d s ν s ν l μ l
If α l 0.8 [38], the value K s l is shown in Equation (12):
K s l = 150 α s 1 α l μ l α l d s 2 + 1.75 α s ρ l ν s ν l d s
where d s is the diameter of the cuttings, the drag coefficient C D and the relative Reynolds number R e s are shown in Equations (10) and (11), respectively, and μ l is the shear viscosity of the liquid phase.
The lift force on the solid phase can be expressed by Equation (13):
F l i f t , s = C l ρ l α s ν l ν s × × ν l
The lift coefficient C l is obtained from the Saffman–Mei model [41,42]; it is related to the particle Reynolds number R e p and the vorticity Reynolds number R e ω . It is expressed by Equation (14):
C l = 6.46 × f ( R e p , R e ω ) , R e p 40 6.46 × 0.0524 ( β R e p ) 1 / 2 , 40 < R e p < 100
The above equations R e p , R e ω , β and f R e p , R e ω value expressions are as follows:
R e p = ρ g d s ν l ν l μ l
R e ω = ρ l × ν l d s 2 μ l
β = 0.5 ( R e ω / R e p )
f R e p , R e ω = 1 0.3314 β 0.5 e 0.1 R e p + 0.3314 β 0.5
The Realizable k-ε model demonstrates superior adaptability for simulating rotating flows, planar jets, separated flows around cylinders, and flows with complex secondary flow characteristics [43]. Given that the numerical simulations in this study involve rotating jets, complex secondary flows, and near-wall boundary layer flows, flow features well suited to this model, the Realizable k-ε model was selected for the calculations.
The governing equations for this turbulence model are expressed as follows:
t ρ k + x j ρ k u j = x j μ + μ t σ k k x j + G k + G b ρ ε Y M + S k
where YM denotes the contribution of the dilatation dissipation term in the Realizable k-ε model.
t ρ ε + x j ρ ε u j = x j μ + μ t σ ε ε x j + ρ C 1 S ε ρ C 2 ε 2 k + ν ε + C 1 ε k ε k C 3 ε G b + S ε
where the C 1 value is shown in Equation (21):
C 1 = max 0.43 , η η + 5 , η = S k ε , S = 2 S i j S i j
where k is the turbulent kinetic energy, m2/s2; uj is the velocity of the fluid, m/s; ε is the turbulent dissipation rate, m2/s3; μ is the dynamic viscosity of the turbulence, Pa·s; Gk is the turbulent kinetic energy due to the laminar velocity gradient, m2/s2; Gb is the turbulent kinetic energy due to the buoyancy force, m2/s2; and YM is the contribution term of the turbulent pulsating expansion into the dissipation rate of the global flow field in compressible flow; C1, C2, and C3 are three constants; σk and σε are Prandtl numbers; Sk and Sε are user-defined source terms.
The Schnerr–Sauer model demonstrates higher solution accuracy and convergence for simulating cavitation phenomena in nozzle flows [44]. As the SSIJ unblocking tool primarily operates via a nozzle jet mechanism, this model was selected for the numerical simulation of its cavitation jets.
The gas-phase volume fraction conservation equation is expressed as follows:
t α v ρ v + α v ρ v v m = S e S c α v = n b 4 3 π R b 3 1 + n b 4 3 π R b 3
where S e and S c are the evaporation and condensation source phases of the bubbles, representing the mass transfer process between the liquid and gas phases in cavitation, and α v is the volume fraction of the gas phase as a function of the bubble number density and bubble radius.
The source phases Se and Sc, and the values are expressed as follows:
S e = ρ v ρ l ρ m α v 1 α v 3 R b 2 P v P 3 ρ l P v P
S c = ρ v ρ l ρ m α v 1 α v 3 R 2 P P v 3 ρ l P v P
R b = α v 1 α v 3 4 π n b 1 / 3
where P v is the saturated vapor pressure, P is the local far-field pressure, and the bubble number density n b takes the optimal value of 1013 [45].
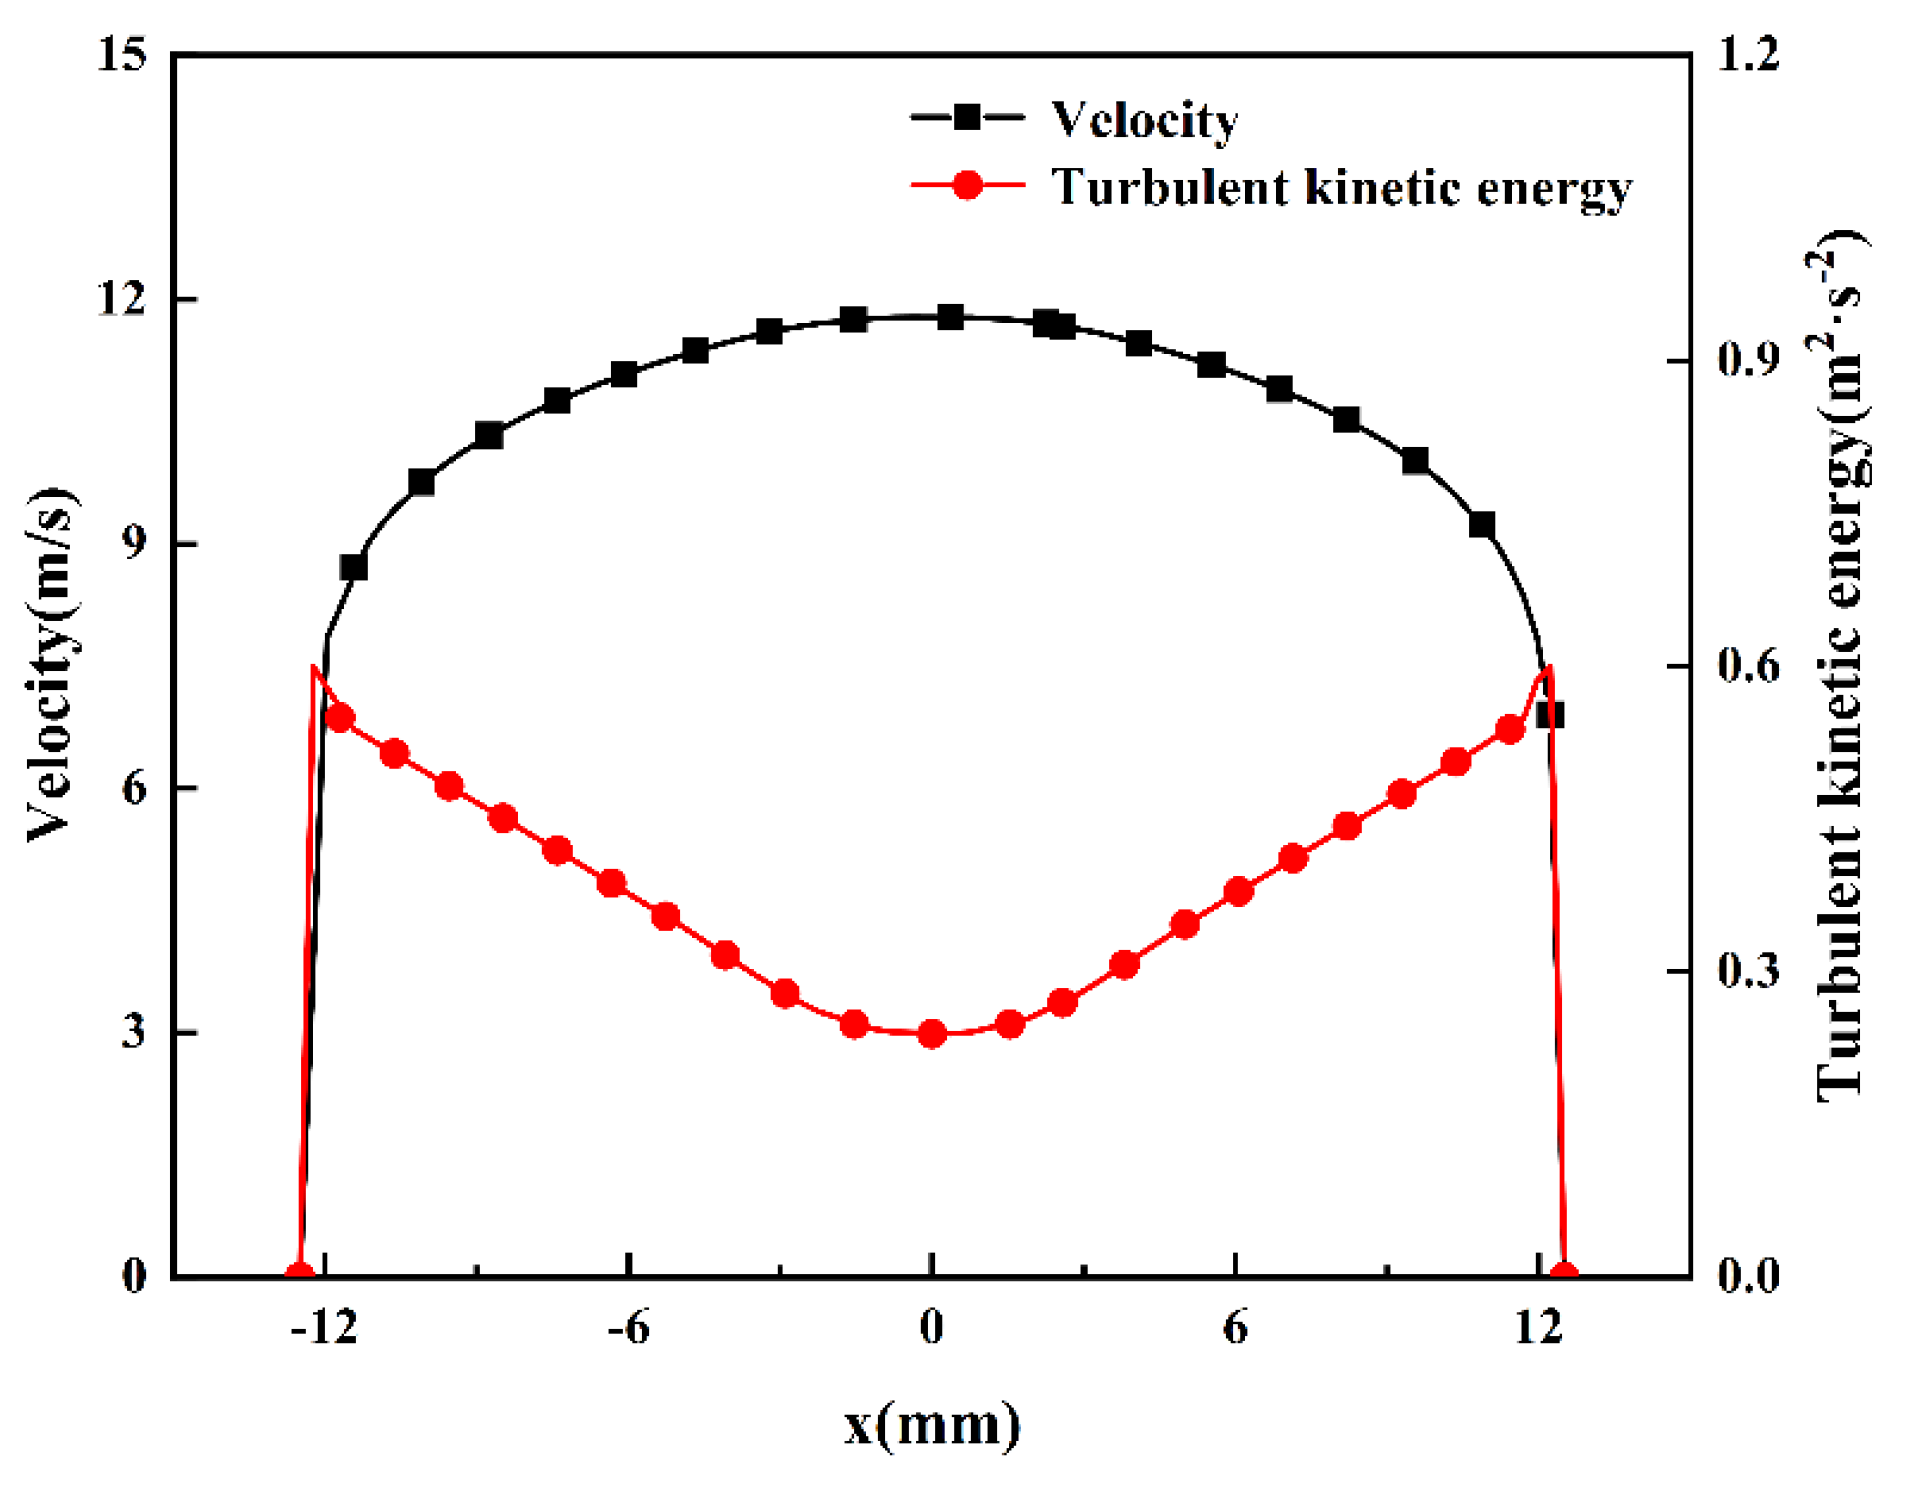
For the cavitation-jet simulation, the inlet boundary condition is set to velocity. To ensure computational accuracy and obtain a fully developed turbulent flow field, a precursor simulation using the Realizable k-ε model is performed on a pipe with a length-to-diameter ratio of 20:1 (length: 160 mm, diameter: 8 mm) [46]. As shown in Figure 9, the time-averaged velocity and turbulence parameter distributions (turbulent kinetic energy k and dissipation rate ε) from the outlet cross-section of this precursor simulation are extracted and applied as the inlet boundary conditions for the main model [47]. The wall boundary condition is set to no-slip, and the outlet boundary condition is defined as pressure. The numerical solution is obtained using ANSYS Fluent 2021 R2 software (ANSYS, Inc., Canonsburg, PA, USA). The SIMPLEC algorithm couples the pressure and velocity fields. Spatial discretization employs the finite-volume method: the pressure term uses the PRESTO! scheme, while the remaining variables use a second-order upwind scheme. For the steady-state cavitation simulations, the convergence criterion was set to 10−4 for all residual variables. These numerical schemes have been widely validated in multiphase flow simulations involving gas–liquid interfaces and film dynamics [48].
In the tool-carrying sand simulation, the inlet boundary condition is set to velocity, and the outlet boundary condition is defined as pressure. Based on field data indicating the scaling location at a well depth of 3060 m, the outlet pressure is set to 30 MPa. As this fouling section is in the horizontal wellbore, gravitational acceleration is applied along the y-axis (−9.81 m/s2). The SIMPLEC algorithm was used for the solution, with the pressure term discretized using the PRESTO! scheme and the remaining variables are discretized with a second-order upwind scheme. The transient solution used a residual convergence criterion of 10−5, a time step of 10−4 s, and a maximum of 200 iterations per time step. The sand phase was initialized at the well bottom using the Patch method, with a density of 2650 kg/m3 and an initial mass of 0.014 kg.

3. Results

3.1. Numerical Simulation for Structural Optimization of the SSIJ Tool

The ranges of structural parameters selected for optimization (straight-section length: 1–4 mm; impeller rotation angle: 180–720°; impeller thickness: 12–18 mm) were determined based on the geometric constraints of the tool dimensions (total length H = 152.7 mm, outer diameter R = 25 mm), manufacturing feasibility (e.g., the resolution limits of 3D printing), and empirical values from previous studies on similar nozzle designs. The selected ranges are also constrained by the dimensional limits of coiled tubing operations: the maximum outer diameter (R = 25 mm) is dictated by the internal diameter of the tubing (50.64 mm), which limits the impeller diameter and thickness; the rotation angle range (180–720°) is bounded by manufacturability and the need to avoid excessive pressure drop across the tool, while the specific values were referenced from the parametric studies on similar swirling jet nozzles reported in the research of Du et al. [20] and Zhang et al. [22].

3.1.1. Impact of the Length of Straight-Line Segments

In order to investigate the effect of different linear segment lengths on the flow field of the unblocking tool jet, the linear segment length L is taken as 1~4 mm for calculation, and other structural parameters are shown in Table 1. The inlet velocity of the model is 10 m/s, and the outlet circumferential pressure is 0.5 MPa [49].
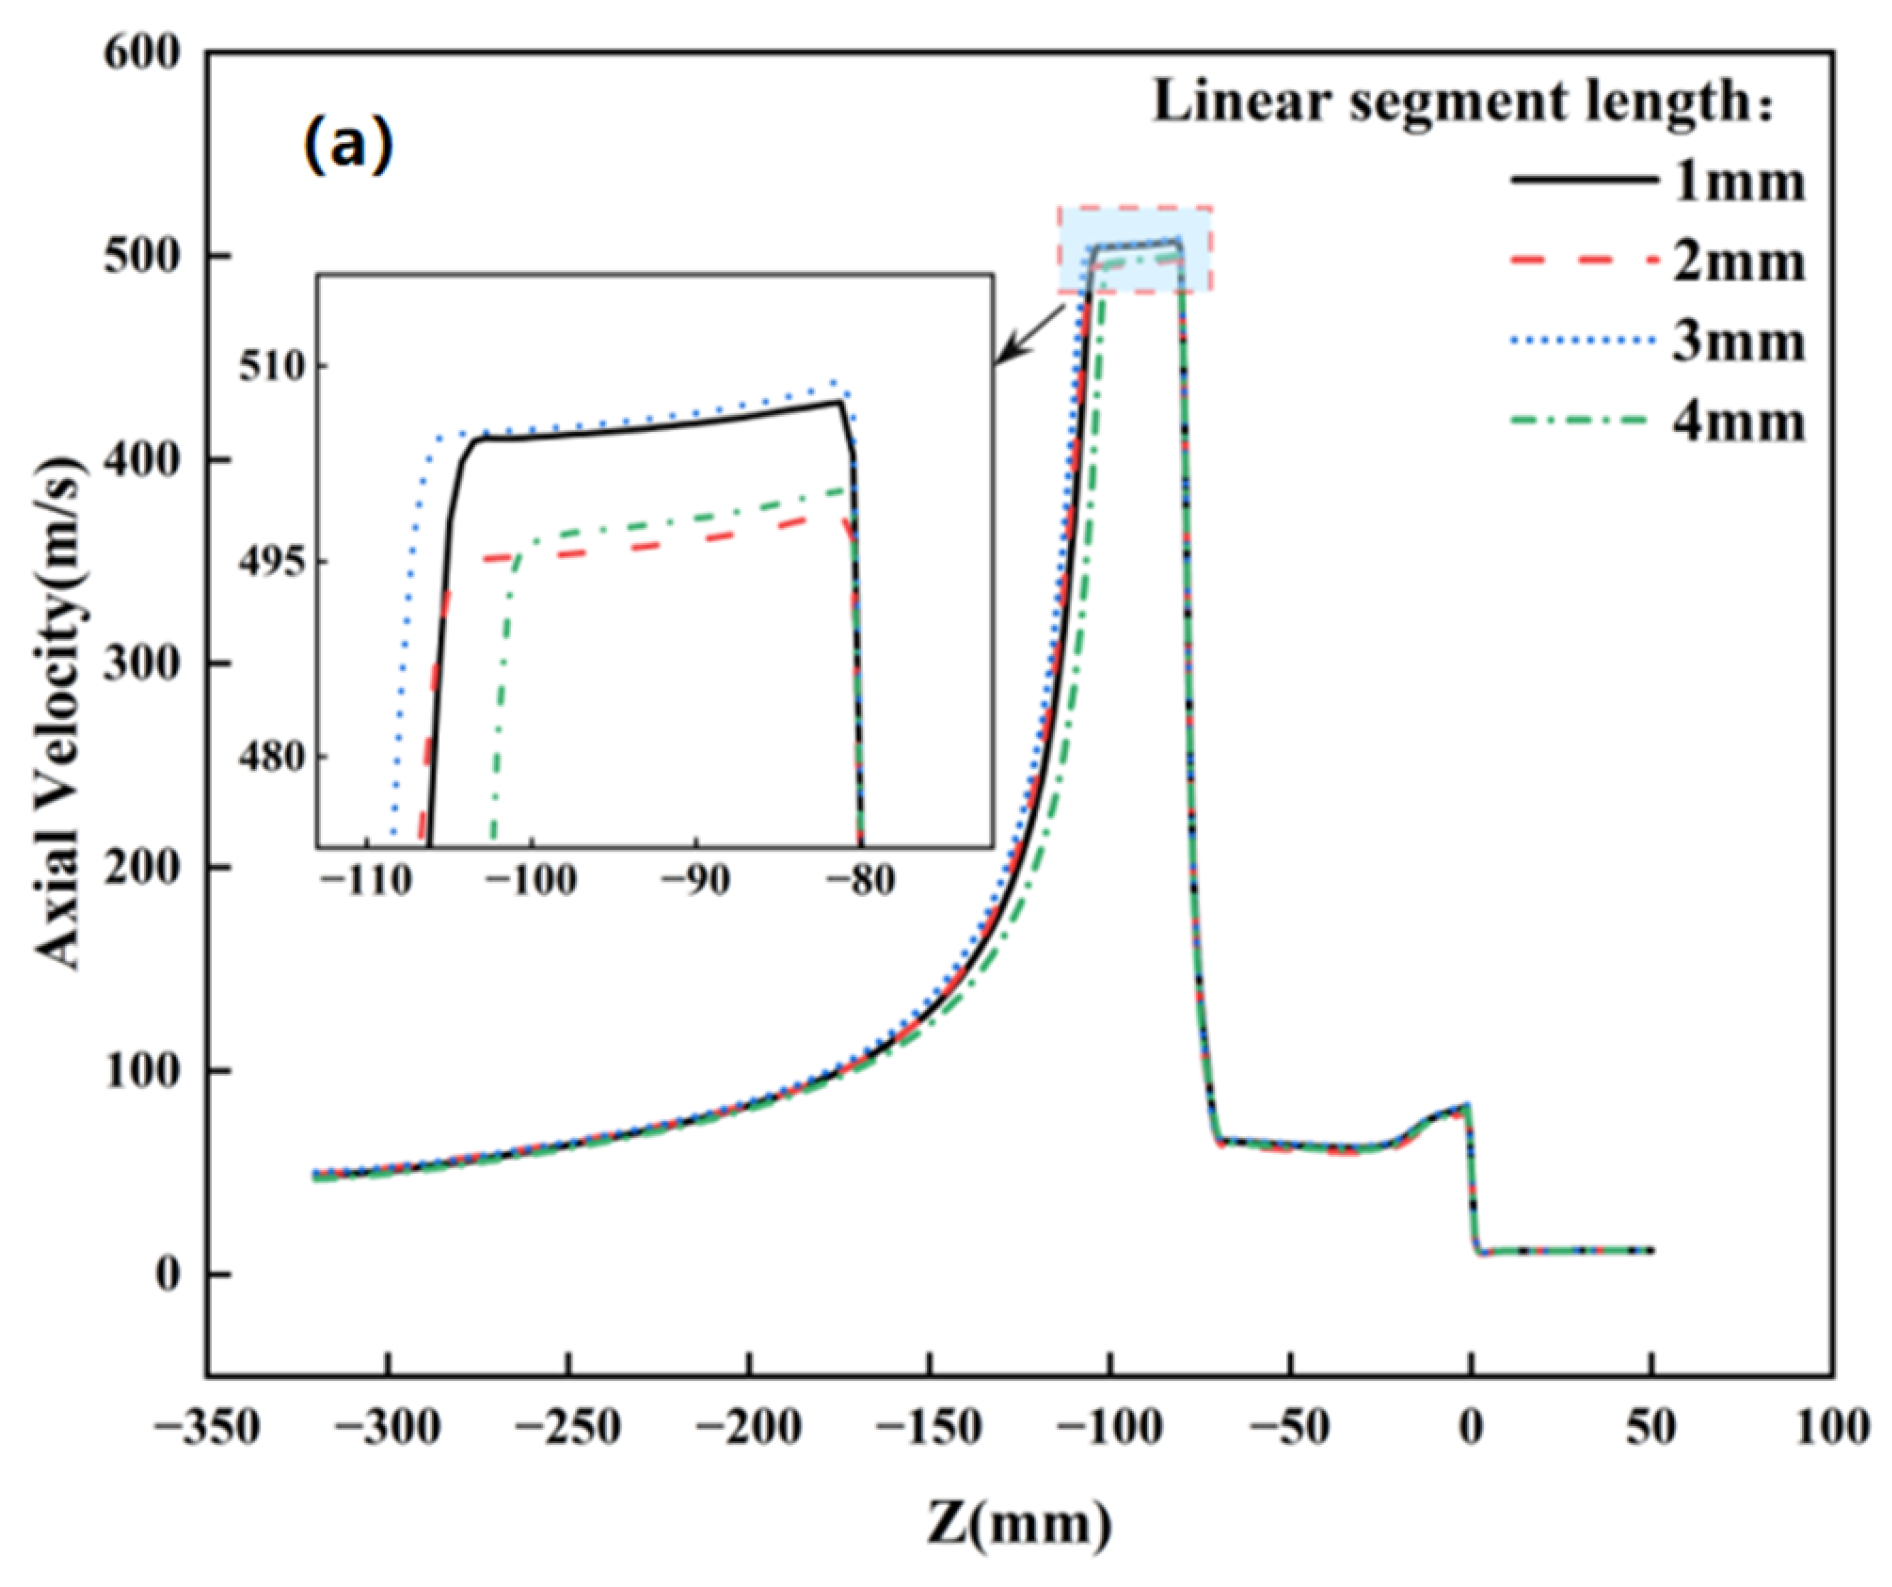
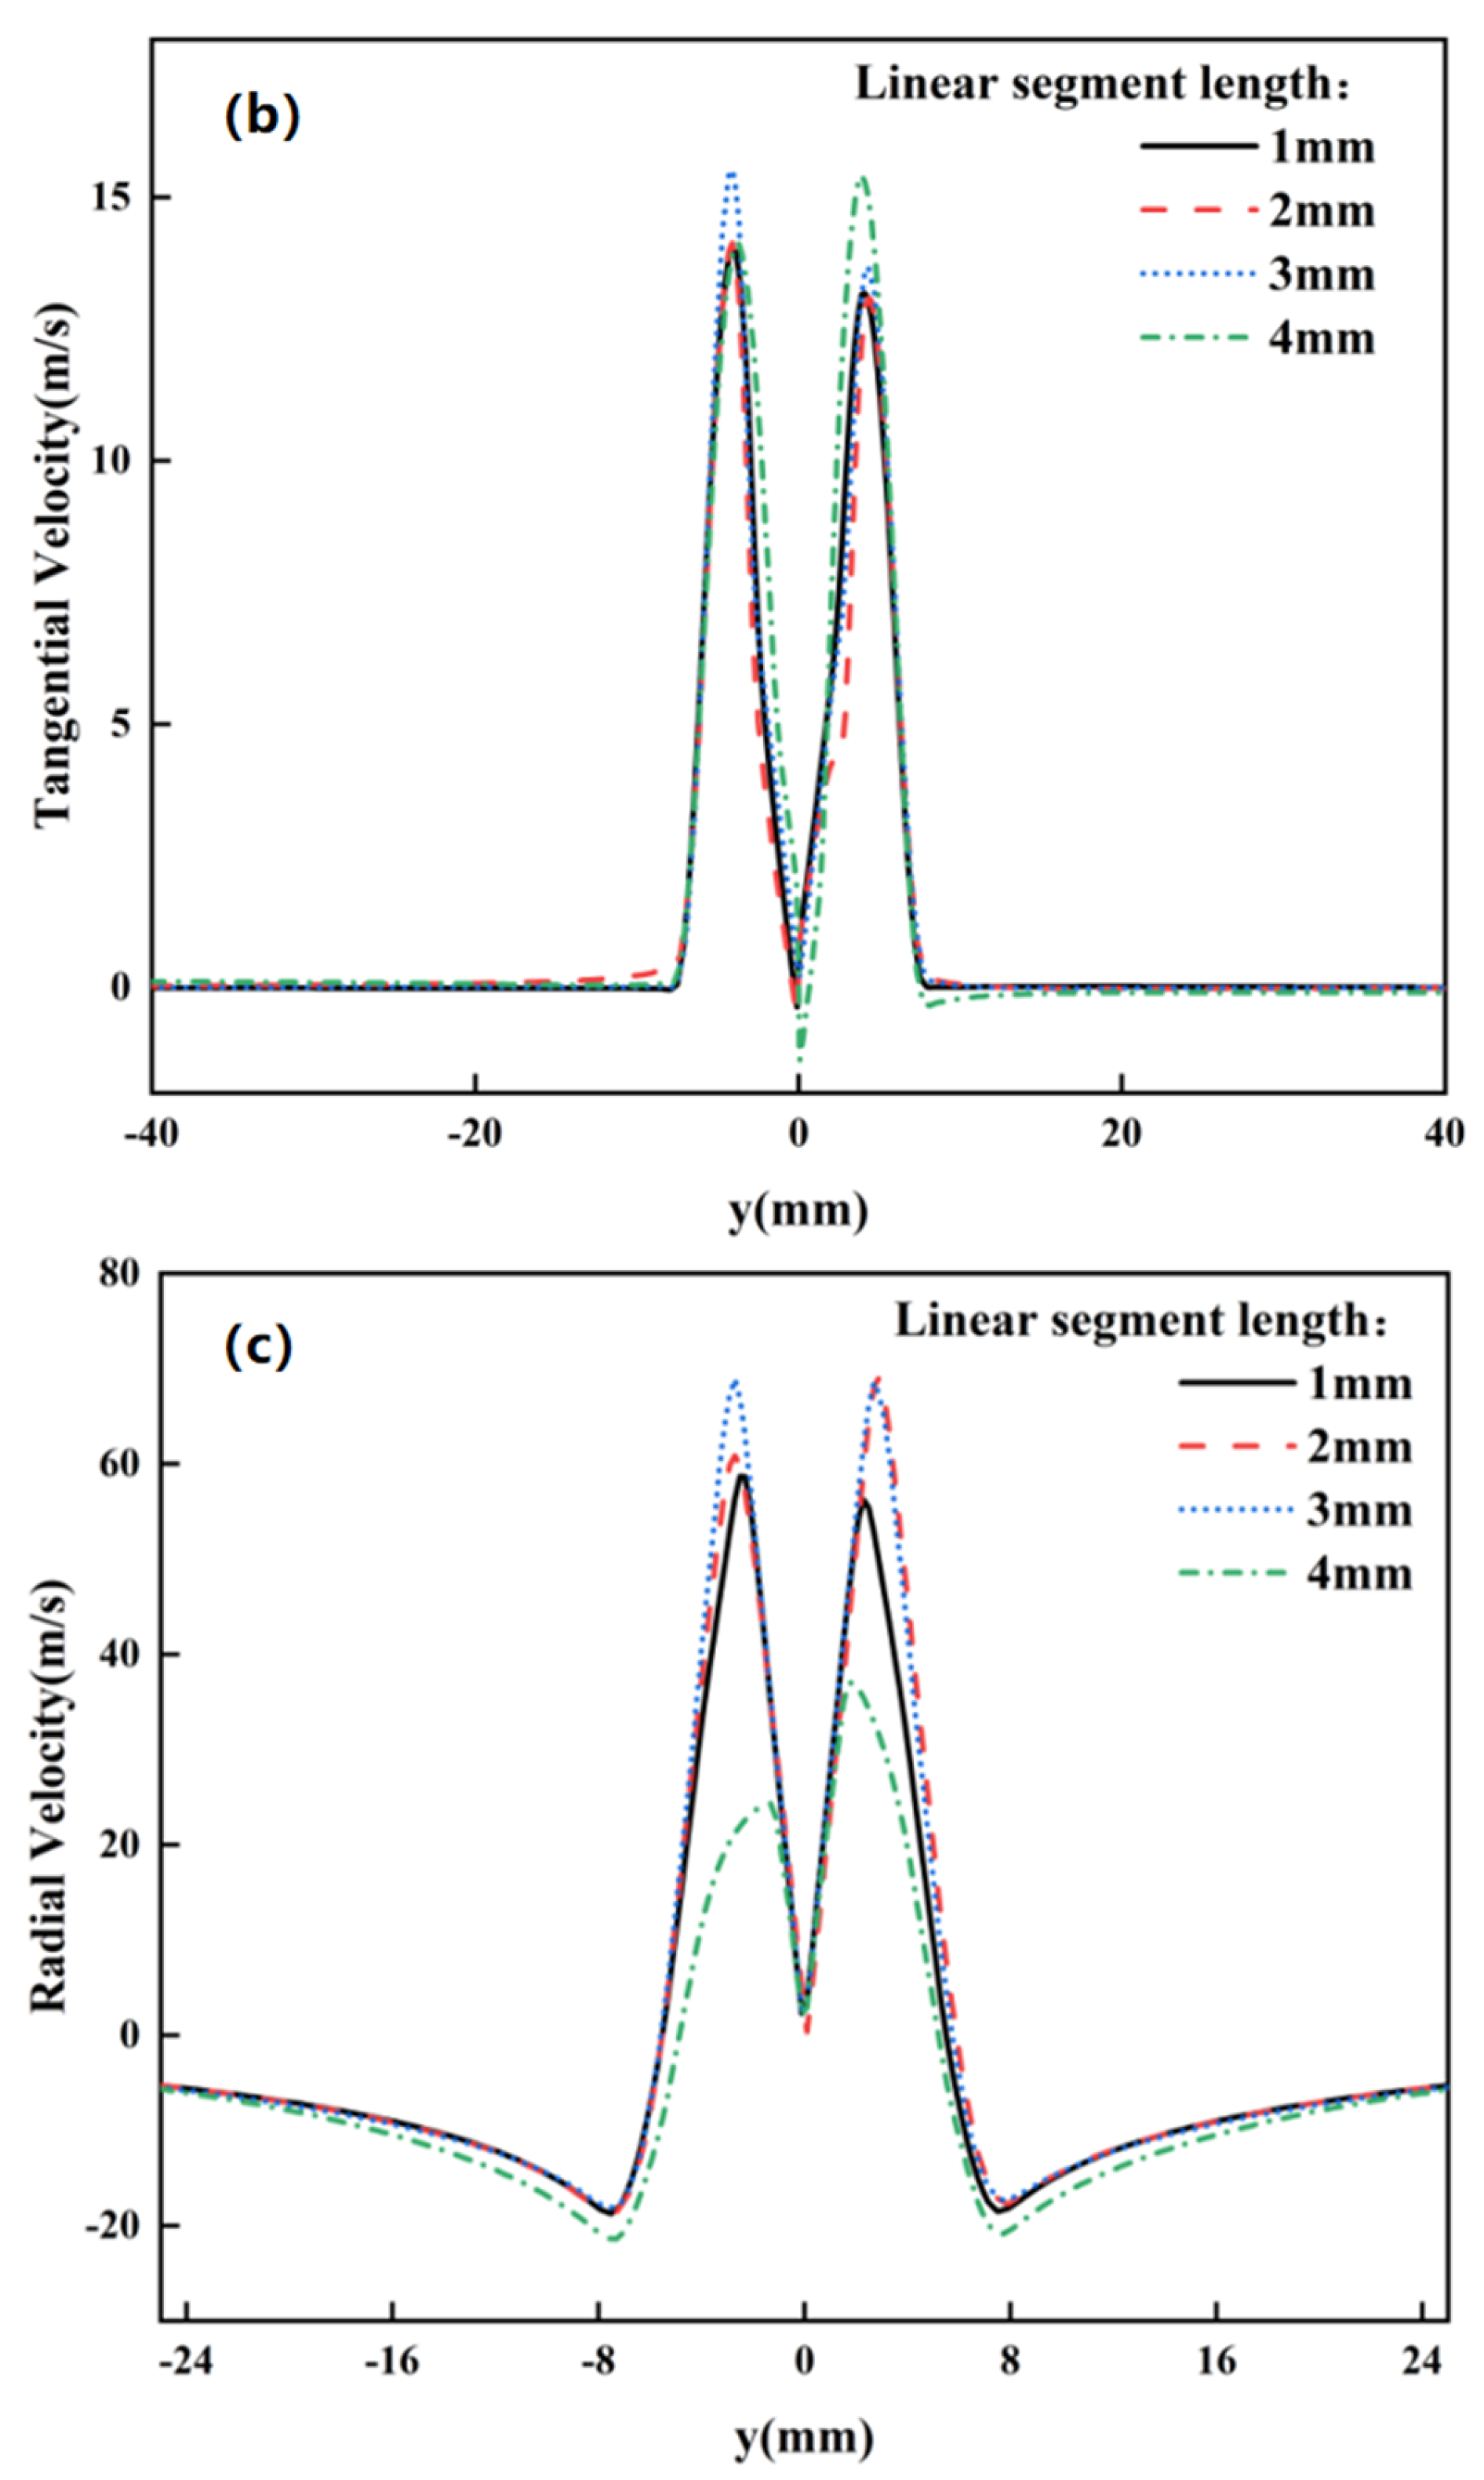
Figure 10a shows the axial velocity distribution under different linear segment lengths. The distribution pattern remains consistent across all lengths. At a linear segment length of 3 mm, the peak axial velocity reaches 508 m/s and exhibits the largest velocity profile width (approximately 28 mm). Figure 10b presents the tangential velocity distribution. The distribution pattern similarly remains consistent across lengths, with a peak tangential velocity of 15.5 m/s observed at the 3 mm length. Figure 10c displays the radial velocity distribution. The jet flow field exhibits an M-shaped distribution symmetric about the y = 0 axis. For the 3 mm linear segment length, the radial velocity peaks symmetrically at 68.9 m/s.
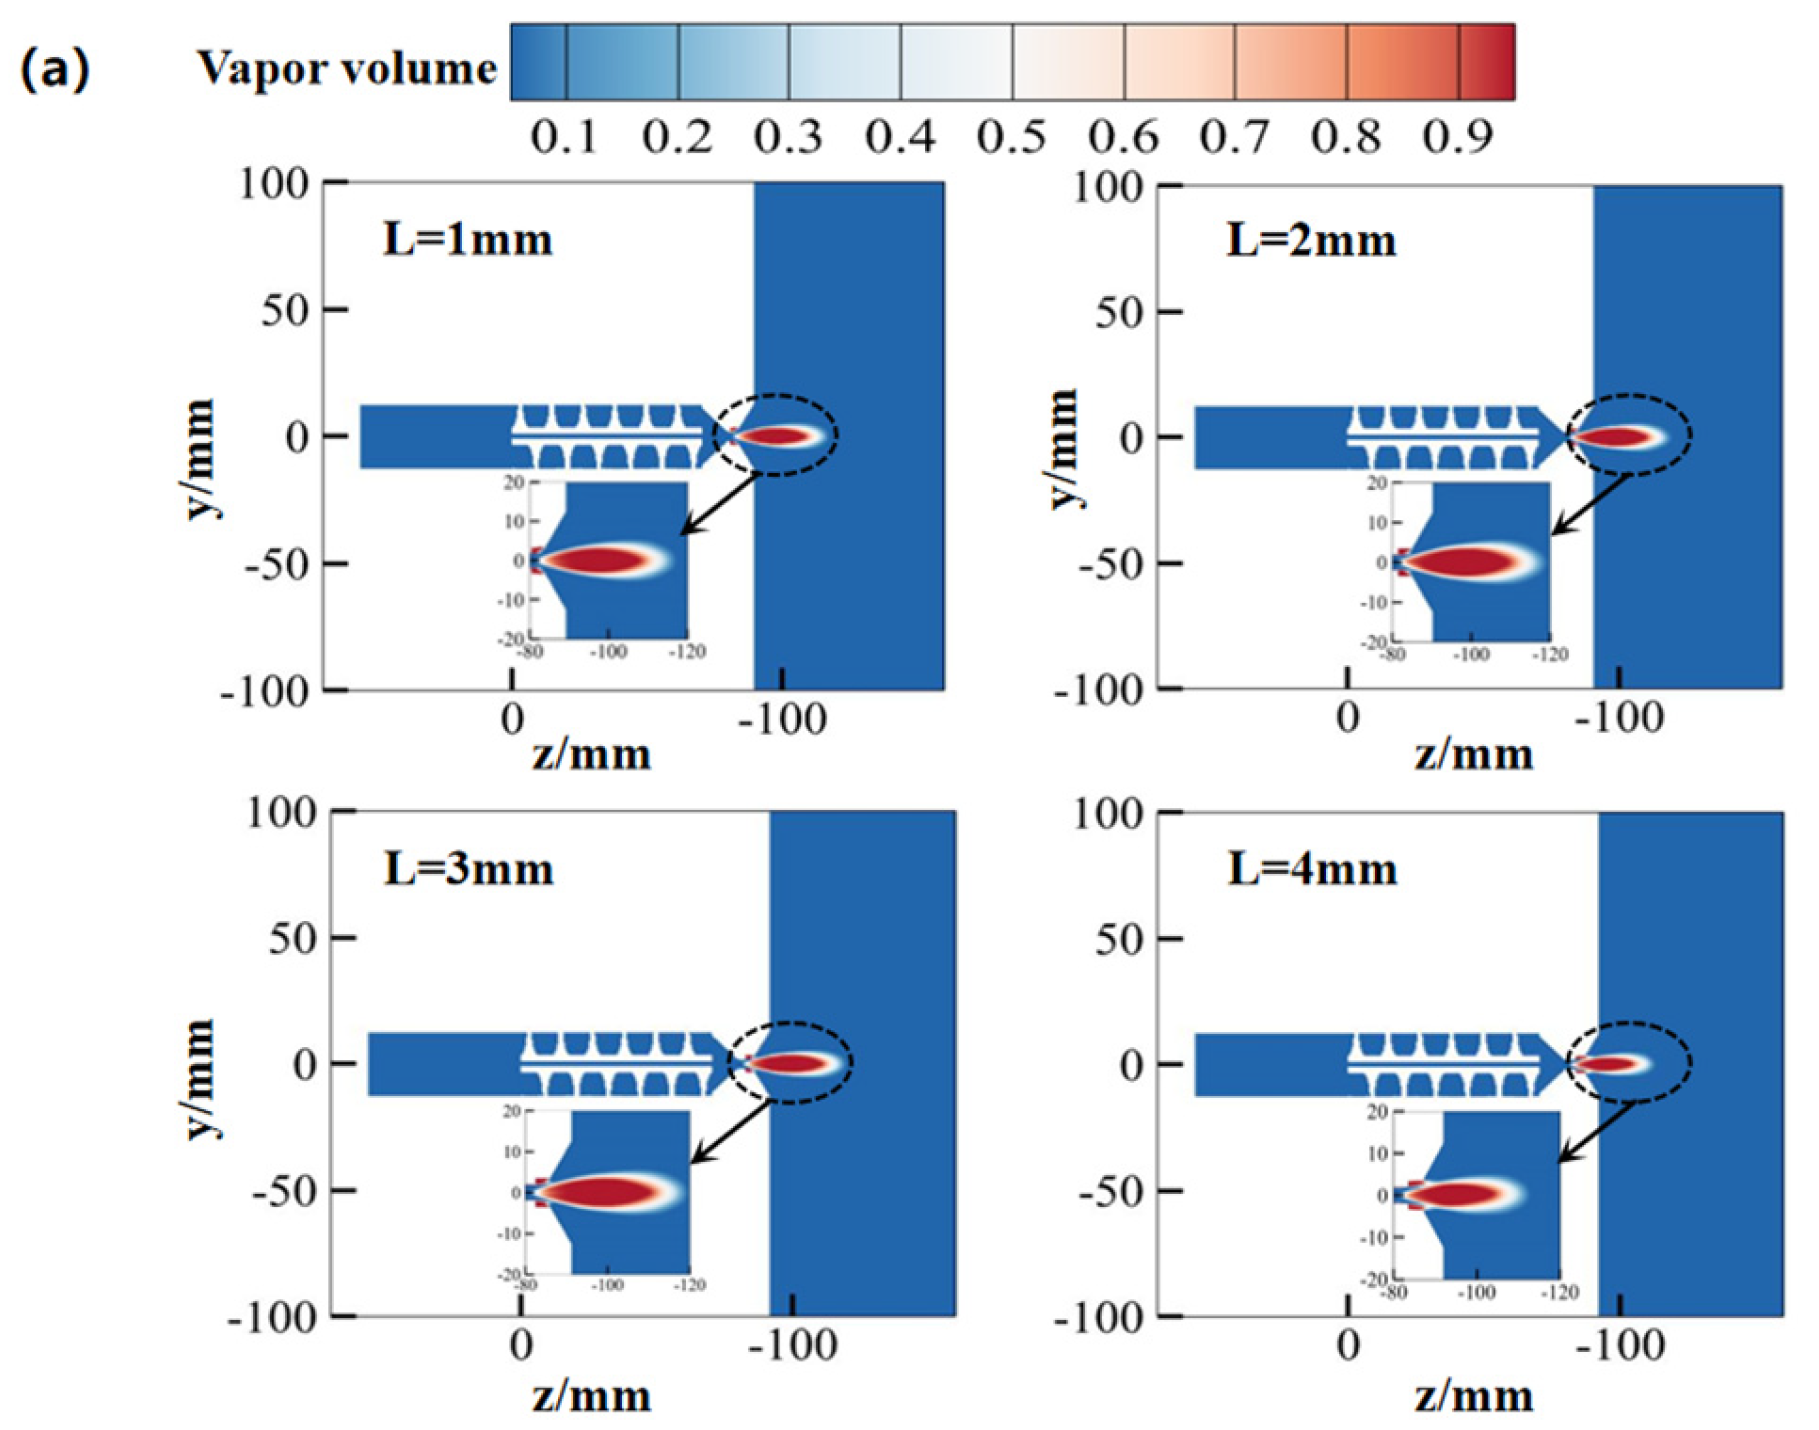
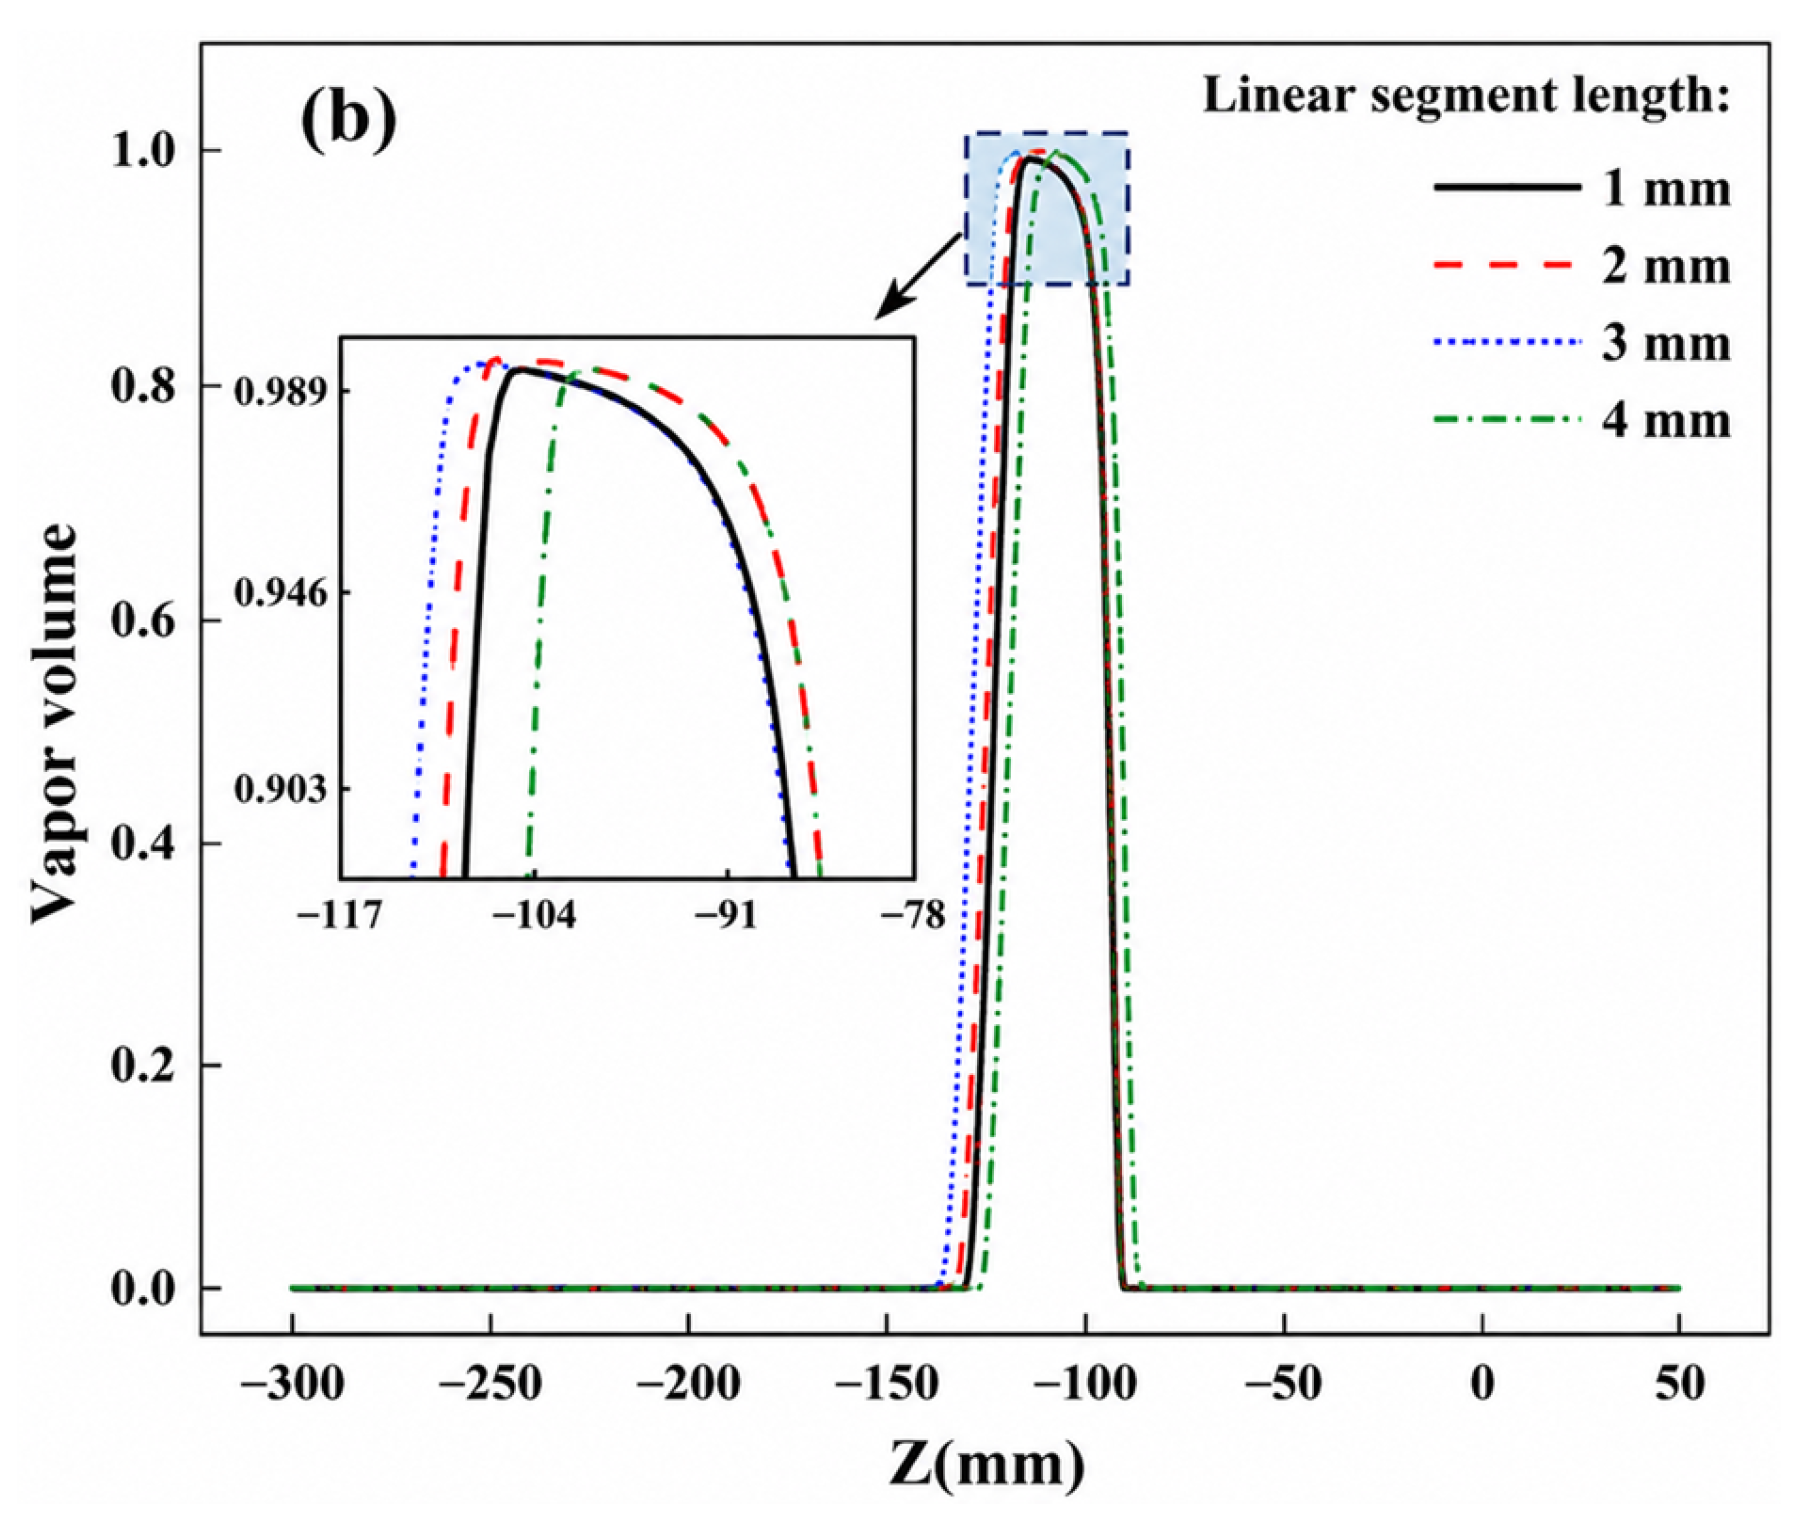
Figure 11a shows the gas-phase (cavitation cloud) distribution under different linear segment lengths. The overall distribution pattern remains similar across lengths: the cavitation inception location and distribution range are consistent, and the cavitation clouds maintain a teardrop shape approximately 30 mm long. Figure 11b shows the gas-phase volume fraction along the tool’s axis. The volume fraction increases to a peak, then decreases downstream. At the axial location 30 mm downstream, the peak gas-phase volume fraction occurs. For the 3 mm linear segment length, this peak fraction is slightly higher than for other lengths, though the increase is marginal.
Considering the combined performance in three-dimensional velocity and cavitation effect, the 3 mm linear segment length was selected as the optimal design.

3.1.2. Impact of the Impeller Rotation Angle

In order to investigate the effect of different impeller rotation angles on the flow field of the unblocking tool jet, the impeller rotation angle θ is taken as 180°~720° for calculation, and other structural parameters are shown in Table 1. The inlet velocity of the model is 10 m/s, and the outlet circumferential pressure is 0.5 MPa.
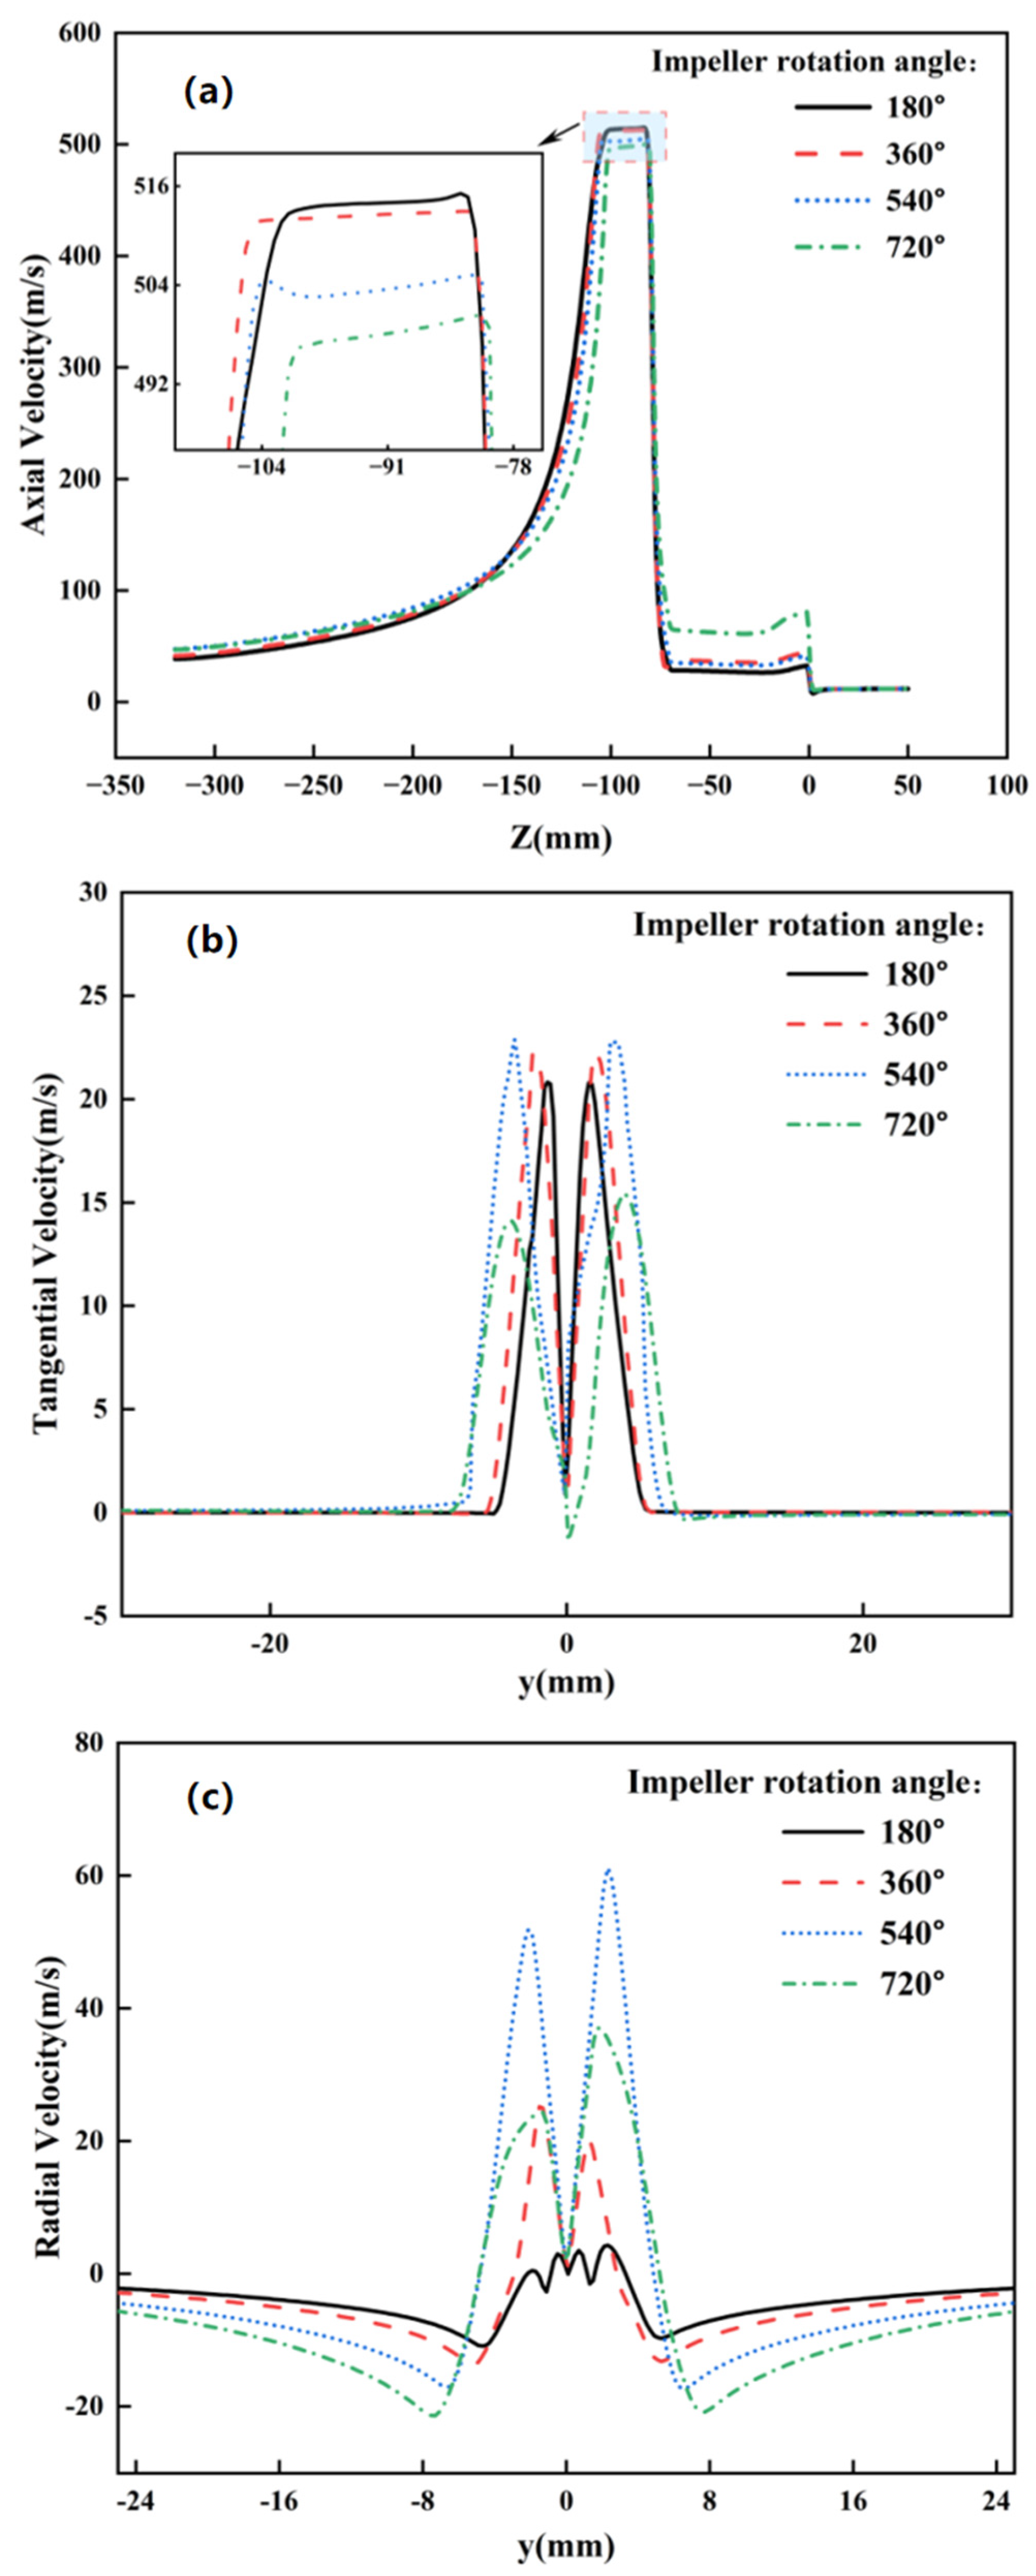
Figure 12a shows axial velocity distributions at different impeller rotation angles. Increasing rotation angle reduces peak axial velocity: 515 m/s at 180° versus a lower value at 360°, where the velocity profile reaches its maximum width of approximately 27 mm. Figure 12b displays tangential velocity distributions. Both peak tangential velocity at 22 m/s and maximum profile width occur at 540° rotation. Figure 12c presents radial velocity distributions. Performance is superior at 540° rotation: peak velocity triples the 360° value while maintaining maximum profile width.
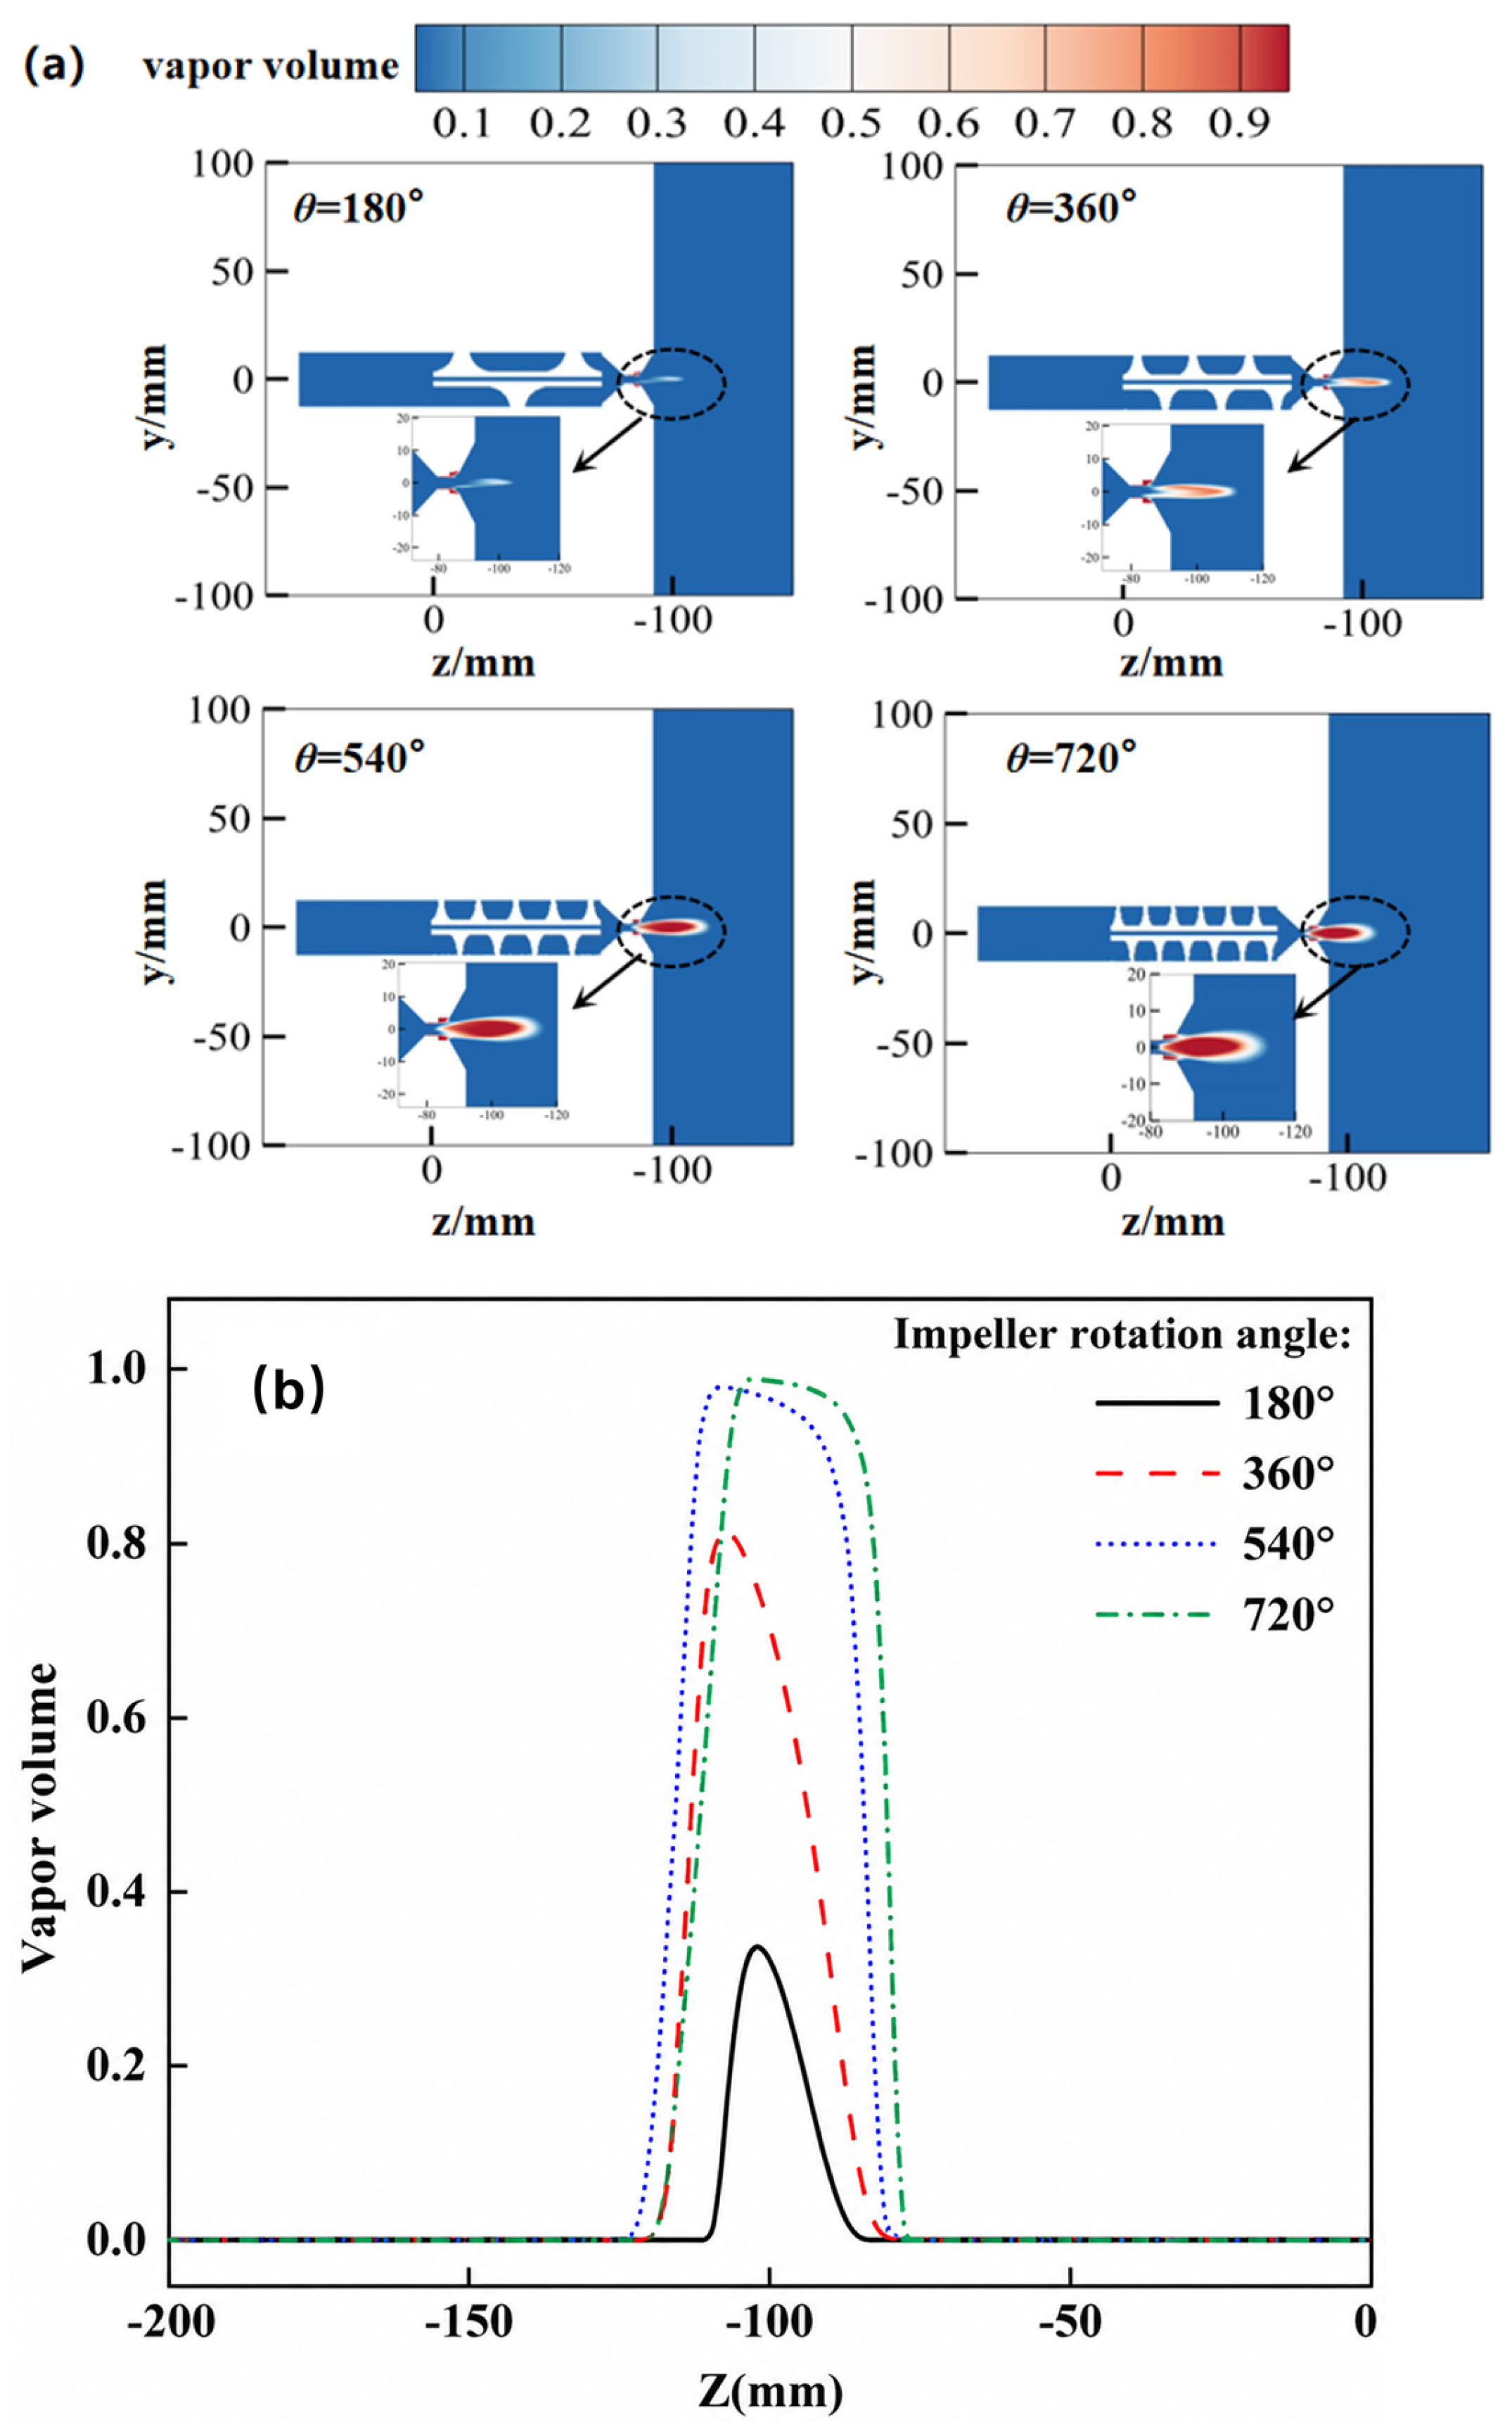
Figure 13a shows the gas-phase distribution cloud of the flow field under different impeller rotation angles. As shown in the figure, the change in the impeller rotation angle has a greater influence on the distribution pattern of the gas phase in the flow field. At rotation angles of 180° and 360°, the gas-phase volume fraction is lower, and the shape of the cavitation cloud does not become droplet-like. At rotation angles of 540° and 720°, the gas-phase volume fraction is larger, and the peak value of the gas-phase volume fraction is slightly higher at 720°. Figure 13b shows the distribution of gas-phase volume fraction along the axial line under different impeller rotation angles. From this, it can be seen that the larger the impeller rotation angle is, the stronger the cavitation inception capability of the tool is. However, when the rotation angle exceeds 540°, this effect becomes smaller.
Comprehensive consideration of the unblocking tool descaling requires larger tangential and radial velocities; the tangential velocity produces circumferential shear force on the scale, enhancing the tool’s effect on scale deposition at the tubing inner wall, while the radial velocity increases the tool’s flushing area. Thus, an impeller rotation angle of 540° was selected as the optimization result. The underlying physical mechanism for the 540° optimum can be explained as follows. As the impeller rotation angle increases, the fluid gains higher tangential momentum, which enhances vortex generation and promotes cavitation inception. However, beyond 540°, the excessive swirling motion creates a stronger centrifugal effect that forces the jet to spread more rapidly in the radial direction, leading to greater energy dissipation and a consequent reduction in axial momentum. This trade-off between tangential enhancement and axial decay means that 540° represents the optimal balance: it provides sufficient tangential velocity for shear-induced scale removal while maintaining an adequate axial impact pressure for effective erosion. Lower angles (180–360°) do not generate enough tangential momentum to produce strong cavitation and shear effects, whereas higher angles (720°) cause excessive radial spreading that dissipates jet energy too quickly.

3.1.3. Impact of the Impeller Thickness

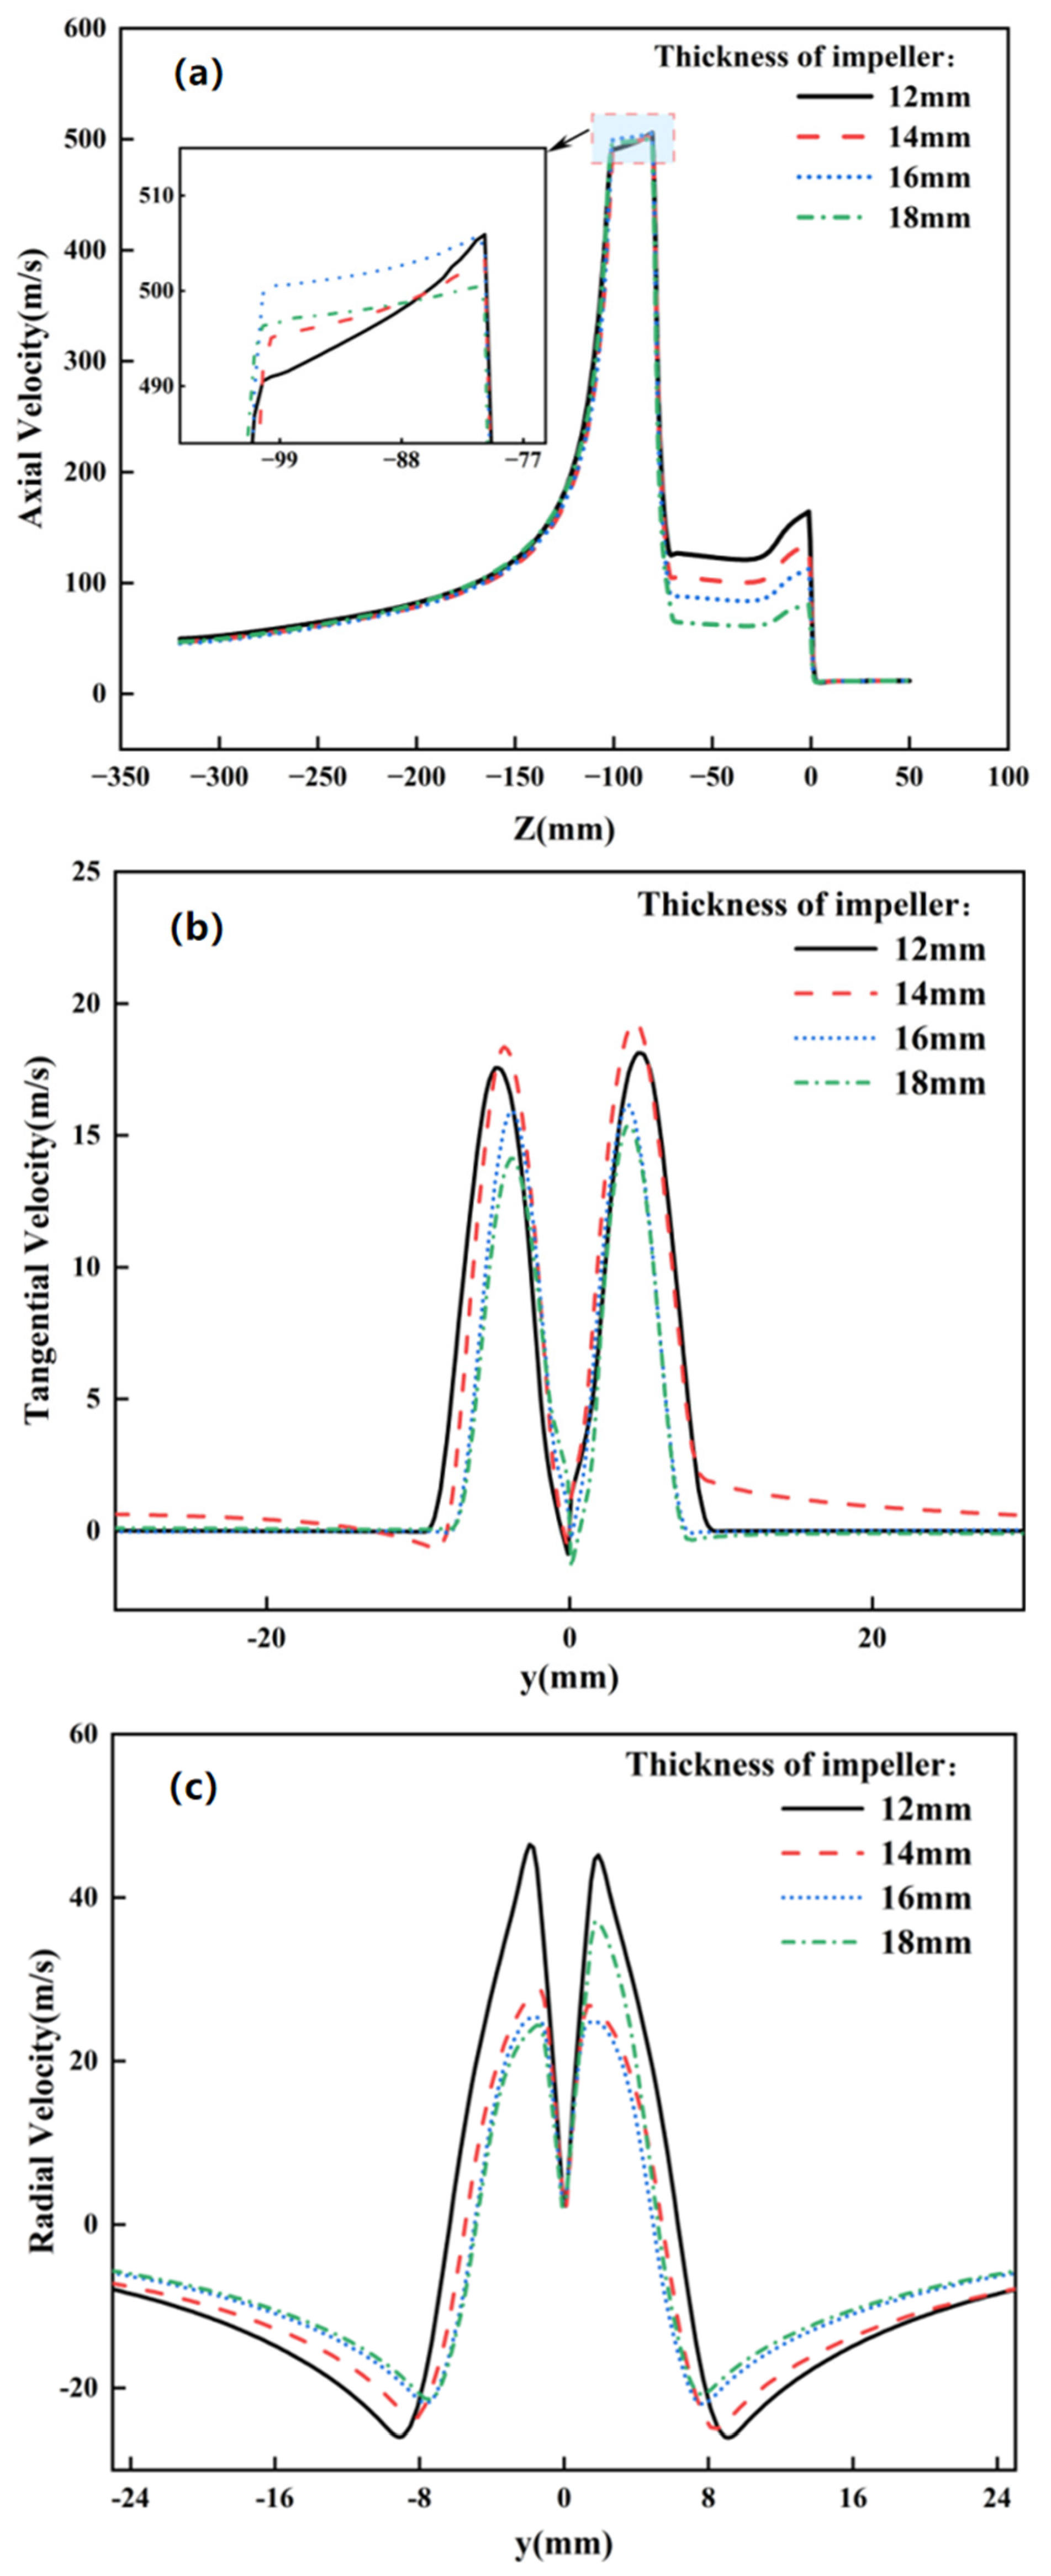
In order to investigate the effect of different impeller thicknesses on the flow field of the unblocking tool jet, the impeller thickness δ is taken as 12~18 mm for calculation, and other structural parameters are shown in Table 1. The inlet velocity of the model is 10 m/s, and the outlet circumferential pressure is 0.5 MPa.
Figure 14a shows axial velocity distributions under different impeller thicknesses. At 12 mm and 16 mm thicknesses, axial velocity shares the same peak value. However, at 12 mm thickness, velocity decreases more rapidly—dropping from 505 m/s to 491 m/s within the z-axis range −100~−110 mm. Figure 14b shows tangential velocity distributions. Smaller impeller thicknesses yield greater peak tangential velocities, with 12 mm and 14 mm maintaining the largest peaks. Figure 14c shows radial velocity distributions. At 12 mm thickness, peak radial velocity reaches 45 m/s—significantly higher than other thicknesses—while maintaining the M-shaped profile symmetric about y = 0.
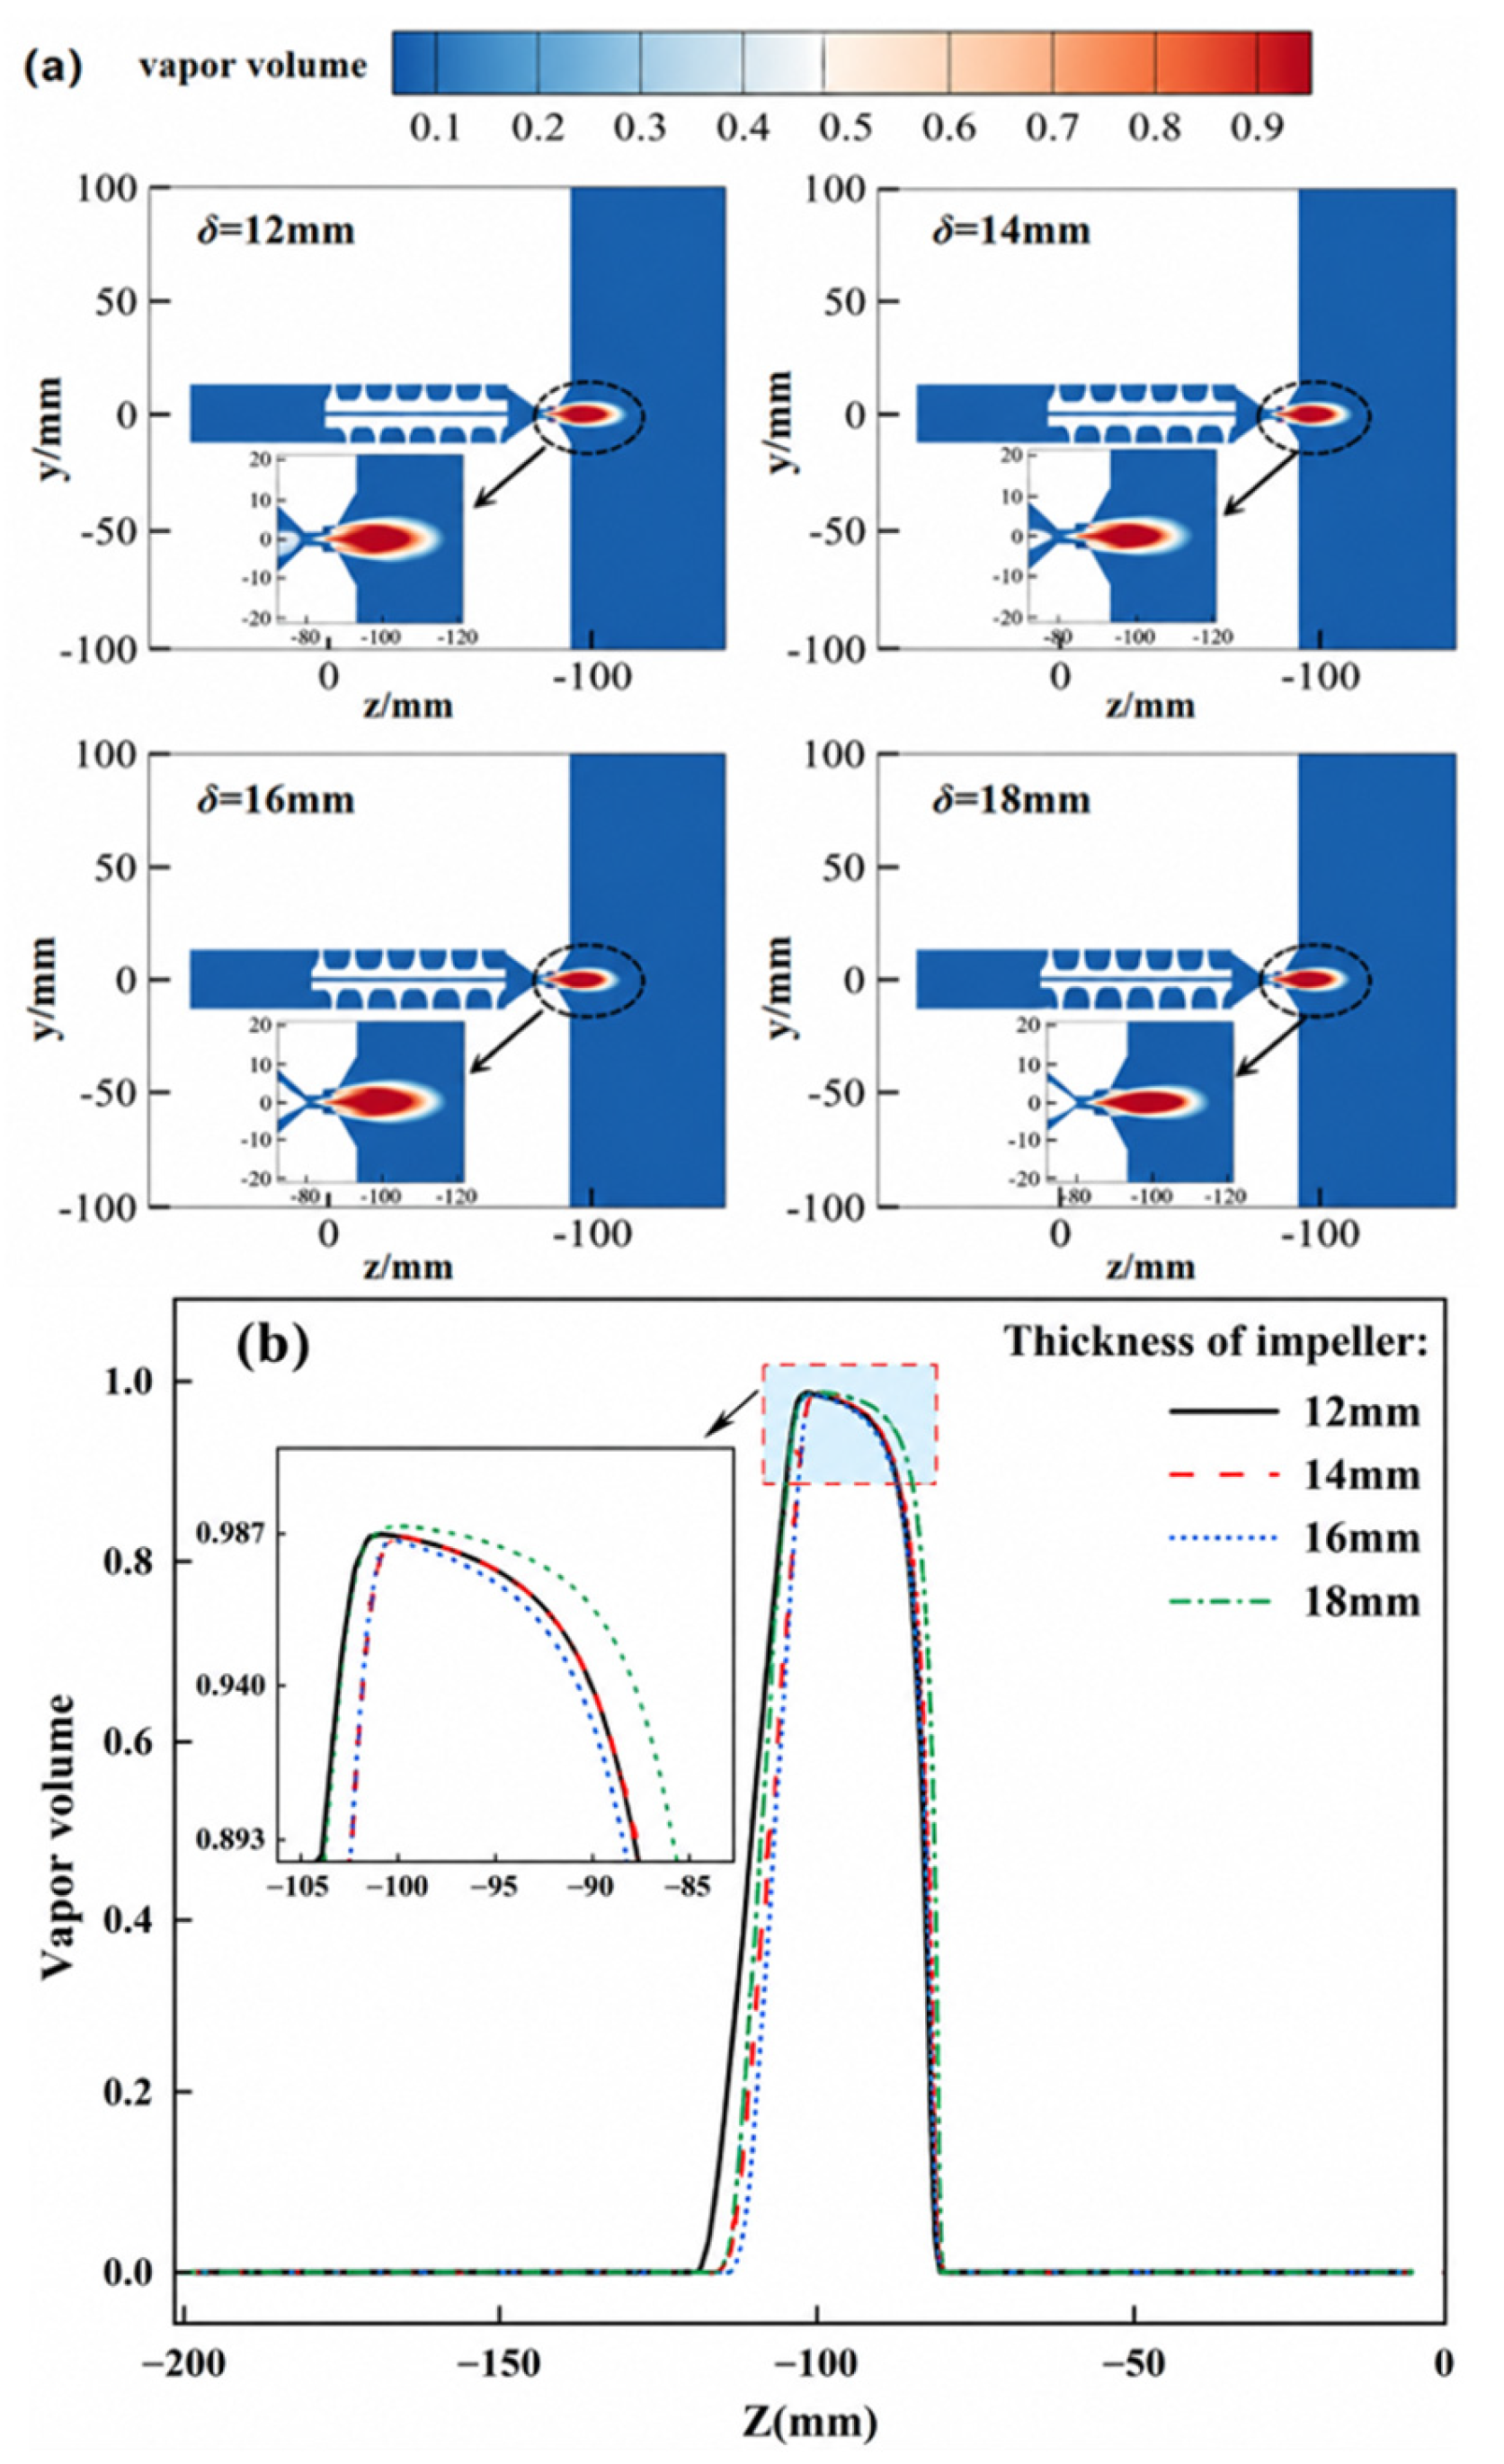
Figure 15 shows the distribution of gas-phase volume fraction under different impeller thicknesses. From the figure, it can be seen that the impeller thickness has less influence on the tool cavitation priming ability and cavitation position. Only small differences exist between the peak value and the contour. After comprehensive consideration, the impeller thickness of 12 mm is selected as the optimized result.
In summary, the optimization results are the length of the linear segment is 3 mm, the impeller rotation angle is 540°, and the thickness of the impeller is 12 mm.
It should be noted that a one-factor-at-a-time (OFAT) scanning approach was adopted in this parametric study to identify the dominant structural parameters and understand their individual effects on the flow field and cavitation performance. While a full factorial design or response surface methodology (RSM) would provide more comprehensive interaction analysis, the OFAT method is considered adequate for the initial parameter screening and mechanistic understanding pursued in this work. Future work will adopt multi-parameter optimization approaches to further refine the design.

3.2. Numerical Simulation of the Jet Flow Field of the SSIJ Tool

For the comparative analysis of the flow field characteristics of the SSIJ tool and the CDJ nozzle, the length of the straight section was set to the optimized value (3 mm), the impeller rotation angle was set to the optimized value (540°), and the thickness of the impeller was 12 mm. the inlet velocity of the two nozzle models was 10 m/s, and the outlet peripheral pressure was 0.5 MPa.

3.2.1. Comparison of Jet Flow Field Characteristics

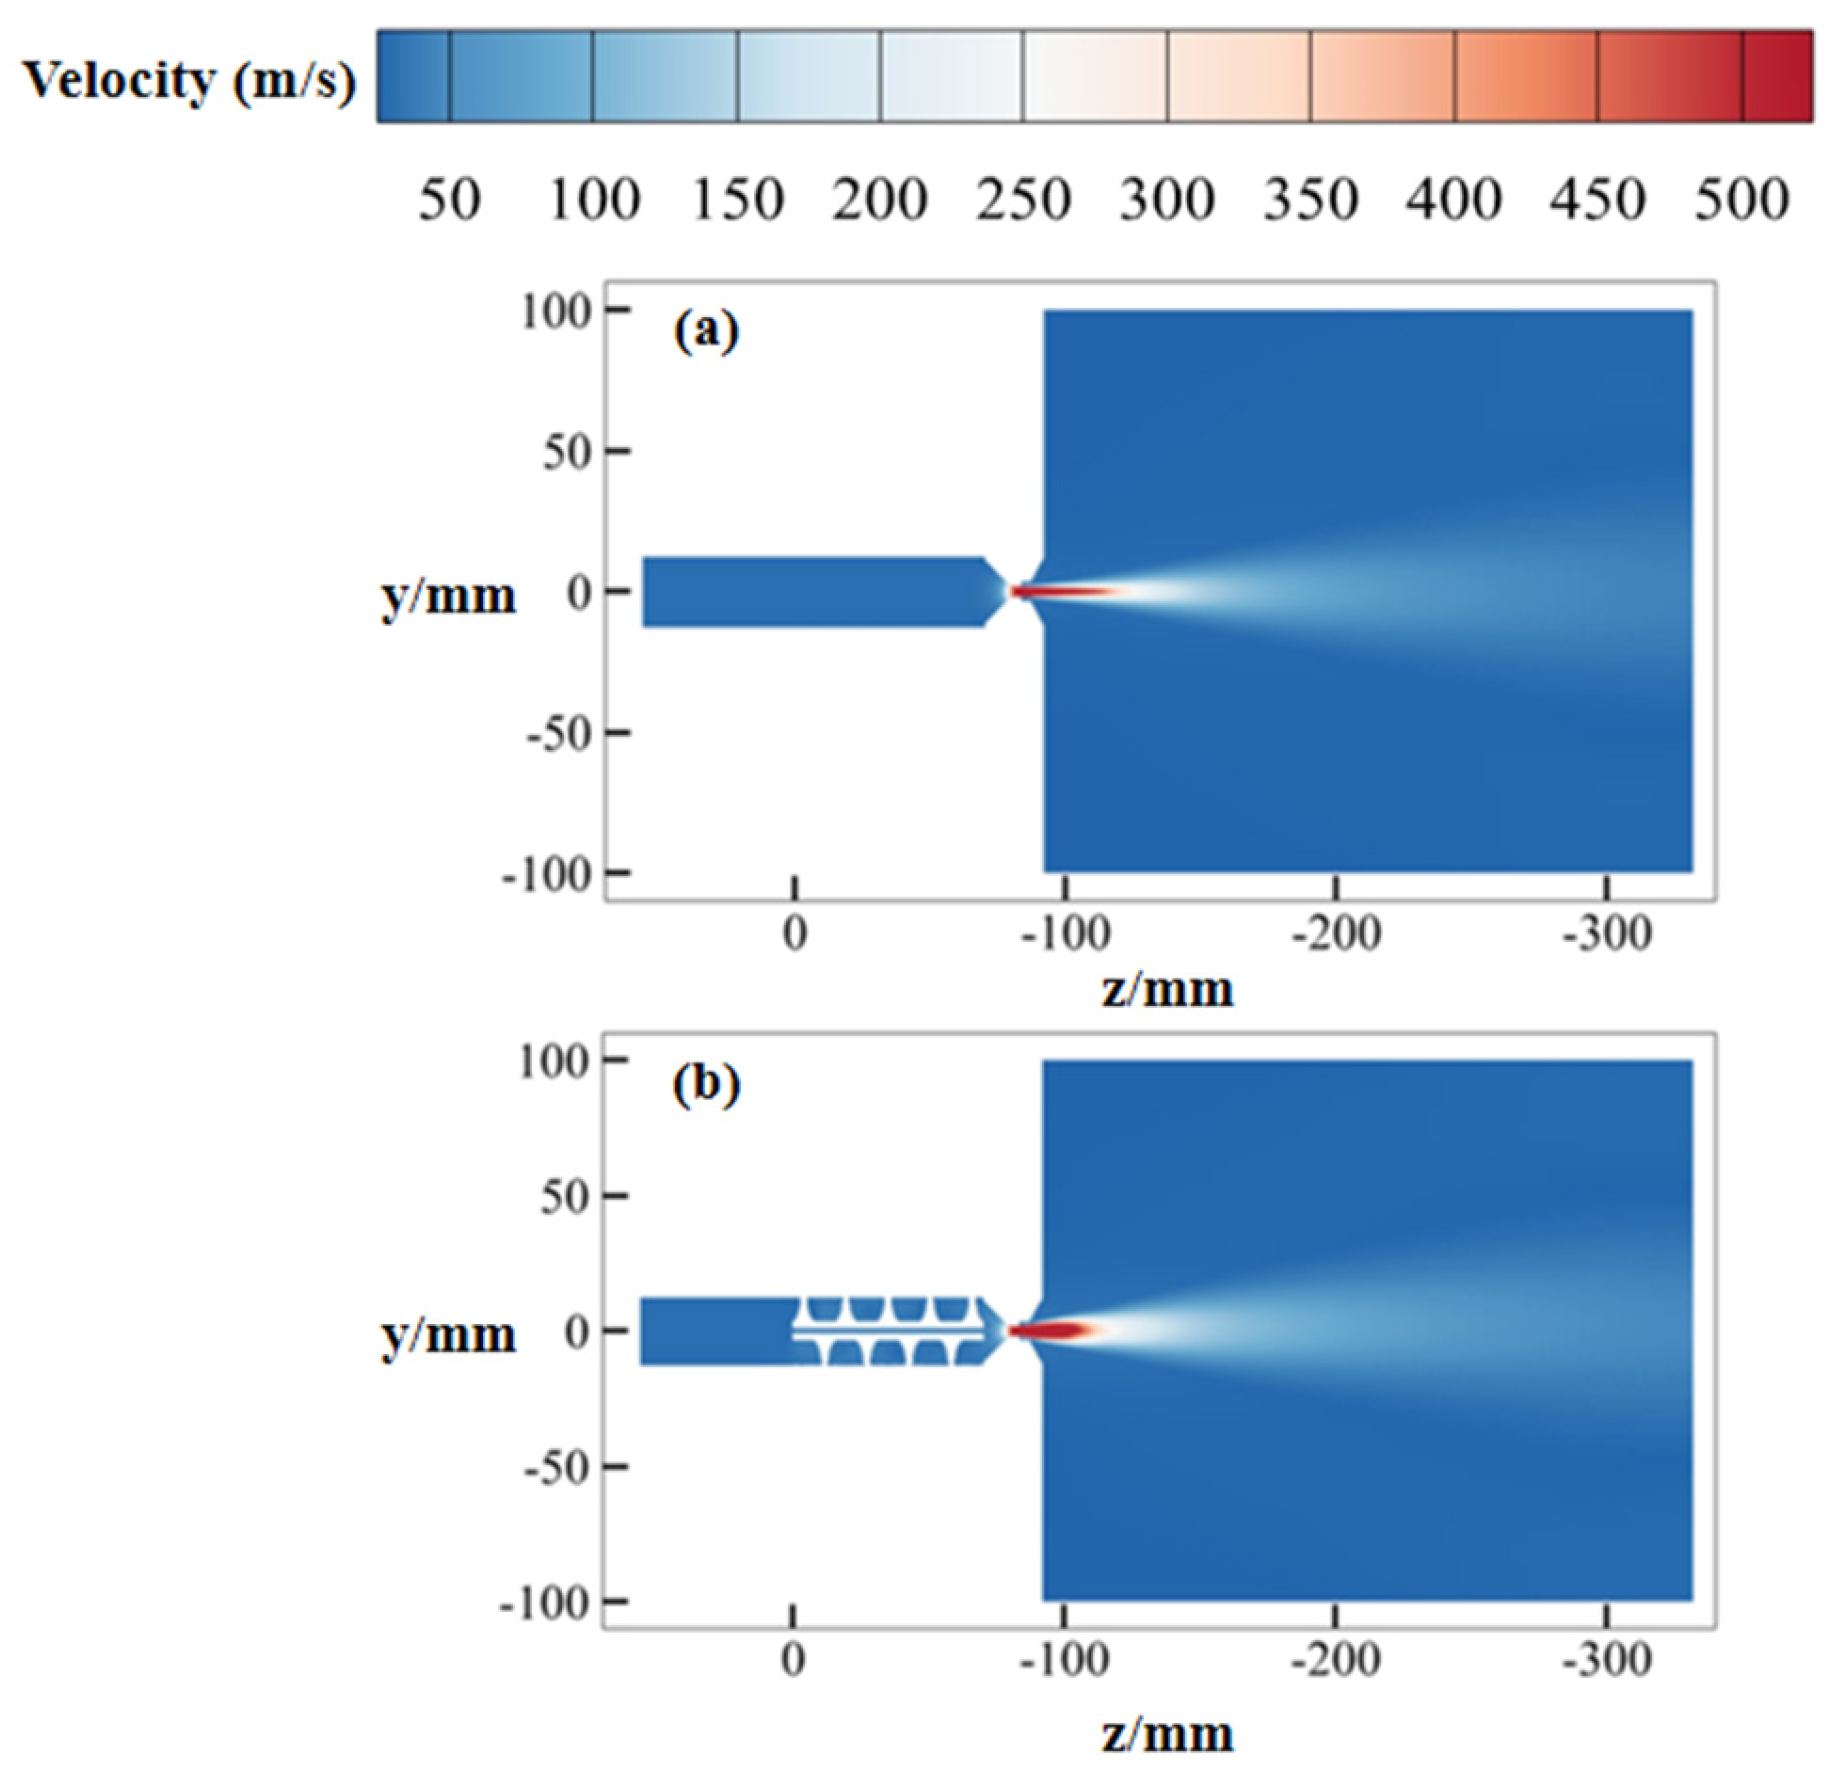
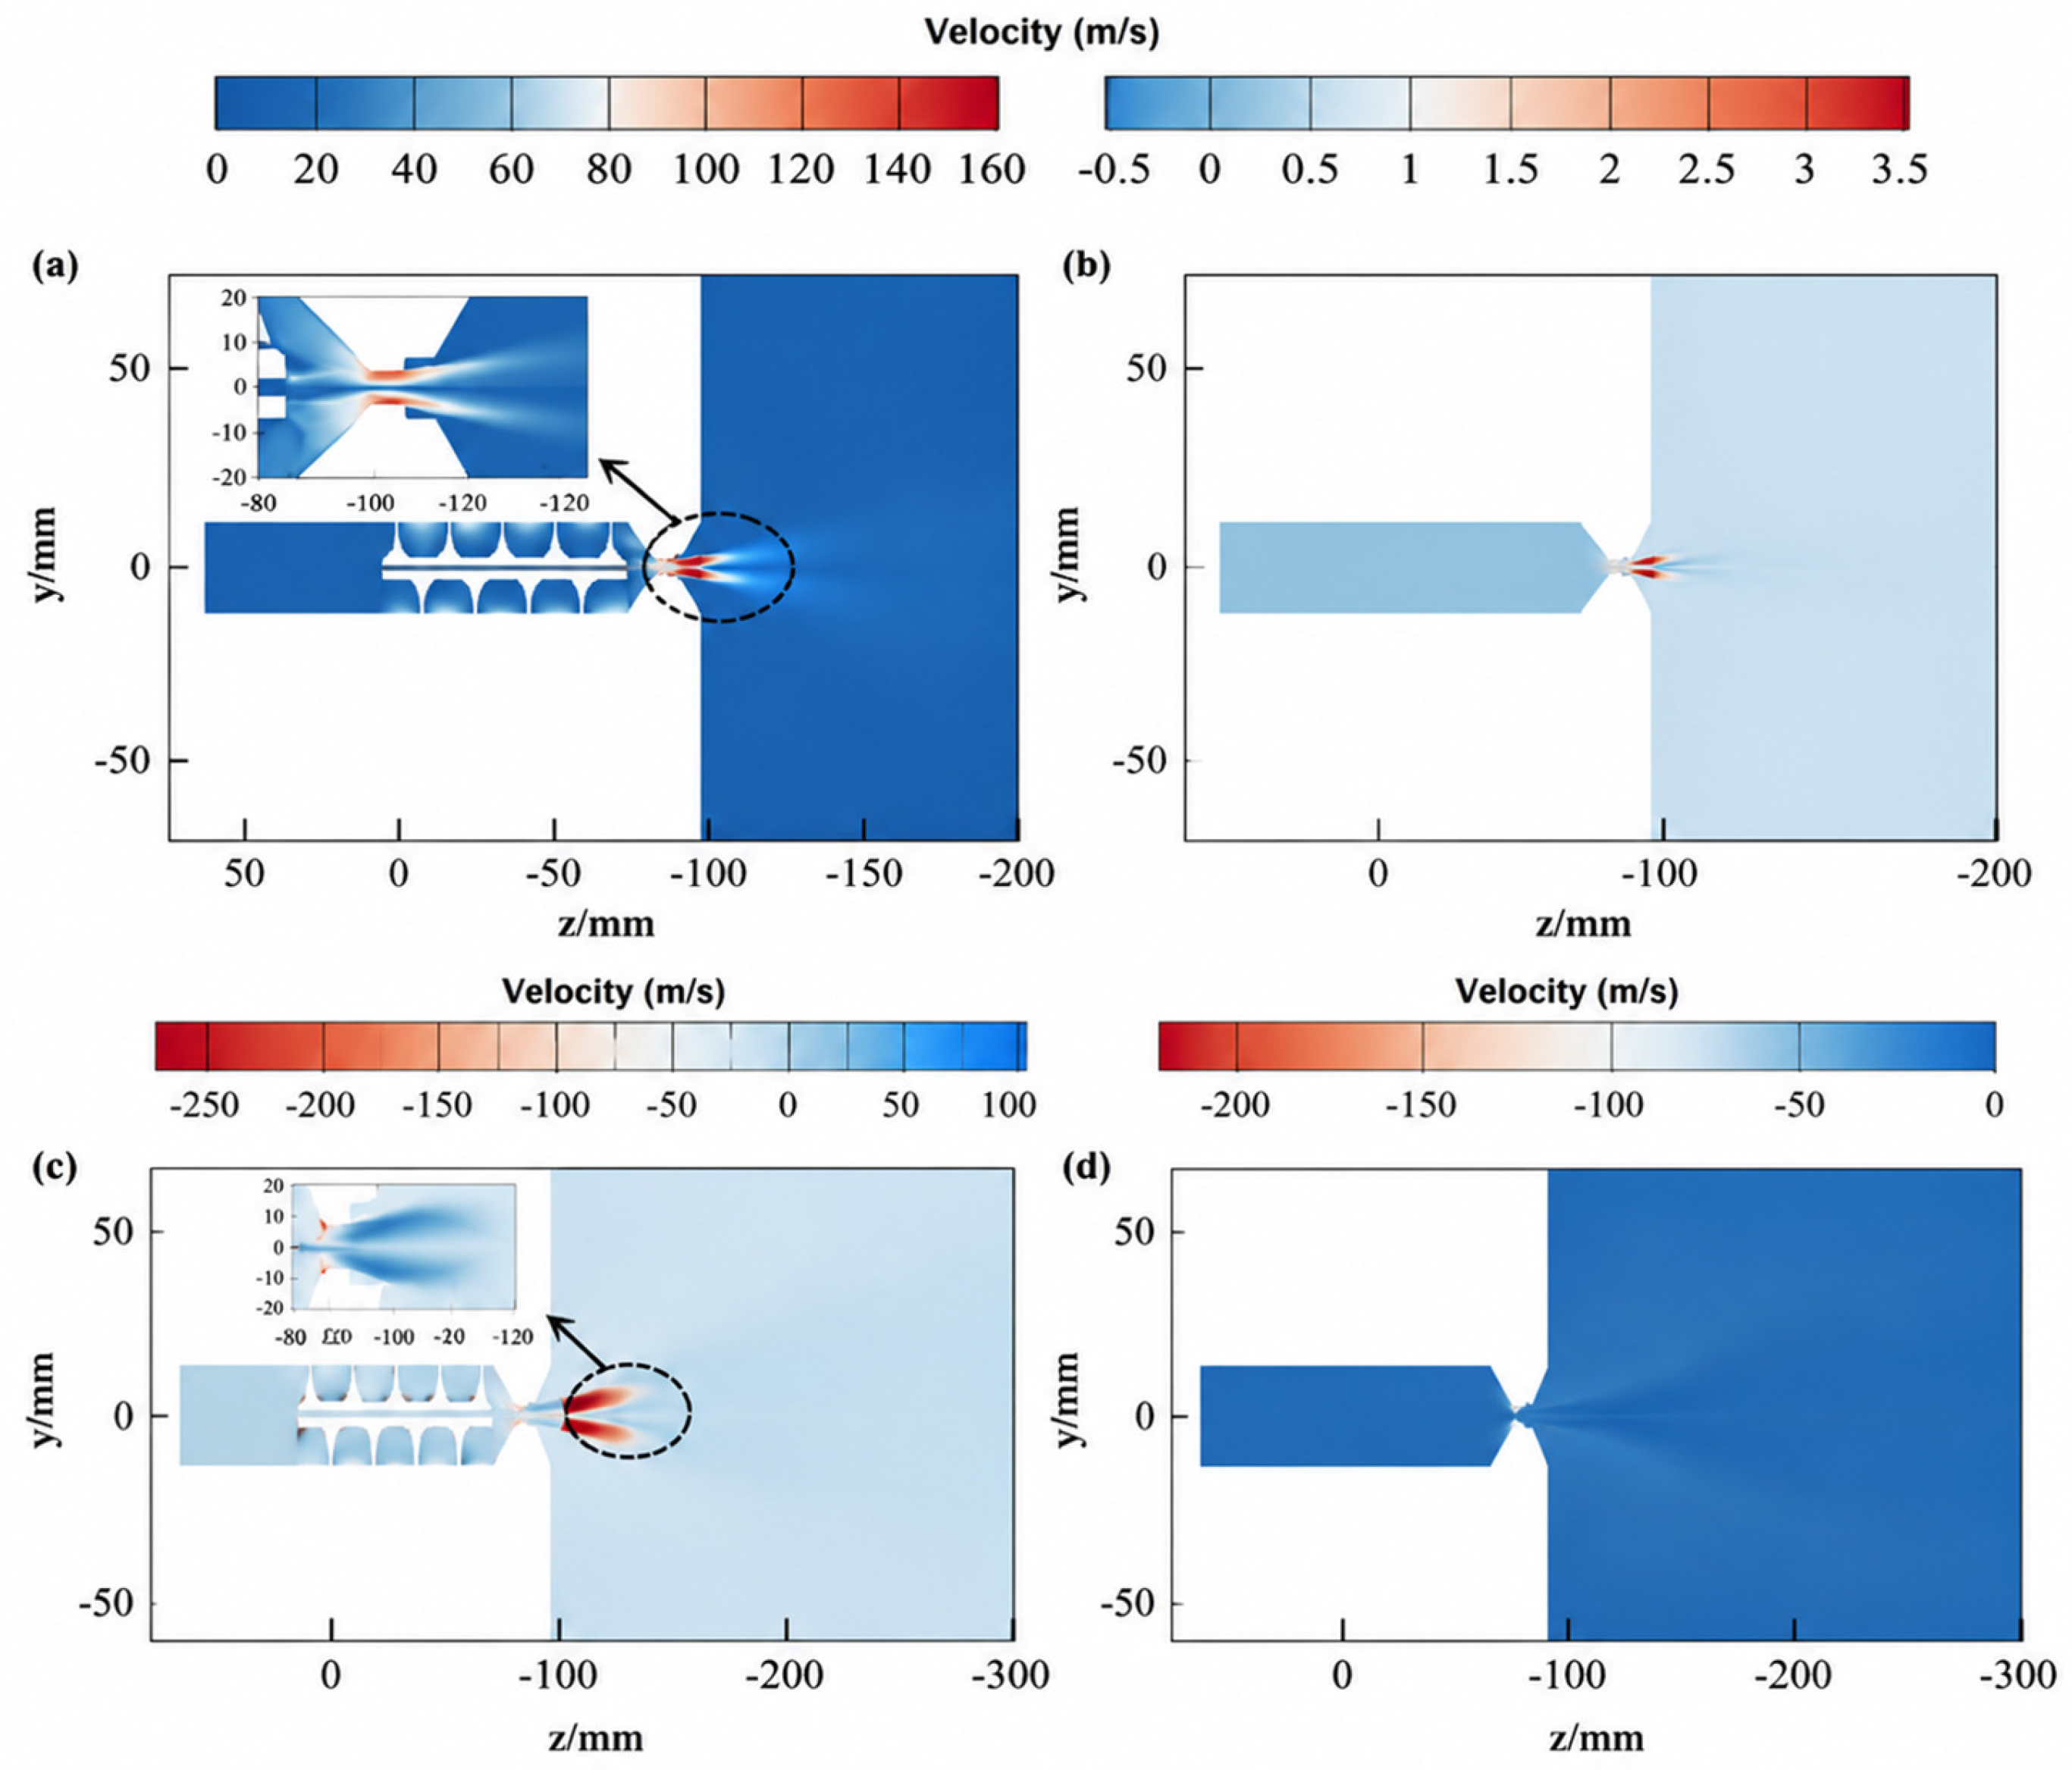
Figure 16 shows axial velocity contours for (a) the converging-diverging jet nozzle and (b) the unblocking tool. Both nozzle structures accelerate flow through the nozzle throat and discharge symmetrically along the centerline after the diffusion section. However, the SSIJ tool exhibits greater jet variability: its flow field expands radially (y-direction) in the diffusion section, with axial velocity decreasing as standoff distance increases, ultimately concentrating near the centerline. In contrast, the CDJ nozzle maintains a more stable jet structure with tighter velocity concentration.
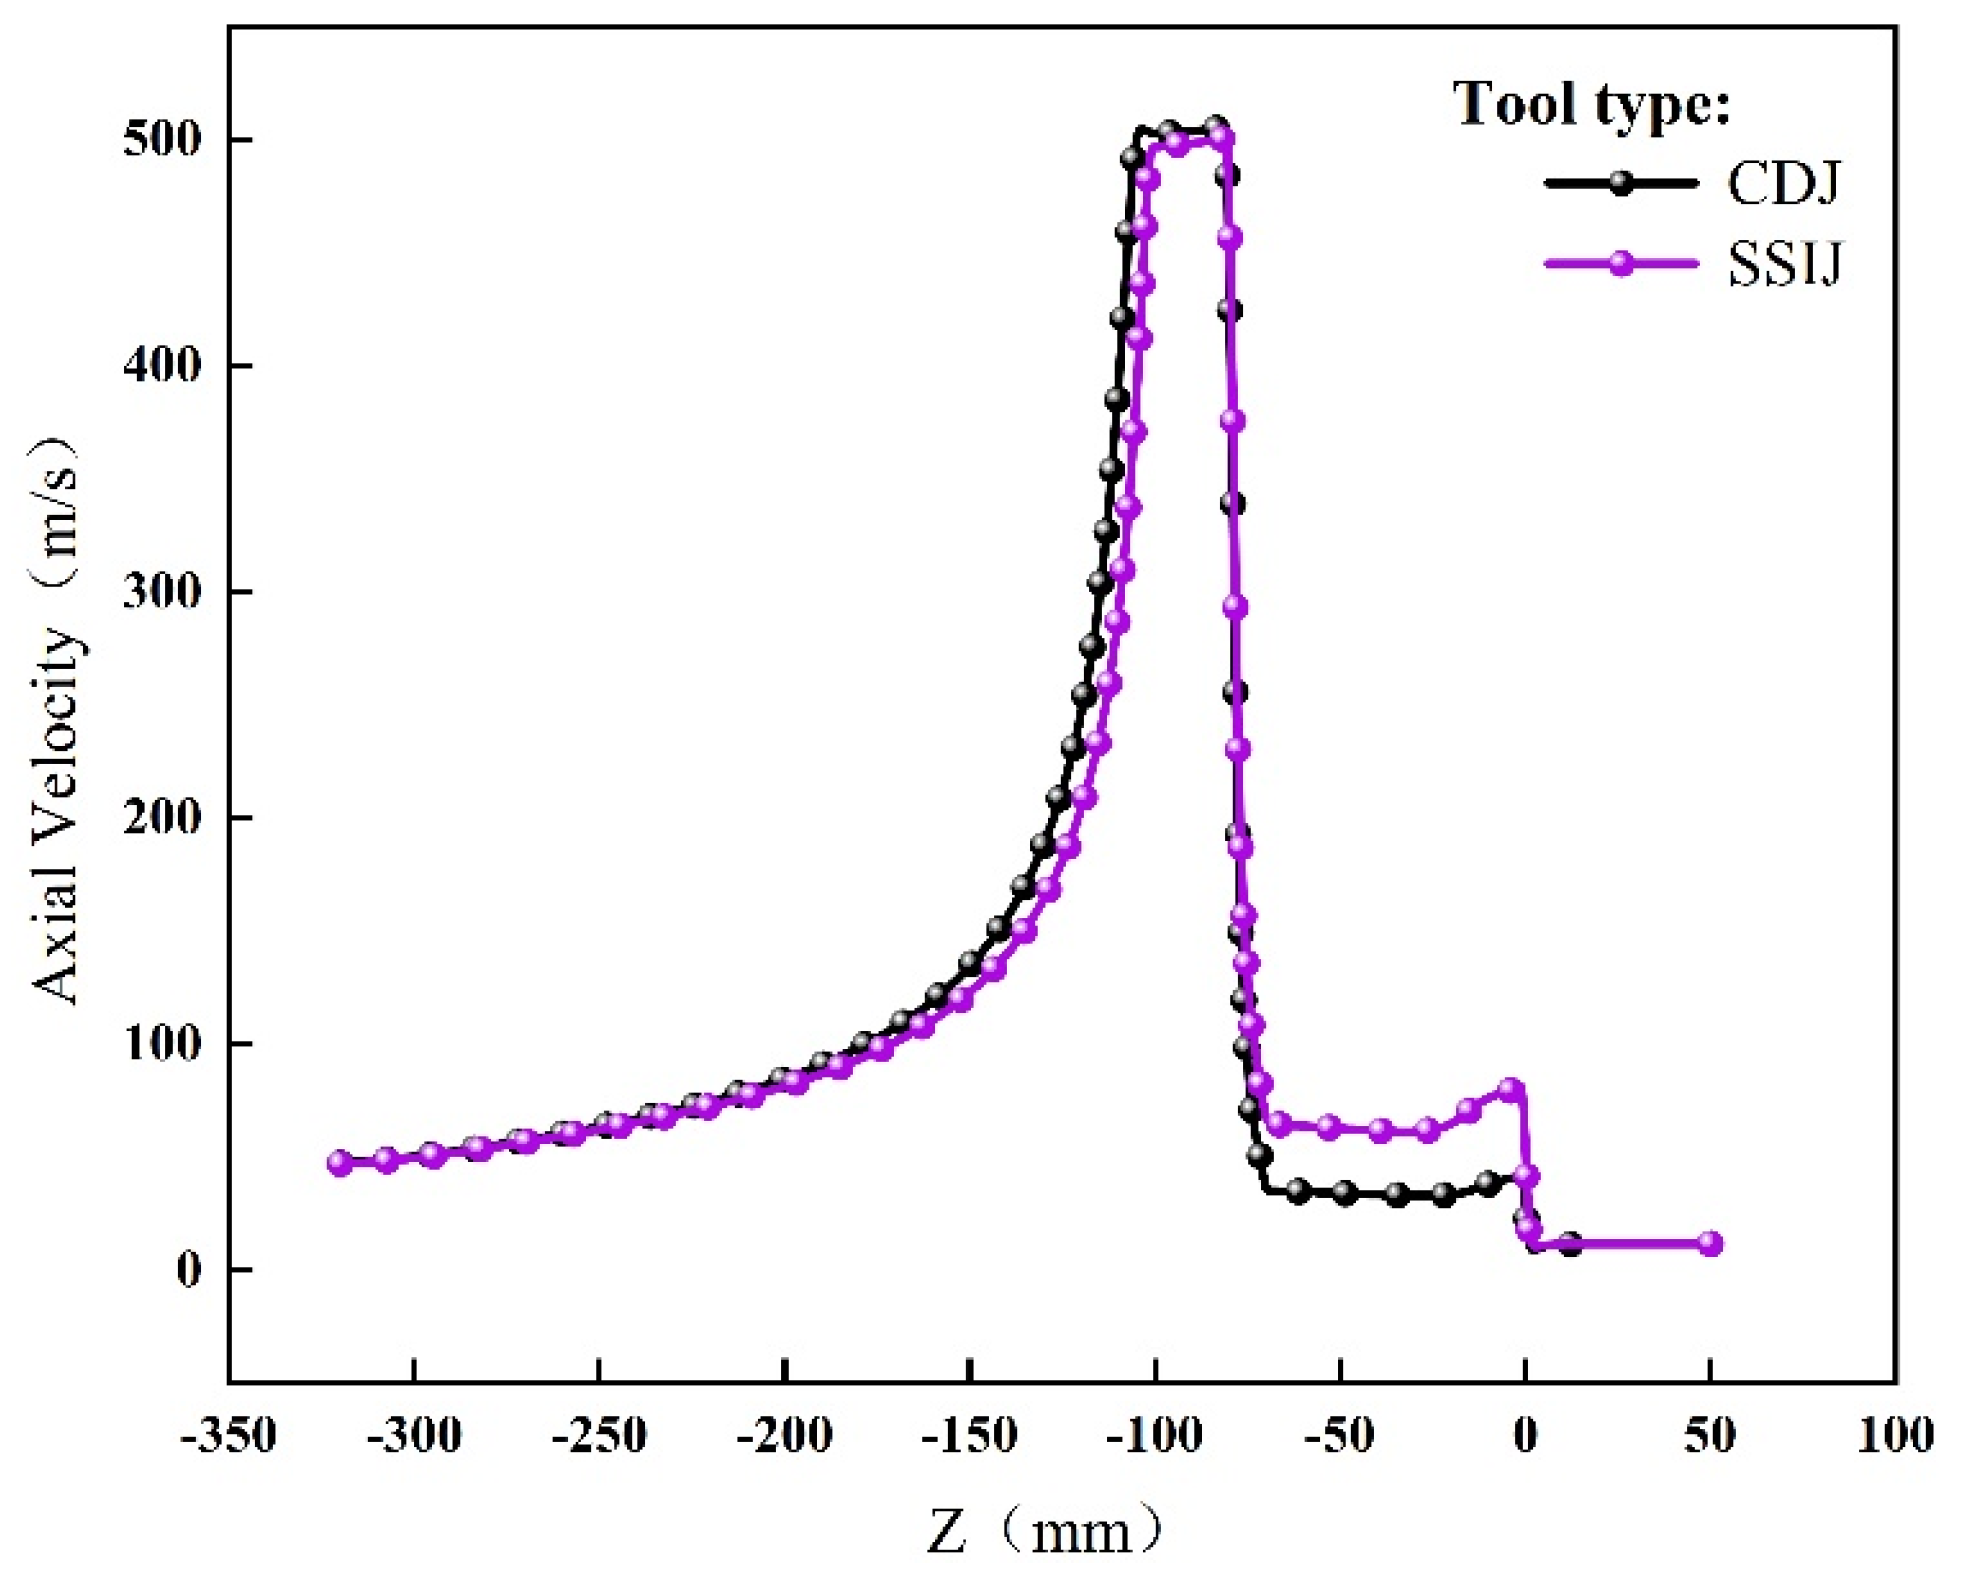
By extracting axial velocity values along the jet centerline, the axial velocity distribution was obtained. As shown in Figure 17, the CDJ nozzle achieves a peak axial velocity of 509 m/s compared to 507 m/s for the SSIJ tool. The CDJ nozzle maintains a potential core of approximately 40 mm (8 times the outlet diameter), whereas no distinct potential core exists in the SSIJ Tool’s jet. This difference arises from the impeller structure in the SSIJ tool, which generates strong swirling flow and suction effects that transfer jet energy to the ambient fluid, creating a more radially extended flow field than the CDJ nozzle.
Figure 18a,b show tangential velocity contours for the CDJ nozzle and SSIJ tool, respectively. The CDJ nozzle exhibits negligible tangential velocity, while the SSIJ tool generates significant tangential velocity with a wide distribution. This occurs because fluid develops spin after passing through the straight-swirling integrated impeller. Figure 18c,d displays radial velocity contours. The SSIJ tool’s jet flow field contains substantial radial velocities, contrasting with minimal radial velocities in the CDJ nozzle. This also results from the straight-swirling integrated impeller, where larger radial velocities create a distinct diffuse layer upon impacting scale material, significantly enhancing sand-carrying [50,51].
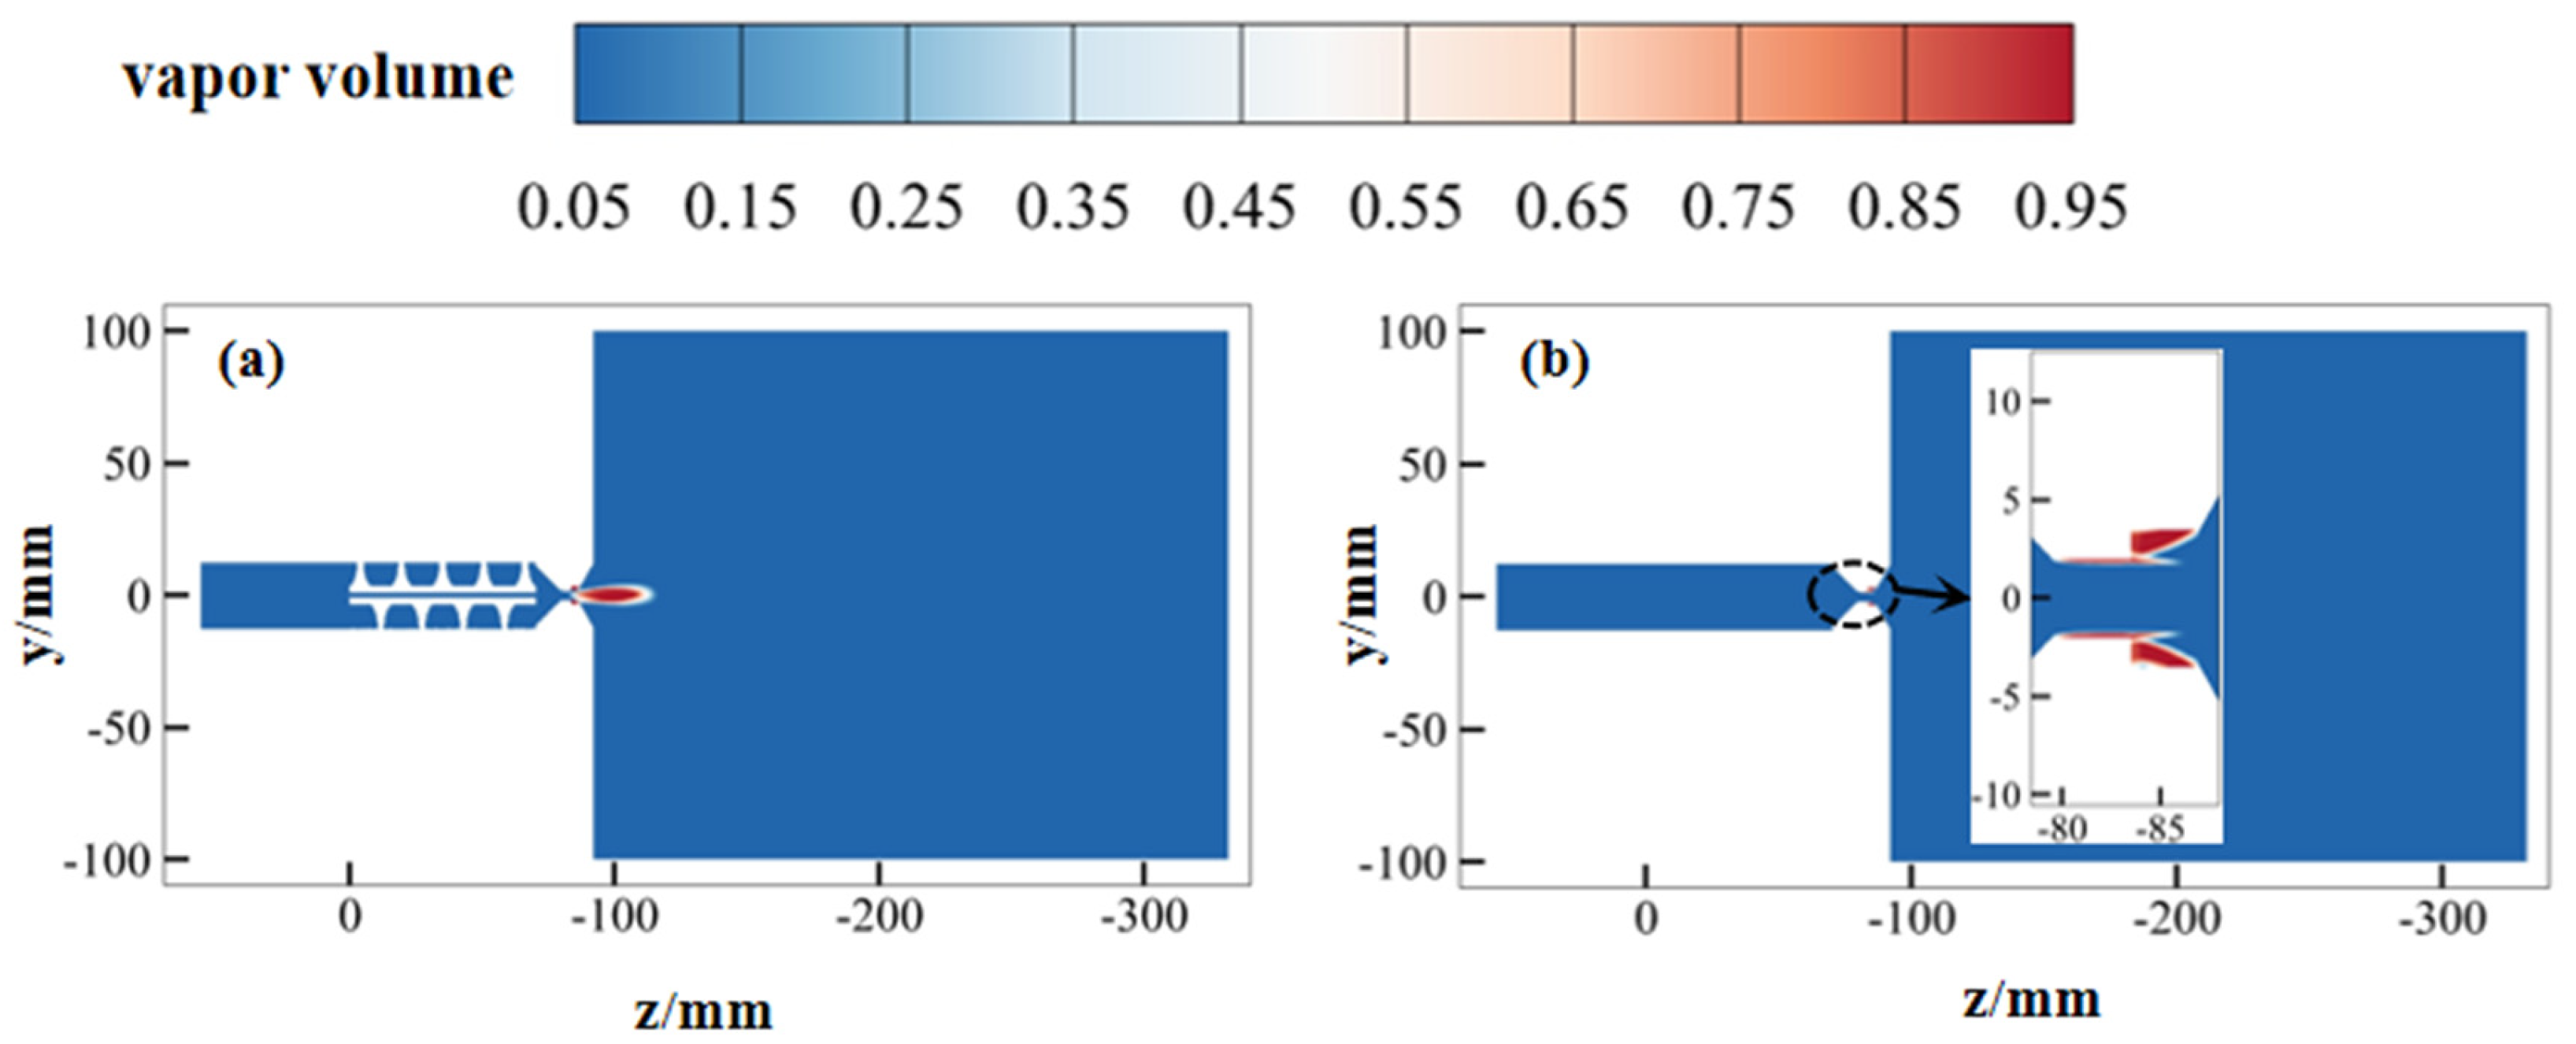
As shown in Figure 19, (a) and (b) are the gas-phase volume fraction clouds of the CDJ nozzle and SSIJ tool, respectively. From the figure, it can be seen that the jet flow field of the CDJ nozzle has a very small cavitation cloud only at the exit corner. For the SSIJ tool, this indicates that it has a strong cavitation inception capability. This phenomenon can be attributed to the straight-swirling integrated impeller structure in the SSIJ tool, which enables the fluid to obtain rotational velocity and generate a large number of vortices, where the center of the vortex is a low-pressure region, which is conducive to the occurrence of cavitation. The principle of cavitation is that when the local pressure drops below the saturation vapor pressure of the fluid at the current temperature, the fluid will vaporize and form bubbles. The collapse of these cavitation bubbles will produce instantaneous high-pressure and strong shock waves. Cavitation bubbles move with the jet and constantly merge to form a bubble cluster. These bubble clusters enhance the erosion and descaling ability when acting on scale deposits. Compared with the CDJ nozzle, the SSIJ tool exhibits stronger tangential and radial velocity components, which enhance shear and sweeping effects on scale deposits. Although a direct quantitative removal rate comparison is not available, the flow field characteristics clearly indicate improved debris mobilization potential.

3.2.2. Influence of Displacement and Standoff Distance on Pressure of SSIJ Tool

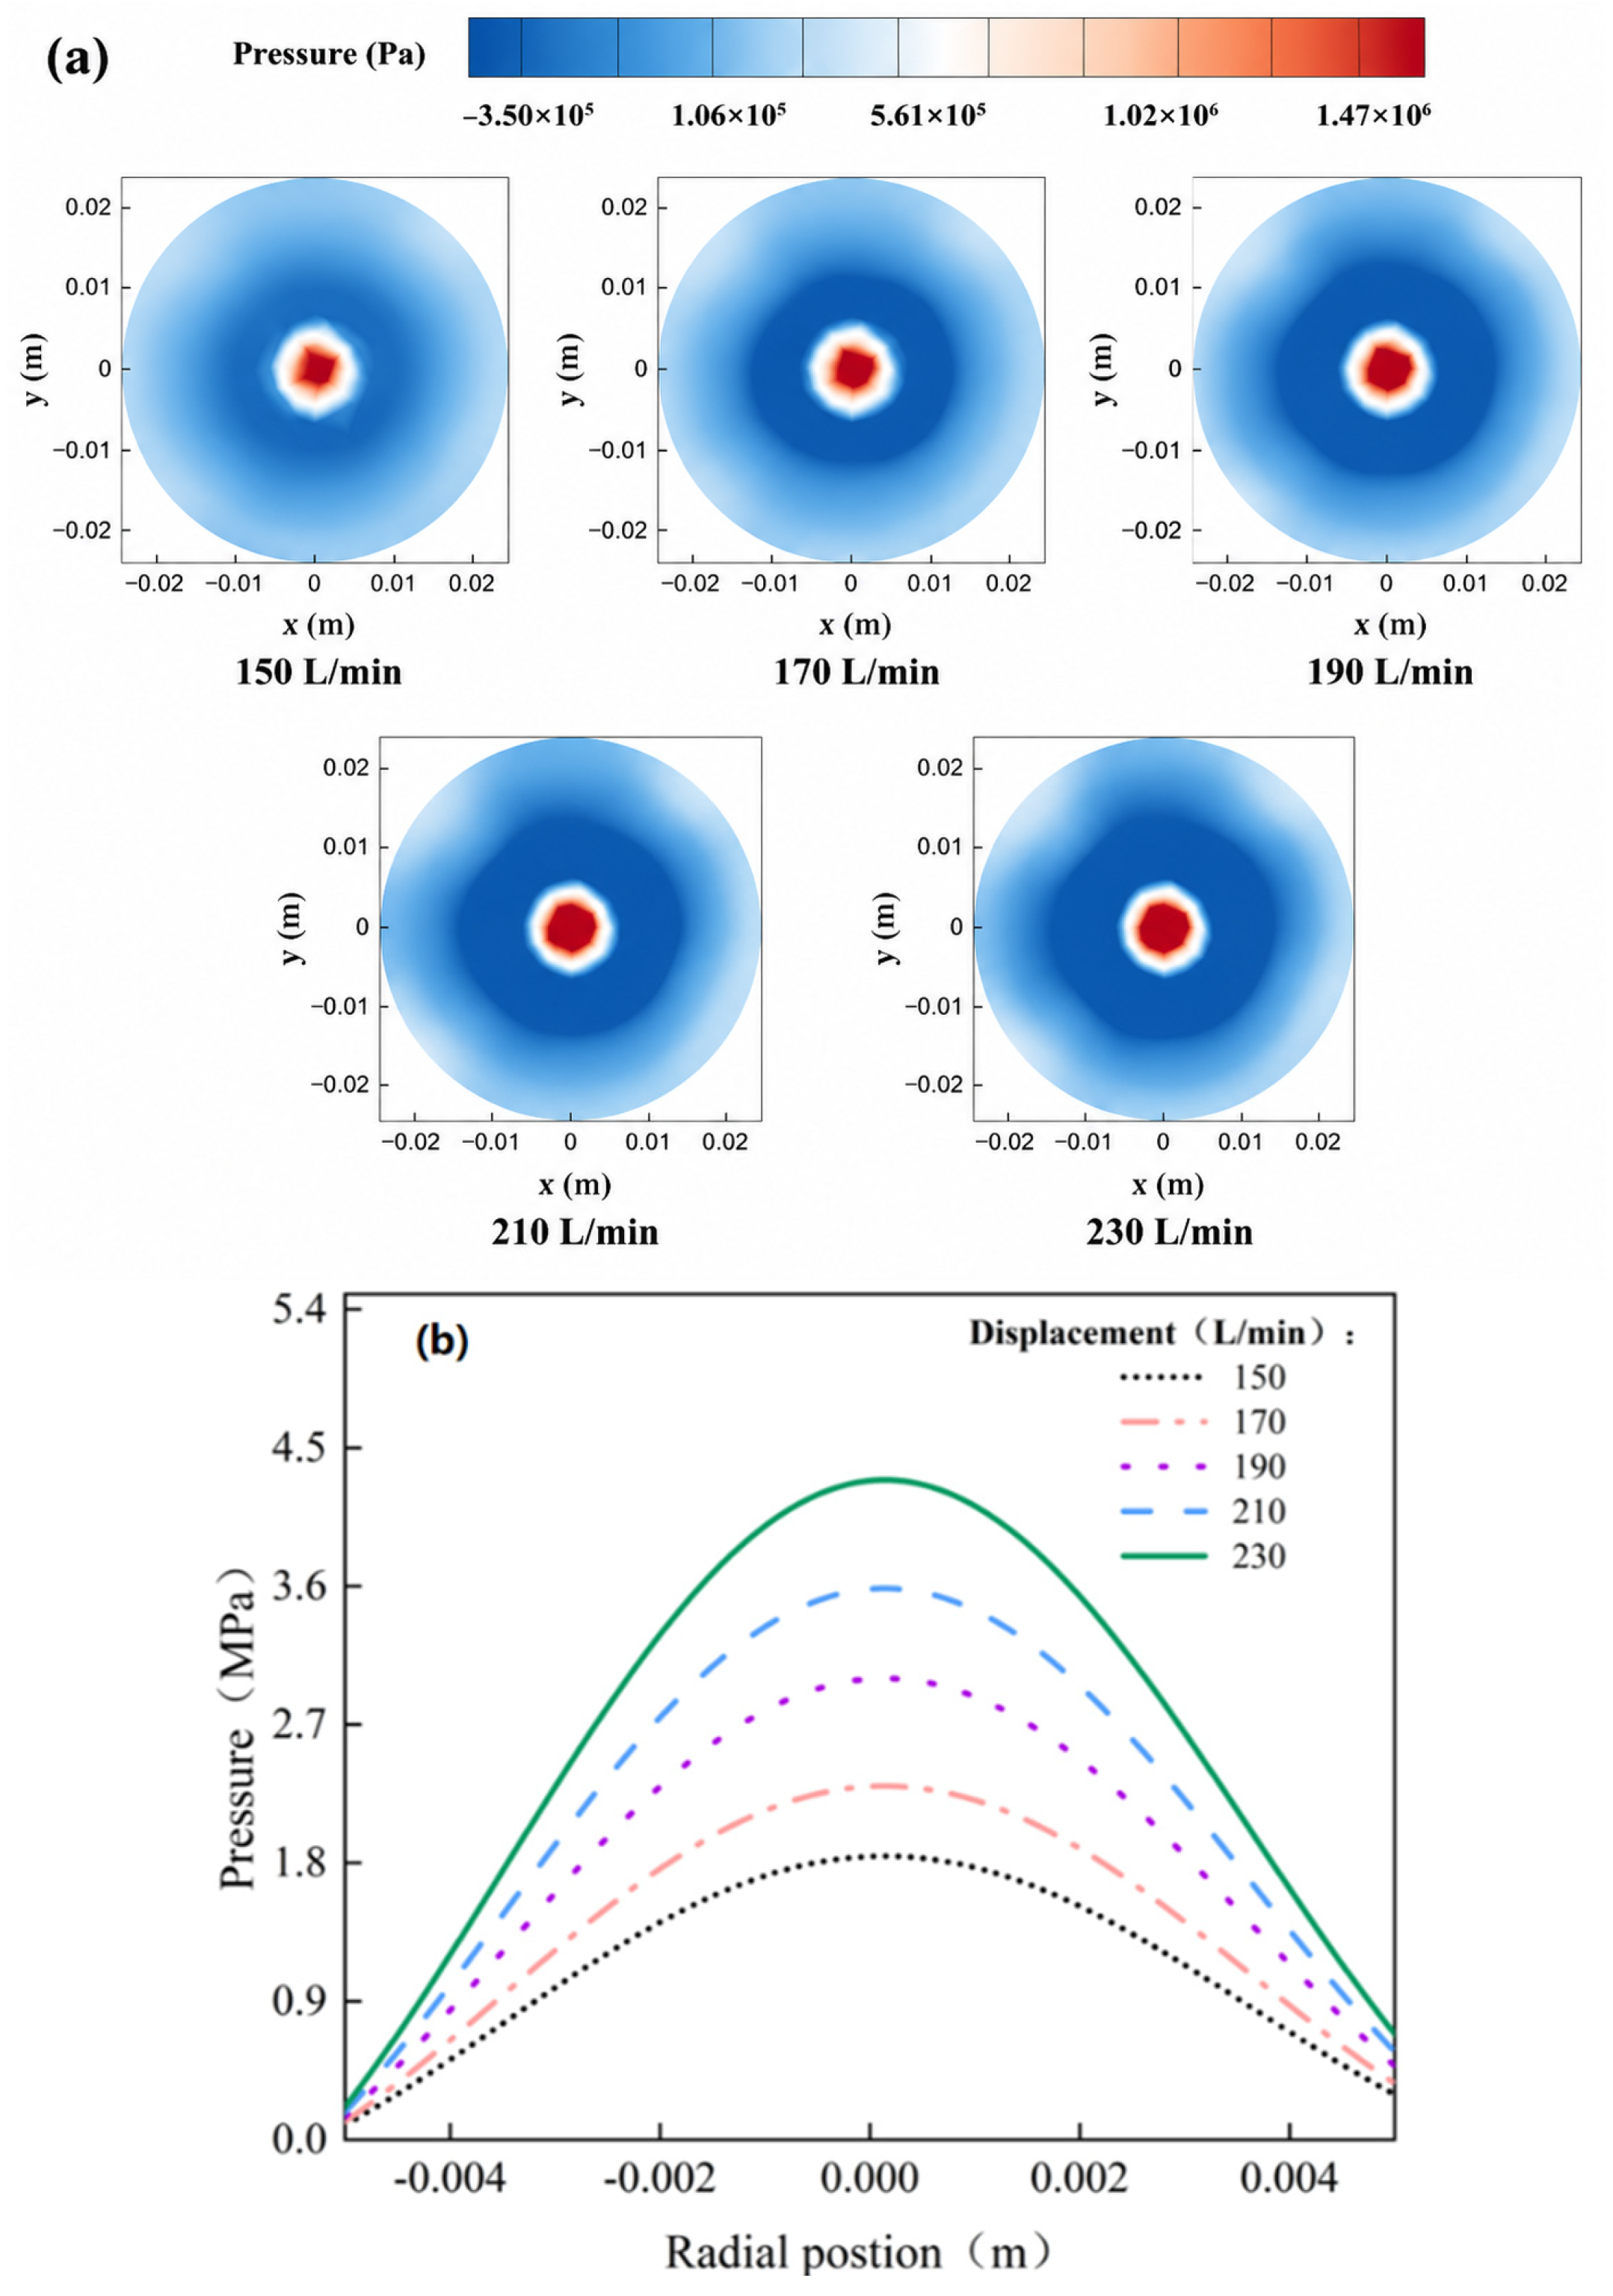
According to site construction conditions, the simulated displacement range is 150–230 L/min. Figure 20a shows the impact pressure contour of the SSIJ tool’s jet under different displacements. From the diagram, a larger displacement corresponds to greater impact pressure. Figure 20b shows radial pressure distribution along the tubing bottom wall. When displacement reaches 230 L/min, peak impact pressure peaks at 4.3 MPa, four times that at 150 L/min displacement. The influence of operating parameters on flow characteristics has also been observed in other fluid dynamic studies, where varying input conditions led to significant changes in flow structure and performance [52].
Although a larger displacement can theoretically improve the jet energy, it will also significantly increase the pump pressure, and thus increase the safety risk of equipment operation and construction. Therefore, the displacement needs to be effectively controlled in practical application to avoid safety accidents caused by excessively high construction pressure or an excessively low displacement, weakening the jet energy and affecting the descaling effect. At the same time, it must be ensured that the pressure does not exceed the maximum bearing pressure drop of the tool.
It is worth noting that the cavitation intensity simulated in this study corresponds to a downhole ambient pressure of 30 MPa, which is significantly higher than the atmospheric conditions used in laboratory experiments. Under such high ambient pressure, the saturation vapor pressure of water remains nearly unchanged, while the local pressure required to initiate cavitation must drop below a much higher baseline. This means that cavitation inception is more difficult to achieve at depth compared to surface conditions. Nevertheless, the present simulation results show that the low-pressure vortices generated by the swirling impeller are still capable of reducing the local pressure sufficiently to reach the vapor pressure threshold, as demonstrated by the non-negligible vapor volume fraction observed in the flow field (Figure 18). Although the vapor volume fraction is lower than what would be expected under atmospheric conditions, the collapse of these bubbles in a high-pressure environment can generate more intense shock waves due to the higher ambient pressure differential. Therefore, while cavitation intensity is reduced at 30 MPa compared to surface conditions, it remains a contributing factor to the overall erosion mechanism under downhole conditions.
In the unblocking process, jet energy changes drastically with standoff distance, which significantly affects tool effectiveness. Research confirms that an optimal standoff distance exists for jet injection [53]. When the standoff distance is 3–4.5 times the nozzle diameter (12–18 mm), this study explores the impact pressure variation of the SSIJ tool.
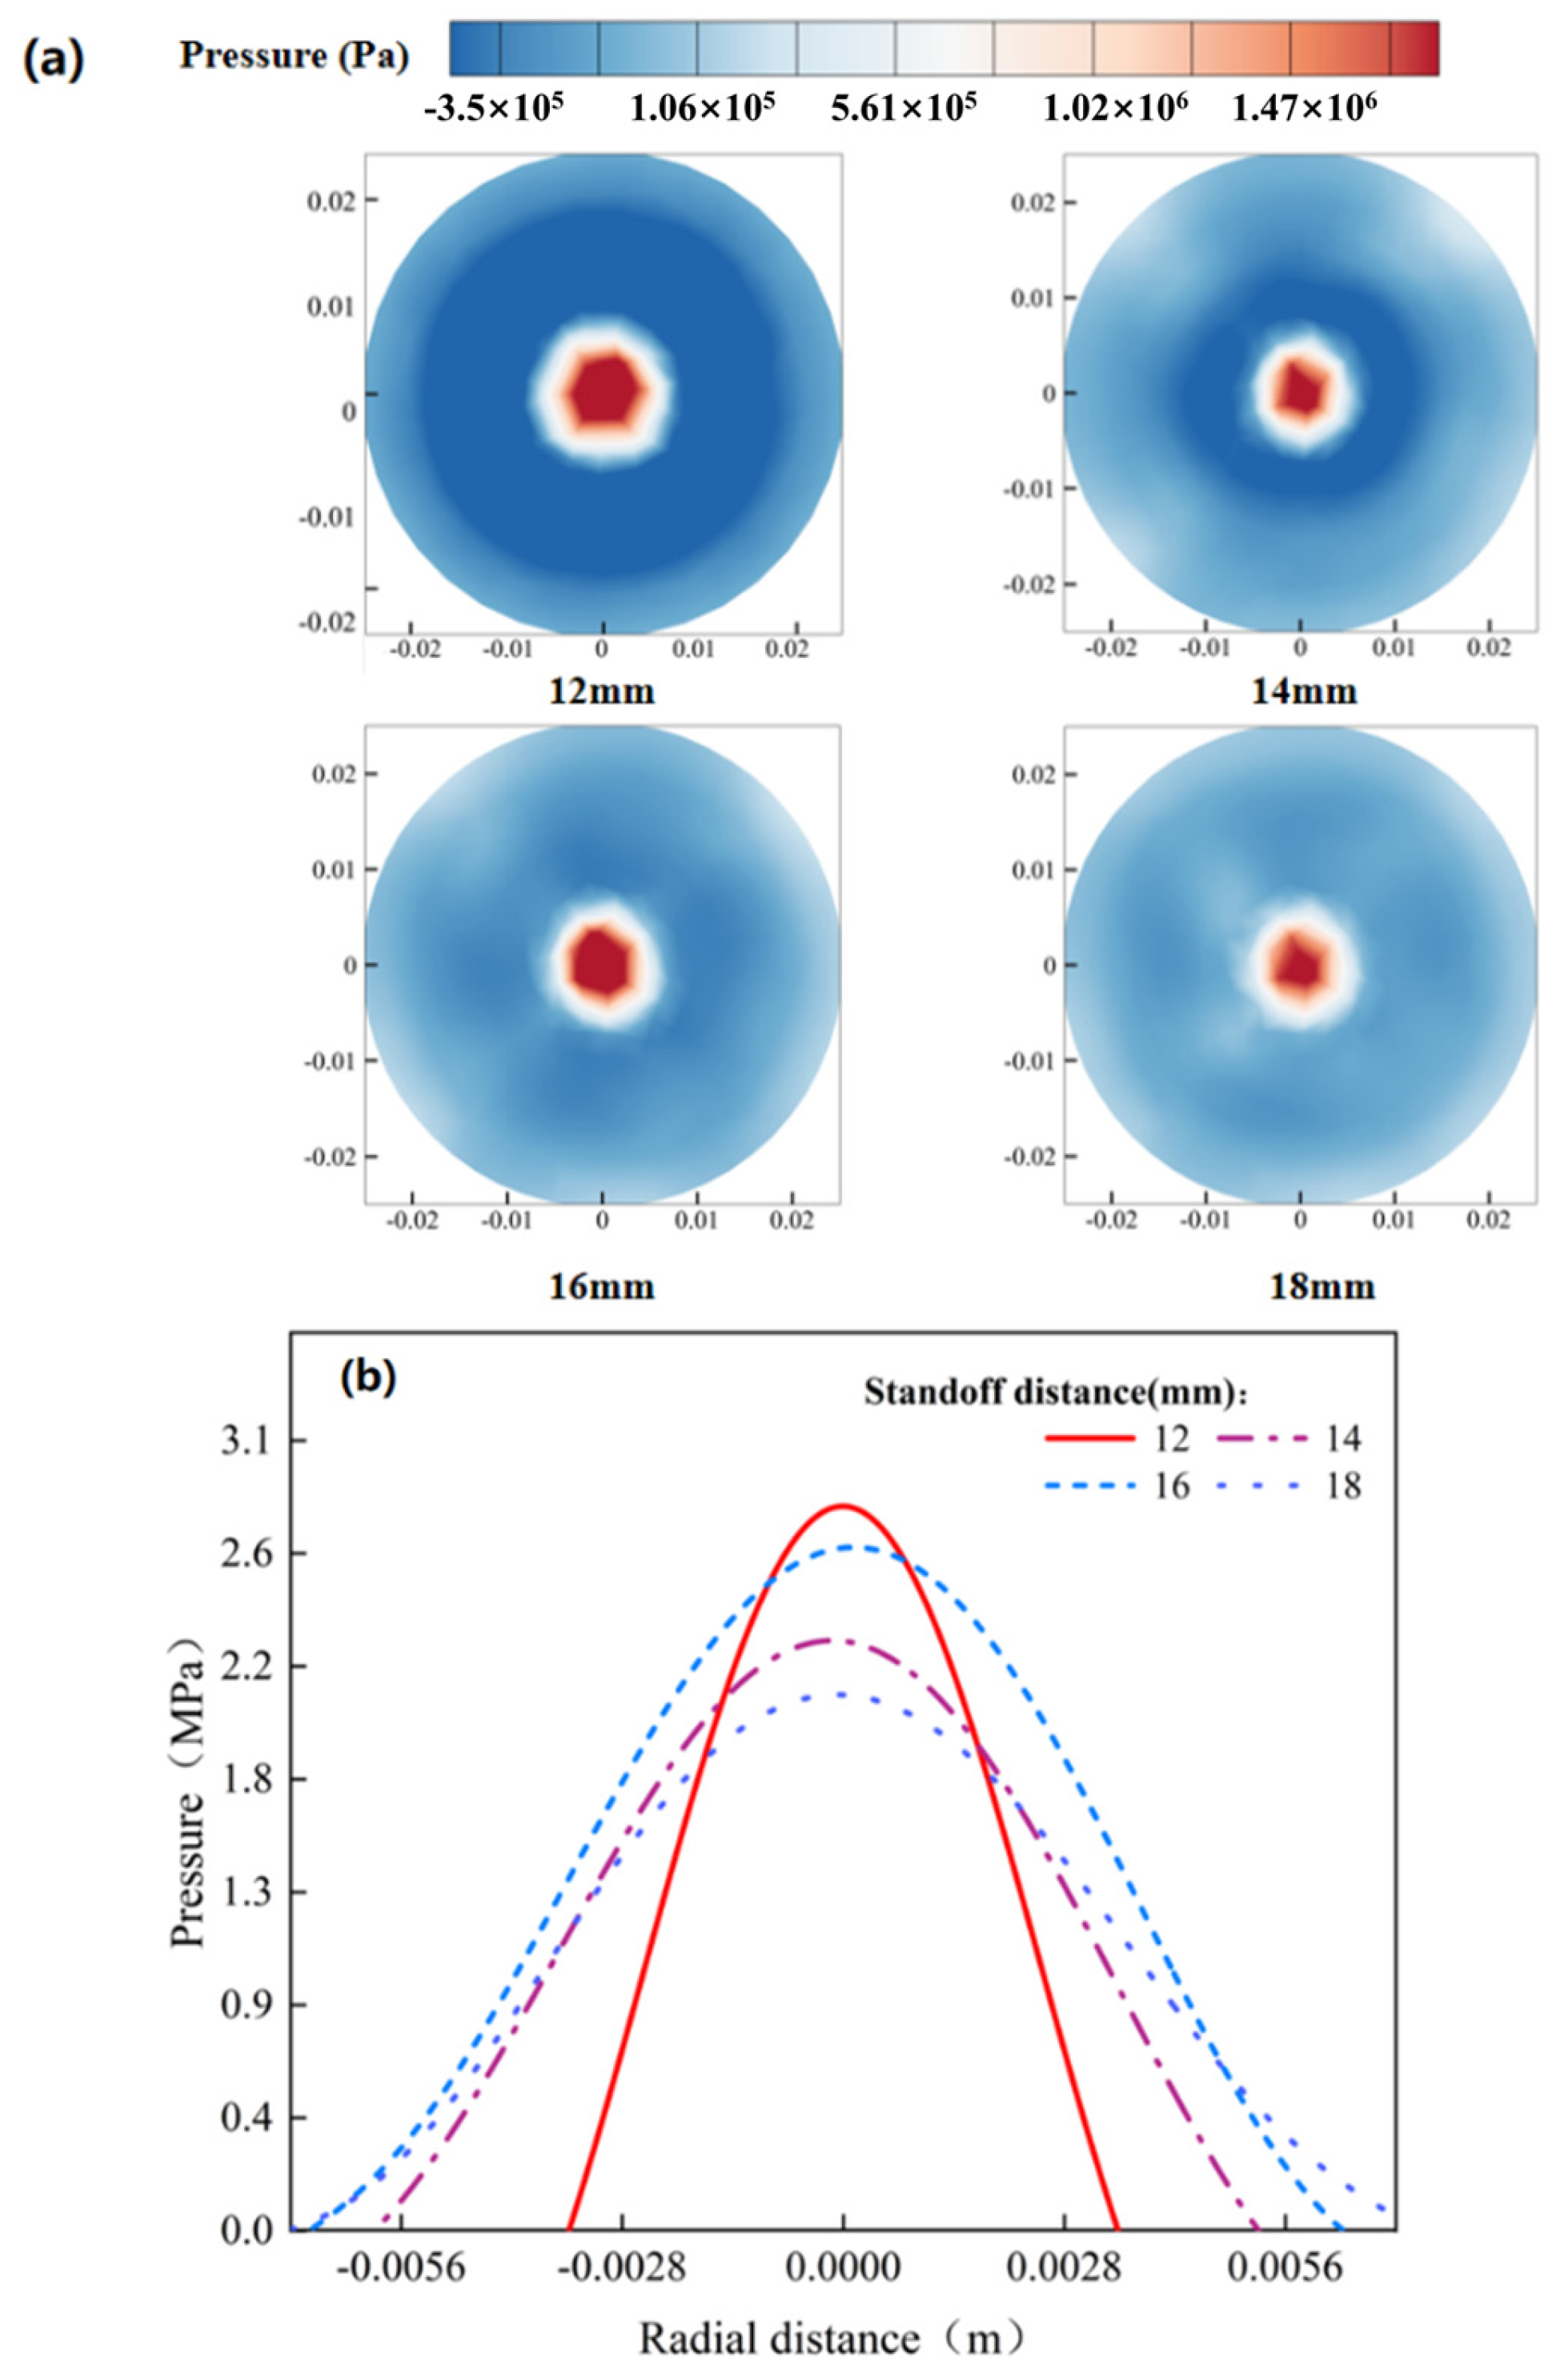
Figure 21a shows the impact pressure cloud diagram of the unblocking tool under different standoff distances. As shown in the figure, with the increase of standoff distance, the maximum jet impact pressure decreases gradually, while the effective action area increases gradually. The Impact Pressure Distribution Chart is extracted and plotted, as shown in Figure 21b. The peak pressure reaches 2.7 MPa when the standoff distance is 12 mm. When the standoff distance is 16 mm, the peak pressure is slightly lower than that at 12 mm, but significantly higher than that at 14 mm and 18 mm. At this time, the effective action area of the jet forms a circular area of 6.7 mm in diameter, which is significantly larger than that at 12 mm and 14 mm, and is similar to that at 18 mm. The effective action area at 18 mm is larger than that at 12 mm and 14 mm. Comprehensively considering the peak impact pressure and the effective action area, the spray standoff distance of 16 mm, i.e., 4 times the outlet diameter, is the best. When the tool is applied in the field, the appropriate standoff distance should be selected according to the specific conditions of the gas well in order to realize the best effect of unblocking.
It is important to note that the optimal standoff distance of 16 mm (4 times the outlet diameter) was determined under a fixed displacement condition. Although a comprehensive parametric study of the coupled effect of displacement and standoff distance was not performed, based on the general physical behavior of turbulent jets, the relationship between standoff distance and displacement is not simply linear. At higher displacements, the jet velocity increases, which delays the axial decay of impact pressure and shifts the optimal standoff distance to a slightly larger value, as the jet maintains its coherence over a longer distance. Conversely, at lower displacements, the jet loses momentum more quickly, and the optimal standoff distance becomes shorter. However, within the displacement range considered in this study (150–230 L/min), the variation in the optimal standoff distance is relatively small (approximately ±2 mm), as the jet Reynolds number remains sufficiently high for the turbulent jet to maintain a similar spreading angle. Therefore, the 16 mm value can be considered a robust approximation for the practical displacement range of coiled tubing operations, though site-specific adjustment is recommended based on actual pump conditions.

3.3. Experiment Validation

3.3.1. Experimental Equipment and Materials

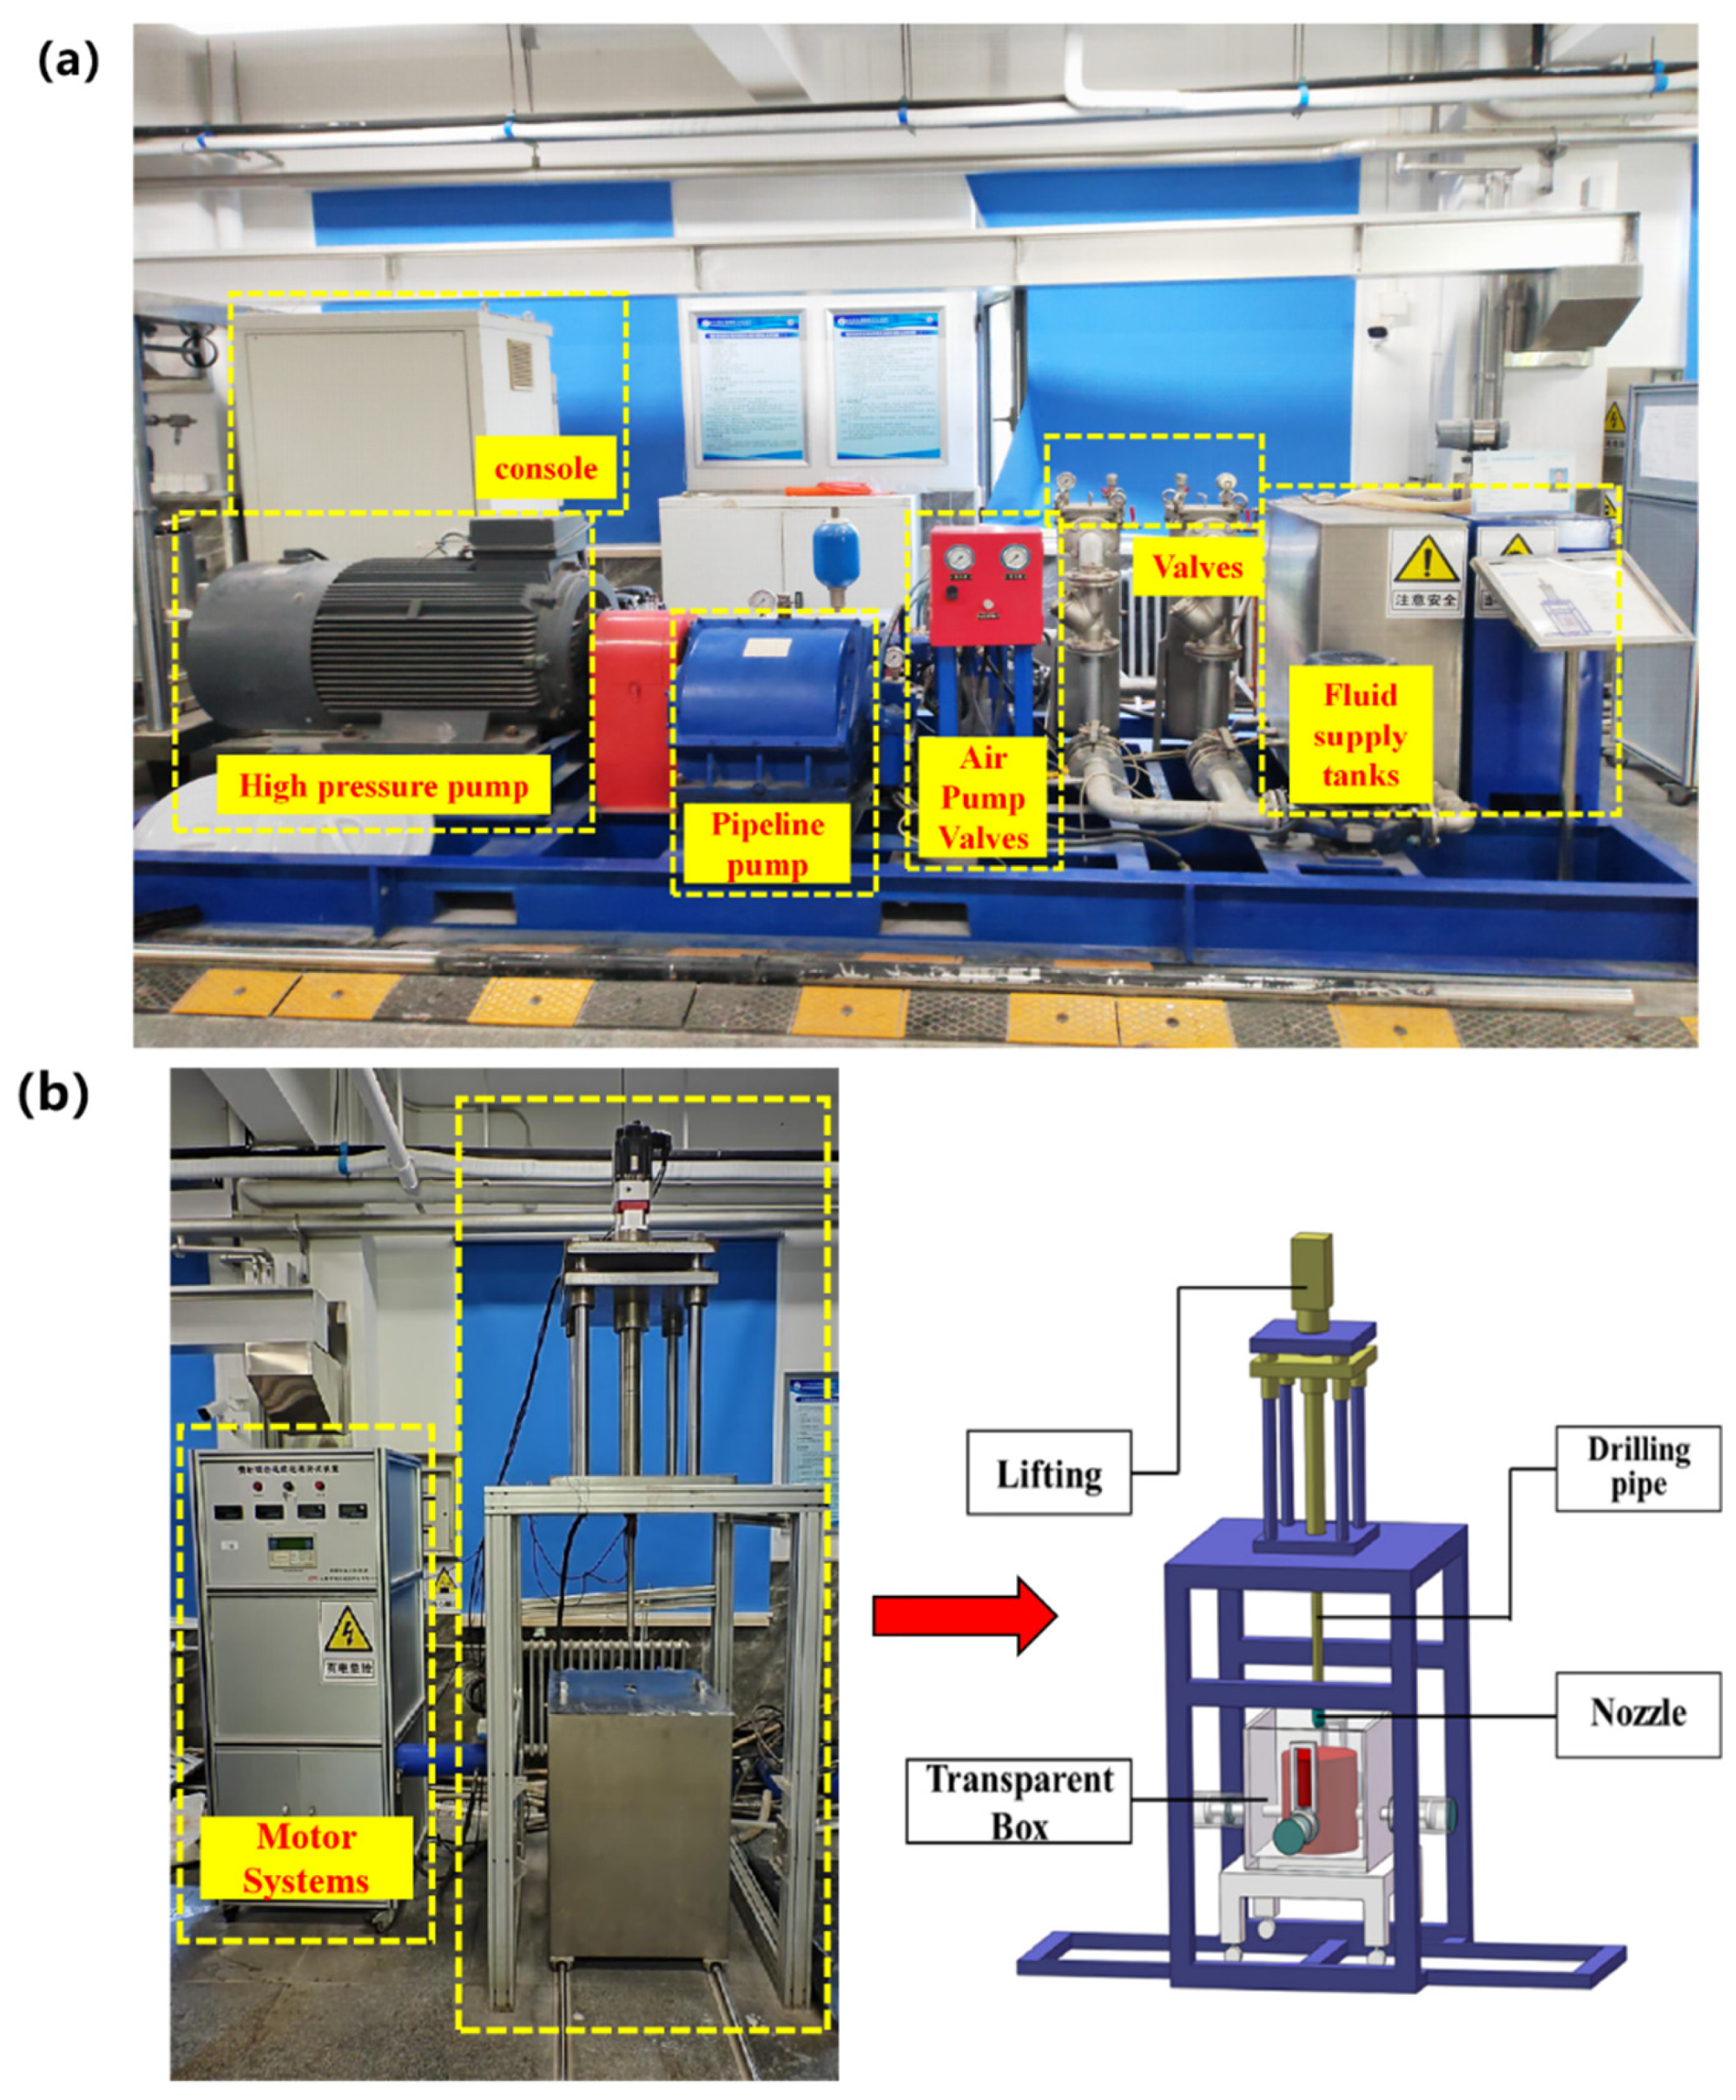
In this study, an indoor experiment on the unblocking tool was conducted using an electric high-pressure pump and a continuous jet rock-breaking experimental device. As shown in Figure 22a, the high-pressure pump assembly consists of a pump, a pipeline pump, an air pump, a valve, and a console. The continuous jet rock-breaking experimental device, shown in Figure 22b, primarily consists of a motor system, a feeding module, and a clamping module.
It should be emphasized that the numerical simulations presented in Section 3.2 are not intended to directly model the physical process of scale removal with solid particles. Instead, they are used to reveal the flow enhancement mechanisms, including velocity redistribution, cavitation development, and impact pressure variation. The actual descaling performance is directly verified through the laboratory experiments presented in this section. Therefore, the numerical and experimental results should be interpreted as complementary rather than directly equivalent.
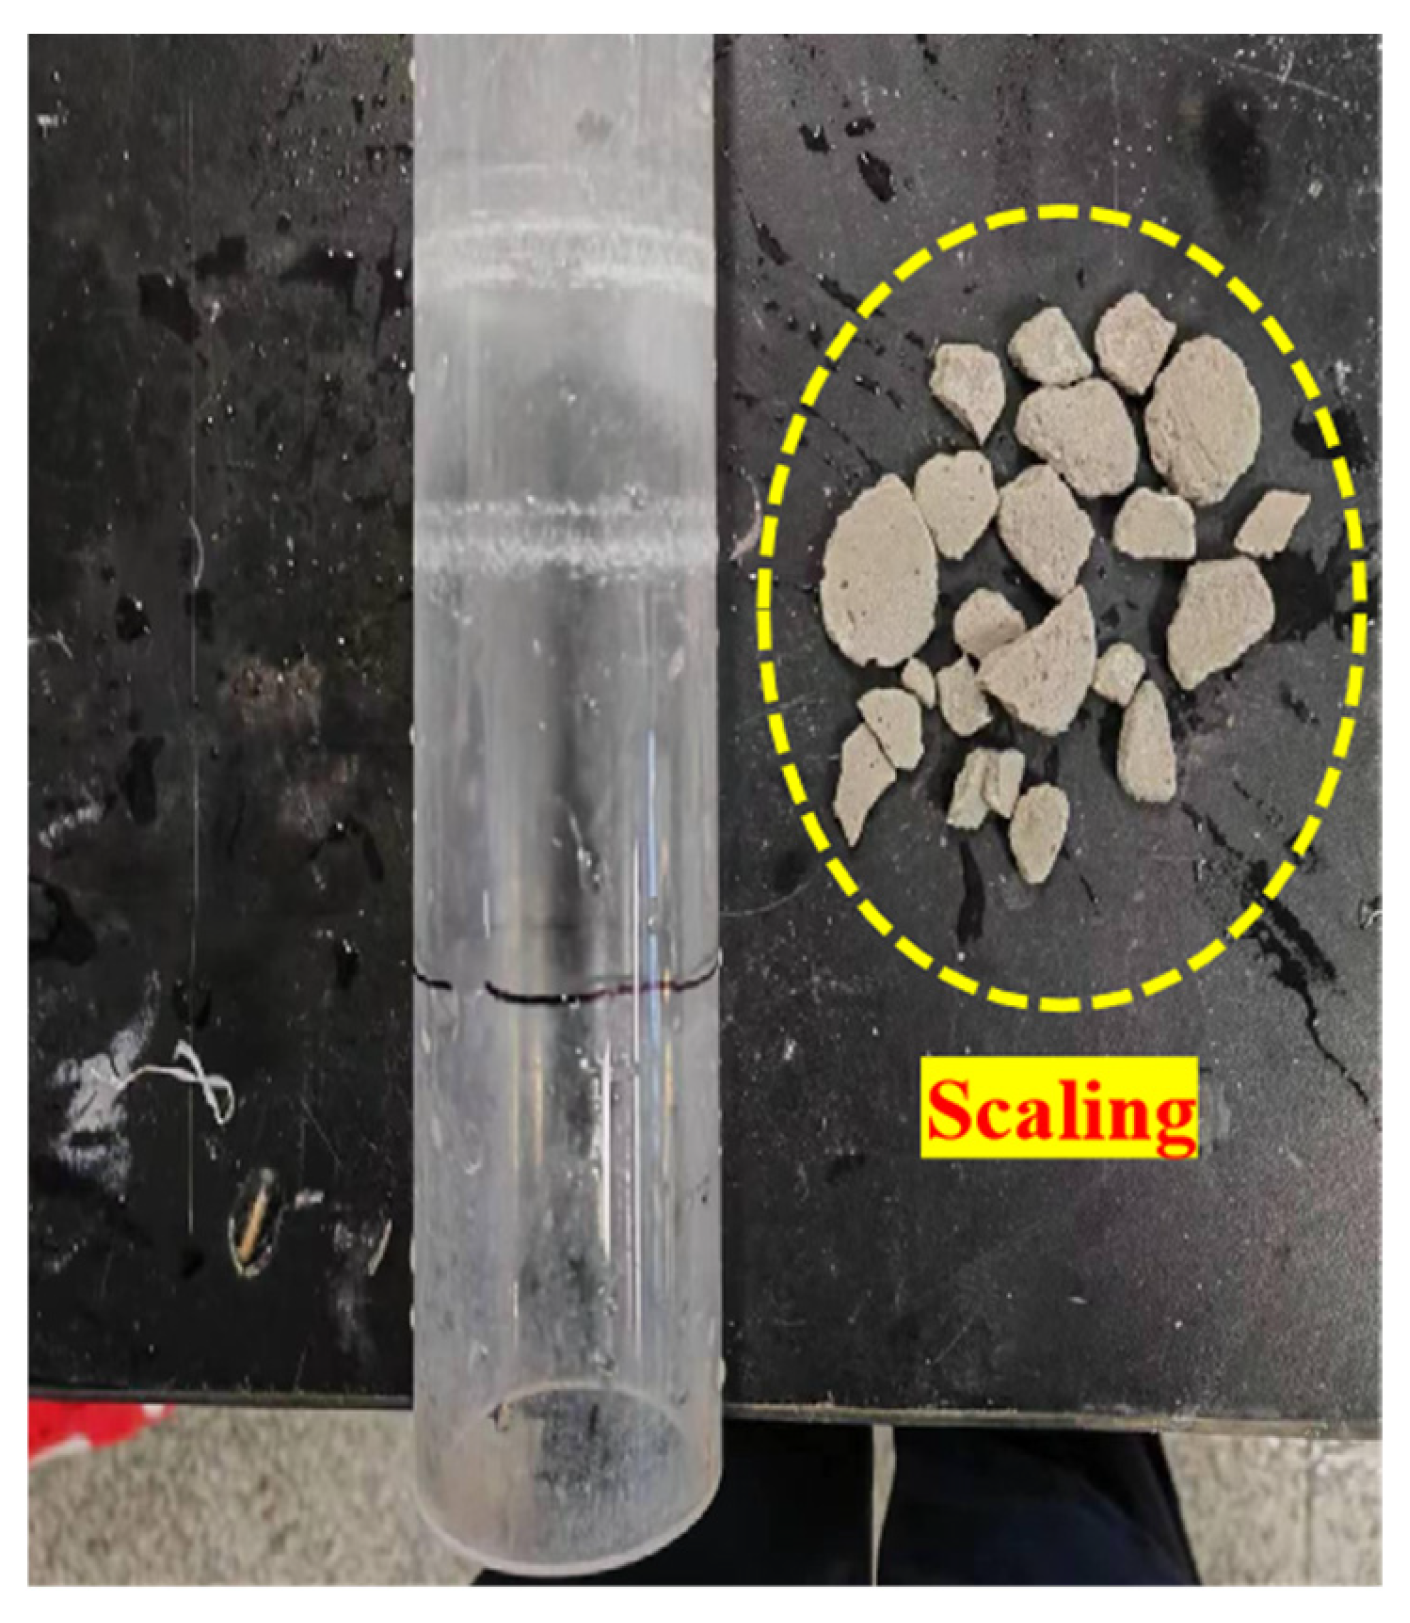
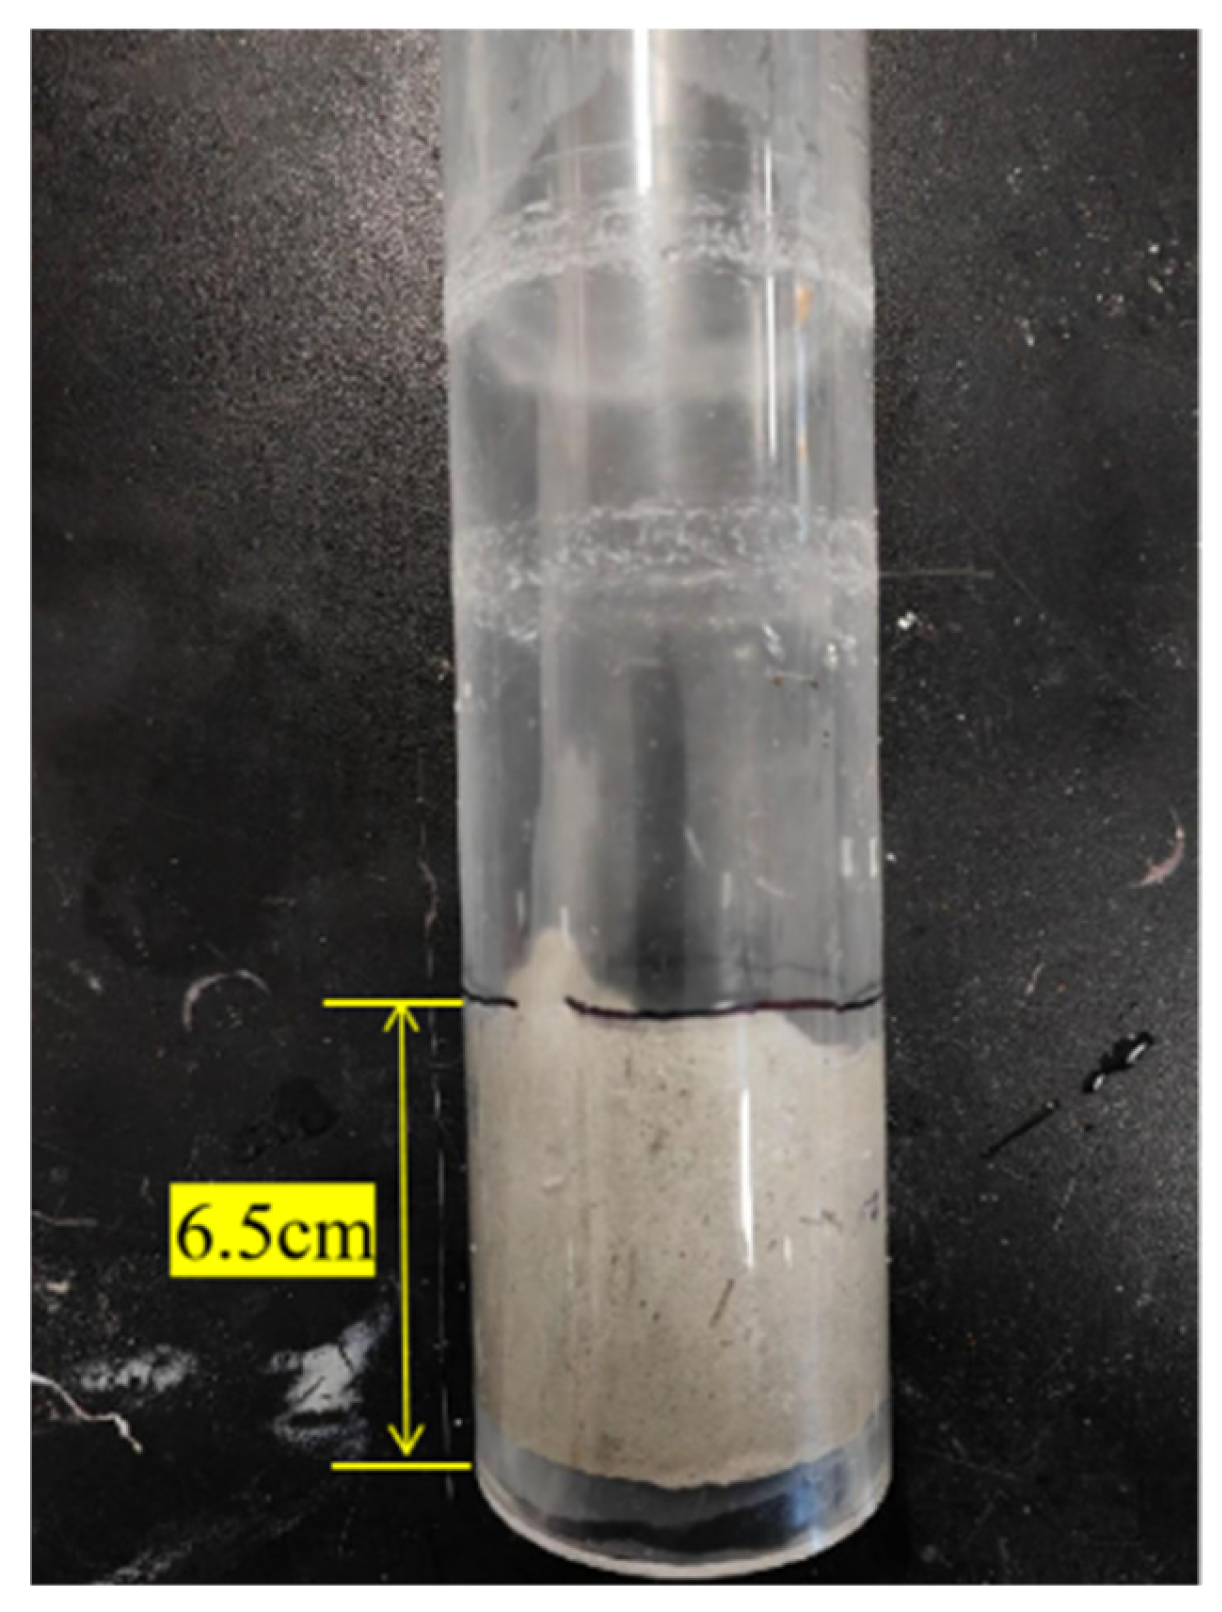
An acrylic tube with an outer diameter of 60 mm and a wall thickness of 5 mm was used to simulate the gas well tubing (which has an outer diameter of 60.3 mm and a wall thickness of 4.83 mm). To mimic the scale inside the tubing, a cement mixture was prepared with sand:lime:gypsum = 5:2:3 and sand:ash:water = 10:2:9. As shown in Figure 23, this produced a scale layer approximately 2 mm thick and 6.5 cm long.

3.3.2. Experimental Methods and Procedures

The descaling experiment was conducted using a continuous jet rock-breaking experimental device. The experimental steps were as follows:
(1)
Pre-experiment preparation: Photograph the scaled tubing and record its initial state.
(2)
Equipment installation: Install the 78 mm OD jet short connection on the continuous jet rock-breaking device. Connect the electric high-pressure pump to the test device using a high-pressure hose. Attach the unblocking tool to the jet short connection. Install the tubing fixing bracket in the reaction box to center the experimental tubing.
(3)
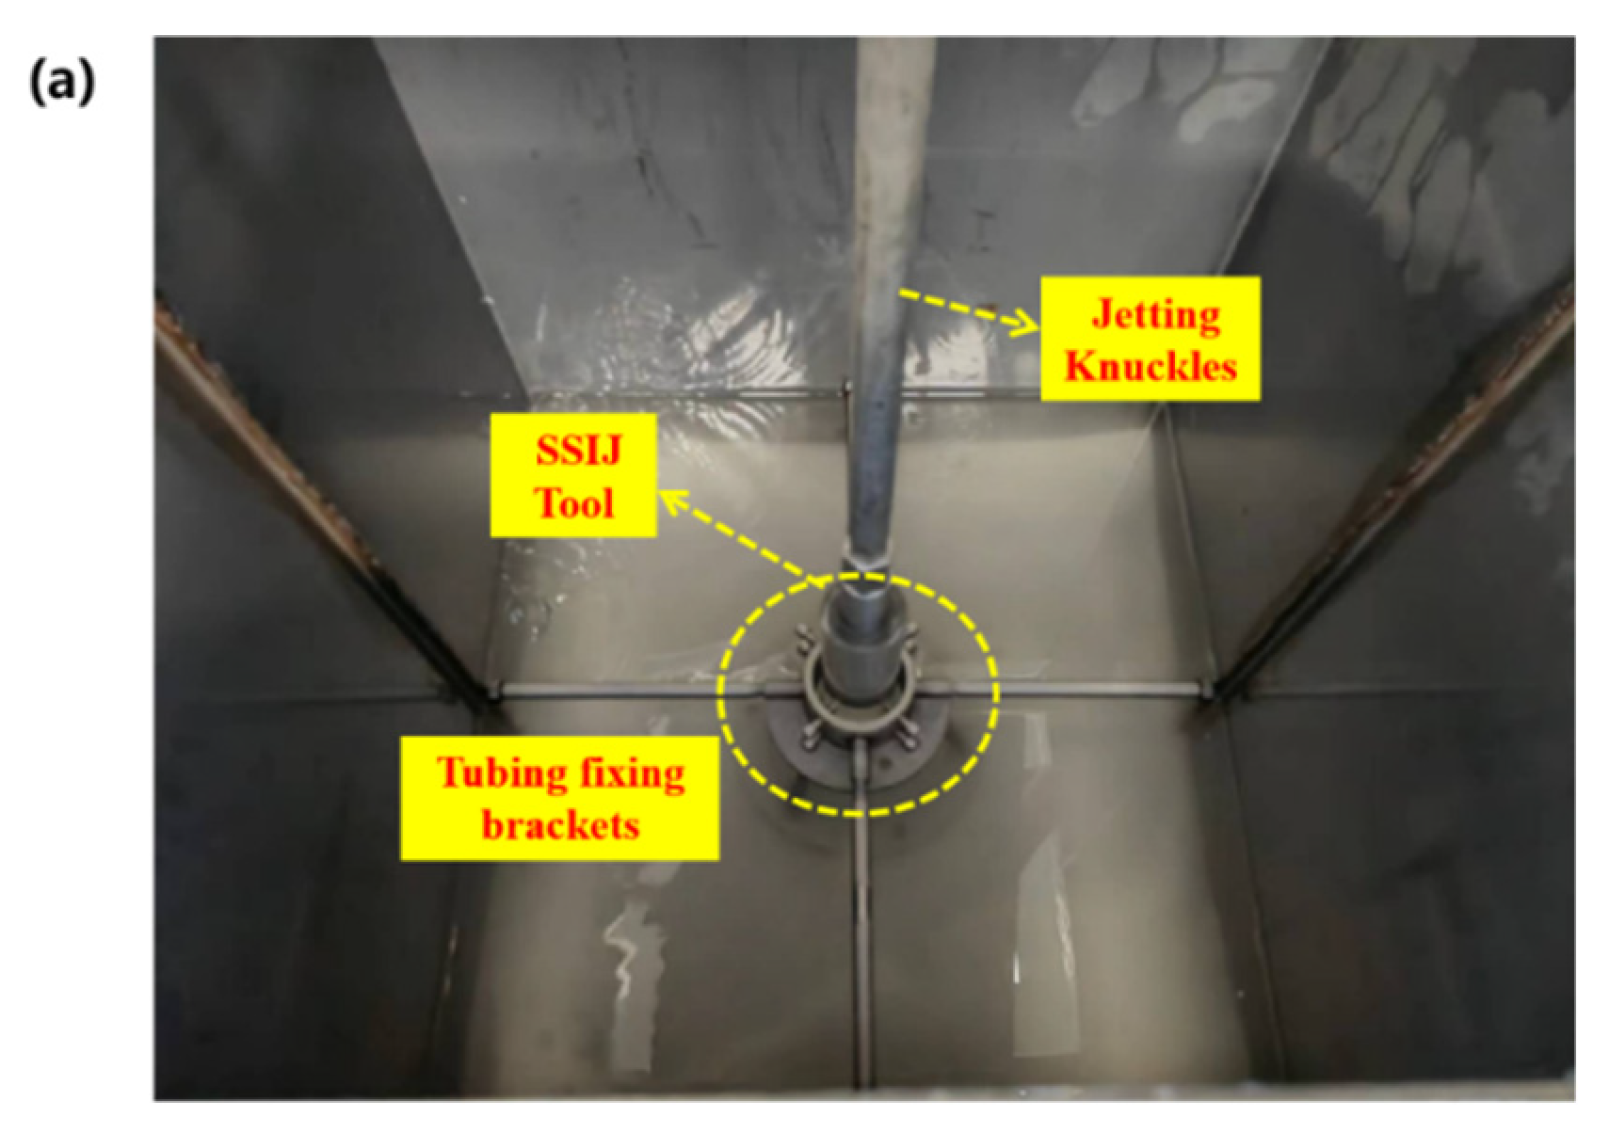
Tool positioning: As shown in Figure 24a, start the continuous jet rock-breaking process. Use the motor to raise and lower the descaling tool until it is positioned 16 mm from the fouling part.
(4)
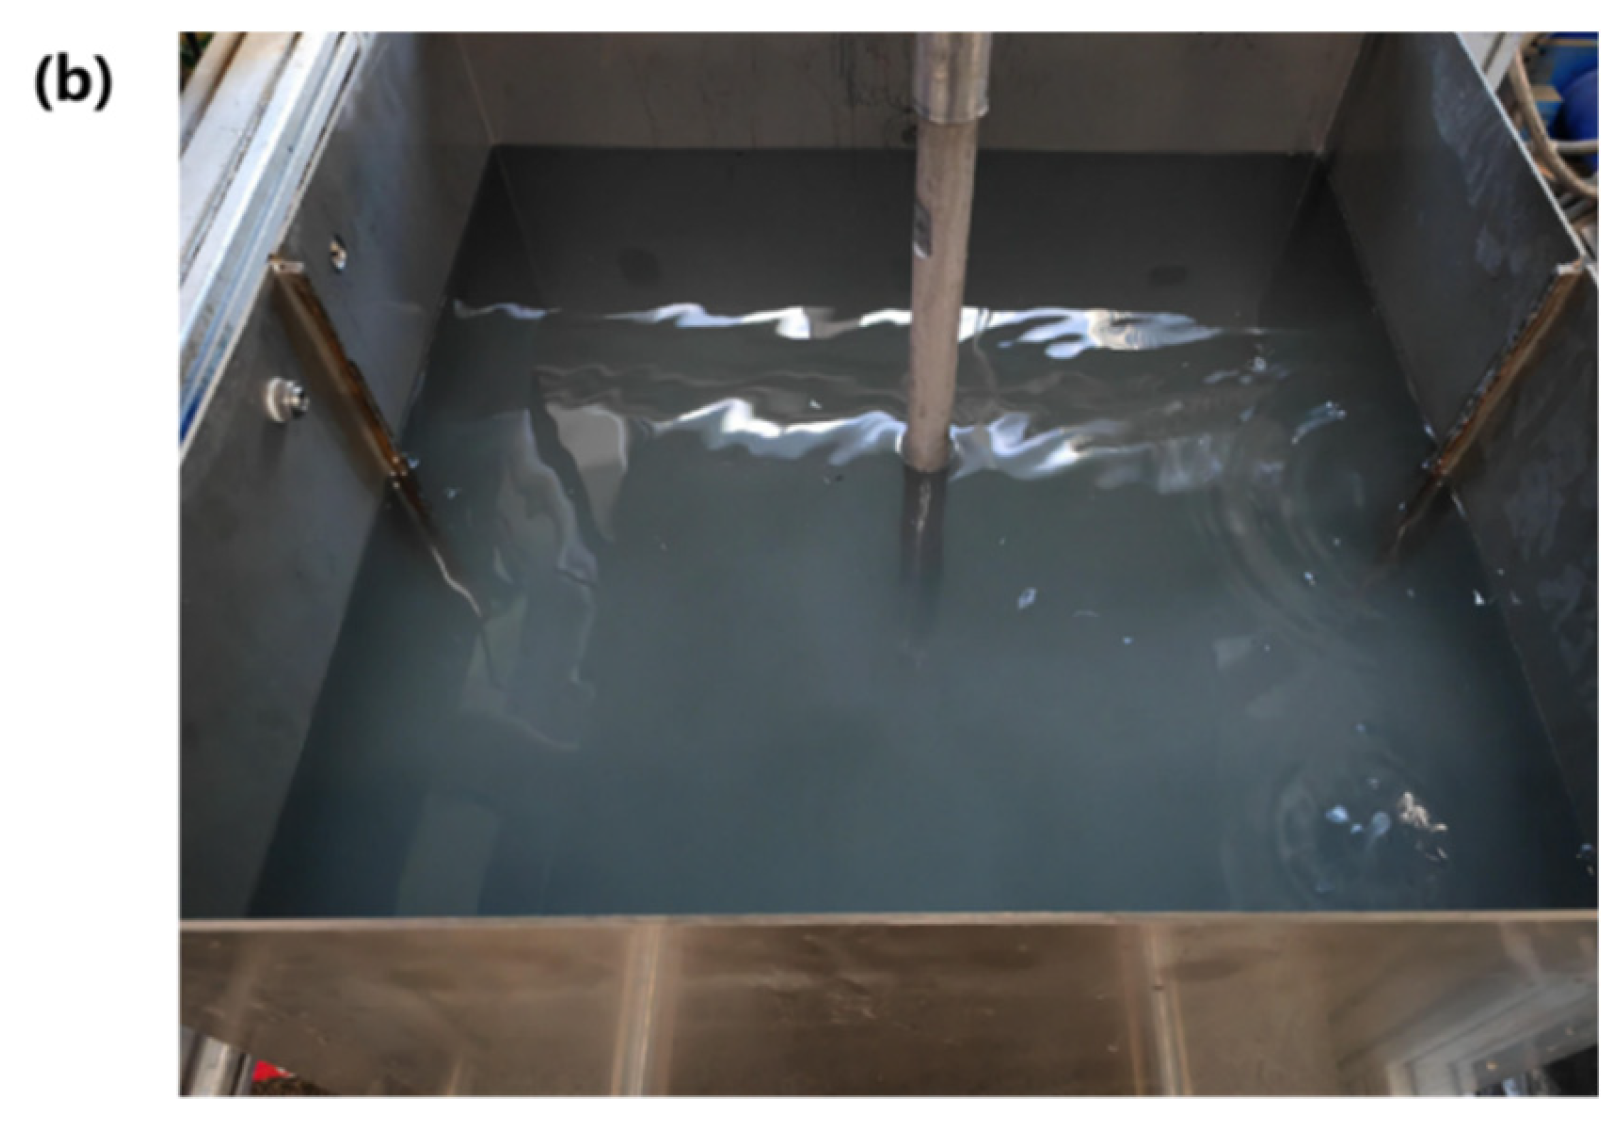
Experiment preparation: Start the generator to power the high-pressure pump. Turn on the pipeline pump and liquid tank. Open the exhaust valve to evacuate air until a water jet is produced. As shown in Figure 24b, submerge the unblocking tool to ensure it operates in a submerged jet state during the experiment.
(5)
Descaling experiment: Start the electric high-pressure pump, set the pressure to 20 MPa, and maintain cleaning for 2 min.
(6)
End of the experiment: Gradually reduce the pump pressure to ambient, then shut off the electric high-pressure pump. Use the continuous feeding device to raise the tool until it is completely out of the experimental tubing.
(7)
Effectiveness assessment: After the experiment, remove the tubing and evaluate the effectiveness of the descaling tool.
Figure 24. Pre-experiment preparation chart; (a) Pre-experiment tool installation diagram; (b) Pre-experimental submerged environment map.
Processes 14 02138 g024aProcesses 14 02138 g024b

3.3.3. Experimental Results and Analysis

Figure 25 shows the tubing after the experiment. The results indicate that the cement layer on the inner wall was effectively eroded into small fragments of various sizes, with no visible residual cement scale remaining after two minutes of continuous cleaning. Analysis of the removed scale samples revealed a particle-size distribution ranging from 1 cm to 2.3 cm. These findings demonstrate that the descaling tool can efficiently remove the tubing scale without residue, highlighting its potential for practical descaling and unblocking operations. Moreover, the particle-size analysis confirms that the tool breaks the scale layer into fragments of relatively small size.
Another limitation of the experimental validation is the use of a cement-based artificial scale, which does not fully replicate the mineral composition or compressive strength of the hard, acid-insoluble scales encountered in actual gas wells (e.g., barium sulfate or calcium carbonate deposits). Consequently, the present experiments provide qualitative evidence of the tool’s descaling capability rather than a quantitative prediction of field removal rates. Future studies will employ real-scale samples or synthetic analogs with well-characterized mechanical properties to enable a more direct performance comparison.

4. Conclusions

This paper investigates the design optimization of a new cavitation-jet unblocking tool. The study includes the optimization of the tool’s structure, characterization of its flow field, and evaluation of its unblocking performance under different parameter conditions. Indoor descaling experiments were also conducted. The main conclusions are as follows:
(1)
A new cavitation-jet unblocking tool for tubing plugging was designed and its structure optimized via numerical simulation, focusing on three-dimensional velocity and cavitation performance. The results show that the length of the straight section has minimal impact on the flow field, while increasing the impeller’s rotation angle enhances both peak 3D velocity and cavitation inception capacity. Additionally, a thinner impeller yields greater radial velocity and expands the effective jet area. In this study, the optimal rotation angle is 540° and the optimal impeller thickness is 12 mm.
(2)
Compared with a converging-diverging jet nozzle, the three-dimensional cavitation jet produced by this tool has larger tangential and radial velocity components, enabling it to exert shear and tensile forces more effectively on the scale sample. Thanks to the impeller and central orifice, the tool also exhibits enhanced cavitation inception capability. Displacement and standoff distance significantly influence jet impact pressure; the optimal spray distance is 16 mm (four times the outlet diameter). In field applications, displacement and standoff distance should be selected based on pump pressure, tool pressure drops, and other operational parameters.
(3)
A numerical simulation study of the unblocking tool’s sand-carrying capacity was conducted using an Eulerian multiphase flow model. The results show that increasing the displacement improves the tool’s sand-carrying capacity but only up to a saturation point; sand particle size has a strong influence, with larger particles reducing capacity and the greatest effect occurring in the 3–5 mm range; and higher fluid viscosity and density enhance performance, with an optimal viscosity of 0.03 Pa·s.
(4)
Indoor experiments on the optimized tool for descaling tubing showed that, under a standoff distance of 16 mm, a pump pressure of 20 MPa, and 2 min of continuous flushing, no scale remained on the inner wall of the experimental tubing, thus verifying the tool’s descaling effectiveness.
It should be noted that a direct quantitative comparison of scale removal performance between the proposed SSIJ tool and the conventional CDJ nozzle was not conducted. The optimal operating condition identified in this study corresponds to an injection pressure of 20 MPa and a standoff distance of 16 mm. The main limitation of this work is the absence of a fully coupled gas–liquid–solid simulation and direct erosion rate quantification, which will be addressed in future studies. In addition, the indoor experiments were conducted using a cement-based artificial scale rather than real field scale samples, so that the quantitative removal rates may differ under actual downhole conditions.

Author Contributions

X.G.: Writing—original draft, Visualization, Validation, Methodology, Formal analysis, Data curation, Conceptualization. J.Z.: Writing—review and editing, Supervision, Resources, Conceptualization. H.L.: Writing—review and editing, Software, Formal analysis. J.L.: Writing—review and editing, Methodology, Data curation. M.L.: Writing—review and editing, Methodology. Y.S.: Writing—review and editing. Y.Z.: review and editing, Supervision. X.W.: Writing—review and editing, Supervision, Resources, Conceptualization. All authors have read and agreed to the published version of the manuscript.

Funding

This work was financially supported by the Open Fund of the State Key Laboratory of Deep Geothermal Resources under Grant No. 30130255-25-FW2313-0001, Postdoctoral Fellowship Program, China Postdoctoral Science Foundation (Grant No. BX20250031), National Natural Science Foundation of China (Grant No. 52504010), and Science Foundation of China University of Petroleum, Beijing (Grant No. 2462025XKBH013).

Data Availability Statement

The original contributions presented in this study are included in the article. Further inquiries can be directed to the corresponding author.

Conflicts of Interest

Authors Xinfeng Guo, Hao Li, Jinxia Liu, and Mengxuan Li were employed by the company Sinopec (Beijing) New Energy Technology Research Institute Co., Ltd. Author Yuqi Sun was employed by the company CNPC Engineering Technology R&D Company Limited. The remaining authors declare that the research was conducted in the absence of any commercial or financial relationships that could be construed as a potential conflict of interest.

References

  1. Bi, K. Current Status and Trend of Key Technologies for Shale Gas Well Drilling and Completion in China. China Pet. Mach. 2024, 52, 12–20+28. [Google Scholar] [CrossRef]
  2. Zou, C.; Dong, D.; Wang, Y.; Li, X.; Huang, J.; Wang, S.; Guan, Q.; Zhang, C.; Wang, H.; Liu, H.; et al. Shale gas in China: Characteristics, challenges and prospects (I). Pet. Explor. Dev. 2015, 42, 753–767. [Google Scholar] [CrossRef]
  3. Ma, X.; Xie, J.; Yong, R.; Zhu, Y. Geological characteristics and high production control factors of shale gas reservoirs in Silurian Longmaxi Formation, southern Sichuan Basin, SW China. Pet. Explor. Dev. 2020, 47, 901–915. [Google Scholar] [CrossRef]
  4. Huang, F.; Mi, J.; Li, D.; Wang, R. Impinging Performance of High-Pressure Water Jets Emitting from Different Nozzle Orifice Shapes. Geofluids 2020, 2020, 8831544. [Google Scholar] [CrossRef]
  5. Sousa, A.; Matos, H.; Guerreiro, L. Preventing and removing wax deposition inside vertical wells: A review. J. Pet. Explor. Prod. Technol. 2019, 9, 2091–2107. [Google Scholar] [CrossRef]
  6. Mukhametshina, A.; Martynova, E.G. Electromagnetic Heating of Heavy Oil and Bitumen: A Review of Experimental Studies and Field Applications. J. Pet. Eng. 2013, 2013, 476519. [Google Scholar] [CrossRef]
  7. Pan, H.; Hu, Y.; Kang, Y.; Liu, H.; Li, L.; Wu, S.; Liu, Y. A novel approach to descaling in oil and gas wells: Laser-assisted water jet descaling. Geoenergy Sci. Eng. 2025, 254, 214055. [Google Scholar] [CrossRef]
  8. Li, X. Research status and prospect of plugging removal and production increasing methods in oil and gas wells. Petrochem. Ind. Technol. 2016, 23, 75–77. [Google Scholar]
  9. Jin, Z.; Xing, Z.; Peng, C.; Qi, P.; Jiaqi, R. Development of Coiled Tubing Jet Tools with Multi-Hole Nozzles and Cleaning Parameter Optimization. Pet. Drill. Tech. 2023, 51, 83–89. [Google Scholar] [CrossRef]
  10. Guha, A.; Barron, R.M.; Balachandar, R. An experimental and numerical study of water jet cleaning process. J. Mater. Process. Technol. 2011, 211, 610–618. [Google Scholar] [CrossRef]
  11. Folkes, J. Waterjet—An innovative tool for manufacturing. J. Mater. Process. Technol. 2009, 209, 6181–6189. [Google Scholar] [CrossRef]
  12. Gong, Y.J. Research Status and Development Trend of Abrasive Water Jet Cutting Technology. Chin. Hydraul. Pneum. 2016, 10, 1–5. [Google Scholar] [CrossRef]
  13. Yang, X.; Yang, L. Numerical Simulation of High-Pressure Water Jets in Air by an Elliptic–Blending Turbulence Model: A Parametric Study. Mathematics 2025, 13, 1646. [Google Scholar]
  14. Dickinson, W.; Nordlund, R.; Nelson, V.; Smolarchuk, P. Conical Water Jet Cleanout Of Plugged Injector Wells. In Proceedings of the Annual Technical Meeting, Anaheim, CA, USA, 1–5 May 1989. [Google Scholar]
  15. Li, J.; Li, G.; Huang, Z.; Song, X.; Yang, R.; Peng, K. The self-propelled force model of a multi-orifice nozzle for radial jet drilling. J. Nat. Gas Sci. Eng. 2015, 24, 441–448. [Google Scholar] [CrossRef]
  16. Song, X.; Li, G.; Huang, Z.; Zhang, L.; Tian, S.; Cui, L. Mechanism and Characteristics of Horizontal Wellbore Cleanout by Rotating Jets. In Proceedings of the IADC/SPE Asia Pacific Drilling Technology Conference and Exhibition, Tianjin, China, 9–11 July 2012. [Google Scholar]
  17. Xianzhi, S.; Gensheng, L.; Zhongwei, H.; Laibin, Z.; Shouceng, T.; Haizhu, W. Mechanism and Characteristics of Horizontal-Wellbore Cleanout by Annular Helical Flow. SPE J. 2013, 19, 45–54. [Google Scholar] [CrossRef]
  18. Hong, C.; Yang, R.; Huang, Z.; Liu, W.; Chen, J.; Cong, R. Experimental investigation on coal-breakage performances by abrasive nitrogen-gas jet with a conical nozzle. Int. J. Rock Mech. Min. Sci. 2021, 142, 104781. [Google Scholar] [CrossRef]
  19. Liu, Y.; Zhang, J.; Wei, J.; Wang, C.; Cui, J. Impact pressure distribution of an SC-CO2 jet used in rock breakage. Geomech. Geophys. Geo Energy Geo Resour. 2021, 8, 27. [Google Scholar] [CrossRef]
  20. Du, P.; Peng, X.; Wei, Z.; Fan, Q. Internal flow field and rock-breaking characteristics of a straight-swirling mixed jet and its influential factors in radial jet drilling. Energy Sci. Eng. 2022, 10, 3411–3422. [Google Scholar] [CrossRef]
  21. Lee, K.-H.; Setoguchi, T.; Matsuo, S.; Kim, H.-D. An experimental study of underexpanded sonic, coaxial, swirl jets. Proc. Inst. Mech. Eng. Part C J. Mech. Eng. Sci. 2004, 218, 93–103. [Google Scholar] [CrossRef]
  22. Zhang, Y.; Wu, X.; Zhao, S.; Hui, C.; Li, G.; Li, J.; Lu, J.; Zhang, B. Numerical Simulation of the Straight-Swirling Integrated Jet and Its Application in Natural Gas Hydrate Drilling. SPE J. 2022, 27, 3724–3739. [Google Scholar] [CrossRef]
  23. Soyama, H. Cavitating Jet: A Review. Appl. Sci. 2020, 10, 7280. [Google Scholar] [CrossRef]
  24. Kan, Z.; Zhang, L.; Liu, X.; Wang, C.; Hao, D.; Ye, Z. Coal permeability evolution under coupled mining disturbance and gas extraction conditions: An experimental study. Nat. Gas Ind. B 2025, 12, 607–622. [Google Scholar] [CrossRef]
  25. Yang, L.; Li, Y.; Wang, D.; Guo, Y.; Li, D. Research on deposition particles carrying with washing tools during well cleaning. J. Pet. Sci. Eng. 2022, 219, 111097. [Google Scholar] [CrossRef]
  26. Yar-Adua, K.H.; John, I.J.; Abbas, A.J.; Lawal, K.A.; Kabir, A. An experimental study on high-pressure water jets for paraffin scale removal in partially blocked production tubings. J. Pet. Explor. Prod. 2020, 11, 973–988. [Google Scholar] [CrossRef]
  27. Wang, G.; Dong, M.; Wang, Z.; Ren, T.; Xu, S. Removing cuttings from inclined and horizontal wells: Numerical analysis of the required drilling fluid rheology and flow rate. J. Nat. Gas Sci. Eng. 2022, 102, 104544. [Google Scholar] [CrossRef]
  28. Akhshik, S.; Behzad, M.; Rajabi, M. CFD-DEM simulation of the hole cleaning process in a deviated well drilling: The effects of particle shape. Particuology 2016, 25, 72–82. [Google Scholar] [CrossRef]
  29. Yao, D.; Sun, X.; Qu, J. Identification and classification of solid–liquid flow patterns in deviated and horizontal annuli. Nat. Gas Ind. B 2025, 12, 386–404. [Google Scholar] [CrossRef]
  30. Yiqun, Z.; Xiao, H.; Xiaoya, W.; Gensheng, L.; Shouceng, T.; Shuai, Z. Experimental and Numerical Simulation Study of Natural Gas Hydrate Erosion by Swirling Jet. Pet. Drill. Tech. 2022, 50, 24–33. [Google Scholar] [CrossRef]
  31. Manninen, M.; Taivassalo, V.; Energy, V.; Kallio, S. On the Mixture Model for Multiphase Flow; U.S. Department of Energy Office of Scientific and Technical Information: Oak Ridge, TN, USA, 1996. [Google Scholar]
  32. ANSYS, Inc. ANSYS Fluent Theory Guide; ANSYS, Inc.: Canonsburg, PA, USA, 2013. [Google Scholar]
  33. Lei, C.; Deng, S.; Guan, J.; Chen, X.; Zheng, T. Flow field numerical simulation and erosion experiment research of submerged cavitating water jets. J. Chongqing Univ. Technol. 2015, 29, 71–76. [Google Scholar]
  34. Chen, Y.; Hu, Y.; Zhang, S. Structure optimization of submerged water jet cavitating nozzle with a hybrid algorithm. Eng. Appl. Comput. Fluid Mech. 2019, 13, 591–608. [Google Scholar] [CrossRef]
  35. Sultan, R.A.; Rahman, M.A.; Rushd, S.; Zendehboudi, S.; Kelessidis, V.C. Validation of CFD model of multiphase flow through pipeline and annular geometries. Part. Sci. Technol. 2019, 37, 685–697. [Google Scholar] [CrossRef]
  36. Xin, X. Numerical simulation research of cuttings transport in microhole annulus based on Eulerian two-fluid model. J. Cent. South Univ. 2023, 54, 4413–4423. [Google Scholar]
  37. Ding, J.; Gidaspow, D. A bubbling fluidization model using kinetic theory of granular flow. Aiche J. 2010, 36, 523–538. [Google Scholar]
  38. Gidaspow, D.; Bezburuah, R.; Ding, J. Hydrodynamics of Circulating Fluidized Beds: Kinetic Theory Approach; Illinois Institute of Technology, Department of Chemical Engineering: Chicago, IL, USA, 1991. [Google Scholar]
  39. Wen, C.Y.; Yu, Y.H. Mechanics of Fluidization. Chem. Eng. Prog. Symp. Ser. 1966, 62, 100–111. [Google Scholar]
  40. Ergun, S.; Orning, A.A. Fluid Flow through Randomly Packed Columns and Fluidized Beds. Ind. Eng. Chem. 1949, 41, 1179–1184. [Google Scholar] [CrossRef]
  41. Saffman, P.G. The lift on a small sphere in a slow shear flow. J. Fluid Mech. 1965, 22, 385–400. [Google Scholar] [CrossRef]
  42. Mei, R.; Klausner, J.F. Shear lift force on spherical bubbles. Int. J. Heat Fluid Flow 1994, 15, 62–65. [Google Scholar] [CrossRef]
  43. Wang, Z.; Fang, Z.; Wang, Z.; Zhang, M.; Liao, R. Improvement of sand-washing performance and internal flow field analysis of a novel downhole sand removal device. Sci. Rep. 2024, 14, 15482. [Google Scholar] [CrossRef] [PubMed]
  44. Schnerr, G.H.; Sauer, J. Physical and Numerical Modeling of Unsteady Cavitation Dynamics. In Proceedings of the Fourth International Conference on Multiphase Flow, New Orleans, LA, USA, 27 May–1 June 2001. [Google Scholar]
  45. Li, H.; Kelecy, F.J.; Egelja-Maruszewski, A.; Vasquez, S.A. Advanced Computational Modeling of Steady and Unsteady Cavitating Flows. In Proceedings of the ASME 2008 International Mechanical Engineering Congress and Exposition, Boston, MA, USA, 31 October–6 November 2008; pp. 413–423. [Google Scholar]
  46. Zhang, Y.; Wu, X.; Li, G.; Hu, X.; Hui, C.; Tan, Y.; Huang, H. Study on erosion performance of swirling cavitating jet for natural gas hydrate. Zhongnan Daxue Xuebao (Ziran Kexue Ban)/J. Cent. South Univ. (Sci. Technol.) 2022, 53, 909–923. [Google Scholar] [CrossRef]
  47. Huque, M.M.; Butt, S.; Zendehboudi, S.; Imtiaz, S. Systematic sensitivity analysis of cuttings transport in drilling operation using computational fluid dynamics approach. J. Nat. Gas Sci. Eng. 2020, 81, 103386. [Google Scholar] [CrossRef]
  48. Jia, B.; Zhao, Z.; Wang, X.; Chen, C.; Ma, X.; Wu, J.; Yang, L.; Politaeva, N. Local film thickness in relation to the droplet topological structure of droplet falling film on micro-nano structured horizontal tubes. Case Stud. Therm. Eng. 2026, 83, 108125. [Google Scholar] [CrossRef]
  49. Yao, L.; Zhao, Y.; Li, D.; Pei, Y.; Yao, H.; Zhao, M. Numerical research of the environmental influence of different depth on the shape of cavitation jet. Chin. J. Hydrodyn. 2014, 29, 675–682. [Google Scholar]
  50. Epelle, E.I.; Obande, W.; Okolie, J.A.; Wilberforce, T.; Gerogiorgis, D.I. CFD modelling and simulation of drill cuttings transport efficiency in annular bends: Effect of particle size polydispersity. J. Pet. Sci. Eng. 2022, 208, 109795. [Google Scholar] [CrossRef]
  51. Song, X.; Li, G.; Wang, M.; Yi, C.; Su, X. Numerical Simulation on Cuttings Carrying Regularity for Horizontal Wells Drilled with Coiled Tubing. Pet. Drill. Tech. 2014, 42, 28–32. https://syzt.com.cn/article/doi/10.3969/j.issn.1001-0890.2014.02.006.
  52. Xie, W.; Luo, Z.; Wang, H.; Zhou, Y.; Liu, Q.; Zhu, Y. Experimental investigation on double wedge type-V shock/shock interaction control subject to SparkJet array. Acta Mech. Sin. 2026, 42, 125207. [Google Scholar] [CrossRef]
  53. Liao, H.; Li, G.; Niu, J. Influential factors and mechanism analysis of rock breakage by ultra-high pressure water jet under submerged condition. Yanshilixue Yu Gongcheng Xuebao/Chin. J. Rock Mech. Eng. 2008, 27, 1243–1250. [Google Scholar]
Figure 1. Schematic of wellbore scaling.
Processes 14 02138 g001
Figure 2. (a) Straight jet, showing purely axial velocity vectors and a cylindrical jet envelope; (b) Rotating jet, illustrating tangential velocity components with a diverging spray pattern; and (c) The straight-swirling integrated jet (SSIJ).
Processes 14 02138 g002
Figure 3. Tool Geometry Model Diagram.
Processes 14 02138 g003
Figure 4. SSIJ Tool solid model.
Processes 14 02138 g004
Figure 5. SSIJ Tool field working principle.
Processes 14 02138 g005
Figure 6. Tool meshing diagram.
Processes 14 02138 g006
Figure 7. Wellbore meshing diagram.
Processes 14 02138 g007
Figure 8. Grid-independent analysis.
Processes 14 02138 g008
Figure 9. Distribution of time-averaged velocity and turbulence intensity at the tool inlet.
Processes 14 02138 g009
Figure 10. Velocity distribution for different linear segment lengths: (a) axial velocity; (b) tangential velocity; (c) radial velocity.
Processes 14 02138 g010aProcesses 14 02138 g010b
Figure 11. Gas-phase distribution of the flow field at different linear segment lengths; (a) clouds of gas-phase distribution; (b) axial gas-phase volume fraction.
Processes 14 02138 g011aProcesses 14 02138 g011b
Figure 12. Velocity distribution for different impeller rotation angles: (a) axial velocity; (b) tangential velocity; (c) radial velocity.
Processes 14 02138 g012
Figure 13. Gas-phase distribution of the flow field at different impeller rotation angles: (a) clouds of gas-phase distribution; (b) axial gas-phase volume fraction.
Processes 14 02138 g013
Figure 14. Velocity distribution for different impeller thickness: (a) axial velocity; (b) tangential velocity; (c) radial velocity.
Processes 14 02138 g014
Figure 15. Gas-phase distribution of the flow field at different impeller thicknesses: (a) Clouds of gas-phase distribution; (b) Axial gas-phase volume fraction.
Processes 14 02138 g015
Figure 16. Axial velocity distribution cloud; (a) CDJ nozzle; (b) SSIJ tool.
Processes 14 02138 g016
Figure 17. Axial velocity distribution.
Processes 14 02138 g017
Figure 18. Tangential and radial velocity distribution cloud; (a) SSIJ tangential velocity; (b) CDJ tangential velocity; (c) SSIJ radial velocity; (d) CDJ radial velocity.
Processes 14 02138 g018
Figure 19. Cloud view of gas-phase volume fraction distribution; (a) CDJ nozzle; (b) SSIJ tool.
Processes 14 02138 g019
Figure 20. Impact pressure distribution at different displacements; (a) Impact pressure distribution cloud; (b) Impact pressure distribution.
Processes 14 02138 g020
Figure 21. Impact pressure distribution at different standoff distances: (a) Impact pressure distribution cloud; (b) Impact pressure distribution.
Processes 14 02138 g021
Figure 22. Experimental equipment diagram; (a) Electric high-pressure pump combination diagram; (b) Diagram of continuous jet rock-breaking experimental device. (the Chinese warning label on the apparatus reads ‘Caution: Safety’).
Processes 14 02138 g022
Figure 23. Experimental cement scaling diagram.
Processes 14 02138 g023
Figure 25. Experimental results.
Processes 14 02138 g025
Table 1. Tool Size Chart.
Unit/mmHRiDTLθrRoδ
CDJ152.725//47202418
SSIJ152.725253.547202418
Disclaimer/Publisher’s Note: The statements, opinions and data contained in all publications are solely those of the individual author(s) and contributor(s) and not of MDPI and/or the editor(s). MDPI and/or the editor(s) disclaim responsibility for any injury to people or property resulting from any ideas, methods, instructions or products referred to in the content.