


Abstract
The visual quality of beverages is a major factor affecting consumers’ perception, quality evaluation, and market acceptance. Traditional colorimetric analysis is accurate but requires specialized equipment, time-consuming sample preparation, and substantial financial and time investment. The objective of this study was to develop a rapid, inexpensive, and accurate alternative method to predict the main color attributes of a date syrup–buttermilk beverage during processing and storage using an artificial neural network (ANN) approach. A multilayer perceptron ANN was developed using a back propagation algorithm. The ANN included three input variables (concentration of date syrup, storage cooling temperature, and storage time), one hidden layer with twenty neurons, and nine output color attributes (lightness, redness/greenness, yellowness/blueness, hue angle, Chroma, total color difference, browning index, whiteness index, and yellow index). To compare the effectiveness of the ANN model for the prediction of color attributes, the multiple linear regression (MLR) models were developed using the same inputs and the same training dataset. Experimental results indicated that all processing variables and their interactions had a significant effect on the color attributes of the beverage (p < 0.001). The trained ANN model exhibited excellent prediction capacity during the validation phase with high coefficients of determination (R2 range was between 0.9974 and 0.9997) with lower root mean squared error than MLR. Moreover, sensitivity analysis indicated date syrup concentration as the most influential factor on the final color profile. The developed ANN model provides an effective approach for the offline prediction of color quality during processing and storage under laboratory conditions. Although the integration of the ANN model with inline sensors may offer opportunities for future intelligent quality-control applications, real-time implementation and industrial deployment were not evaluated in the present study.
1. Introduction
Beverage appearance is an important quality attribute having a significant influence on consumer perception, acceptance, and marketability. Color is the primary visual cue for assessment of product worth and is an indicator of formulation uniformity, freshness, flavor intensity, and storage stability [1,2,3]. The dynamic nature of color stability in dairy-based matrices is greatly affected by ingredient composition, thermal treatment, fermentation, homogenization, pH shifts, and storage conditions [2,4,5,6]. Thus, precise tracking and mathematical projection of color kinetics are essential to ensure product uniformity along the supply chain. As consumers are seeking nutrient-rich alternatives to refined sugars, development has been focused on functional dairy beverages with natural sweeteners [6]. Date syrup, locally called “dibs”, is a promising candidate because of its high content of monosaccharides, minerals, polyphenols, and antioxidants [7,8,9,10]. However, the addition of date syrup to dairy systems presents complex quality challenges. Syrup pigments interact with milk proteins and non-enzymatic browning reactions (e.g., Maillard browning) during storage and dramatically alter the beverage’s color and chromatic profile [7]. Since the change of color during storage of dairy products correlates with consumer perception of freshness and flavor uniformity, manufacturers need to be able to accurately track these changes [2].
Instrumental color analysis is based on the CIELAB (L*, a*, and b*) basic color space [11] and derived indices such as total color difference, Chroma, hue angle, browning index, whiteness index, and yellowindex [12,13,14]. Although these indices provide a comprehensive profile of visual stability, conventional assessment requires specialized colorimeters or spectrophotometers. These laboratory methods are inherently destructive, time-consuming, expensive, and impractical for real-time industrial monitoring [15]. To avoid such limitations, predictive modeling has been proposed to directly predict color attributes, as example in dyeing processes [16].
However, conventional mathematical models have some limitations in describing the complex and non-linear interactions of complex food matrices, whereas ANNs are well suited for mapping and understanding such relationships without the need for fixed mechanistic equations [17,18,19,20,21]. ANNs have been successfully used for monitoring quality changes of standard dairy fluids and fermented beverages [3,14,22]. However, there is a distinct lack of systematic data regarding the non-linear color kinetics of polyphenol-rich, sugar-dense matrices like date syrup–buttermilk mixtures under varied thermal and temporal conditions. The simultaneous interplay of date syrup concentration, fluctuating storage temperatures, and time creates a very non-linear trajectory of browning that has not been modeled yet. In an attempt to fill this gap, this work presents a novel data-driven framework to track color changes in complex functional dairy formulations. The specific objectives of this work were as follows:
- To measure the joint effect of date syrup concentration (5, 10, and 15% w/w), storage cooling temperature (0, 5, 10, and 15 °C), and storage time (0 to 15 days) on three basic color spaces and six derived color parameters.
- To develop and validate an multilayer perceptron (MLP) ANN model to estimate these nine different color attributes offline.
- To perform a sensitivity analysis to identify and isolate the most mathematically dominant factor driving visual degradation. This research ultimately provides a rapid, low-cost, and non-destructive computational tool suited for industrial quality control, shelf-life optimization, and real-time process control in functional dairy manufacturing.
2. Materials and Methods
2.1. Preparation of Date Syrup–Buttermilk Beverage
Date syrup–buttermilk beverages were prepared using different syrup concentrations and stored under controlled cooling temperature conditions to evaluate changes in their color characteristics during storage. Commercial date syrup and fresh buttermilk purchased from a local market in Riyadh, Saudi Arabia. The date syrup was formed from Khlass dates (Phoenix dactylifera L.), one of the most vital date cultivars in Saudi Arabia [23]. Additionally, the buttermilk is manufactured using cow’s milk. Three date syrup concentrations were prepared (5, 10, and 15% w/w) and calculated as the weight of date syrup relative to the total beverage weight. The date syrup was added to buttermilk and mixed at room temperature for 2 min using a commercial electric drink mixer (T2, MACAP, Maerne, Italy). The prepared beverage samples were stored at four refrigerated storage temperatures: 0, 5, 10, and 15 °C. Color measurements were conducted at six storage times: 0, 3, 6, 9, 12, and 15 days.
The experiment was conducted in a full factorial design with three factors: date syrup concentration (three levels), storage cooling temperature (four levels), and storage time (six levels), resulting in 72 treatment combinations. Color measurements performed in triplicate for each treatment combination, giving a total of 216 data points.
2.2. Color Measurement
The color characteristics of the date syrup–buttermilk beverage samples were measured using a CR-400 colorimeter (Konica Minolta, Tokyo, Japan). Before measurement, the colorimeter calibrated using a standard white calibration plate according to the manufacturer’s instructions.
The basic color parameters assessed were the yellowness/blueness (b*), lightness (L*), and redness/greenness (a*). L* is a measure of lightness in the system, with zero for black and one hundred for white. Positive a* values indicate redness, and negative a* values indicate greenness. Positive b* values indicate yellowness, and negative b* values indicate blueness. The color measurements were performed in triplicate for each treatment combination, and the average results were employed for further study. During March 2024, all color measurements were accomplished at the Food Engineering Laboratory, Department of Agricultural Engineering, College of Food and Agriculture Sciences, King Saud University, Riyadh, Saudi Arabia.
2.3. Calculation of Derived Color Parameters
In addition to the basic CIELAB color parameters, various derived color parameters were calculated to allow a more comprehensive evaluation of the color quality and stability of the date syrup–buttermilk beverages. These parameters were total color difference (ΔE), Chroma (C), hue angle (h°), whiteness index (WI), yellow index (YI), and browning index (BI). The total color difference (ΔE) calculated using Equation (1), as described by Fernandez-Avila et al. [24].
where L*, a*, and b* are the color values of each sample, and L0*, a0*, and b0* are the color values of the control sample. The beverage made with 5% date syrup, kept at a cooling temperature of 0 °C, and stored on day zero was the treatment-specific reference used in this study to calculate the ΔE. However, this treatment was chosen because it contained the lowest values of all the processing parameters that were examined. For this treatment, the measured color values were L0* = 58.6, a0* = −5.76, and b0* = 8.78. However, in milk-date syrup drinks, color is heavily influenced by the concentration and the specific cultivar of the date used [7].
Chroma (C), h°, WI, YI, and BI were determined using the following Equations (2)–(7) [12,14,25,26,27].
where
The derived color parameters used to assess changes in overall color difference, color saturation or Chroma, hue, whiteness, yellowness, and browning development during different processing treatments.
2.4. Artificial Neural Network Modeling
ANN modeling performed to predict the basic and derived color attributes of the date syrup–buttermilk beverages from the experimental processing and storage variables. The three input variables were date syrup concentration (% w/w), storage cooling temperature (°C), and storage time (days). The nine output variables were yellowness/blueness (b*), total color difference (ΔE), browning index (BI), lightness (L*), hue angle (h°), redness/greenness (a*), Chroma (C), yellow index (YI), and whiteness index (WI).
A multilayer perceptron ANN was developed using Qnet V.2000 software [28]. Although Qnet V.2000 is an earlier neural network software package, it implements standard multilayer perceptron and back propagation algorithms that remain widely accepted in predictive modeling research. The software version has less impact on the ANN models’ prediction performance than the network architecture, training procedures, and data quality.
Before training, the input and output data were normalized by Qnet V.2000 within the range of 0.15–0.85 to improve training efficiency and numerical stability using Equation (8):
where is the normalized value, is the original value, and and are the minimum and maximum values of the corresponding variable. After prediction, the normalized outputs were reverse scaled to their original units.
The experimental dataset was randomly divided into training, testing, and validation datasets with a ratio of 70, 15, and 15 points, respectively. To ensure independence among datasets, the partitioning procedure was performed at the treatment–combination level rather than at the individual observation level. All replicate measurements corresponding to a specific treatment combination were assigned exclusively to a single dataset (training, testing, or validation), thereby preventing information leakage between subsets.
The training dataset was employed to adjust the weights of the ANN model and minimize the prediction error, the testing dataset was employed to stop the training and select the best ANN model, and the validation dataset was employed to evaluate the robustness and predictive capability of the resulting ANN model.
The ANN models trained for up to 10,000 iterations. Qnet V. 2000 adjusted the learning rate, while the momentum rate kept constant at 0.80. The best ANN model was selected based on the lowest prediction error, especially root mean square error (RMSE), and the highest correlation coefficient between experimental and target values. The best ANN architecture was three input neurons, one hidden layer with twenty neurons, and nine output neurons, i.e., a 3-20-9 network with a sigmoid activation function (Figure 1).
Figure 1.
Schematic diagram of the selected 3–20–9 ANN architecture used for predicting the color attributes of date syrup–buttermilk beverages.
2.5. Development of Multiple Regression Models
To compare the performance of the developed ANN model for prediction of color attributes of date syrup–buttermilk beverages, an MLR model for each color parameter was constructed using the three processing elements—concentration of date syrup, storage temperature, and storage time—as input variables to predict color attributes of date syrup–buttermilk beverages. The multiple regression technique will estimate the parameters b0, b1, …, bq of the linear equation: y = b0 + b1 × 1 + … + bqxq. The regression coefficients b0, b1, …, bq represent the independent contributions of each independent variable × 1, …, xq to the prediction of the dependent variable y. However, b0 is the intercept (the value of y when all predictors are zero). MLR models were developed using the same training data set, during ANN trainingand the prediction ability of the MLR model was evaluated using the test data set. MLR models were created using SPSS software version 22.0 (SPSS Inc., Chicago, IL, USA).
2.6. ANN Model Performance Evaluation
The prediction performance of the developed ANN ANN and MLR models was evaluated by comparing the experimental (observed) and predicted values of the color attributes. The model accuracy is judged by mean absolute percentage error (MAPE), root mean square error (RMSE), mean squared error (MSE), mean absolute error (MAE), and coefficient of determination (R2) as specified in Equations (9)–(13) [29,30].
where is the observed value, is the predicted value, is the mean observed value, and is the number of observations in all datasets. Lower RMSE, MSE, MAE, and MAPE values designate better predictive accuracy, while R2 values closer to one indicate stronger agreement between observed and estimated values.
2.7. Contribution Percentage and Sensitivity Analysis
The contribution percentages were determined by the input contribution analysis function implemented in the software Qnet V.2000. This function estimates the relative influence of each input variable based on the weights of the connections in the trained neural network. The calculated percentages were used to rank the importance of date syrup concentration, storage period, and storage cooling temperature in predicting the color attributes of the beverage. For more information about how the Qnet V.2000 determines the contribution percentages, the readers can refer to [8].
The three input variables assessed were date syrup concentration, storage cooling temperature, and storage time. The output variables were L*, a*, b*, ΔE, C, h°, BI, WI, and YI. In order to determine the relative influence of each input variable on each color parameter predicted, the percentage contribution of each input variable was calculated. This analysis served to identify which processing parameter had the most significant impact on the predicted color quality of the beverage. Higher percentage contributions meant that the corresponding input variable had greater influence on the ANN output response.
2.8. Statistical Analysis
The experimental data were statistically analyzed using three-way analysis of variance (ANOVA) to evaluate the impacts of date syrup concentration, storage cooling temperature, storage time, and their interactions on the basic and derived color parameters of the date syrup–buttermilk beverages. The experiment organized according to a completely randomized design.
When significant differences are detected, mean comparisons are achieved via the least significant difference (LSD) test. Differences believed statistically significant at p ≤ 0.05. Statistical analysis was performed using SAS 9.4 software [31]. Pearson correlation analysis was accomplished to assess the relationships among the processing variables and color attributes. The correlation analysis was executed using SPSS software version 22.0 (SPSS Inc., Chicago, IL, USA).
3. Results and Discussion
3.1. Statistical and Correlation Analysis
The samples’ color characteristics, L*, a*, and b*, were found to differ significantly, and the inclusion of date syrup in the drink’s composition altered the samples’ color. The lightness, or L* parameter, has a range of zero (black) to one hundred (white). The degree of red (+a*) or green (−a*) color is indicated by the a* parameter, while the degree of yellow (+b*) or blue (−b*) color is measured by the b* parameter.
The findings were statistically examined. The analysis of variance of the three processing parameters affecting the color characteristics is presented in Table 1, Table 2 and Table 3. The significance of the results was evaluated using the F test at a significance threshold of p = 0.05. Based on the values of significance level Pr > F (Table 1, Table 2 and Table 3), all processing factors had a highly statistical significance (p < 0.001) for the main effect, and the probable interactions also had high significant effect on all color attributes.
Table 1.
Source of variation, degrees of freedom (Df), and significant level of factors affecting the L*, b*, and a* of the created drinks.
Table 2.
Source of variation, degrees of freedom (Df), and significant level of factors affecting the AE, hue angle, and Chroma of the created drinks.
Table 3.
Source of variation, degrees of freedom (Df), and significant level of factors affecting the WI, BI, and YI of the created drinks.
The correlation analysis of processing factors and color attributes of created drinks in general showed the association of three processing factors and color attributes (Table 4). Processing factors, however, were not associated. The correlation data also shows different relationships between the color parameters. From Table 4, all the relationships between processing factors and color attributes had extraordinarily strong, strong, moderate, and weak correlations. Furthermore, negative and positive correlations with different statistical significances were among the parameters. The highest correlation observed between the brown index (BI) and the yellow index (YI) (r = 0.999; p < 0.01) (Table 4). A similar inter-relationship was found in the color characteristics in the study of Sliwinski et al. [32]. L* was negatively related with a*, b* and ΔE, whereas a*, b* and ΔE were positively correlated with each other in all the developed beverages and storage conditions. However, according to Sliwinski et al. [32], ΔE has become an important indicator of thermal depreciation. The preferred color index is typically determined by industry norms. For example, when it comes to baked or fried foods, the food business frequently favors the browning index. Color components like the yellow index were necessary when evaluating the compositional and quality criteria of unconcentrated and refractive window-concentrated milk [14].
Table 4.
Person correlation coefficients among processing factors and color attributes of the created drinks (overall dataset).
3.2. Analysis of Experimental Data for Basic and Derivate Color Parameters
The milk product’s color may be a sign of physicochemical alterations. Instrumental color analysis has been frequently utilized to identify color variations in dairy products over storage because color changes, especially over storage time, are important quality parameters in this context [33]. Additionally, the “a*” and “b*” parameters are influenced by factors related to the amount of natural pigment in milk, and variations in the color parameters of milk drinks among studies may be caused by potential chemical changes in the milk (the carotenoid, protein, and riboflavin content) [2]. The possible expected reason for the variations in color data is the fact that milk color is affected by various factors, including both hereditary and nongenetic factors. The physical structure of milk is also changing by storage conditions and technical processes causing variations in color [4] especially for L* values [5].
The basic color parameters of the developed drink samples were measured at room temperature (24 ± 2 °C). Table 5 displays the statistical description of the basic and derivative color parameters of the fresh buttermilk and date syrup. Table 6 depicts descriptive statistics for the processing factors and color attributes data pulled from the experimental work. According to the International Commission on Illumination, for L*, one hundred is a perfect white sample and zero is a perfect black sample; for a*, positive values indicate redness and negative values indicate greenness; and for b*, positive values indicate yellowness and negative values indicate blueness [11].
Table 5.
The arithmetic means of triplicate samples and standard deviation of the basic and derivative color parameters of fresh buttermilk and date syrup.
Table 6.
Descriptive statistics for the processing factors and color attributes data pulled from the experimental work.
As shown in Table 5, color attributes of fresh Khalas date syrup were 3.81, 6.31, and 5.03, respectively, for L*, a*, and b*. However, melanoidins, which are produced by Maillard reactions between reducing sugars (mostly glucose and fructose) and amino acids during processing, are confirmed to be the main pigments in date syrup. The primary cause of date juice’s dark hue is these high-molecular-weight brown nitrogenous polymers [9]. The color characteristics (L, a, and b*) of syrup date derived from Magdy dates were darker (L = 2.57), less red (a = 2.65), and less yellow (b = 3.51) in the research of [34]. Khalas syrup was the highest in yellowness (b) (10.21), followed by Salma syrup (9.19). These attributes for fresh buttermilk, respectively, are 77.66, 3.98, and 10.26 (Table 3). Cadwallader et al. [35] reported the L, a, and b* values of the 1% fat aseptic milk at the beginning of storage were 83.68, −2.66, and 7.53, respectively. The differences may be related to product type and compositions. In the study done by Alhamdan et al. [7], L*, a*, and b* were 95.82, −2.45, and 10.57 for fermented cow’s milk (laban) and 6.89, 2.23, and 7.59 for date syrup of the Khalas variety acquired from a date factory in the Alhasa area of Saudi Arabia, respectively.
Based on Table 5, the derived color attributes that are helpful indications of product quality and stability include hue angle, Chroma, WI, browning index, and YI, which were 21.20, 11.00, 75.09, 17.42, and 18.87, respectively, for fresh buttermilk; and for fresh Khalas date syrup, they were, respectively, 37.15, 6.31, 3.60, 418.91, and 195.24. However, L*, a*, b*, Chroma, hue angle, and BI were 6.892, 2.231, 7.588, 7.91, 52.103, and 277.498, respectively, for Khlass date syrup, as reported by Elamshity and Alhamdan [36]. L*, a*, b*, Chroma, hue angle, and BI were reported by Elamshity and Alhamdan [36] for cow milk as 95.795, −2.113, 9.064, 9.307, −53.303, and 8.064, and, for camel milk, the values were 94.912, −1.274, 5.627, 5.77, −53.432, and 4.978. The browning index (BI) for date syrup is typically different, depending on the extraction method, concentration, and temperature used during processing. It is a measure of non-enzymatic browning [10]. The BI value for the fresh buttermilk (BI = 17.42) was lower than that of date syrup (as indicated in Table 1; BI = 418.91). The BI values of the buttermilk–date syrup beverages were lower than those of date syrup alone because the buttermilk and date syrup had distinct hues. Milk drinks with additions are usually formulated to have bright attractive colors, frequently matching certain fruit, grain, or dessert flavors. Depending on the additions, the colors can vary from brilliant yellow to deep red, green, and blue, but they are natural [37]. Furthermore, based on the results of ΔE (Table 5), the values are in the range of 0 to 4.17. However, these values rest on the assumption of the initial color space of L*, a*, and b*. It is clear that the values of ΔE are greater than approximately 2–3, which is often regarded as visually distinguishable; the observed changes across storage conditions are actually perceptible, while ΔE above 5 means the color is clearly different [38]. In their study, Fikry et al. [39] observed an increase in ΔE and BI of the date drink during storage time. The observed differences in ΔE and browning index due to the storage cooling temperature are substantially lower than the commonly reported perceptibility threshold of approximately 2–3 ΔE units. Therefore, although these effects were statistically significant, their practical or sensory relevance may be limited within the investigated experimental range. The raw color coordinates presented in Table 7 further confirm that date syrup concentration was the dominant factor affecting color variation. The magnitude of color changes associated with date syrup concentration was considerably larger than those produced by storage time or storage cooling temperature. Consequently, the practical contribution of storage cooling temperature, and to a lesser extent storage time, appears relatively small compared with the effect of date syrup concentration.
Table 7.
Effects of storage time, storage cooling temperature, and date syrup concentration on the mean of the created drink’s basic and derivative color characteristics.
In this study, the addition of date syrup to the buttermilk caused the L* and WI values to decrease, as shown in Table 7, particularly in the range of 5% to 15% date syrup concentration; however, at a 5% date syrup concentration, the L* value was 58.27, and, at a 15% date syrup concentration, the L* value was 53.28. Furthermore, the WI value was 57.09 at a 5% date syrup concentration, but at 15% of the date syrup concentration, its value dropped to 51.39.
The positive b* value, which represents the yellowness, increases with the addition of date syrup to the buttermilk from 8.24 at a 5% date syrup concentration to 12.73 at a 15% date syrup concentration (Table 7). The negative a* value, which represents the degree of green within the color space, increases with the addition of date syrup to the buttermilk from −5.57 at a 5% date syrup concentration to −4.27 at a 15% date syrup concentration (Table 7). Additionally, the ΔE, hue angle, Chroma, BI, and YI increased with the addition of date syrup to the buttermilk in the range of 5% to 15%. The range of these parameters was 0.75, −34.08, 9.95, 7.50, and 20.10 at a 5% date syrup concentration, while at a 15% syrup concentration, their value increased with values of 6.81, −18.54, 13.43, 20.14, and 34.13, respectively.
According to our data, the lightness of buttermilk alone was higher than that of buttermilk containing date syrup. This finding may relate to the possible interactions between the date syrup compositions and the butter compositions. The addition of persimmon to whole milk caused color shift trends in L*, a*, and b* [40]. However, their samples were made with whole milk and varying concentrations of persimmon (10, 20, and 30% W/V). Lightness (L*) declined as persimmon content increased, whereas redness (a*) and yellowness (b*) increased. The yellow pigments, particularly the carotenoids from persimmon, are responsible for these color alterations in the samples. Furthermore, milk beverages with different date powder ratios turned darker with time, with lightness (L*) decreasing and color variation (ΔE) increasing over the storage period [41]. The difference compared to the present study may be due to the different composition between milk and buttermilk as well as the structure and manufactured date syrup. Elamshity and Alhamdan [36] discovered that the mean values of the milk drinks’ basic parameter (L*), which varied from 85.133 to 88.667 and ranged from zero for darkness to one hundred for whiteness (brightness), showed the impact of the date syrup (deep brown) on darkening the milk drinks’ color. They investigated cow milk + date syrup Sukkary (15%), cow milk + date syrup Khalass (10%), camel milk + date syrup Sukkary (15%), and camel milk + date syrup Khalass (10%). While the mean value of (b*) ranged from 13.383 to 15.262, the mean value of (a*) varied from −0.075 to 0.418. Due to an inadequate description of the methodology, color study results given for milk drinks or other food products, in the literature, were sometimes impossible to repeat or appropriately understand [2].
For optimizing the beverage manufacturing process, assessing shelf life, and ensuring quality control, accurate prediction of these color properties is crucial [42]. Reduced consumer preference and the loss of crucial nutritional components might result from changes in drink qualities over the course of their shelf life [39]. The shelf life [43] is the maximum amount of time that a food product can be stored under environmental conditions without any discernible deterioration in its quality or acceptability to customers, or the amount of time before the product is no longer suitable for human consumption [44]. However, shelf life is a crucial factor that involves a complex process, as it depends on various elements, including the food itself, storage conditions, packaging, and manufacturing processes. This is because color features usually become the most important quality characteristics because they contribute to consumer acceptance and control of the beverage industry processes [39]. Milk’s color is affected by storage duration, which typically results in a darkening of the product, especially at greater refrigeration temperatures. The non-enzymatic browning (Maillard reaction) between the proteins in the milk and the sugars in the date syrup is the main cause of the color shift [35]. However, the Maillard reaction, a nonenzymatic browning process, is brought on by a condensation reaction between reducing sugars (lactose and its hydrolysis products, glucose, and galactose, in milk).
Table 7 shows that the created drink’s basic and derived color parameters were impacted significantly by storage period. During the storage period, there was a substantial decline in the degrees of whiteness (p < 0.05) as well as in L*, b*, hue angle, Chroma, BI, and YI, which decreased as storage duration rose from 0 to 15 days. The developed buttermilk–date syrup had L* values ranging from 54.66 to 55.60 during the investigated storage period (Table 7), as well as b*, hue angle, Chroma, WI, BI, and YI, which were in the range of 9.38 to 10.65, −26.68 to −25.90, 10.83 to 11.83, 53.37 to 54.04, 12.61 to 13.94, and 25.51 to 27.55, respectively (Table 7).
In relation to a*, the findings showed that the control sample’s (0 storage days +5% date syrup concentration +0 °C storage cooling temperature) tendency toward greenness was negative during the first and last storage periods, ranging from −4.68 to –5.00, and that the degree of greenness increased at the end of the storage period compared to its beginning. Furthermore, for ΔE, the findings showed that the control sample (0 storage days, +5% date syrup concentration, +0 °C storage cooling temperature) had the lowest value of 3.83 and, during storage periods, the ΔE increased at the end of the storage period compared to its beginning, with a range of 3.83 to 4.59. In this direction, Fikry et al. [39] used a control sample to examine the impact of storage times ranging from 0 to 28 days on the color characteristics of the date-based energy drink. They discovered that, as storage time increased from 0 to 28 days, L* declined while b*, a*, ΔE, BI, and Chroma increased. This could be because of non-enzymatic browning, which could affect the variation in the color attributes L*, a*, and b* values. According to Alsaedi et al. [45], for milk, a*, b*, ΔE, hue angle, Chroma, YI, and BI rose after storage, while L* and WI decreased. According to Cadwallader et al. [35], the 1% fat aseptic milk’s L, a, and b* values at the start of storage were 83.68, −2.66, and 7.53, respectively. Because of the increased Maillard browning with time, the b* value rose with storage duration. Although the sugar syrup additions may have contributed to the variations in the b* trend between the current study and other investigations, the Maillard reaction—a nonenzymatic browning event—is still to blame. Following fermentation and five, ten, and fifteen days of storage at 4 °C, the color of treated date press cake-based drinkable yogurt was measured by adding 0 (control), 2, 4, and 6% (g/100 g) of its powder to drinkable yogurt before fermentation. The date press cake yogurt treatments had L* values ranging from 69.83 to 78.45, compared to the control treatment of 96.75 during the first storage period, according to the color measurement value determinants provided by the Hunter Lab (L*, a*, and b*). Furthermore, at the conclusion of the storage period, they ranged from 45.92 to 57.54 in comparison to the control treatment and 72.6. During the storage period, there was a substantial decline in the degrees of whiteness (p < 0.05). In relation to a*, the findings showed that the control sample’s tendency toward greenness was negative during the first and last storage periods, ranging from −4.24 to −1.91, and that the degree of greenness decreased at the end of the storage period compared to its beginning [46].
Table 7 also demonstrates how storage cooling temperature has a substantial impact on the basic and derived color parameters of the produced drinks. While b*, Chroma, ΔE, BI, and YI dropped as storage cooling temperature rose from 0 °C to 15 °C. In relation to L*, a*, hue angle, and WI, the results revealed that they rose as storage cooling temperature rose from zero to fifteen °C. The range of L*, b*, a*, ΔE, hue angle, Chroma, WI, BI, and YI were 55.02–55.25, 10.10–10.21, −4.95 to −4.72, 4.14–4.22, −26.66 to −25.86, 11.22–11.42, 53.58–53.85, 13.247–13.277, 26.31–26.71 as listed in Table 7, respectively, when storage cooling temperature changed.
The storage cooling temperature has a significant impact on the characteristics of milk drinks; lower temperatures (often between 2 and 4 °C) significantly slow down, but do not entirely stop, color deterioration and browning [47]. Higher storage temperatures (e.g., twenty °C to fifty °C) accelerate the Maillard process, resulting in lower luminosity (L) values, more yellowing (higher b* values), and quicker browning. Significant ΔE shifts occurred in 0.5% fat milk at 30 °C and both 0.5% and 3.8% fat milk at 50 °C [32]. Also, Karlsson et al. [48] and Ranvir et al. [49] found significant shifts toward yellow–brown tones and decreased lightness at elevated cooling temperatures of milk. For ten days, date powder–milk drinks containing 0%, 10%, 15%, 20%, and 25% weight/weight dates were chilled at 1 °C and 5 °C. Beverages with a color shift (ΔE) ranging from 12.93 to 35.55 were darker when date powder concentrations increased [41].
In addition, different additives added to dairy milk products can affect the color of the final product. As an example, yogurt enriched with flaxseed press cake showed a decrease in a* (redness) values due to fermentation [50]. The findings of a study that added ginseng root extract to yogurt demonstrated that the addition had an impact on the color values, as the L* values dropped from 93.96 to 90.99 and the a* and b* values rose from 2.92 and 2.30 to 5.91 and 11.11, respectively. A yellowish hue produced by darkness, lower luminosity L* relative to the control samples, and higher b* values [51]. The impact of yogurt containing tomato pomace on color measures during storage was noted by Alqahtani et al. [52]. The findings showed that the values of a* and b* increased while the whiteness values of L* decreased. Mkadem et al. [53] found that adding dried dates to a fermented milk drink improved its color features, particularly a* and b*. The a* value went from −1.8 ± 0.8 to 4.5 ± 0.2, while the b* value increased from 3.1 ± 0.1 to 12.1 ± 0.1.
3.3. Performance of the Developed ANN for Estimating Basic Derivate Color Parameters of the Created Drinks
The network definition and training control parameters of the selected ANN model are summarized in Table 8. The study focuses on estimating the fundamental and derived color characteristics of the manufactured drinks using ANN. ANN aims to develop a non-linear relationship that considers the effects of date syrup concentration, storage time, and storage chilling temperature on nine color features of the buttermilk–date dibs beverage. Different 3-layer and 4-layer ANNs were investigated. The 4-layer ANN model is not as effective as the 3-layer ANN model. Additionally, the sigmoid transfer function outperforms the hyperbolic tangent transfer function in practical terms. The best ANN model features a 3-20-9 structure and a sigmoid transfer function.
Table 8.
Training control parameters and network definition (extracted from Qnet V.2000) of the developed ANN model with a 3–20–9 architecture.
The RMSE for training data decreased continuously to a minimum of 0.006326 (Table 8 and Figure 2), and for testing data, it likewise decreased steadily to a minimum of 0.006555 (Table 8 and Figure 2). Next, for the cases outside of the training and test set, the correlation coefficient evaluated how well the network predictions trend with targets. The correlation coefficient ranged from −1 to 1 [54]. According to Figure 3, the training and testing data’s final correlation coefficient values were 0.999675 and 0.999608, respectively (Table 8 and Figure 3). As a result, there is a strong correlation between the target and output data in the constructed network.
Figure 2.
Iteration numbers and RMSE for the training and testing datasets for the developed ANN of the 3-20-9 structure.
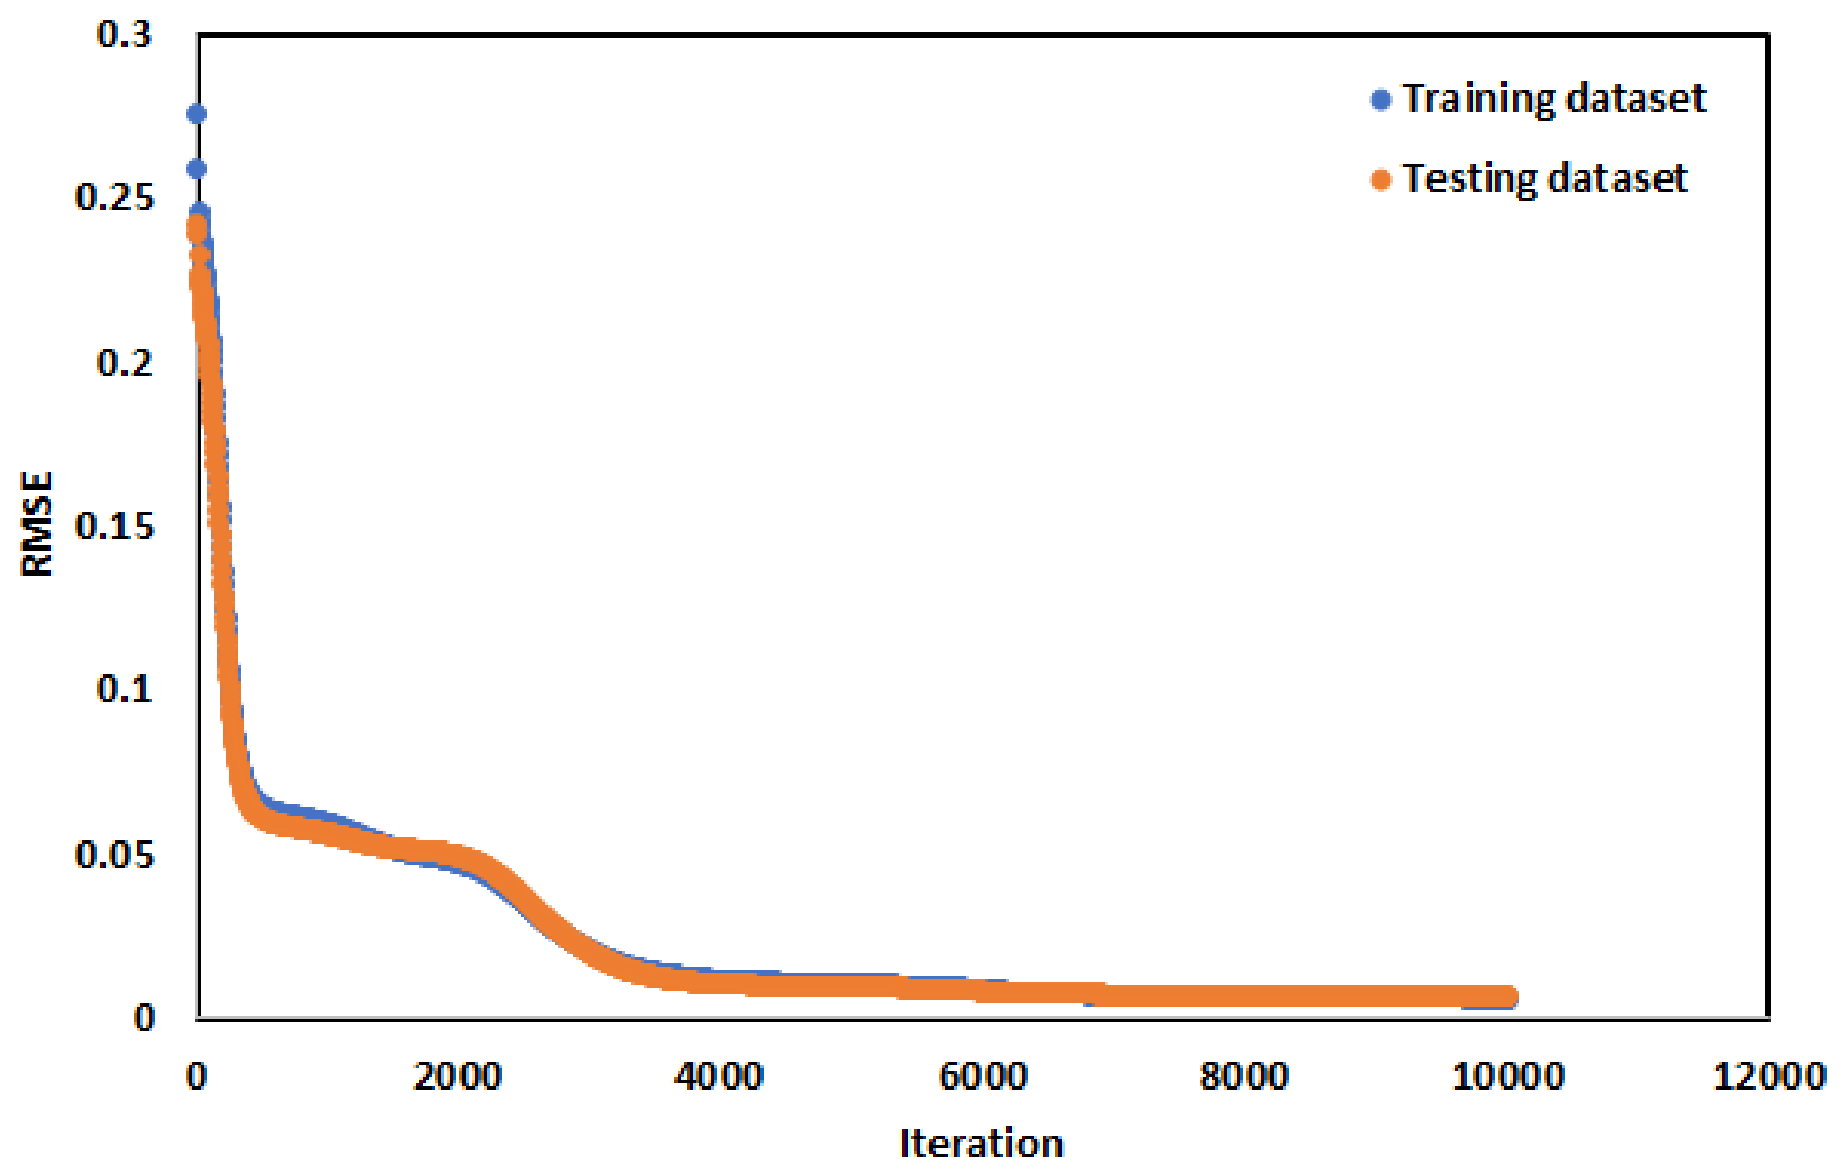
Figure 3.
Iteration and correlation coefficient for the training and testing datasets for the developed ANN of the 3-20-9 structure.
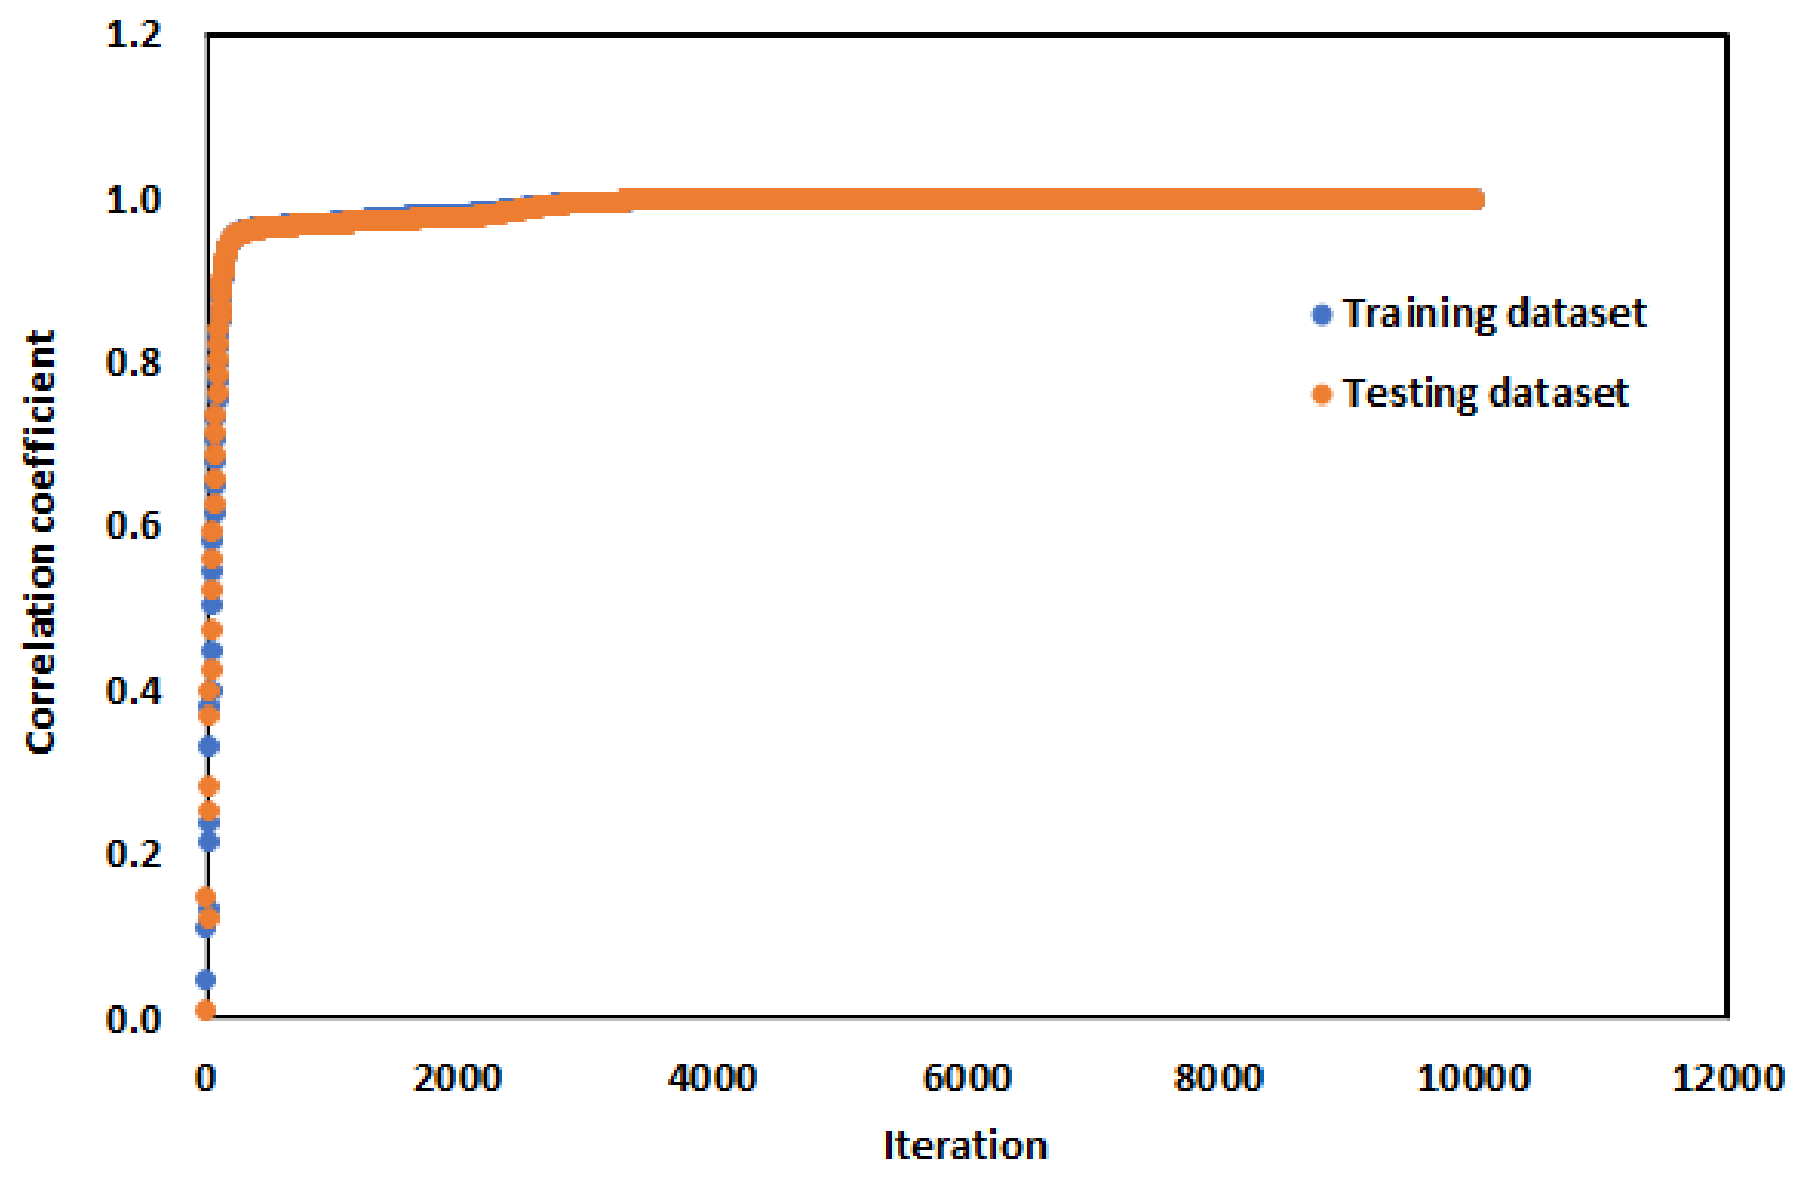
Figure 4 shows the graph that Qnet V.2000 produced based on the ANN modeloutput, which displays normalized network outputs against target values. The horizontal line denotes the training aim, and the vertical line represents the network output. Additionally, the model achieved an excellent overall agreement result when the location was near the red ideal agreement line. The statistical performance (Table 9) of the ANN model shows good correlation between the predicted and observed values of color characteristics in both training and testing datasets, which confirms the efficiency of the ANN model.
Table 9.
Statistical performance of the developed ANN with structure of the 3-20-9 of the created drinks (extracted from Qnet V.2000).
Figure 4.
Comparisons of normalized targets vs. outputs produced from Qnet V. 2000 for the developed ANN of structure of the 3-20-9 structure.
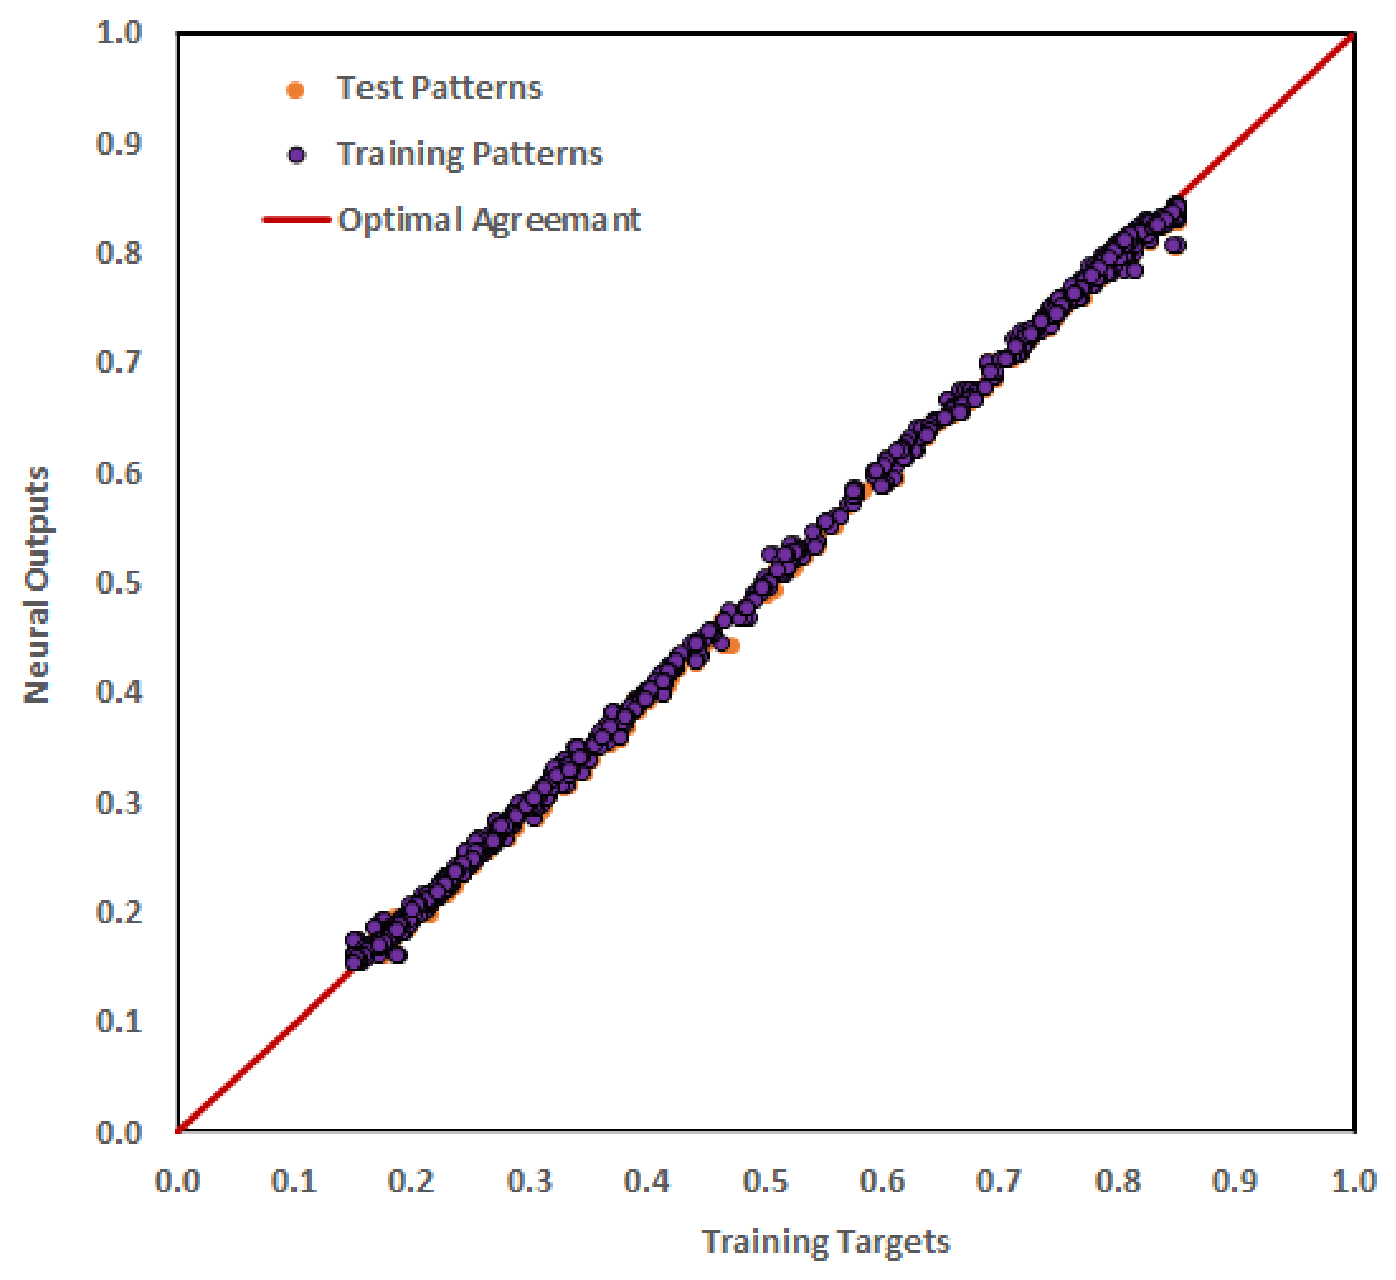
Figure 5, as an example, further strengthens the ANN model performance shown in Table 9, showing both training and testing dataset for the observed and predicted L*. This indicates a positive connection between expected and real L*. Moreover, the values of the statistical criteria—RMSE, MAE, MAPE, and MSE—as well as R2 for the training, validation, and testing datasets (Table 10), indicate that the model has low error and bias. The model learns the relations in the training data and generalizes well to predict color characteristics for unseen data, which shows the resilience and applicability of the model, as demonstrated in Figure 6 for L*.
Figure 5.
The relationship between observed and predicted L* of the created drinks using the training and testing datasets and the development of ANN structure of 3-20-9.
Table 10.
Values of statistical criteria, i.e., RMSE, MAE, MAPE, and MSE, as well as R2 for training, testing, and validation datasets using the developed ANN model.
Figure 6.
The relationship between observed and predicted L* of the created drinks using the validation dataset and the development of the ANN structure of 3-20-9.
The high R2 values (Table 10) for the validation dataset show a significant correlation between the predicted and real L*, which means that the model captures the underlying connections successfully. Similarly, low RMSE values for the validation dataset (Table 10) indicate strong accuracy and generalization of the model. This indicates a positive connection between expected and real L*. Moreover, the values of statistical criteria, RMSE, MAE, MAPE, and MSE for the training and testing dataset (Table 10) support the low error and bias of the model. The model learns the relations in the training data and generalizes well to predict color characteristics for unseen data, which shows the resilience and applicability of the model, as demonstrated in Figure 6 for L*. The high R2 values (Table 10) for the validation dataset show a significant correlation between the predicted and real L*, which means that the model captures the underlying connections successfully. Similarly, low RMSE values for the validation dataset (Table 10) indicate strong accuracy and generalization of model.
However, Figure 6 shows the relationship between observed and predicted L* of the created drinks using the validation dataset and the development ANN structure of 3-20-9 (R2 = 0.9992) for L*.
Overall, statistical criteria, i.e., RMSE, MAE, MAPE, and MSE, demonstrate the model’s effectiveness in accurately predicting color attributes for the created buttermilk–date syrup drinks based on the input variables. As stated by the literature, the prediction rests on the MAPE having a receiving level of 10% [55]. The MAPE values for the validation dataset were 0.0959, 0.3190, −0.3846, 3.4542, −0.5062, 0.0851, 0.3564, 0.5266, and 0.2834%, respectively, for L*, b*, a*, ΔE, hue angle, WI, Chroma, BI, and YI (Table 10).
Because they can accurately capture relationships between input and output variables regardless of nonlinearity, artificial neural networks (ANNs) are highly valued for empirical modeling. ANNs are particularly good at extracting knowledge from data without the need for a predefined fitting function, and they can accommodate a variety of nonlinear functions, including quadratic ones.
Although it is known that ANNs require more experimental data to be established, diverse research studies proved that they can be operative even with fewer data points used in the training stage, signifying their flexibility and pliability in empirical modeling [18,19,56]. The research articles demonstrated that the accuracy of ANNs in prediction is related to different parameters, such as training algorithms, the number of inputs, the type of ANN, the type of activation functions, etc.
The RMSE error curves for training and testing datasets used to understand overtraining behavior (Figure 2). The training dataset’s constant decline as the testing dataset’s error rose led to over-training [57]. Figure 2 shows that the RMSE curves for the training and testing datasets declined at the same time. In that instance, the model’s ability to forecast was unaffected by overtraining. Additionally, the created ANN model found in this work matched Beale et al.’s [58] criterion, that a successful model with minimal overfitting is one in which the validation correlation coefficient is near to the value from the training stage (Table 10). Additionally, the training performance (MSE) should be lower than the previous phases, and the difference between the validation and testing MSE should be minimal [57,58]. The best ANN model presented in this article also met these criteria (Table 10). Therefore, while designing new goods, the Dibbs milk drink makers would be able to save time and money by implementing the ANN model described in this study. Additionally, quickly determining color variations of any new advancements without the requirement for instrument-based color tests, which take time to prepare and collect data, can be realized.
For prediction of different qualities in foods such as thermal conductivity, moisture content, viscosity, color characteristics, drying behavior, and shelf-life parameters, ANNs can recogniz 22ethem [3,21,59]. Their high predictive ability makes them suitable for complex dairy-based formulations enriched with natural sweeteners. Furthermore, predicting color attributes can be useful for predicting the quality parameters of food. As an example, a multiple linear regression (MLR) model can employ quality characteristics such as fat %, pH, viscosity, density, and moisture content based on the color components (L*, a*, and b*) of both concentrated and unconcentrated milk [14]. Because of their accuracy and dependability, ANNs can be applied to predict food quality. Based on L*, a*, and b* values, ANNs are employed to estimate seafood storage times [60]. To train and evaluate the ANN model, the necessary dataset—which depicts the color changes of various seafood products—was gathered from the literature. After fitting the observed and anticipated time of storage data, a regression coefficient of 0.85 was detected. The study’s findings indicate that the suggested ANN model is accurate, dependable, and suitable for estimating seafood goods’ storage times. ANN models were employed by Nadian et al. [61] to assess color changes in apple slices that dried at temperatures between 50 and 70 °C with heated air blowing at a speed of 1–2 m/s. Their goal was to employ a computer vision system in conjunction with artificial neural networks (ANN) as a non-invasive, inexpensive, and simple technique for quickly and inline evaluating and regulating the color and moisture changes in food during drying. In general, food quality modeling has shown promise thanks to recent developments in artificial intelligence, especially the application of ANN. For example, ANN models have been used to forecast postharvest quality metrics in fruits such as apples, bananas, and mangoes, including firmness, weight loss, and color changes [62]. ANN has also been used to predict the growth of microorganisms and the shelf life of fresh produce in different storage conditions [63]. Because these models can capture nonlinear interactions in biological systems, they perform better.
Visual characteristics such as color are critical in today’s beverage production for brand consistency. However, measuring color in closed, sterile dairy processing and storage environments with inline colorimeters or camera-based vision systems poses significant challenges, including high hardware costs, complex calibration, and sensor obstruction from product buildup on optical surfaces. A “soft-sensor” approach can be employed to overcome these difficulties. By training an artificial neural network (ANN) using readily available process parameters such as formulation concentration, storage temperature, and time, producers can predict product color in real-time without disrupting closed process flow or requiring specialized optical equipment. Generally speaking, the presentation of the color quality level enables the manufacturer to alter the processing, which justifies the employment of the ANN in this study to forecast the color attributes of the generated beverage. The prediction of color quality at every stage of manufacturing is a novel aspect of the study. The study’s conclusion demonstrates the potential for enhancing the beverage’s quality based on its color, which is supported by both the technical findings and the belief that the beverage’s color matters to consumers.
3.4. Comparing the Effectiveness of the ANN Model with MLR Models for the Prediction of Color Attributes of Date Syrup–Buttermilk Beverages
To determine the relationship between the color attributes of date syrup–buttermilk beverages and the explanatory variables used in the study (storage period, date syrup concentration, and cooling temperature), MLR models were developed with the variables listed in Table 11. Results of regression coefficients and the coefficient of determination (R2) during the training phase of the MLR models of color attributes of date syrup–buttermilk beverages are shown in Table 11. In MLR models, regression coefficients represent the change in the dependent variable for a one-unit change in an independent variable, holding all others constant. However, regression coefficients are the foundation for quantifying the impact of predictors on the target outcome. Furthermore, the multiple linear regression model can be used for prediction, as well as for understanding the relationships between the dependent and independent variables [64]. Furthermore, the values of the statistical criteria—RMSE, MAE, MAPE, R2, and MSE—as well as R2 for the training, testing, and validation datasets (Table 12) indicate that the MLR models have low error and bias.
Table 11.
Results of the regression coefficients and coefficient of determination (R2) during the training phase of the MLR models of color attributes of date syrup–buttermilk beverages.
Table 12.
Values of statistical criteria, i.e., RMSE, MAE, MAPE, and MSE as well as R2 for training, testing, and validation datasets using the developed MLR models.
The study revealed that the ANN model R2 in the range of 0.9994 to 0.9997 in the validation phase (Table 10) demonstrated superior predictive capabilities for all color attributes compared to MLR’s R2 in the range of 0.7989 to 0.9973 in the validation phase (Table 12). Owing to ANN’s ability to model nonlinear relationships in the processing environment of producing the beverages’ data, its performance is better, although the multilinear regression models also performed better at all color attributes because of their linear storage cooling temperatures, date syrup concentration, and storage period dependency, but the ANN achieved higher coefficients of determination (R2) overall in the validation stage. These results confirm that ANN-based methodology can effectively predict color attributes of date syrup–buttermilk beverages and improve processing environments of the beverages’ data assessment.
The results indicated that the MLR models and the ANN model performed well in predicting the color attributes. In the validation phase, the ANN model had R2 in the range of 0.9994 to 0.9997 and RMSE in the range of 0.0270 to 0.1561 (Table 10 and Figure 7 and Figure 8) compared to MLR as R2 in the range of 0.7989 to 0.9973 and RMSE in the range of 0.3183 to 0.9623 as shown in Table 12 and Figure 7 and Figure 8. These results support using both MLR and ANN models for predicting the color attributes of date syrup–buttermilk beverages with reasonable accuracy, which will contribute to improving the quality management of date syrup–buttermilk beverages.
Figure 7.
A bar graph shows the RMSE of MLR and ANN models for the prediction of color attributes of date syrup–buttermilk beverages using the validation dataset.
Figure 8.
A bar graph shows R2 of MLR and ANN models for prediction of color attributes of date syrup–buttermilk beverages using the validation dataset.
To make a comparison of the effectiveness of the ANN model with MLR models for the prediction of color attributes of date syrup–buttermilk beverages, the statistical values of observed and predicted values by ANN and MLR models and relative percentage error are listed in Table 13. Relative percentage error was in the range of −1.17 to 3.18%, which was determined based on the mean valANN predicted both MLR observed and predicted; however, according to Lewis [65], relative percentage error values of less than 10% indicate very accurate forecasts between predicted values and experimental or observed data. Based on the statistical criteria that appeared in Table 10 and Table 12, the ANN achieved superior predictive accuracy within the combined experimental domain of date syrup concentration, storage time, and storage cooling temperature. The ANN model captured the combined effects of date syrup concentration, storage time, and storage cooling temperature, with date syrup concentration representing the major source of variation in the color responses. The date syrup concentration is the primary determinant of color changes, whereas storage time and storage cooling temperature produce comparatively small effects that are statistically detectable but of limited practical importance under the studied conditions.
Table 13.
Mean, maximum, minimum, and standard deviation of observed and predicted data using MLR and ANN as well as relative percentage error using the validation dataset (data point = 30 patterns).
3.5. Outcome of Calculating Each Input’s Contribution Percentage to Outputs
The developed ANN model can determine the percentage contribution of each input to outputs due to the complicated and non-linear relationship between the parameters like storage cooling temperatures, date syrup concentration, storage period, and color attributes of L*, b*, a*, ΔE, hue angle, WI, Chroma, BI, and YI for a drink made from date syrup and buttermilk. Sensitivity analysis provides tools for users of mathematical and simulation models to determine the relative relevance of each input and to comprehend how closely a model’s output is related to its input [66]. By using the input node interrogator and Qnet V.2000 software, the influence of the inputs on the output can be understood through their contribution percentages. As a result, the variables that have a higher percentage among others can be evaluated. The graphical view of the input’s contribution percentage to outputs of L*, b*, and a* is presented in Figure 9; meanwhile, the input’s contribution percentage to outputs of ΔE, hue angle, WI, Chroma, BI, and YI is depicted in Figure 10.
Figure 9.
Contribution percentages of input-to-output relationships utilizing the constructed artificial neural network (ANN) model of structure 3-20-9 to forecast L*, b*, and a* of a date syrup drink based on experimental data.
Figure 10.
Contribution percentages of input-to-output relationships utilizing the constructed artificial neural network (ANN) model of structure 3-20-9 to forecast ΔE, hue angle, WI, Chroma, BI, and YI of a date syrup drink based on experimental data.
The results show that date syrup concentration, with a higher contribution percentage of more than an average of 77.33%, was the main factor influencing all color attributes, followed by storage time and storage cooling temperature for L*, b*, and a* (Figure 9). For the remaining color attributes, date syrup concentration with a higher contribution percentage of more than an average of 85.64% was achieved (Figure 10), followed by storage time and storage cooling temperature for ΔE, hue angle, WI, Chroma, BI, and YI [66]. The date syrup is categorized by a rich golden-brown color, a vital quality feature. The creation of degradation products from reducing sugars, melanoidins, and polyphenolic complexes primarily brings about this color [67].
The sensitivity analysis indicated that the concentration of date syrup contributed much more to the color attributes of the beverage than the storage temperature and storage period. Although storage-related reactions such as pigment degradation, oxidation, Maillard reactions, and protein–polyphenol interactions are reported to influence color in dairy products, the higher concentration of naturally colored compounds in date syrup is believed to be responsible for the dominant effect of syrup concentration. Date syrup contains pigments formed during the ripening of dates and the production of syrup that may impart an intense brown color even at low concentrations [6]. The increase in the concentration of these pigments in the beverage matrix caused significant and instant changes in the parameters of color due to the increase in the concentration of date syrup from 5 to 15%. The research was based on a short storage period (15 days), and the samples were stored under refrigeration (0–15 °C), which significantly reduced the rates of oxidative and non-enzymatic browning reactions [68]. Refrigeration storage decreases the molecular mobility and the kinetics of reactions related to degradation of pigments and development of color [69]. Thus, the extent of color variation due to storage-associated reactions was less than the variation due to the initial pigment load contributed by date syrup. Furthermore, according to the sensitivity study, the concentration of date syrup accounts for more than 81.49% (77.33% + 85.64%) of the color attributes prediction. This demonstrates that the formulation factor determines the product’s precise first color profile. From the perspective of product stability, however, the non-linear kinetics of color deterioration (e.g., Maillard browning and pigment degradation) are represented by the remaining variance regulated by storage temperature and time. An ANN is needed to capture the subtle, interwoven non-linear interactions of storage time and temperature across variable syrup concentrations, which determine the true visual shelf life of the beverage, even though simple linear models may effectively map the fundamental effect of the formulation.
3.6. Practical Applications
The results provide useful applications for ANN modeling as an innovative monitoring and prediction method to improve food sustainability and quality based on assessment of its color. The proposed methodology employs artificial neural networks (ANN) and processing parameters, including date syrup concentration, cooling temperature, and storage duration, to facilitate prediction of the color quality of date syrup–buttermilk beverages. Tests conducted during cold storage offer information about color changes over time, which helps manufacturers of these beverages identify critical adjustments. Additionally, the study offers a methodical approach that makes it easier for the food business to adopt recent technologies.
It is crucial to remember that color is a single component of the overall quality matrix, even though the suggested ANN model achieves good, predicted accuracy for the color attributes. Turbidity, pH, total solids, etc., are important properties in determining the quality of the dairy-based drinks. A thorough real-time industrial quality control loop should ideally combine the soft sensor with the suitable sensors to simultaneously capture the changes of the beverage properties.
3.7. Innovation, Limitations, and Overall Suggestions
The present study demonstrated that ANN is an effective predictor of the color characteristics of a date syrup–buttermilk beverage, which can contribute to the sustainable development of such beverages; however, it also revealed limitations related to the experimental conditions, as these were confined to a relatively narrow range of storage temperatures, syrup concentrations, and storage times, which may affect the generalizability of the results to other dairy systems or industrial conditions. But, in general, the following sentences describe innovation, limitations, and overall suggestions.
- The main novelty of this study is the transition of beverage color quality evaluation from a destructive, resource-consuming laboratory procedure to an intelligent multi-variable prediction framework. This work presents a high-capacity multi-layer perceptron artificial neural network (MLP-ANN) capable of simultaneously mapping basic, non-destructive processing inputs (e.g., syrup concentration, storage temperature, and storage time) directly onto nine complex CIE color coordinates and chemical browning indexes (lightness (L*), yellow-ness/blueness (b*), hue angle (h°), color difference (ΔE), redness/greenness (a*), browning index (BI), Chroma (C), whiteness index (WI), and yellow index (YI)) with close to perfect accuracy (R2 was more than 0.90). Moreover, the study provides insight into the non-linear kinetic interactions responsible for pigment degradation in date syrup–buttermilk matrices by merging this computational approach with a systematic sensitivity analysis and lays down a fundamental blueprint for real-time Industry 4.0 sensor integration in dairy manufacturing.
- Although the integration of the ANN model with inline sensors may offer opportunities for future intelligent quality-control applications, real-time implementation and industrial deployment were not evaluated in the present study. However, such applications remain prospective and require further investigation under industrial conditions.
- The date syrup content was the key factor affecting all the color properties. Therefore, the date syrup–buttermilk beverage producers should consider controlling date syrup content.
- Optimization of storage cooling temperature and storage time to avoid undesirable color changes and to maintain visual acceptability of the beverage during its shelf life is required.
- Integrating ANN models with digital sensors and automated monitoring systems creates beneficial real-time intelligent quality control systems for functional dairy drinks.
- More studies should be performed to create industrial applicability and to evaluate the applicability of the proposed ANN model to other dairy-based beverages and natural sweeteners.
- Future prediction models should include more quality characteristics (viscosity, sensory attributes, nutritional value, microbiological safety, and customer acceptability) for building sophisticated systems to evaluate the quality of beverages.
- Larger experimental datasets with a greater variety of processing circumstances are fundamental to further improve the model generalization, robustness, and prediction accuracy.
4. Conclusions
The present study demonstrated the offline prediction of color attributes within the investigated ranges of syrup concentration, cooling temperature, and storage time under laboratory conditions. Potential applications involving real-time monitoring, inline sensing, and industrial quality-control systems are now identified as future research directions rather than established outcomes.
The findings of this study demonstrated that the artificial neural network (ANN) and multiple linear regression (MLR) models were successfully employed to forecast the color features of the date syrup–buttermilk drink under varied processing and storage settings. The R2 and RMSE of MLR models were in the range of 0.7989 to 0.9973 for R2 and for RMSE, the range was 0.3183 to 0.9623; however, the ANN model for the same dataset (validation dataset) produced much-improved results with R2 in the range of 0.9994 to 0.9997 and RMSE in the range of 0.0270 to 0.1561.
All the studied color parameters (L*, a*, b*, ΔE, C*, h°, BI, WI, and YI) are highly influenced by storage cooling temperature, date syrup content, storage period, and their interactions. The developed multilayer perceptron ANN model proved to be a good predictive model for all the color attributes and can be applied as a reliable tool to predict beverage color quality without the need for extensive laboratory observations. Among the investigated input variables, the date syrup content was found to be the most significant factor influencing beverage color characteristics.
The proposed method based on ANN has different useful advantages, such as less analysis time, lower operating costs, less dependence on on laboratory equipment, and fast quality assessment during beverage production and storage. Thus, the suggested ANN model can help producers to maintain customer acceptability of date syrup–buttermilk beverages, optimize processing conditions, and enhance product quality control. However, several limitations of the present study should be recognized despite these contributions. First, the experiments were conducted under controlled laboratory settings and within limited ranges of syrup concentration, storage cooling temperature, and storage duration, which may restrict the applicability of the results to other dairy systems or industrial processing conditions. In addition, no closed or aseptic processing environment, real-time operation, inline sensing, or camera-based measurement system was evaluated. Thus, the developed soft-sensor concept is proposed as a potential future application rather than a validated industrial implementation. Future research using such modeling techniques may include other physiochemical, rheological, and sensory quality characteristics of dairy-based functional beverages.
Author Contributions
Conceptualization, A.M.A. and S.A.-G.; methodology, A.M.A., B.A., S.M.A.-S., and S.A.-G.; software, A.M.A.; validation, S.A.-G. and B.A.; formal analysis, S.M.A.-S., A.M.A., and S.A.-G.; investigation, S.A.-G.; resources, S.A.-G.; data curation, A.M.A. and S.A.-G.; writing—original draft preparation, A.M.A., B.A., S.M.A.-S., and S.A.-G.; writing—review and editing, A.M.A., B.A., S.M.A.-S., and S.A.-G.; visualization, S.A.-G.; supervision, S.A.-G.; project administration, S.A.-G.; funding acquisition, A.M.A. and S.A.-G. All authors have read and agreed to the published version of the manuscript.
Funding
This research was funded by the Ongoing Research Funding Program (ORF-2026-1891), King Saud University, Riyadh, Saudi Arabia.
Data Availability Statement
Data are contained within the article.
Acknowledgments
The authors would like to extend their sincere appreciation to the Ongoing Research Funding Program (ORF-2026-1891), King Saud University, Riyadh, Saudi Arabia.
Conflicts of Interest
The authors declare no conflict of interest.
References
- Pathare, P.B.; Opara, U.L.; Al-Said, F.A.J. Colour measurement and analysis in fresh and processed foods: A review. Food Bioprocess Technol. 2013, 6, 36–60. [Google Scholar]
- Milovanovic, B.; Djekic, I.; Miocinovic, J.; Djordjevic, V.; Lorenzo, J.M.; Barba, F.J.; Mörlein, D.; Tomasevic, I. What Is the Color of Milk and Dairy Products and How Is It Measured? Foods 2020, 9, 1629. [Google Scholar] [CrossRef] [Scilit] [PubMed]
- Hussein, J.B.; Oke, M.O.; Agboola, F.F.; Sanusi, M.S. Prediction of colour characteristics of microwave-dried tomato slices using artificial neural network and adaptive neuro-fuzzy inference systems. Contemp. Agric. 2023, 72, 107–121. [Google Scholar] [CrossRef] [Scilit]
- Hassan, A.; Amjad, I.; Mahmood, S. Microbiological and physicochemical analysis of different UHT milks available in market. Afr. J. Food Sci. 2009, 3, 100–106. [Google Scholar]
- Grigioni, G.; Biolatto, A.; Langman, L.; Descalzo, A.; Irurueta, M.; Paez, R.; Taverna, M. Color and pigments in milk and dairy. In Practical Food Research, 1st ed.; Rui, M.S., Ed.; Nova Science Publisher: New York, NY, USA, 2010; pp. 283–297. [Google Scholar]
- Al-Farsi, M.; Lee, C.Y. Nutritional and functional properties of dates: A review. Crit. Rev. Food Sci. Nutr. 2008, 48, 877–887. [Google Scholar] [CrossRef] [Scilit] [PubMed]
- Alhamdan, A.M.; Al Juhaimi, F.Y.; Hassan, B.H.; Ehmed, K.A.; Mohamed Ahmed, I.A. Physicochemical, Microbiological, and Sensorial Quality Attributes of a Fermented Milk Drink (Laban) Fortified with Date Syrup (Dibs) during Cold Storage. Foods 2021, 10, 3157. [Google Scholar] [CrossRef] [Scilit] [PubMed]
- Al-Ghamdi, S.; Alfaifi, B.; Aboukarima, A.M. Employing an Artificial Neural Network Model to Predict Thermal Properties of a Drink Made from Buttermilk Sweetened with Date Syrup. Appl. Sci. 2026, 16, 4362. [Google Scholar] [CrossRef] [Scilit]
- Roufegarinejad, L.; Piroozifard, M.; Asefi, N.; Tabibi-Azar, M.; Ashraf, R. Comparative study of date syrup decolourization Efficiency with Ion Exchange Resins and Bone Char. Asian J. Chem. 2010, 22, 16–20. [Google Scholar]
- Toufeili, I.; Itani, M.; Zeidan, M.; Al Yamani, O.; Kharroubi, S. Nutritional and Functional Potential of Carob Syrup Versus Date and Maple Syrups. Food Technol. Biotechnol. 2022, 60, 266–278. [Google Scholar] [CrossRef] [Scilit] [PubMed]
- Gilchrist, A.; Colorimetry, J.N.; Lindon, T.J.C.; Tranter, G.E.; Holmes, J.L. (Eds.) Encyclopedia of Spectroscopy and Spectrometry; Academic Press: London, UK; San Diego, CA, USA, 2000; Volume 1, pp. 340–342. [Google Scholar]
- Vargas, M.; Chafer, M.; Albors, A.; Chiralt, A.; Gonzalez-Martinez, M. Physicochemical and sensory characteristics of yoghurt produced from mixtures of cows’ and goats’ milk. Int. J. Dairy Technol. 2008, 18, 1146–1152. [Google Scholar] [CrossRef] [Scilit]
- Mendoza, F.; Dejmek, P.; Aguilera, J.M. Calibrated color measurements of agricultural foods using image analysis. Postharvest Biol. Technol. 2006, 41, 285–295. [Google Scholar] [CrossRef] [Scilit]
- Al-Hilphy, A.R.; Ali, H.I.; Al-IEssa, S.A.; Gavahian, M.; Mousavi-Khaneghah, A. Assessing Compositional and Quality Parameters of Unconcentrated and Refractive Window Concentrated Milk Based on Color Components. Dairy 2022, 3, 400–412. [Google Scholar] [CrossRef] [Scilit]
- Afshari Jouybari, H.; Farahnaky, A. Evaluation of Photoshop software potential for food colorimetry. J. Food Eng. 2011, 106, 170–175. [Google Scholar] [CrossRef] [Scilit]
- Şahin, C.; Balcı, O.; Işık, M.; Gökenç, İ. Artificial neural networks approach for prediction of CIELab values for yarn after dyeing and finishing process. J. Text. Inst. 2023, 114, 1326–1335. [Google Scholar] [CrossRef] [Scilit]
- Saber, W.I.A.; El-Naggar, N.E.-A.; El-Hersh, M.S.; El-Khateeb, A.Y.; Elsayed, A.; Eldadamony, N.M.; Ghoniem, A.A. Rotatable central composite design versus artificial neural network for modeling biosorption of Cr6+ by the immobilized Pseudomonas alcaliphila NEWG-2. Sci. Rep. 2021, 11, 1717. [Google Scholar] [CrossRef] [Scilit] [PubMed]
- Elsayed, A.; Moussa, Z.; Alrdahe, S.S.; Alharbi, M.M.; Ghoniem, A.A.; El-Khateeb, A.Y.; Saber, W.I. Optimization of heavy metals biosorption via artificial neural network: A case study of cobalt (II) sorption by Pseudomonas alcaliphila NEWG-2. Front. Microbiol. 2022, 13, 893603. [Google Scholar] [CrossRef] [Scilit] [PubMed]
- El-Metwally, M.M.; Abdel-Fattah, G.M.; Al-Otibi, F.O.; Khatieb, D.K.E.; Helmy, Y.A.; Mohammed, Y.M.; Saber, W.I. Application of artificial neural networks for enhancing Aspergillus flavipes lipase synthesis for green biodiesel production. Heliyon 2023, 9, e20063. [Google Scholar] [CrossRef] [Scilit] [PubMed]
- Hornik, K.; Stinchombe, M.; White, H. Multilayer feed-forward networks are universal approximators. Neural Netw. 1989, 2, 359–366. [Google Scholar] [CrossRef] [Scilit]
- Guiné, R.P.F. The Use of Artificial Neural Networks (ANN) in Food Process Engineering. Int. J. Food Eng. 2019, 5, 5–21. [Google Scholar] [CrossRef] [Scilit]
- Al-Fayadh, H.M.S.; Shuker, A.I.; Dayia, M.A.; Saadi, A.M.; Abdullah, E.A. Applications for Artificial Intelligence in Food and Dairy Science: Advancing Food Quality and Safety: A Review. Pharaonic J. Sci. 2026, 2, 51–65. [Google Scholar] [CrossRef] [Scilit]
- Al-Mahish, M.; Almulhim, T.; Alali, M. Purchasing decisions on date palm fruits: A quantitative analysis of the Khalas cultivar. PLoS ONE 2023, 18, e0289512. [Google Scholar] [CrossRef] [Scilit] [PubMed]
- Fernandez-Avila, C.; Gutierrez-Merida, C.; Trujillo, A.J. Physicochemical and sensory characteristics of a UHT milk-based product enriched with conjugated linoleic acid emulsified by Ultra-High-Pressure Homogenization. Innov. Food Sci. Emerg. Technol. 2017, 39, 275–283. [Google Scholar] [CrossRef] [Scilit]
- Bermúdez-Aguirre, D.; Mawson, R.; Versteeg, K.; Barbosa-Cánovas, G.V. Composition properties, physicochemical characteristics and shelf life of whole milk after thermal and thermo-sonication treatments. J. Food Qual. 2009, 32, 283–302. [Google Scholar] [CrossRef] [Scilit]
- Yoplac, I.; Hidalgo, A.; Vargas, L. Antimicrobial biofilms with microencapsulated citral and sodium caseinate to extend the shelf life of fresh cheese. Food Packag. Shelf Life 2022, 34, 100932. [Google Scholar] [CrossRef] [Scilit]
- Askari, G.R.; Emam-Djomeh, Z.; Mousavi, S.M. Investigation of microwave treatment on the optical properties of apple slices during drying. Dry. Technol. 2008, 26, 1362–1368. [Google Scholar] [CrossRef] [Scilit]
- Vesta Services, Inc. Qnet V 2000 Shareware; Vesta Services, Inc.: Winnetka, IL, USA, 2000. [Google Scholar]
- Tsae, N.B.; Adachi, T.; Kawamura, Y. Application of Artificial Neural Network for the Prediction of Copper Ore Grade. Minerals 2023, 13, 658. [Google Scholar] [CrossRef] [Scilit]
- Sammen, S.S.; Kisi, O.; Ehteram, M.; El-Shafie, A.; Al-Ansari, N.; Ghorbani, M.A.; Bhat, S.A.; Ahmed, A.N.; Shahid, S. Rainfall Modeling Using Two Different Neural Networks Improved by Metaheuristic Algorithms. Environ. Sci. Eur. 2023, 35, 112. [Google Scholar] [CrossRef] [Scilit]
- SAS, version 9.4. Statistical Software. SAS Institute Inc.: Cary, NC, USA, 2013.
- Sliwinski, M.; Chojnowska, K.; Rybka, J.; Szczęsny, T.; Mroczkowski, T.; Groszyk, Z.; Paweł, P. Impact of elevated and severe storage temperatures on the stability of UHT milk. LWT 2026, 246, 119226. [Google Scholar] [CrossRef] [Scilit]
- Ryan, J.; Hutchings, S.C.; Fang, Z.; Bandara, N.; Gamlath, S.; Ajlouni, S.; Ranadheera, C.S. Microbial, physico-chemical and sensory characteristics of mango juice-enriched probiotic dairy drinks. Int. J. Dairy Technol. 2020, 73, 182–190. [Google Scholar] [CrossRef] [Scilit]
- Hussien, A.M.S.; Fouad, M.T.; Abd El-Aziz, M.; Ashour, N.E.; Mostafa, E.A.M. Evaluation of Physico-chemical Properties of Some Date Varieties and Yoghurt Made with its Syrups. J. Biol. Sci. 2017, 17, 213–221. [Google Scholar] [CrossRef] [Scilit]
- Cadwallader, D.C.; Pranata, J.; Liu, Y.; Barbano, D.M.; Drake, M.A. Effects of storage time and temperature on the chemical and sensory properties of aseptic milk. J. Dairy Sci. 2025, 108, 4818–4838. [Google Scholar] [CrossRef] [Scilit] [PubMed]
- Elamshity, M.G.; Alhamdan, A.M. Non-Destructive Evaluation of the Physiochemical Properties of Milk Drink Flavored with Date Syrup Utilizing VIS-NIR Spectroscopy and ANN Analysis. Foods 2024, 13, 524. [Google Scholar] [CrossRef] [Scilit] [PubMed]
- Flavored Milk Drinks-Natural Colors’ Application. Available online: https://www.aafud.com/newsinfo-flavored-milk-drinks-natural-colors-application.html (accessed on 15 June 2026).
- Color Difference Formula and ΔE: CIE Standards and Color Tolerance. Available online: https://skychemi.com/color-difference-formula-delta-e/ (accessed on 15 June 2026).
- Fikry, M.; Yusof, Y.A.; Al-Awaadh, A.M.; Baroyi, S.A.H.M.; Ghazali, N.S.M.; Kadota, K.; Mustafa, S.; Abu Saad, H.; Shah, N.N.A.K.; Al-Ghamdi, S. Assessment of Physical and Sensory Attributes of Date-Based Energy Drink Treated with Ultrasonication: Modelling Changes during Storage and Predicting Shelf Life. Processes 2023, 11, 1399. [Google Scholar] [CrossRef] [Scilit]
- Jokar, A.; Azizi, M.H. Formulation and production of persimmon milk drink and evaluation of its physicochemical, rheological, and sensorial properties. Food Sci. Nutr. 2022, 10, 1126–1134. [Google Scholar] [CrossRef] [Scilit] [PubMed]
- Younis, M.; Ahmed, K.A.; Ahmed, I.A.M.; Yehia, H.M.; Abdelkarim, D.O.; Alhamdan, A.; Elfeky, A. Optimization and Storage Stability of Milk–Date Beverages Fortified with Sukkari Date Powder. Processes 2024, 12, 1739. [Google Scholar] [CrossRef] [Scilit]
- Kardas, M.; Rakuła, M.; Kołodziejczyk, A.; Staśkiewicz-Bartecka, W. Consumer Preferences, Sensory Evaluation, and Color Analysis of Beetroot and Tomato Juices: Implications for Product Development and Marketing in Health-Promoting Beverages. Foods 2024, 13, 4059. [Google Scholar] [CrossRef] [Scilit] [PubMed]
- Jena, S.; Das, H. Shelf life prediction of aluminum foil laminated polyethylene packed vacuum dried coconut milk powder. J. Food Eng. 2012, 108, 135–142. [Google Scholar] [CrossRef] [Scilit]
- Young, N.; O’sullivan, G. The influence of ingredients on product stability and shelf life. In Food and Beverage Stability and Shelf Life; Elsevier: Amsterdam, The Netherlands, 2011; pp. 132–183. [Google Scholar]
- Alsaedi, A.W.M.; Al-Hilphy, A.R.; Al-Mousawi, A.J.; Gavahian, M. Artificial intelligence-based modeling of novel non-thermal milk pasteurization to achieve desirable color and predict quality parameters during storage. J. Food Process Eng. 2024, 47, e14658. [Google Scholar] [CrossRef] [Scilit]
- Alqahtani, N.K.; Alnemr, T.M.; Alsalem, A.K.; Alotaibi, M.M.; Mohammed, M. Experimental Investigation and Modeling for the Influence of Adding Date Press Cake on Drinkable Yogurt Quality. Foods 2023, 12, 1219. [Google Scholar] [CrossRef] [Scilit] [PubMed]
- Paludetti, L.F.; Jordan, K.; Kelly, A.L.; Gleeson, D. Evaluating the effect of storage conditions on milk microbiological quality and composition. Ir. J. Agric. Food Res. 2018, 57, 52–62. [Google Scholar] [CrossRef] [Scilit]
- Karlsson, M.A.; Langton, M.; Innings, F.; Malmgren, B.; Höjer, A.; Wikström, M.; Lundh, Å. Changes in stability and shelf-life of ultra-high temperature treated milk during long term storage at different temperatures. Heylion 2019, 5, e02431. [Google Scholar] [CrossRef] [Scilit] [PubMed]
- Ranvir, S.G.; Sharma, R.; Gandhi, K.; Nikam, P. Physico-chemical changes during processing and storage of UHT milk. Indian J. Dairy Sci. 2021, 74, 39–47. [Google Scholar] [CrossRef] [Scilit]
- Łopusiewicz, Ł.; Drozłowska, E.; Siedlecka, P.; Mężyńska, M.; Bartkowiak, A.; Sienkiewicz, M.; Zielińska-Bliźniewska, H.; Kwiatkowski, P. Development, Characterization, and Bioactivity of Non-Dairy Kefir-Like Fermented Beverage Based on Flaxseed Oil Cake. Foods 2019, 8, 544. [Google Scholar] [CrossRef] [Scilit] [PubMed]
- Lee, H.S.; Song, M.W.; Kim, K.-T.; Hong, W.-S.; Paik, H.-D. Antioxidant Effect and Sensory Evaluation of Yogurt Supplemented with Hydroponic Ginseng Root Extract. Foods 2021, 10, 639. [Google Scholar] [CrossRef] [Scilit] [PubMed]
- Alqahtani, N.K.; Helal, A.; Alnemr, T.M.; Marquez, O. Influence of Tomato Pomace Inclusion on the Chemical, Physical and Microbiological Properties of Stirred Yoghurt. Int. J. Dairy Sci. 2020, 15, 152–160. [Google Scholar] [CrossRef] [Scilit]
- Mkadem, W.; Belguith, K.; Ben Zid, M.; Boudhrioua, N. Fortification of Traditional Fermented Milk “Lben” with Date Powder: Physicochemical and Sensory Attributes. In Proceedings of the 1st International Electronic Conference on Processes: Processes System Innovation, Online, 17 May 2022; MDPI: Basel, Switzerland, 2022; p. 43. [Google Scholar]
- Nov, P.; Peansupap, V. Using Artificial Neural Network for Selecting Type of Subcontractor Relationships in Construction Project. Eng. J. 2020, 24, 73–88. [Google Scholar] [CrossRef] [Scilit]
- Qazi, A.; Fayaz, H.; Wadi, A.; Raj, R.G.; Rahim, N.A.; Khan, W.A. The Artificial Neural Network for Solar Radiation Prediction and Designing Solar Systems: A Systematic Literature Review. J. Clean. Prod. 2015, 104, 1–12. [Google Scholar] [CrossRef] [Scilit]
- Moussa, Z.; Ghoniem, A.A.; Elsayed, A.; Alotaibi, A.S.; Alenzi, A.M.; Hamed, S.E.; Elattar, K.M.; Saber, W.I.A. Innovative binary sorption of Cobalt (II) and methylene blue by Sargassum latifolium using Taguchi and hybrid artificial neural network paradigms. Sci. Rep. 2022, 12, 18291. [Google Scholar] [CrossRef] [Scilit] [PubMed]
- Goodfellow, I.; Bengio, Y.; Courville, A. Deep Learning; MIT Press: Cambridge, MA, USA, 2016. [Google Scholar]
- Beale, M.H.; Hagan, M.T.; Demuth, H.B. Deep Learning Toolbox User’s Guide; Mathworks Inc.: Sherborn, MA, USA, 2018. [Google Scholar]
- Erentürk, K.; Erentürk, S. Comparison of regression analysis and artificial neural networks in predicting carrot drying kinetics. Int. Ref. J. Eng. Sci. (IRJES) 2024, 13, 96–99. [Google Scholar]
- Stangierski, J.; Weiss, D.; Kaczmarek, A. Multiple regression models and Artificial Neural Network (ANN) as prediction tools of changes in overall quality during the storage of spreadable processed Gouda cheese. Eur. Food Res. Technol. 2019, 245, 2539–2547. [Google Scholar] [CrossRef] [Scilit]
- Nadian, M.H.; Rafiee, S.; Aghbashlo, M.; Hosseinpour, S.; Nohtasebi, S.S. Continuous real-time monitoring and neural network modeling of apple slices color changes during hot air drying. Food Bioprod. Process. 2015, 94, 263–274. [Google Scholar] [CrossRef] [Scilit]
- Shi, C.; Zhao, Z.; Jia, Z.; Hou, M.; Yang, X.; Ying, X.; Ji, Z. Artificial neural network-based shelf-life prediction approach in the food storage process: A review. Crit. Rev. Food Sci. Nutr. 2024, 64, 12009–12024. [Google Scholar] [CrossRef] [Scilit] [PubMed]
- Jafar, R.; Awad, A.; Hatem, I.; Jafar, K.; Awad, E.; Shahrour, I. Multiple Linear Regression and Machine Learning for Predicting the Drinking Water Quality Index in Al-Seine Lake. Smart Cities 2023, 6, 2807–2827. [Google Scholar] [CrossRef] [Scilit]
- Lewis, C.D. Industrial and Business Forecasting Methods; Butterworths Publishing: London, UK, 1982. [Google Scholar]
- Tarlak, F. The use of predictive microbiology for the prediction of the shelf life of food products. Foods 2023, 12, 4461. [Google Scholar] [CrossRef] [Scilit] [PubMed]
- Sivaji, C.; Ramachandran, M.; Rajamanickam, J.; Sharm, R. Analyzing Sensitivity Analysis Techniques: A Comprehensive Study Across Various Fields. J. Mater. Its Charact. 2023, 2, 1–9. [Google Scholar] [CrossRef] [Scilit]
- Agwu, O.E.; Akpabio, J.U.; Dosunmu, A. Artificial Neural Network Model for Predicting the Density of Oil-Based Muds in High-Temperature, High-Pressure Wells. J. Pet. Explor. Prod. Technol. 2020, 10, 1081–1095. [Google Scholar] [CrossRef] [Scilit]
- Nasehi, S.M.; Ansari, S.; Sarshar, M. Removal of dark colored compounds from date syrup using activated carbon: A kinetic study. J. Food Eng. 2012, 111, 490–495. [Google Scholar] [CrossRef] [Scilit]
- Damodaran, S.; Parkin, K.; Fennema, O.R. Fennema’s Food Chemistry, 5th ed.; CRC Press: Boca Raton, FL, USA, 2017. [Google Scholar] [CrossRef] [Scilit]
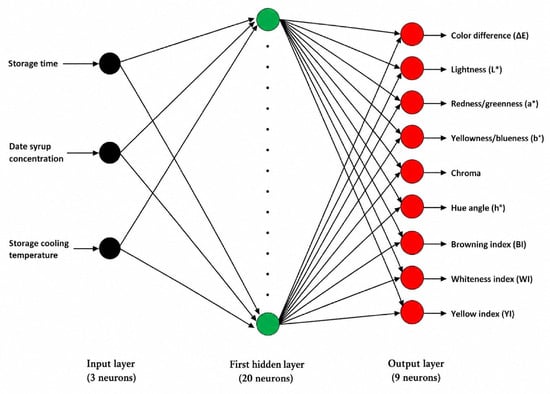
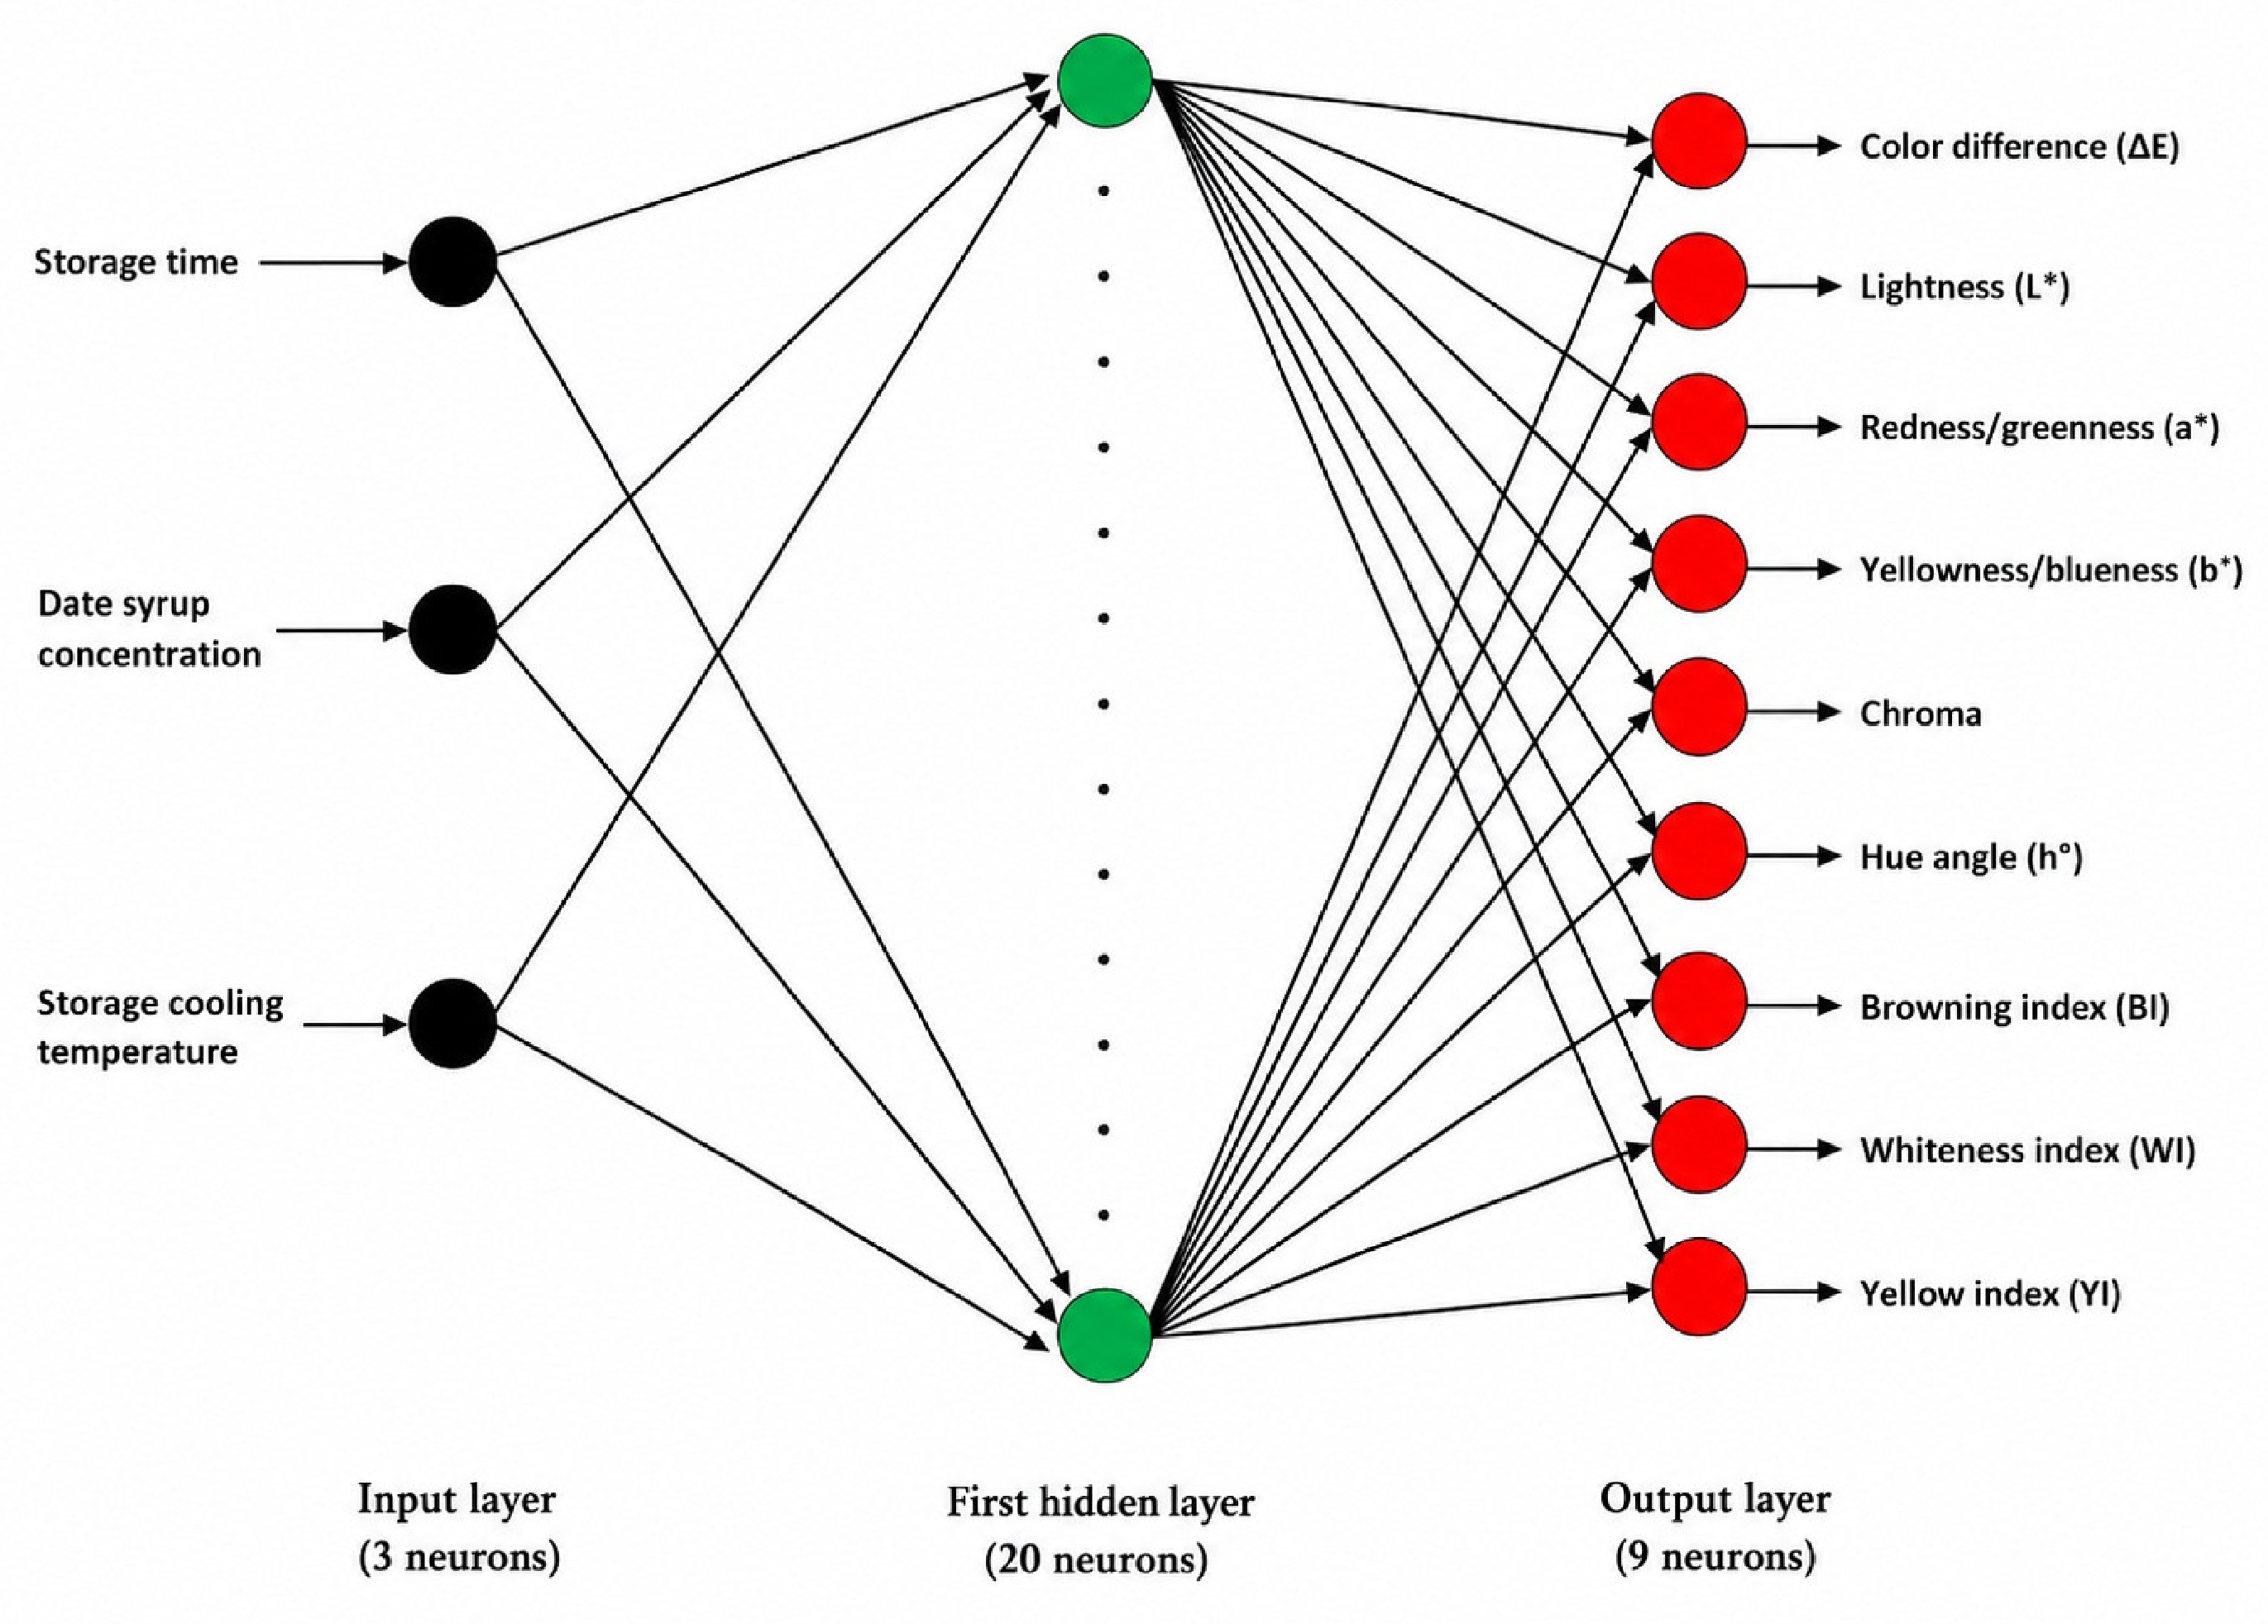
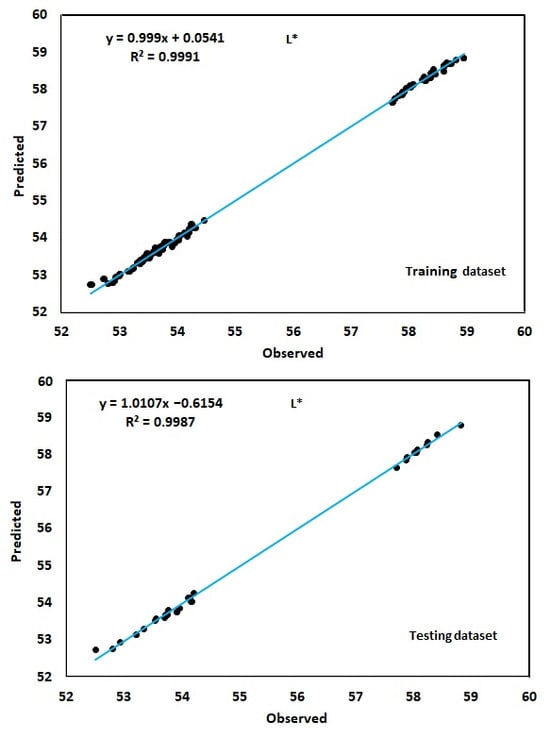
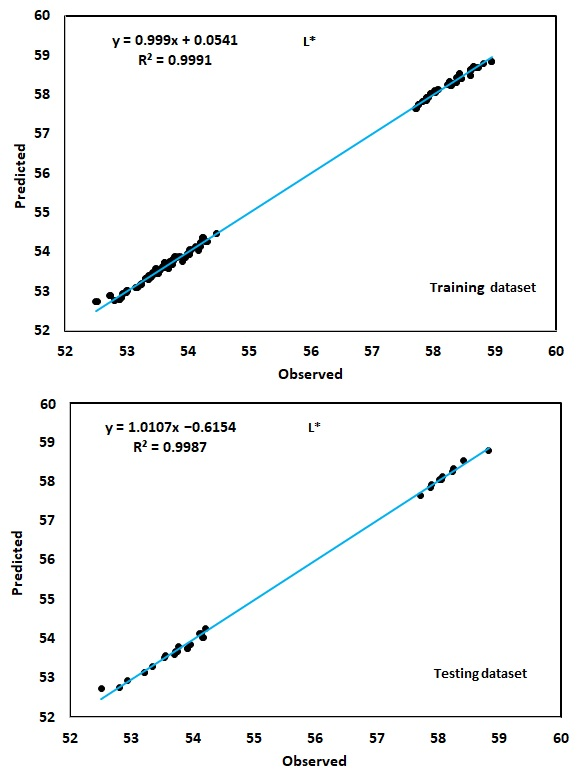
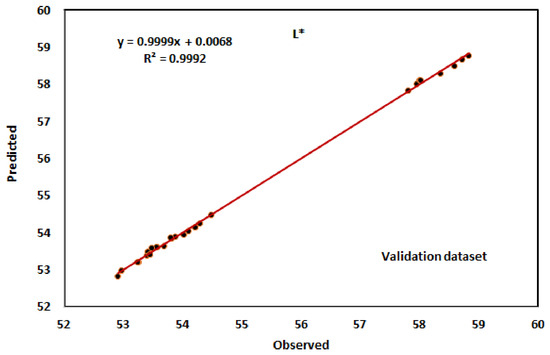
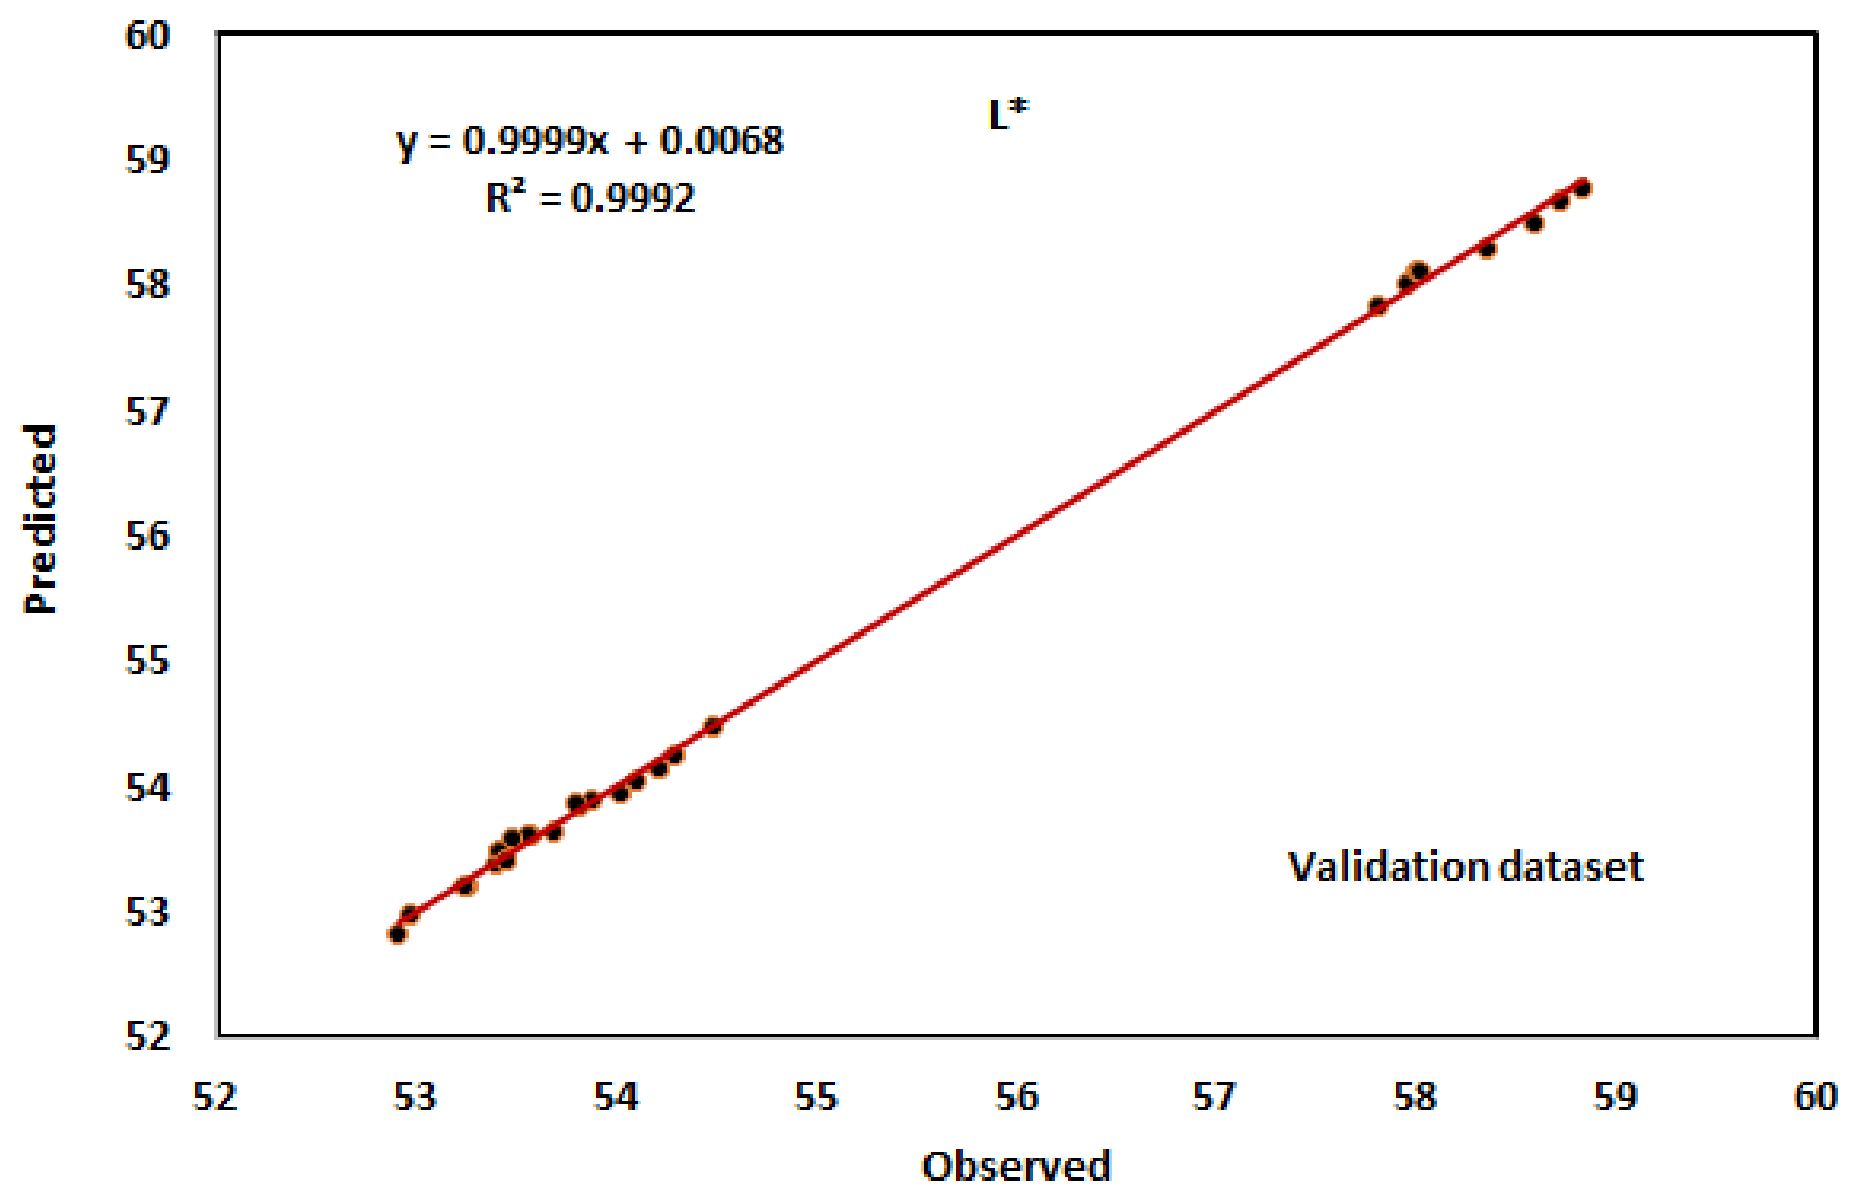
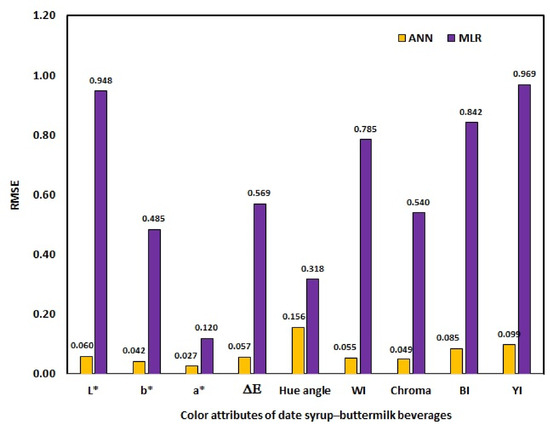
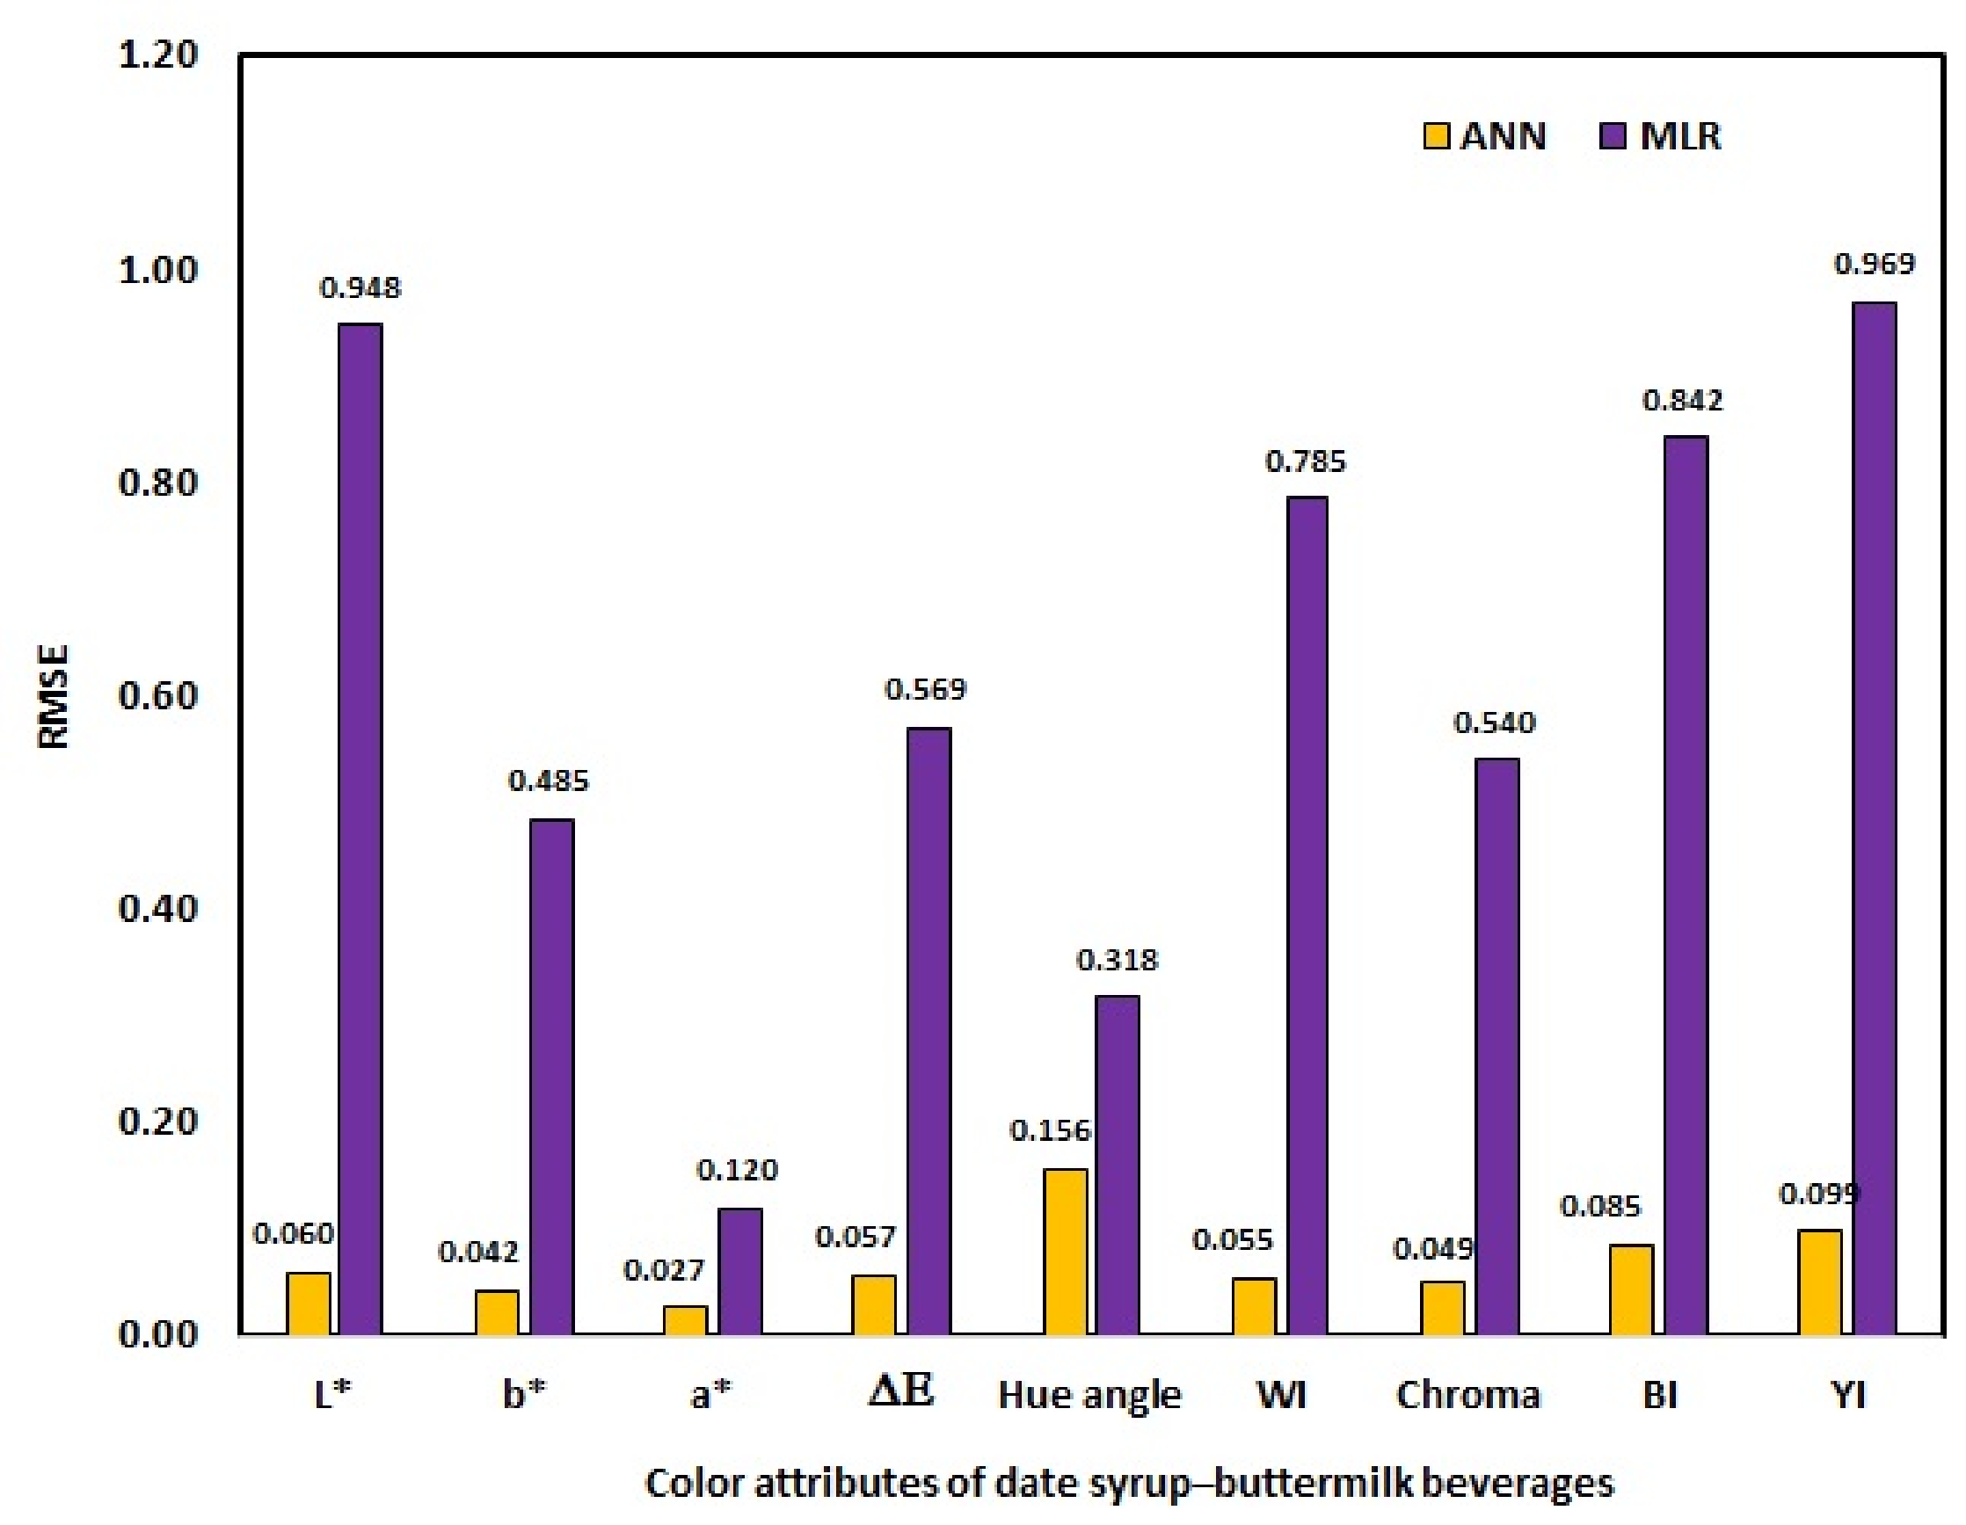
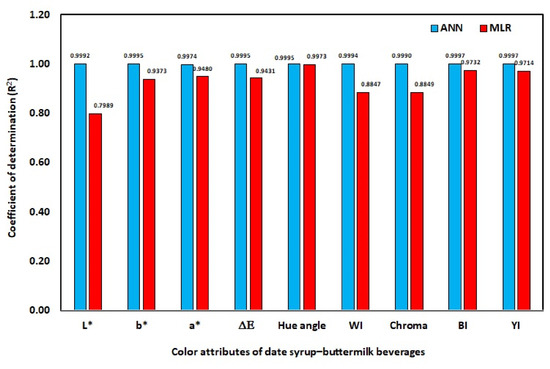
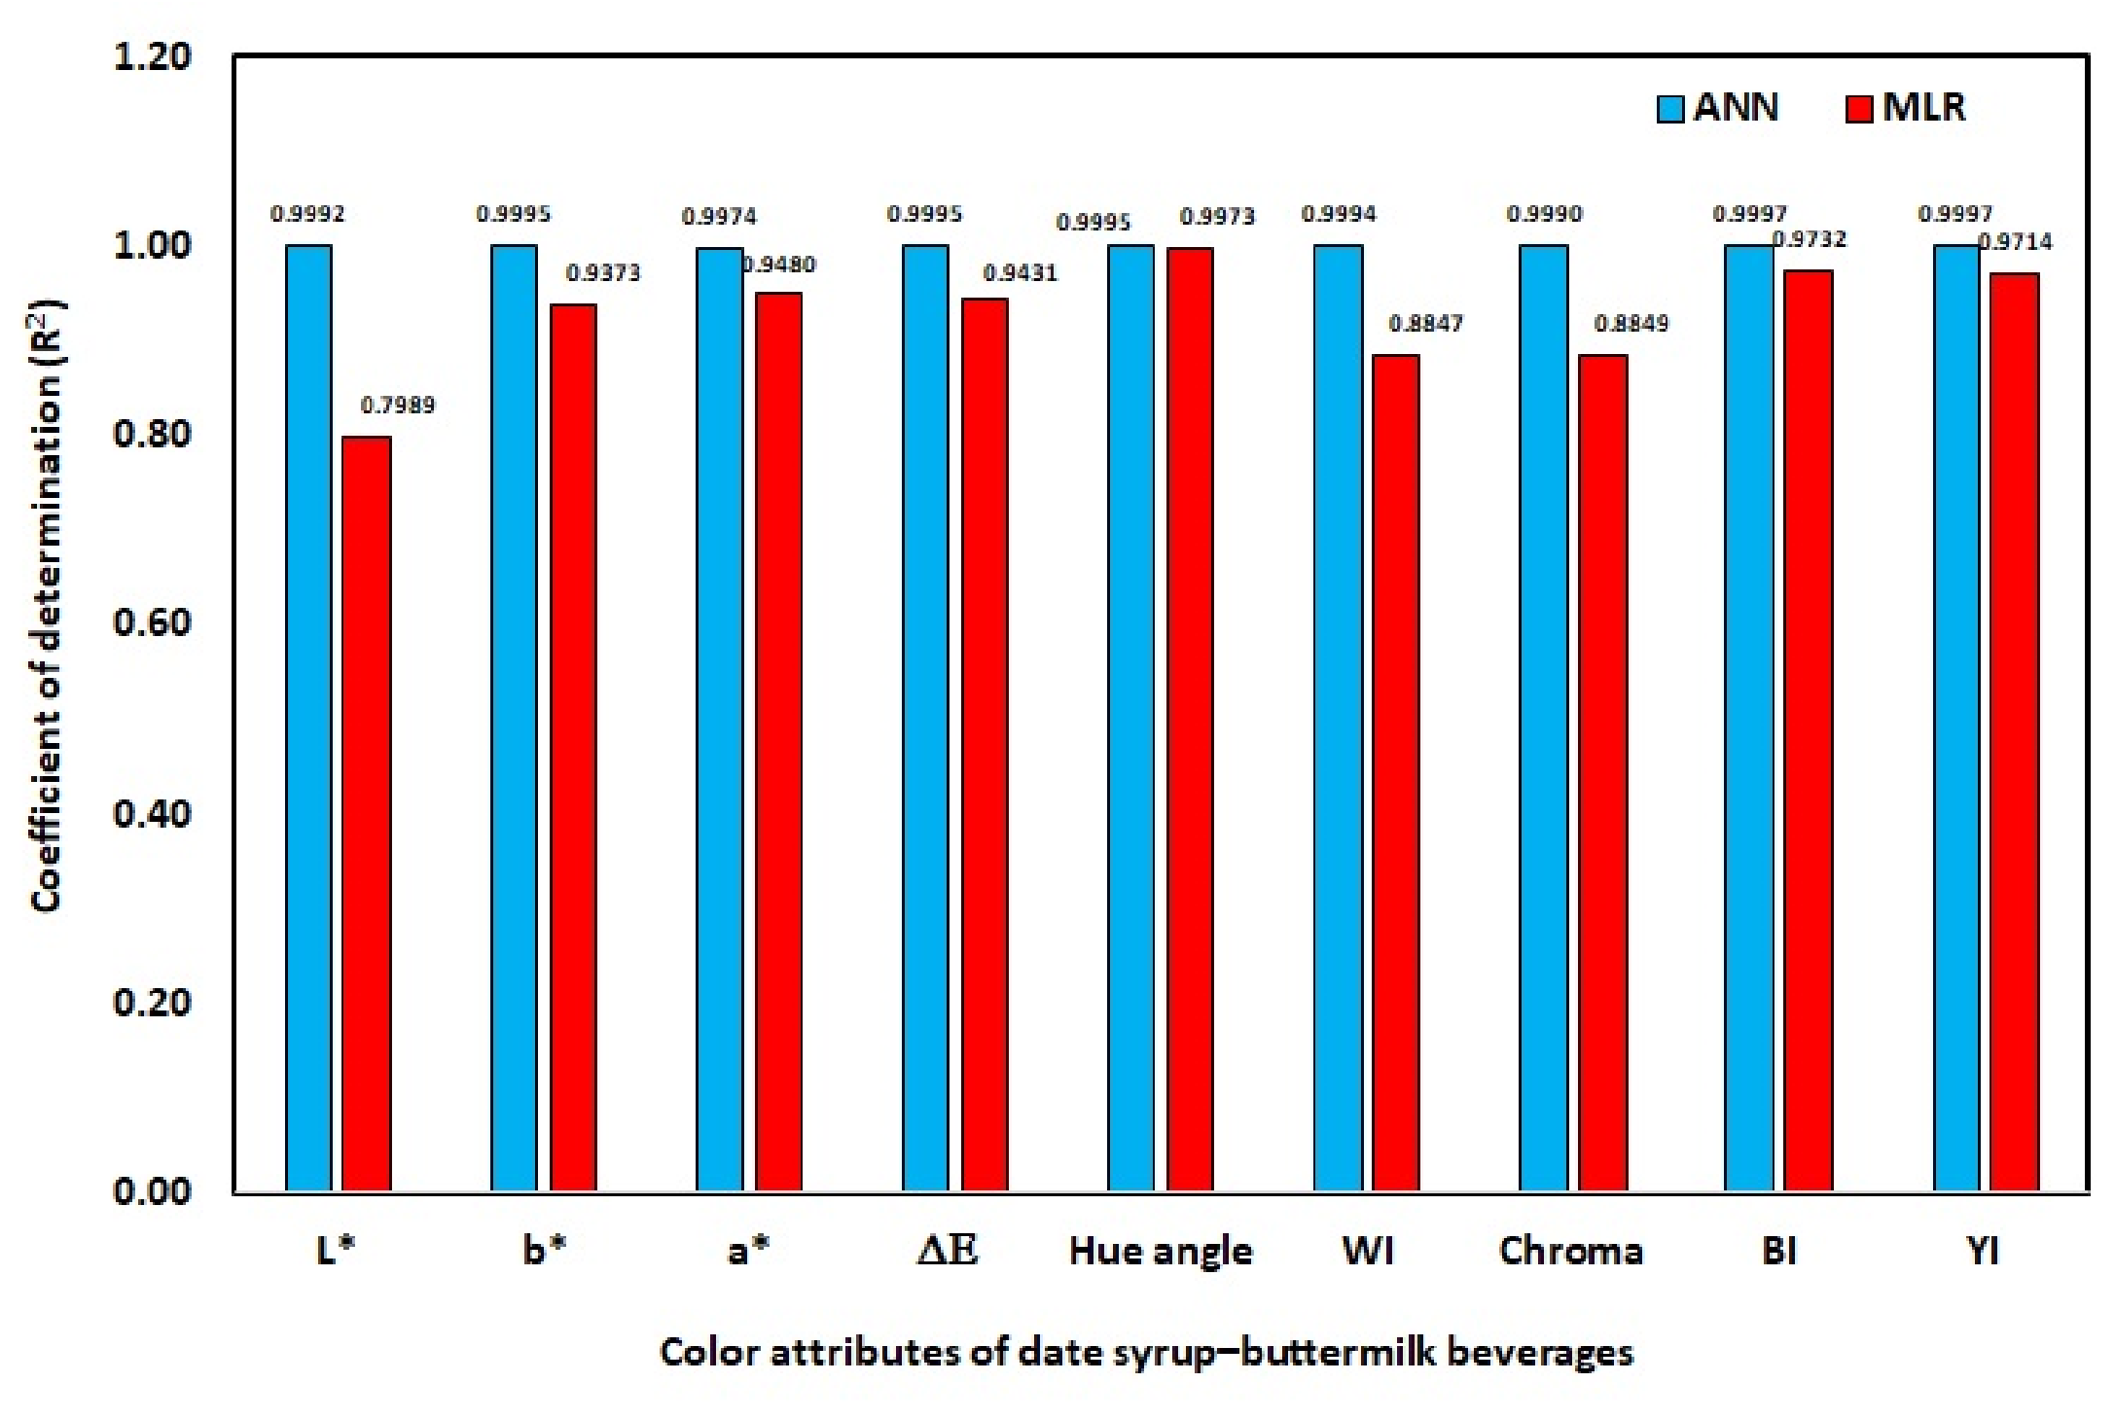
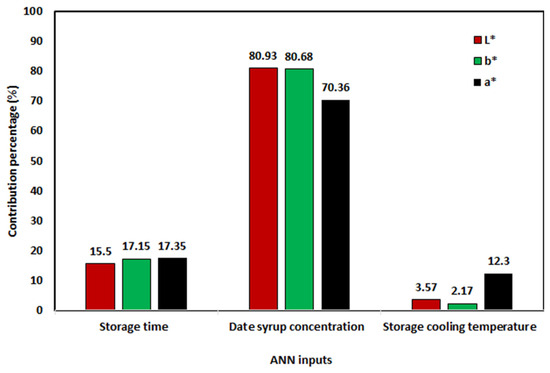
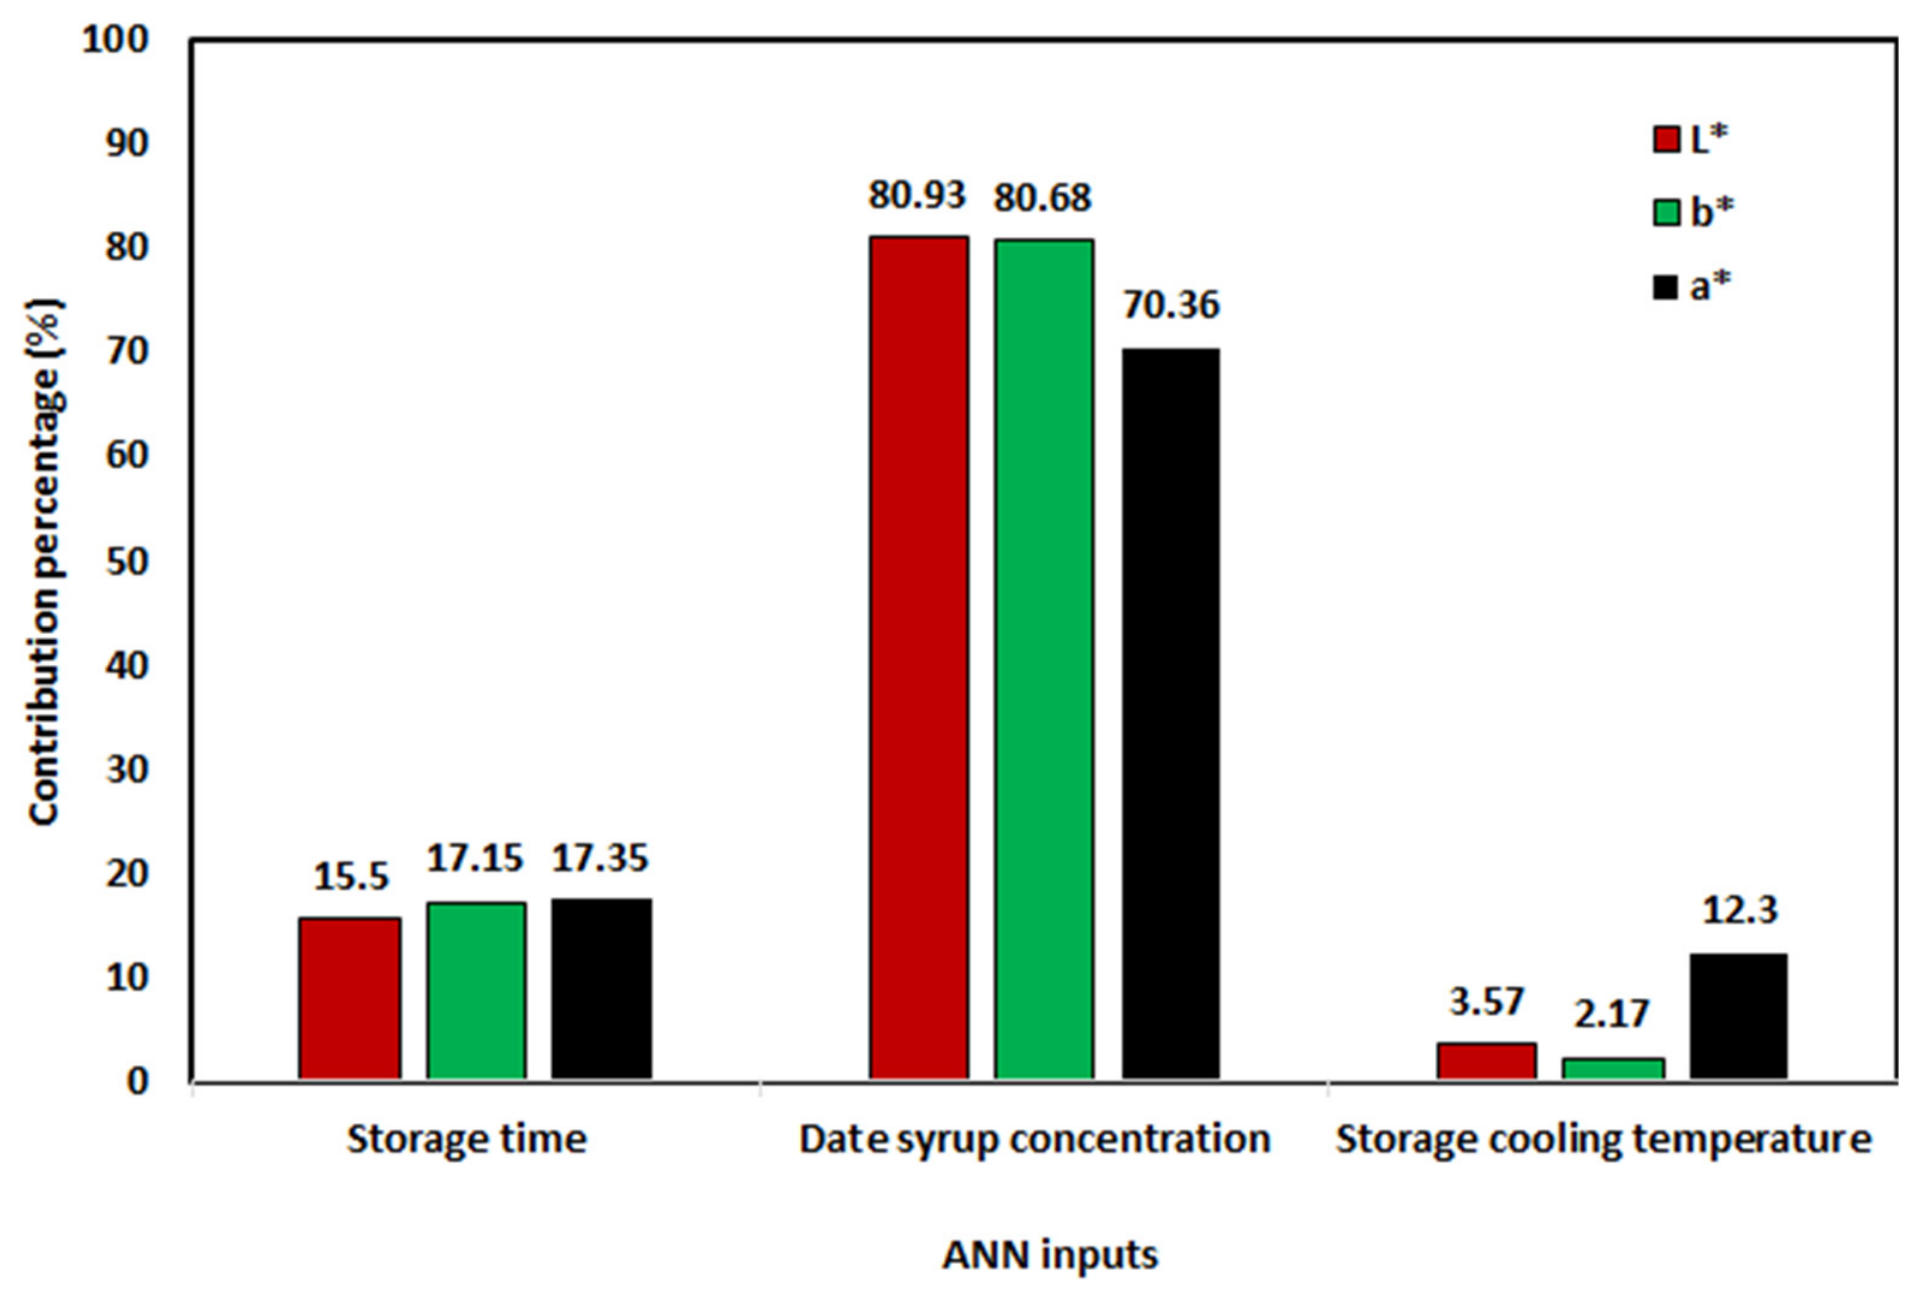
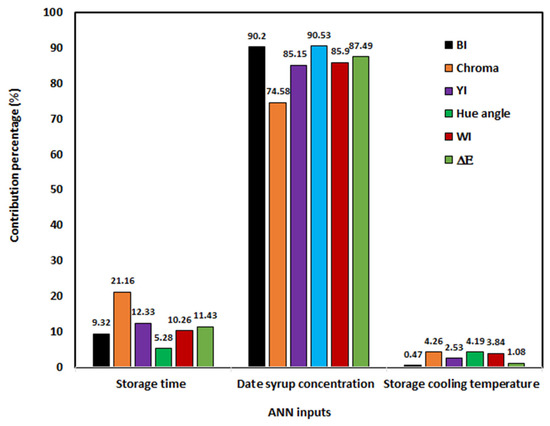
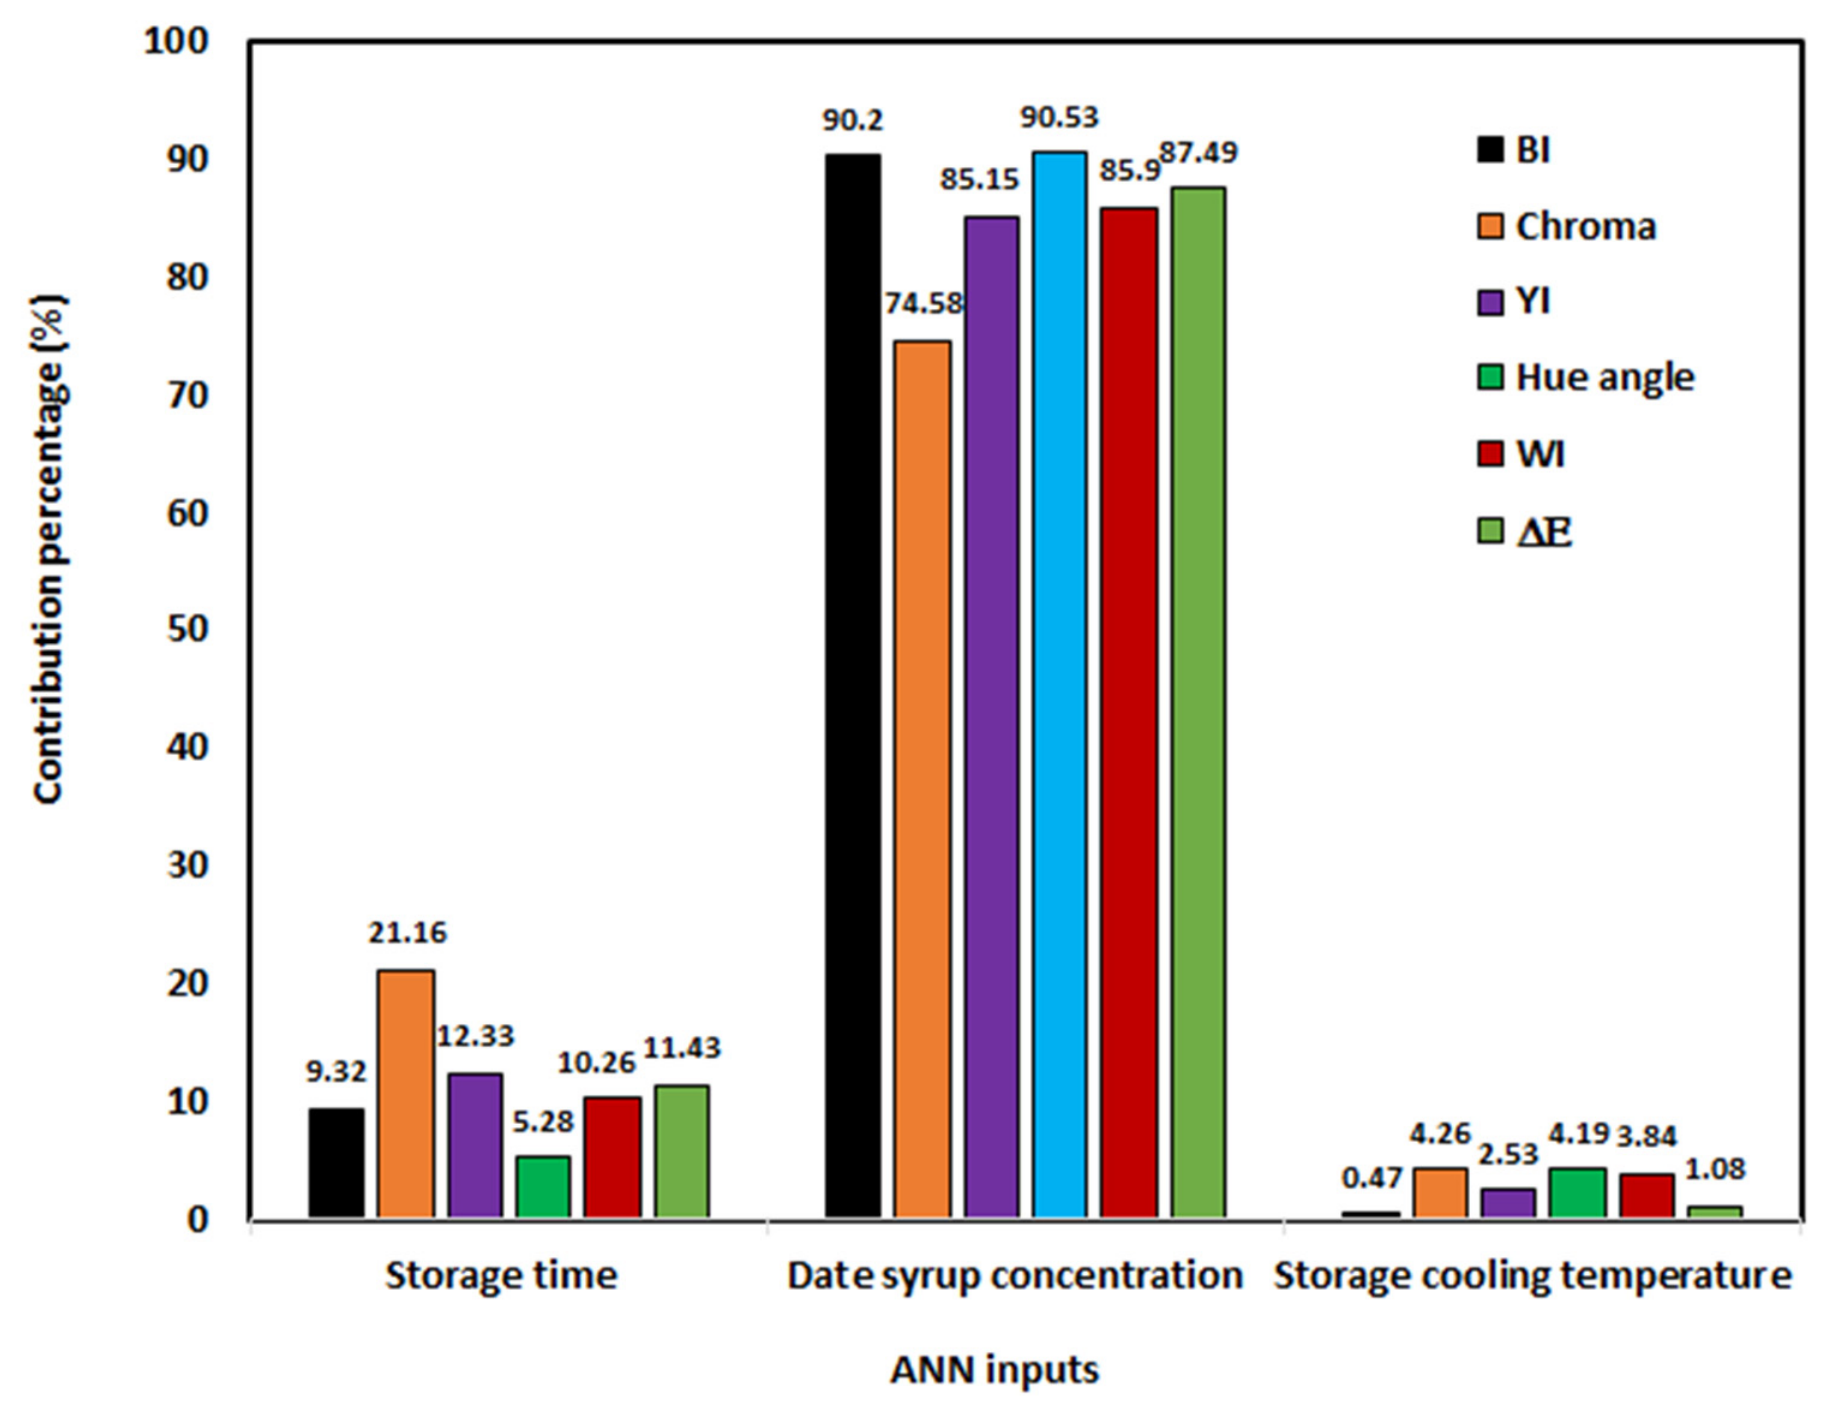

Disclaimer/Publisher’s Note: The statements, opinions and data contained in all publications are solely those of the individual author(s) and contributor(s) and not of MDPI and/or the editor(s). MDPI and/or the editor(s) disclaim responsibility for any injury to people or property resulting from any ideas, methods, instructions or products referred to in the content. |
© 2026 by the authors. Licensee MDPI, Basel, Switzerland. This article is an open access article distributed under the terms and conditions of the Creative Commons Attribution (CC BY) license.