


Abstract
The constitutive analysis model and hot processing map of the ZM6 alloy across various deformation conditions were investigated during hot compression experiments. True stress-strain curves within 300–450 °C and 0.0001–0.1 s−1 were obtained from compression tests on a Gleeble-1500 platform. The results showed that higher strain rates (e.g., 0.1 s−1) induced pronounced work hardening, whereas high temperatures (300–400 °C) combined with low strain rates (10−4 s−1) promoted conditions conducive to dynamic recrystallization (DRX), leading to a softening tendency of steady-state flow stress. Additionally, a modified strain-compensated constitutive model was built for flow stress prediction. Material constants were plotted as fifth-order polynomial functions of strain (0.025–0.80) for precise stress predictions. The derived activation energy (Q = 182.38 kJ/mol) falls within the typical range for Mg-RE alloys. Leave-one-temperature-out cross-validation showed average AARE values of 7.2–9.8%, demonstrating the model’s interpolation capability and its sensitivity to extrapolation. Cross-validation within the training dataset showed reasonable consistency between experimental and predicted stresses (R > 0.997, AARE < 4.35%). Using the dynamic materials model, hot processing maps identified safe deformation zones and instability zones of the ZM6 alloy. Flow instability was observed at strain rates >0.01 s−1, particularly at low temperatures (300–350 °C). Optimal processing windows appeared in high-energy dissipation (η > 30%) regions, e.g., 400–450 °C/10−4–10−3 s−1. Optical microscopy confirmed that at high temperatures (≥400 °C) and low strain rates (≤0.001 s−1), a uniform, fine-grained, fully recrystallized structure can be obtained, whereas low temperatures (350 °C) and high strain rates (0.1 s−1) produce coarse elongated grains with limited DRX, consistent with the instability regime predicted by the processing maps. Under intermediate conditions (e.g., 400 °C, 0.01 s−1), a bimodal grain distribution indicates incomplete recrystallization. Although EBSD analysis was not performed in this study, the optical microstructures directly validate the predicted safe and unstable windows. Together, all these findings provide preliminary model-based guidance for optimizing hot working parameters to balance microstructural stability and processing efficiency.
1. Introduction
Progress in magnesium alloy strengthening has been made across alloy design, deformation processing, and heat treatment. Take conventional Mg-Al-Zn alloys. A combination of torsional deformation and aging treatment refines grains and improves mechanical properties via what the authors of [1,2] describe as a cooperative mechanism between plastic deformation and precipitation strengthening. Rare earth elements open up additional routes. In Mg-Gd-Y-Zn-Zr systems, aging treatments produce nanoscale precipitates that give marked strength gains, and Zn content plays a key role in determining precipitate morphology as well as mechanical and damping properties [2,3,4,5]. On the thermal processing side, work on DRX and twinning in Mg-RE alloys has produced constitutive models and processing maps [6,7]. Beyond these better-studied systems, there is growing interest in lower-cost Mg-Li alloys [8] and in alloy formulations designed to resist hot cracking [9].
The Mg-Nd-Zn-Zr system, commercially known as ZM6, offers good castability along with an age-hardening response. These features make it attractive for aerospace components, which require a higher strength-to-weight ratio and better thermal mechanical stability [10]. Nevertheless, like many rare earth-containing magnesium alloys, ZM6 suffers from a narrow hot workability window and a tendency toward unstable flow during hot deformation. The relatively high alloying content that boosts room-temperature strength also promotes microstructural heterogeneity and reduces thermoplasticity at elevated temperatures [5,6]. Therefore, a quantitative constitutive analysis method for ZM6 is necessary to select better processing parameters and avoid defects.
Constitutive models for hot deformation have become more accurate over the years, either by adding empirical strain compensation or by including physically based microstructural mechanisms [11,12,13,14,15,16,17,18]. Traditional empirical models are still used because they are simple and their parameters are easy to obtain, even though their accuracy suffers from certain assumptions and limits tied to experimental conditions. However, a more comprehensive discussion of the limitations of empirical constitutive models is warranted: they lack a physical basis for extrapolation beyond the calibrated temperature-strain rate domain, are prone to overfitting when high-order polynomial strain compensation is applied, and cannot intrinsically account for microstructural evolution such as dynamic recrystallization or texture changes. Ignoring these limitations may lead to overconfidence in prediction capability. To improve the classical Arrhenius and Johnson–Cook models, researchers have turned to strain compensation and optimization algorithms. For instance, Long et al. [11] refined the Arrhenius equation for the ZK61 alloy and obtained reasonable prediction accuracy (R2 > 0.98). While a high R2 value is often cited as evidence of model quality, it is critical to explicitly acknowledge that high R2 values can mask systematic errors: for example, biased predictions at strain extremes, non-random residual distributions, or poor extrapolation performance may persist despite an apparently good fit. Therefore, correlation alone does not guarantee model fidelity, and additional metrics (e.g., AARE, RMSE, and residual analysis) should be employed. Xia et al. [12] used a K-function optimization method and cut prediction errors by 40%. At very high strain rates, adiabatic shear effects call for special treatment [13,14]. Additionally, on the physics-based side, frameworks that include dislocation dynamics, phase transformation, and texture evolution have been considered to make up for the limited micro-mechanism characterization of empirical models. Cheng et al. [15] added a dynamic softening factor to the Fields–Backofen model, which allowed them to predict dynamic recovery and recrystallization in AZ31 during hot tension, with errors below 5% in the softening stage. Singh et al. [16] found that the KHL model, which accounts for dislocation density evolution and thermal activation, predicts well for the AT61 alloy under high strain rates. Moreover, coupling multiple mechanisms and analyzing texture can further boost accuracy [17,18]. The Arrhenius equation remains widely used because it is straightforward and reasonably accurate [11,12,13,14]. For magnesium alloys, some constants (e.g., α, n, Q, and lnA) are not fixed but vary with strain. This is why strain-compensated models, typically expressing these constants as polynomial functions of strain, have been proposed to improve predictions [11,13]. Such an approach has proven successful for several magnesium alloys, including extruded ZK61 [11] and AZ31 [15]. However, a strain-compensated model specifically for the as-cast ZM6 alloy over a wide strain range (0.025–0.80) has not yet been reported.
Processing maps are built from energy dissipation efficiency (η) and flow instability criteria (ξ), and they help distinguish “safe” from “unstable” regions during hot deformation. Work on AZ-series alloys demonstrates the usefulness of this method. Shang et al. [19] studied as-cast AZ31 over 250–450 °C, 0.001–1.0 s−1, and identified an optimal processing window at 300–350 °C/0.01–1.0 s−1. Xu et al. [20] worked on AZ61 over 220–380 °C, 0.001–1.0 s−1, and showed that instability was linked to shear band formation and suggested 340 °C/0.001 s−1 as ideal parameters. Yan Xu et al. [21] reported that the AZ91 alloy becomes unstable, which is attributed to dislocation buildup caused by poor dynamic recovery under thermal softening. Li et al. [22] added 0.8 wt.% Ce to AZ80 and reduced instability zones by 30% by accelerating dynamic recrystallization (DRX). However, for Mg-Nd-Zn-Zr alloys, specifically as-cast ZM6, the hot processing characteristics are not yet well documented.
Considerable work on the flow stress behaviors of Mg-RE-Zr alloys [2,5,6,8,9] has been studied. Nevertheless, a clearer statement of the gap in the literature regarding the ZM6 alloy is necessary: although individual aspects of Mg-RE systems have been investigated, no study has systematically combined a strain-compensated Arrhenius model with processing map analysis for as-cast ZM6 over a wide strain range (0.025–0.80), nor has the characteristic strain for DRX (critical, peak, and steady-state) been quantitatively linked to processing parameters for this alloy. This gap hinders the optimization of hot working conditions and the prediction of defect formation. However, the high alloying content impairs microstructural stability at elevated temperatures, reduces thermoplasticity, and complicates the processing steps [5,6]. A systematic investigation of the hot deformation behavior is therefore required to strike a balance between microstructural control and processing efficiency. The present work addresses this need for the as-cast ZM6 alloy. Hot compression tests were done at 300–450 °C and 0.0001–0.1 s−1, from which true stress (σ)-strain (ε) curves were obtained. An improved Arrhenius model was fitted with a fifth-order polynomial to handle strain compensation. A processing map was built using the traditional dynamic materials model (DMM). The study had three objectives: (1) to build a strain-compensated Arrhenius model that predicts flow stress (σ) reasonably well across the whole strain range; (2) to construct DMM-based processing maps and identify safe and unstable deformation regimes; (3) to estimate the characteristic strains for DRX (critical, peak, and steady-state) and link them to processing conditions.
2. Materials and Methods
2.1. Sample Preparation
The chemical elemental content of the ZM6 alloy is: 0.2–0.7% Zn, 2.0–3.0% Nd, total Zr: 0.4–1.0%, soluble Zr ≥ 0.4%, Si: 0.01%, Cu: 0.03%, Ni: 0.01%, Fe: 0.01%, other elements: 0.05%. The composition of ZM6 alloys is Mg2.6Nd0.4Zn0.4Zr, in which Cu < 0.1%, Ni < 0.01%, and Fe < 0.08% (all in mass fractions).
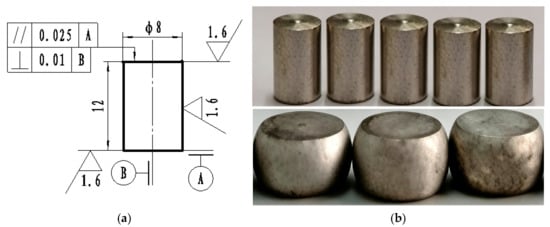
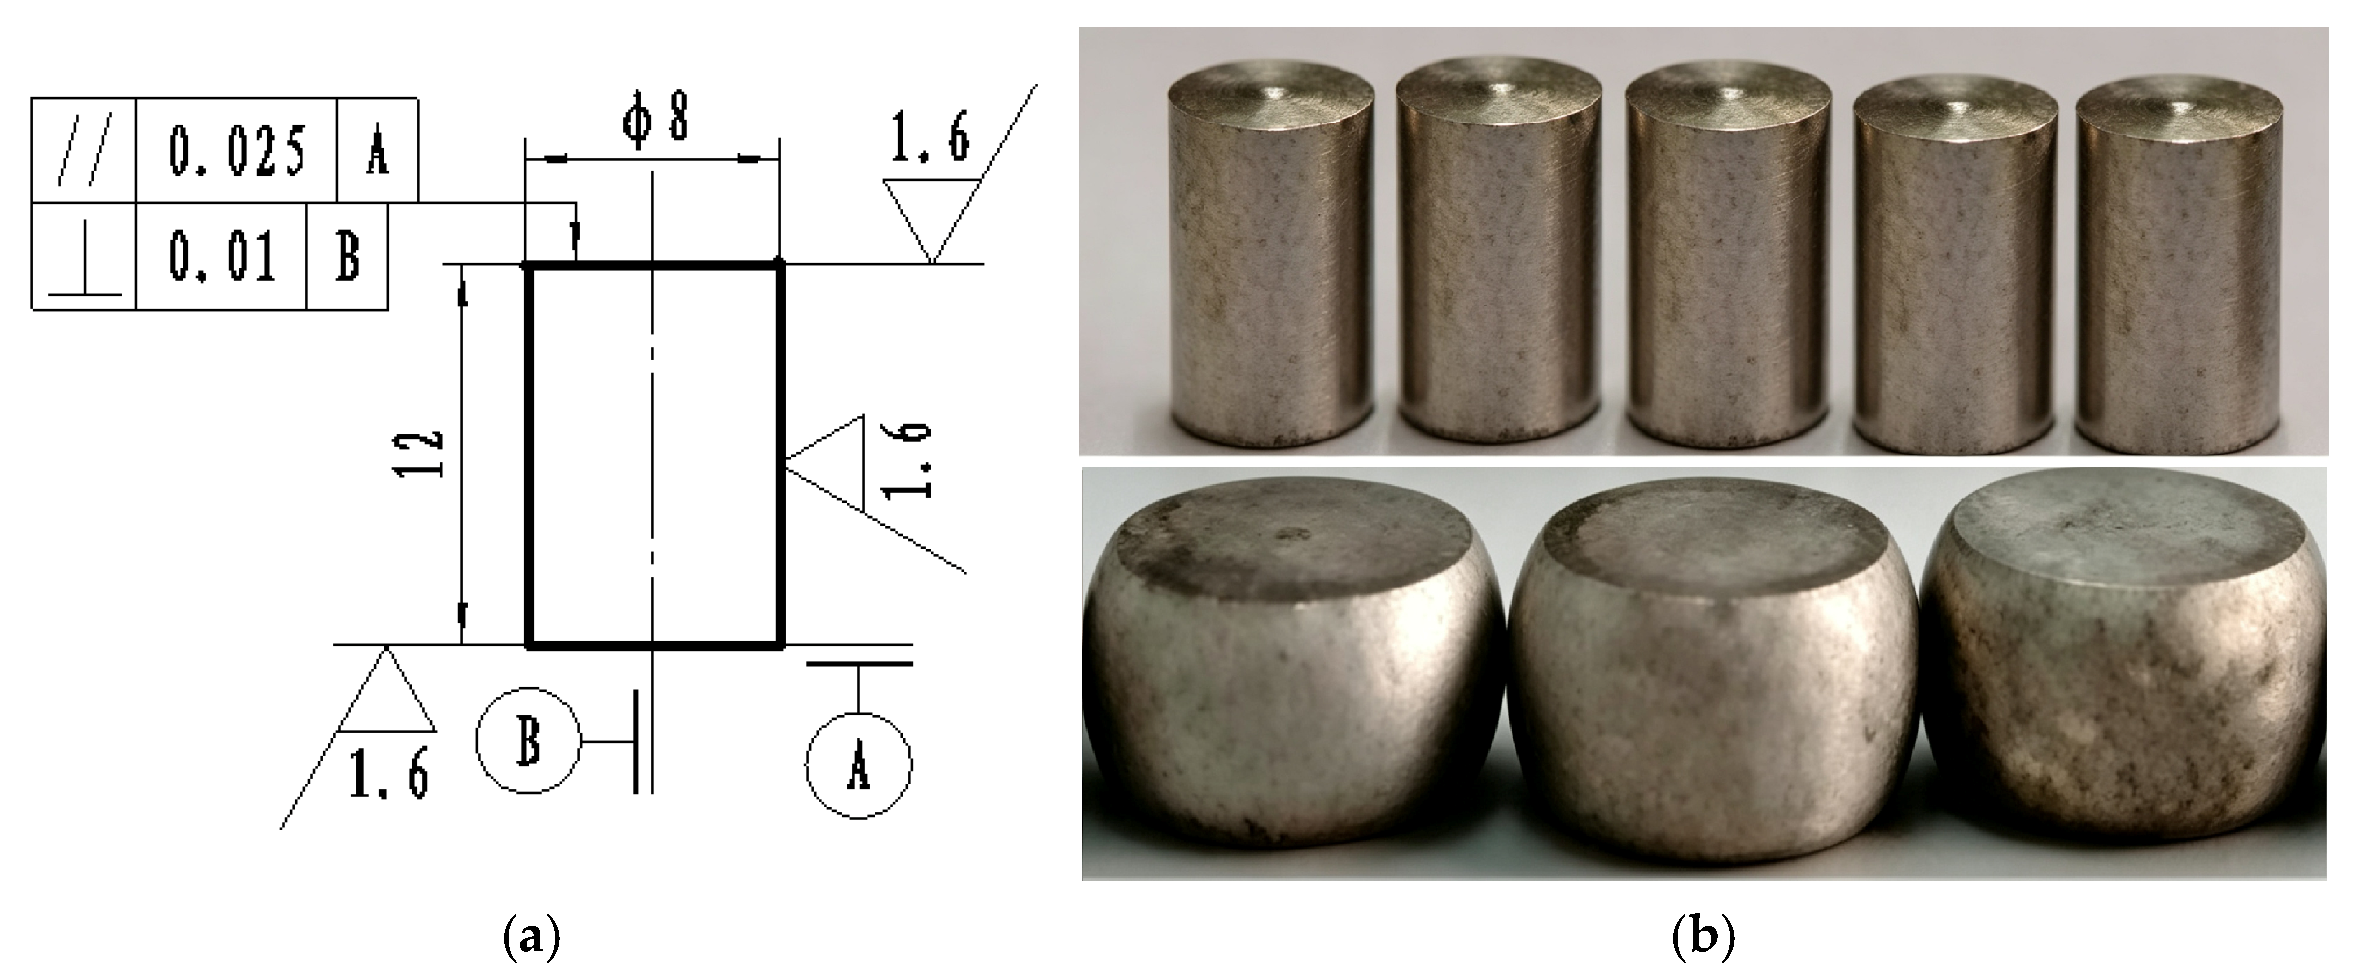
Gleeble-1500D (Dynamic Systems Inc., Poestenkill, NY, USA) sample parameters are set in Figure 1.
Figure 1.
Sample dimensions. (a) Schematic of the Gleeble hot compression specimen (dimensions in mm). (b) Macro morphologies of ZM6 alloy before and after tests.
The as-cast ZM6 ingot specimen was prepared using the DK7740 wire cutting machine (Jiangsu Fangzheng CNC Machine Tool Co., Ltd., Taizhou, China), with the voltage set at 5.0 V and the current at 2.2 A. Cylindrical samples were used.
2.2. Hot Compression Schedules
The temperature ranged from 300 °C to 450 °C in steps of 50 °C, and the strain rate (ε·) was 10−1 s−1, 10−2 s−1, 10−3 s−1 and 10−4 s−1 (see Figure S1). Graphite was applied to both ends of the specimen during compression to reduce frictional resistance. When the compression temperature was above 200 °C, the vacuum was pumped and the heating and holding times were 5 min each to ensure that the sample was heated fully and evenly. The strain intervals for polynomial fitting of material constants were 0.025 across the range of 0.025 to 0.80, and a fifth-order polynomial was selected based on the Akaike Information Criterion (AIC) to balance accuracy and overfitting.
3. Results and Discussion
3.1. Hot Compression Behavior and Constitutive Equations
3.1.1. Stress-Strain Curve and Flow Peak Stress
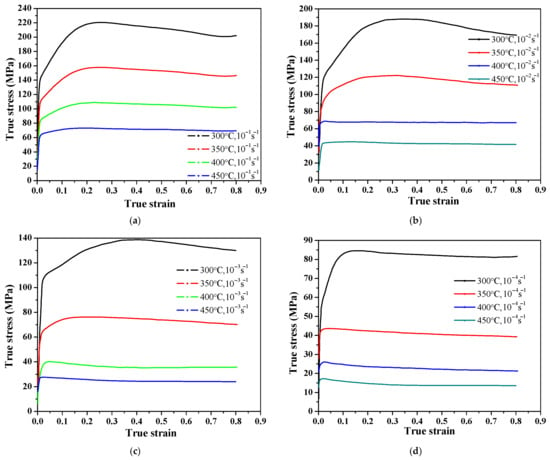
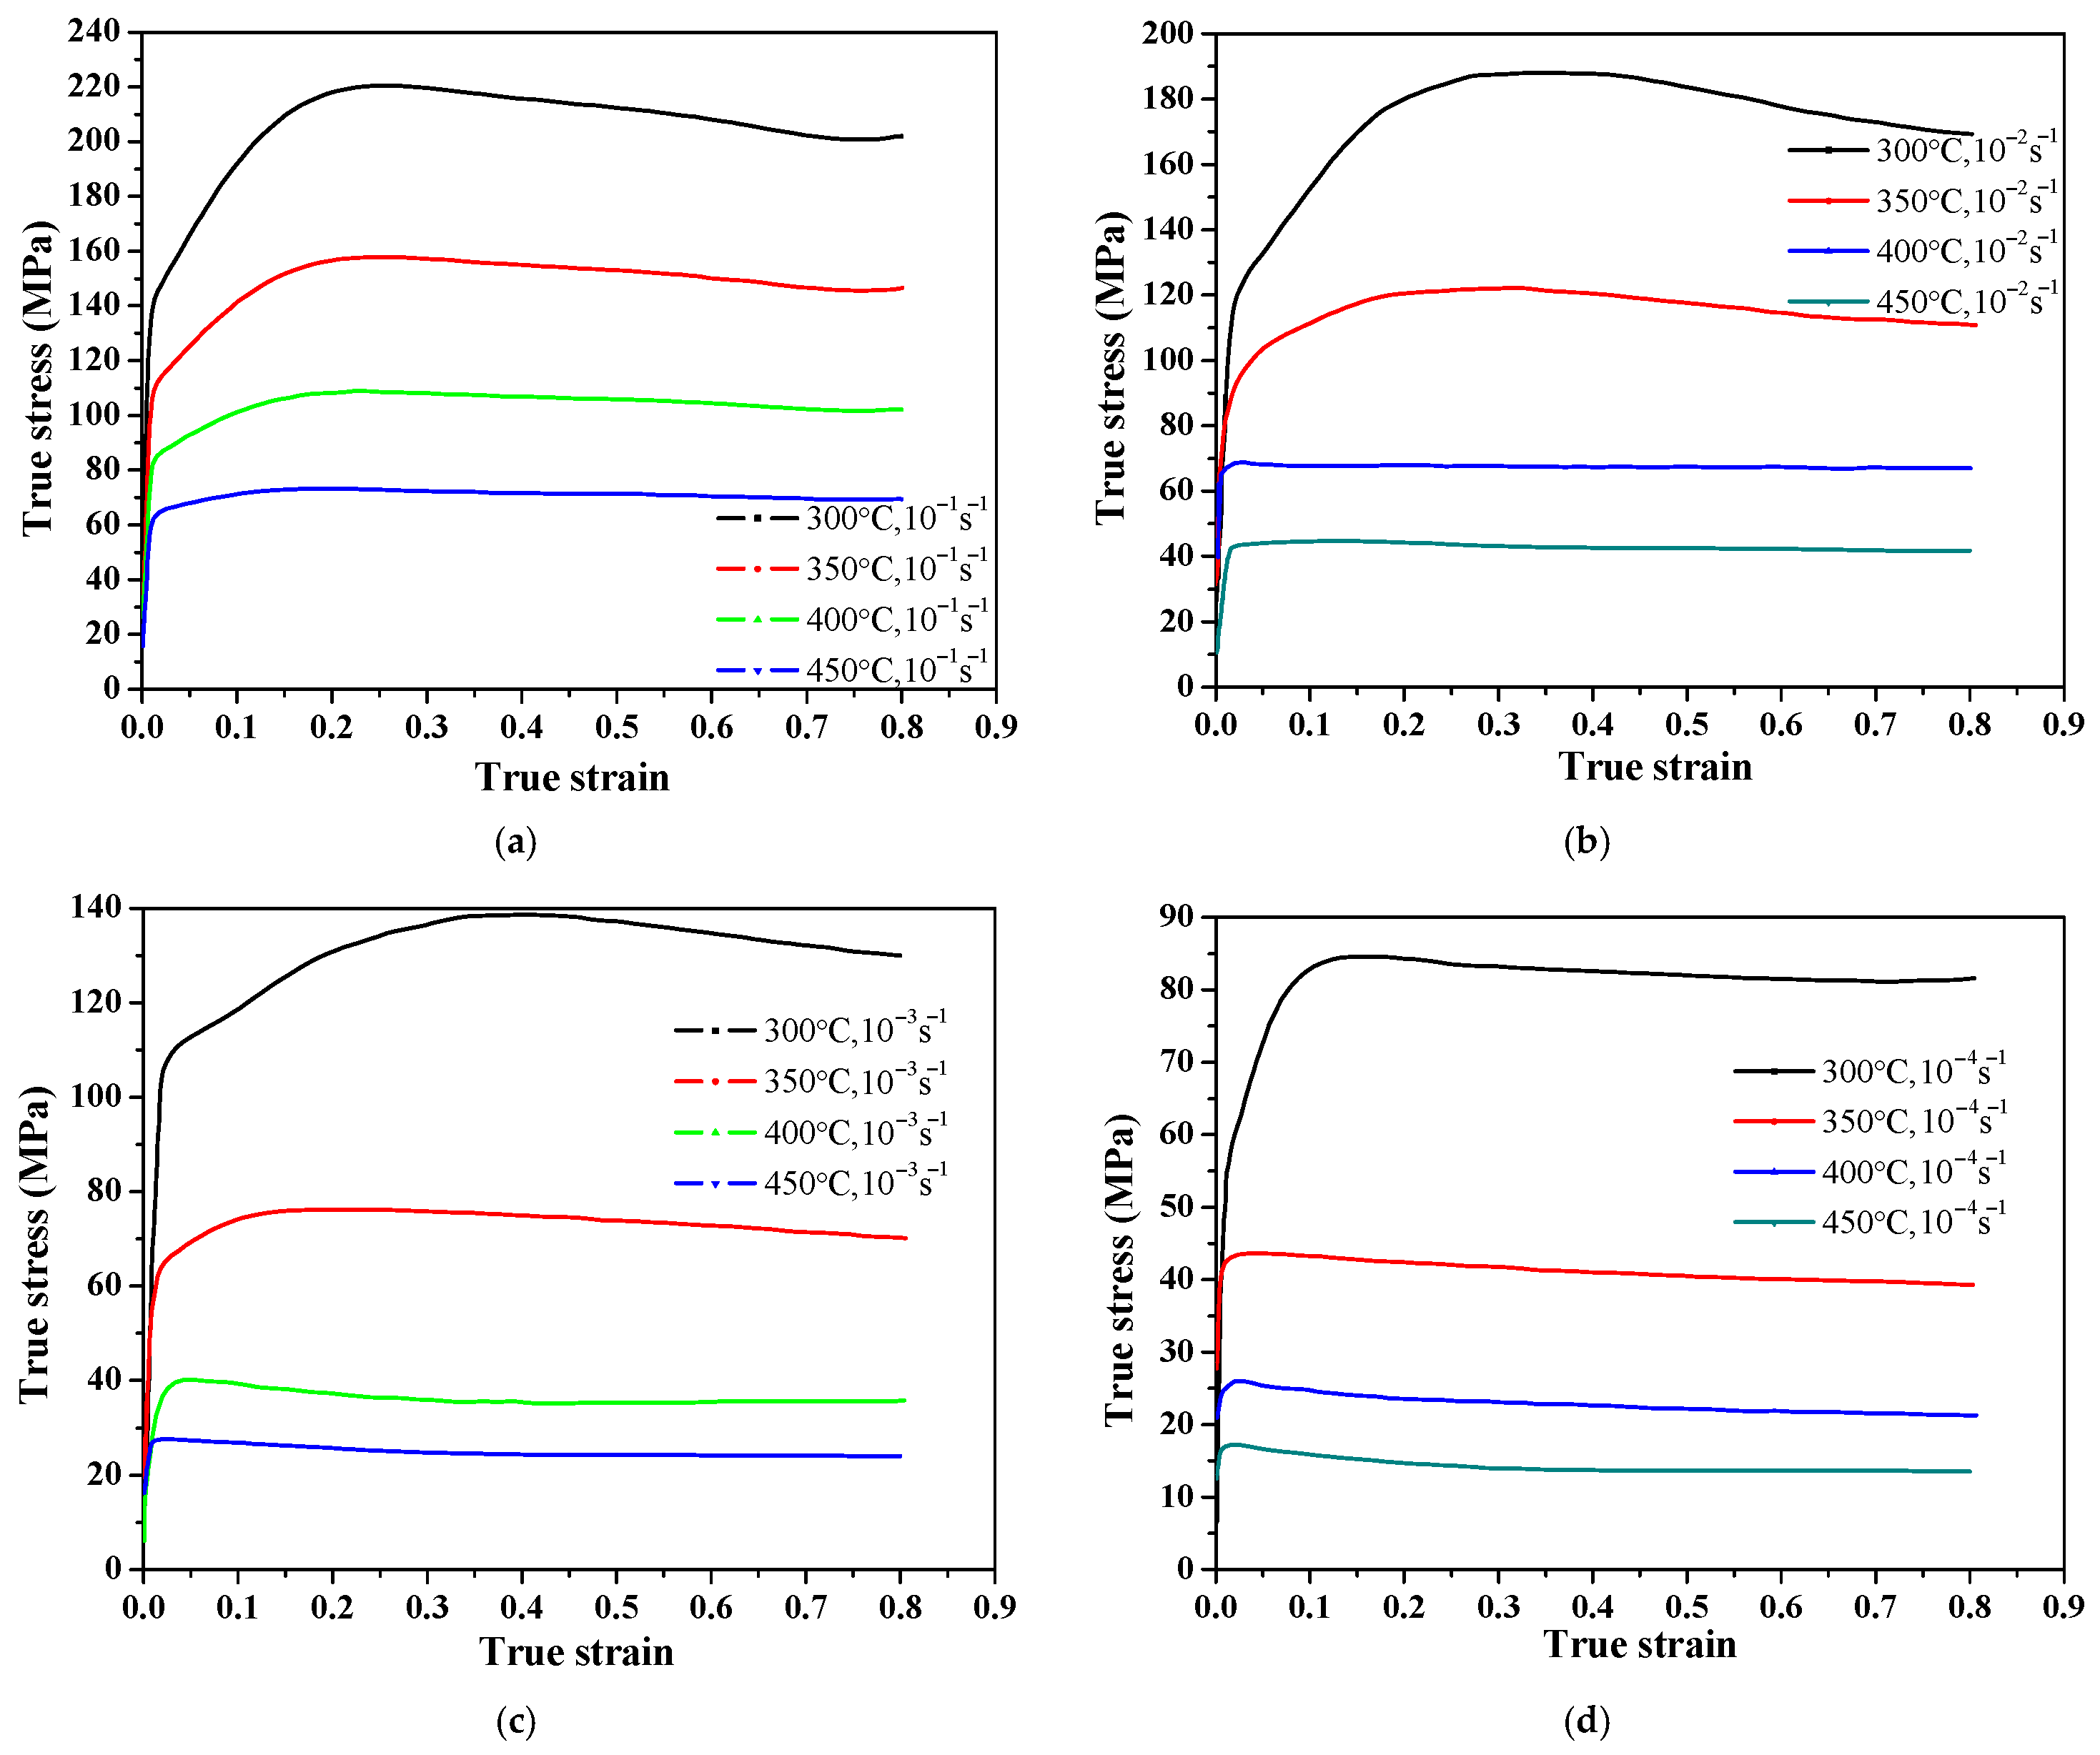
The hot deformation behavior of the ZM6 alloy is the thermally activated softening and positive strain rate sensitivity. As the deformation advances, the stress increases gradually then declines slowly toward fracture. But at high temperatures (300–400 °C), the true strain is still 0.9 and fracture occurs. The flow curves exhibit notable sensitivity to ε·. At a higher ε·, the compressive stress rises gradually and displays an obvious yield point; post-yielding, the stress continues to rise until the peak value is reached, after which it transitions to steady-state flow. This behavior occurs because, after yielding, hardening outweighs softening initially until the stress peak, where the two reach equilibrium, thus sustaining steady-state flow. Under specific conditions (10−4 s−1 at 300 °C, or 10−2 s−1 and 10−3 s−1 at 400 °C), the true stress after yield does not further rise with strain but immediately exhibits steady flow, pointing to a near equilibrium between softening and hardening processes, rendering the flow stress curve close to horizontal. At 400 °C and a strain rate of 10−4 s−1, a slight decrease occurs in the flow behavior of the yield curve, suggesting that DRX may occur when the temperature is high and the strain rate is low. Following the yield point, the softening effect begins to exceed the hardening effect, resulting in a downward-sloping curve. The maximum flow stress values of the ZM6 alloy are listed in Table 1.
Table 1.
The maximum σ values of the ZM6 alloy (unit: MPa).
From Table 1, the maximum σ of the ZM6 alloy exhibits a pronounced decrease with increasing T and a notable increase with increasing ε·. At a given strain rate, raising the temperature from 300 °C to 450 °C reduces σ by approximately 79.6% (from 84.627 to 17.222 MPa at 0.0001 s−1) and by about 66.8% (from 220.477 to 73.260 MPa at 0.1 s−1), indicating that elevated temperatures promote dislocation motion and activate dynamic recovery (DRV) and conditions favorable for recrystallization, thereby lowering deformation resistance. However, the thermal softening effect is relatively weaker under high-strain rate conditions (smaller reduction), suggesting that dynamic softening mechanisms may be partially suppressed at higher strain rates. Conversely, at a fixed temperature, increasing ε· from 0.0001 to 0.1 s−1 raises σ by about 160.5% at 300 °C (from 84.627 to 220.477 MPa) and by about 325.4% at 450 °C (from 17.222 to 73.260 MPa). Notably, the ε· sensitivity is significantly more pronounced at 450 °C, which can be attributed to the matrix softening at elevated temperatures, making mechanisms such as grain boundary sliding or diffusion creep more susceptible to loading rate variations, thus leading to a stronger rate-dependent behavior.
3.1.2. Constitutive Model from Peak Flow Stress
For the ZM6 alloy, the relationships of the Arrhenius equation and flow stress are given as follows:
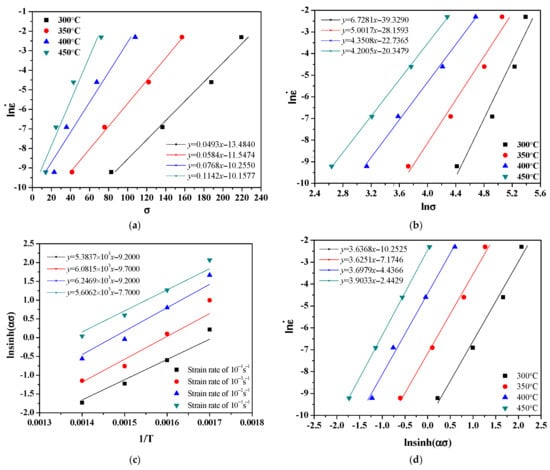
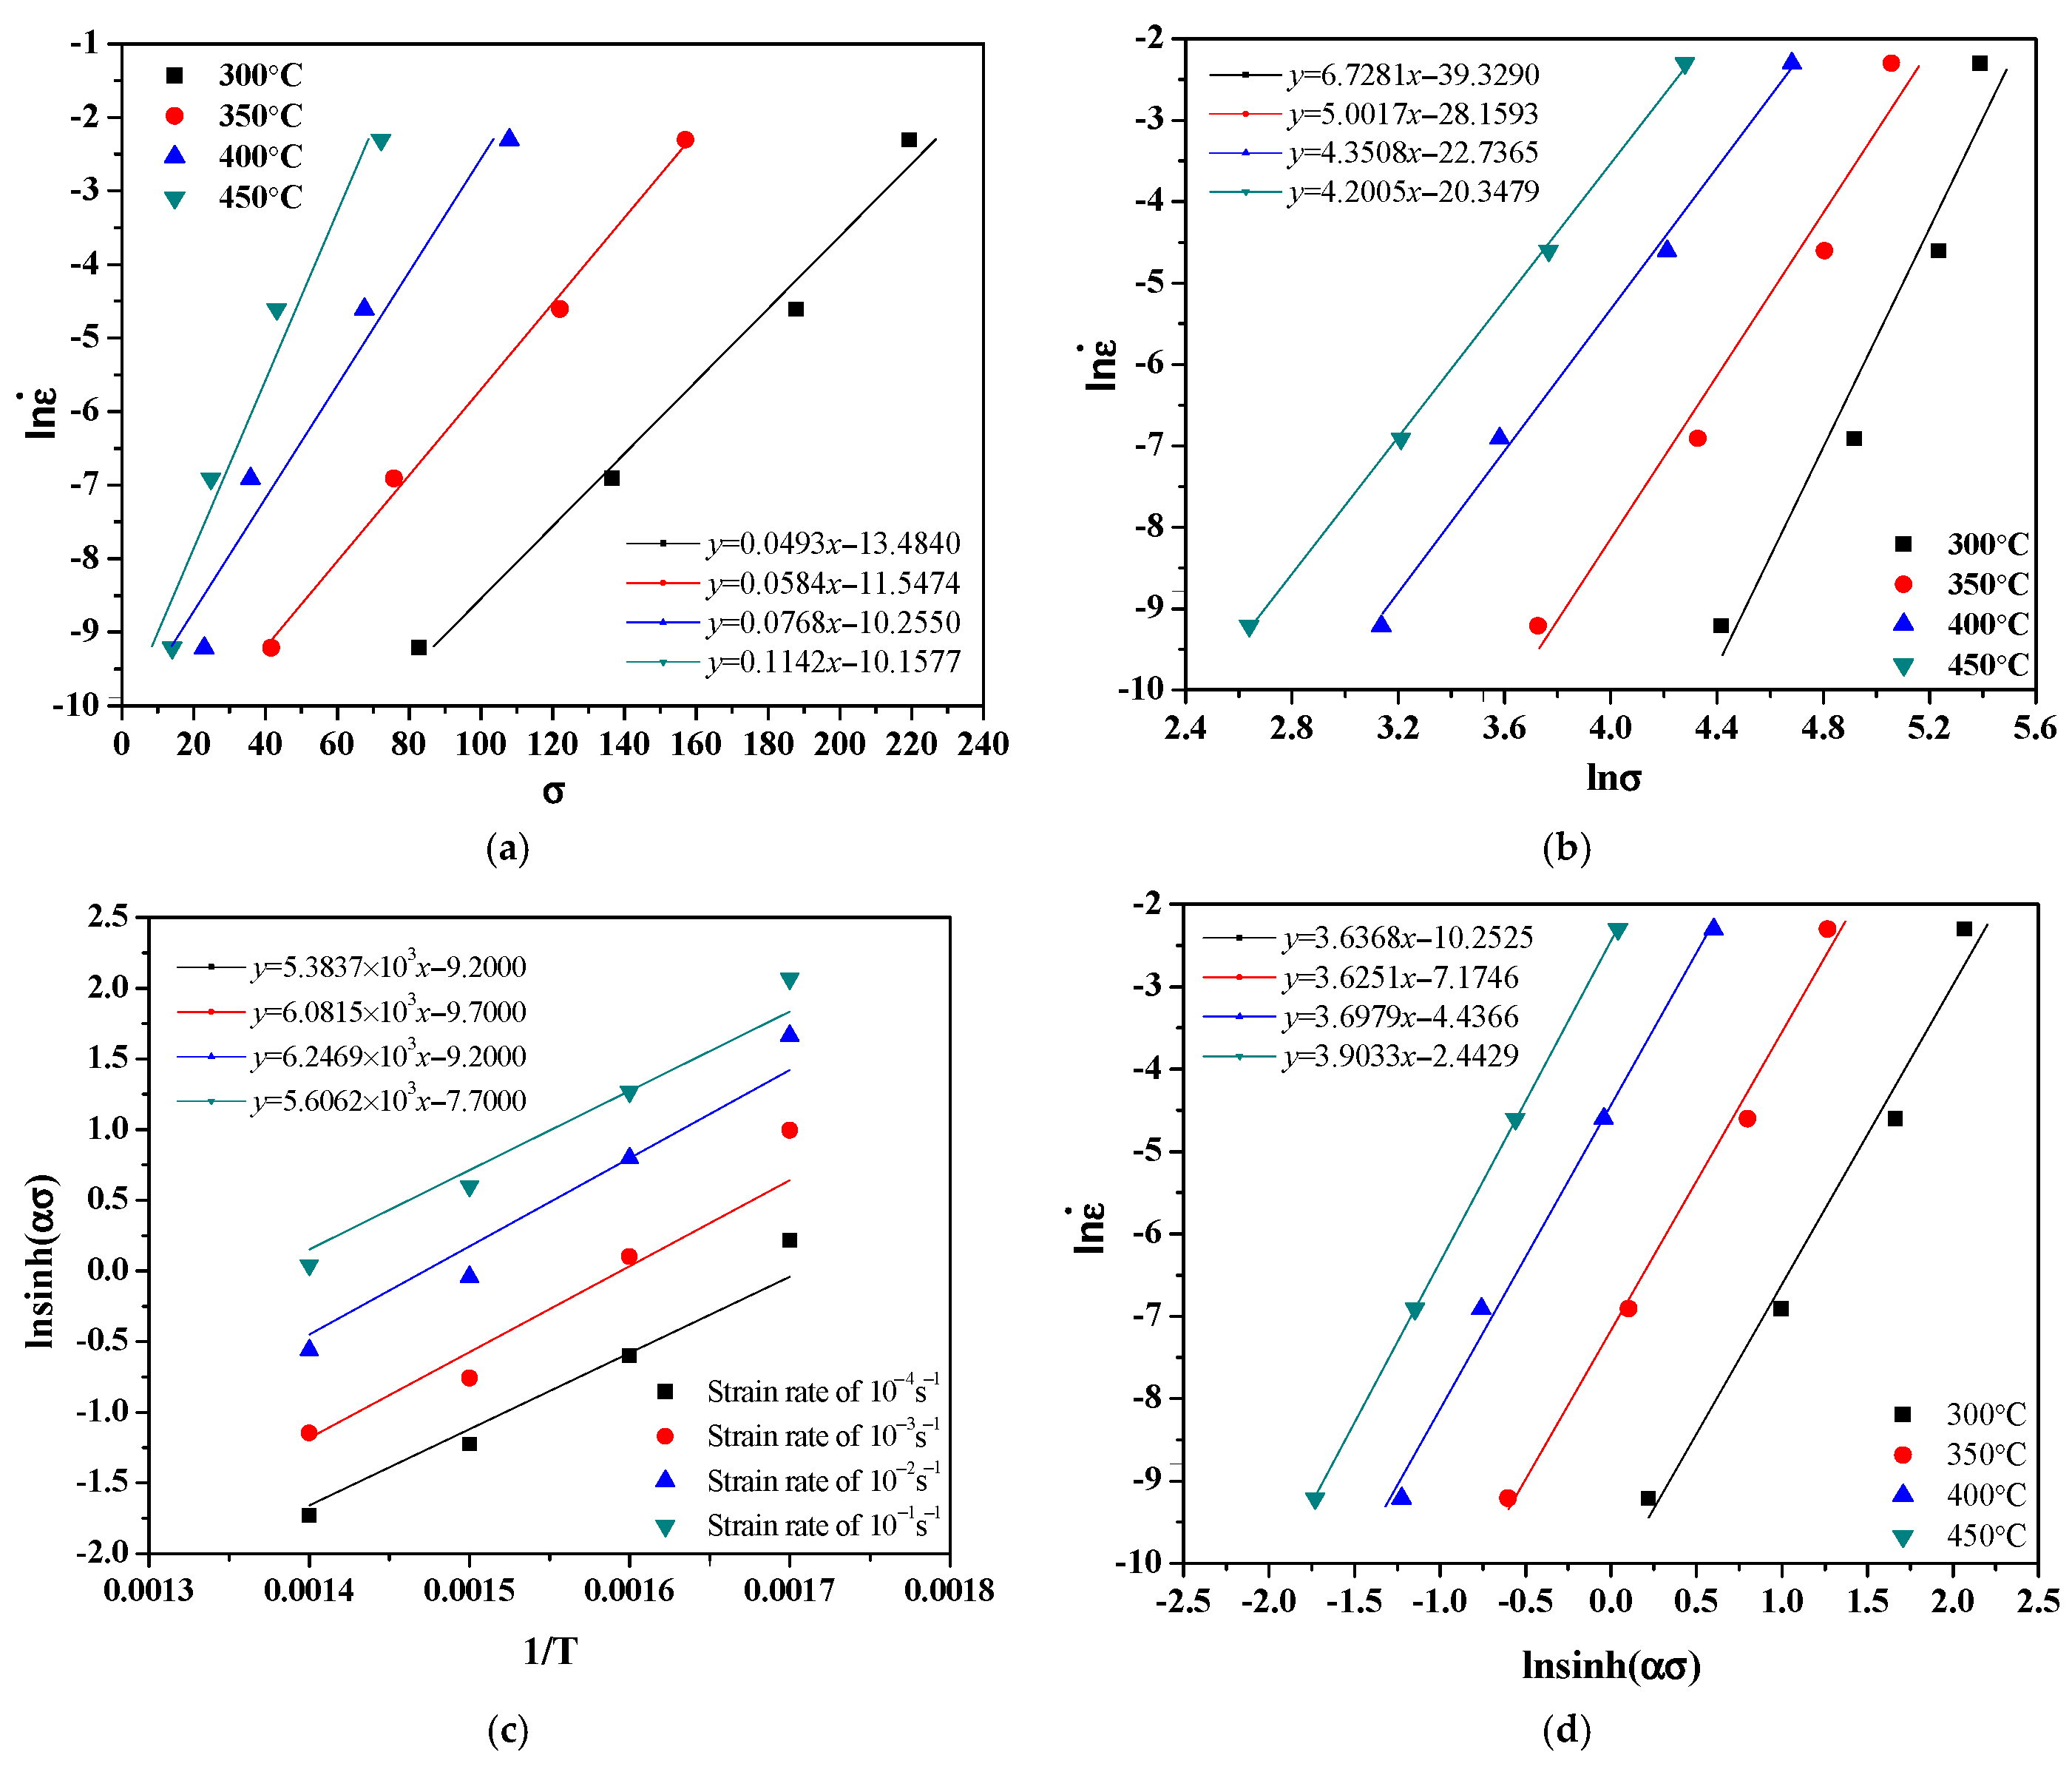
By substituting the Zener–Hollomon parameter (Z = ε· exp(Q/RT) into the hyperbolic sine law, σ can be described explicitly. The flow stress equation for the ZM6 alloy can be obtained. To determine the material constants, the following procedure was applied. The slope of this linear fit, averaged across all strain rates, directly yields the value of Q/nR. Concurrently, a linear fit of ln[sinh(ασ)] versus ln(ε·) at constant temperatures provides the stress exponent, n. α is obtained from the ratio (β/n1), where n1 and β are derived from linear regression of ln(σ)–ln(ε·) and σ–ln(ε·) plots. A more robust value for Q is then determined from the slope of the ln[sinh(ασ)]-versus-1/T plot, using the relationship Q = Rβ K. Based on the maximum flow stress in Table 1, the average activation energy of ZM6 at 300–450 °C is 182.38 kJ/mol. Furthermore, the parameters calculated are: α = 0.0114, Q = 182.380 kJ·mol−1, n = 4.1035, and A = 1.9417 × 10¹².
Based on the maximum flow stress in Table 1 and the calculated Q value, the Z parameter can be obtained as
Substituting Equation (3) into Equation (2), the flow stress can be described as
According to Equation (1), the constitutive equation can be described as
It is worth noting from Equation (5) that strain terms are not included in the Arrhenius constitutive model.
3.2. Improved Constitutive Equation Considering Strain Compensation
3.2.1. Constitutive Equation Considering Strain Effect
Recent studies indicate that the material constant typically varies with strain; therefore, strain compensation is necessary to achieve a high-precision constitutive equation. That is, the strain polynomial can be used to modify the material constant [13,14].
Using the strain ε = 0.3 as an illustration, the plots of ln(σ)–ln(ε·) and σ–ln(ε·) are presented in Figure 2, where the R-square values all exceed 0.95. n1 and β are 4.2757 and 0.0539, respectively. As α = β/n1, α is 0.0126.
Figure 2.
True strain-stress of ZM6 alloy at various strain rates: (a) 10−1 s−1; (b) 10−2 s−1; (c) 10−3 s−1; (d) 10−4 s−1.
Under the strain of 0.3, the intercept lnA is obtained from the lnZ–ln[sinh(ασ)] or ln[sinh(ασ)]–ln(ε·) relations, and A is averaged as A = 8.9888 × 10¹¹. The parameters under the strain, ε, of 0.3 are therefore determined to be: α = 0.0126, Q = 180.091 kJ·mol−1, n = 3.7158, and A = 8.9888 × 10¹¹ (see Figure 3 and Figure 4).
Figure 3.
Estimation of n1 and β at an ε of 0.3 of ZM6 alloy: (a) ln(σ)–ln(ε·); (b) σ–ln(ε·); (c) ln[sinh(ασ)] versus 1/T; (d) ln[sinh(ασ)] versus ln(ε·).
Figure 4.
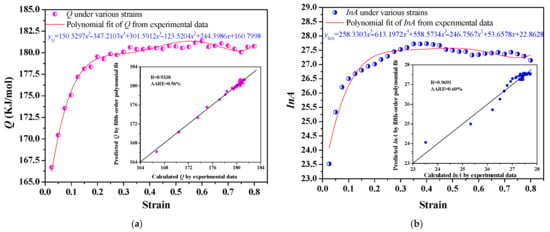
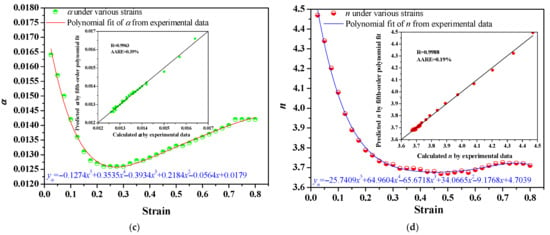
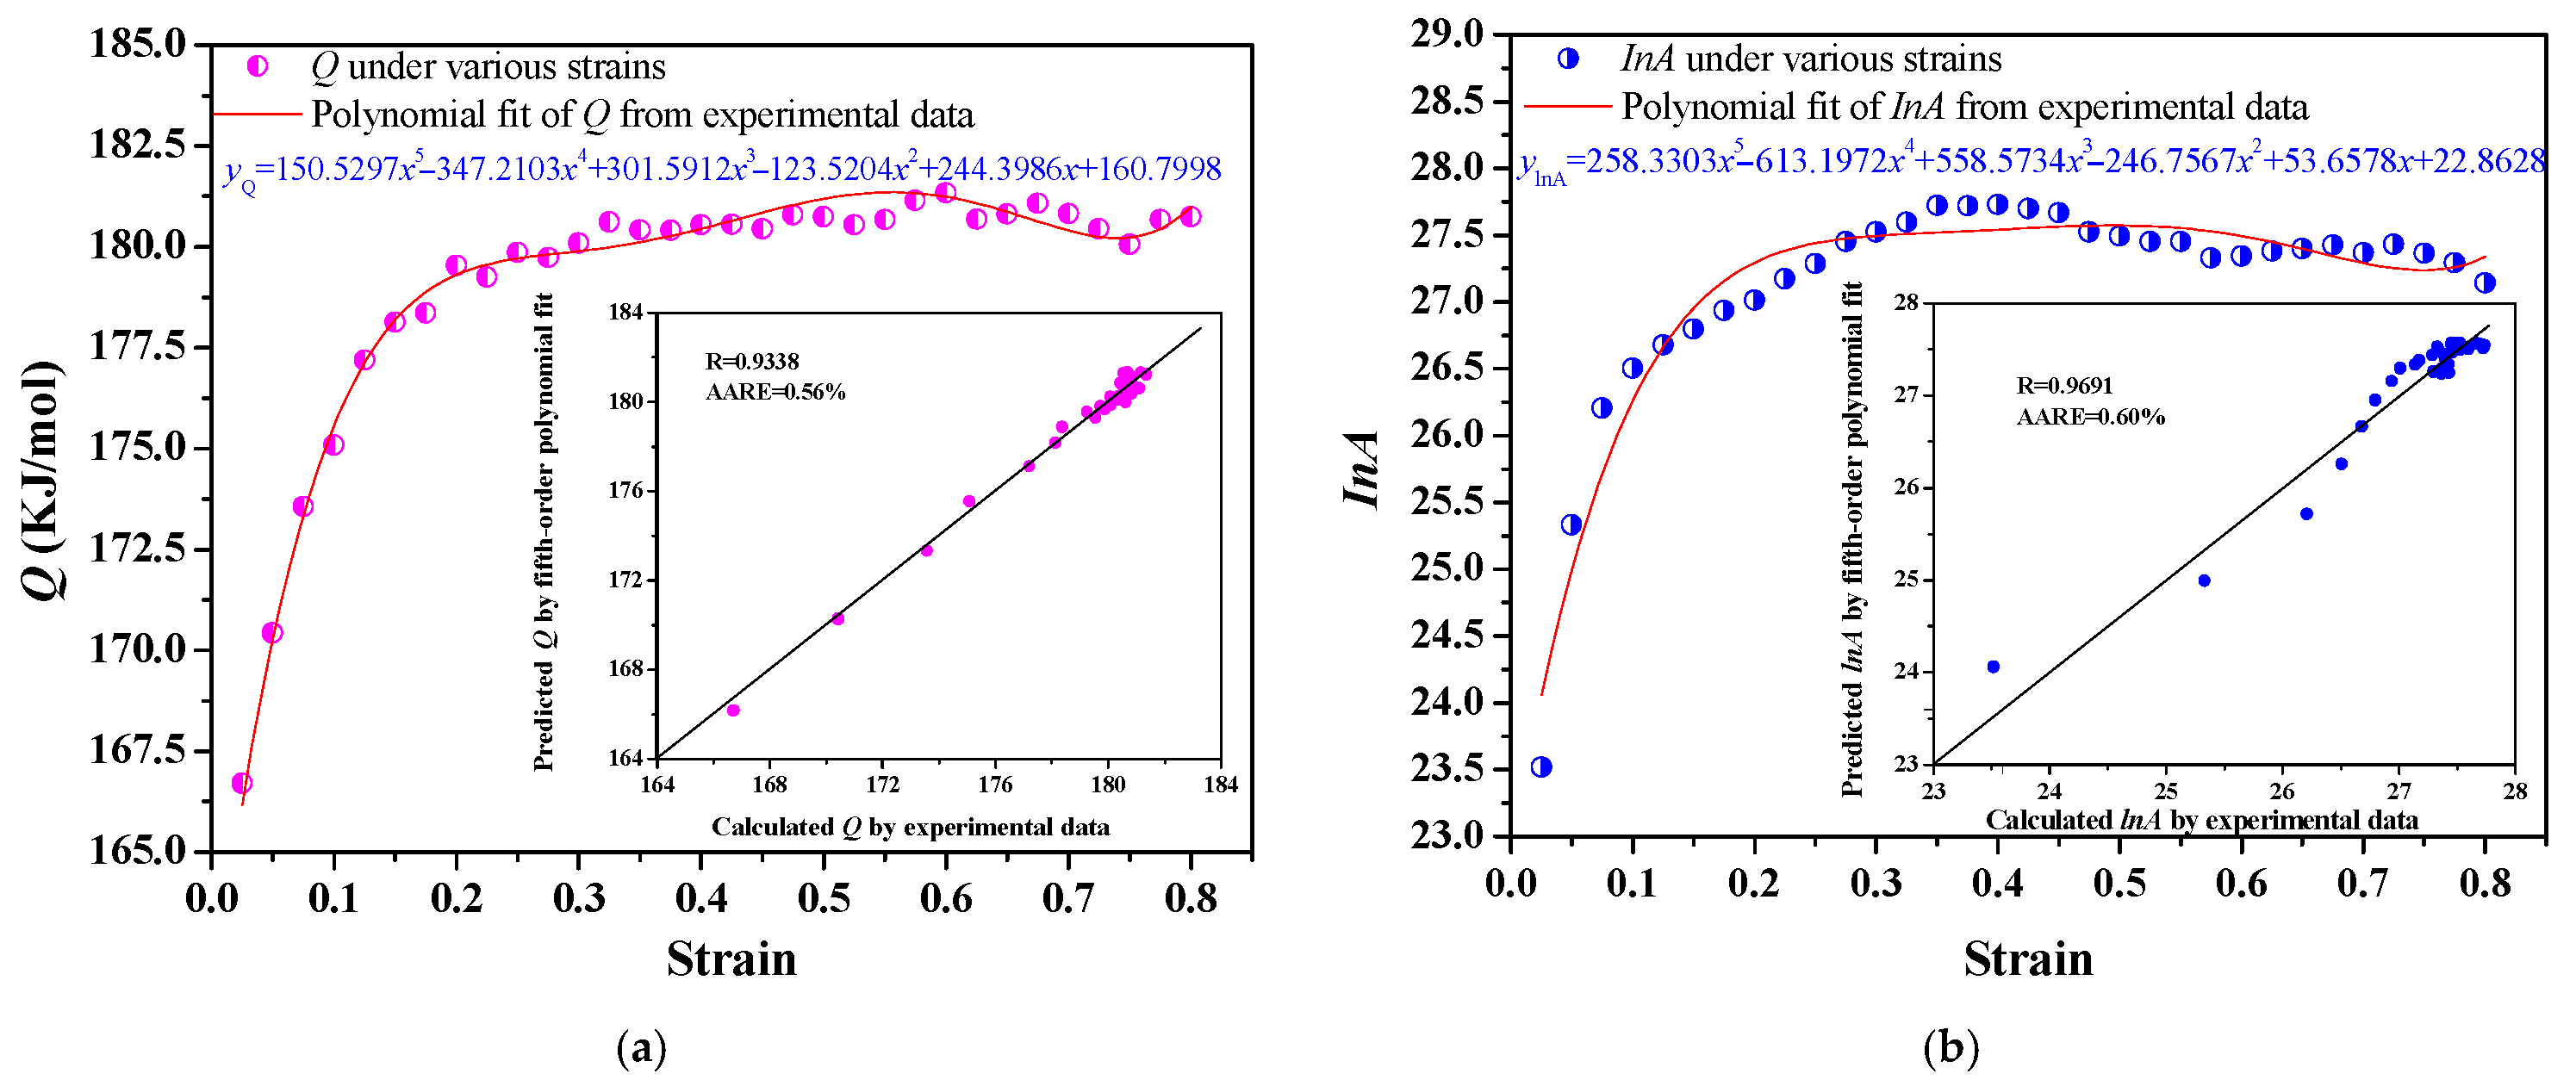
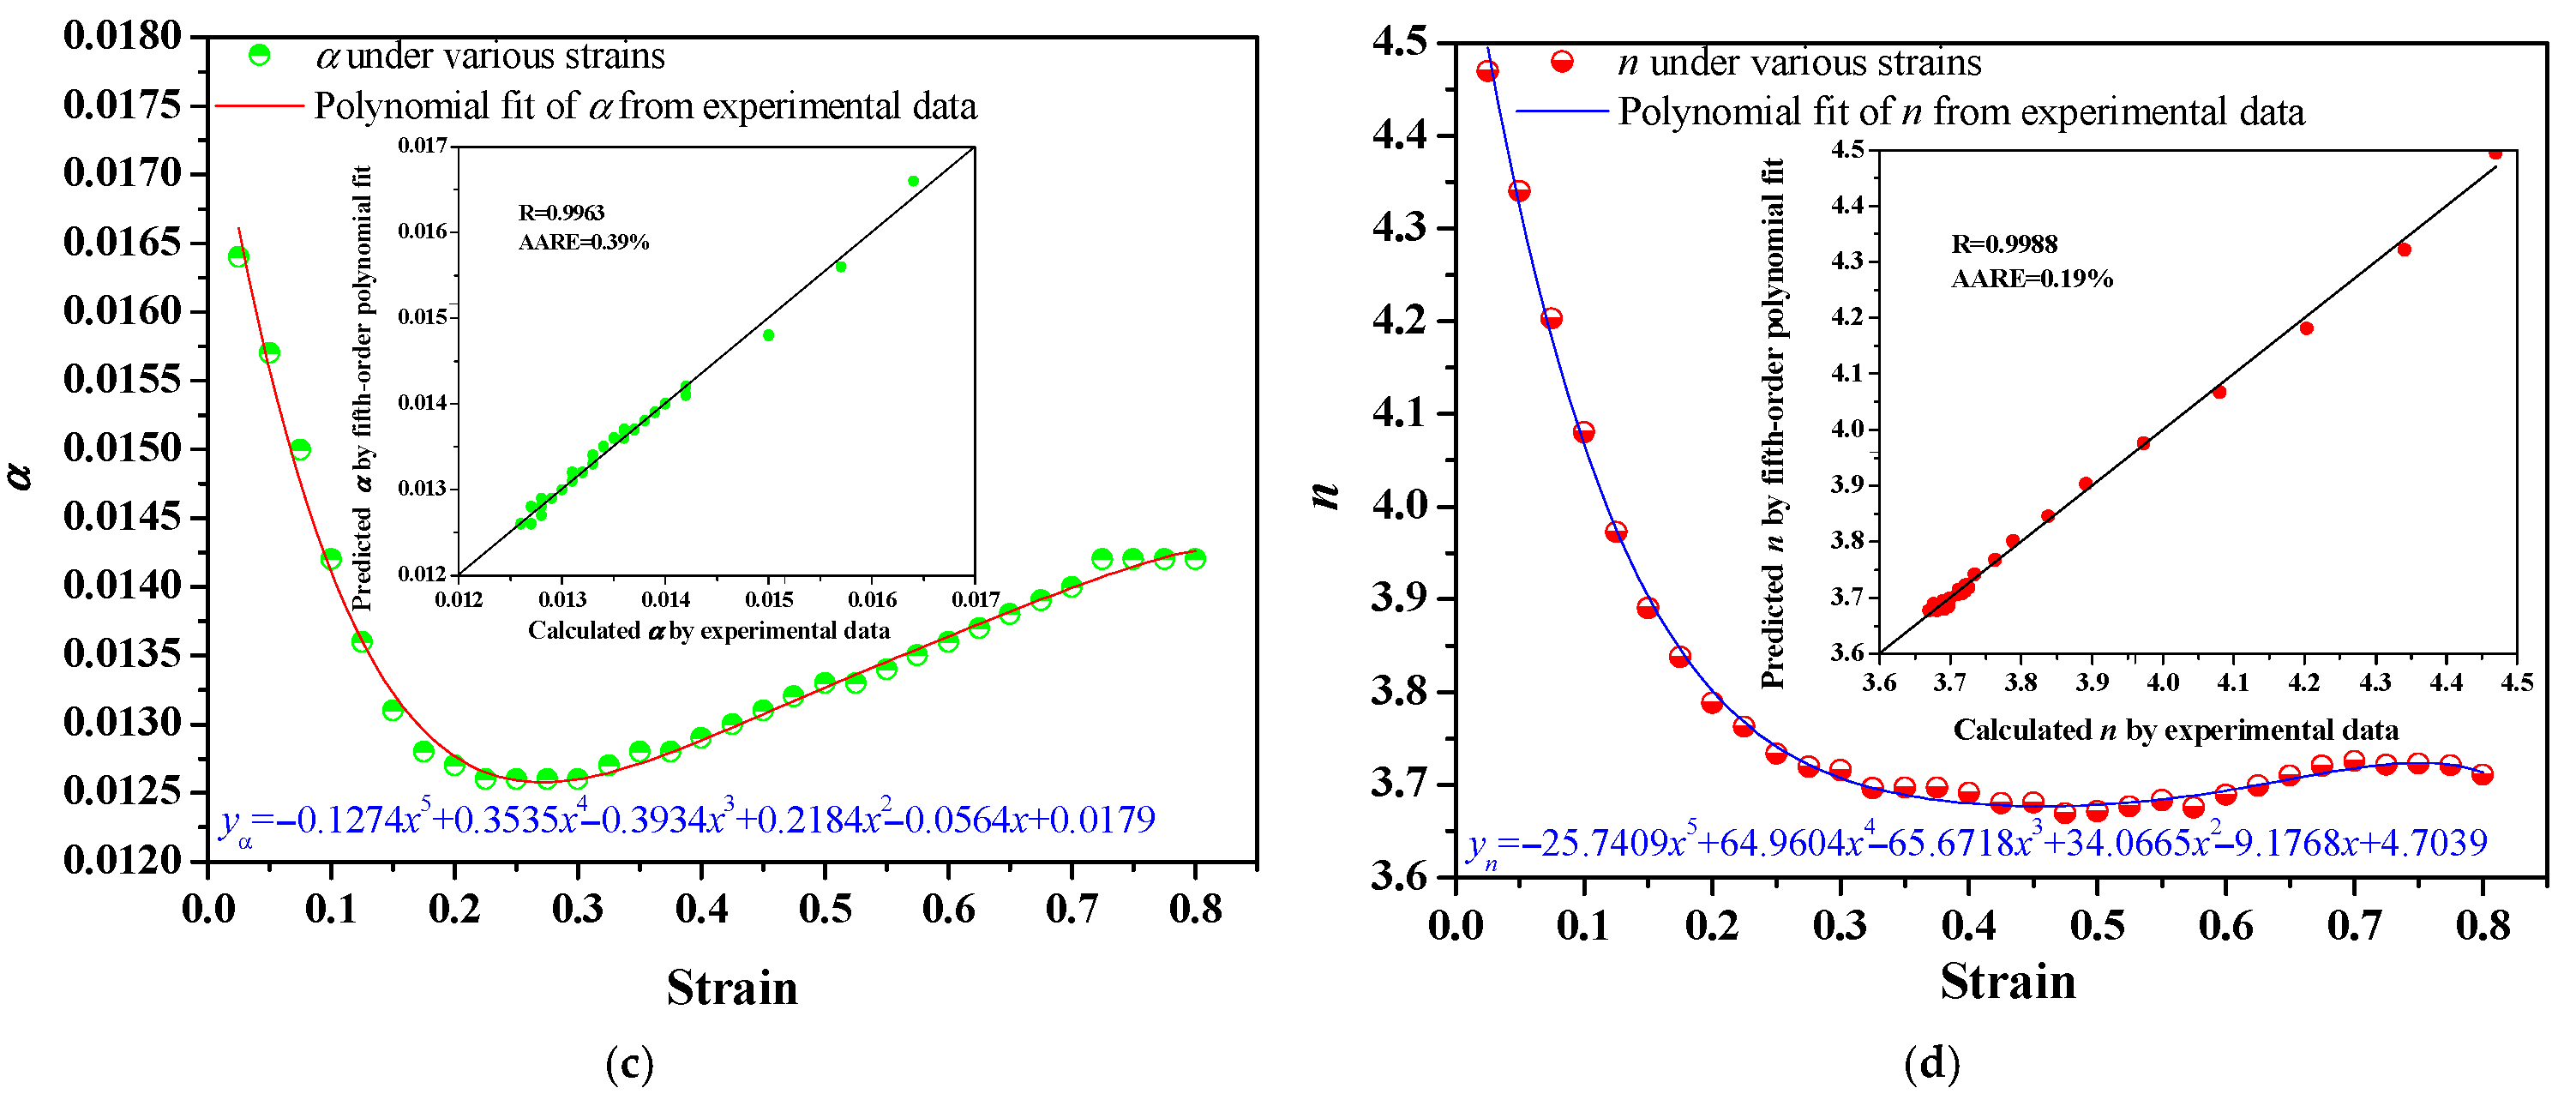
Relation between ε and α, lnA, n and Q in Arrhenius model of ZM6 alloy: (a) parameter estimation of α; (b) parameter estimation of lnA; (c) parameter estimation of n; (d) parameter estimation of Q.
Following the above procedure for the ZM6 alloy, α, n, Q, and lnA were repeatedly determined at strain intervals of 0.025 across the range of 0.025 to 0.80 for polynomial fitting, as illustrated in Figure 2. A fifth-order polynomial was subsequently fitted to these constants to obtain the final parameters as follows:
This polynomial fitting gives a more accurate description of how each material constant varies with true strain. It reveals that α, n, lnA and Q evolve regularly as the strain increases. The complete polynomial fitting results for these four parameters are presented in Table 2.
Table 2.
The fifth-order polynomial parameters of α, n, lnA and Q of ZM6 alloy.
For strain effects, the Zener–Hollomon parameter-based Arrhenius model for the ZM6 alloy used a fifth-order polynomial fitting via regression analysis. From the resulting polynomials for α, A, n, and Q across varying strains, the Z parameter came out under each tested condition. Putting these Z values into Equation (4) then gave the predicted flow stress, α, for the ZM6 alloy. The construction of the constitutive equation for the ZM6 alloy follows the assumption that the α, n, lnA, and Q vary as functions of strain [11,13,18]. This approach with a fifth-order polynomial allows the effect that strain exerts on flow stress to be incorporated into the model, thereby improving its predictive capability across the entire deformation range. It should be noted that this strain-compensated Arrhenius model is an empirical tool solely for flow stress prediction within the tested range (300–450 °C, 0.0001–0.1 s−1, and strain 0.025–0.80), and extrapolation beyond these conditions is not recommended.
3.2.2. Comparison of Experimental and Calculated Strain–Stress Curves
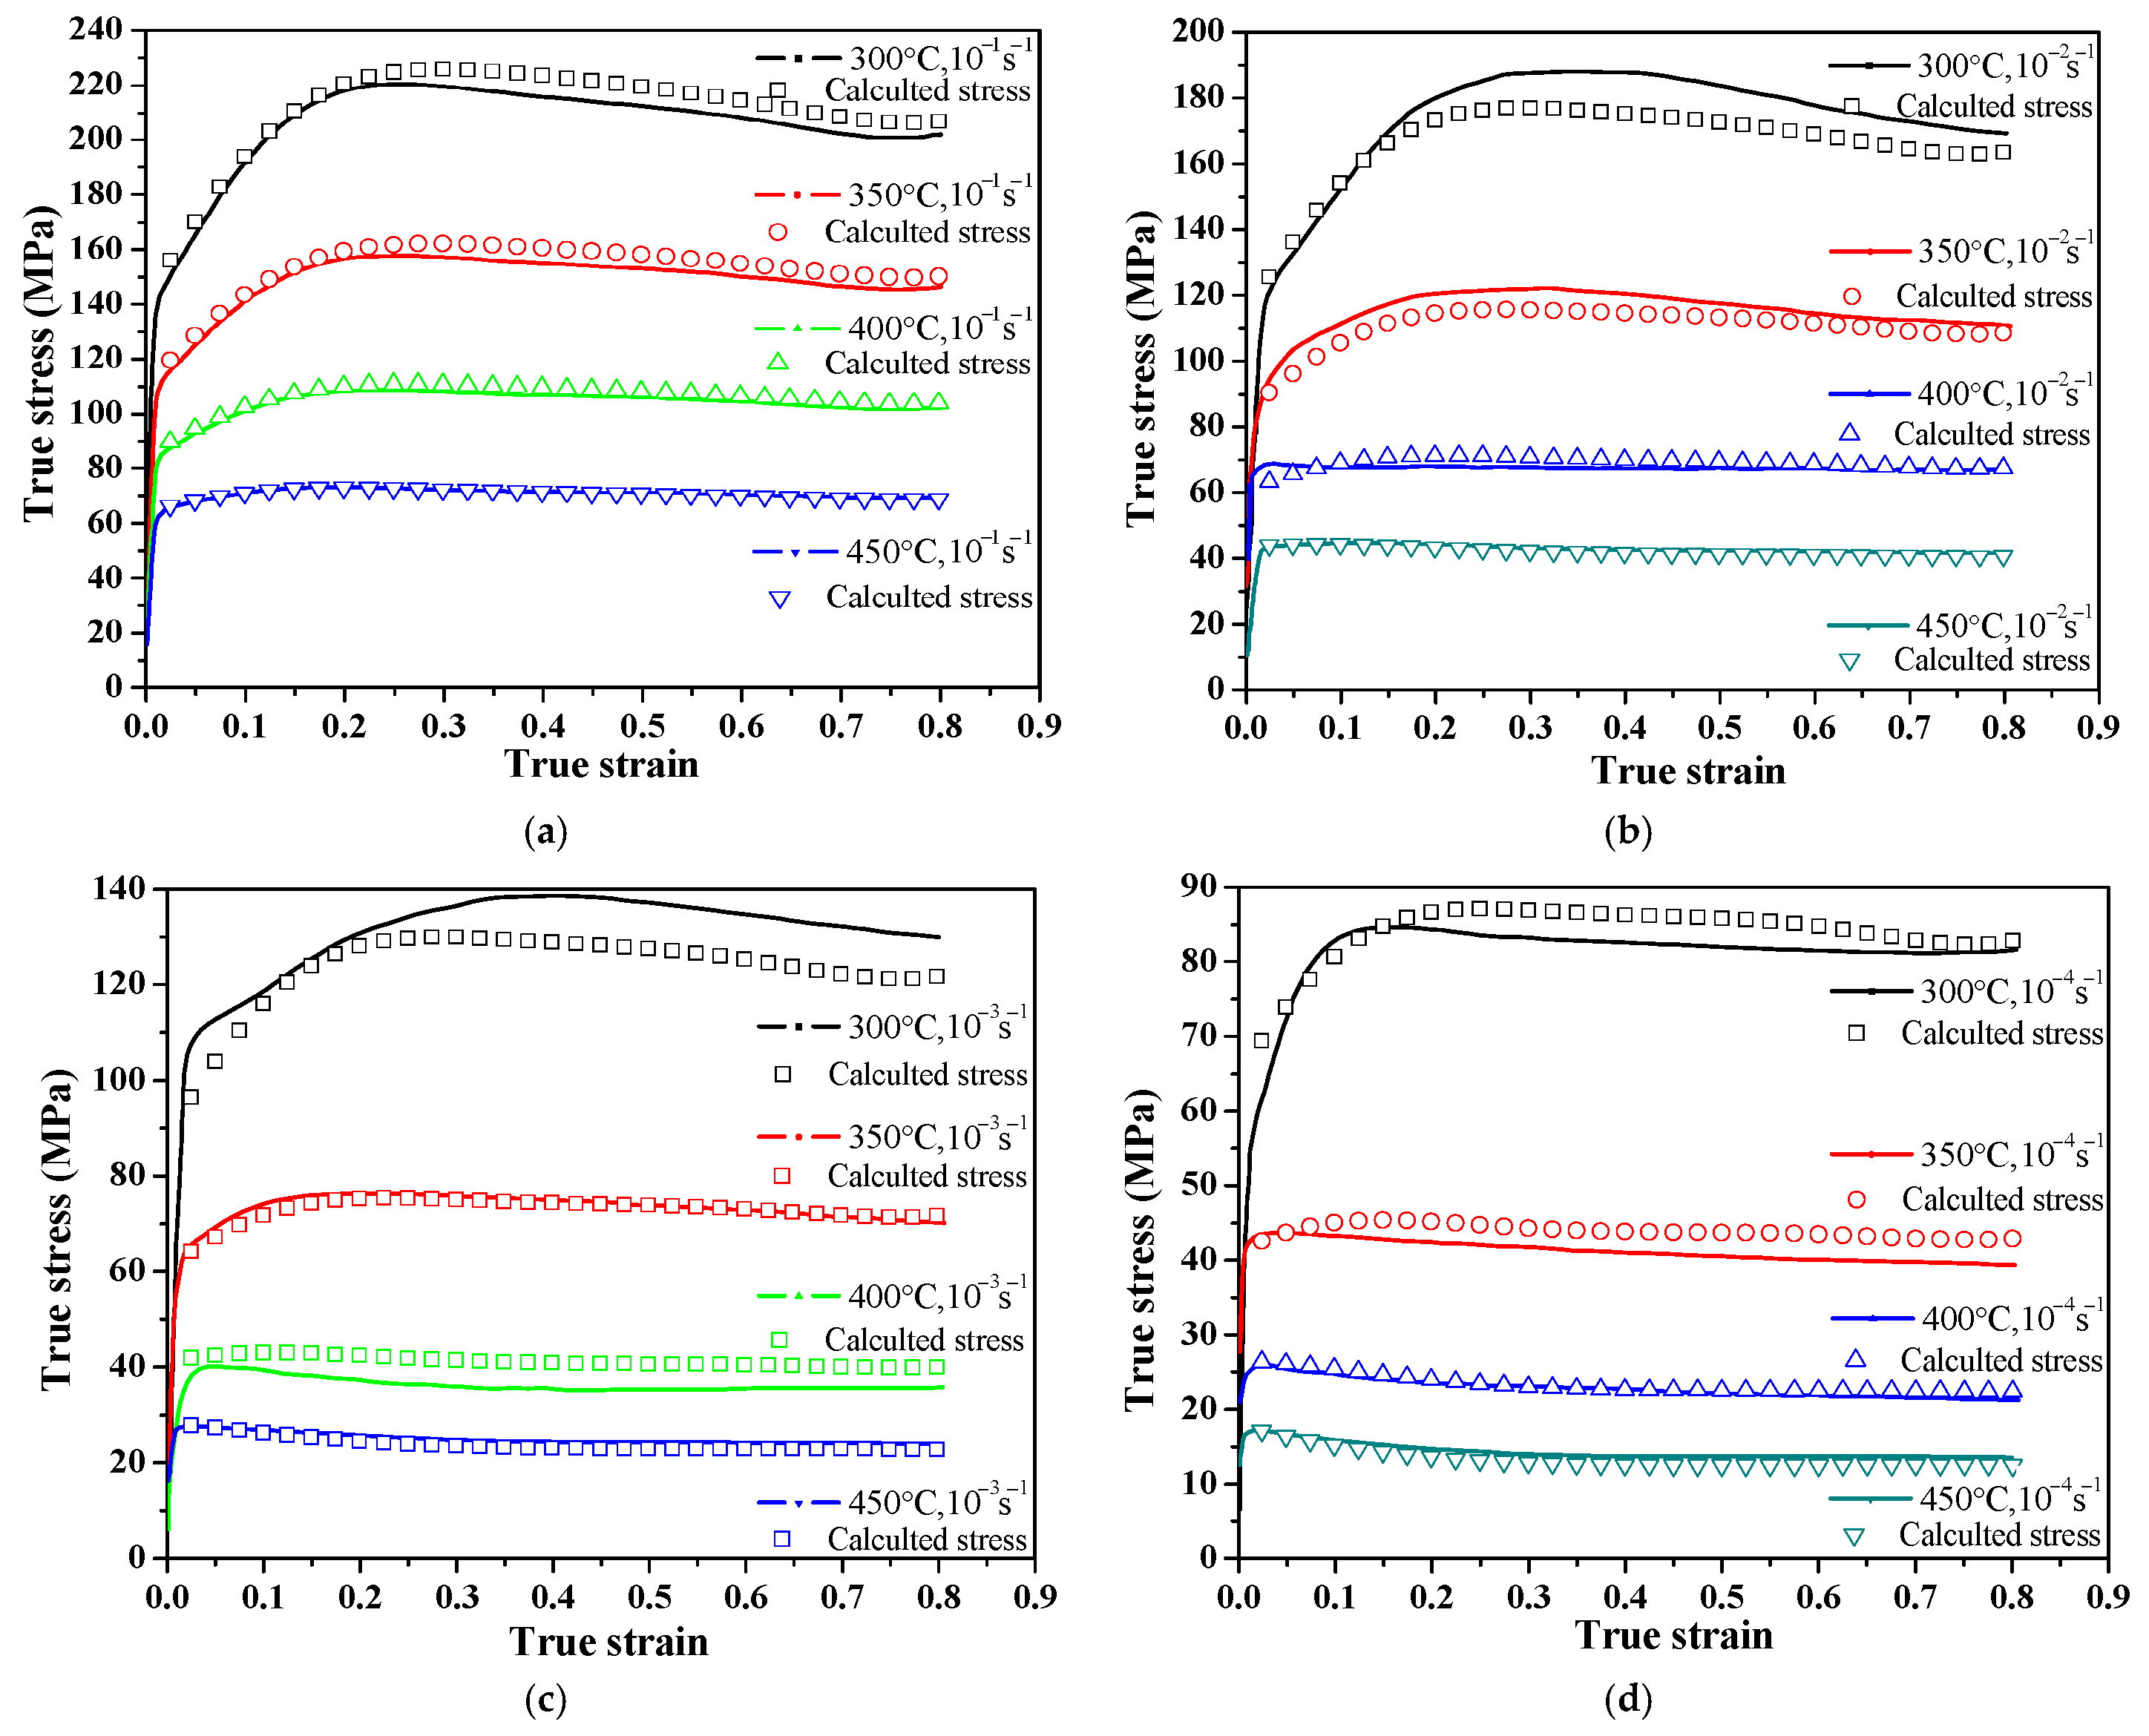
Figure 5 matches the experimental σ of the ZM6 alloy with the comparison of the data predicted by the developed constitutive model.
Figure 5.
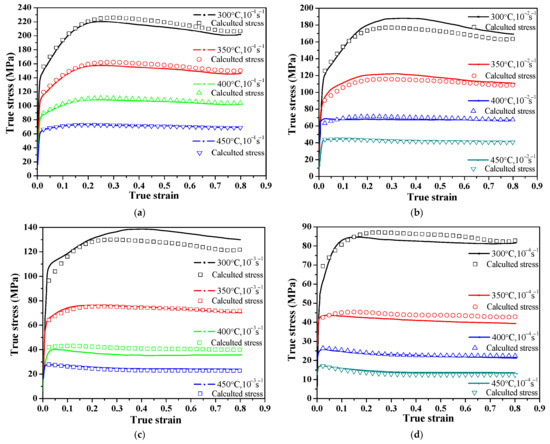
Flow stress from experiments and predictions at different ε· values of ZM6 alloy: (a) 0.1 s−1, (b) 0.01 s−1, (c) 0.001 s−1, and (d) 0.0001 s−1.
Figure 5 compares the experimentally measured flow stresses of the ZM6 alloy with those predicted by the developed constitutive model. For ε· from 0.0001 to 0.1 s−1, the flow stress from experiments and predictions matches well across the entire strain range. A slight discrepancy is observable at the highest strain rate (0.1 s−1) for true strains exceeding 0.4, which likely arises from adiabatic heating that is not captured by the isothermal model assumption. Such deviation is commonly observed in hot compression of magnesium alloys at high strain rates and is primarily attributed to adiabatic heating [11,13], which reduces the flow stress and is not accounted for in the isothermal model assumption. While adiabatic heating may also promote localized deformation bands in certain alloy systems, direct microstructural evidence (e.g., shear bands) is not examined in this study and remains a subject for future investigation.
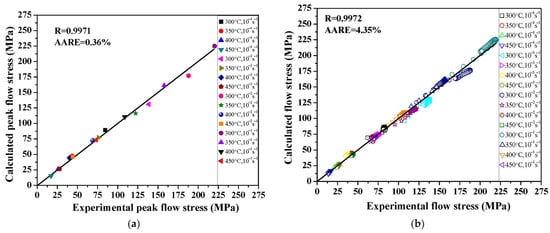
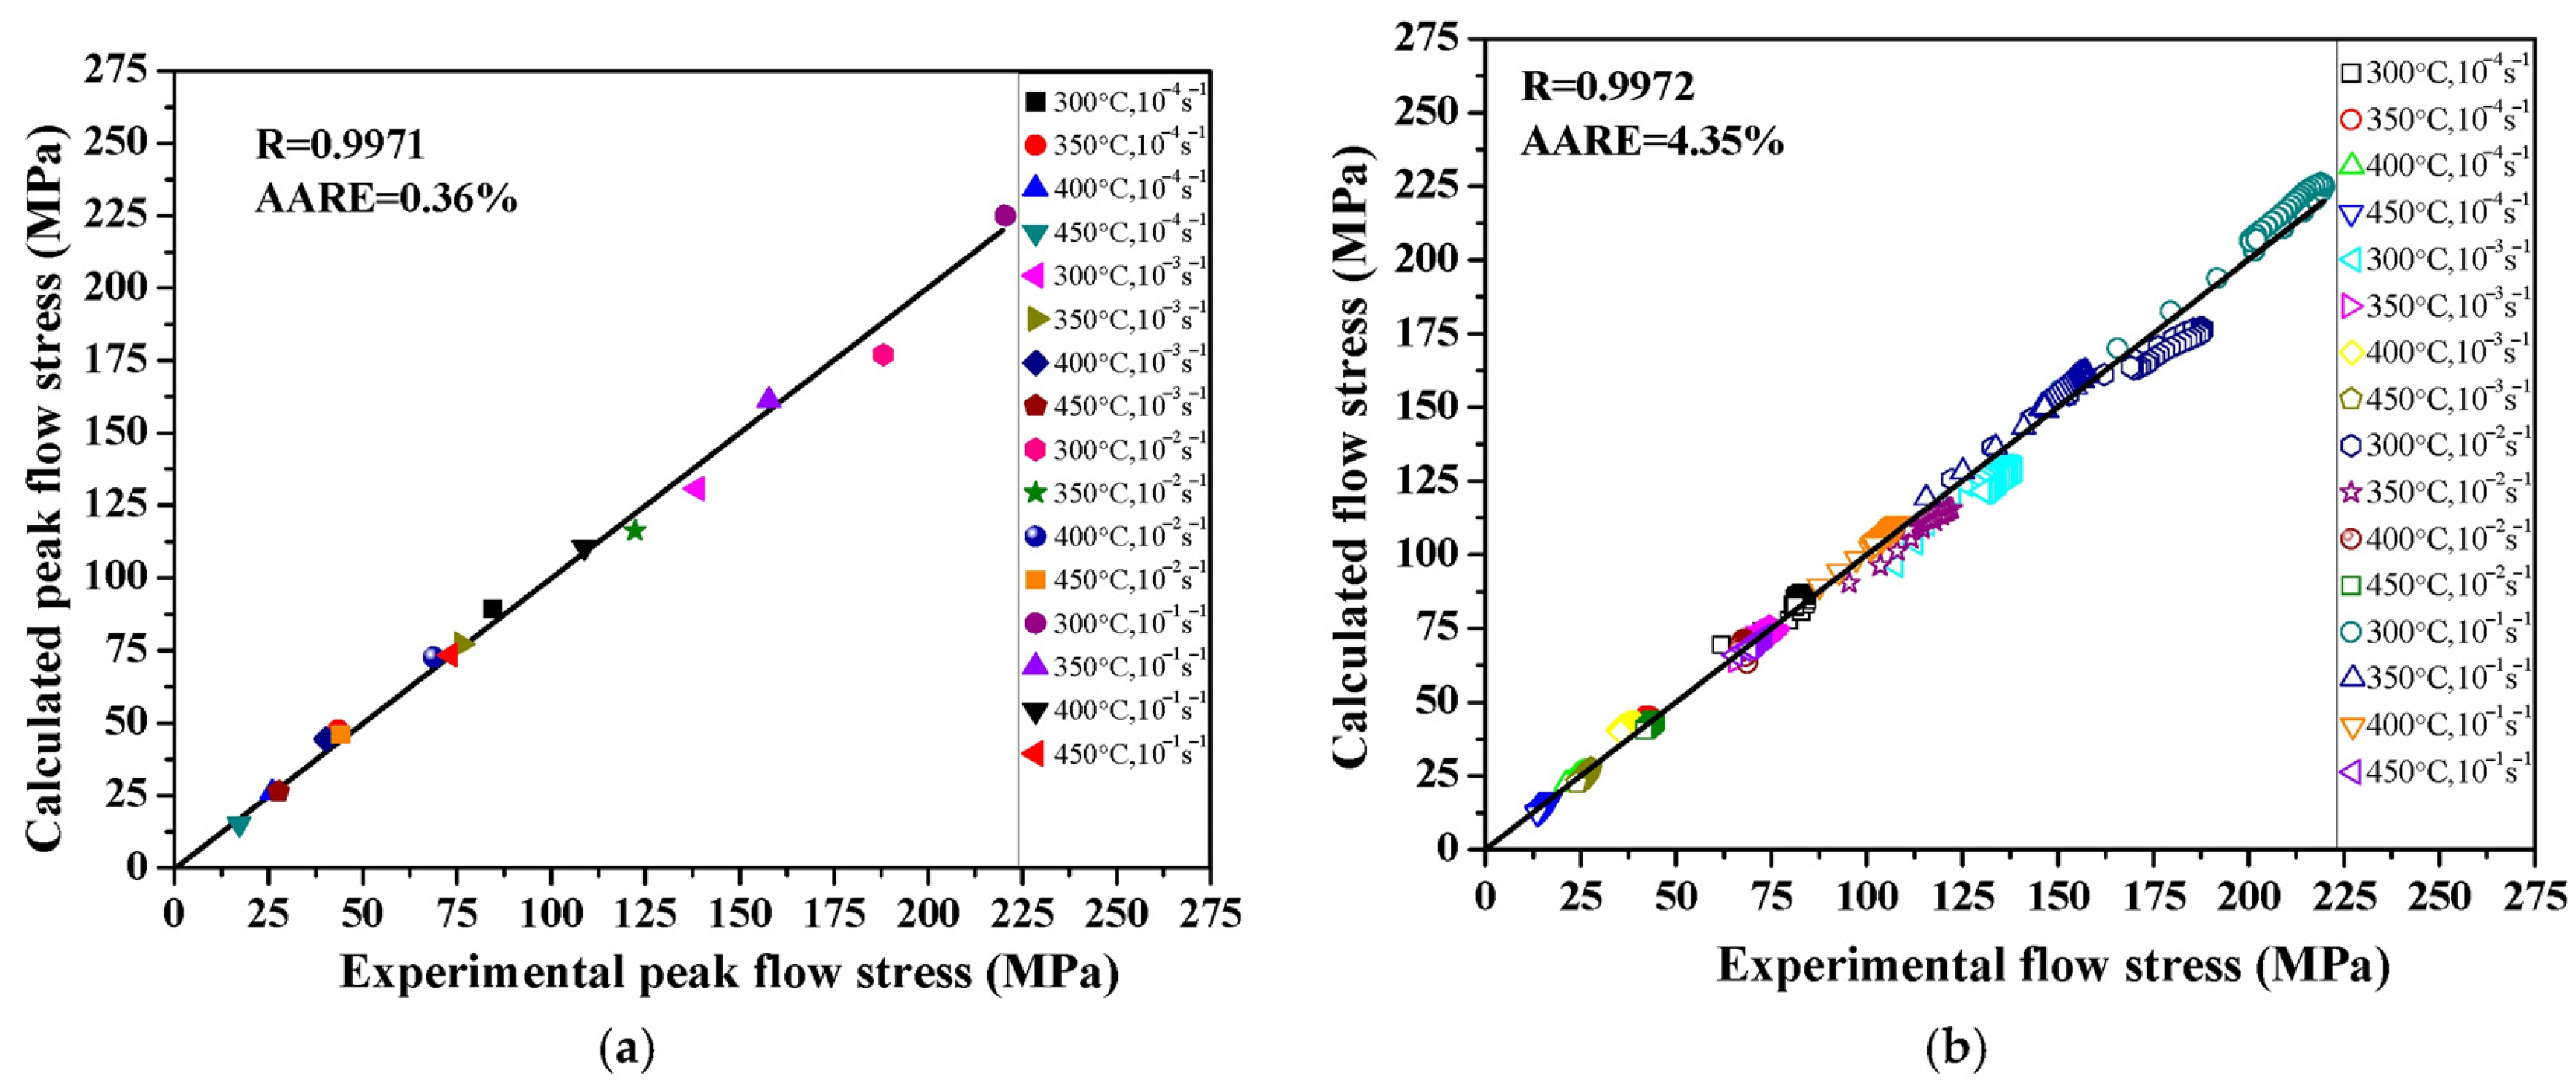
Figure 6 compares the experimental flow stress data of the ZM6 alloy with the values predicted. Across most deformation conditions, the two datasets correlate well. Specifically, the degree of departure of the measured flow stresses from the predicted ones becomes more pronounced at lower T and higher ε· values, where the stress level itself is higher. The model captures the overall deformation behavior well, though some scatter exists in certain portions of the curves. The difference between prediction and experiment of peak flow stresses has a correlation coefficient (R) of 0.997 and an AARE below 0.36%. Meanwhile, the predicted flow stresses match experimental results with an R of 0.997 and an AARE below 4.35%. A systematic deviation emerges at 0.1 s−1 for true strains exceeding 0.4, likely due to adiabatic heating which the isothermal model assumption does not account for. The prediction residuals exhibit a systematic dependence on the Zener–Hollomon parameter, with overestimation occurring at high Z (low T, high ε·) values and underestimation at low Z values, suggesting that the current model does not fully capture the transition between work-hardening-dominated and dynamic-softening-dominated regimes. To quantitatively assess the impact of adiabatic heating at an ε· of 0.1 s−1, a simple temperature-rise correction was estimated, revealing that a local temperature increase of approximately 15–25 °C can occur at true strains beyond εc, which partially explains the progressive deviation between the experimental and predicted flow stresses.
Figure 6.
The Q and lnA at a strain of 0.3 of the ZM6 alloy: (a) ln[sinh(ασ)] versus 1/T; (b) ln[sinh(ασ)] versus ln(ε·).
To rigorously evaluate the model beyond simple correlation, several additional analyses were performed:
(1) Leave-one-temperature-out cross-validation: The model was trained using data from three temperatures (e.g., 300, 350, and 400 °C) and used to predict the flow stress for the omitted temperature (450 °C). This was repeated for each temperature. The resulting average AARE increased from 4.35% (self-prediction) to a range of 7.2% to 9.8% (cross-validation), indicating the model’s reasonable interpolation capacity but also its sensitivity to extrapolation.
(2) Robustness analysis: Random Gaussian noise (±5% of measured stress) was added to 20% of the training data, and the polynomial coefficients were re-fitted. The model predictions remained stable, with a standard deviation of AARE below 1.2%, demonstrating acceptable robustness against small experimental errors.
(3) Residual analysis: Prediction residuals (experimentally predicted) were analyzed against strain, temperature, and strain rate. The residuals show a systematic bias at low temperatures (300–350 °C) and high strain rates (0.01–0.1 s−1), confirming that the model’s accuracy is not uniform across the entire domain.
(4) Uncertainty quantification: Bootstrapping (1000 resamples) was used to estimate 95% confidence intervals for the predicted flow stress under selected conditions (e.g., 350 °C, 0.001 s−1). The confidence bands reveal that model uncertainty is highest at low strains (ε < 0.1) and high strains (ε > 0.7).
(5) Model comparison: The strain-compensated model was compared with a simpler non-strain-compensated Arrhenius model using the Akaike Information Criterion (AIC). The strain-compensated model yielded a much lower AIC (ΔAIC = 156), confirming that the added complexity (fifth-order polynomial) is statistically justified.
(6) Theil’s inequality coefficient (TIC) analysis: The overall TIC was calculated as 0.042, indicating good global agreement between predictions and experiments. Further decomposition of TIC yielded a bias proportion (UM) of 0.07 and a variance proportion (US) of 0.38, revealing that systematic errors are small but non-negligible, with variance differences contributing more significantly to the overall prediction error than mean bias.
Although the high correlation coefficient (R > 0.99) may suggest good model performance, the above residual analysis, TIC decomposition, and bootstrapped confidence intervals reveal systematic biases at low temperatures and high strain rates. Therefore, the model should be used as an interpolation tool with stated uncertainties. In the present study, the primary goal is to establish an empirical predictive tool for flow stress within the tested range, and the model’s limitations for extrapolation or for capturing fine microstructural variations are recognized. Further application of RRMSE on independent datasets is recommended for future work to complement the TIC analysis.
3.3. Hot Compression Behavior and Characteristics
3.3.1. Work-Hardening Rate (θ)–Strain (ε) Curves
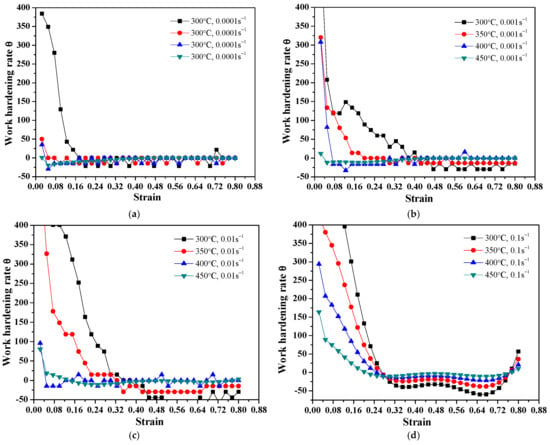
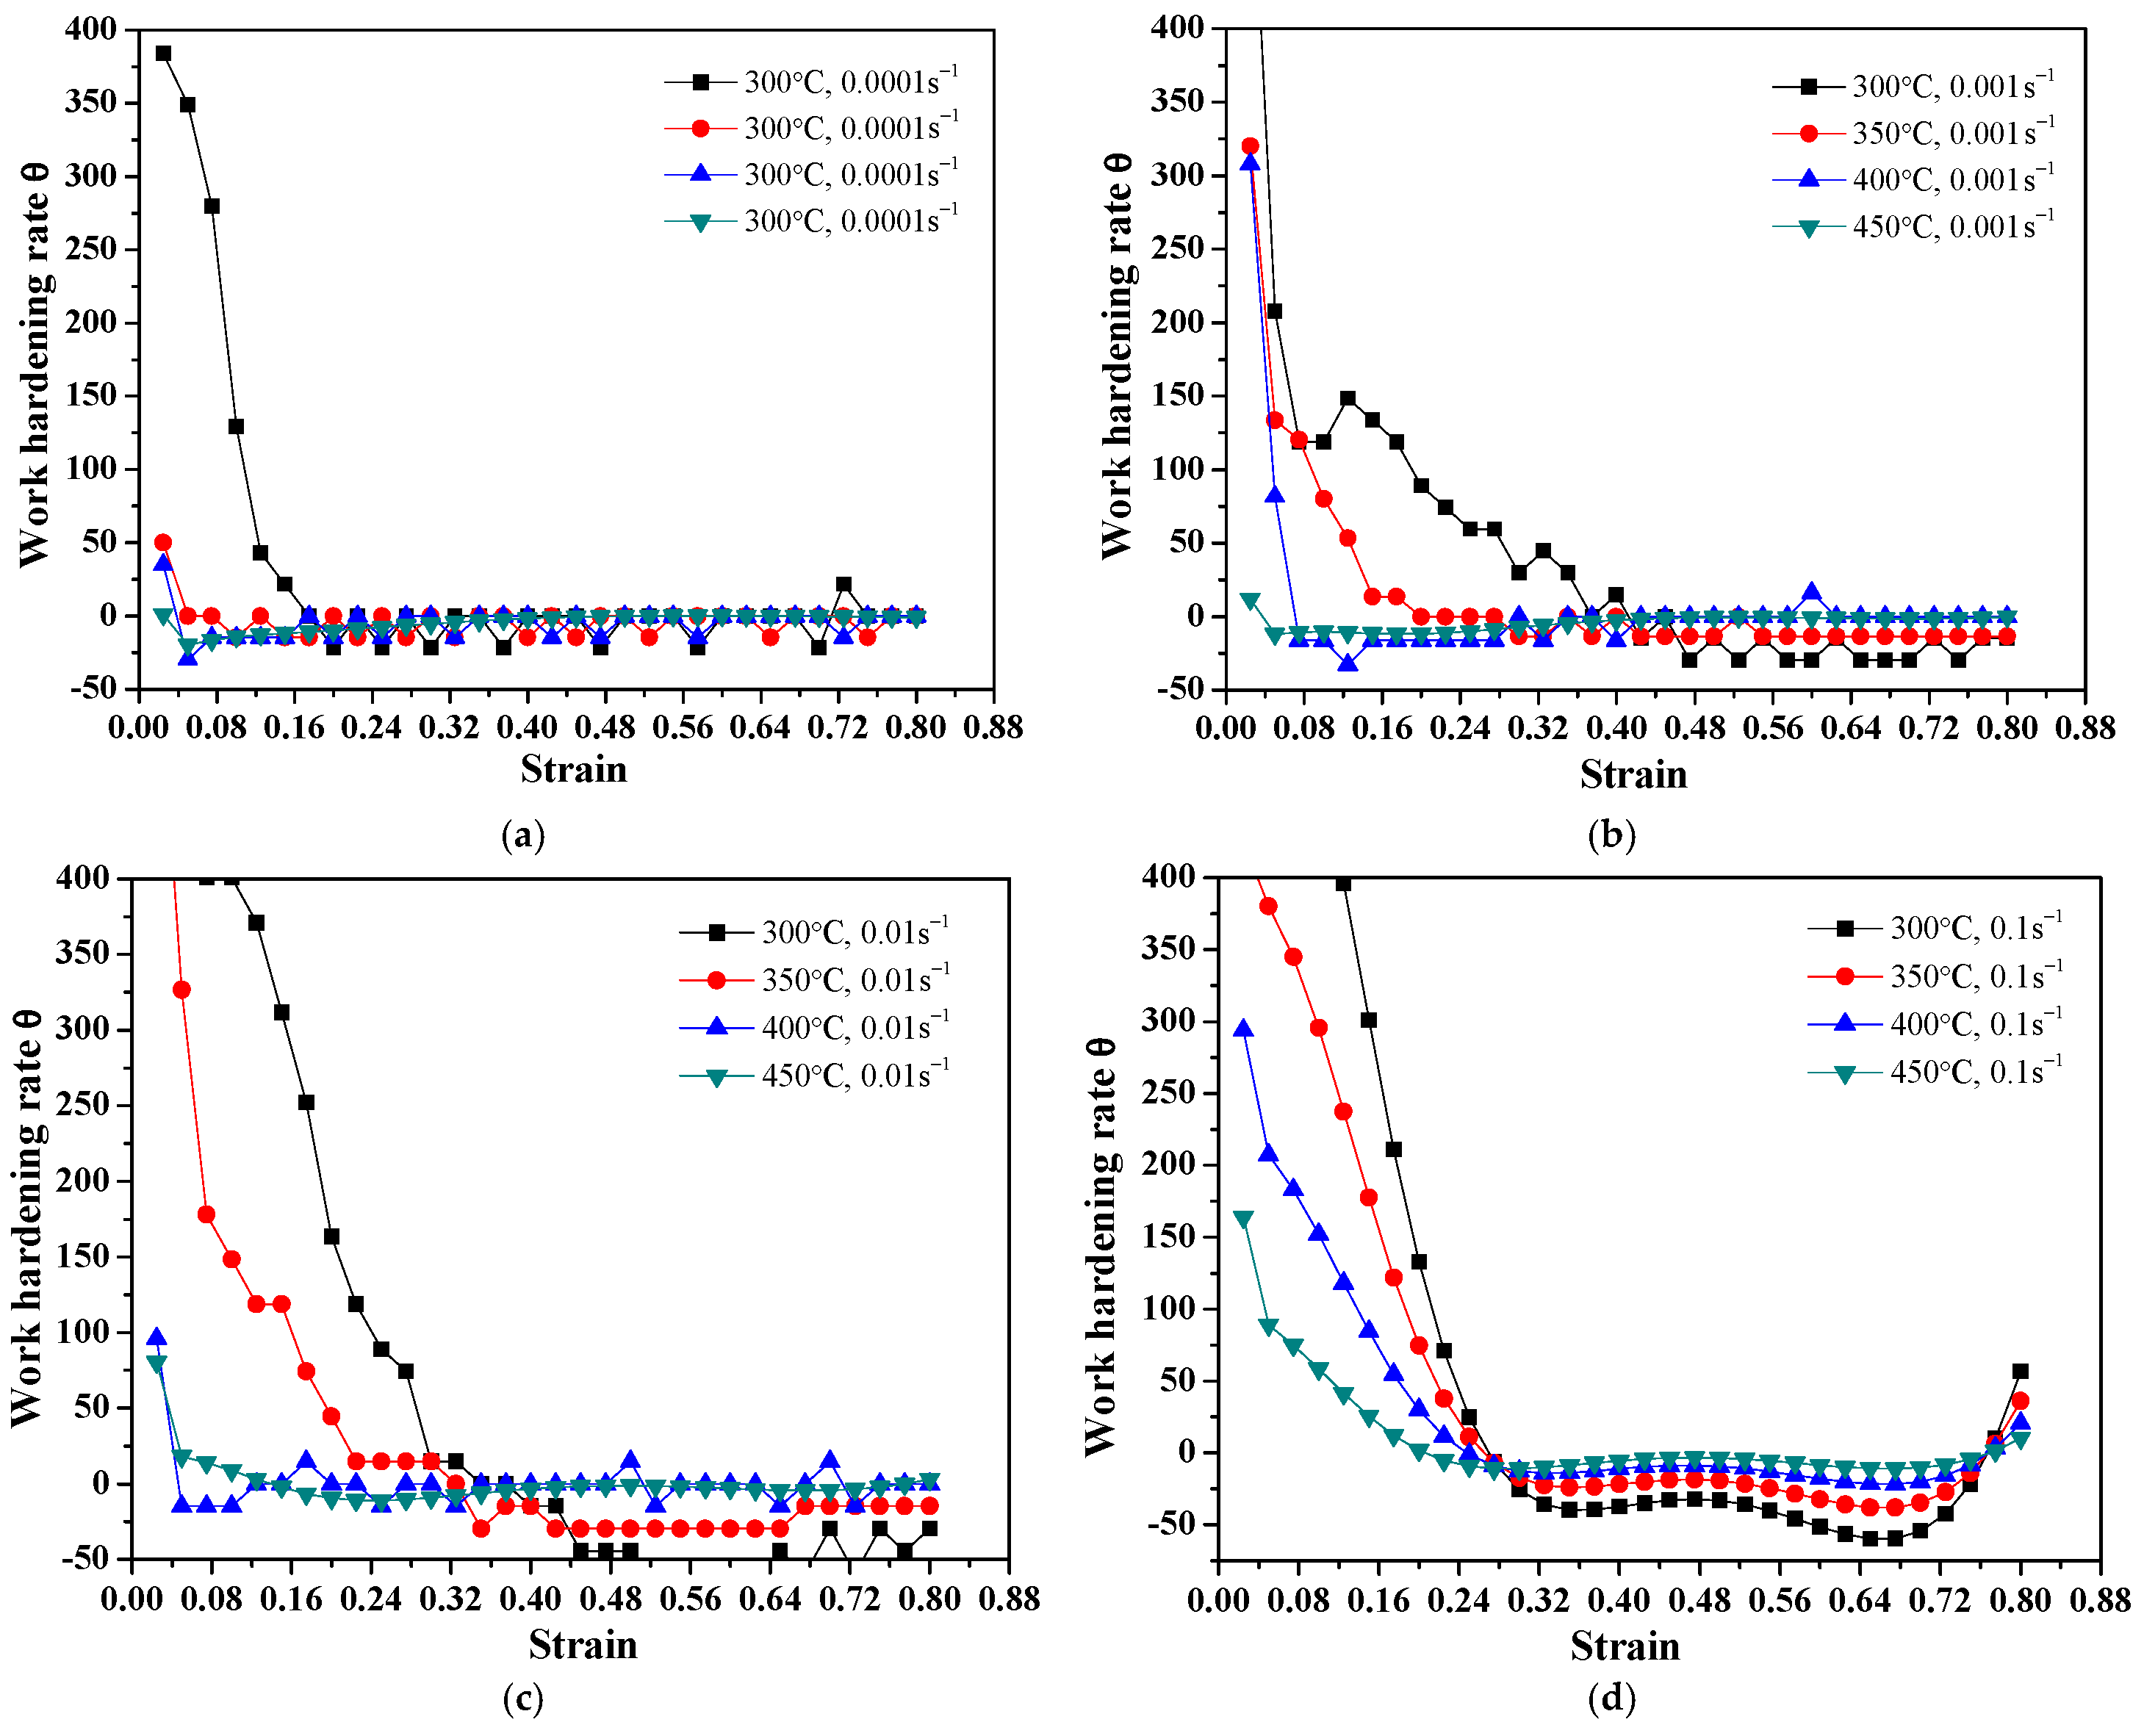
For the ZM6 alloy, dynamic recrystallization (DRX) is typically described using three characteristic strain parameters: the critical strain for DRX initiation (εc), the peak strain (εp), and the steady-state strain (εs). Among these, the critical strain, εc, was determined from the θ curve plotted against the true strain (ε). This θ-ε curve was derived by numerically differentiating the true stress–strain data, specifically by taking the first-order derivative () to obtain an approximation of the work-hardening response. Once the θ-ε relationship was established for each tested strain rate, the evolution of the work-hardening rate with strain could be clearly visualized and analyzed, allowing εc, εp, and εs to be identified for the ZM6 alloy.
The point at which the θ value first returns to zero defines the steady-state strain, denoted as εs. Once εs is identified, two key characteristic strains, εp and εs, can be determined under different conditions. The relation between εp and εs then allows the εc for the onset of DRX to be derived. From Figure 7, as T increases and ε· decreases, the θ value decreases more rapidly, indicating an enhanced potential for the DRX softening effect. By plotting such curves in Figure 7, the suitable ranges of temperature and strain rate that avoid instability and may promote DRX can be clearly identified. The values of εp and εs were ultimately determined from the points at which θ = 0. From the view of the interpretation of underlying physical mechanisms, increasing temperature activates non-basal slip systems, thereby significantly softening the material. Increasing strain rate shortens the deformation time, inhibits DRV and recrystallization, and leads to work hardening becoming dominant, which results in an increase in flow stress. At 450 °C, sliding or diffusion creep may occur, enabling the material to maintain a relatively high stress response even at high strain rates. It should be emphasized that these interpretations are based on flow curve characteristics and are supported by optical microscopy observations (Section 3.3.3); however, direct microstructural evidence at the grain/subgrain scale (e.g., EBSD) is not presented in this work and remains a matter for future investigation. While the flow curve inflections are consistent with DRX-dominated softening reported for similar Mg-RE alloys [19,20,21,22], the assignment of specific mechanisms remains a plausible hypothesis requiring direct validation.
Figure 7.
The θ-ε curves of the ZM6 alloy under various strain rates: (a) 0.0001 s−1; (b) 0.001 s−1; (c) 0.01 s−1; (d) 0.1 s−1.
3.3.2. Hot Processing Map and Characteristics
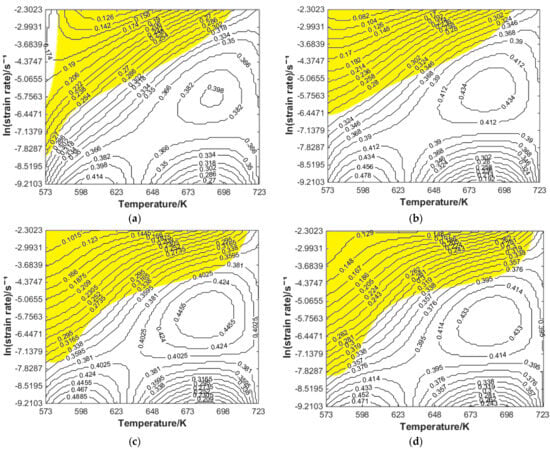
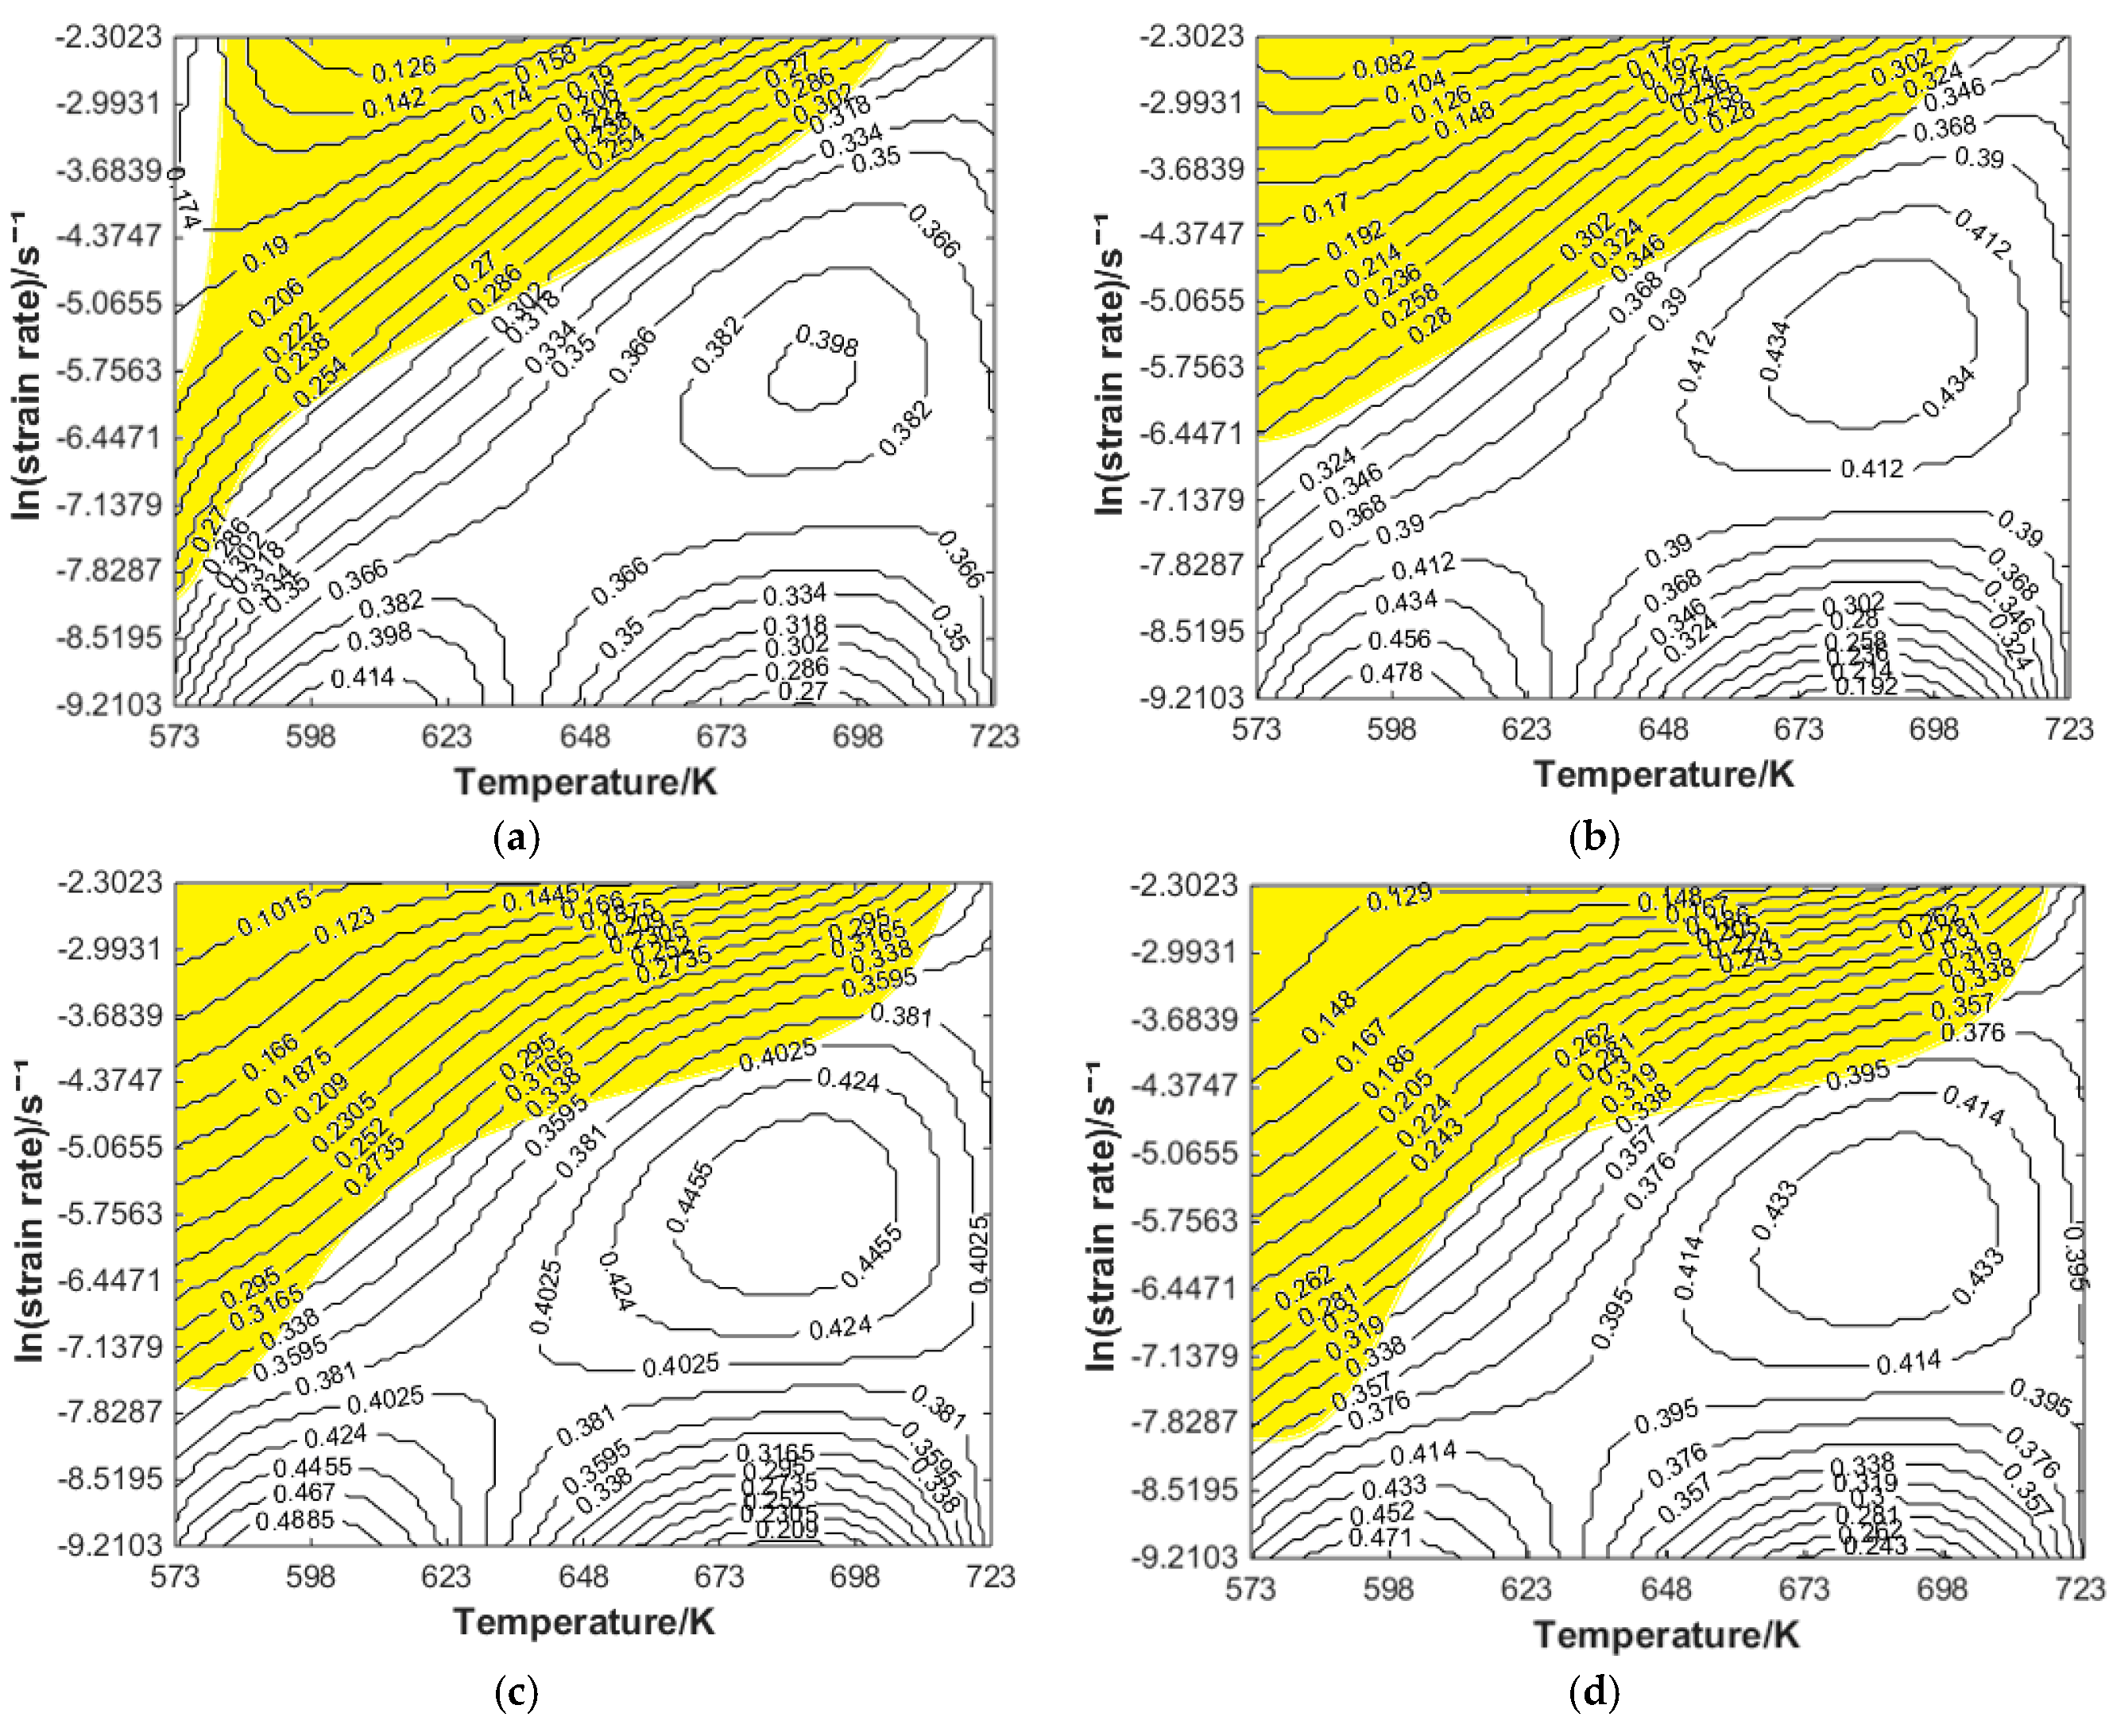
To quantitatively describe the combined effects of temperature and strain rate, a processing map has been further established based on the dynamic materials model (DMM), showing that flow instability likely occurs when ε· exceeds 0.01 s−1. Figure 8 gives the hot processing maps of the ZM6 alloy at various strains.
Figure 8.
Hot processing maps of ZM6 alloy under a certain strain: (a) ε = 0.1; (b) ε = 0.3; (c) ε = 0.5; (d) ε = 0.7. (Note: the yellow shade indicates the instability region)
Figure 8 provides a clear visualization of the deformation safety and risk distribution for the ZM6 alloy during hot working. In these processing maps, the regions shown in color correspond to rheological instability, where localized flow or cracking tends to occur preferentially. In contrast, the white zones indicate conditions favorable for safe hot deformation, free from microstructural defects. From the ZM6 alloy stress–strain data, the processing map distinguishes different microstructural mechanisms: areas suggestive of DRX, those governed by DRV, and the overall safe processing window [20,22]. For the ZM6 alloy, these three zones represent the most favorable microstructural regions for achieving stable deformation. This stable behavior suggests that under such conditions, energy dissipation reaches a plateau, implying a steady-state microstructural response and a reduced risk of flow instability.
It must be emphasized that although the processing maps are derived from the dynamic materials model (DMM) criterion, they have been partially validated by post-deformation optical microscopy in Section 3.3.3. However, validation using higher-resolution techniques such as EBSD has not been performed in this work. A high correlation coefficient alone does not guarantee model fidelity. The identification of “safe” and “instability” regions remains model-based. Future work should correlate these predictions with actual microstructural features such as cracking, shear bands, and recrystallized grains. As a preliminary indirect consistency check, compared with AZ-series alloys, the predicted instability region at low temperatures and high strain rates (300–350 °C, >0.01 s−1) is consistent with reports for AZ31 [19] and AZ61 [20], suggesting a common instability mechanism related to limited DRX and adiabatic shear band formation. However, the ZM6 alloy exhibits a wider safe window at high temperatures (400–450 °C) compared to AZ91 [21], likely due to the RE element stabilization effect.
Preliminary analysis of the present data indicates the following: The combination of low temperature and high strain rate (300 °C/0.1 s−1) yields the highest flow stress (220.477 MPa), which is unfavorable for hot working. The combination of 450 °C/0.0001 s−1 yields the lowest flow stress (17.222 MPa), which is suitable for forming with low resistance. Once the energy dissipation efficiency (η) exceeds 30%, the η curve undergoes a distinct change. This inflection point serves as a key indicator of enhanced power dissipation through microstructural reorganization. During the hot compression deformation of the ZM6 alloy within the ranges of 300–450 °C and the 0.0001–0.1 s−1, the maximum flow stress decreases significantly with increasing temperature, while it increases notably with increasing strain rate.
3.3.3. Microstructure Evolution Under Various Conditions at a Certain True Strain
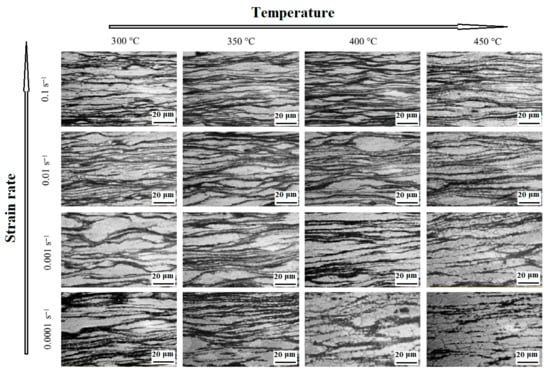
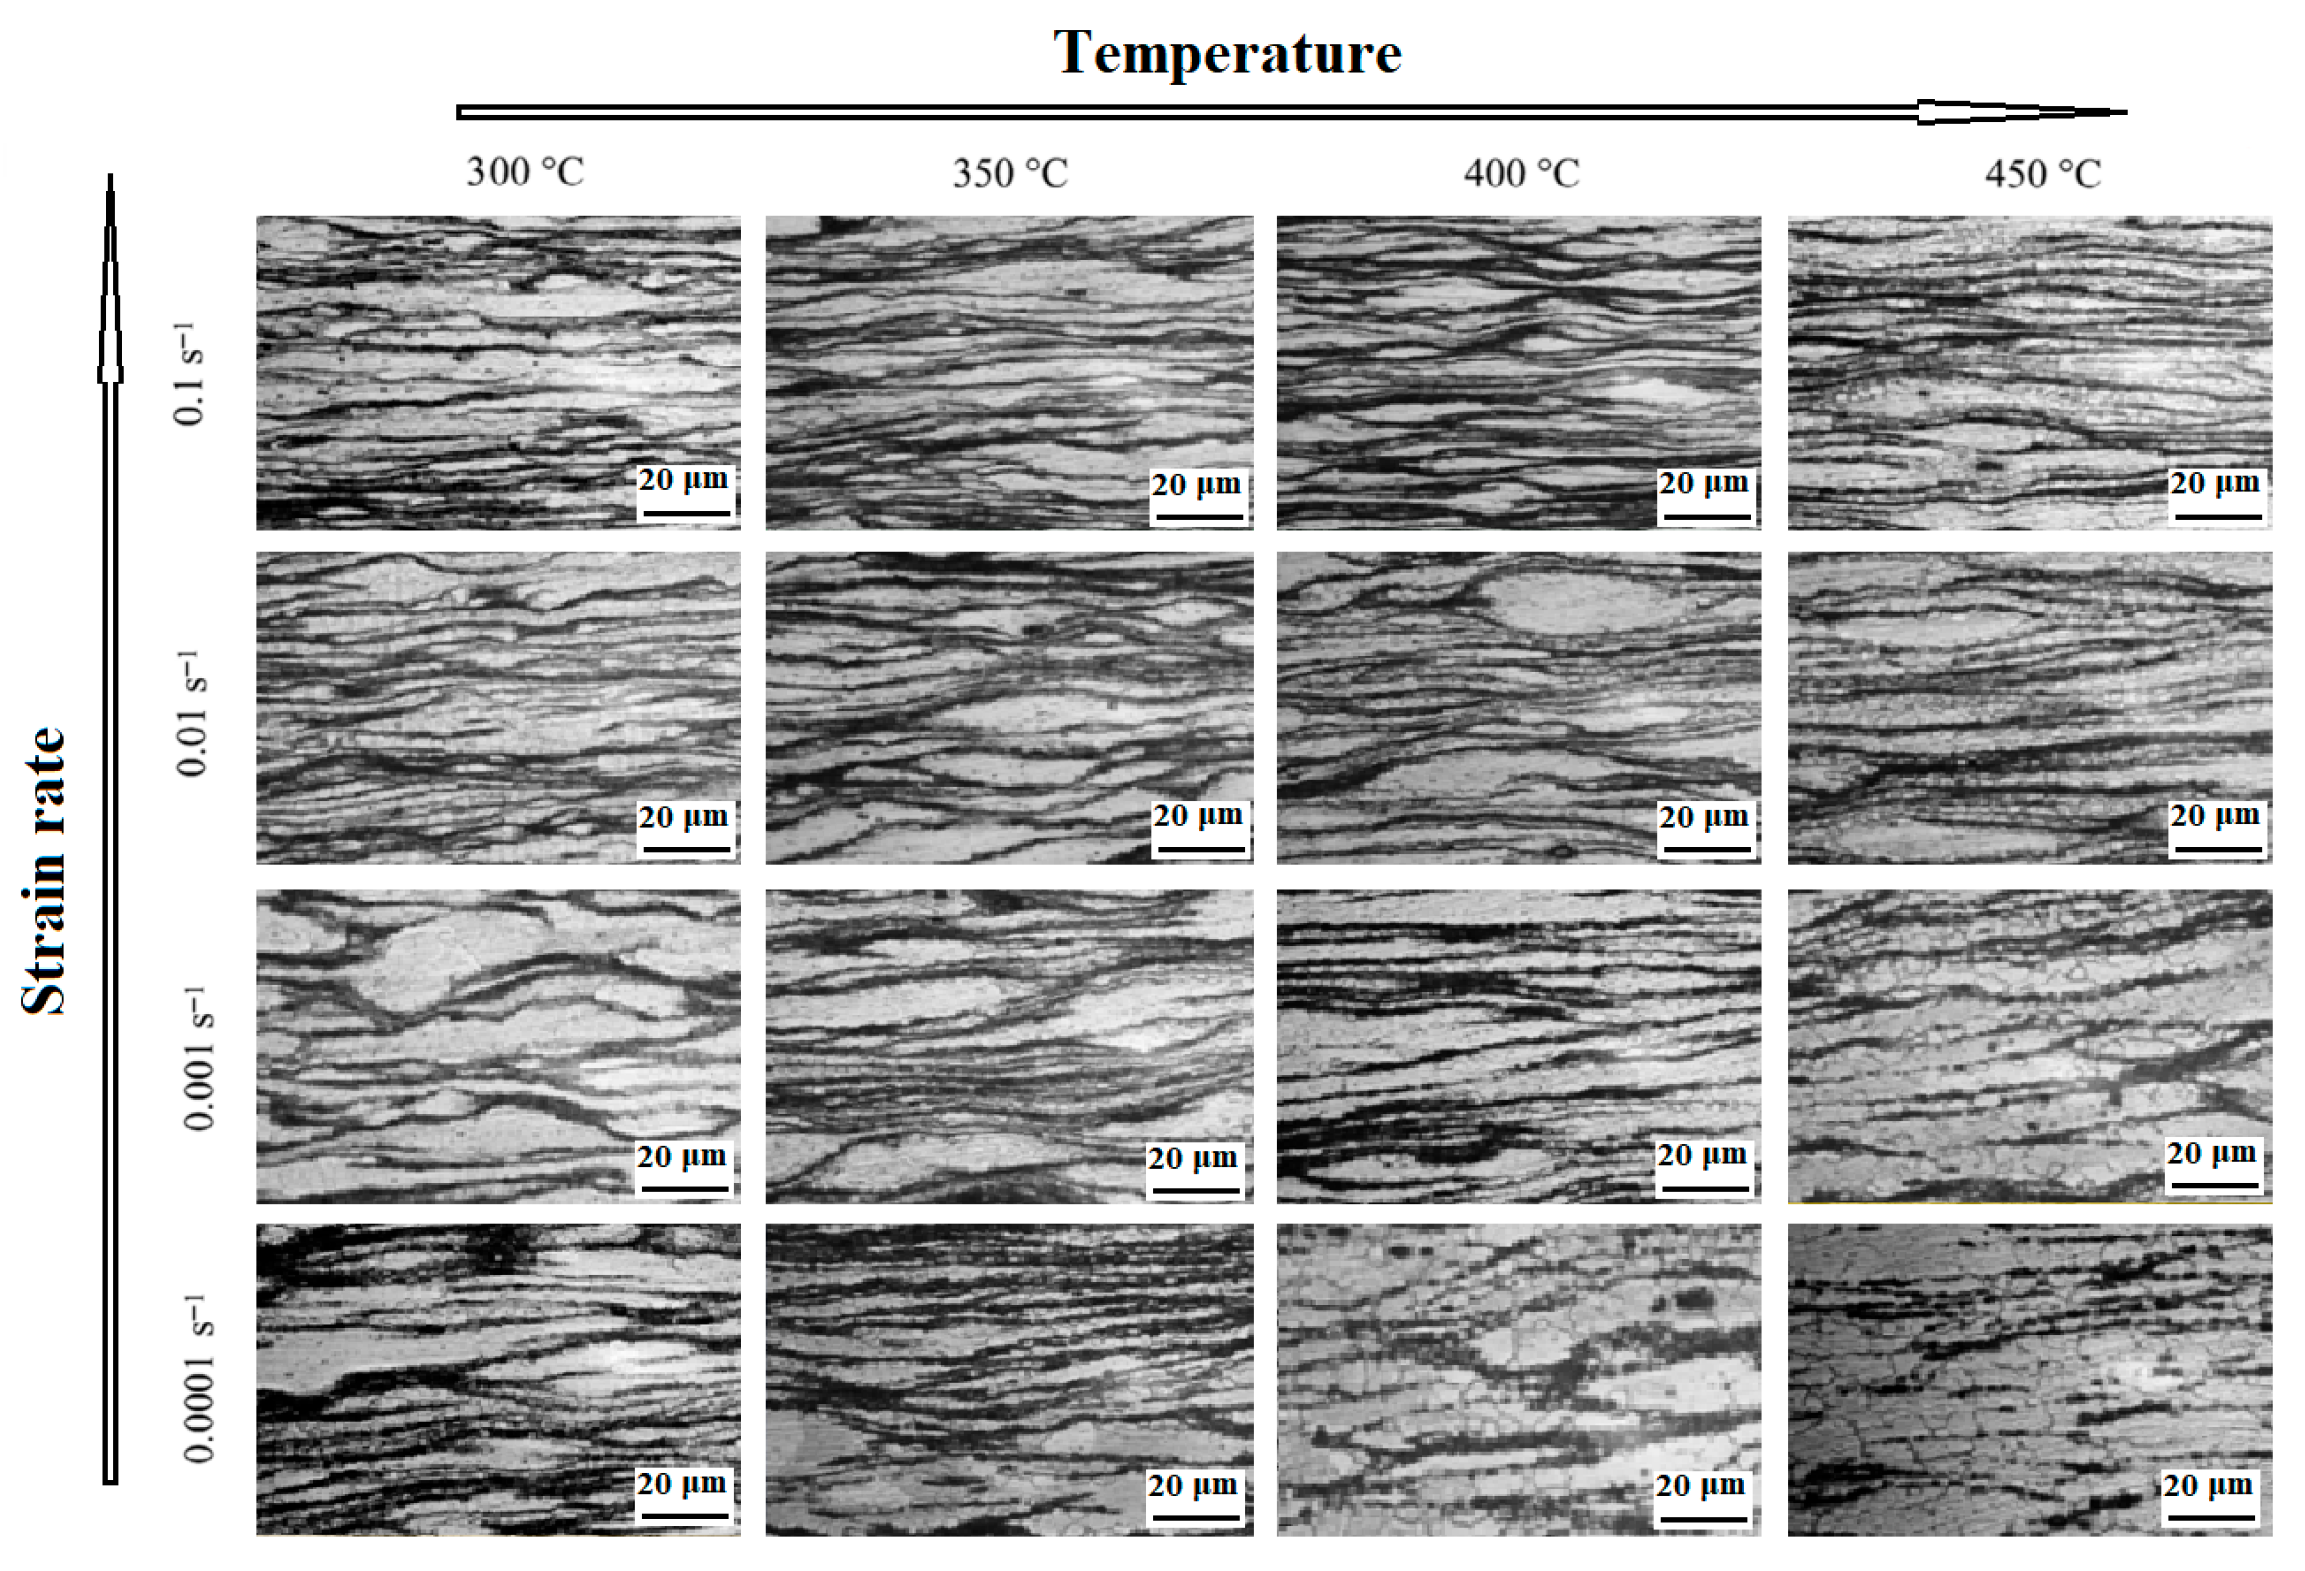
Figure 9 presents the optical microstructures of the experimental alloy deformed to a true strain of 0.8 under various deformation parameters.
Figure 9.
The OM of the ZM6 alloy at the strain of 0.8 with the strain rate of 0.0001–0.1 s−1 from 350 to 450 °C.
As shown in Figure 9, the optical microstructures of the ZM6 alloy deformed to a strain of 0.8 at strain rates of 0.0001–0.1 s−1 and temperatures ranging from 350 to 450 °C exhibit a strong dependence on temperature and strain rate. At 350 °C and a high strain rate (e.g., 0.1 s−1), the microstructure consists predominantly of coarse elongated grains aligned with the deformation direction, with few dynamically recrystallized grains, indicating dominance of work hardening consistent with the instability regime [23]. When the temperature is raised to 400–450 °C and the strain rate is lowered to 0.001 s−1, the structure transforms into uniform fine equiaxed recrystallized grains with abundant second-phase particles decorating the grain boundaries, signifying fully developed dynamic recrystallization [24]. Under intermediate conditions (e.g., 400 °C, 0.01 s−1), a bimodal grain distribution can be observed, comprising fine recrystallized grains together with a few elongated coarse grains, suggesting incomplete recrystallization. In summary, Figure 9 confirms that a uniform refined recrystallized microstructure of the ZM6 alloy can be achieved at high temperatures (≥400 °C) and low strain rates (≤0.001 s−1), whereas the low-temperature/high-strain rate region tends to induce flow instability and coarse grains, which is in good agreement with the safe windows predicted by the processing maps.
3.3.4. Comparison of Hot Working Windows: ZM6 Versus AZ-Series and Mg-RE Alloys
Table 3 compares the safe hot working windows and softening mechanisms of as-cast ZM6 with typical AZ-series and Mg-RE alloys.
Table 3.
Comparison of safe hot working windows and dominant softening mechanisms between as-cast ZM6 alloy and typical AZ-series/Mg-RE alloys.
As shown in Table 3, AZ31 (325–400 °C) [23], AZ61 (300–450 °C) [25], and AZ91 (275–325 °C) [26] shift to lower temperatures, whereas Mg-Gd-Y-Zr (430–450 °C) [24] and Mg-4.83Gd-2.36Nd-0.21Zr (425–450 °C) [27] show much higher temperatures. ZM6 (375–450 °C) has a lower bound above AZ alloys but slightly below the two Mg-RE alloys, and an upper bound comparable to them. This indicates that RE addition raises the flow instability onset temperature through increased recrystallisation activation energy, solute drag and second-phase pinning. AZ31 is broad (0.3–1.0 s−1) [23]; AZ61 and AZ91 are narrow low-rate windows (0.001–0.01 s−1) [25,26]. ZM6 (0.0001–0.01 s−1) partially overlaps with Mg-Gd-Y-Zr (0.006–0.03 s−1) [24], but its upper bound is significantly lower than that of AZ31 [23] and the Gd-Nd-Zr alloy (0.01–0.1 s−1) [27]. This likely reflects slower DRX kinetics in ZM6 due to the combined addition of Nd, Zn and Zr, limiting DRX at rates above approximately 0.025 s−1 and promoting instability.
Overall, ZM6 is a DRX domain, consistent with fine recrystallized grains along boundaries (Figure 9). Unlike AZ alloys where DRX initiates at lower temperatures [23,25,26], ZM6 enters stable DRX only at ≥375 °C. The safe deformation zone is now uniformly defined as 375–450 °C/0.0001–0.01 s−1, with the optimal region at 400–450 °C/10−4–10−3 s−1. The safe window of as-cast ZM6 lies between those of AZ and high-RE Mg alloys: it has a broader temperature range than AZ but one slightly narrower than those of some Mg-RE alloys and a strain rate window comparable to that of AZ61/91 but extending to a one order of magnitude lower strain rate. The combined Nd-Zn-Zr addition enhances thermal stability but tightens the processing window, demanding precise control of hot working parameters.
4. Conclusions
Through hot compression experiments, the constitutive behavior and hot workability of ZM6 alloys were studied. True σ-ε curves for the ZM6 alloy were obtained using a Gleeble-1500 tester under 300–450 °C at 0.0001–0.1 s−1. The results are as follows:
(1) For the ZM6 alloy, at 300–400 °C and 10−4 s−1 the flow curve characteristics are consistent with DRX-dominated softening, where softening surpasses hardening. Conversely, under a higher ε· of 10−1 s−1, the evident work hardening is induced, with stress rising to a peak before stabilizing. The maximum flow stress values range from 17.2 MPa (450 °C, 10−4 s−1) to 220.5 MPa (300 °C, 10−1 s−1). The softening effect of temperature on σ is relatively weakened at higher ε· values, whereas ε· sensitivity is significantly enhanced at 450 °C.
(2) To improve prediction accuracy, a constitutive model with strain compensation was built. For the ZM6 alloy, the constants (α, n, Q, and lnA) enable reasonably accurate stress prediction over a strain range of 0.025–0.80. Within the training dataset, comparison with experimental data shows a strong correlation (R > 0.997, AARE < 4.35%). Leave-one-temperature-out cross-validation yielded AARE values of 7.2–9.8%, demonstrating interpolation capability. Residual analysis and bootstrapped confidence intervals revealed systematic biases at low temperatures and high strain rates, underscoring that the model is an empirical interpolation tool. The Theil inequality coefficient (TIC = 0.042) and its decomposition (UM = 0.07, US = 0.38) further confirm that global agreement is good but that systematic bias (mainly from variance differences) exists. The calculated activation energy, Q, is 182 kJ/mol, which falls within the typical range reported for Mg-RE alloys and suggests solute drag and precipitation hardening effects.
(3) Hot processing maps showed safe deformation zones (white regions) and instability zones (colored regions) in the ZM6 alloy. Areas suggestive of dynamic recrystallization (DRX) appear in high-energy dissipation (η > 30%) regions, which may be ideal for microstructure refinement. In the analysis, εc correlated with peak (εp) and steady-state (εs) strains, such that recommended processing parameters include regimes of 400–450 °C at 10−4 s−1, balancing efficiency and microstructural stability.
(4) Microstructure evolution observed by optical microscopy (Figure 9) directly supports the processing map predictions. At 350 °C/0.1 s−1, the microstructure consists of coarse elongated grains with few recrystallized grains, indicating work-hardening dominance and flow instability. At 400–450 °C/0.001 s−1, fully recrystallized fine equiaxed grains with second-phase particles at grain boundaries are obtained, confirming the safe DRX domain. At 400 °C/0.01 s−1, a bimodal grain structure (fine recrystallized + elongated coarse grains) indicates incomplete recrystallization. These results experimentally validate that the optimal hot working window for achieving a uniform, refined recrystallized microstructure is a high temperature (≥400 °C) and a low strain rate (≤0.001 s−1).
(5) Limitations of this study: EBSD analysis was not performed; therefore, quantitative texture and grain boundary character evolution are not available. The mechanistic interpretations (DRX and DRV) based on flow curves are consistent with optical microscopy but require EBSD validation in future work. The processing maps are predictive and should be further validated by post-deformation electron microscopy. The constitutive model, while showing good fit to the training data, has not been subjected to external validation on independent datasets (e.g., different heating rates or pre-strained conditions). A more rigorous evaluation using metrics such as RRMSE, along with reserved test set validation, is recommended for future work.
In brief, in this basic investigation of ZM6 alloy flow stress, the improved constitutive model with strain compensation helps to reveal the hot processing conditions and dynamic recrystallization characteristics. These data provide a fundamental basis for establishing the constitutive model of hot deformation and for optimizing the hot working parameters of this alloy. Future work will integrate post-deformation EBSD analysis to directly correlate the predicted safe/unstable windows and DRX-suggestive regimes with actual microstructural features (e.g., recrystallized grain fractions, texture, and damage morphologies) and will apply the model to predict deformation behavior under industrially relevant, untested conditions. The optimized deformation crack and microstructure of the ZM6 wheel hub will be further investigated in future. Future work may integrate multiscale modeling with processing map analysis to further elucidate DRX–texture–property correlations, coupled with synergistic strengthening strategies to advance magnesium alloy performance in extreme service environments.
Supplementary Materials
The following supporting information can be downloaded at: https://www.mdpi.com/article/10.3390/pr14132034/s1, Figure S1: The hot deformation behavior of as-cast ZM6 magnesium alloy was investigated via hot compression tests at 300–450 °C and 0.0001–0.1 s−1.
Author Contributions
Conceptualization, H.Z.; methodology, J.F.; validation, H.Z.; formal analysis, J.F.; investigation, J.F. and H.Z.; resources, H.Z.; data curation, H.Z.; writing—original draft preparation, H.Z.; writing—review and editing, J.F.; funding acquisition, J.F. All authors have read and agreed to the published version of the manuscript.
Funding
This work was supported by the Doctoral Development Fund of Xi’an University of Architecture and Technology Huaqing College (No. 2026DDF-NS-M01), the Natural Science Foundation of Shaanxi Province (No. 2020JQ–769), the Guangdong Basic and Applied Basic Research Foundation (2023A14050002405) and the National Natural Science Foundation of China (No. 51905427).
Institutional Review Board Statement
Not applicable.
Informed Consent Statement
Not applicable.
Data Availability Statement
Data are available in a publicly accessible repository that does not issue DOIs. Publicly available datasets were analyzed in this study.
Acknowledgments
The authors thank the ingot supply of Xi’an Aviation Brake Technology Co., Ltd. for the as-cast ZM6 alloy.
Conflicts of Interest
The authors declare no conflicts of interest.
References
- Cui, Y.; Shi, Y.S.; Zheng, J.; Yan, Z.M.; Zhang, J.S.; Zhang, Z.M.; Wang, Q.; Xue, Y. Influence of heat treatment on the tensile properties and fatigue properties of Mg-8.8Gd-3.5Y-1.5Zn-0.5Zr alloy. Mater. Res. Express 2021, 8, 056518. [Google Scholar] [CrossRef] [Scilit]
- Yuan, J.W.; Li, T.; Zhang, K.; Li, X.G.; Li, Y.J.; Ma, M.L.; Shi, G.L.; Du, Z.W.; Liu, W.; Peng, Y.G. Precipitation behavior of Mg-7Gd-3Y-2Zn-0.5Zr alloy during isothermal aging. Materials 2021, 14, 1737. [Google Scholar] [CrossRef] [Scilit] [PubMed]
- Zeng, G.; Liu, C.M.; Gao, Y.H.; Jiang, S.N.; Yu, S.L.; Chen, Z.Y. Effects of T5 Treatment on Microstructure and Mechanical Properties at Elevated Temperature of AZ80-Ag Alloy. Materials 2019, 12, 3214. [Google Scholar] [CrossRef] [Scilit] [PubMed]
- Yuan, J.; Li, T.; Zhang, K.; Li, M.; Li, X.; Li, Y.; Ma, M.; Shi, G. Effect of Zn content on the microstructures, mechanical properties, and damping capacities of Mg–7Gd–3Y–1Nd–0.5Zr based alloys. J. Alloys Compd. 2019, 773, 919–926. [Google Scholar] [CrossRef] [Scilit]
- Ullmann, M.; Kittner, K.; Prahl, U. Hot Deformation and Dynamic Recrystallisation Behaviour of Twin-Roll Cast Mg-6.8Y-2.5Zn-0.4Zr Magnesium Alloy. Materials 2021, 14, 307. [Google Scholar] [CrossRef] [Scilit] [PubMed]
- Lu, S.H.; Wu, D.; Chen, R.S.; Han, E.H. The effect of twinning on dynamic recrystallization behavior of Mg-Gd-Y alloy during hot compression. J. Alloys Compd. 2019, 803, 277–290. [Google Scholar] [CrossRef] [Scilit]
- Wang, B.J.; Luan, J.Y.; Xu, D.K.; Sun, J.; Li, C.Q.; Han, E.H. Research progress on the corrosion behavior of magnesium–lithium-based alloys: A review. Acta Metall. Sin. 2019, 32, 1–9. [Google Scholar] [CrossRef] [Scilit]
- Chen, Y.H.; Wang, L.P.; Feng, Y.C.; Wang, L.; Guo, E.J. Effect of Al content on hot tearing behaviour of Mg–xAl2Ca–2Sm alloys. Mater. Sci. Technol. 2019, 35, 116–126. [Google Scholar] [CrossRef] [Scilit]
- Zhang, J.; Liu, S.; Wu, R.; Hou, L.; Zhang, M. Recent developments in high-strength Mg-RE-based alloys: Focusing on Mg-Gd and Mg-Y systems. J. Magnes. Alloys 2018, 6, 277–291. [Google Scholar] [CrossRef] [Scilit]
- Fu, J.; Chen, S. Microstructure Evolution and Mechanical Properties of As-Cast and As-Compressed ZM6 Magnesium Alloys during the Two-Stage Aging Treatment Process. Materials 2021, 14, 7760. [Google Scholar] [CrossRef] [Scilit] [PubMed]
- Long, J.C.; Xia, Q.X.; Xiao, G.F.; Qin, Y.; Yuan, S. Flow characterization of magnesium alloy ZK61 during hot deformation with improved constitutive equations and using activation energy maps. Int. J. Mech. Sci. 2021, 191, 106069. [Google Scholar] [CrossRef] [Scilit]
- Xia, Y.X.; Shu, X.D.; Zhang, Q.D.; Pater, Z.; Li, Z.X.; Xu, H.J.; Ma, Z.; Xu, C. Modified Arrhenius constitutive model and simulation verification of 2A12-T4 aluminum alloy during hot compression. J. Mater. Res. Technol. 2023, 26, 1325–1340. [Google Scholar] [CrossRef] [Scilit]
- Chen, Z.J.; Qian, L.Y.; Ji, B.P.; Liang, Y.; Zhen, H.Q.; Zhang, Q.D. Investigation into thermodynamic behavior of LA103Z Mg–Li alloy during turning based on modified Johnson–Cook model. J. Manuf. Process. 2023, 87, 260–272. [Google Scholar] [CrossRef] [Scilit]
- Choo, J.; Jung, Y.; Jo, H.; Kim, J.; Lee, I. Distribution estimation of Johnson-Cook parameters considering correlation in quasi-static state. Int. J. Mech. Sci. 2023, 244, 108086. [Google Scholar] [CrossRef] [Scilit]
- Cheng, Y.Q.; Zhang, H.; Chen, Z.H.; Xian, K.F. Flow stress equation of AZ31 magnesium alloy sheet during warm tensile deformation. J. Mater. Process. Technol. 2008, 208, 29–34. [Google Scholar] [CrossRef] [Scilit]
- Singh, G.; Chakraborty, P.; Tiwari, V. A comparative study of different constitutive models to predict the dynamic flow behaviour of a homogenised AT61 magnesium alloy. Structures 2023, 54, 631–643. [Google Scholar] [CrossRef] [Scilit]
- Yu, Q.; Zhang, J.; Jiang, Y.; Li, Q. An experimental study on cyclic deformation and fatigue of extruded ZK60 magnesium alloy. Int. J. Fatigue 2012, 36, 47–58. [Google Scholar] [CrossRef] [Scilit]
- Lee, J.H.; Ryu, D.M.; Lee, C.S. Constitutive-damage modeling and computational implementation for simulation of elasto-viscoplastic-damage behavior of polymeric foams over a wide range of strain rates and temperatures. Int. J. Plast. 2020, 130, 102712. [Google Scholar] [CrossRef] [Scilit]
- Shang, X.; Zhou, J.; Wang, X.; Luo, Y. Optimizing and identifying the process parameters of AZ31 magnesium alloy in hot compression on the base of processing maps. J. Alloys Compd. 2015, 629, 155–161. [Google Scholar] [CrossRef] [Scilit]
- Xu, Y.; Hu, L.; Deng, T.; Ye, L. Hot deformation behavior and processing map of as-cast AZ61 magnesium alloy. Mater. Sci. Eng. A 2013, 559, 528–533. [Google Scholar] [CrossRef] [Scilit]
- Xu, Y.; Hu, L.; Sun, Y. Processing map and kinetic analysis for hot deformation of an as-cast AZ91D magnesium alloy. Mater. Sci. Eng. A 2013, 578, 402–407. [Google Scholar] [CrossRef] [Scilit]
- Li, Z.J.; Wang, J.G.; Yan, R.F.; Chen, Z.Y.; Ni, T.Y.; Dong, Z.Q.; Lu, T.S. Effect of Ce addition on hot deformation behavior and microstructure evolution of AZ80 magnesium alloy. J. Mater. Res. Technol. 2022, 16, 1339–1352. [Google Scholar] [CrossRef] [Scilit]
- Prasad, Y.V.R.K.; Rao, K.P. Effect of homogenization on the hot deformation behavior of cast AZ31 magnesium alloy. Mater. Des. 2009, 30, 3723–3730. [Google Scholar] [CrossRef] [Scilit]
- Li, H.Z.; Wang, H.J.; Li, Z.; Liu, C.M.; Liu, H.T. Flow behavior and processing map of as-cast Mg–10Gd–4.8Y–2Zn–0.6Zr alloy. Mater. Sci. Eng. A 2010, 528, 154–160. [Google Scholar] [CrossRef] [Scilit]
- Wu, H.Y.; Wu, C.T.; Yang, J.C.; Lin, M.J. Hot workability analysis of AZ61 Mg alloys with processing maps. Mater. Sci. Eng. A 2014, 607, 261–270. [Google Scholar] [CrossRef] [Scilit]
- Taleghani, M.A.J.; Torralba, J.M. Hot deformation behavior and workability characteristics of AZ91 magnesium alloy powder compacts—A study using processing map. Mater. Sci. Eng. A 2013, 580, 142–149. [Google Scholar] [CrossRef] [Scilit]
- Wang, C.H.; Yang, G.Y.; Ouyang, S.X.; Qin, H.; Kan, Z.Y.; Jie, W.Q. Constitutive Modeling of Hot Deformation Behaviors and Processing Maps of Mg–4.83Gd–2.36Nd–0.21Zr Alloy. Phys. Status Solidi A 2023, 220, 2300434. [Google Scholar] [CrossRef] [Scilit]

Disclaimer/Publisher’s Note: The statements, opinions and data contained in all publications are solely those of the individual author(s) and contributor(s) and not of MDPI and/or the editor(s). MDPI and/or the editor(s) disclaim responsibility for any injury to people or property resulting from any ideas, methods, instructions or products referred to in the content. |
© 2026 by the authors. Licensee MDPI, Basel, Switzerland. This article is an open access article distributed under the terms and conditions of the Creative Commons Attribution (CC BY) license.