Abstract
Under the dual challenges of energy supply demand imbalance and the efficient operation of underground gas storage (UGS) facilities, this study investigated the mechanical behavior of reservoir rocks and optimal production pressure differential in a depleted gas reservoir in China under multi-cycle injection-production. For the first time, we reveal the mechanical degradation mechanism of hydration and cyclic fatigue for three typical lithologies in depleted sandstone reservoirs. Rock mechanics tests were conducted to analyze the effects of lithology, water saturation, and cyclic loading on mechanical properties, and appropriate failure criteria were evaluated. The main findings are as follows: (1) Under a confining pressure of 45 MPa, the peak strength of fine sandstone was the highest at 160.13 MPa, and the peak strength of argillaceous sandstone was the lowest at 114.92 MPa. The strength increased approximately linearly with confining pressure. (2) Increasing water saturation significantly weakened rock strength, particularly in argillaceous sandstone due to hydration effects. At 45% water saturation, its strength decreased by 37.38%. while Young’s modulus and Poisson’s ratio remained relatively unaffected. (3) Rock strength progressively degraded with the number of loading cycles. Siltstone showed the most significant degradation, with a strength reduction of 28.50% after 200 cycles. The damage induced by cyclic loading was less severe than that caused by hydration. (4) Among five failure criteria evaluated, the Mogi–Coulomb criterion demonstrated superior predictive capability by incorporating three-dimensional principal stress effects, showing closest agreement with the experimental data. We further established a depth-dependent production pressure differential profile and proposed a lithology-specific injection-production strategy. These findings provide theoretical foundations for optimizing injection-production strategies and sand control measures in depleted reservoir UGS systems.
1. Introduction
Amidst heightened volatility in crude oil markets, the energy sector crisis has intensified. Natural gas, recognized as a clean and efficient energy resource, has emerged as a critical component of the global energy transition in recent decades [1,2,3,4]. In the face of the imbalance between energy supply and demand, the use of existing or newly built underground space to store natural gas to realize seasonal peaking and safe supply of natural gas is an important method of ensuring energy security and balancing supply and demand [5,6]. Depleted hydrocarbon reservoirs constitute the predominant UGS type worldwide, offering distinct advantages including lower capital investment, shorter commissioning timelines, greater storage capacity, enhanced operational safety, and reduced storage-transportation costs [3,7,8,9]. Chinese reservoirs, however, present unique geological complexities compared to international analogs, having undergone multiphase tectonic evolution during depositional history. These formations are typically characterized by extensive fault networks, significant burial depths, pronounced heterogeneity, and late-stage formation water encroachment [8,9,10]. Furthermore, repeated injection-production cycling induces near-wellbore stress reorientation, promoting cyclic fatigue damage in reservoir rocks and compromising UGS integrity.
Alternating multi-cycle injection-production is a key operational characteristic of underground gas storage (UGS) systems. Due to the high operational demand, the injection-production rates in UGS facilities are significantly higher—often several to dozens of times greater—than those in conventional production wells. As a result, wellbore components such as tubing and casing are subjected to coupled effects of temperature fluctuations, pressure cycling, and repeated mechanical loading. These conditions can lead to corrosion, wear, and an elevated risk of leakage, which ultimately constrain the injection-production performance of UGS facilities and may trigger sand production in the reservoir [11]. Intensive cyclic injection-production operations can induce fatigue damage in the caprock of UGS systems, leading to brittle or plastic deformation [12]. Zhao et al. [13] investigated the microstructure of tight sandstone and found that cyclic stress alters the stress sensitivity of the pore network, thereby influencing both injectivity and productivity. Milad et al. [14] evaluated changes in porosity, permeability, and pore compressibility of core samples under varying effective stresses and cyclic loading conditions. Deng et al. [15] employed nuclear magnetic resonance (NMR) techniques to characterize pore structure evolution in sandstone subjected to cyclic loading, identifying the influence of cycle number on different pore types. Mi et al. [16] developed a method to assess the dynamic sealing capacity of UGS caprocks under alternating multi-cycle loading by integrating three-dimensional acoustic emission (AE) monitoring with rock damage tests, thereby analyzing microcrack propagation during cyclic stress application. Gao and Feng [17] conducted true triaxial cyclic loading experiments on jointed marble and found that damage accumulation can be quantified by irreversible strain and energy dissipation, both of which show an approximately linear relationship. Xia et al. [18] performed multi-level cyclic triaxial compression tests on sandstone under varying confining pressures using AE techniques and observed that the rock damage variable decreases with increasing confining pressure, but increases with higher upper stress limits in cyclic loading. A broad range of experimental studies has demonstrated that parameters such as loading frequency, stress path, confining pressure, and testing temperature exert significant influences on rock pore structure and mechanical behavior [19,20,21,22,23,24,25,26].
In addition, under conditions of high-intensity cyclic injection-production, significant variations occur in reservoir pressure, fluid migration patterns, and the gas–water interface [27]. Cyclic operations induce periodic movement of the gas–water contact, wherein gas and water phases repeatedly displace each other. This dynamic two-phase interaction results in alternating water saturation within parts of the reservoir rock, thereby complicating multiphase flow behavior in the pore network [28,29,30]. Experimental studies have demonstrated that formation water intrusion during UGS operations alters the relative permeability of reservoir rocks, and this effect is characterized by significant hysteresis. Hysteresis in relative permeability critically influences fluid distribution and production performance during gas storage and cyclic injection-production processes [31,32,33]. Periodic hydration associated with these operations can lead to the expansion of clay minerals, significantly modifying porosity and pore structure [34]. Hydration primarily weakens rock strength by degrading mechanical parameters such as fracture toughness, elastic modulus, and internal friction coefficient [35,36,37]. Moreover, rocks with higher clay mineral content exhibit more pronounced hydration-induced deterioration [38]. However, these studies mostly focus on a single factor and rarely involve the effects of “lithology-water saturation-cyclic loading” in depleted sandstone reservoirs. in terms of engineering application, they mostly stay at the analysis of mechanical laws, lacking optimized production pressure differential schemes for different lithologies, which limits their guiding role in the safe and efficient operation of depleted gas reservoir UGS.
The cumulative damage caused by multi-cycle injection-production operations in UGS systems ultimately manifests as sand production within the reservoir. As a complex geomechanics issue, sand production is governed by a variety of interrelated factors, including in situ stress conditions, pressure gradients, rock strength, and pore fluid pressure [39,40,41,42,43,44]. In contrast to rock damage studies, which are typically based on theoretical models and laboratory experiments, investigations into sand production rely heavily on numerical simulations that incorporate both experimental data and theoretical frameworks. O’Connor et al. [45] applied a two-dimensional discrete element method (DEM) to simulate sand production during hydrocarbon extraction processes. Khamitov et al. [46,47] utilized three-dimensional CFD–DEM simulations to study interparticle bond breakage in sandstone during sand production. Their results indicate that damage zones tend to develop around perforated intervals and expand rapidly under fluid flow, mobilizing particles that migrate toward the perforation tunnels. They also developed a visual experimental apparatus to replicate sand production in weakly consolidated sandstone, proposing a particle-competition stripping mechanism specific to such formations. Rakhimzhanova et al. [48] employed three-dimensional CFD–DEM–IBM simulations to investigate the dynamics of periodic sand production in sandstone formations. They found that sand production is primarily triggered by the collapse of sand arches near perforation zones, and that increasing interparticle bonding strength in these regions can effectively mitigate sand release. Song et al. [49,50] combined laboratory testing with numerical modeling to evaluate the mechanical properties of reservoir rocks across different sedimentary facies and proposed a method for calculating the critical drawdown pressure in UGS, offering practical guidance for safe and stable operations. However, most of these studies focus on sand production during the development phase of oil and gas fields and are not directly applicable to depleted gas reservoirs repurposed for UGS. Moreover, comprehensive investigations into lithology-dependent variations in mechanical behavior under cyclic injection-production regimes, as well as the applicability of various failure criteria under UGS conditions, remain limited.
To address these gaps, this study aimed to investigate how the lithology and water saturation modify the strength of reservoir rocks as well as the production pressure differential under multi cycles mechanical loading. A series of rock mechanics experiments were designed to simulate the cyclic injection-production conditions characteristic of UGS operations. These tests yielded mechanical parameters under various conditions, enabling the evaluation of how different water saturation levels and numbers of loading cycles influence the mechanical behavior of reservoir rocks. Based on the experimental data, production pressure differentials were calculated using five commonly applied failure criteria. A comparative analysis was then conducted to determine the most appropriate failure criterion for this specific depleted reservoir. The findings provide a theoretical foundation for optimizing production strategies and ensuring safe, stable UGS operation in the field.
2. Experimental Methods
2.1. Sample Preparation
The target depleted gas reservoir in this study is located in an oilfield in western China. The reservoir is developed in the Paleogene sandstone formation. Affected by multiple tectonic movements in the Himalayan period, it forms a “fault–sandbody” composite reservoir. The reservoir has favorable petrophysical properties, with porosity ranging from 21.5% to 23.7% and permeability between 38.86 mD and 175.5 mD, classifying it as a medium to high-porosity and medium to high-permeability system. An underlying aquifer is present at the base of the reservoir, and edge water has invaded some sandstone intervals along faults, resulting in changes in the water saturation in near-water wells. Up to now, the UGS has completed multiple injection-production cycles. Sand production has been observed in some production wells, indicating the degradation of rock mechanical properties around the wellbore. Based on these reservoir characteristics, three representative lithologies—siltstone, fine sandstone, and argillaceous sandstone—were selected for core sampling, which are consistent with the lithology distribution interpreted by on-site logging. Downhole rock cores were retrieved from depths ranging from 2381.98 m to 2651.20 m, and the core samples were processed into standard cylindrical samples, as shown in Figure 1.
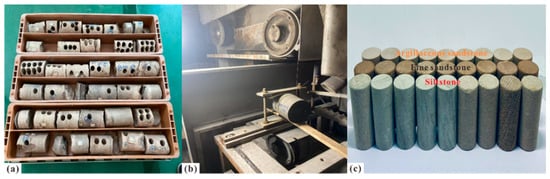
Figure 1.
Sample preparation. (a) Drill core store sampling; (b) wire-cutting device; (c) core sample.
The mineral composition of the core samples was analyzed using X-ray diffraction (XRD) technology. Among them, fine sandstone had the highest content of quartz, approximately 78%, followed by feldspar at about 17%, and the content of clay minerals was relatively low, approximately 5%, with quartz overgrowth cementation, dense grain packing; siltstone had a quartz content of 67%, feldspar of 17%, and clay minerals of 14%, argillaceous cementation, moderate grain sorting; argillaceous sandstone had a quartz content of 56%, feldspar of 15%, and clay minerals of 29%, massive argillaceous cementation, loose grain packing. Basic physical properties, including density, porosity, and permeability, were measured, covering the actual petrophysical range of the on-site reservoir. The results are presented in Table 1.

Table 1.
Physical property parameters of core samples.
2.2. Conventional Triaxial Compression Tests
A total of nine sandstone samples representing three lithologies were selected for conventional triaxial compression tests under confining pressures of 15 MPa, 30 MPa, and 45 MPa. According to the in situ stress logging report of the study area, the range of geo-stress is 22.1–47.5 MPa. The selected confining pressure range fully covers the actual in situ stress interval of the reservoir, ensuring that the experimental stress environment is consistent with the on-site reservoir conditions.
During the test, the confining pressure was applied first and maintained constant, followed by axial loading at a stress rate of 0.5~1 MPa∙s−1 until the specimen failed completely. The peak load at failure was recorded. Young’s modulus and Poisson’s ratio were extracted by linear approximation of the elastic stage, where the stress range was 30–70% of the peak strength. Temperature was maintained constant at 25 °C during the test.
2.3. Triaxial Compression Tests with Different Water Saturation
Simulated formation water was prepared based on the mineralization levels, ionic composition, and concentration data obtained from the underground gas storage site. A vacuum saturation apparatus (Figure 2a) was used to saturate the core samples. Each sample was placed under vacuum conditions for 12 h to remove entrapped air, followed by saturation in simulated formation water under a confining pressure of 10 MPa for 24 h to ensure complete saturation. After saturation, the samples were dried under controlled conditions to achieve target water saturation levels (0%, 15%, 30%, 45%). On-site production monitoring shows that edge water invades the reservoir along faults, resulting in the water saturation near the wells to fluctuate continuously. The set water saturation levels not only simulate the actual water invasion state of the reservoir but also help to identify the critical threshold of water saturation affecting rock strength.
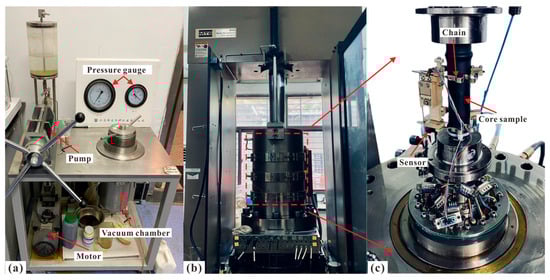
Figure 2.
Testing instrument. (a) Vacuum pressure saturation instrument; (b,c) MTS815.04 rock mechanics testing system.
Using this protocol, a total of nine cylindrical samples representing three lithologies—siltstone, fine sandstone, and argillaceous sandstone—were prepared with the above water saturation levels. These samples were subsequently subjected to triaxial compression testing under a confining pressure of 30 MPa.
2.4. Cyclic Triaxial Loading Tests
A total of nine sandstone samples representing three lithologies were selected for cyclic triaxial loading tests. The cyclic axial load was applied using a sinusoidal waveform, with a maximum axial stress of 60 MPa and a minimum of 20 MPa, under a constant confining pressure of 30 MPa. The loading frequency was maintained at 0.1 Hz, and the core samples were subjected to 50, 100, and 200 loading cycles, respectively. On the final cycle, each specimen was loaded to failure, and its post-cyclic peak strength was measured.
The UGS operations in the research area follow a cyclic pattern of “gas production in winter and gas injection in summer”, and several cycles have been completed so far. The loading cycles in the experiment correspond to the on-site injection-production, which can simulate the final fatigue damage state of the gas storage reservoir throughout its entire life cycle.
All three types of experiments were conducted using the MTS815.04 rock mechanics testing system at the State Key Laboratory of Geomechanics and Geotechnical Engineering, Institute of Rock and Soil Mechanics, Chinese Academy of Sciences (Figure 2b,c).
3. Experimental Results and Discussion
3.1. Mechanical Properties of Core Samples with Different Lithology
Conventional triaxial compression tests were conducted to determine the mechanical strength of three core lithologies under varying confining pressures. Taking the fine sandstone specimen FS-01 as a representative example, the stress–strain curve obtained from the experiment can be divided into four distinct stages, as illustrated in Figure 3a. In the initial pore compaction stage, the curve exhibits a concave upward shape, with a gradually increasing slope and slow stress accumulation. This behavior reflects the compaction of internal pores under increasing external load. During the subsequent elastic deformation stage, the curve becomes approximately linear, conforming to Hooke’s law. At this stage, microcracks may initiate or extend stably, but the material has not yet undergone structural failure. Once the stress surpasses the elastic limit, the curve transitions into the plastic deformation stage. Here, internal microcracks propagate more consistently, leading to a decrease in the slope of the curve. This stage is characterized by a nonlinear convex relationship between stress and strain, where strain increases rapidly while stress rises at a slower rate. Upon reaching peak strength, the bonding between rock grains is significantly compromised, resulting in the rapid coalescence of microcracks into macroscopic fractures—marking the onset of failure. In the post-peak failure stage, load-bearing capacity is primarily maintained by frictional resistance along fracture surfaces. Although stress declines sharply, residual strength persists, and strain continues to increase, ultimately resulting in shear failure along the dominant fracture plane. It should be noted that the mechanical behavior at sandstone–mudstone interfaces has not been studied in this research, due to the lack of interlayer samples.
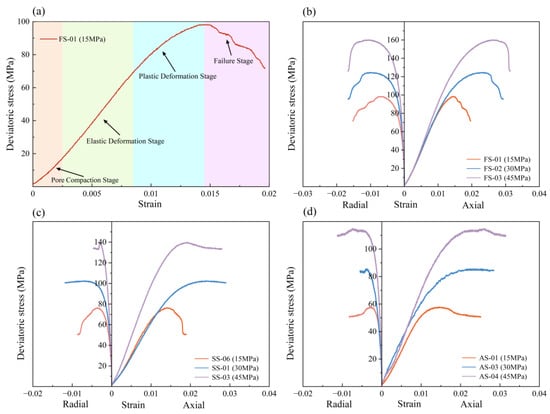
Figure 3.
The stress–strain curve of the routine triaxial compression tests. (a) Stress–strain Curve Development Stages; (b) Fine sandstone; (c) Siltstone; (d) Argillaceous sandstone.
Figure 3b–d illustrates the stress–strain responses of the three core lithologies under varying confining pressures. The peak strength of all rock types increased with elevated confining pressure. Among them, fine sandstone exhibited the highest strength, ranging from 98.40 MPa to 160.13 MPa. Siltstone followed, with strength values between 76.39 MPa and 139.70 MPa, while argillaceous sandstone had the lowest strength, increasing from 57.79 MPa to 114.92 MPa.
In terms of deformation characteristics, all three lithologies underwent a distinct compaction phase. Argillaceous sandstone displayed the most pronounced compaction behavior, followed by siltstone, whereas fine sandstone exhibited the shortest compaction stage. With increasing confining pressure, the compaction stage of fine sandstone remained relatively unchanged, while that of siltstone and argillaceous sandstone shortened, particularly in the latter. This can be attributed to the higher clay mineral content and lower initial compaction density of argillaceous sandstone, making its compaction stage more prominent. Under higher confining pressures, argillaceous sandstone experienced significant pre-compaction prior to axial loading, leading to notable changes in its compaction behavior. Conversely, fine sandstone, being the most compact, is less affected by varying confining pressures in terms of compaction.
In the plastic deformation and failure stages, the three rock types exhibited both similarities and differences. Argillaceous sandstone showed the most evident yield stage, followed by siltstone, with fine sandstone displaying the shortest yield stage. As confining pressure increased, the yield behavior became more pronounced in all samples, characterized by extended yield segments and increased peak axial strain. However, post-peak behavior varied among the rock types: argillaceous sandstone exhibited a gradual decline in post-peak stress, reflecting pronounced plastic characteristics that intensify with increasing confining pressure. Siltstone initially demonstrated elastic-brittle behavior under 15 MPa, with a slow post-peak stress decline followed by a rapid drop, but transitioned toward more plastic behavior as confining pressure increased. Fine sandstone, after reaching peak strength, showed a sharp drop in residual stress, indicative of a hard-brittle rock. Although higher confining pressure enhanced its yield characteristics, fine sandstone retained its inherently brittle failure mode.
Based on the triaxial compression test results, key rock mechanical parameters—including Young’s modulus, Poisson’s ratio, internal friction angle, and cohesion—were determined for the three sandstone lithologies, as summarized in Table 2. Figure 4a–c illustrates the relationships between selected mechanical parameters and confining pressure.
Table 2.
The rock mechanical parameters of the core samples.
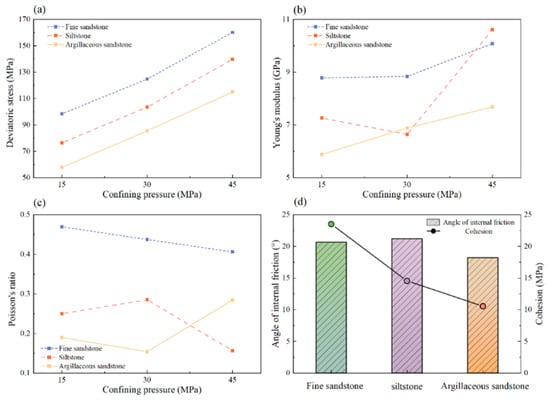
Figure 4.
The variation of rock mechanical parameters. (a) Deviatoric stress; (b) Young’s modulus; (c) Poisson’s ratio; (d) Angle of internal friction & Cohesion.
As shown in Figure 4a, the peak strength of all three rock types increased nearly linearly with rising confining pressure. Among them, fine sandstone demonstrated the highest strength, followed by siltstone and argillaceous sandstone. The superior strength of fine sandstone can be attributed to its uniform grain size, dense internal structure, and stronger cementation. In contrast, argillaceous sandstone’s higher clay mineral content and weaker cementation contributed to its lower strength. Figure 4b depicts the relationship between confining pressure and Young’s modulus, revealing a general positive correlation. Young’s modulus characterizes the stiffness of the material in the elastic stage. As confining pressure increases, Young’s modulus also increases, indicating that the rock’s resistance to elastic deformation improves, ultimately leading to an increase in peak strength. Poisson’s ratio, however, exhibits a more complex behavior, as seen in Figure 4c. Overall, fine sandstone has a higher Poisson’s ratio than both siltstone and argillaceous sandstone. With increasing confining pressure, Poisson’s ratio in fine sandstone shows a slight decline, while that of siltstone and argillaceous sandstone varies irregularly. This is because siltstone and argillaceous sandstone exhibit plastic behavior under high confining pressures. In rocks where plastic deformation dominates, Poisson’s ratio tends to fluctuate without a consistent trend. Brittle materials with higher Poisson’s ratios are more susceptible to damage [51,52]. Fine sandstone, which consistently exhibits a hard-brittle failure mode, shows a slight decline in Poisson’s ratio as confining pressure increases. Figure 4d presents the relationships between cohesion and internal friction angle across the different lithologies. Siltstone has a slightly higher internal friction angle than fine sandstone and a significantly higher value than argillaceous sandstone. Fine sandstone exhibits substantially greater cohesion than both siltstone and argillaceous sandstone. As key shear strength parameters, cohesion and internal friction angle jointly determine overall rock strength [53]. The relatively low strength of argillaceous sandstone is primarily attributed to its high clay mineral content and weak intergranular cementation. Considering that the internal friction angles among the rock types are approximately similar, the higher strength of fine sandstone is mainly due to its significantly greater cohesion. This interpretation is consistent with the results of the triaxial compression tests.
3.2. Mechanical Properties of Core Samples with Different Water Saturation
At a confining pressure of 30 MPa, triaxial compression tests were performed on fine sandstone, siltstone, and argillaceous sandstone samples with varying water saturations. The resulting mechanical parameters are summarized in Table 3. Siltstone and argillaceous sandstone displayed notable plastic behavior, whereas fine sandstone consistently retained a hard-brittle failure mode. As water saturation increased from 0% (dry state) to 45%, the peak strength of fine sandstone decreased from 124.78 MPa to 95.52 MPa; that of siltstone decreased from 103.50 MPa to 68.54 MPa; and that of argillaceous sandstone decreased from 85.49 MPa to 53.53 MPa. The overall strength ranking remained consistent, with fine sandstone exhibiting the highest strength, followed by siltstone and argillaceous sandstone, as illustrated in Figure 5.
Table 3.
The rock mechanical parameters of the core samples with different water saturation.
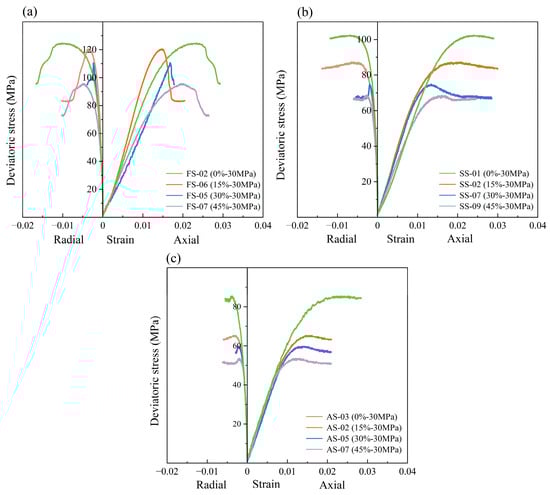
Figure 5.
The stress–strain curve of rocks with different water saturation. (a) Fine sandstone; (b) Siltstone; (c) Argillaceous sandstone.
To quantify the effect of water saturation on rock fracture characteristics, integral metrics were calculated from the stress–strain curves. The results show that as the water saturation increased to 45%, the fracture energy of fine sandstone decreased by 21.3%, that of siltstone decreased by 28.7%, and that of argillaceous sandstone decreased by 35.2%. The absolute value of the slope of the softening zone decreased as the water saturation increased, the change was most significant in argillaceous sandstone, with the slope dropping from −5.2 MPa/ε to −2.8 MPa/ε. These results confirm that hydration not only reduces peak strength but also weakens the fracture energy capacity and brittleness of rocks. Due to the high mineral content of formation water, water molecules infiltrate microcracks and defects within the rock and engage in physicochemical interactions with the internal minerals. These reactions weaken the cementation by dissolving bonding agents, reduce intergranular cohesion, and ultimately lower rock strength through localized stress concentrations and uneven stress redistribution.
Figure 6a presents the Young’s modulus of core samples under varying water saturation levels. For siltstone and argillaceous sandstone, the Young’s modulus fluctuated within approximately 6.5 GPa, consistent with the elastic behavior observed in the stress–strain curves in Figure 5. This suggests that water saturation does not significantly affect the elastic stiffness of these lithologies. In contrast, the Young’s modulus of fine sandstone exhibited greater variability (within the error bars), which can be attributed to differences in weathering and inherent heterogeneities within the samples. The Poisson’s ratios of siltstone and argillaceous sandstone fluctuated around 0.2, while the Poisson’s ratio of fine sandstone varied significantly and was similar to the Young’s modulus. This was all caused by the differences in fine sandstone samples (Figure 6b). Figure 6c illustrates the normalized deviatoric stress for the three rock types under a confining pressure of 30 MPa. A progressive strength reduction was observed with increasing water saturation. At 45% saturation, the strength reductions for fine sandstone, siltstone, and argillaceous sandstone were 23.44%, 33.78%, and 37.38%, respectively. These results indicate that argillaceous sandstone was most sensitive to hydration, followed by siltstone, while fine sandstone was least affected. Hydration had minimal influence on Young’s modulus or Poisson’s ratio; its primary impact lies in mechanical strength degradation. Core samples with weaker cementation, higher clay mineral content, and lower particle packing density are more susceptible to hydration-induced weakening.
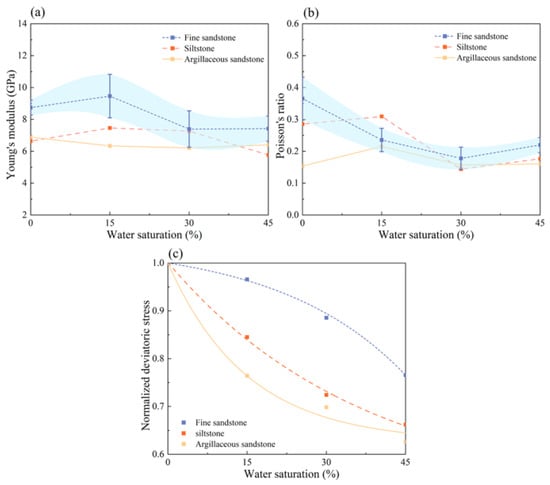
Figure 6.
The variation of rock mechanical parameters with different water saturation. (a) Young’s modulus; (b) Poisson’s ratio; (c) Normalized deviatoric stress. The blue color part represents the range of the error bars.
3.3. Mechanical Properties of Core Samples with Different Cyclic Loading
Figure 7a–c shows the results of cyclic triaxial loading tests conducted at a confining pressure of 30 MPa. As the number of loading cycles increased from 50 to 200, a consistent reduction in peak strength was observed for all lithologies. Specifically, the peak strength of fine sandstone decreased from 124.78 MPa to 110.48 MPa, siltstone from 103.50 MPa to 74.01 MPa, and argillaceous sandstone from 85.49 MPa to 66.07 MPa.
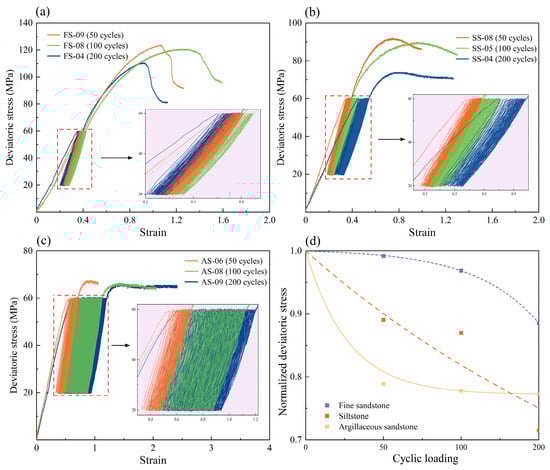
Figure 7.
The stress–strain curve of rocks with different cyclic loading. (a) Fine sandstone; (b) Siltstone; (c) Argillaceous sandstone; (d) Variation of deviatoric stress.
During each loading cycle, the stress–strain response remained approximately linear, indicating that the specimens remained within the elastic regime under cyclic axial stresses ranging from 20 MPa to 60 MPa. As the cycle count increased, the slope of the stress–strain curves gradually decreased, and axial strain accumulation became more pronounced, particularly for argillaceous sandstone (Figure 7c). Due to its relatively low strength, the upper bound of axial stress approached the peak strength of argillaceous sandstone, resulting in cumulative fatigue damage and progressive axial deformation. These findings highlight a strong correlation between axial strain accumulation and fatigue-induced degradation in rocks [54]. Magnified views of the loading segments revealed that the hysteresis loops in later cycles resembled those in the initial cycles—elongated and narrow—but their enclosed areas decreased slightly. This behavior indicates progressive stiffness degradation and the accumulation of fatigue damage caused by repetitive loading and unloading. Notably, the hysteresis loops displayed sharp inflection points at the loading and unloading transitions, suggesting that the rock maintained predominantly elastic behavior during these phases, accompanied by relatively high deformation rates [55]. In order to eliminate the influence of creep effect on the test, each cycle was followed by a 10 s hold at the minimum axial stress, ensuring that plastic deformation was fully developed before the next cycle.
Figure 7d presents the normalized deviatoric stress under varying cycle counts. After 200 cycles, the strength degradation ratios for fine sandstone, siltstone, and argillaceous sandstone were 11.46%, 28.50%, and 22.71%, respectively. Siltstone exhibited the highest sensitivity to fatigue damage, followed by argillaceous sandstone, while fine sandstone was the least affected. Although fatigue damage from cyclic loading is less severe than hydration, the injection and production operations in depleted reservoirs subject the formations to long-term cyclic pressure fluctuations. Therefore, the accumulation of fatigue damage is a critical factor affecting reservoir integrity, and its effects must be carefully considered during the operation of UGS facilities.
The cyclic loading test in this study only reproduced the mechanical part of the multi-cycle injection-production conditions in UGS facilities, but did not consider issues such as gas–water migration in actual UGS. Therefore, the production pressure differential calculated in this paper should be regarded as an upper limit estimate, and on-site application needs to be dynamically adjusted in combination with water chemistry monitoring data.
4. Optimal Selection of Failure Criteria for Underground Gas Storage
In this section, five widely used rock strength failure criteria in geomechanics are analyzed: Mohr–Coulomb, Drucker–Prager, Hoek–Brown, Modified Lade, and Mogi–Coulomb. The applicability of each criterion to various geological and engineering conditions is briefly reviewed. A comparative analysis is then performed to evaluate their suitability for application in UGS systems developed from depleted gas reservoirs. Finally, triaxial compression test data are employed to validate the predictive accuracy of each criterion, and the most appropriate failure model for multi-cycle injection-production conditions in depleted gas reservoirs is identified.
4.1. Mohr–Coulomb
The Mohr–Coulomb failure criterion is one of the most widely adopted models in rock mechanics for characterizing rock strength. According to Mohr’s theory of strength, failure occurs when the shear stress on a potential failure plane exceeds the material’s shear strength [56]. The criterion can be mathematically expressed in principal stress space as:
In this equation, represents the maximum principal stress, the minimum principal stress, the cohesion of the rock, and the internal friction angle. It is evident that Equation (1) does not incorporate the intermediate principal stress, which highlights a fundamental limitation of the Mohr–Coulomb criterion: it reduces the shear strength condition to a function of only the maximum and minimum principal stresses. While this simplification contributes to its widespread use in engineering applications due to ease of implementation, it may lead to inaccuracies under certain reservoir conditions, particularly where the intermediate principal stress plays a non-negligible role in rock failure.
4.2. Drucker–Prager
The Drucker–Prager failure criterion defines a relationship between shear stress and the mean (octahedral) normal stress. On the π-plane, this criterion yields a circular yield surface, which eliminates the numerical singularities associated with the sharp corners present in the Mohr–Coulomb model [57]. The mathematical formulation of the criterion is given as:
where is the first invariant of the stress tensor, is the second deviatoric stress invariant, and represents the intermediate principal stress.
By incorporating the first stress invariant, the Drucker–Prager criterion accounts for the effect of the intermediate principal stress, thereby addressing a key limitation of the Mohr–Coulomb criterion. It is widely used in geomechanical modeling to predict rock failure. However, this criterion may overestimate the contribution of the intermediate principal stress to rock strength, potentially reducing its predictive accuracy under certain geological conditions.
4.3. Hoek–Brown
The Hoek–Brown criterion is a nonlinear strength criterion specifically developed for jointed or heavily fractured rock masses. It is particularly well-suited for reservoirs with extensively developed discontinuities or highly fragmented geological structures. Its mathematical formulation is expressed as follows [58]:
where denotes the uniaxial peak strength of intact rock; m is the material constant related to rock hardness, typically ranging from 0 to 25; and s is the structural coefficient representing the degree of rock mass disturbance or fragmentation, with values ranging from 0 to 1.
The Hoek–Brown criterion comprehensively accounts for both the material properties of the rock and the influence of structural discontinuities, thus overcoming the limitations of the Mohr–Coulomb criterion, which omits the influence of intermediate principal stress. This criterion improves the accuracy of sand production predictions in fractured reservoirs and is particularly well-suited for estimating the strength of reservoirs under high confining pressure conditions.
4.4. Modified Lade
The Modified Lade criterion, based on the first and third stress invariants, presents a distinct failure criterion compared to others such as the Mohr–Coulomb criterion, where shear strength is linearly related to normal stress. This criterion was subsequently modified, leading to the currently accepted standard definition equation [59]. The mathematical expression is as follows:
where represents the modified first stress invariant, denotes the modified third stress invariant, is the pore pressure within the rock, and is a parameter determined by the rock’s cohesion and internal friction angle.
4.5. Mogi–Coulomb
The expression of the Mogi–Coulomb criterion is as follows [60]:
In this equation, represents the octahedral shear stress, and denotes the average effective stress. The Mogi–Coulomb criterion, which extends the original Mohr–Coulomb criterion, incorporates the effect of the intermediate principal stress by establishing a linear relationship between octahedral shear stress and the mean effective stress. This criterion is particularly useful for rock failure analysis under complex stress conditions and for predicting sand production in heterogeneous reservoirs. It also aids in mitigating the risk of wellbore instability caused by stress anisotropy.
4.6. Calculation of Production Pressure Differential
To simplify the analytical formulations presented in this paper, the following assumptions were made: (1) the borehole is vertical, with its axis aligned with one of the principal stress directions; (2) the mechanical properties of the reservoir rock are isotropic; (3) the rock behaves as an ideal elastic-plastic material. Based on these assumptions, and by considering the wellbore bottom pressure, pore pressure, and incorporating the Biot coefficient, the three principal effective stresses at the borehole wall can be calculated as follows:
where is the maximum horizontal principal stress, is the minimum horizontal principal stress, is the vertical principal stress, and is the wellbore bottom pressure.
By integrating Equations (12)–(14) with the five failure criteria and applying the rock mechanical parameters for different lithologies obtained in Section 3, the ultimate bottom hole pressure of the UGS reservoir in the depleted gas formation can be reliably determined. Accordingly, the production pressure differential for the target block can be established.
Figure 8 illustrates the production pressure differential under current formation pressure conditions of the UGS reservoir in the depleted gas of the target block. The results calculated using the Mohr–Coulomb, Drucker–Prager, and Mogi–Coulomb criteria are relatively consistent, all indicating that the fine sandstone exhibited the highest production pressure differential, while the argillaceous sandstone exhibited the lowest, which is in accordance with the experimental results presented in Section 2. In contrast, the predictions derived from the Hoek–Brown and Modified Lade criteria were less satisfactory. The production pressure differential estimated using the Hoek–Brown criterion was approximately 12.53 MPa across all three lithologies. This reason is due to the inclusion of two highly empirical coefficients in the Hoek–Brown formulation, which introduces substantial subjectivity. The Modified Lade criterion consistently underestimates the production pressure differential and even yields negative values for argillaceous sandstone, which is clearly inconsistent with the actual conditions. Currently, the operational production pressure differential in the target block ranges between 3–5 MPa, as indicated by the brownish-yellow band in Figure 8. The calculated ultimate production pressure differential was 6.58 MPa, marked by the red dashed line, suggesting that there remains an available margin of approximately 1 MPa, represented by the light-yellow band, indicating further production potential within a safe operating margin.
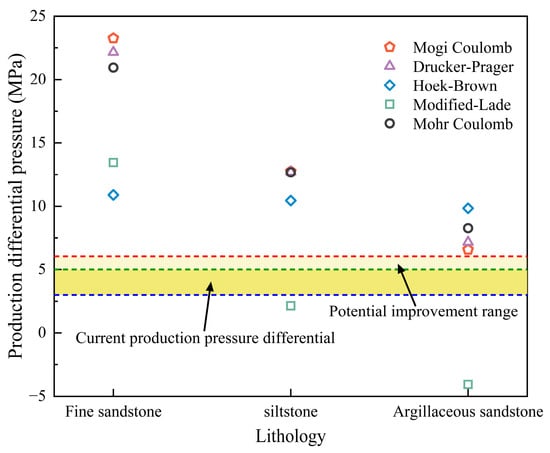
Figure 8.
Reservoir production pressure differential with different failure criteria.
To further assess the applicability of various rock strength failure criteria in estimating the production pressure differential, the relationship between reservoir pressure and production pressure differential was analyzed for the target block (Figure 9). As production progresses and reservoir pressure decreases, the corresponding production pressure differential showed a clear linear decline. Among the three lithologies, argillaceous sandstone demonstrated the highest sensitivity to pressure depletion, exhibiting a 30.30% reduction in production pressure differential from the initial to the current formation pressure. Siltstone showed a 19.23% decrease, while fine sandstone was least affected, with a reduction of only 12.14%.

Figure 9.
The variation of production pressure differential with different formation pressure. (a) Fine sandstone; (b) Siltstone; (c) Argillaceous sandstone.
The limitations of the Hoek–Brown and Modified Lade criteria were further confirmed by the results shown in Figure 9. The Hoek–Brown criterion produced overly generalized estimates, failing to differentiate between lithological variations. The production pressure differential of argillaceous sandstone calculated by the Modified Lade criterion was negative, not shown in Figure 9c. The results obtained in the siltstone (Figure 9b) showed a nonlinear relationship. Only the results for fine sandstone (Figure 9a) aligned reasonably with the actual reservoir. These findings collectively indicate that the Hoek–Brown and Modified Lade criteria are unsuitable for evaluating production pressure differential in the target block. Notably, the Mogi–Coulomb criterion, as an enhancement of the Mohr–Coulomb criterion, also mitigates the issue of overemphasized intermediate principal stress in the Drucker–Prager criterion. Thus, the Mogi–Coulomb criterion is recommended as the most appropriate model for evaluating production pressure differential in the UGS operations within depleted gas reservoirs of the target block.
The production pressure differential profile for a well in the depleted gas reservoir of the target block, calculated using the Mogi–Coulomb criterion, is presented in Figure 10. This profile facilitates the identification of reservoir lithology and its corresponding production pressure differential at any given depth. The average production pressure differentials for fine sandstone, siltstone, and argillaceous sandstone in the target well were 23.01 MPa, 13.27 MPa, and 6.89 MPa, respectively.
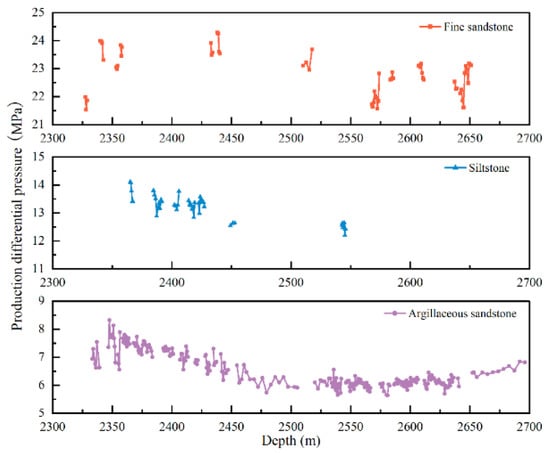
Figure 10.
Production pressure differential profile of well.
The production pressure differential in the wellbore region is primarily governed by the mechanical strength of the rock and the in situ stress conditions of the reservoir. Since variations in the geo-stress field are relatively minor at the current stage, lithological characteristics and stress perturbations induced by injection-production play a more dominant role in determining pressure differential. Accordingly, mitigating formation water invasion during the middle and late stages of development and conducting real-time monitoring of stress field evolution during gas injection-production are essential strategies for managing sand production risk in UGS operations in depleted gas reservoirs.
It should be noted that the comparative verification of the five strength criteria in this study was based on the same set of triaxial compression test data, and independent verification under other loading conditions or field scenarios has not yet been conducted. The Mogi–Coulomb criterion is recommended in this study primarily based on its superior fitting performance with laboratory triaxial data and its ability to overcome the inherent limitations of other criteria. In future research, we will conduct true triaxial tests on reservoir rock samples and match the criterion predictions with field sand production events with accurately recorded pressure differentials to further validate the applicability and robustness of the Mogi–Coulomb criterion in depleted gas reservoir UGS systems.
5. Conclusions
This study investigated the evolution of rock mechanical properties under multi-cycle gas injection and production conditions through mechanical tests of different lithologies. By comparing five rock strength failure criteria, the most appropriate model for evaluating the production pressure differential in UGS operations within depleted gas reservoirs of the target block was identified. The results offer both experimental validation and theoretical support for optimizing gas injection and production strategies under complex geological conditions. The main conclusions are as follows:
- (1)
- Conventional triaxial compression tests reveal that the mechanical properties of sandstone are strongly influenced by lithology and confining pressure. Fine sandstone exhibited the highest strength, reaching 160.13 MPa at a confining pressure of 45 MPa. Argillaceous sandstone showed the lowest strength. The plastic deformation of siltstone became more pronounced under high pressures. Due to coring and experimental constraints, mudstone interlayers were not included in the current tests, their influence on reservoir integrity requires subsequent research.
- (2)
- Increasing water saturation significantly reduced rock strength due to cement dissolution and clay mineral swelling. At 45% saturation, strength reductions of 37.38%, 33.78%, and 23.44% were observed for argillaceous sandstone, siltstone, and fine sandstone, respectively. Hydration had no significant effect on the Young’s modulus and Poisson’s ratio of the rock.
- (3)
- Cyclic loading induced by repeated gas injection and production led to fatigue damage, with degradation levels dependent on lithology and loading conditions. After 200 cycles, the strengths of the three types of sandstones decreased by 28.50%, 22.71%, and 11.46%, respectively. The strength of argillaceous sandstone was the most significantly damaged. Fine sandstone still maintained a hard-brittle failure mode even at later stages of cyclic loading.
- (4)
- The Mogi–Coulomb criterion was the most suitable under heterogeneous reservoir conditions, as it effectively accounts for the influence of all three principal stresses. It produced production pressure differentials of 23.01 MPa, 13.27 MPa, and 6.89 MPa for the three types of sandstones, which were highly consistent with the experimental strength rankings.
- (5)
- The production pressure differential profile shows that the operating pressure differential in the target block is between 3 to 5 MPa, indicating that there is still optimization potential relative to the theoretical limit of 6.58 MPa. It is recommended to dynamically monitor the reservoir and maintain water saturation below 30% and ensure that the wellhead pressure does not exceed the lowest production pressure differential. This can be combined with acoustic emission or micro-seismic monitoring technologies to assess fatigue damage of the reservoir in real-time and optimize the injection-production strategies.
This study verified the applicability of the Mogi–Coulomb criterion based on laboratory triaxial test data, but no field verification was conducted. Subsequent research will focus on these aspects to enhance the reliability of this criterion in engineering applications.
Author Contributions
Conceptualization, H.Z., K.X. and J.L.; methodology, P.Z., L.L., X.W. and H.G.; software, J.S. and H.W.; validation, J.L.; formal analysis, J.S., Z.W. and S.L.; investigation, H.Z.; resources, S.L.; writing—original draft, J.S.; writing—review and editing, J.L.; supervision, L.L. and X.W.; project administration, H.Z., K.X., H.W., S.L., X.W. and H.G.; funding acquisition, P.Z., Z.W., K.X., L.L. and H.G. All authors have read and agreed to the published version of the manuscript.
Funding
The authors are grateful to the financial support from the National Natural Science Foundation of China (Grant Nos. 52474086, 52241602) and the CNPC Tarim Oilfield Research and Development Center Scientific Research Project (YF202506).
Data Availability Statement
The original contributions presented in this study are included in the article. Further inquiries can be directed to the corresponding author(s).
Conflicts of Interest
Author Hui Zhang, Penglin Zheng, Zhimin Wang, Ke Xu, Haiying Wang, Lei Liu, Shujun Lai, Xin Wang and Hongxiang Gao were employed by the company PetroChina Tarim Oilfield Company. The remaining authors declare that the research was conducted in the absence of any commercial or financial relationships that could be construed as potential conflicts of interest.
References
- Emenike, S.N.; Falcone, G. A review on energy supply chain resilience through optimization. Renew. Sustain. Energy Rev. 2020, 134, 110088. [Google Scholar] [CrossRef]
- Bakhtiari, M.; Shad, S.; Zivar, D.; Razaghi, N. Coupled hydro-mechanical analysis of underground gas storage at Sarajeh field, Qom formation, Iran. J. Nat. Gas Sci. Eng. 2021, 92, 103996. [Google Scholar] [CrossRef]
- Zou, C.; Yang, Z.; He, D.; Wei, Y.; Li, J.; Jia, A.; Chen, J.; Zhao, Q.; Li, Y.; Li, J.; et al. Theory, technology and prospects of conventional and unconventional natural gas. Pet. Explor. Dev. 2018, 45, 604–618. [Google Scholar] [CrossRef]
- Bachu, S.; Bonijoly, D.; Bradshaw, J.; Burruss, R.; Holloway, S.; Christensen, N.P.; Mathiassen, O.M. CO2 storage capacity estimation: Methodology and gaps. Int. J. Greenh. Gas Control. 2007, 1, 430–443. [Google Scholar] [CrossRef]
- Ma, X.; Zheng, D.; Shen, R.; Wang, C.; Luo, J.; Sun, J. Key technologies and practice for gas field storage facility construction of complex geological conditions in China. Pet. Explor. Dev. 2018, 45, 507–520. [Google Scholar] [CrossRef]
- Zheng, Y.; Sun, J.; Qiu, X.; Lai, X.; Liu, J.; Guo, Z.; Wei, H.; Min, Z. Connotation and evaluation technique of geological integrity of UGSs in oil/gas fields. Nat. Gas Ind. B 2020, 7, 594–603. [Google Scholar] [CrossRef]
- Sun, J.; Xu, H.; Wang, J.; Shi, L.; Li, C.; Tang, L.; Zhong, R. Injection–production mechanisms and key evaluation technologies for underground gas storages rebuilt from gas reservoirs. Nat. Gas Ind. B 2018, 5, 616–622. [Google Scholar] [CrossRef]
- Ding, G.; Li, C.; Wang, J.; Xu, H.; Zheng, Y.; Wanyan, Q.; Zhao, Y. The status quo and technical development direction of underground gas storages in China. Nat. Gas Ind. B 2015, 2, 535–541. [Google Scholar] [CrossRef]
- Ma, X.; Zheng, D.; Ding, G.; Wang, J. “Extreme utilization” theory and practice in gas storages with complex geological conditions. Pet. Explor. Dev. 2023, 50, 419–432. [Google Scholar] [CrossRef]
- Song, R.; Wu, M.; Liu, J.; Yang, C. Pore scale modeling on microbial hydrogen consumption and mass transfer of multicomponent gas flow in underground hydrogen storage of depleted reservoir. Energy 2024, 306, 132534. [Google Scholar] [CrossRef]
- Xu, Q.; Liu, H.; Song, Z.; Dong, S.; Zhang, L.; Zhang, X. Dynamic risk assessment for underground gas storage facilities based on Bayesian network. J. Loss Prev. Process Ind. 2023, 82, 104961. [Google Scholar] [CrossRef]
- Altmann, J.B.; Müller, B.I.R.; Müller, T.M.; Heidbach, O.; Tingay, M.; Weißhardt, A. Pore pressure stress coupling in 3D and consequences for reservoir stress states and fault reactivation. Geothermics 2014, 52, 195–205. [Google Scholar] [CrossRef]
- Zhao, N.; Wang, L.; Sima, L.; Guo, Y.; Zhang, H. Understanding stress-sensitive behavior of pore structure in tight sandstone reservoirs under cyclic compression using mineral, morphology, and stress analyses. J. Pet. Sci. Eng. 2022, 218, 110987. [Google Scholar] [CrossRef]
- Farahani, M.; Aghaei, H.; Masoumi, H. Effect of pore type on porosity, permeability and pore volume compressibility of geological formations due to in-situ stress change. J. Pet. Sci. Eng. 2022, 218, 110986. [Google Scholar] [CrossRef]
- Deng, G.; Zhou, J.; Tian, S.; Xian, X.; Zhou, L.; Zhang, C.; Li, S.; Tan, Y. Pore structure changes and its stress-sensitive behavior in sandstone under cyclic stress: Implication for underground gas storage. Gas Sci. Eng. 2023, 119, 205130. [Google Scholar] [CrossRef]
- Mi, L.; Guo, Y.; Li, Y.; Zeng, D.; Lu, C.; Zhang, G. Evaluation of the dynamic sealing performance of cap rocks of underground gas storage under multi-cycle alternating loads. Energy Geosci. 2024, 5, 100319. [Google Scholar] [CrossRef]
- Gao, Y.; Feng, X.-T. Study on damage evolution of intact and jointed marble subjected to cyclic true triaxial loading. Eng. Fract. Mech. 2019, 215, 224–234. [Google Scholar] [CrossRef]
- Xia, D.; Liu, H.; Liu, J.; Guo, Y.; Liu, M.; Qiu, X.; Li, H.; Tan, H.; Lu, J. Study on the Evolution of Mechanical Properties and Acoustic Emission of Medium-Permeability Sandstone under Multi-Level Cyclic Loading Stress Paths. Processes 2024, 12, 1773. [Google Scholar] [CrossRef]
- Wang, S.; Xu, W.; Sun, M.; Wang, W. Experimental investigation of the mechanical properties of fine-grained sandstone in the triaxial cyclic loading test. Environ. Earth Sci. 2019, 78, 416. [Google Scholar] [CrossRef]
- Gao, M.; Xie, J.; Gao, Y.; Wang, W.; Li, C.; Yang, B.; Liu, J.; Xie, H. Mechanical behavior of coal under different mining rates: A case study from laboratory experiments to field testing. Int. J. Min. Sci. Technol. 2021, 31, 825–841. [Google Scholar] [CrossRef]
- Zhou, Y.; Sheng, Q.; Li, N.; Fu, X. The relationship between dynamic strength and strain rate and damage to rock materials subjected to dynamic cyclic loading. Geomech. Geophys. Geo-Energy Geo-Resour. 2021, 7, 88. [Google Scholar] [CrossRef]
- Sui, W.; Hou, Y.; Cheng, Z. Microscopic Stress Sensitivity Analysis with In Situ SEM Study and Digital Core Deformation Simulation. Geofluids 2021, 2021, 6663616. [Google Scholar] [CrossRef]
- Hu, M.; Xu, W.; Wang, H.; Ning, Y.; Wang, R.; Lyu, C.; Zhang, T. Deformation characteristics of muddy sandstones during cyclic loading and unloading with different stress lower limits under pore pressure. Int. J. Fatigue 2023, 172, 107606. [Google Scholar] [CrossRef]
- Wang, M.; Li, J.; Tan, H.; Wang, J.; Shi, Z.; Li, K. Study on fatigue characteristics and thermal damage mechanism of red sandstone under high temperature-cyclic load coupling. Int. J. Fatigue 2023, 168, 107405. [Google Scholar] [CrossRef]
- Zhou, J.; Deng, G.; Tian, S.; Xian, X.; Yang, K.; Zhang, C.; Dong, Z. Experimental study on the permeability variation of sandstone at cyclic stress: Implication for underground gas storage. J. Energy Storage 2023, 60, 106677. [Google Scholar] [CrossRef]
- Li, X.; Liu, Z.; Feng, X.; Zhang, H.; Feng, J. Effects of Acid Sulfate and Chloride Ion on the Pore Structure and Mechanical Properties of Sandstone Under Dynamic Loading. Rock Mech. Rock Eng. 2021, 54, 6105–6121. [Google Scholar] [CrossRef]
- Song, R.; Feng, D.; Hui, G.; Liu, J.; Yang, C. Visualized experiments on the hydrogen transports and bubble ripening mechanism in porous reservoir of underground hydrogen storage. Int. J. Hydrog. Energy 2025, 105, 326–344. [Google Scholar] [CrossRef]
- Tooseh, E.K.; Jafari, A.; Teymouri, A. Gas-water-rock interactions and factors affecting gas storage capacity during natural gas storage in a low permeability aquifer. Pet. Explor. Dev. 2018, 45, 1123–1128. [Google Scholar] [CrossRef]
- Song, R.; Song, Y.; Liu, J.; Yang, C. Multiscale experimental and numerical study on hydrogen diffusivity in salt rocks and interlayers of salt cavern hydrogen storage. Int. J. Hydrog. Energy 2024, 79, 319–334. [Google Scholar] [CrossRef]
- Song, Y.; Song, R.; Liu, J.; Yang, C. Evaluation on H2, N2, He & CH4 diffusivity in rock and leakage rate by diffusion in underground gas storage. Int. J. Hydrog. Energy 2025, 100, 234–248. [Google Scholar]
- Juanes, R.; Spiteri, E.J.; Orr, F.M., Jr.; Blunt, M.J. Impact of relative permeability hysteresis on geological CO2 storage. Water Resour. Res. 2006, 42. [Google Scholar] [CrossRef]
- Shi, L.; Wang, J.-m.; Liao, G.-z.; Xiong, W.; Gao, S.-S. Mechanism of gas-water flow at pore-level in aquifer gas storage. J. Cent. South Univ. 2013, 20, 3620–3626. [Google Scholar] [CrossRef]
- Zhu, S.; Sun, J.; Wei, G.; Zheng, D.; Wang, J.; Shi, L.; Liu, X. Numerical simulation-based correction of relative permeability hysteresis in water-invaded underground gas storage during multi-cycle injection and production. Pet. Explor. Dev. 2021, 48, 190–200. [Google Scholar] [CrossRef]
- Fan, X.; He, L.; Zhang, Q.; Zhao, P.; Zhang, M.; Yao, B.; Ran, J.; Song, J.; Li, K. Effect of hydration on Pore Structure and Physical Properties of Permian Basalt and tuff in Sichuan Basin during pressurized imbibition. J. Pet. Sci. Eng. 2022, 213, 110322. [Google Scholar] [CrossRef]
- Noël, C.; Baud, P.; Violay, M. Effect of water on sandstone’s fracture toughness and frictional parameters: Brittle strength constraints. Int. J. Rock Mech. Min. Sci. 2021, 147, 104916. [Google Scholar] [CrossRef]
- Tang, S.B.; Yu, C.Y.; Heap, M.J.; Chen, P.Z.; Ren, Y.G. The Influence of Water Saturation on the Short- and Long-Term Mechanical Behavior of Red Sandstone. Rock Mech. Rock Eng. 2018, 51, 2669–2687. [Google Scholar] [CrossRef]
- Heap, M.J.; Harnett, C.; Farquharson, J.; Baud, P.; Rosas-Carbajal, M.; Komorowski, J.-C.; Violay, M.E.; Gilg, H.A.; Reuschlé, T. The influence of water-saturation on the strength of volcanic rocks and the stability of lava domes. J. Volcanol. Geotherm. Res. 2023, 444, 107962. [Google Scholar] [CrossRef]
- Heap, M.J.; Villeneuve, M.; Kushnir, A.R.L.; Farquharson, J.I.; Baud, P.; Reuschlé, T. Rock mass strength and elastic modulus of the Buntsandstein: An important lithostratigraphic unit for geothermal exploitation in the Upper Rhine Graben. Geothermics 2019, 77, 236–256. [Google Scholar] [CrossRef]
- Tixier, M.P.; Loveless, G.W.; Anderson, R.A. Estimation of Formation Strength from the Mechanical-Properties Log. J. Pet. Technol. 1975, 27, 283–293. [Google Scholar] [CrossRef]
- Li, X.; Feng, Y.; Gray, K.E. A hydro-mechanical sand erosion model for sand production simulation. J. Pet. Sci. Eng. 2018, 166, 208–224. [Google Scholar] [CrossRef]
- Guo, M.; Liu, H.; Wang, Y.; Zhang, H.; Wang, J.; Dong, X. Sand production by hydraulic erosion during multicycle steam stimulation: An analytical study. J. Pet. Sci. Eng. 2021, 201, 108424. [Google Scholar] [CrossRef]
- Salahi, A.; Dehghan, A.N.; Sheikhzakariaee, S.J.; Davarpanah, A. Sand production control mechanisms during oil well production and construction. Pet. Res. 2021, 6, 361–367. [Google Scholar] [CrossRef]
- Chen, Y.; Sun, X.; Yan, T.; Yao, D.; Duan, R. Experimental study on micron-sized sand particles transport in the water flow path of hydrates production wellbore. J. Nat. Gas Sci. Eng. 2020, 73, 103088. [Google Scholar] [CrossRef]
- Kneafsey, T.J.; Tomutsa, L.; Moridis, G.J.; Seol, Y.; Freifeld, B.M.; Taylor, C.E.; Gupta, A. Methane hydrate formation and dissociation in a partially saturated core-scale sand sample. J. Pet. Sci. Eng. 2007, 56, 108–126. [Google Scholar] [CrossRef]
- O’Connor, R.i.M.; Torczynski, J.R.; Preece, D.S.; Klosek, J.T.; Williams, J.R. Discrete element modeling of sand production. Int. J. Rock Mech. Min. Sci. 1997, 34, 231.e1–231.e15. [Google Scholar] [CrossRef]
- Khamitov, F.; Minh, N.H.; Zhao, Y. Coupled CFD–DEM numerical modelling of perforation damage and sand production in weak sandstone formation. Geomech. Energy Environ. 2021, 28, 100255. [Google Scholar] [CrossRef]
- Khamitov, F.; Minh, N.H.; Zhao, Y. Numerical investigation of sand production mechanisms in weak sandstone formations with various reservoir fluids. Int. J. Rock Mech. Min. Sci. 2022, 154, 105096. [Google Scholar] [CrossRef]
- Rakhimzhanova, A.; Thornton, C.; Amanbek, Y.; Zhao, Y. Numerical simulations of sand production in oil wells using the CFD-DEM-IBM approach. J. Pet. Sci. Eng. 2022, 208, 109529. [Google Scholar] [CrossRef]
- Song, R.; Xie, R.; Zhang, P.; Pei, G.; Liu, J.; Wan, X. Critical drawdown pressure prediction for sanding production of underground gas storage in a depleted reservoir in China. Energy Sci. Eng. 2023, 11, 4287–4301. [Google Scholar] [CrossRef]
- Song, R.; Zhang, P.; Tian, X.; Huang, F.; Li, Z.; Liu, J. Study on Critical Drawdown Pressure of Sanding for Wellbore of Underground Gas Storage in a Depleted Gas Reservoir. Energies 2022, 15, 5913. [Google Scholar] [CrossRef]
- Huang, X.; Li, S.; Jin, Y.; Yang, D.; Su, G.; He, X. Analysis on the influence of Poisson’s ratio on brittle fracture by applying uni-bond dual-parameter peridynamic model. Eng. Fract. Mech. 2019, 222, 106685. [Google Scholar] [CrossRef]
- Li, X.; Li, L.; Yan, Y.; Qi, C. A micro-macro fracture model for evaluating the brittle-ductile transition and rockburst of rock in true triaxial compression. Int. J. Rock Mech. Min. Sci. 2025, 186, 105993. [Google Scholar] [CrossRef]
- Li, H.; Pel, L.; You, Z.; Smeulders, D. Stress-dependent instantaneous cohesion and friction angle for the Mohr–Coulomb criterion. Int. J. Mech. Sci. 2024, 283, 109652. [Google Scholar] [CrossRef]
- Chen, J.; Du, C.; Jiang, D.; Fan, J.; He, Y. The mechanical properties of rock salt under cyclic loading-unloading experiments. Geomech. Eng. 2016, 10, 325–334. [Google Scholar] [CrossRef]
- Roberts, L.A.; Buchholz, S.A.; Mellegard, K.D.; Düsterloh, U. Cyclic Loading Effects on the Creep and Dilation of Salt Rock. Rock Mech. Rock Eng. 2015, 48, 2581–2590. [Google Scholar] [CrossRef]
- Trzeciak, M.; Sone, H. Polyaxial failure criteria for in situ stress analysis using borehole breakouts: Review of existing methods and development of an empirical alternative. Int. J. Rock Mech. Min. Sci. 2024, 182, 105864. [Google Scholar] [CrossRef]
- Drucker, D.C.; Prager, W. Soil mechanics and plastic analysis or limit design. Q. Appl. Math. 1952, 10, 157–165. [Google Scholar] [CrossRef]
- Hoek, E.; Carranza-Torres, C.; Corkum, B. Hoek-Brown failure criterion-2002 edition. Proc. NARMS-Tac 2002, 1, 267–273. [Google Scholar]
- Ewy, R.T. Wellbore-Stability Predictions by Use of a Modified Lade Criterion. SPE Drill. Complet. 1999, 14, 85–91. [Google Scholar] [CrossRef]
- Trzeciak, M.; Sone, H. Critical review of the Mogi failure criterion based on true-triaxial laboratory data analysis and theoretical considerations. Int. J. Rock Mech. Min. Sci. 2022, 159, 105220. [Google Scholar] [CrossRef]
Disclaimer/Publisher’s Note: The statements, opinions and data contained in all publications are solely those of the individual author(s) and contributor(s) and not of MDPI and/or the editor(s). MDPI and/or the editor(s) disclaim responsibility for any injury to people or property resulting from any ideas, methods, instructions or products referred to in the content. |
© 2025 by the authors. Licensee MDPI, Basel, Switzerland. This article is an open access article distributed under the terms and conditions of the Creative Commons Attribution (CC BY) license (https://creativecommons.org/licenses/by/4.0/).