


Error in Figure 7a
In the original publication [1], there was a mistake in Figure 7 as published. “As the copyright of Figure 7a was not obtained, it was deleted after publication”. The corrected Figure 7 appears below.
Figure 7.
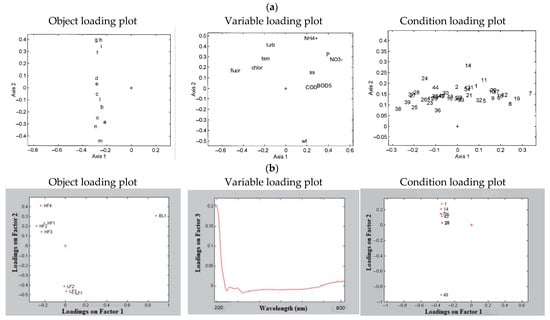
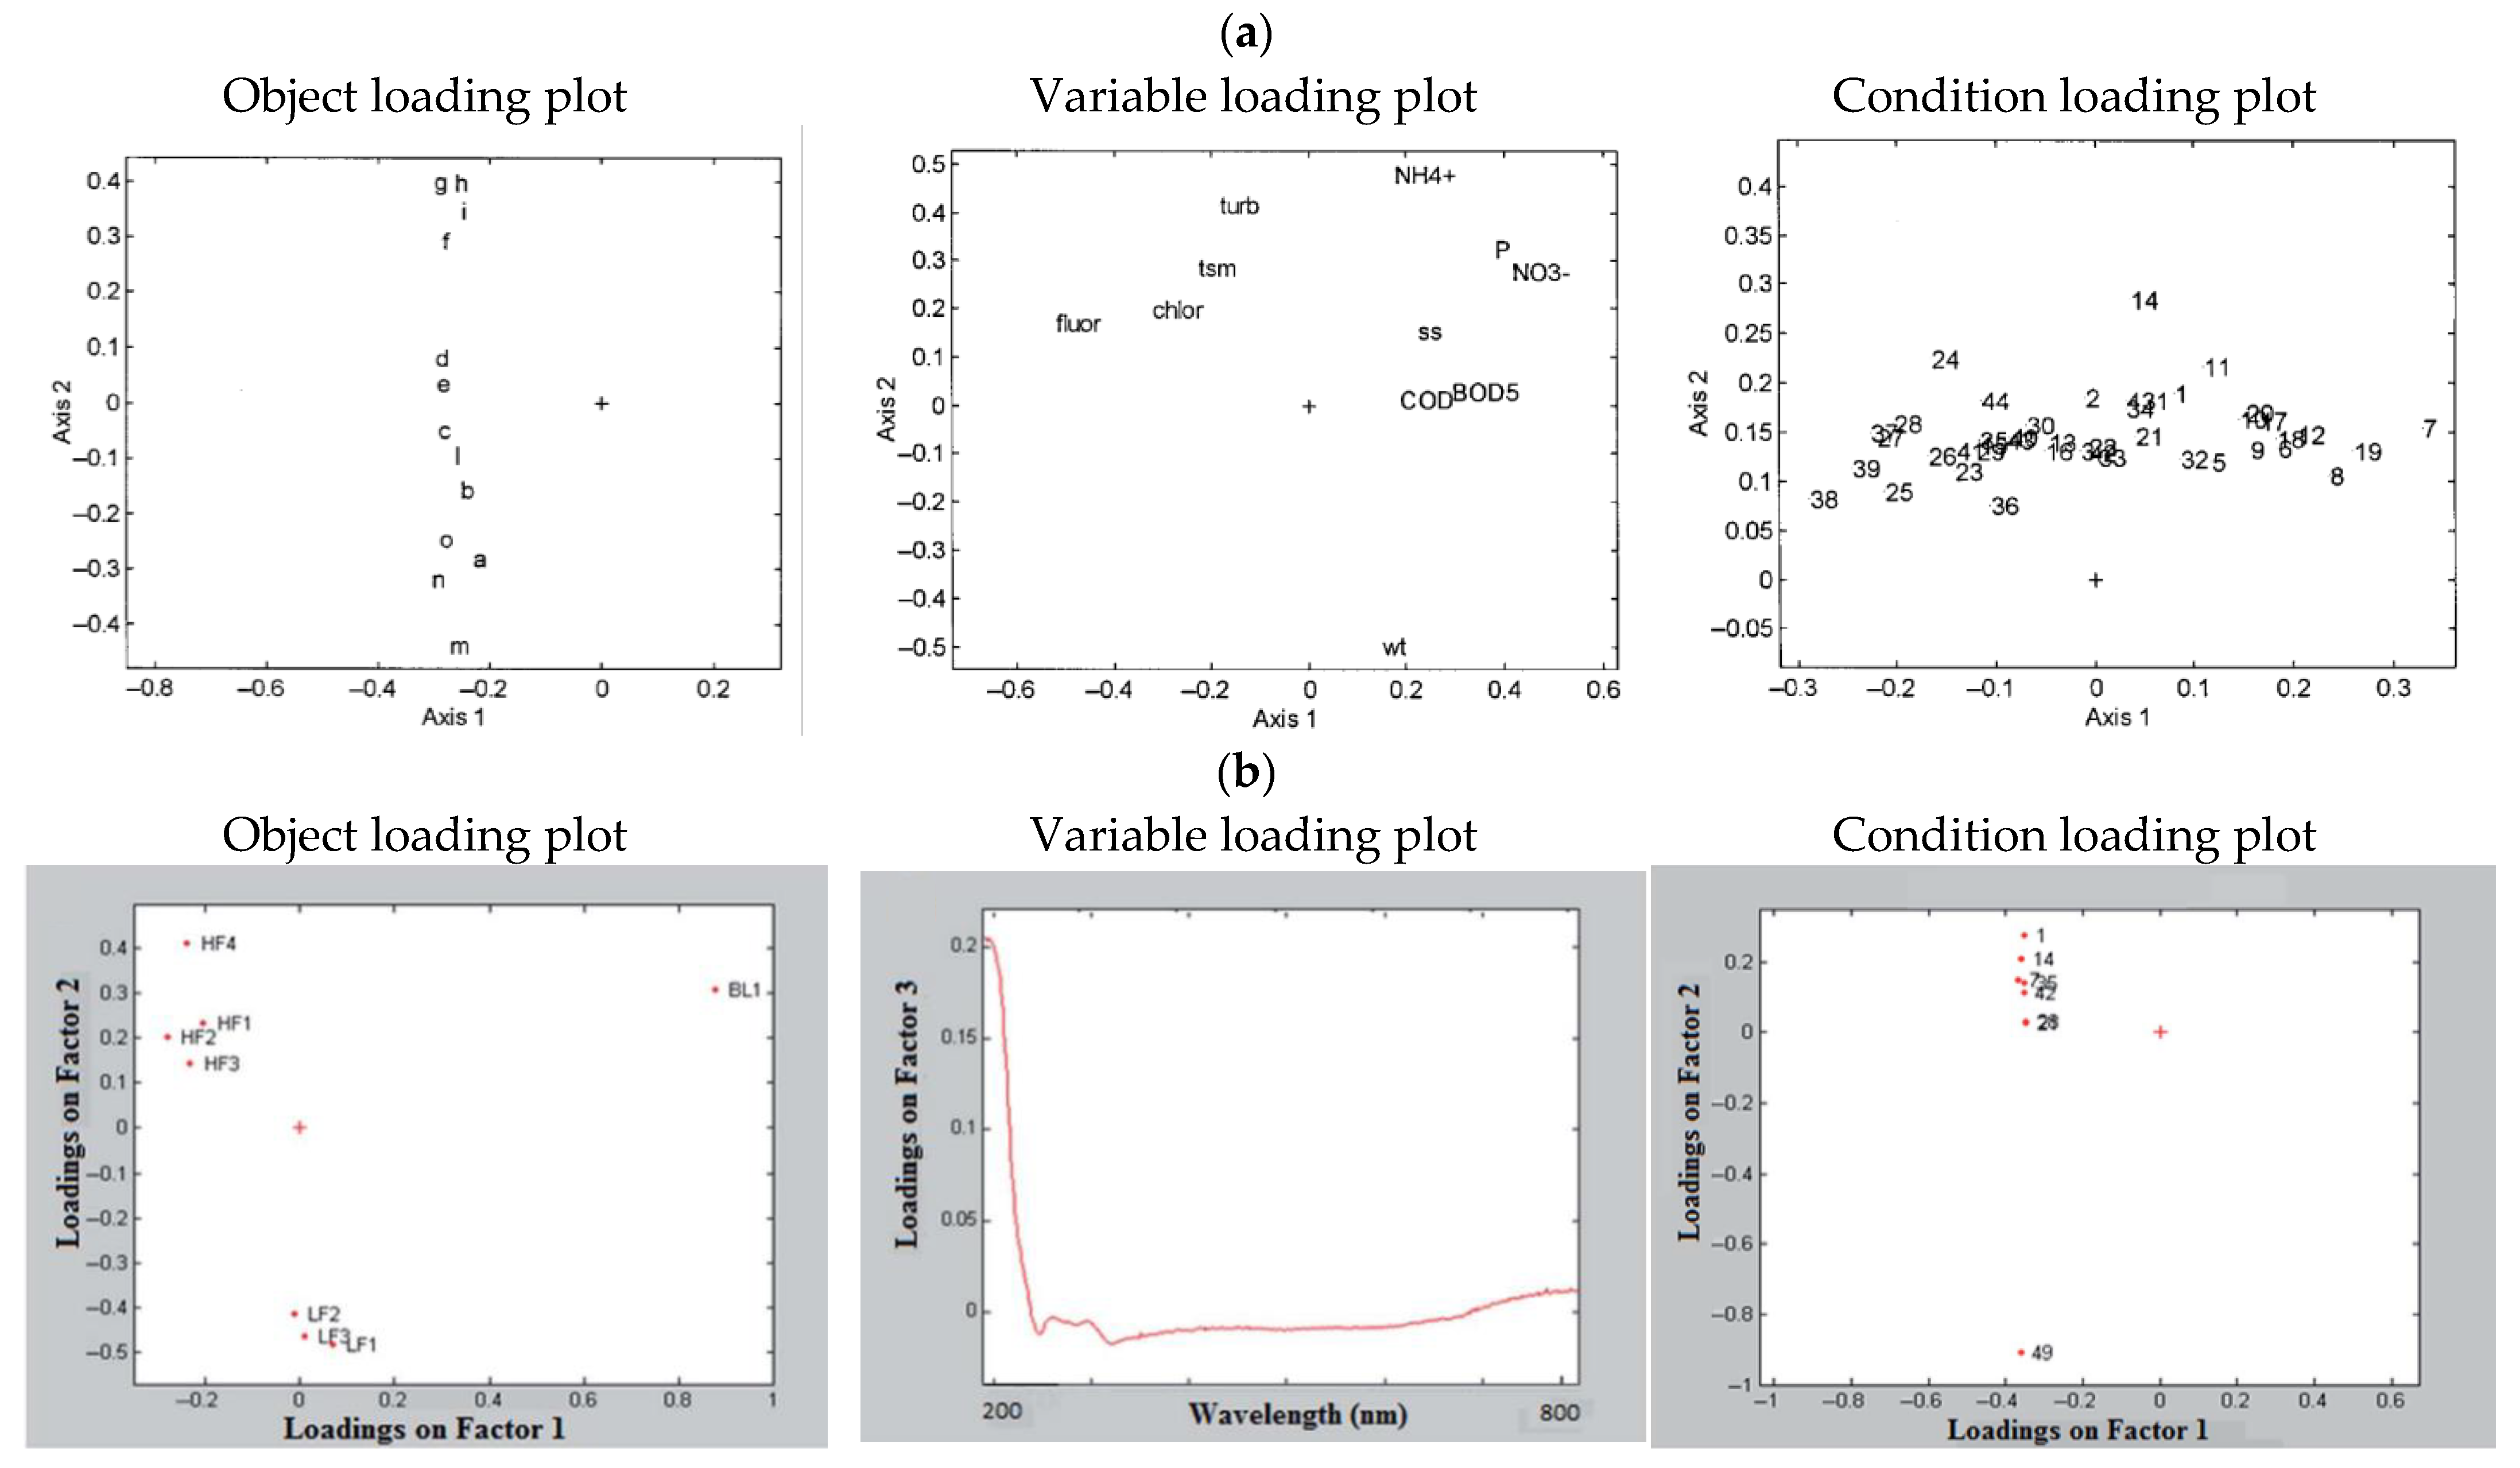
Examples of object, variable, and condition loading plots for Tucker 3 models reported in the literature. (a) [2 2 2] Tucker 3 in Leardi et al. [16]. (b) [3 3 2] Tucker 3 in Aliakbarian et al. [20].
Text Correction
Due to the deletion of Figure 7a, the text before and after Figure 7 has been modified.
A correction has been made to “2.3.2”, “Loading Analysis”:
To help the reader understand loading analysis, the loading plots for some of the Tucker 3 models discussed in Figure 6 are presented in Figure 7 and commented on, just from a data treatment point of view. In the first case from Leardi et al. (Figure 7a), the loading plots are presented separately but, in this case, this decision is probably due to visualization simplicity related to the numerosity of objects, variables, and conditions, since the core matrix is perfectly diagonal and allows triplot interpretation. Nevertheless, the objects and conditions here are perfectly independent, being described by Axis 2 and 1, respectively. Variables coded as NH4+, turb, and wt are mainly responsible for object distinction, while fluor, P, and NO3− are for condition separation; still referring to variables, we can also distinguish two main groups of correlated parameters (fluor, chlor, tsm, turb and NH4+, P, NO3−, ss, COD, BOD5) and a completely separated one (wt).
The following example by Aliakbarian et al. [20] is a bit more complex. Loadings are presented as separated for both diagonality and visualization issues: in fact, here, the variables consist of UV–Vis spectra, and therefore, a line plot is preferrable over a scatter one to facilitate the interpretation, as presented in Figure 7b. Objects are separated along both axes in three main groups (BL, LF, and HF) but the variable loading along the corresponding axes is not reported, so the reason behind this separation cannot be determined (actually, it is not interesting and quite obviously in the investigation). One of the conditions is perfectly separated from the others along Axis 2: the reason behind this separation must be found in the variable loading on Axis 3, since the core matrix shows that the conditions’ Axis 2 is mainly correlated with the variables’ Axis 3. We can thus conclude that separation relies on absorbance values in the region up to 230 nm.
The authors state that the scientific conclusions are unaffected. This correction was approved by the Academic Editor. The original publication has also been updated.
Reference
- Guembe-Garcia, M.; Magnaghi, L.R.; Franceschi, G.E.; Bova, A.; Biesuz, R. Multi-Way Data Analysis Nowadays: Taking Advanced Chemometric Tools to Everyday Analytical Chemistry Applications. Chemosensors 2026, 14, 37. [Google Scholar] [CrossRef] [Scilit]
Disclaimer/Publisher’s Note: The statements, opinions and data contained in all publications are solely those of the individual author(s) and contributor(s) and not of MDPI and/or the editor(s). MDPI and/or the editor(s) disclaim responsibility for any injury to people or property resulting from any ideas, methods, instructions or products referred to in the content. |
© 2026 by the authors. Licensee MDPI, Basel, Switzerland. This article is an open access article distributed under the terms and conditions of the Creative Commons Attribution (CC BY) license.