


Abstract
Sensitive and on-site detection of pesticide residues remains a critical challenge for food safety, particularly in developing regions where rapid screening tools are urgently needed. Herein, we report a flexible surface-enhanced Raman scattering (SERS) platform based on triangular silver nanoplates (TSNPs) integrated onto a polydimethylsiloxane (PDMS) substrate, enabling sensitive and conformal detection of paraquat residues on agricultural surfaces. TSNPs were synthesized via a seed-mediated photochemical growth method and formulated into a TSNP ink, which was directly deposited onto oxygen-plasma-treated and thiol-functionalized PDMS substrates. Owing to the highly anisotropic geometry and sharp edges of TSNPs, the flexible SERS substrate exhibits strong localized surface plasmon resonance (LSPR) enhancement and mechanically stable electromagnetic hot spots. Systematic optimization of TSNP optical absorbance revealed that uniform nanoplate distribution and optimal hotspot density were achieved at an absorbance of 2.0. The SERS performance was evaluated using rhodamine 6G under front-side and back-side illumination configurations, demonstrating good signal reproducibility and a detection limit of approximately 10−5 M. Notably, back-side illumination through the PDMS layer provided superior SERS responses due to improved optical transmission and light–matter interaction. The practical applicability was further demonstrated through back-side SERS detection of paraquat on aluminum foil as a model surface, achieving a lowest detectable concentration of 5 × 10⁻⁶ M, followed by damage-free detection on Chinese pear peels. This work highlights a reliable and nondestructive flexible SERS platform for on-site pesticide residue monitoring.
1. Introduction
Agriculture plays a vital role in sustaining the global food supply, particularly in developing countries where agricultural productivity is closely tied to food security and economic stability [1,2,3]. To improve crop yield and reduce labor demands, agrochemicals—especially herbicides—are extensively used in routine farming practices [4,5]. Paraquat, a non-selective herbicide valued for its rapid action, high effectiveness, and low cost, remains widely applied in many developing regions despite increasing concerns over its severe toxicity. Improper handling and limited regulatory enforcement can lead to the accumulation of paraquat residues in agricultural products and the environment, posing significant risks to food safety, environmental sustainability, and public health [6,7,8,9]. Therefore, there is a pressing need for sensitive, rapid, and minimally invasive analytical techniques that enable on-site monitoring of paraquat residues in food and agricultural matrices, particularly in resource-limited settings [10].
Conventional analytical methods for pesticide residue determination, such as gas and liquid chromatography coupled with mass spectrometry (GC–MS and LC–MS), provide excellent sensitivity and accuracy [11,12,13]. However, these techniques rely on destructive sampling, complex sample preparation, and laboratory-based instrumentation, which restrict their applicability for rapid and on-site analysis [14,15]. To address these limitations, alternative approaches capable of rapid, sensitive, and nondestructive detection have attracted increasing attention. Among them, surface-enhanced Raman scattering (SERS) has emerged as a powerful spectroscopic technique that enables ultrasensitive molecular detection by amplifying Raman signals of analytes located in close proximity to plasmonic nanostructures, typically composed of noble metals such as silver (Ag), gold (Au), or copper (Cu). This enhancement primarily arises from LSPR-induced electromagnetic field amplification at nanoscale “hot spots,” with additional contributions from chemical charge-transfer interactions. In such chemical enhancement processes, electron transfer between adsorbed molecules and the metal surface can selectively amplify certain vibrational modes. However, because these interactions are often transient and adsorption-dependent, they may introduce signal variability; therefore, many practical SERS sensing platforms are designed to rely predominantly on electromagnetic enhancement for more uniform and reliable signal amplification [16]. For practical sensing applications, an effective SERS substrate must exhibit high enhancement efficiency, signal reproducibility, and compatibility with real-world sampling conditions [16,17,18]. Colloidal SERS substrates offer advantages in terms of simple synthesis and scalability but often suffer from poor signal uniformity and limited reproducibility due to the random distribution of hot spots. In contrast, solid-supported SERS substrates provide improved uniformity and reproducibility through well-defined nanostructures, yet they typically require destructive sampling and involve complex, costly fabrication processes. To address these challenges, increasing attention has been directed toward flexible SERS platforms, where mechanical adaptability and plasmonic tunability are recognized as integral components of sensing performance [16,19,20,21,22,23,24,25].
Early studies on flexible SERS substrates primarily focused on transferring the enhancement efficiency of rigid plasmonic architectures onto deformable supports, in which the substrate functioned largely as a passive carrier. However, emerging applications—including wearable sensing and conformal analysis on irregular or curved surfaces—necessitate SERS substrates that can operate reliably under continuous mechanical deformation. This shift has highlighted the critical role of substrate material selection. Accordingly, a variety of flexible supports, such as filter paper, cellulose, nanofiber mats, elastomers, and polymers, have been explored due to their mechanical compliance and scalable fabrication. Common polymer substrates including poly(methyl methacrylate) (PMMA), polyethylene terephthalate (PET), polyethylene (PE), and polydimethylsiloxane (PDMS) have been widely employed [23,24,25,26,27,28,29,30,31,32,33,34,35,36,37,38,39,40]. Nevertheless, the limited deformability of PMMA and PET restricts strain-induced plasmonic modulation, while PE, despite its high flexibility, offers limited control over nanostructure uniformity. In contrast, PDMS exhibits high and reversible mechanical compliance, enabling predictable deformation-driven modulation of interparticle spacing and LSPR behavior. Combined with its facile processing, low Raman background, chemical stability, and compatibility with noble metal nanostructures after surface modification, PDMS is particularly well suited as an active flexible platform for practical SERS applications [41,42,43,44].
Despite these advantages, the plasmonic architectures integrated onto PDMS have remained largely confined to simple or weakly anisotropic nanostructures. Previous studies have demonstrated flexible PDMS-based SERS substrates incorporating Ag nanoislands fabricated via replicated techniques and thermal evaporation [42,45], spherical Ag nanoparticles assembled through multi-step self-assembly strategies [23,46], porous Ag/Au hybrid materials [33,47], and Ag nanocubes formed by organic/water interfacial self-assembly [41]. However, to date, the integration of faceted and highly anisotropic plasmonic nanostructures capable of generating stronger and more tunable LSPR responses has not yet been demonstrated on PDMS platforms. Triangular silver nanoplates (TSNPs), which we have previously investigated [48], represent a distinctive class of plasmonic nanostructures, exhibiting three distinct LSPR modes arising from their sharp edges and tips. Their single-crystalline nature ensures mechanically robust and stable electromagnetic hot spots, while the exposed (110) facets provide energetically favorable adsorption sites for paraquat molecules, eliminating the need for auxiliary surface functionalization.
Herein, we report a TSNP-ink-based PDMS flexible SERS platform featuring high sensitivity, mechanical robustness, and dual-mode (front- and back-side) detection. TSNP colloids were synthesized via a photoirradiation method and formulated into a TSNP ink for direct deposition onto PDMS substrates pretreated by oxygen plasma and subsequent silanization with (3-mercaptopropyl)trimethoxysilane (MPTMS). The resulting flexible SERS substrate was systematically evaluated using rhodamine 6G (R6G) as a probe molecule and paraquat as a representative pesticide, with key analytical metrics including limit of detection (LOD), signal-to-noise ratio (SNR), and enhancement factor (EF) used to assess Raman enhancement capability, stability, and reproducibility. Finally, the practical applicability of the proposed platform was demonstrated through in situ, damage-free detection of paraquat residues on wheat husks, underscoring its potential for real-world, on-site sensing applications.
2. Materials and Methods
2.1. Materials
The chemical substances were obtained from the following suppliers: silver nitrate (AgNO3) from Polskie Odczynniki Chemiczne (POCH, Gliwice, Poland), trisodium citrate (Na3C6H5O7) from Ajax Finechem (Cherrybrook, NSW, Australia), sodium borohydride (NaBH4) from QReC (Asia) Sdn. Bhd. (Kuala Lumpur, Malaysia), paraquat dichloride (PQ) from Dr. Ehrenstorfer (Augsburg, Germany), deionized (DI) water from Green Synthesis and Application Laboratory (Bangkok, Thailand), DOWSIL™ 184 Silicone Elastomer Base and the curing agent from Dow Inc. (Midland, MI, USA), and (3-Mercaptopropyl) trimethoxysilane (MPTMS) (95%) from Sigma-Aldrich (St. Louis, MO, USA). Raman spectra were acquired using a Raman spectrometer (inVia, Renishaw plc, Wotton-under-Edge, Gloucestershire, United Kingdom). Data analysis was performed using Origin 9.0 (OriginLab Corporation, Northampton, MA, USA) and Microsoft Excel (Microsoft Corporation, Redmond, WA, USA).
2.2. Synthesis of Triangular Silver Nanoplates (TSNPs)
TSNPs were synthesized following a seed-mediated photochemical growth strategy adapted from a previously published protocol [48]. The synthesis process consisted of seed preparation, light-induced anisotropic growth, and post-synthesis purification. First, spherical silver nanoparticle seeds were prepared via aqueous chemical reduction. Deionized water (72.75 mL) was placed in a reaction vessel and stirred at 433 rpm. Subsequently, 0.75 mL of 0.01 M AgNO3 solution was introduced, followed by the addition of 0.75 mL of 0.3 M trisodium citrate solution. The mixture was allowed to react under continuous stirring for 30 min. Thereafter, 0.0375 mL of 0.008 M NaBH4 solution was added slowly to the mixture to initiate nucleation. Stirring continued for an additional 2 min until a pale-yellow colloid indicating seed formation was obtained. The resulting seed suspension was stored at 4 °C in the dark for 12 h prior to further use. For the growth of TSNPs, 20 mL of the seed solution was withdrawn and equilibrated at room temperature (25 °C) under light-protected conditions for approximately 2 h. The solution was then exposed to irradiation from high-pressure sodium lamps (FL, HPS-T 150W Rx7S; Luna, SC735, Bangkok, Thailand) with an incident power density of 130 mW cm−2. During irradiation, the reaction containers were positioned 13 cm from the lamp surface, and illumination was maintained for 1 h to induce anisotropic growth of the silver nanostructures. After completion of the photochemical process, the reaction mixture was purified by centrifugation to separate triangular nanoplates from residual spherical nanoparticles. Aliquots of 1.5 mL were transferred into individual microcentrifuge tubes and centrifuged at 15,000 rpm for 15 min using a high-speed tabletop centrifuge (UGAIYA Bio-Sciences Co., Ltd (Hirakata, Osaka, Japan). Following centrifugation, 1.4 mL of the supernatant was carefully removed, leaving approximately 0.1 mL of the precipitation. The collected TSNP pellets were combined and redispersed in deionized water. The final suspension was diluted to achieve a consistent optical absorbance prior to subsequent characterization and application.
2.3. Preparing of PDMS Flexible Substrate
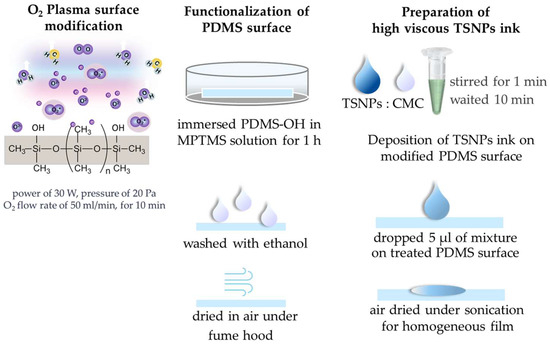
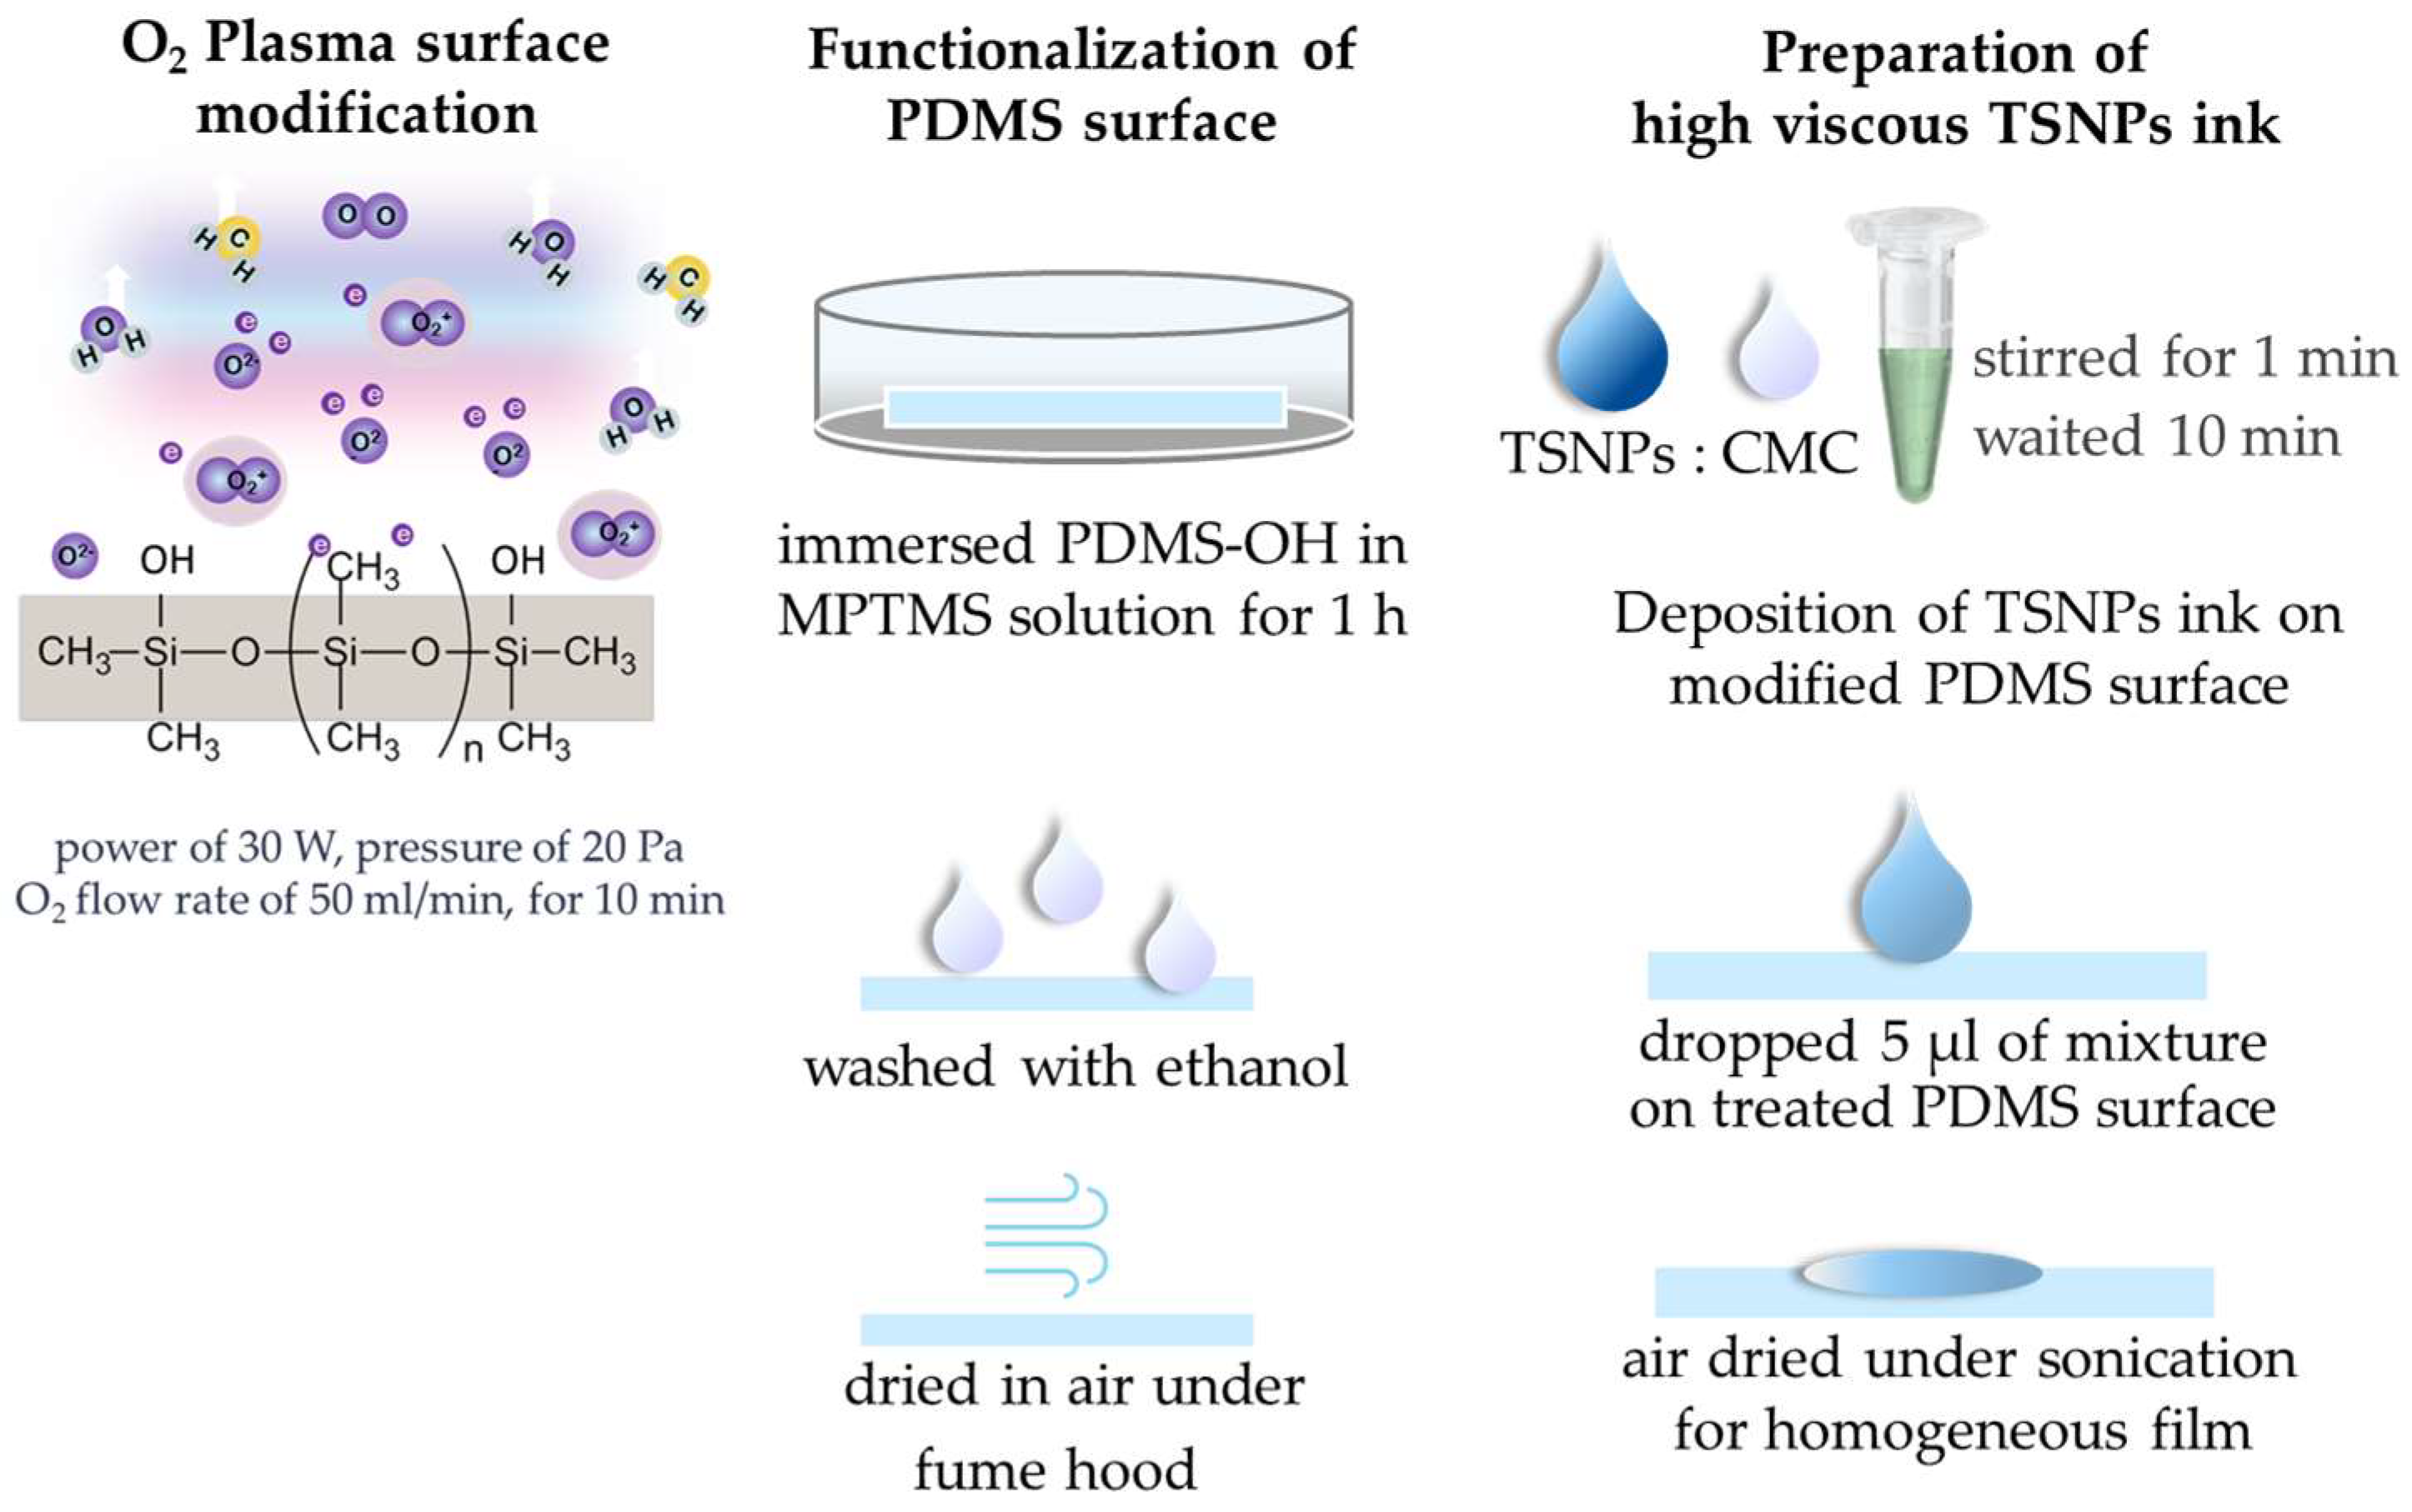
PDMS was selected as a transparent and flexible supporting substrate. The mechanical and optical properties of PDMS films with different thicknesses were systematically evaluated. The fabrication process of the PDMS substrates is schematically presented in Figure 1. Briefly, the silicone elastomer base was blended with the curing agent at a weight ratio of 5:1, and the homogeneous mixture was poured into rectangular molds (1.5 × 6.5 cm2) with various border heights to control the film thickness. The filled molds were placed in a vacuum chamber to remove trapped air bubbles and subsequently cured in an oven at 55 °C for 90 min. After curing, the PDMS films were cut into pieces with dimensions of 1 × 1.5 cm2. To activate the surface, the PDMS substrates were treated with oxygen atmospheric plasma at a power of 30 W for 10 min, followed by immediate immersion in a 0.5% (v/v) MPTMS solution for 1 h at room temperature to introduce thiol functional groups onto the surface. The functionalized PDMS substrates were then rinsed thoroughly with ethanol and dried in air. Finally, TSNP inks prepared under different conditions were drop-cast onto the modified PDMS surfaces as shown in Figure 2.
Figure 1.
Preparation of PDMS substrates.
Figure 2.
Surface functionalization of PDMS substrates and TSNP ink deposition.
2.4. Fabrication of TSNP-Based Flexible SERS Substrates with Controlled Optical Absorbance
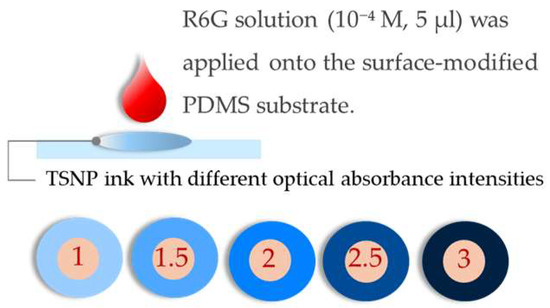
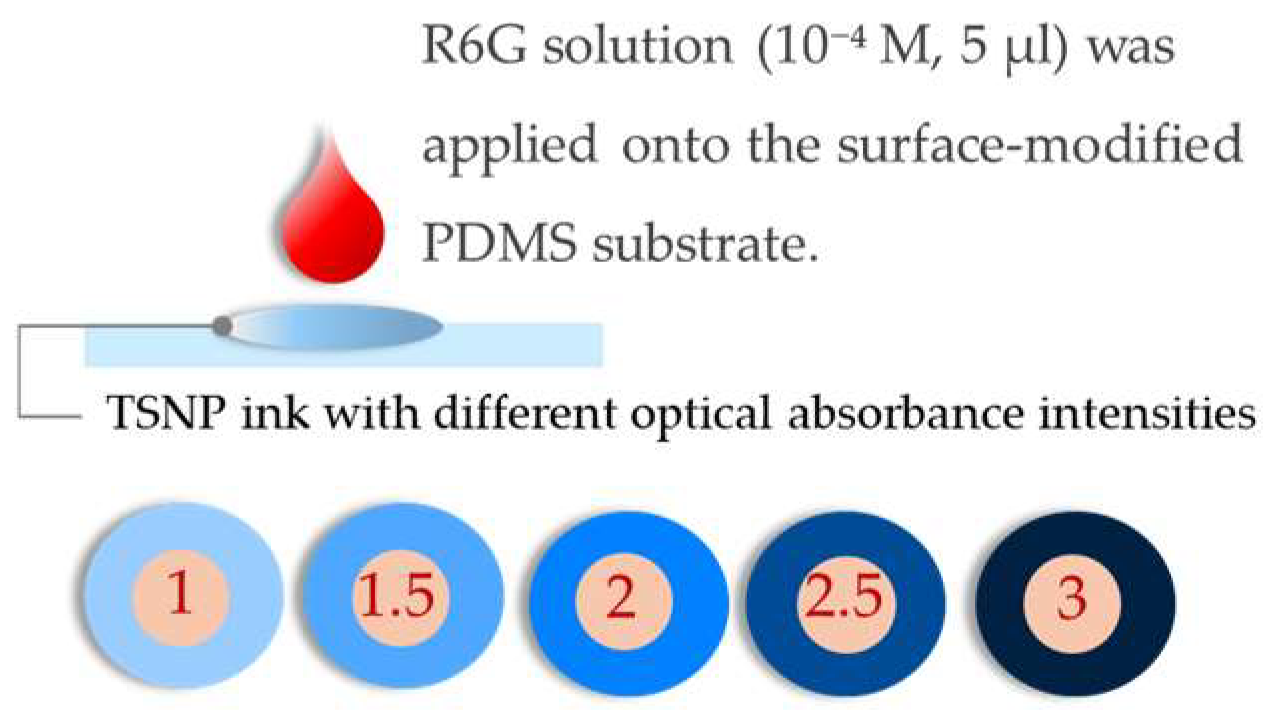
The step-by-step deposition of TSNP ink onto the modified PDMS substrates is schematically illustrated in Figure 3. The optical properties of the synthesized TSNP colloid were systematically characterized prior to ink preparation and deposition onto the PDMS substrates. For each synthesis batch, the colloidal solution was adjusted to ensure that the maximum LSPR absorption peak was centered at 660 nm. TSNP colloidal solutions with optical absorbance values of 1.0, 1.5, 2.0, 2.5, and 3.0 were subsequently blended with carboxymethyl cellulose (CMC) at a volume ratio of 3:1 to intentionally vary the nanoparticle concentration and investigate its influence on plasmonic coupling and hotspot formation. The resulting mixtures were agitated for 1 min to obtain well-dispersed TSNP inks, followed by the dropwise deposition of 5 μL onto the PDMS substrates and drying under ultrasonic-assisted airflow. Field-emission scanning electron microscopy (FESEM) was employed to examine the surface morphology and dispersion behavior of TSNPs on the PDMS substrates prepared using different absorbance levels. To evaluate the SERS performance, 2 μL of R6G (10−4 M) was dropwise applied onto each TSNP/PDMS substrate prior to Raman measurements. Raman spectra were collected using a 785 nm laser with an excitation power of 3.2 mW, a 50× objective lens, and an integration time of 5 s. A total of 343 spectra were randomly acquired from two independent samples under each condition. The optimal absorbance of the TSNP colloid for flexible SERS substrate fabrication was determined by correlating the FESEM observations with the corresponding SERS enhancement performance. To quantitatively evaluate the Raman signal quality, enhancement capability, and measurement reproducibility, the SNR, EF, and RSD were calculated as described below.
Figure 3.
Deposition of TSNP inks with varying optical absorbance levels.
The SNR was calculated as the ratio between the intensity of the primary characteristic Raman peak of the analyte and the baseline intensity estimated from a spectral region where no characteristic Raman bands were present. Reliable detection was considered when SNR ≥ 3, following the commonly adopted detection criterion in Raman and SERS analyses, and the LOD was therefore defined as the lowest analyte concentration that yielded a detectable Raman signal with SNR ≥ 3 [49,50,51].
The EF was calculated according to
where is the Raman intensity of the selected characteristic peak obtained from the analyte on the SERS substrate, is the Raman intensity of the same peak obtained from the conventional Raman measurement of the analyte, and and denote the analyte concentrations used in the SERS and normal Raman measurements, respectively [17,52].
The reproducibility of the SERS measurements was further evaluated using the relative standard deviation (RSD) of the primary Raman peak intensity, calculated as
where SD represents the standard deviation of the primary Raman peak intensity and denotes the average intensity of the primary Raman peak obtained from multiple spectra [53].
2.5. Performance of TSNP Flexible SERS Substrate
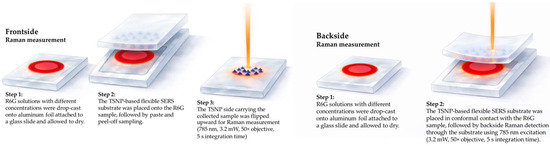
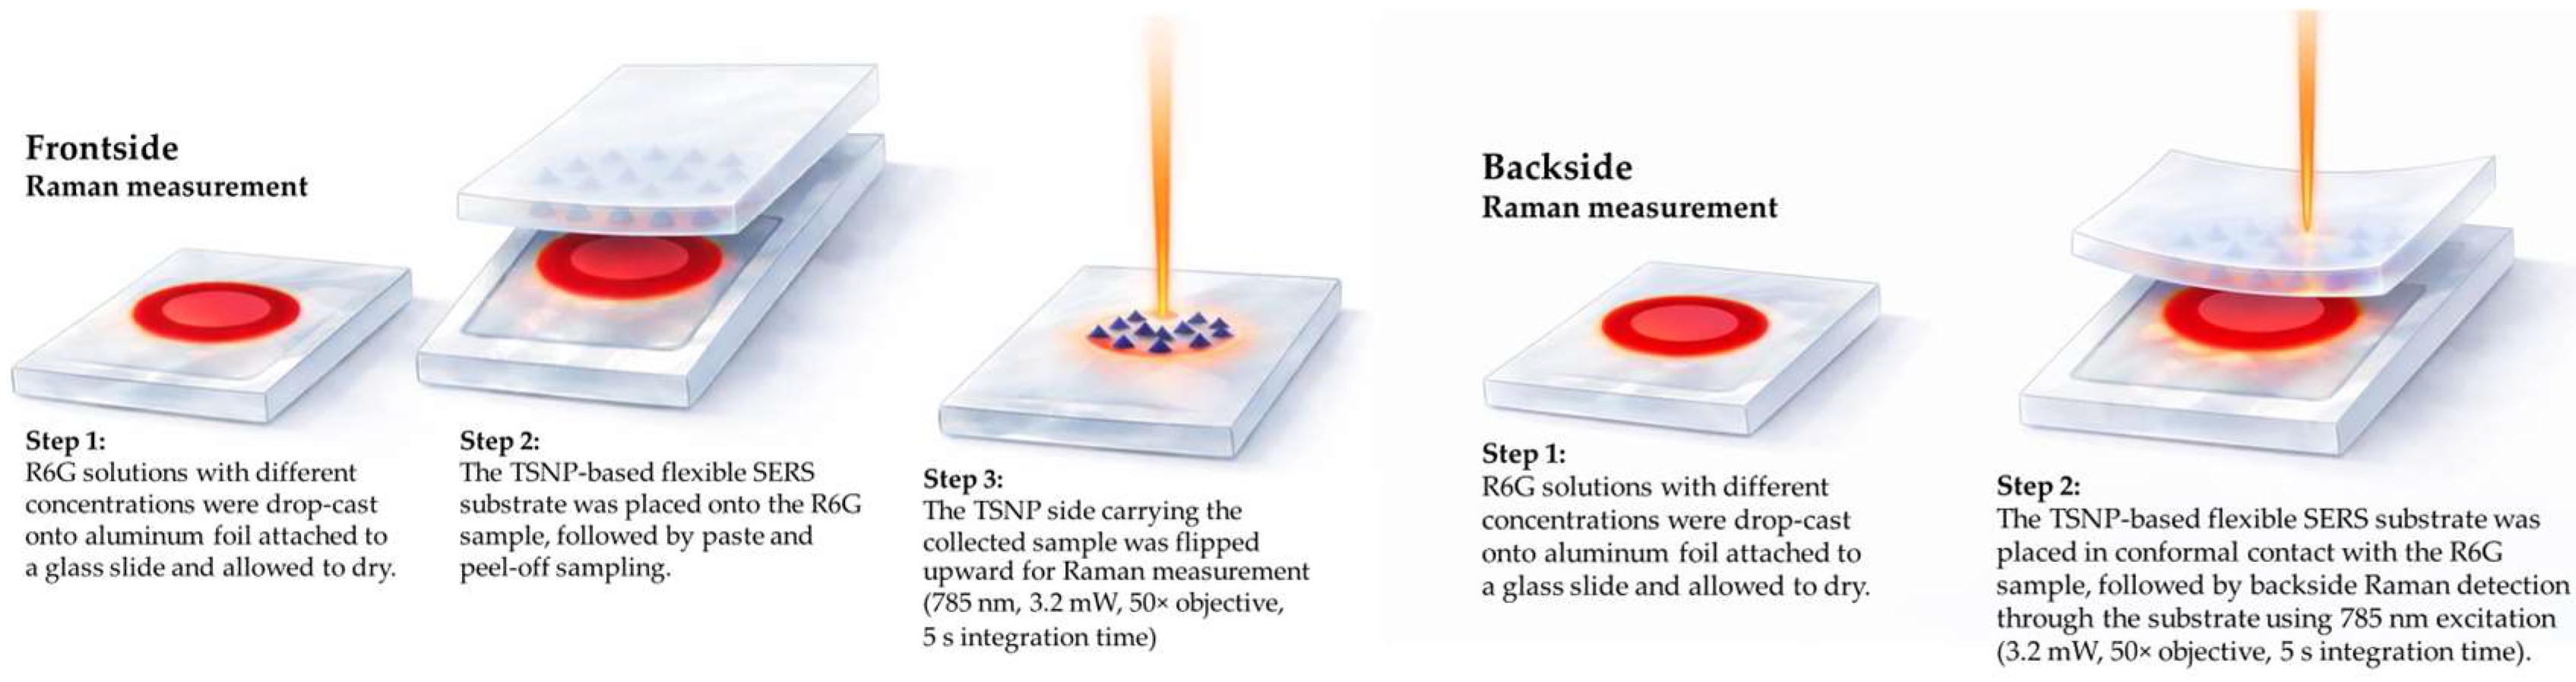
The SERS performance of the TSNP-based flexible substrate was systematically investigated using R6G deposited on aluminum foil under front-side and back-side Raman measurement configurations (Figure 4). R6G solutions with concentrations of 10−3, 5 × 10⁻⁴, 10−4, 5 × 10⁻⁵, and 10−5 M (5 μL) were drop-cast onto aluminum foil substrates and allowed to dry under ambient conditions. For front-side measurements, the TSNP flexible SERS substrate was first laminated onto the R6G-coated surface, subsequently peeled off, inverted, and then subjected to Raman analysis. In contrast, for back-side measurements, the TSNP flexible SERS substrate was directly laminated onto the R6G-coated surface with the TSNP-decorated side in direct contact with the analyte. Spectral acquisition was performed using a 785 nm excitation laser with a power of 3.2 mW, a 50× objective lens, and an integration time of 5 s. For each concentration, 50 spectra were randomly collected from two independent samples. The averaged spectra were used to calculate the SNR and EF, based on which the sensitivity and reproducibility of the substrate were evaluated.
Figure 4.
Illustration of front-side and back-side Raman measurement setups for the TSNP-based flexible substrate.
2.6. Application of TSNP Flexible SERS Substrate
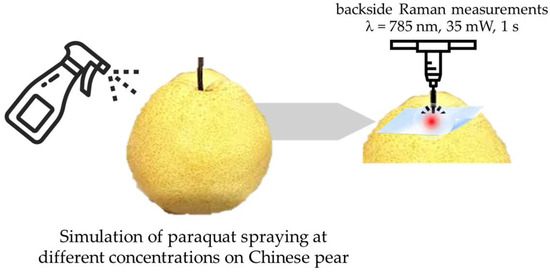
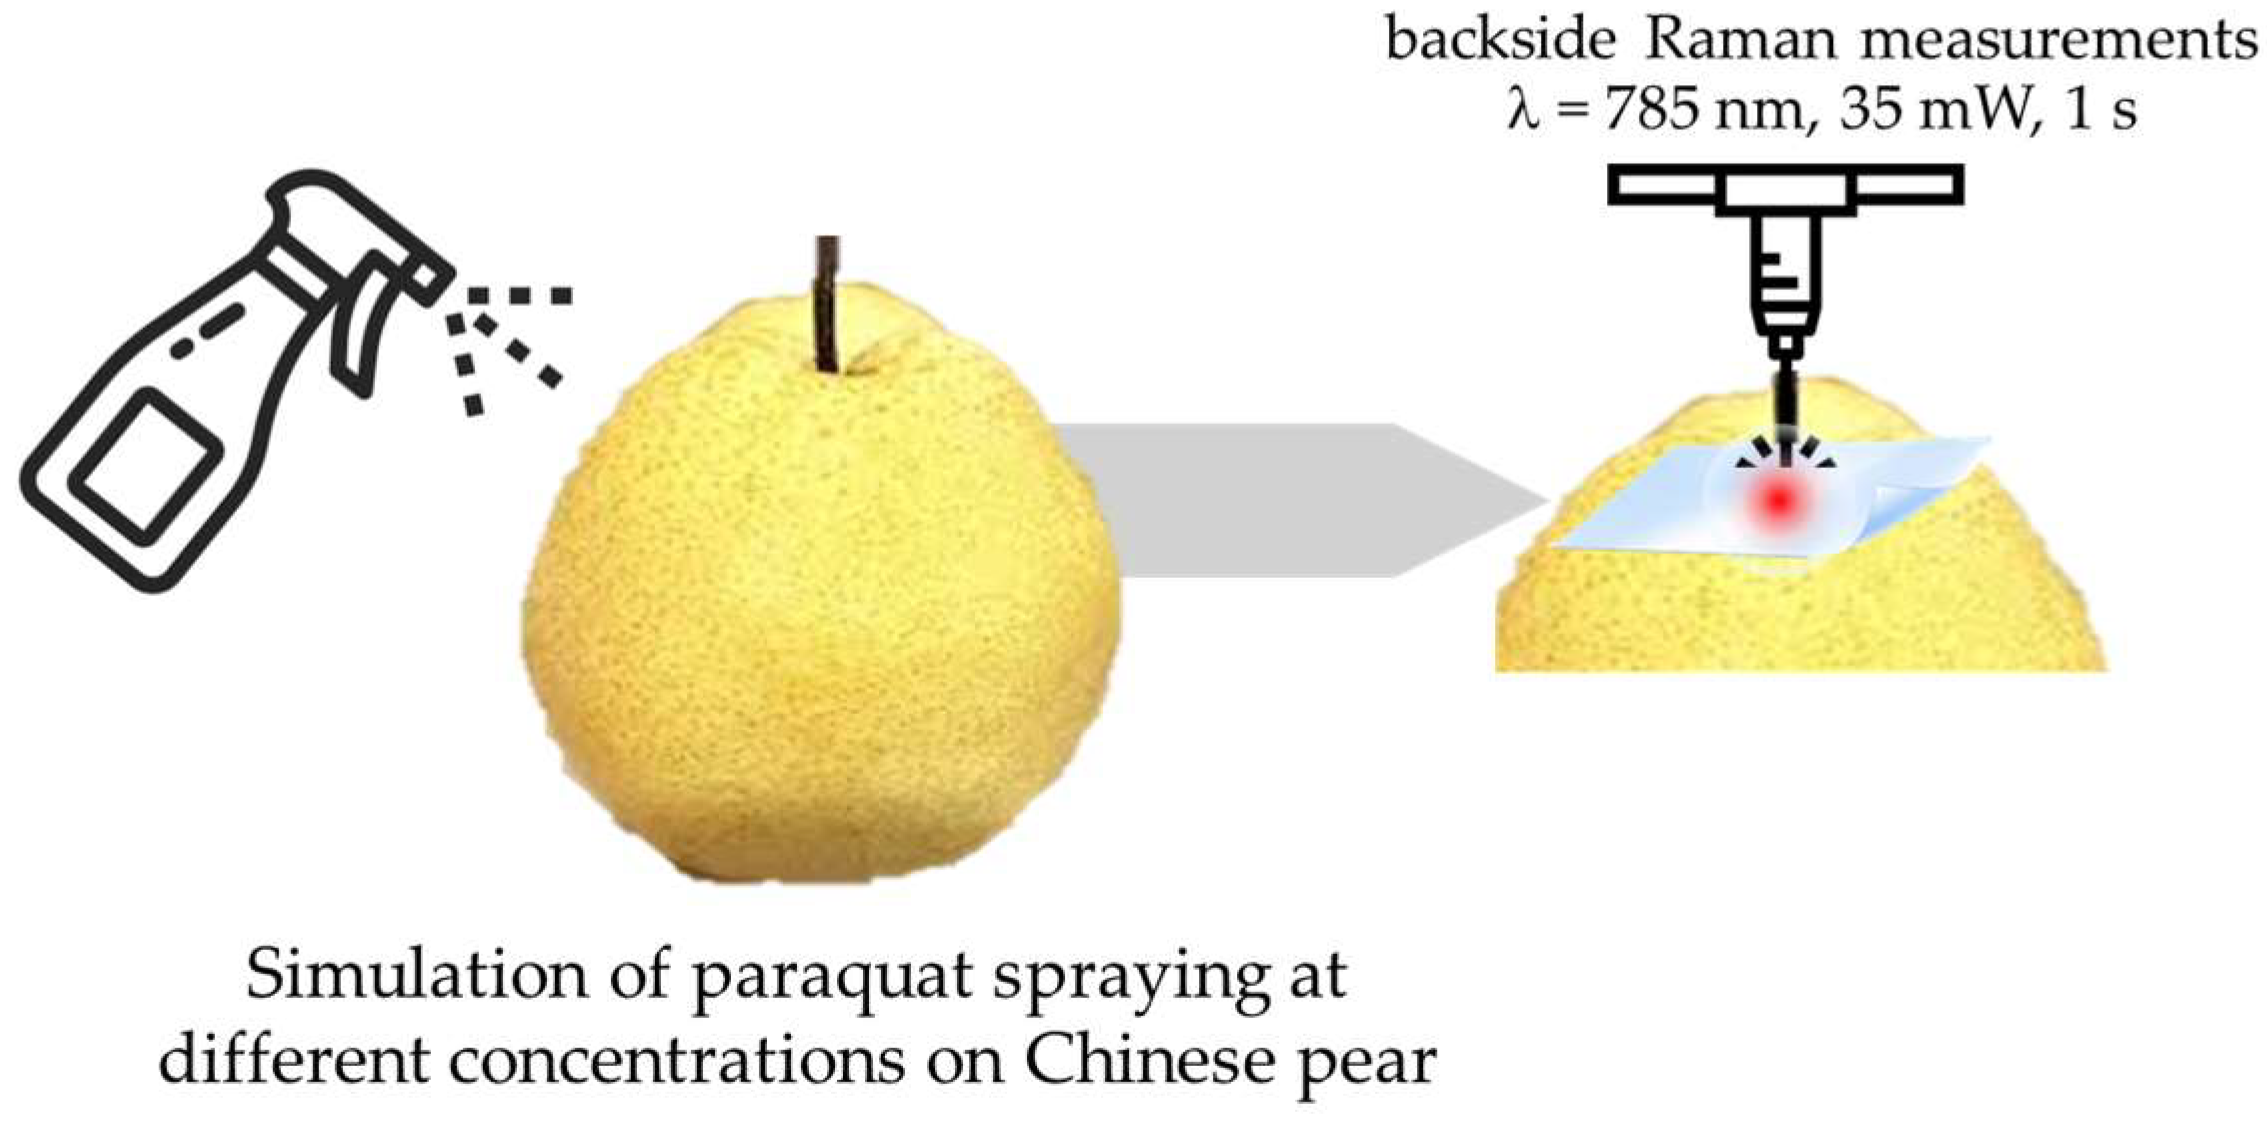
The practical applicability of the TSNP-based flexible SERS substrate was demonstrated through the detection of PQ residues on agricultural produce. Chinese pear samples were spiked on the peel with analytical and commercial-grade PQ solutions at a concentration of 0.0257 μg/L (10−4 M). The TSNP flexible SERS substrates were then placed in direct contact with the contaminated peel surfaces for Raman analysis. Raman measurements were performed using a 785 nm excitation laser with a power of 35 mW, a 50× objective lens, and an acquisition time of 1 s. The experimental procedure is schematically illustrated in Figure 5.
Figure 5.
Practical applicability of the TSNP-based flexible SERS substrate in detecting PQ residues on Chinese pears.
3. Results
3.1. Mechanical and Optical Properties of PDMS Substrates
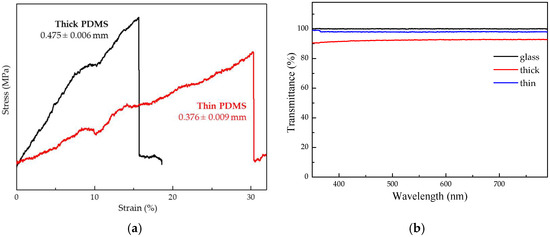
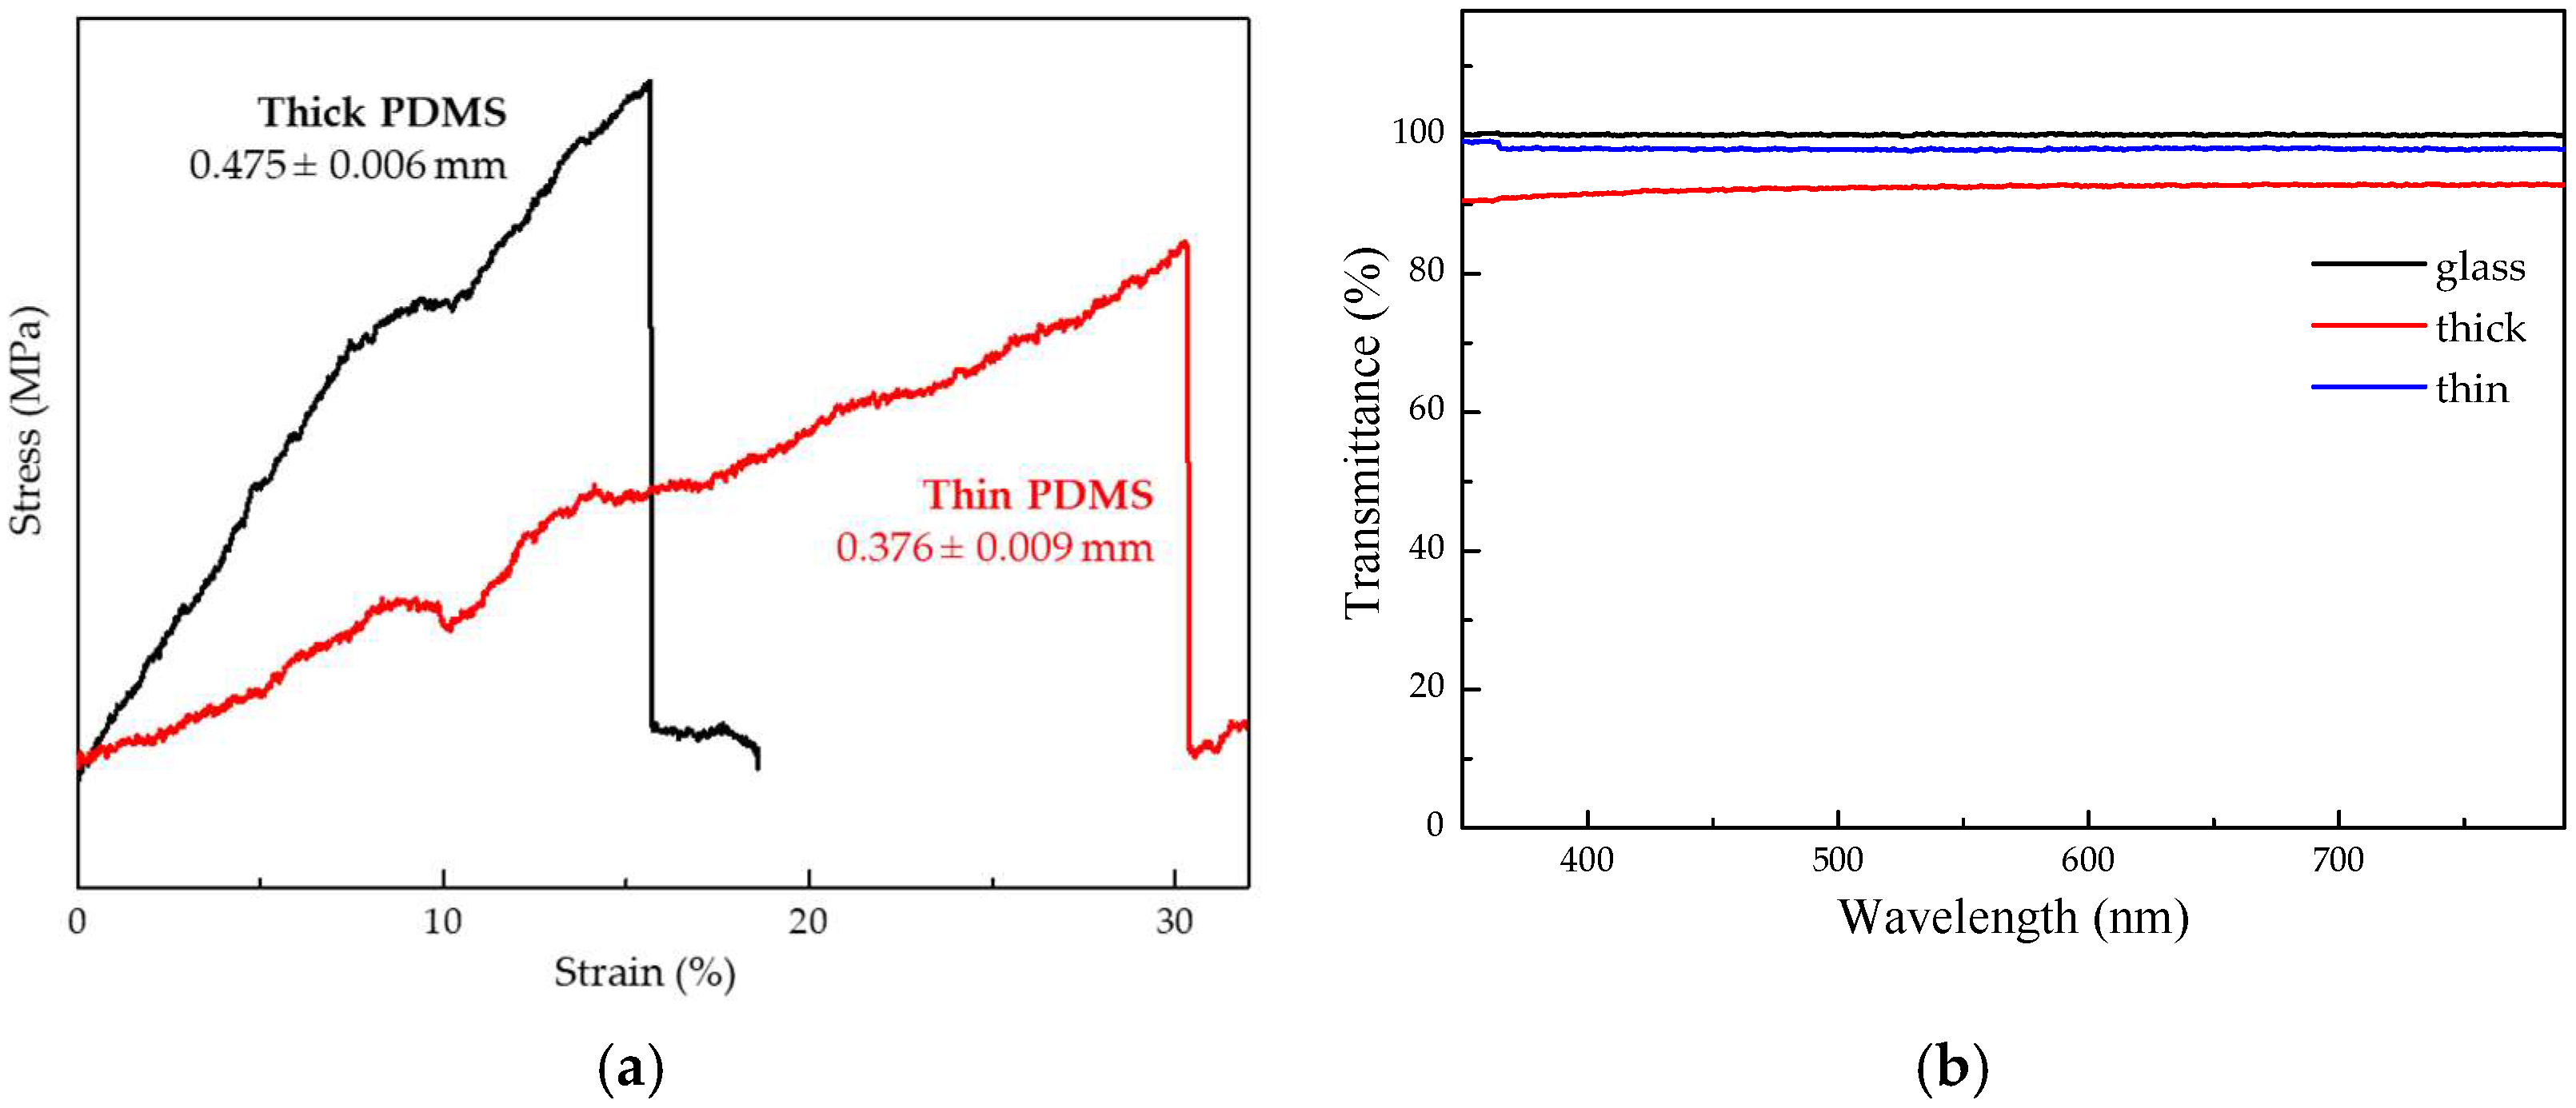
The mechanical properties of PDMS substrates were strongly dependent on film thickness. Tensile characterization was performed on PDMS films with thicknesses of 0.475 ± 0.006 and 0.376 ± 0.009 mm (Figure 6a), and their stress–strain behaviors were analyzed. As summarized in Table 1, the thicker substrate exhibited a higher tensile modulus (2.681 ± 0.725 MPa) compared to the thinner substrate (1.485 ± 0.566 MPa), indicating that the thinner film possesses lower stiffness and greater flexibility. Although the thinner substrate showed lower tensile strength, it exhibited a higher strain at tensile strength [22]. To quantitatively assess mechanical robustness, the toughness was calculated as the area under the stress–strain curve using trapezoidal integration. The thinner PDMS substrate exhibited a toughness of 3.79 MJ/m3, which is higher than that of the thicker substrate (2.87 MJ/m3), corresponding to an approximately 32% increase in energy absorption capacity prior to fracture. The combination of lower modulus and higher toughness demonstrates enhanced deformability and mechanical resilience, which are critical for flexible SERS platforms subjected to bending or stretching. Moreover, the thinner PDMS substrate showed superior optical transmittance (98%) compared to the thicker substrate (92%) (Figure 6b), enabling more efficient laser penetration. Based on these combined mechanical and optical advantages, the thinner PDMS substrate was selected as the optimal flexible platform for subsequent fabrication.
Figure 6.
(a) Schematic stress–strain curves; (b) UV–vis spectra of bare PDMS substrates with different thicknesses.
Table 1.
Mechanical properties of the PDMS substrate.
3.2. Optimization of TSNP Loading for Reproducible SERS Performance
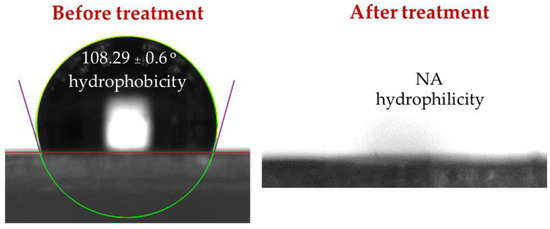
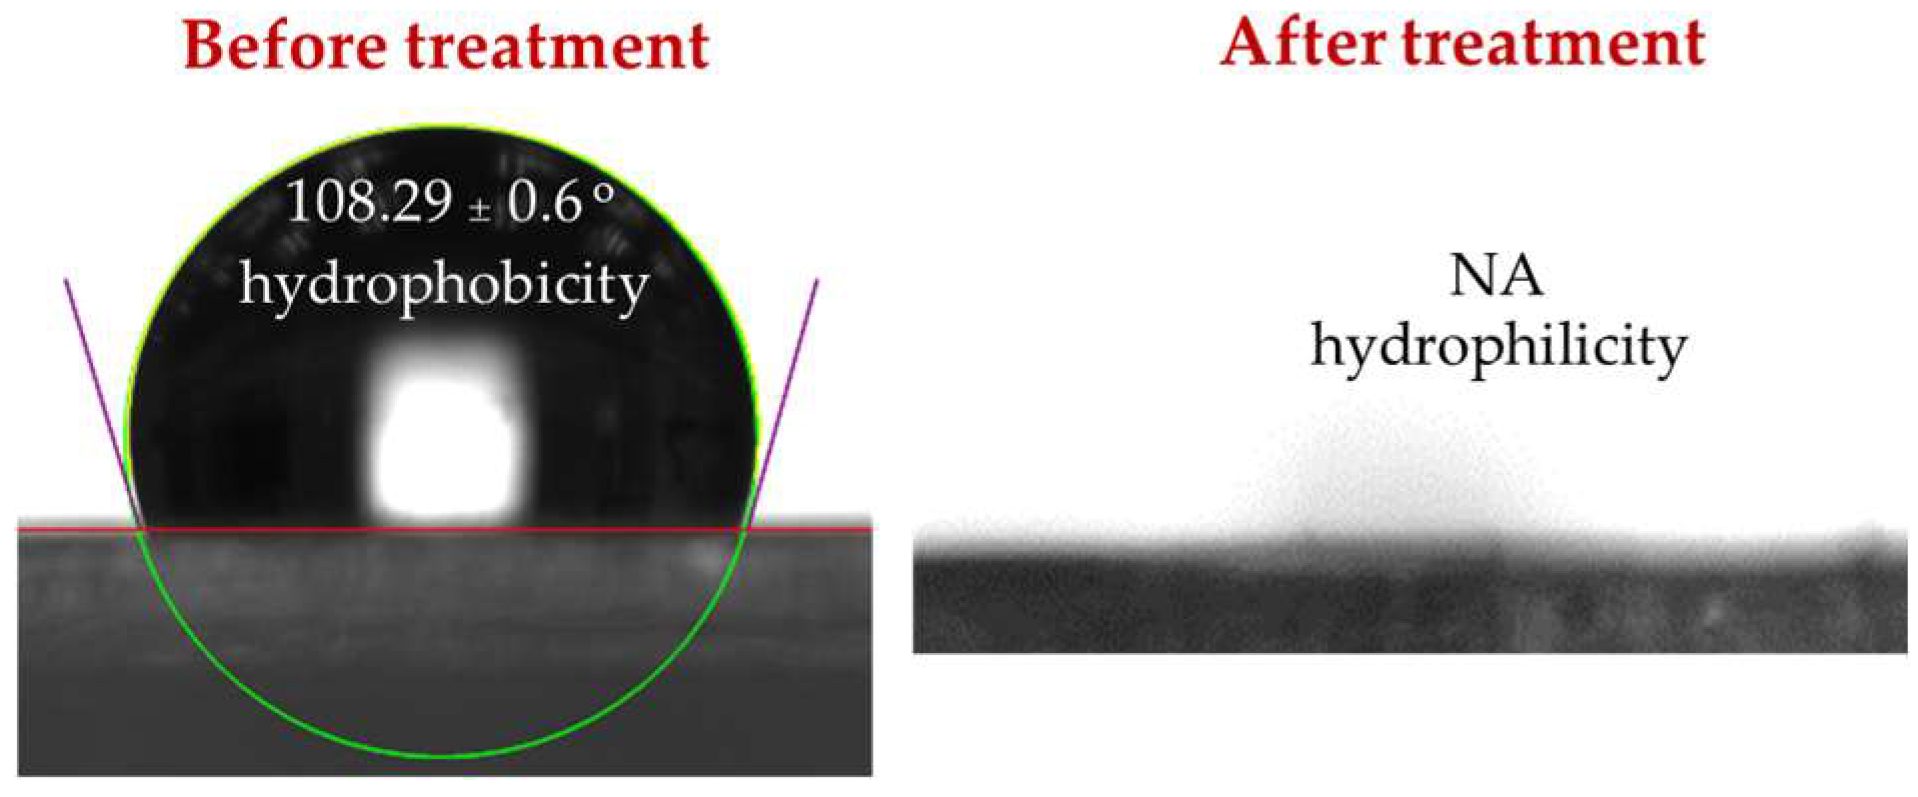
The deposition of TSNP ink onto thin PDMS substrates was initiated by oxygen plasma treatment to activate the surface and enhance wettability. Plasma exposure converted surface methyl groups (–CH3) into silanol groups (Si–OH), resulting in a highly hydrophilic surface, as evidenced by the decrease in contact angle from 108.29° ± 0.6° for pristine PDMS to an unmeasurably low value after treatment (Figure 7). The plasma-treated substrates were subsequently immersed in MPTMS solution to form a thiol-functionalized self-assembled layer, thereby enabling effective immobilization of TSNPs through Ag–S interactions [54,55,56].
Figure 7.
Contact angles of the PDMS surface before and after plasma surface modification.
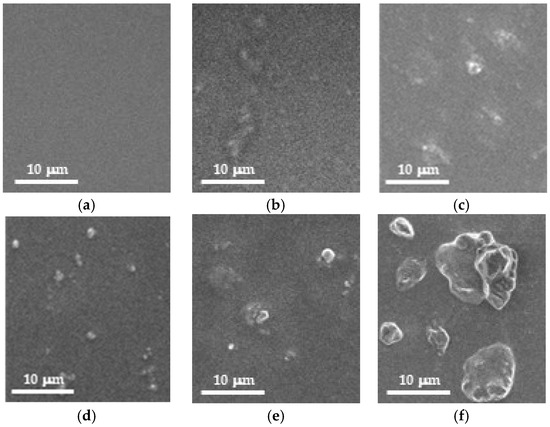
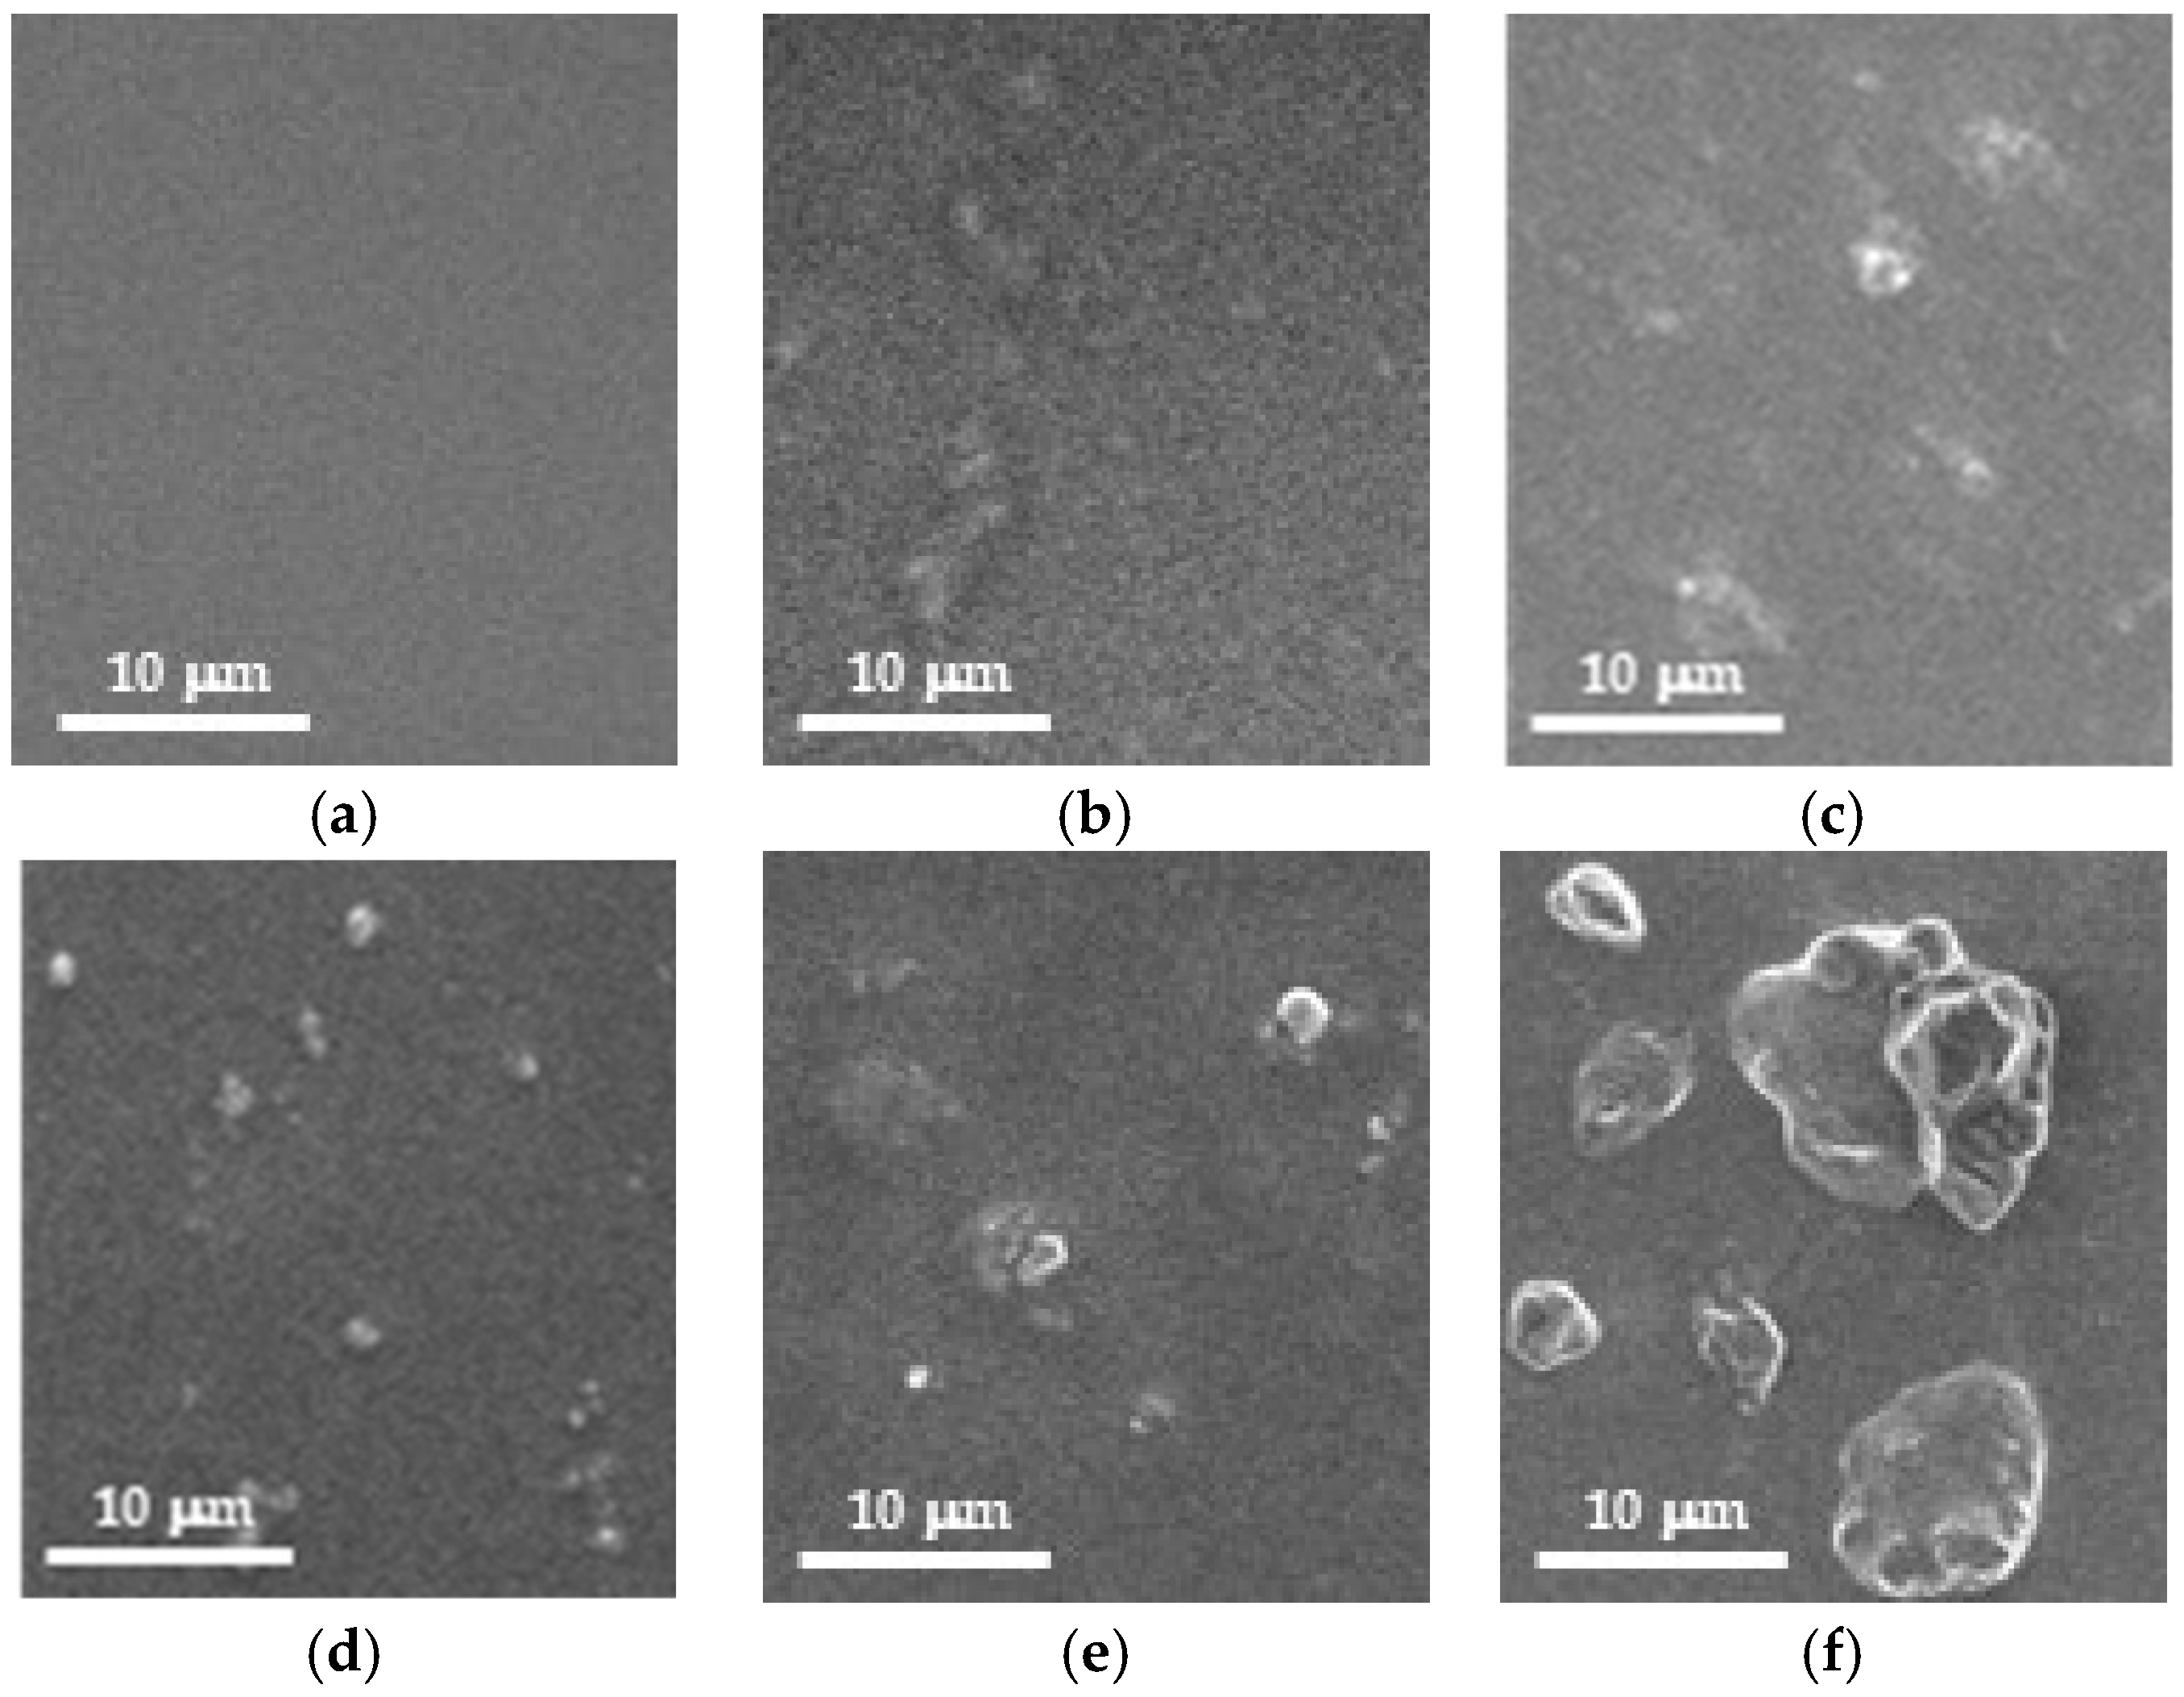
To systematically optimize nanoparticle loading for SERS applications, TSNP colloids with optical absorbance values of 1.0–3.0 were deposited onto the modified PDMS substrates. FESEM analysis (Figure 8a–f) revealed that increasing absorbance led to progressive nanoparticle aggregation. Lower absorbance values resulted in sparse surface coverage and insufficient hotspot density, whereas higher-absorbance conditions caused excessive aggregation and non-uniform hotspot distribution. In contrast, an absorbance of 2.0 produced a comparatively uniform nanoparticle arrangement with appropriate interparticle spacing, which is critical for effective plasmonic coupling and hotspot generation.
Figure 8.
SEM images of TSNPs/PDMS substrates prepared using TSNP colloids with different optical absorbance values: (a) 0, (b) 1, (c) 1.5, (d) 2, (e) 2.5, and (f) 3.
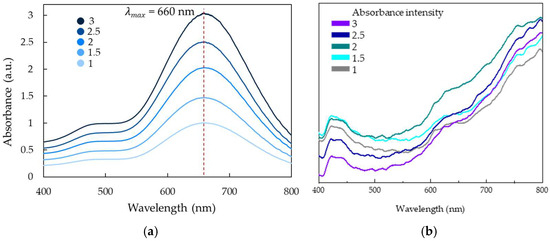
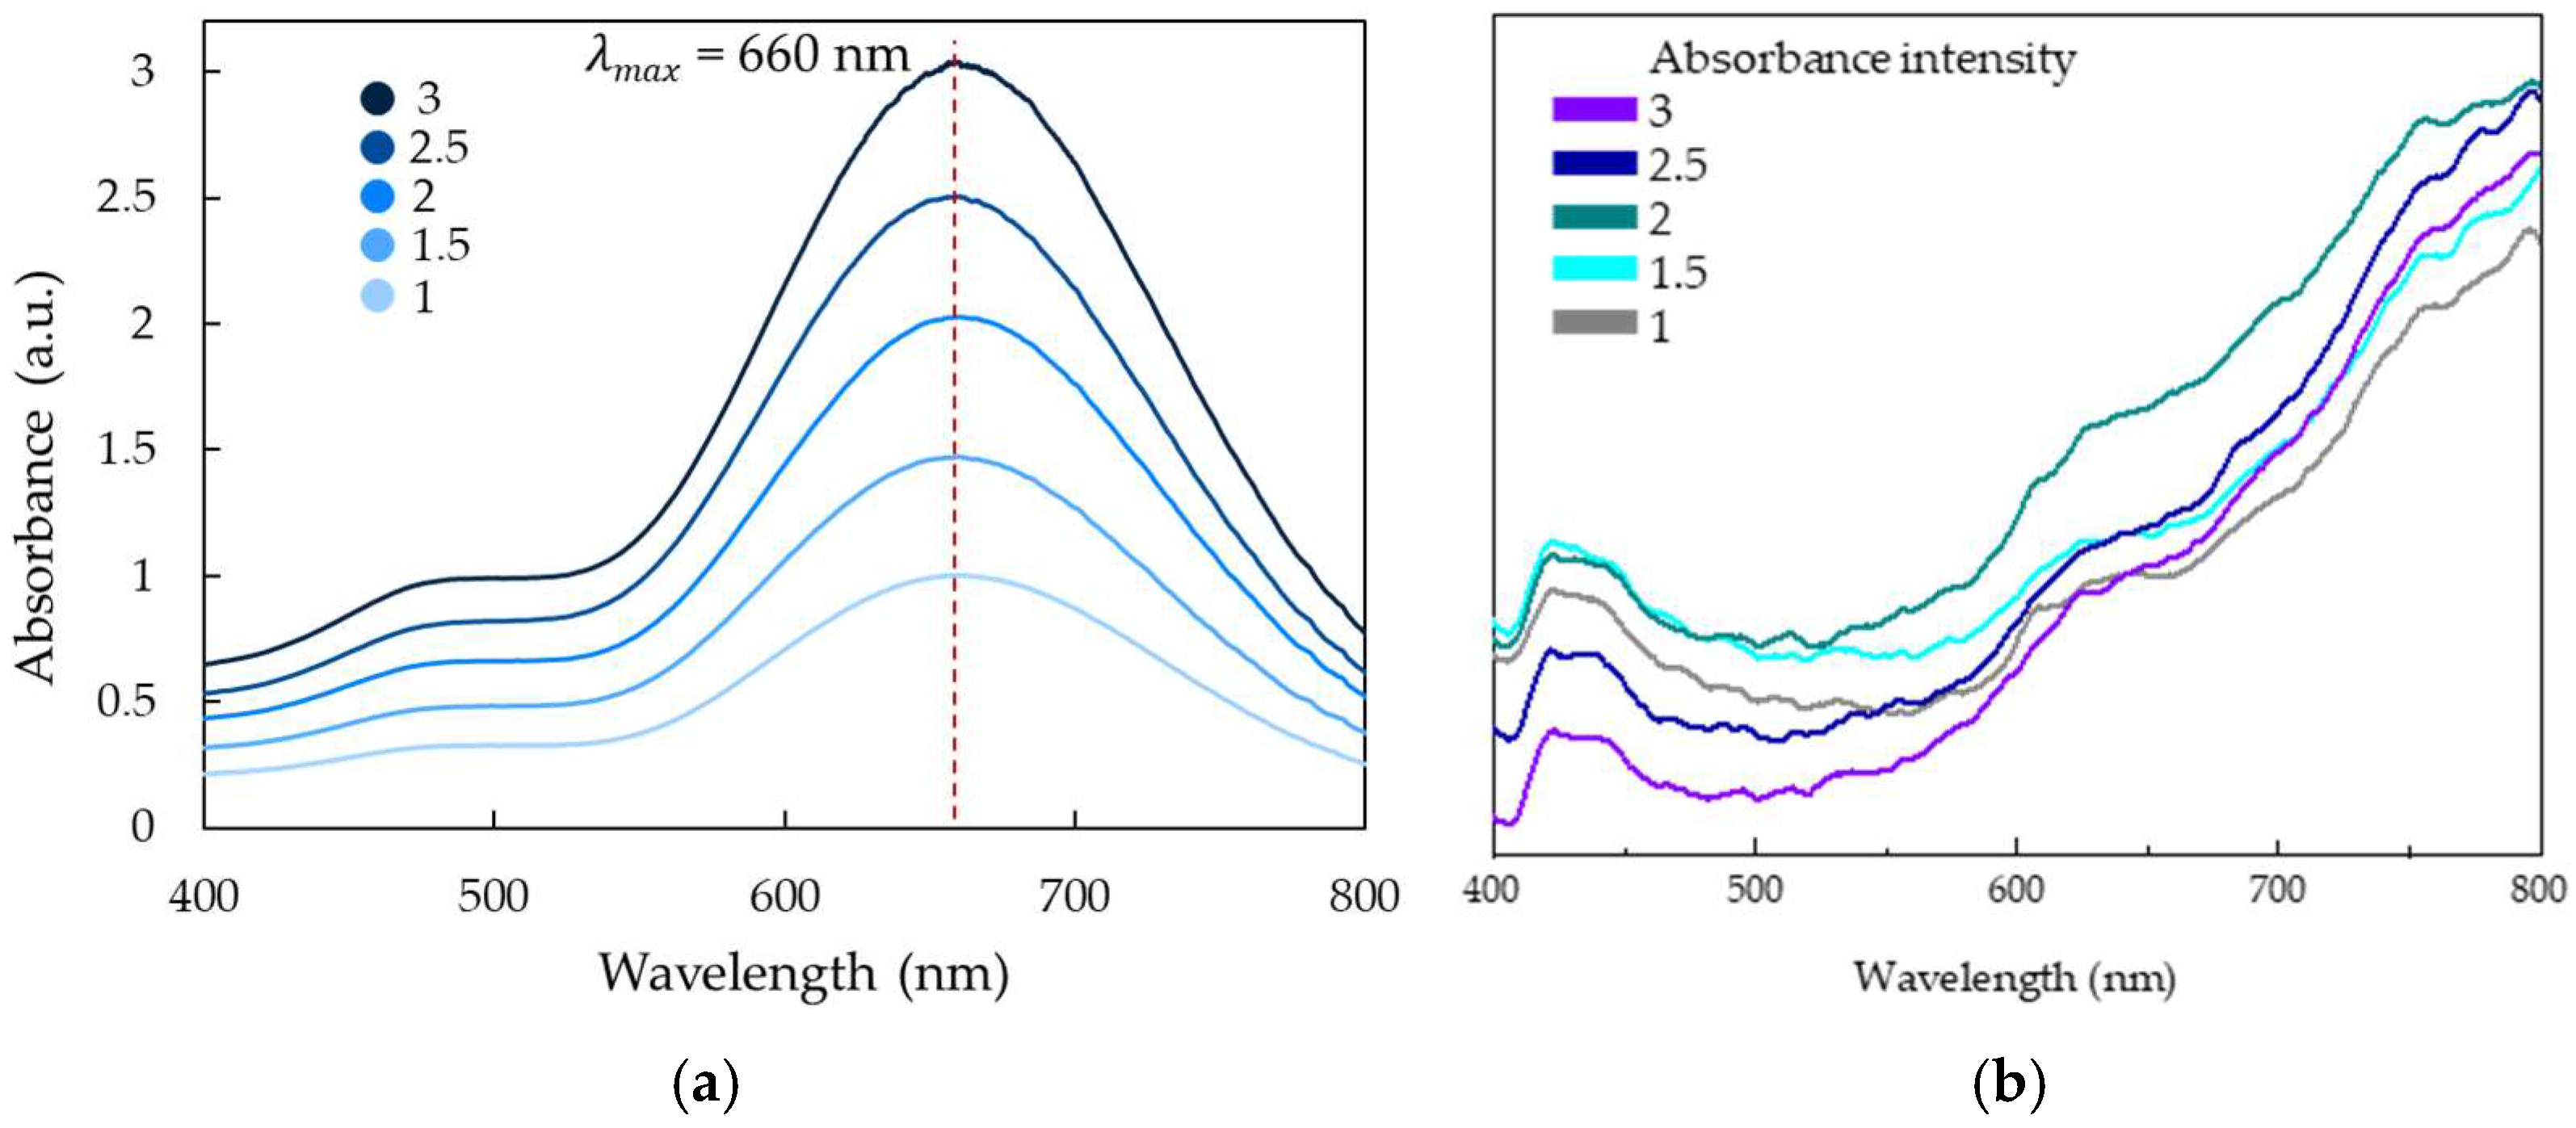
To further relate the observed morphology to plasmonic behavior, the UV–vis absorbance spectrum of the optimized TSNP-coated PDMS substrate was examined. In the colloidal state, the TSNPs exhibit a plasmonic absorption maximum at approximately 660 nm (Figure 9a), corresponding to the in-plane dipolar LSPR of the TSNPs. After immobilization onto the thiol-functionalized PDMS substrate, the spectral profile becomes broader relative to the colloidal dispersion (Figure 9b). This broadening is characteristic of nanoparticle films and arises from reduced interparticle spacing, electromagnetic coupling between adjacent nanoplates, and modification of the local dielectric environment by the PDMS substrate. Consequently, the plasmonic response is redistributed into a broadened band rather than a sharp peak [57]. Although the original LSPR maximum remains centered near 660 nm, the extended spectral tail toward longer wavelengths provides partial overlap with the 785 nm excitation laser used in this study, thereby supporting efficient electromagnetic enhancement for SERS measurements. These findings are consistent with the previously reported behavior of Ag nanoparticle films on PDMS substrates.
Figure 9.
UV–vis absorbance spectra of (a) TSNP colloid and (b) TSNP-coated PDMS substrates at different colloidal absorbance intensities.
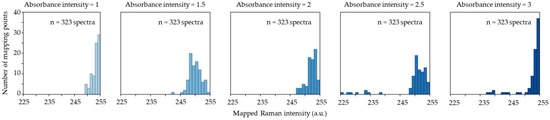
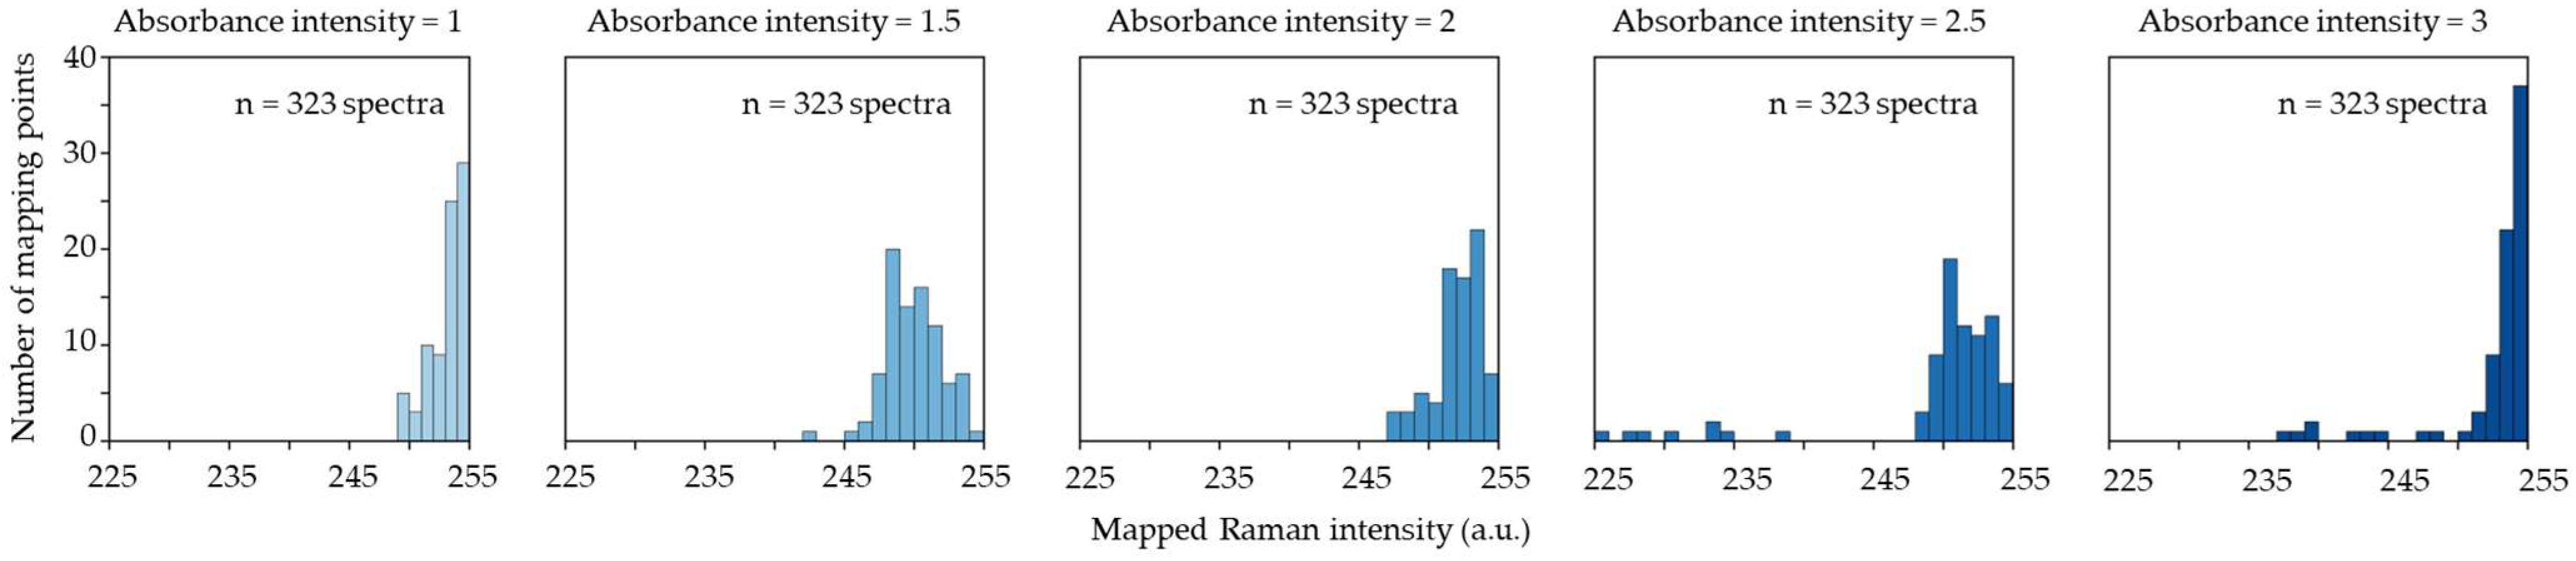
The SERS performance of the substrates was subsequently evaluated using 10−4 M R6G as a probe molecule. The spectra were analyzed in terms of SNR, EF, and the probability of detecting the characteristic Raman band at 1649 cm−1. Raman intensity values extracted from mapping images at 1649 cm−1 were further used for distribution analysis (Figure 10). In agreement with the morphological observations, mapping-derived Raman intensity distributions indicated that low-intensity signals (0–80) were predominantly associated with substrates prepared from lower-absorbance colloids (1.0 and 1.5), reflecting weaker Raman enhancement. A substantial overlap within the intermediate range (80–150) suggested comparable signal levels across all conditions. Notably, in the high-intensity range (150–250), the substrate prepared at an absorbance of 2.0 exhibited the strongest contribution, demonstrating a clear shift toward enhanced Raman response. Although higher-absorbance conditions (2.5 and 3.0) produced broader intensity distributions, they did not dominate the highest-intensity region to the same extent as the absorbance of 2.0, indicating redistribution rather than continuous improvement of SERS activity. As summarized in Table 2, the substrate prepared at an absorbance of 2.0 showed the highest average peak intensity, SNR, EF, and detection probability, confirming that this nanoparticle density yields optimal hotspot formation and overall SERS performance.
Figure 10.
Histogram of Raman mapping intensity at 1649 cm−1 of 10−4 M R6G obtained from TSNP-based flexible SERS substrates prepared with different colloidal absorbance intensities.
Table 2.
SNR and EF values at 1649 cm−1 for 10−4 M R6G obtained from front-side illumination SERS detection.
The reproducibility of the SERS response was assessed using the RSD from 323 spot measurements. The optimized substrate exhibited a low %RSD value of 3.12%, well below the commonly accepted threshold (≤20%) for satisfactory SERS reproducibility [53]. Collectively, these results demonstrate that an absorbance of 2.0 provides both strong electromagnetic enhancement and reliable quantitative performance, and this condition was therefore selected for subsequent investigations.
3.3. SERS Performance of Flexible TSNP-Based Substrates
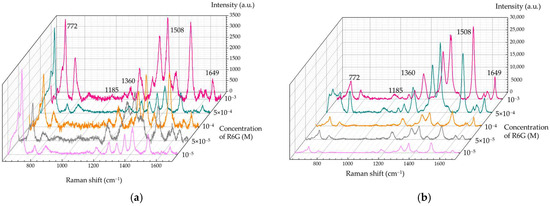
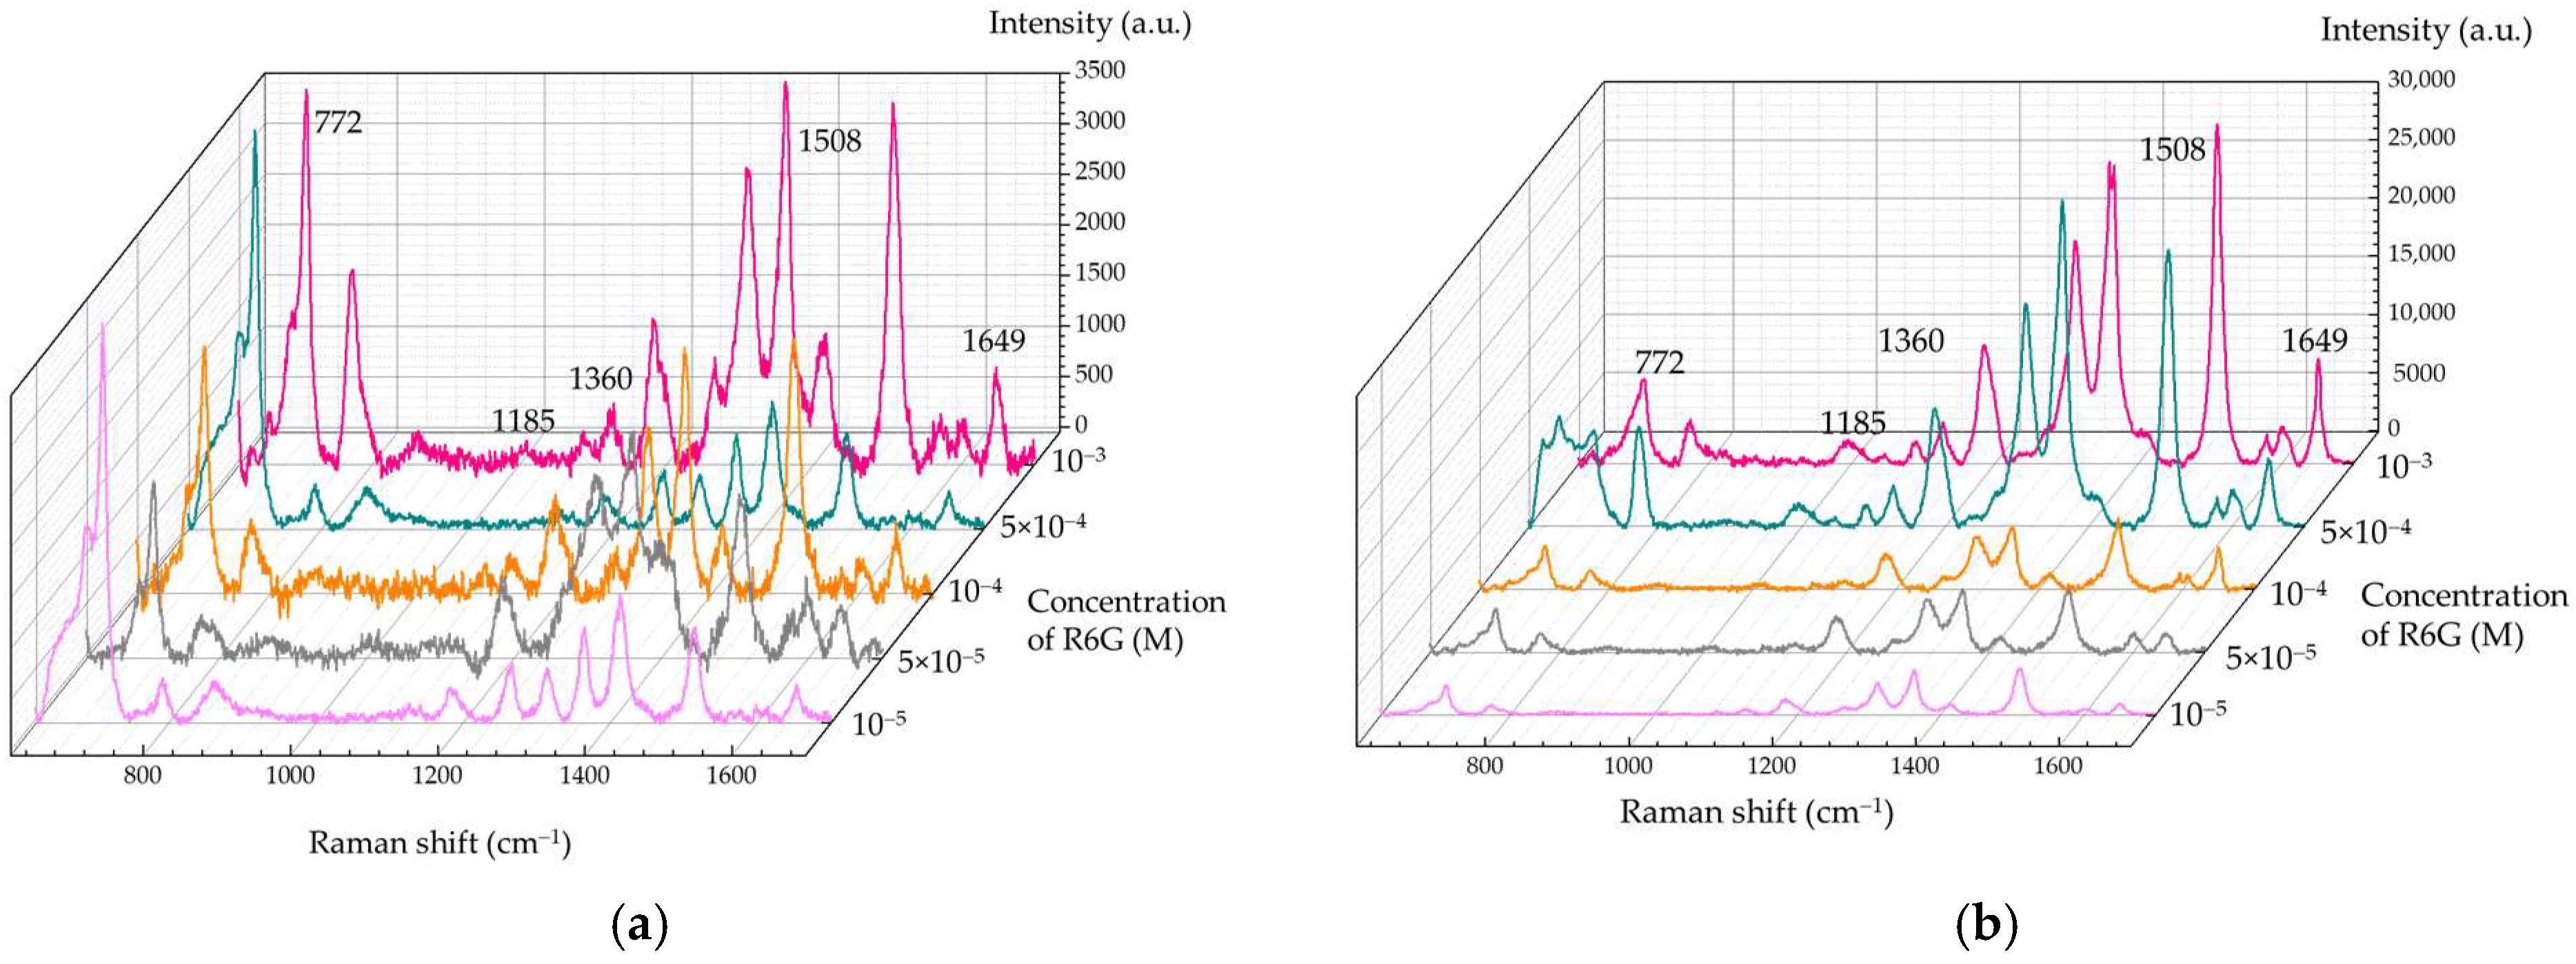
The analytical capability of the flexible TSNP-based SERS substrate was systematically assessed using R6G as a model analyte over a concentration range of 10−3–10−5 M (Figure 11a,b). Two optical configurations were employed, including direct excitation on the TSNP layer (front-side illumination) and excitation through the PDMS support (back-side illumination). For each configuration, spectra were acquired from 20 randomly distributed locations to evaluate signal uniformity under the tested conditions. Quantitative comparison based on the average primary peak intensity, SNR, and EF (Table 3) indicated that back-side illumination consistently produced stronger SERS responses than front-side illumination. The apparent increase in SNR at lower R6G concentrations under front-side illumination arises from the negligible background contribution of bare PDMS at 1649 cm−1, such that even weak SERS signals remain distinguishable relative to the noise level.
Figure 11.
Average SERS spectra of 10−3–10−5 M R6G using a TSNP flexible SERS substrate with (a) front- and (b) back-side illumination.
Table 3.
SNR and EF values at 1649 cm−1 for SERS front- and back-side illumination of R6G at different concentrations.
The relatively stronger SERS intensity observed under back-side excitation may be attributed to optical and plasmonic considerations. When the excitation laser propagates through the PDMS layer (n ≈ 1.40), the refractive index contrast at the excitation interface is reduced, which may decrease reflection losses and improve optical coupling efficiency. Back-side illumination may also promote stronger near-field confinement at the metal–PDMS interface and facilitate excitation of the in-plane dipolar plasmon modes of the triangular nanoplates. In contrast, front-side illumination involves a larger air-to-metal refractive index mismatch, which may limit optical coupling and near-field confinement. Collectively, these factors provide a plausible explanation for the enhanced hotspot formation observed under back-side excitation [41,58].
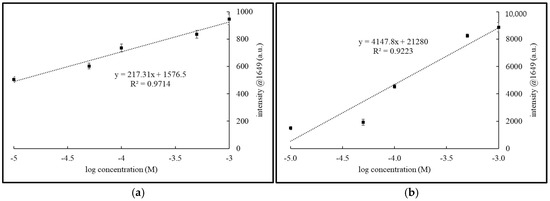
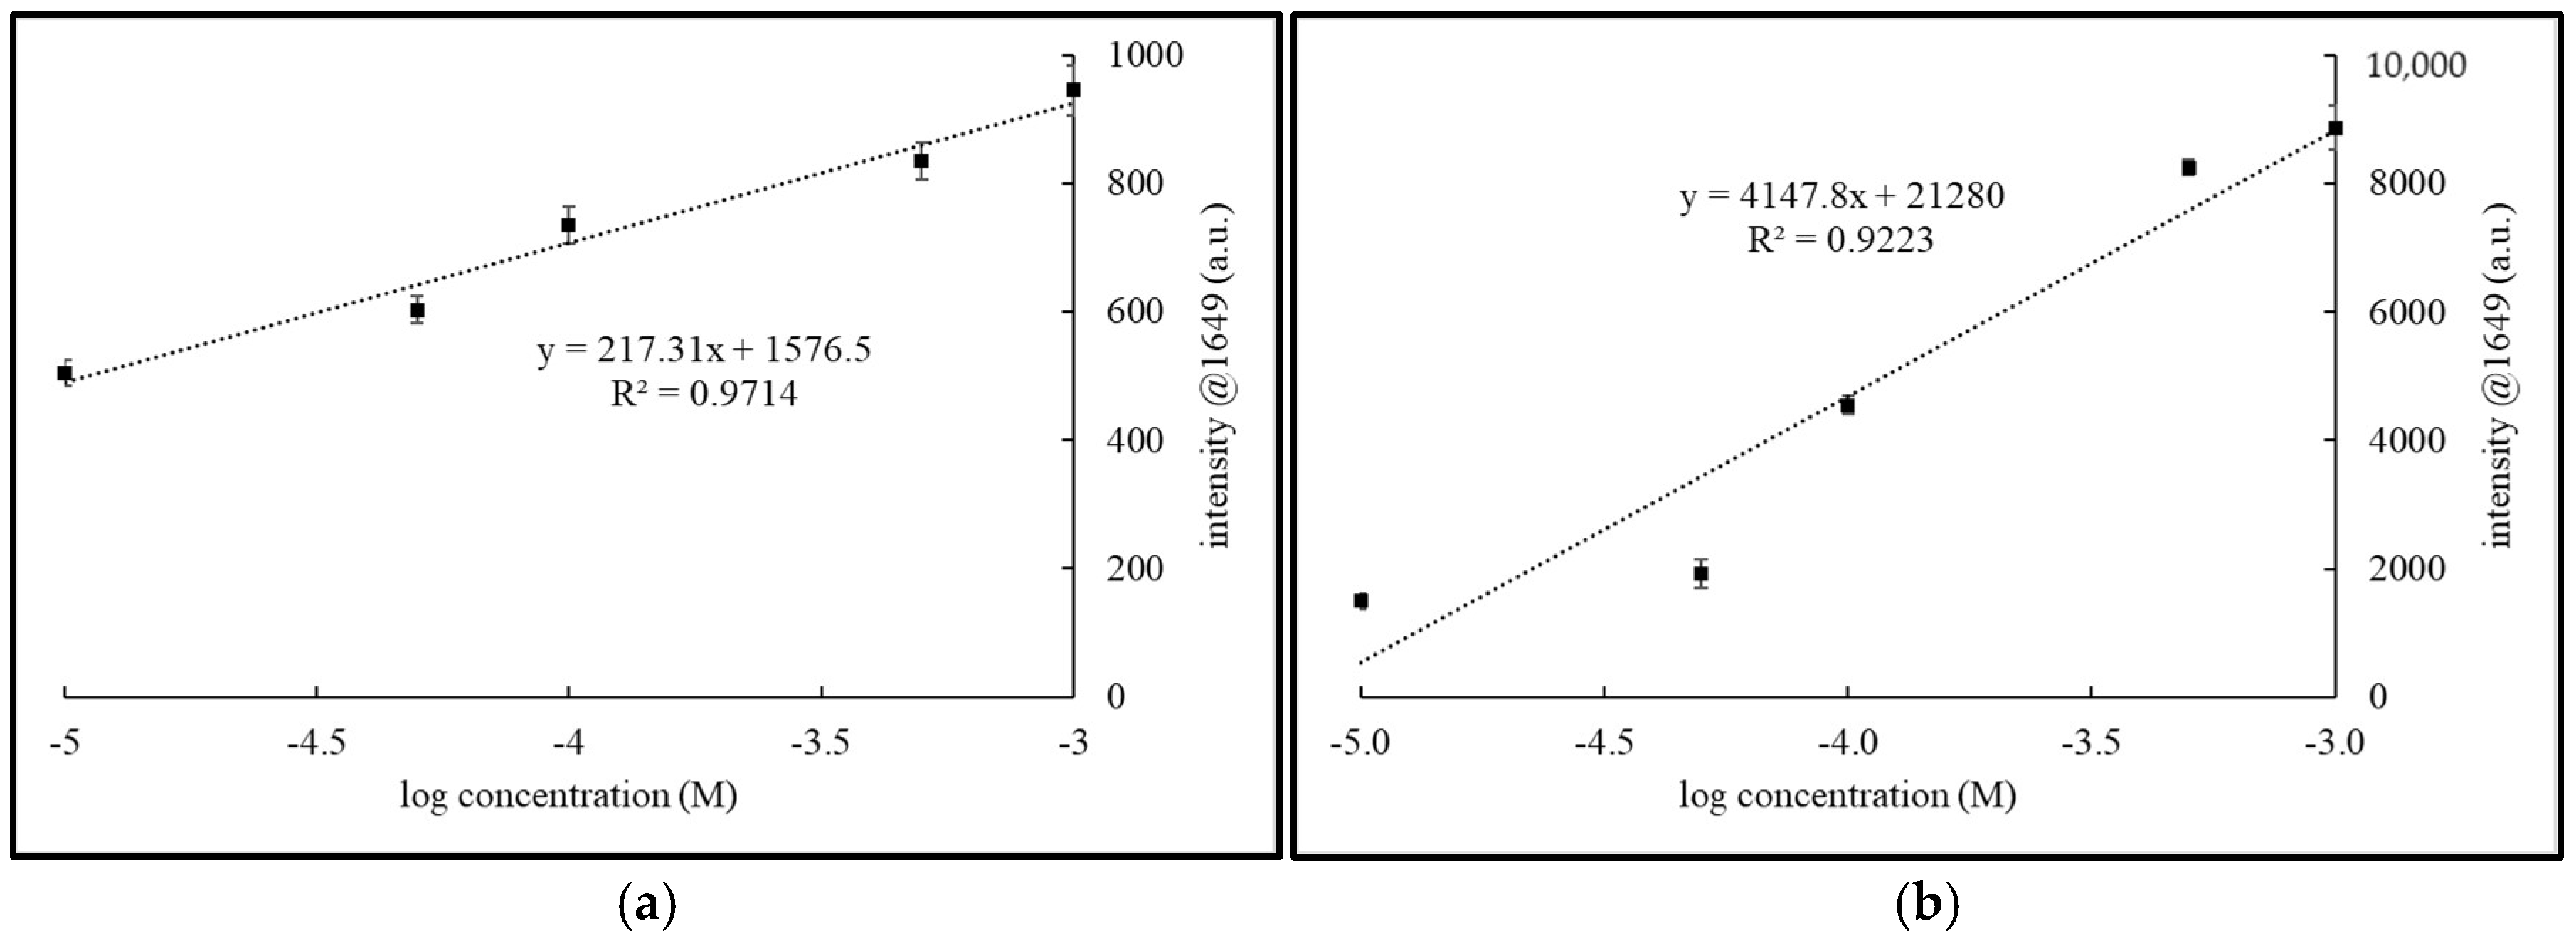
Calibration plots constructed from the characteristic R6G peaks (Figure 12a,b) exhibited good linearity over the investigated concentration range, enabling quantitative analysis down to approximately M for both configurations. While further optimization may improve the analytical sensitivity, the present results demonstrate the feasibility of the TSNP-based flexible SERS platform. Importantly, the fabrication strategy is inherently scalable: TSNP colloids can be synthesized in large volumes, and PDMS substrates can be readily produced through a rapid and straightforward process. This approach enables the preparation of multiple flexible substrates under consistent fabrication conditions, providing a practical basis for further structural optimization and application-oriented development. According to the commonly adopted SNR criterion in Raman and SERS analyses, the LOD was estimated using a threshold of SNR ≥ 3, corresponding to the minimum signal level distinguishable from the background. At the lowest investigated R6G concentration of M, the measured SNR values were 17.35 and 30.61 under front-side and back-side illumination, respectively, both of which are substantially higher than the detection threshold. These results confirm that the flexible TSNP-based SERS substrate enables reliable Raman detection at concentrations on the order of M.
Figure 12.
(a) Calibration curves of R6G obtained under SERS front-side illumination and (b) back-side illumination using a TSNP flexible SERS substrate.
3.4. Application of Flexible TSNP-Based SERS Substrates for Paraquat Detection
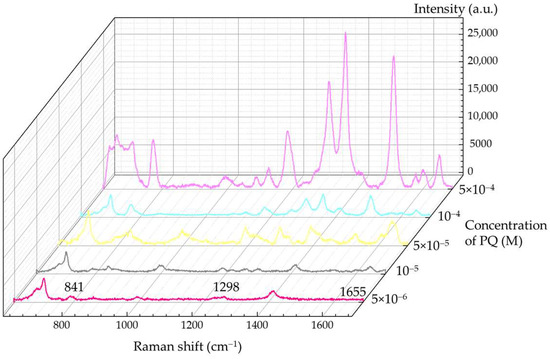
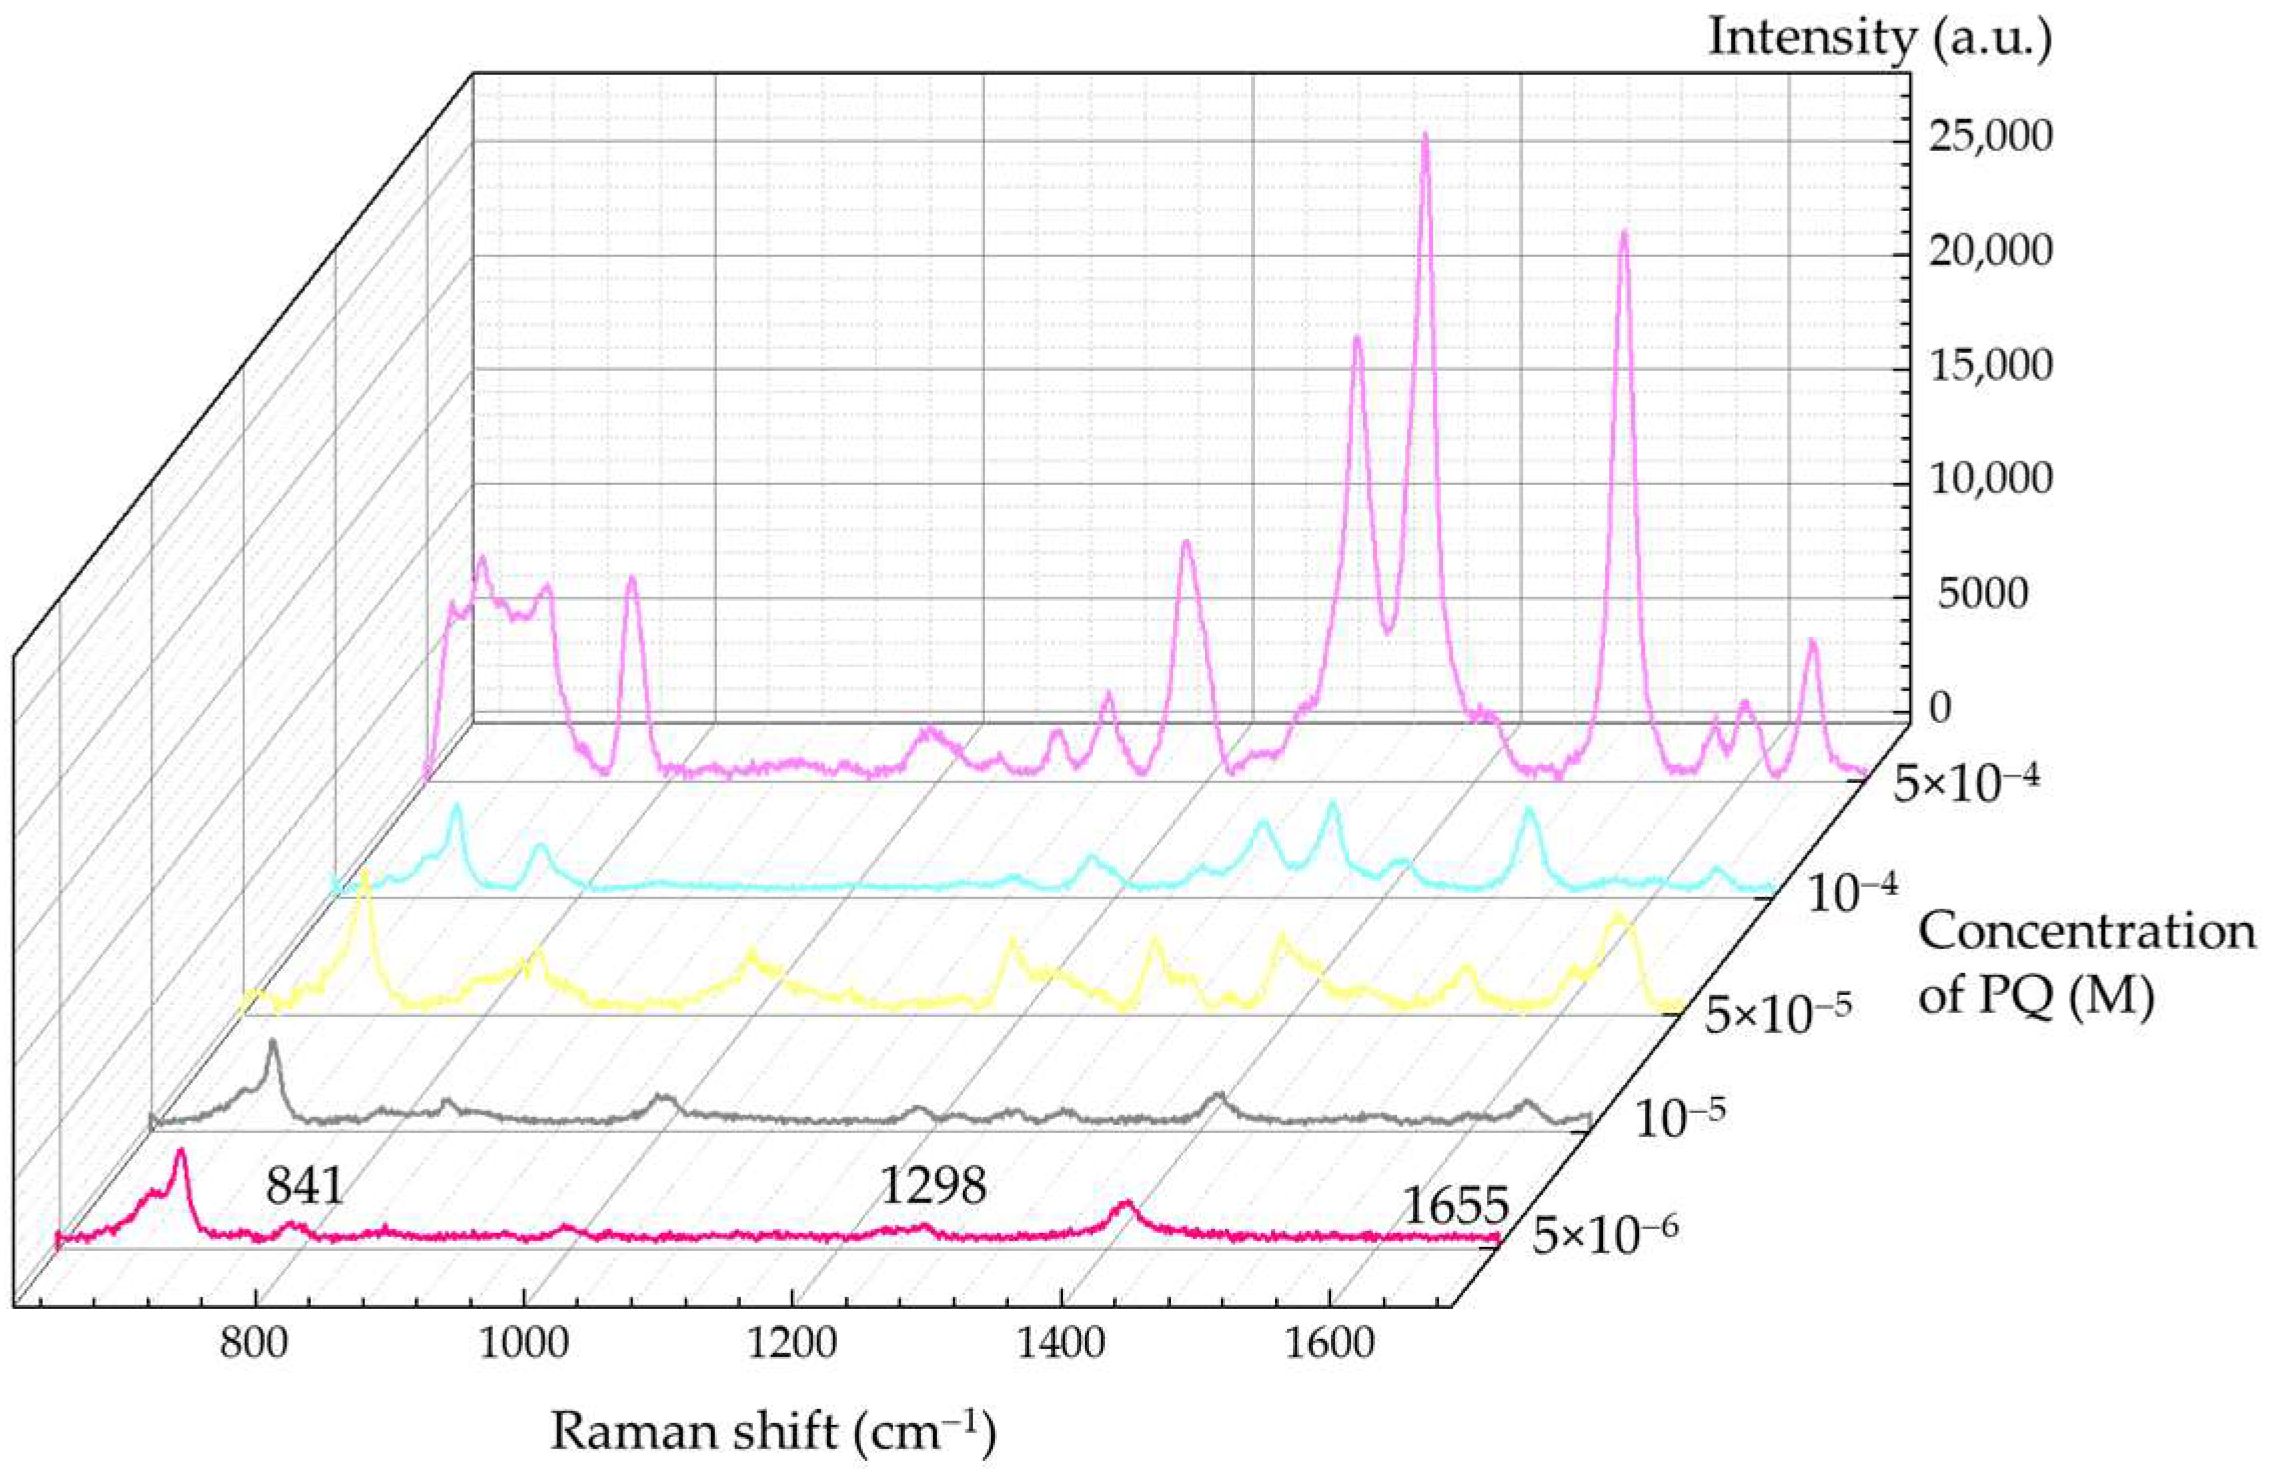
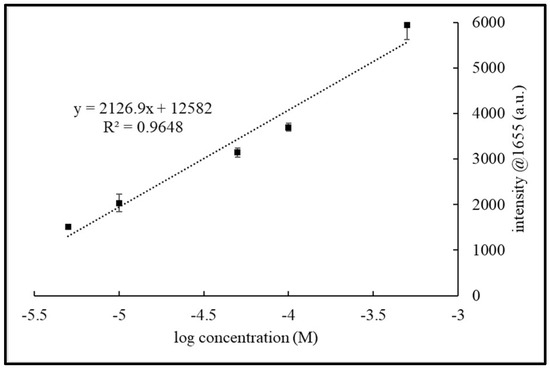
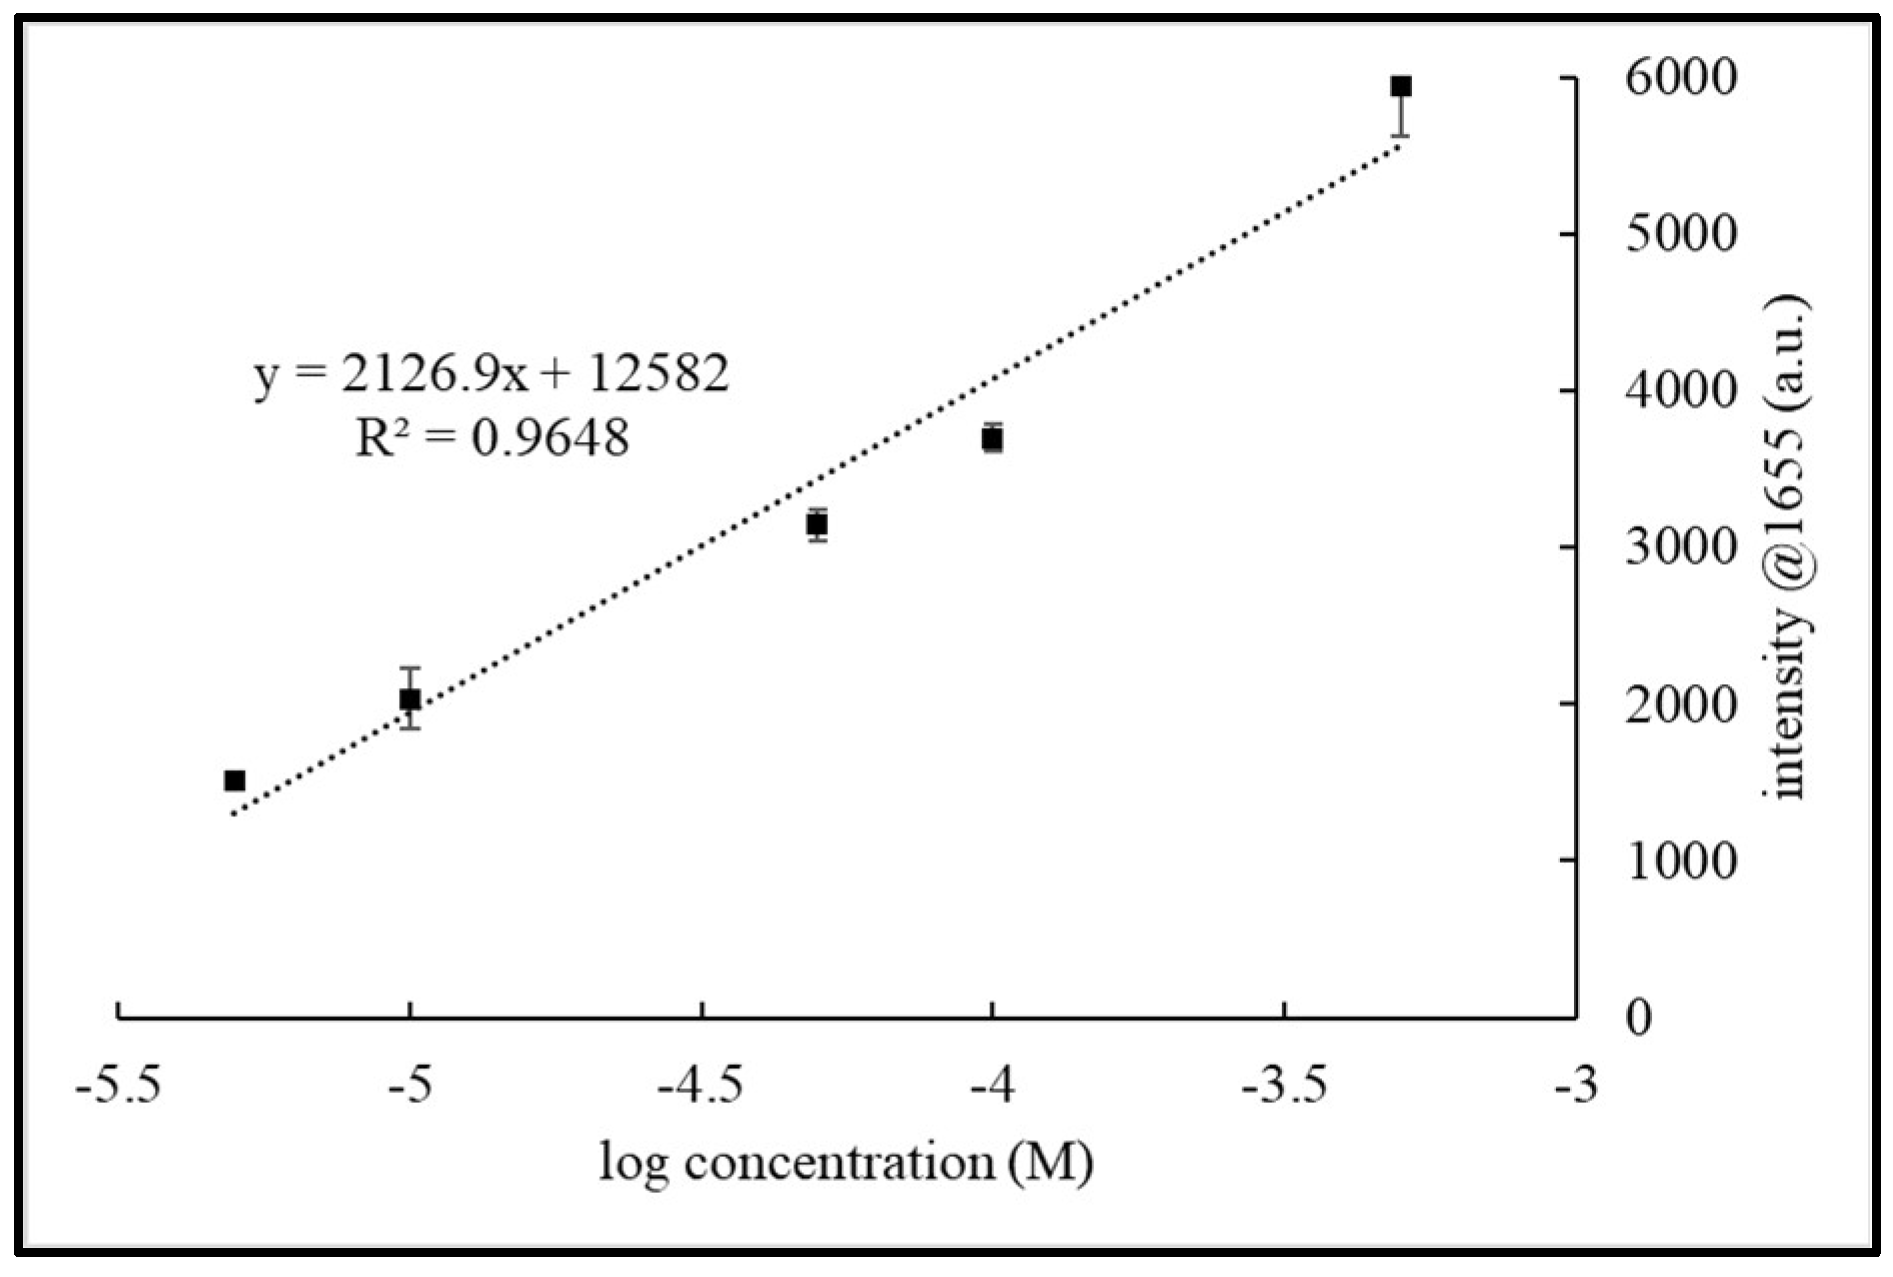
The application potential of the TSNP-based flexible SERS substrate was evaluated through the detection of paraquat on both model and real agricultural surfaces. Aluminum foil was first employed as a reference substrate, onto which laboratory-grade paraquat solutions (5 × 10⁻⁴–5 × 10⁻⁶ M) were deposited, followed by back-side SERS measurements using the flexible substrate. SERS spectra collected from 20 randomly selected locations were analyzed in terms of SNR and EF (Table 4). The characteristic Raman band at 1655 cm−1 exhibited a clear concentration-dependent response (Figure 13), and the corresponding calibration curve displayed a linear relationship between Raman intensity and paraquat concentration over the investigated range (Figure 14). This behavior enabled reliable detection down to 5 × 10⁻⁶ M with good reproducibility. At this lowest investigated concentration, a distinct Raman signal with an SNR of 140.65 was still observed, confirming reliable molecular detection under the back-side measurement configuration.
Table 4.
SNR and EF values at the Raman peak of 1655 cm−1 obtained from SERS back-side illumination of different paraquat concentrations on an aluminum foil substrate.
Figure 13.
Average SERS spectra of 5 × 10⁻⁴–5 × 10⁻⁶ M PQ using a TSNP flexible SERS substrate with back-side illumination.
Figure 14.
Plot of SERS intensity at 1655 cm−1 as a function of paraquat concentration on an aluminum foil substrate.
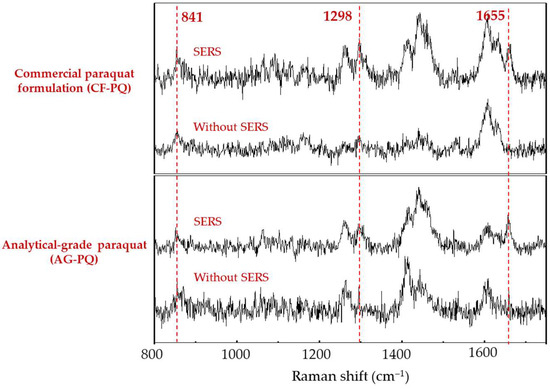
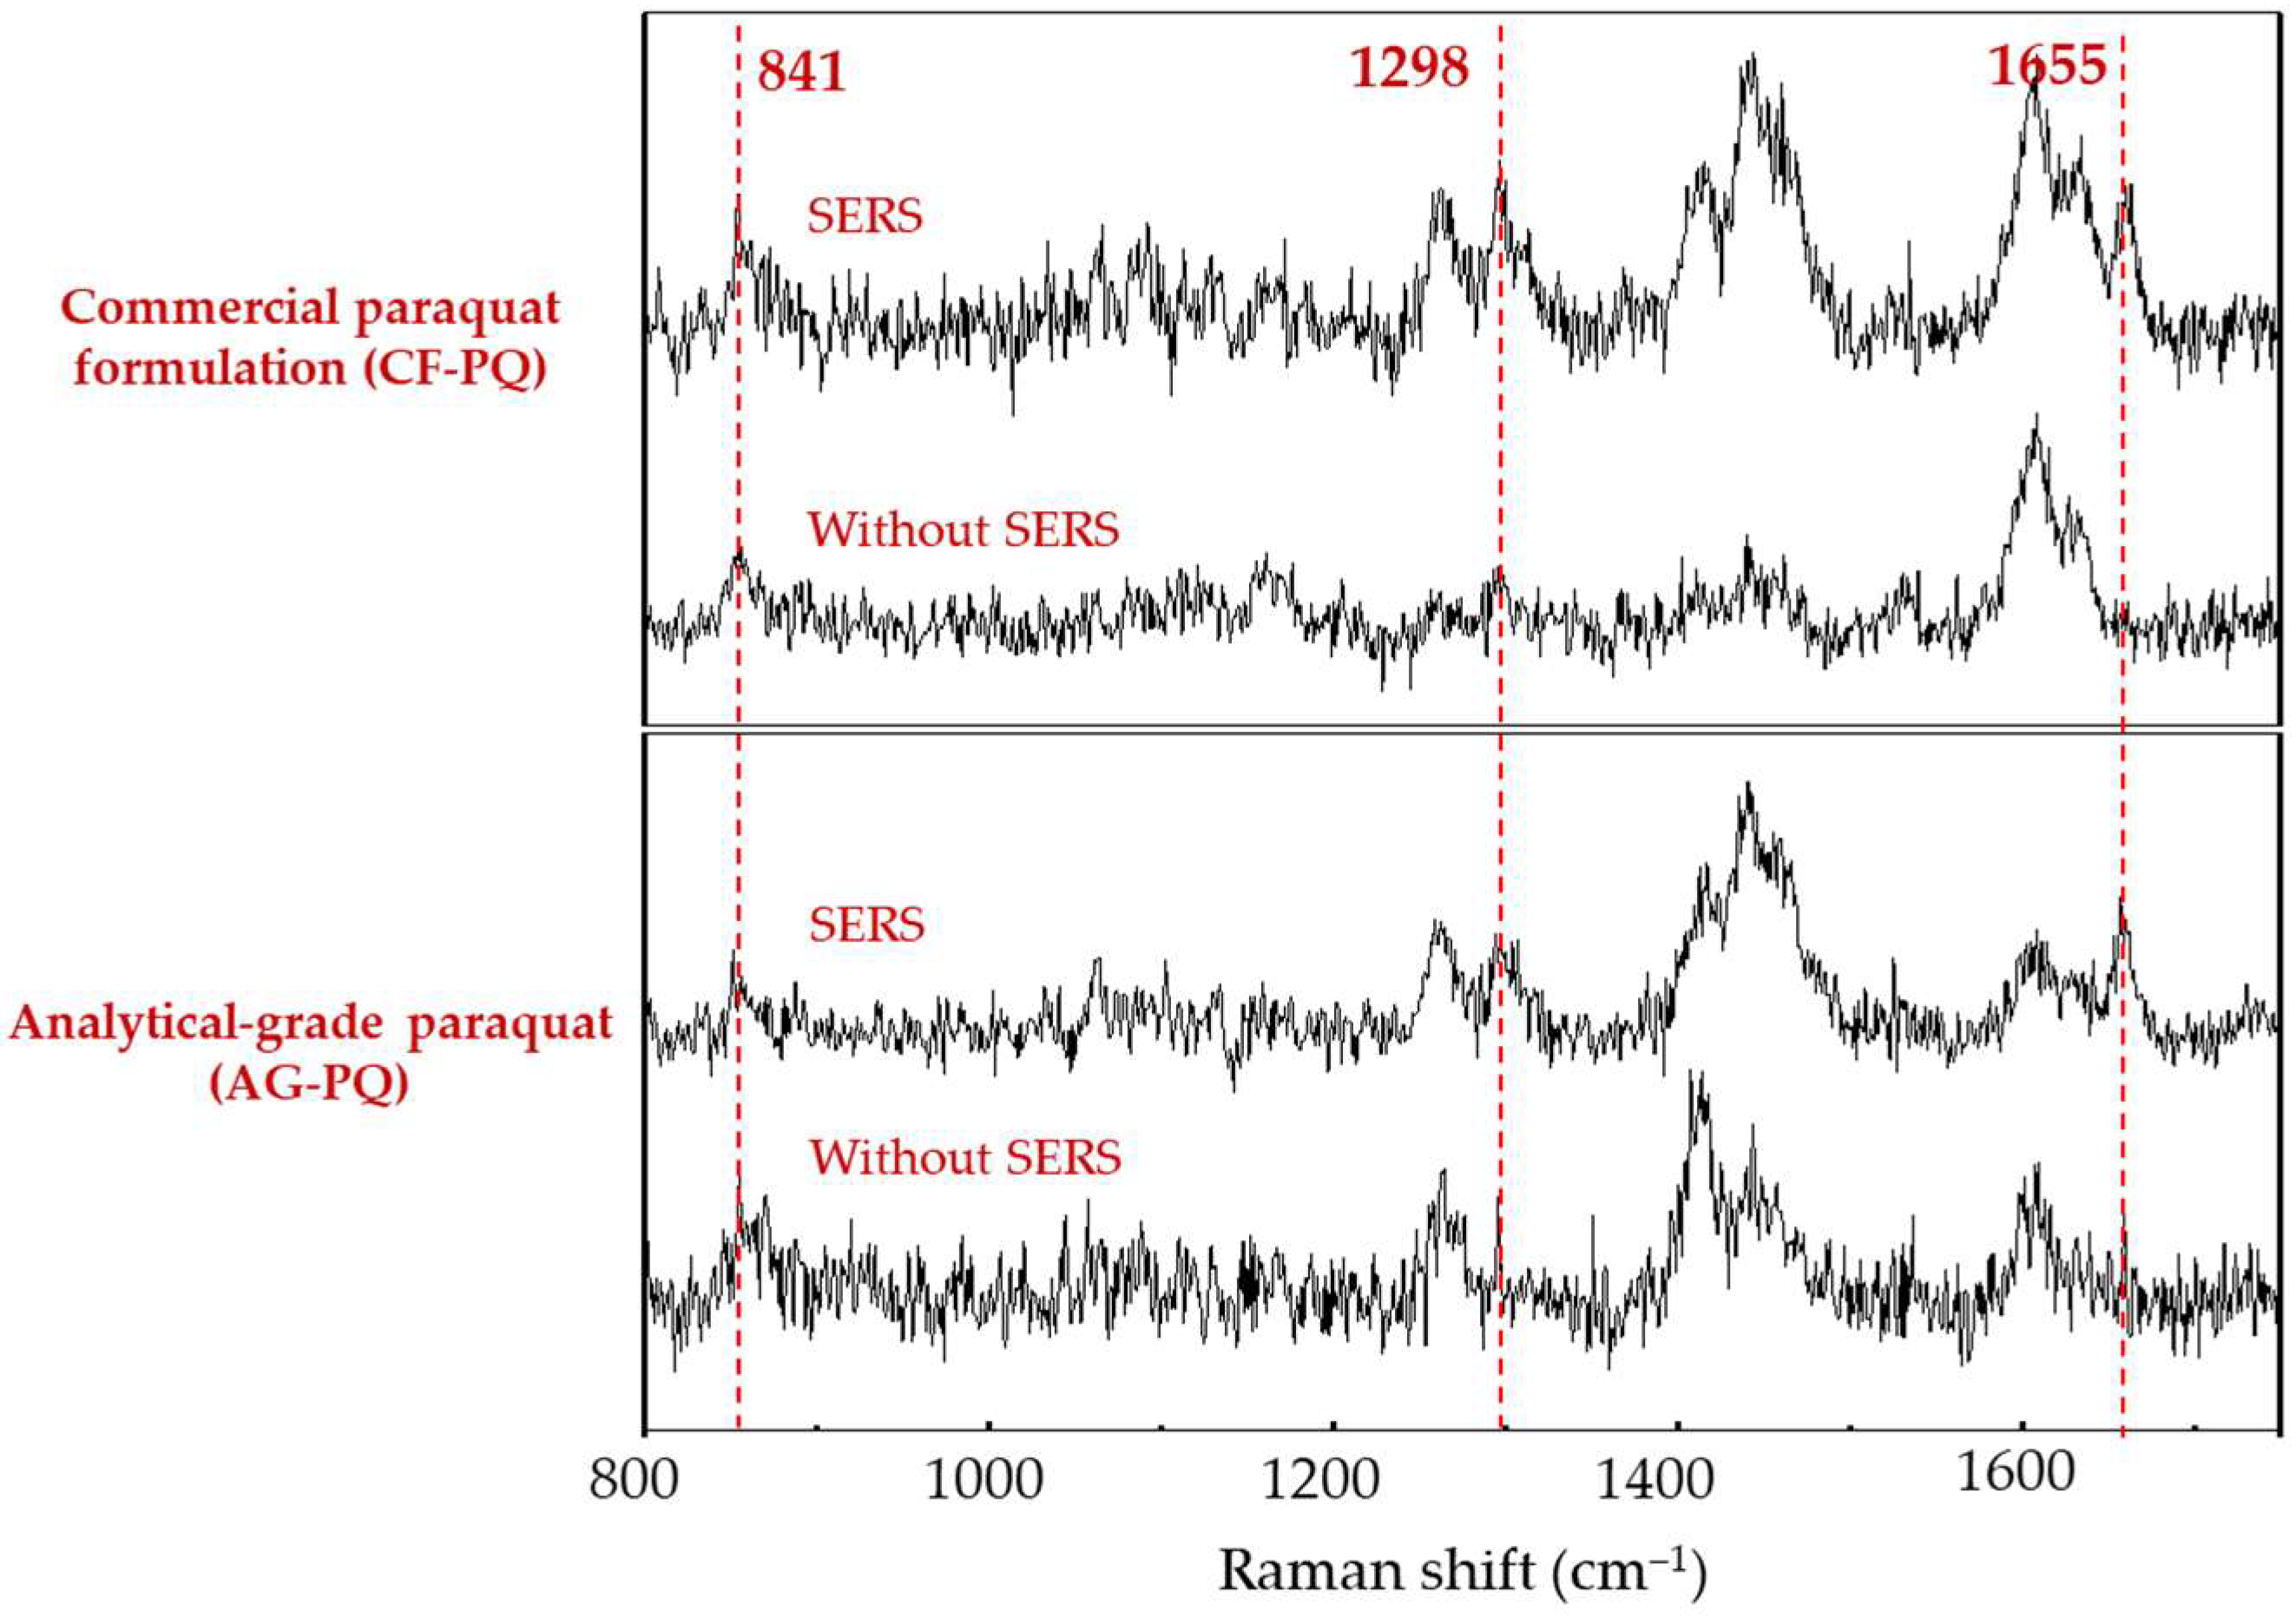
The method was subsequently extended to a real agricultural matrix by applying both laboratory-grade and commercial-grade paraquat solutions (10−4 M) onto Chinese pear peels. Distinct paraquat signals were successfully detected under back-side illumination in both cases (Figure 15). However, the Raman intensity obtained from pear peels was lower than that observed on aluminum foil at comparable concentrations. This difference is mainly attributed to matrix-related effects. Aluminum foil provides a relatively smooth and chemically inert surface, allowing paraquat molecules to remain accessible and interact efficiently with the SERS-active sites.
Figure 15.
Representative SERS spectra of 10−4 M paraquat detected on Chinese pear.
In contrast, the pear peel possesses a rough and porous biological structure, which may partially absorb or retain paraquat within the matrix, thereby reducing its effective interaction with the SERS substrate. In addition, naturally occurring components in the peel may compete for adsorption sites or contribute to background signals, further decreasing the effective enhancement. Therefore, the reduced SERS intensity observed on pear peel is primarily attributed to limited analyte accessibility and matrix interference, rather than an intrinsic difference in substrate performance.
To clarify the spectral contributions, detailed peak assignment was performed. Bands at 841 and 1298 cm−1 were observed in both untreated pear peel and paraquat-treated samples, indicating that these signals originate predominantly from intrinsic matrix components such as polysaccharides (e.g., cellulose and pectin). Features in the 1440–1460 cm−1 region are attributed to CH2 bending vibrations of carbohydrates and cuticular wax constituents, while bands in the 1260–1280 cm−1 range correspond to C–O stretching and CH bending modes of pectic substances. A weak band near ~1600 cm−1 is assigned to C=C stretching vibrations of naturally occurring phenolic compounds present in the peel matrix. Importantly, the band at 1655 cm−1 was detected exclusively after paraquat deposition and was completely absent in the untreated pear peel spectrum. This band is assigned to the aromatic ring stretching vibration of paraquat. The clear spectral separation between the matrix-related feature near ~1600 cm−1 and the paraquat band at 1655 cm−1, together with its exclusive appearance in paraquat-treated samples, confirms its reliability as a diagnostic marker for selective detection in complex agricultural matrices.
Overall, these results indicate that the TSNP-based flexible SERS substrate enables the detection of paraquat on agricultural surfaces with reasonable signal reproducibility under the present experimental conditions. To place the developed platform in the context of previously reported flexible SERS substrates, a comparison with representative literature reports is summarized in Table 5, including the plasmonic nanostructure, flexible substrate, EF, and LOD. While several reported systems achieve lower detection limits under optimized laboratory conditions, the TSNP–PDMS substrate developed in this work may offer additional practical features arising from the anisotropic plasmonic properties of TSNPs combined with the flexible PDMS support, which can facilitate back-side measurements and nondestructive detection on agricultural surfaces.
Table 5.
Comparison of representative polymer-based flexible SERS substrates reported in the literature.
4. Conclusions
In summary, a flexible SERS substrate based on TSNPs immobilized on a PDMS substrate was successfully developed for sensitive and nondestructive pesticide detection. The integration of highly anisotropic TSNPs with a mechanically compliant PDMS support enabled strong LSPR enhancement while maintaining conformal contact with irregular surfaces. Surface activation by oxygen plasma followed by MPTMS silanization facilitated stable TSNP immobilization and uniform hotspot distribution, with an optimized TSNP ink absorbance of 2.0 providing the highest enhancement efficiency and signal reproducibility. The flexible substrate exhibited reliable dual-mode detection under both front-side and back-side illumination configurations, with back-side detection consistently producing stronger SERS signals due to enhanced light scattering and prolonged optical interaction within the PDMS matrix. The platform enabled quantitative detection of R6G down to 10−5 M and paraquat on aluminum foil with a detection limit of 5 × 10⁻⁶ M. Furthermore, in situ and damage-free detection of paraquat residues on Chinese pear peels was successfully demonstrated, highlighting the capability of the flexible SERS platform for conformal detection directly on real agricultural surfaces. Overall, this work establishes a flexible TSNP-based SERS sensing platform that integrates anisotropic plasmonic nanostructures with mechanically adaptable substrates. The demonstrated dual-mode detection capability and successful analysis of real agricultural samples suggest its potential applicability for rapid screening of pesticide residues on crop surfaces.
Author Contributions
Conceptualization, A.K., K.T., T.S., N.N. and F.C.; methodology, A.K., K.T., N.N. and F.C.; software, A.K., N.N. and T.S.; validation, A.K., N.N., T.S. and K.T.; formal analysis, A.K., K.T., N.N. and F.C.; investigation, A.K. and K.T.; resources, K.T. and N.N.; data curation, A.K.; writing—original draft preparation, A.K.; writing—review and editing, A.K., T.S., K.T. and F.C.; visualization, A.K.; supervision, T.S. and K.T.; project administration, T.S., K.T. and F.C.; funding acquisition, A.K., T.S., K.T. and F.C. All authors have read and agreed to the published version of the manuscript.
Funding
This research received no external funding.
Data Availability Statement
The original contributions presented in the study are included in the article; further inquiries can be directed at the corresponding author.
Acknowledgments
The authors wish to express their sincere appreciation to the National Science and Technology Development Agency (NSTDA) for granting access to the Raman spectrometer. The authors also gratefully acknowledge the Faculty of Science, King Mongkut’s University of Technology, for providing access to the Raman spectrometer and other scientific facilities. Furthermore, the authors acknowledge with deep appreciation the financial support from the Science Achievement Scholarship of Thailand and the National Research Council of Thailand (NRCT) for educational support.
Conflicts of Interest
Author Kheamrutai Thamaphat was employed by the company Supavut Industry Company Limited. The remaining authors declare that the research was conducted in the absence of any commercial or financial relationships that could be construed as a potential conflict of interest.
References
- Pawlak, K.; Kołodziejczak, M. The Role of Agriculture in Ensuring Food Security in Developing Countries: Considerations in the Context of the Problem of Sustainable Food Production. Sustainability 2020, 12, 5488. [Google Scholar] [CrossRef] [Scilit]
- Trentinaglia, M.T.; Baldi, L.; Peri, M. Supporting Agriculture in Developing Countries: New Insights on the Impact of Official Development Assistance Using a Climate Perspective. Agric. Food Econ. 2023, 11, 39. [Google Scholar] [CrossRef] [Scilit]
- Islam, S. Agriculture, Food Security, and Sustainability: A Review. Explor. Foods Foodomics 2025, 3, 101082. [Google Scholar] [CrossRef] [Scilit]
- Lin, M.H.; Sun, L.; Kong, F.; Lin, M. Rapid Detection of Paraquat Residues in Green Tea using Surface-Enhanced Raman Spectroscopy (SERS) Coupled with Gold Nanostars. Food Control 2021, 130, 108280. [Google Scholar] [CrossRef] [Scilit]
- Roldán, M.L.; Corrado, G.; Francioso, O.; Sanchez-Cortes, S. Interaction of Soil Humic Acids with Herbicide Paraquat Analyzed by Surface-Enhanced Raman Scattering and Fluorescence Spectroscopy on Silver Plasmonic Nanoparticles. Anal. Chim. Acta 2011, 699, 87–95. [Google Scholar] [CrossRef] [Scilit]
- Abdullahi, K.; Saleh, K.J.; Mzungu, I. Effect of Atrazine, 2,4-D Amine, Glyphosate, and Paraquat Herbicides on Soil Microbial Population. J. Environ. Microbiol. Toxicol. 2022, 10, 19–22. [Google Scholar] [CrossRef] [Scilit]
- Martin, J.; Gaudard, L. Paraquat, Diuron, and Atrazine for the Renewal of Chemical Weed Control in Northern Cameroon. Agric. Dév 1997, 29–41. Available online: https://agritrop.cirad.fr/388926/1/document_388926.pdf (accessed on 15 March 2026).
- Heydebreck, F. Monitoring of Paraquat in Soya Products Intended for Animal Feed. Int. J. Food Contam. 2021, 8, 4. [Google Scholar] [CrossRef] [Scilit]
- Vaccari, C.; Dib, R.E.; de Camargo, L.V. Paraquat and Parkinson’s Disease: A Systematic Review Protocol According to the OHAT Approach for Hazard Identification. Syst. Rev. 2017, 6, 98. [Google Scholar] [CrossRef] [Scilit]
- Rajaram, R.; Neelakantan, L. Recent Advances in Estimation of Paraquat Using Various Analytical Techniques: A Review. Results Chem. 2023, 5, 100703. [Google Scholar] [CrossRef] [Scilit]
- Sandín-España, P.; Dagnac, T. Development of Analytical Methods to Analyze Pesticide Residues. Molecules 2023, 28, 3074. [Google Scholar] [CrossRef] [Scilit] [PubMed]
- Hernández-Mesa, M.; Moreno-González, D. Current Role of Mass Spectrometry in the Determination of Pesticide Residues in Food. Separations 2022, 9, 148. [Google Scholar] [CrossRef] [Scilit]
- Romniou, S.E.; Nana, K.; Dasenaki, M.; Komaitis, E.; Proestos, C. Development and Validation of Pesticide Residues Determination Method in Fruits and Vegetables through Liquid and Gas Chromatography Tandem Mass Spectrometry (LC-MS/MS and GC-MS/MS) Employing Modified QuEChERS Method and a Centrifugal Vacuum Concentrator. Agriculture 2022, 12, 1936. [Google Scholar] [CrossRef] [Scilit]
- IFOAM EU Group. Guideline for Pesticide Residue Contamination for International Trade in Organic; IFOAM EU Group: Brussels, Belgium, 2012; Available online: https://www.organicseurope.bio/content/uploads/2020/09/ifoameu_regulation_guideline_for_pesticide_residue_contamination_for_international_trade_in_organic_2012.pdf (accessed on 1 December 2025).
- Srinivasan, P. Pests, pesticides and regulations. In Paraquat; International Institute of Biotechnology and Toxicology (IIBT): New Delhi, India, 2003; pp. 10–17. [Google Scholar]
- Pilot, R.; Signorini, R.; Durante, C.; Orian, L.; Bhamidipati, M.; Fabris, L. A Review on Surface-Enhanced Raman Scattering. Biosensors 2019, 9, 57. [Google Scholar] [CrossRef] [Scilit]
- Sharma, B.; Frontiera, R.R.; Henry, A.I.; Ringe, E.; Van Duyne, R.P. SERS: Materials, Applications, and the Future. Mater. Today 2012, 15, 16–25. [Google Scholar] [CrossRef] [Scilit]
- Schlücker, S. Surface-Enhanced Raman Spectroscopy: Concepts and Chemical Applications. Angew. Chem. Int. Ed. 2014, 53, 4756–4795. [Google Scholar] [CrossRef] [Scilit]
- Mosier-Boss, P.A. Review of SERS Substrates for Chemical Sensing. Nanomaterials 2017, 7, 142. [Google Scholar] [CrossRef] [Scilit]
- Cheng, D.; He, M.; Ran, J.; Cai, G.; Wu, J.; Wang, X. Depositing a Flexible Substrate of Triangular Silver Nanoplates onto Cotton Fabric for Sensitive SERS Detection. Sens. Actuators B Chem. 2018, 270, 508–517. [Google Scholar] [CrossRef] [Scilit]
- Weng, G.; Feng, Y.; Zhou, J.; Li, J.; Zhu, J.; Zhao, J. Sensitive Detection of Choline in Infant Formulas by SERS Marker Transformation Occurring on Filter-Based Flexible Substrate. Sens. Actuators B Chem. 2020, 308, 127754. [Google Scholar] [CrossRef] [Scilit]
- Hocheng, H.; Chen, C.M.; Chou, Y.C.; Lin, C.H. Study of Novel Electric Routing and Integrated Packaging on Biocompatible Flexible Substrates. Microsyst. Technol. 2010, 16, 423–430. [Google Scholar] [CrossRef] [Scilit]
- Alyami, A.; Quinn, A.J.; Iacopino, D. Flexible and Transparent Surface-Enhanced Raman Scattering (SERS)-Active Ag NPs/PDMS Composites for In Situ Detection of Food Contaminants. Talanta 2019, 201, 58–64. [Google Scholar] [CrossRef] [Scilit]
- Zhu, L.; Dai, H.; Zhang, S.; Hu, D.; Zhou, Q.; Zou, M.; Adkins, J.; Zheng, J. Enhanced Surface-Enhanced Raman Scattering (SERS) Sensitivity by the Self-Assembly of Silver Nanoparticles (AgNPs) Laminated on Polydimethylsiloxane (PDMS). Anal. Lett. 2019, 52, 2868–2882. [Google Scholar] [CrossRef] [Scilit]
- Ma, Y.; Du, Y.; Chen, Y.; Gu, C.; Jiang, T.; Wei, G.; Zhou, J. Intrinsic Raman Signal of Polymer Matrix Induced Quantitative Multiphase SERS Analysis Based on Stretched PDMS Film with Anchored Ag Nanoparticles/Au Nanowires. Chem. Eng. J. 2020, 381, 122710. [Google Scholar] [CrossRef] [Scilit]
- Trinh, B.-T.; Nguyen, S.K.; Kim, D.; Nguyen, H.-Q.; Lee, J.; Sohn, Y.; Yoon, I. Cellulose-Based SERS Substrate for Vapor-Phase Thiol Detection with PCA for Enhanced Chemical Selectivity. Chemosensors 2025, 13, 101. [Google Scholar] [CrossRef] [Scilit]
- Serebrennikova, K.V.; Komova, N.S.; Aybush, A.V.; Zherdev, A.V.; Dzantiev, B.B. Flexible Substrate of Cellulose Fiber/Structured Plasmonic Silver Nanoparticles Applied for Label-Free SERS Detection of Malathion. Materials 2023, 16, 1475. [Google Scholar] [CrossRef] [Scilit]
- Wu, J.; Xi, J.; Chen, H.; Li, P.; Zhang, L.; Li, P.; Wu, W. Flexible 2D Nanocellulose-Based SERS Substrate for Pesticide Residue Detection. Carbohydr. Polym. 2022, 277, 118890. [Google Scholar] [CrossRef] [Scilit]
- Liu, X.; Deng, W.; Yang, Y.; Xi, J.; Li, S.; Zhang, L.; Li, P.; Wu, W. Superhydrophobic Nanocellulose-Based Self-Assembled Flexible SERS Substrates for Pesticide Detection. Int. J. Biol. Macromol. 2024, 282, 137171. [Google Scholar] [CrossRef] [Scilit] [PubMed]
- Mehmandoust, S.; Sahbafar, H.; Mohsennezhad, A.; Hadi, A.; Eskandari, V. Experimental and Numerical Evaluations of Flexible Filter Paper Substrates for Sensitive and Rapid Identification of Methyl Parathion Pesticide via Surface-Enhanced Raman Scattering (SERS). Vib. Spectrosc. 2023, 129, 103586. [Google Scholar] [CrossRef] [Scilit]
- Bai, L.; Xue, P.; Liu, Z. Fabrication of a flexible nanofiber membrane for SERS detection of pollutants: An efficient and eco-friendly approach. Spectrochim. Acta Part A Mol. Biomol. Spectrosc. 2025, 334, 125920. [Google Scholar] [CrossRef] [Scilit] [PubMed]
- Ponlamuangdee, K.; Rattanabut, C.; Viriyakitpattana, N.; Roeksrungruang, P.; Karn-orachai, K.; Pimalai, D.; Bamrungsap, S. Fabrication of Paper-Based SERS Substrate Using a Simple Vacuum Filtration System for Pesticides Detection. Anal. Methods 2022, 14, 1765–1773. [Google Scholar] [CrossRef] [Scilit] [PubMed]
- Wu, M.; Zhang, C.; Ji, Y.; Tian, Y.; Wei, H.; Li, C.; Li, Z.; Zhu, T.; Sun, Q.; Man, B.; et al. 3D Ultrasensitive Polymers-Plasmonic Hybrid Flexible Platform for In-Situ Detection. Polymers 2020, 12, 392. [Google Scholar] [CrossRef] [Scilit]
- Wu, W.; Liu, L.; Dai, Z.; Liu, J.; Yang, S.; Zhou, L.; Xiao, X.; Jiang, C.; Roy, V.A.L. Low-Cost, Disposable, Flexible and Highly Reproducible Screen Printed SERS Substrates for the Detection of Various Chemicals. Sci. Rep. 2015, 5, 12205. [Google Scholar] [CrossRef] [Scilit]
- Zhou, N.; Meng, G.; Huang, Z.; Ke, Y.; Zhou, Q.; Hu, X. A Flexible Transparent Ag-NC@PE Film as a Cut-and-Paste SERS Substrate for Rapid In Situ Detection of Organic Pollutants. Analyst 2016, 141, 5864–5869. [Google Scholar] [CrossRef] [Scilit]
- Tan, Y.; Yang, K.; Zhang, X.; Zhou, Z.; Xu, Y.; Xie, A.; Xue, C. Stretchable and Flexible Micro-Nano Substrates for SERS Detection of Organic Dyes. ACS Omega 2023, 8, 14541–14548. [Google Scholar] [CrossRef] [Scilit]
- Wang, K.; Sun, D.-W.; Pu, H.; Wei, Q. Polymer Multilayers Enabled Stable and Flexible Au@Ag Nanoparticle Array for Nondestructive SERS Detection of Pesticide Residues. Talanta 2021, 223, 121782. [Google Scholar] [CrossRef] [Scilit]
- Wang, T.-J.; Barveen, N.R.; Liu, Z.-Y.; Chen, C.-H.; Chou, M.-H. Transparent, Flexible Plasmonic Ag NP/PMMA Substrates Using Chemically Patterned Ferroelectric Crystals for Detecting Pesticides on Curved Surfaces. ACS Appl. Mater. Interfaces 2021, 13, 34910–34922. [Google Scholar] [CrossRef] [Scilit] [PubMed]
- Xu, X.; Hu, X.; Fu, F.; Liu, L.; Liu, X. DNA-Induced Assembly of Silver Nanoparticle Decorated Cellulose Nanofiber: A Flexible Surface-Enhanced Raman Spectroscopy Substrate for the Selective Charge Molecular Detection and Wipe Test of Pesticide Residues in Fruits. ACS Sustain. Chem. Eng. 2021, 9, 5217–5229. [Google Scholar] [CrossRef] [Scilit]
- Li, L.; Chin, W.S. Rapid Fabrication of a Flexible and Transparent Ag Nanocubes@PDMS Film as a SERS Substrate with High Performance. ACS Appl. Mater. Interfaces 2020, 12, 37538–37548. [Google Scholar] [CrossRef] [Scilit]
- Lu, C.-H.; Cheng, M.-R.; Chen, S.; Syu, W.-L.; Chien, M.-Y.; Wang, K.-S.; Chen, J.-S.; Lee, P.-H.; Liu, T.-Y. Flexible PDMS-Based SERS Substrates Replicated from Beetle Wings for Water Pollutant Detection. Polymers 2023, 15, 191. [Google Scholar] [CrossRef] [Scilit] [PubMed]
- Mi, J.; Yuan, Y.; Hao, X.; Lin, Y.; Shi, J. Flexible Large-Area Surface Enhanced Raman Scattering Substrate Based on Bowl-Shaped Arrays of Au Nanoparticles on PDMS. ACS Appl. Nano Mater. 2024, 7, 13664–13671. [Google Scholar] [CrossRef] [Scilit]
- Peng, R.; Zhang, T.; Wang, S.; Liu, Z.; Pan, P.; Xu, X.; Song, Y.; Liu, X.; Yan, S.; Wang, J. Self-Assembly of Strain-Adaptable Surface-Enhanced Raman Scattering Substrate on Polydimethylsiloxane Nanowrinkles. Anal. Chem. 2024, 96, 10620–10629. [Google Scholar] [CrossRef] [Scilit]
- Lin, G.; Zhu, J.; Wang, Y.; Yang, B.; Xiong, S.; Zhang, J.; Wu, W. Fabrication of polydimethylsiloxane (PDMS)-Based Flexible Surface-Enhanced Raman Scattering (SERS) Substrate for Ultrasensitive Detection. J. Vis. Exp. 2023, 65595. [Google Scholar] [CrossRef] [Scilit]
- Zhang, H.; Zhang, Z.; Wang, H.; Huang, L.; Yang, Z.; Wang, Y.; Li, H. Versatile Flexible SERS Substrate for In Situ Detection of Contaminants in Water and Fruits Based on Ag NPs Decorated Wrinkled PDMS Film. Opt. Express 2024, 31, 21025–21037. [Google Scholar] [CrossRef] [Scilit]
- Zhang, C.; Chen, S.; Jiang, Z.; Shi, Z.; Wang, J.; Du, L. Highly Sensitive and Reproducible SERS Substrates Based on Ordered Micropyramid Array and Silver Nanoparticles. ACS Appl. Mater. Interfaces 2021, 13, 21025–21037. [Google Scholar] [CrossRef] [Scilit]
- Tran, N.L.N.; Ta, T.H.K.; Dung, V.H.; Van, T.T.; Le, H.V.; Nhu, H.T.T. Designing Flexible SERS Platforms by Embedding Double-Plasmonic (Ag-Au) Nanostructures in Porous ZIF-8 Frameworks on PDMS. Sens. Actuators A Phys. 2025, 387, 116423. [Google Scholar] [CrossRef] [Scilit]
- Ketkong, A.; Sutthibutpong, T.; Nuntawong, N.; Chutrakulwong, F.; Thamaphat, K. Sensitive Detection of Paraquat in Water Using Triangular Silver Nanoplates as SERS Substrates for Sustainable Agriculture and Water Resource Management. Nanomaterials 2025, 15, 1827. [Google Scholar] [CrossRef] [Scilit] [PubMed]
- Le Ru, E.C.; Etchegoin, P.G. Principles of Surface-Enhanced Raman Spectroscopy and Related Plasmonic Effects, 1st ed.; Elsevier: Amsterdam, The Netherlands, 2009. [Google Scholar]
- Mehta, M.; Waterland, M. Ultrasensitive surface-enhanced Raman scattering detection of biological pollutants by controlled evaporation on omniphobic substrates. Heliyon 2020, 6, e04317. [Google Scholar] [CrossRef] [Scilit]
- Zhao, H.; Huang, D.; Zhu, S. Multibranch Gold Nanoparticles as Surface-Enhanced Raman Spectroscopy Substrates for Rapid and Sensitive Analysis of Fipronil in Eggs. Sensors 2019, 19, 5354. [Google Scholar] [CrossRef] [Scilit]
- Moskovits, M. Surface-Enhanced Raman Spectroscopy: A Brief Retrospective. J. Raman Spectrosc. 2005, 36, 485–496. [Google Scholar] [CrossRef] [Scilit]
- Fang, H.; Zhang, X.; Zhang, S.J.; Liu, L.; Zhao, Y.M.; Xu, H.J. Ultrasensitive and Quantitative Detection of Paraquat on Fruit Skins via Surface-Enhanced Raman Spectroscopy. Sens. Actuators B Chem. 2015, 213, 452–456. [Google Scholar] [CrossRef] [Scilit]
- Tan, S.H.; Nguyen, N.-T.; Chua, Y.C.; Kang, T.G. Oxygen Plasma Treatment for Reducing Hydrophobicity of a Sealed Polydimethylsiloxane Microchannel. Biomicrofluidics 2010, 4, 32204. [Google Scholar] [CrossRef] [Scilit] [PubMed]
- Adly, N.Y.; Hassani, H.; Tran, A.Q.; Balski, M.; Yakushenko, A.; Offenhäusser, A.; Mayer, D.; Wolfrum, B. Observation of Chemically Protected Polydimethylsiloxane: Towards Crack-Free PDMS. Soft Matter 2017, 13, 6297–6303. [Google Scholar] [CrossRef] [Scilit] [PubMed]
- Osmani, B.; Deyhle, H.; Weiss, F.M.; Töpper, T.; Karapetkova, M.; Leung, V.; Müller, B. Morphology and Conductivity of Au Films on Polydimethylsiloxane Using (3-Mercaptopropyl)trimethoxysilane (MPTMS) as an Adhesion Promoter. In Electroactive Polymer Actuators and Devices (EAPAD) 2016; Proceedings of SPIE; SPIE: Bellingham, WA, USA, 2016; Volume 9798, p. 979822. [Google Scholar]
- Kim, J.H.; Park, H.; Seo, S.W. In situ Synthesis of Silver Nanoparticles on The Surface of PDMS with High Antibacterial Activity and Biosafety Toward an Implantable Medical Device. Nano Converg. 2017, 4, 26. [Google Scholar] [CrossRef] [Scilit] [PubMed]
- Kim, Y.; Baek, S.; Gupta, P.; Kim, C.; Chang, K.; Ryu, S.-P.; Kang, H.; Kim, W.-S.; Myoung, J.; Park, W.; et al. Air-Like Plasmonics with Ultralow-Refractive-Index Silica Aerogels. Sci. Rep. 2019, 9, 2265. [Google Scholar] [CrossRef] [Scilit] [PubMed]



Disclaimer/Publisher’s Note: The statements, opinions and data contained in all publications are solely those of the individual author(s) and contributor(s) and not of MDPI and/or the editor(s). MDPI and/or the editor(s) disclaim responsibility for any injury to people or property resulting from any ideas, methods, instructions or products referred to in the content. |
© 2026 by the authors. Licensee MDPI, Basel, Switzerland. This article is an open access article distributed under the terms and conditions of the Creative Commons Attribution (CC BY) license.