


Abstract
Background/Objectives: To examine the association between the triglyceride-glucose (TyG) index, a surrogate marker of insulin resistance, and metabolic syndrome (MetS), and to develop a model for predicting MetS risk to support early prevention. Methods: Participants were free of MetS at baseline in 2016 and had ascertainable follow-up outcomes in 2026. Baseline measurements were candidate predictors, and MetS detected at follow-up was the binary outcome. Continuous and categorical variables were compared using the Mann–Whitney U test and Pearson’s chi-square or Fisher’s exact test, respectively. Variables with an overall p < 0.20 in univariable logistic regression entered LASSO logistic regression. Predictors were selected using stratified tenfold cross-validation and the one-standard-error rule. Eight selected variables were entered into multivariable logistic regression to estimate adjusted odds ratios and construct a nomogram. Logistic regression and random forest models using these fixed predictors were assessed with the same stratified tenfold splits. Out-of-fold AUCs and Brier scores were calculated, and random forest calibration and decision curves were plotted. Results: The study included 1304 participants. Eight predictors were selected: age, body weight, BMI, LDL-C, uric acid, HbA1c, left forearm T-score, and TyG index. Each one-unit increase in TyG was associated with an adjusted odds ratio of 1.86 (95% CI 1.41–2.47; p < 0.001). The random forest model had apparent and out-of-fold AUCs of 0.833 and 0.748, and Brier scores of 0.1478 and 0.1716, respectively. Out-of-fold decision curves indicated greater estimated net benefit than screening all or no participants at thresholds of 20%, 30%, and 40%. Conclusions: The TyG-centered MetS risk prediction model showed moderate discrimination and calibration. Its performance and clinical utility require evaluation in an independent population before use in screening.
1. Introduction
Metabolic syndrome (MetS) is a cluster of clinical abnormalities characterized primarily by abdominal obesity, elevated blood pressure, and disturbances in glucose and lipid metabolism [1]. Nationally representative surveys indicate a substantial burden of MetS among Chinese adults. Analyses of the national nutrition and health surveys conducted in 2002 and 2010–2012 showed that its prevalence increased from 9.5% to 18.7% [2]. Another study based on the 2015–2017 China Nutrition and Health Surveillance reported a standardized adult prevalence of 31.1% [3]. Insulin resistance, chronic inflammation, and oxidative stress are closely associated with the development and progression of MetS [1,4]. A cross-sectional study in Romania also identified associations between several surrogate indices of insulin resistance and MetS [5]. Although the hyperinsulinemic–euglycemic clamp is the gold standard for assessing insulin sensitivity, its complexity and cost limit its use in large-scale population screening [6]. The triglyceride-glucose (TyG) index, calculated from fasting triglyceride and glucose concentrations, is a simple surrogate marker of insulin resistance [7,8]. Previous studies have mainly examined its ability to identify concurrent MetS [9,10], while cohort studies have also evaluated its association with incident MetS [11]. However, its long-term predictive performance and applicability across populations require further assessment. This study therefore used baseline measurements and follow-up MetS outcomes to develop a risk prediction model to support risk stratification among individuals attending hospital health examinations.
2. Materials and Methods
2.1. Data Sources
This study used multicenter survey data from plateau regions of western China. Surveys were conducted at Linxia Municipal People’s Hospital, Gannan Prefecture People’s Hospital, Xiahe County People’s Hospital, Yushu Prefecture People’s Hospital in Qinghai, and Shigatse Municipal People’s Hospital in Tibet in 2016 (baseline) and 2026 (follow-up). Convenience sampling was used to recruit individuals attending health examinations at the participating hospitals.
Inclusion criteria were age ≥18 years and substantially complete demographic information, physical measurements, and core laboratory tests.
Exclusion criteria were pregnancy; severe visual or hearing impairment or communication difficulties; and missing key measurements, including age, sex, fasting glucose, or blood lipids.
A total of 1911 participants were enrolled at baseline in 2016. During follow-up, 269 did not complete the survey, including 25 who died. Survey data were obtained from 1642 participants in 2026. After excluding 30 participants without baseline data, paired records were available for 1612 participants. Excluding 276 participants with MetS at baseline and 12 whose baseline MetS status could not be determined because of missing data left 1324 participants. A further 20 participants with indeterminate follow-up MetS outcomes were excluded, yielding a final analytical sample of 1304.
MetS was defined according to the Chinese Diabetes Society’s Guidelines for the Prevention and Treatment of Type 2 Diabetes in China (2020 Edition) [12]. Participants were required to meet at least three of the following five criteria: (1) abdominal obesity, defined as waist circumference ≥ 90 cm in men or ≥85 cm in women; (2) fasting plasma glucose (FPG) ≥ 6.1 mmol/L and/or 2 h plasma glucose (2 hPG) ≥ 7.8 mmol/L, and/or diagnosed diabetes under treatment; (3) blood pressure ≥ 130/85 mmHg and/or diagnosed hypertension under treatment; (4) fasting triglycerides (TG) ≥ 1.7 mmol/L; and (5) fasting high-density lipoprotein cholesterol (HDL-C) < 1.04 mmol/L.
The same measurement thresholds were applied at baseline in 2016 and follow-up in 2026. At baseline, medication fields were unavailable in the merged analytical dataset. Measured values meeting the relevant threshold qualified the glycemic or blood-pressure component as positive. The treatment criterion was coded as negative when the corresponding disease history was explicitly recorded as absent and as unknown when the history was positive or unclear. At follow-up, a recorded history of diabetes together with recorded use of glucose-lowering medication qualified the glycemic component as positive, and a recorded history of hypertension together with recorded use of antihypertensive medication qualified the blood-pressure component as positive. Measured values meeting the relevant threshold also qualified these components as positive. When a disease history was recorded but the corresponding medication status was missing, the treatment criterion was coded as unknown. MetS was classified as present when at least three of the five components were positive and as absent when at least three were negative. The remaining records were classified as indeterminate.
2.2. Study Procedures
2.2.1. Questionnaire Survey
Uniformly trained investigators contacted participants by telephone to schedule surveys and health examinations at designated sites and used standardized instructions to explain questionnaire completion. For participants unable to complete the questionnaire independently, investigators asked each question without leading the respondent and recorded the answers [13]. Information collected included demographics (age, sex, ethnicity, educational attainment, occupation, and annual household income), lifestyle factors (active and passive smoking), and personal medical history (menopausal status, dyslipidemia, hyperuricemia, and gout). Histories of dyslipidemia, hyperuricemia, and gout were collected in the questionnaire and considered candidate predictors. The lipid components of the MetS definition were determined from measured triglyceride and HDL-C concentrations.
2.2.2. Physical Examination
Height, body weight, waist circumference, and blood pressure were measured. Height and weight were assessed with uniformly calibrated equipment while participants wore light clothing and no shoes or hats, to the nearest 0.1 cm and 0.1 kg, respectively. Waist circumference was measured 1 cm above the umbilicus while participants stood naturally and breathed calmly, to the nearest 0.1 cm. Body mass index (BMI) was calculated as weight (kg)/height2 (m2). Blood pressure was measured using a calibrated electronic sphygmomanometer on the right upper arm with the participant seated after 5 min of quiet rest. Three consecutive measurements were obtained at 5 min intervals and averaged.
2.2.3. Laboratory Tests
The same measurement protocol was used in both survey waves. Fasting venous blood was collected on the survey day. For the oral glucose tolerance test (OGTT), participants drank a solution containing 75 g of anhydrous glucose dissolved in 250–300 mL of warm water within 5 min. A second venous blood sample was collected 120 min after the glucose load to measure 2 h plasma glucose (2 hPG). Fasting plasma glucose (FPG), 2 hPG, total cholesterol (TC), triglycerides (TG), low-density lipoprotein cholesterol (LDL-C), high-density lipoprotein cholesterol (HDL-C), and uric acid (UA) were measured using BS-220 automated biochemical analyzer (Shenzhen Mindray Bio-Medical Electronics Co., Ltd., Shenzhen, China). Thyroid-stimulating hormone (TSH), thyroid peroxidase antibodies (TPOAb), and thyroglobulin antibodies (TgAb) were measured using cobas e 601 electrochemiluminescence immunoassay analyzer (Roche Diagnostics GmbH, Mannheim, Germany). Glycated hemoglobin (HbA1c) was measured using VARIANT II analyzer (Bio-Rad Laboratories, Inc., Hercules, CA, USA). Fasting urine samples were stored at −20 °C and sent to the central project laboratory for urinary iodine measurement. Glucose, TG, and cholesterol measurements were expressed in mmol/L. Laboratory personnel performed the assays according to the manufacturers’ instructions, and internal quality controls remained within acceptable limits. The left radius was assessed using quantitative ultrasound with an OSTEOKJ7000A+ device (Nanjing Kejin Industrial Co., Ltd., Nanjing, China). The device measured the speed of sound along the radius and reported the left radial T-score. The 2 hPG value was used to determine the glycemic component of MetS at baseline and follow-up.
2.2.4. Calculation of the Composite Index
The TyG index was calculated as ln[TG (mg/dL) × FPG (mg/dL)/2] [14].
Original TG and FPG values were expressed in mmol/L and converted to mg/dL by multiplying by 88.57 and 18.018, respectively, before calculating TyG.
2.3. Data Processing and Statistical Analysis
Questionnaire and laboratory data were independently entered twice using EpiData 3.1 and checked for discrepancies. Analyses were performed in Python (v3.12.14). Categorical coding was verified against the original survey records; medical histories recorded as “unknown” were treated as missing. Unusual laboratory values were checked, and processing decisions were documented. Chained-equations imputation generated ten datasets for missing baseline predictors. For continuous variables, imputed values were averaged across datasets; for categorical variables, the mode was used, producing a single analytical dataset. Participants were grouped by MetS status at follow-up in 2026. Continuous variables were summarized as medians and quartiles, M (P25, P75), and compared using the Mann–Whitney U test. Categorical variables were presented as counts and percentages and compared using Pearson’s chi-square test or Fisher’s exact test when expected counts were small. Values for multicategory Fisher tests were estimated using Monte Carlo simulation.
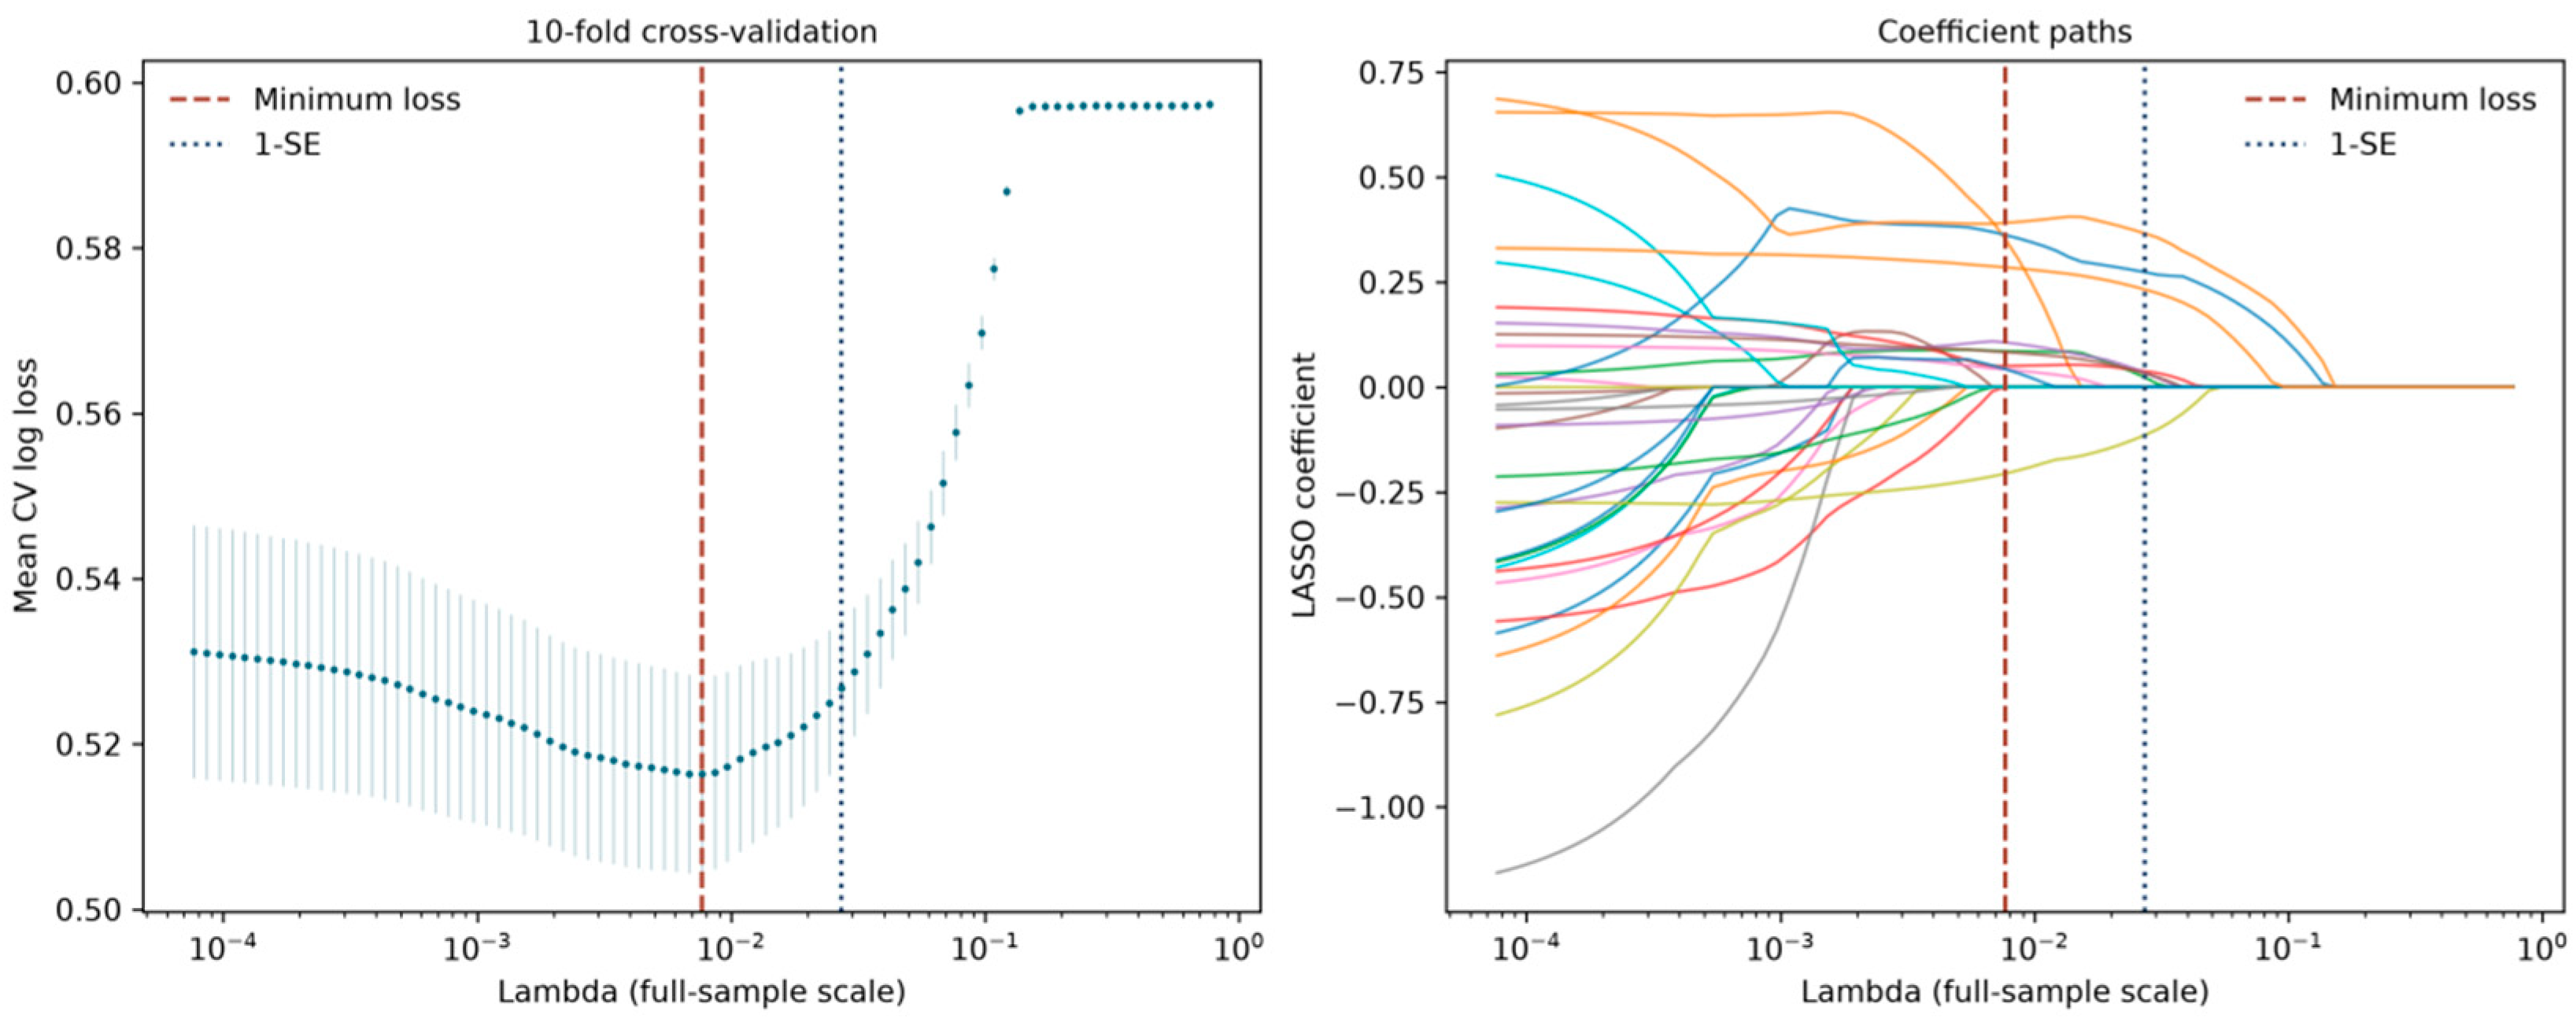
Baseline measurements from 2016 were candidate predictors, and MetS status at follow-up in 2026 was the binary outcome. Univariable logistic regression was performed first, and variables with an overall p < 0.20 entered LASSO logistic regression [15]. Categorical variables were dummy-coded with reference categories. Continuous variables were standardized within each training fold, and the corresponding parameters were applied to its validation fold. Stratified tenfold cross-validation used mean log loss for tuning. The penalty parameter was selected using the one-standard-error (1-SE) rule, retaining eight baseline predictors.
In the original analysis, univariable screening and LASSO predictor selection were performed on the full development dataset before the eight selected predictors were held fixed for tenfold cross-validation. We subsequently evaluated the full model development procedure using stratified tenfold outer cross-validation and stratified fivefold inner cross-validation. Imputation, preprocessing, and univariable screening were repeated within each inner training split. The LASSO penalty was selected using mean log loss and the one-standard-error rule. Within each outer training set, preprocessing and screening were repeated, the selected penalty was applied, and a random forest was fitted using the predictors retained in that fold. The number of candidate predictors at each split was capped at three. Predictions from the outer test folds were pooled to calculate performance metrics. Missingness was assessed before imputation for each candidate predictor. Among the eight predictors retained in the original model, missingness ranged from 0% to 10.89%. We used chained-equation imputation to retain partially observed records and make use of available predictor information. Missing continuous and categorical values were imputed using training-set medians and modes, respectively. A sensitivity analysis repeated the nested procedure using deterministic chained regression imputation for continuous predictors.
A random forest classifier was constructed using these eight predictors [16]. The prespecified configuration comprised 500 decision trees, a maximum depth of five, at least ten records per leaf, and three randomly selected candidate variables at each split, with Gini impurity as the splitting criterion. Individual predicted probabilities of MetS were obtained by averaging the probabilities across trees.
Apparent performance and stratified tenfold out-of-fold performance after fixing the eight predictors were reported separately. Discrimination was assessed using receiver operating characteristic (ROC) curves and the area under the curve (AUC). Overall probability prediction error was assessed with the Brier score. Calibration curves compared mean predicted probabilities with observed MetS proportions within deciles of predicted risk. Overall accuracy, sensitivity, and specificity were calculated at a classification threshold of 0.50. Decision curve analysis (DCA) [17] estimated net benefit across threshold probabilities and compared model-guided further screening with screening all or no participants. All tests were two-sided, with α = 0.05.
3. Results
3.1. Participant Characteristics
The final sample comprised 1304 participants, including 371 with MetS and 933 without MetS at follow-up. Comparisons of their 2016 baseline characteristics showed significant differences in age, height, weight, BMI, TyG index, TC, LDL-C, UA, HbA1c, serum calcium, serum phosphorus, left forearm bone mineral density and T-score, and right calcaneal bone mineral density and T-score (all p < 0.05). TSH, TPOAb, TgAb, urinary iodine, alanine aminotransferase (ALT), aspartate aminotransferase (AST), AST/ALT ratio, and vitamin D did not differ significantly (all p > 0.05; Table 1 and Table 2).
Table 1.
Univariable comparisons of 2016 baseline characteristics by MetS outcome in 2026.
Table 2.
Cont. Categorical baseline characteristics by MetS outcome in 2026.
3.2. LASSO Regression Analysis
Candidate predictors included demographics, lifestyle factors, physical measurements, and laboratory results. Following univariable screening, 23 variables with an overall p < 0.20 entered LASSO regression. Stratified tenfold cross-validation and the 1-SE rule were used to select the penalty parameter. Eight baseline predictors retained nonzero coefficients: age, weight, BMI, LDL-C, UA, HbA1c, left forearm T-score, and TyG index. These were used to construct the random forest model (Figure 1).
Figure 1.
Predictor selection using LASSO regression.
3.3. Multivariable Logistic Regression Analysis
The eight LASSO-selected baseline variables were entered simultaneously into multivariable logistic regression. For each 10-year increase in age, 5 kg increase in weight, 1 kg/m2 increase in BMI, and one-unit increase in TyG, the adjusted odds ratios for MetS detected at follow-up in 2026 were 1.136 (95% CI 1.002–1.287), 1.175 (95% CI 1.041–1.326), 1.174 (95% CI 1.082–1.273), and 1.864 (95% CI 1.409–2.467), respectively (all p < 0.05). Each one-unit increase in left forearm T-score was associated with an adjusted odds ratio of 0.805 (95% CI 0.710–0.913; p < 0.001). After adjustment for the other variables, LDL-C, UA, and HbA1c were not significantly associated with follow-up MetS (all p > 0.05; Table 3). The overall likelihood-ratio test indicated that the eight-predictor model fitted better than the intercept-only model (χ2 = 232.982, df = 8; p < 0.001). Cox–Snell and Nagelkerke pseudo-R2 values were 0.164 and 0.235, respectively. At a predicted probability threshold of 0.50, the original eight-predictor logistic regression model had an apparent sensitivity of 34.2% and specificity of 92.7% when evaluated in the development sample.
Table 3.
Multivariable logistic regression analysis of MetS risk.
3.4. Prediction Model Development and Performance
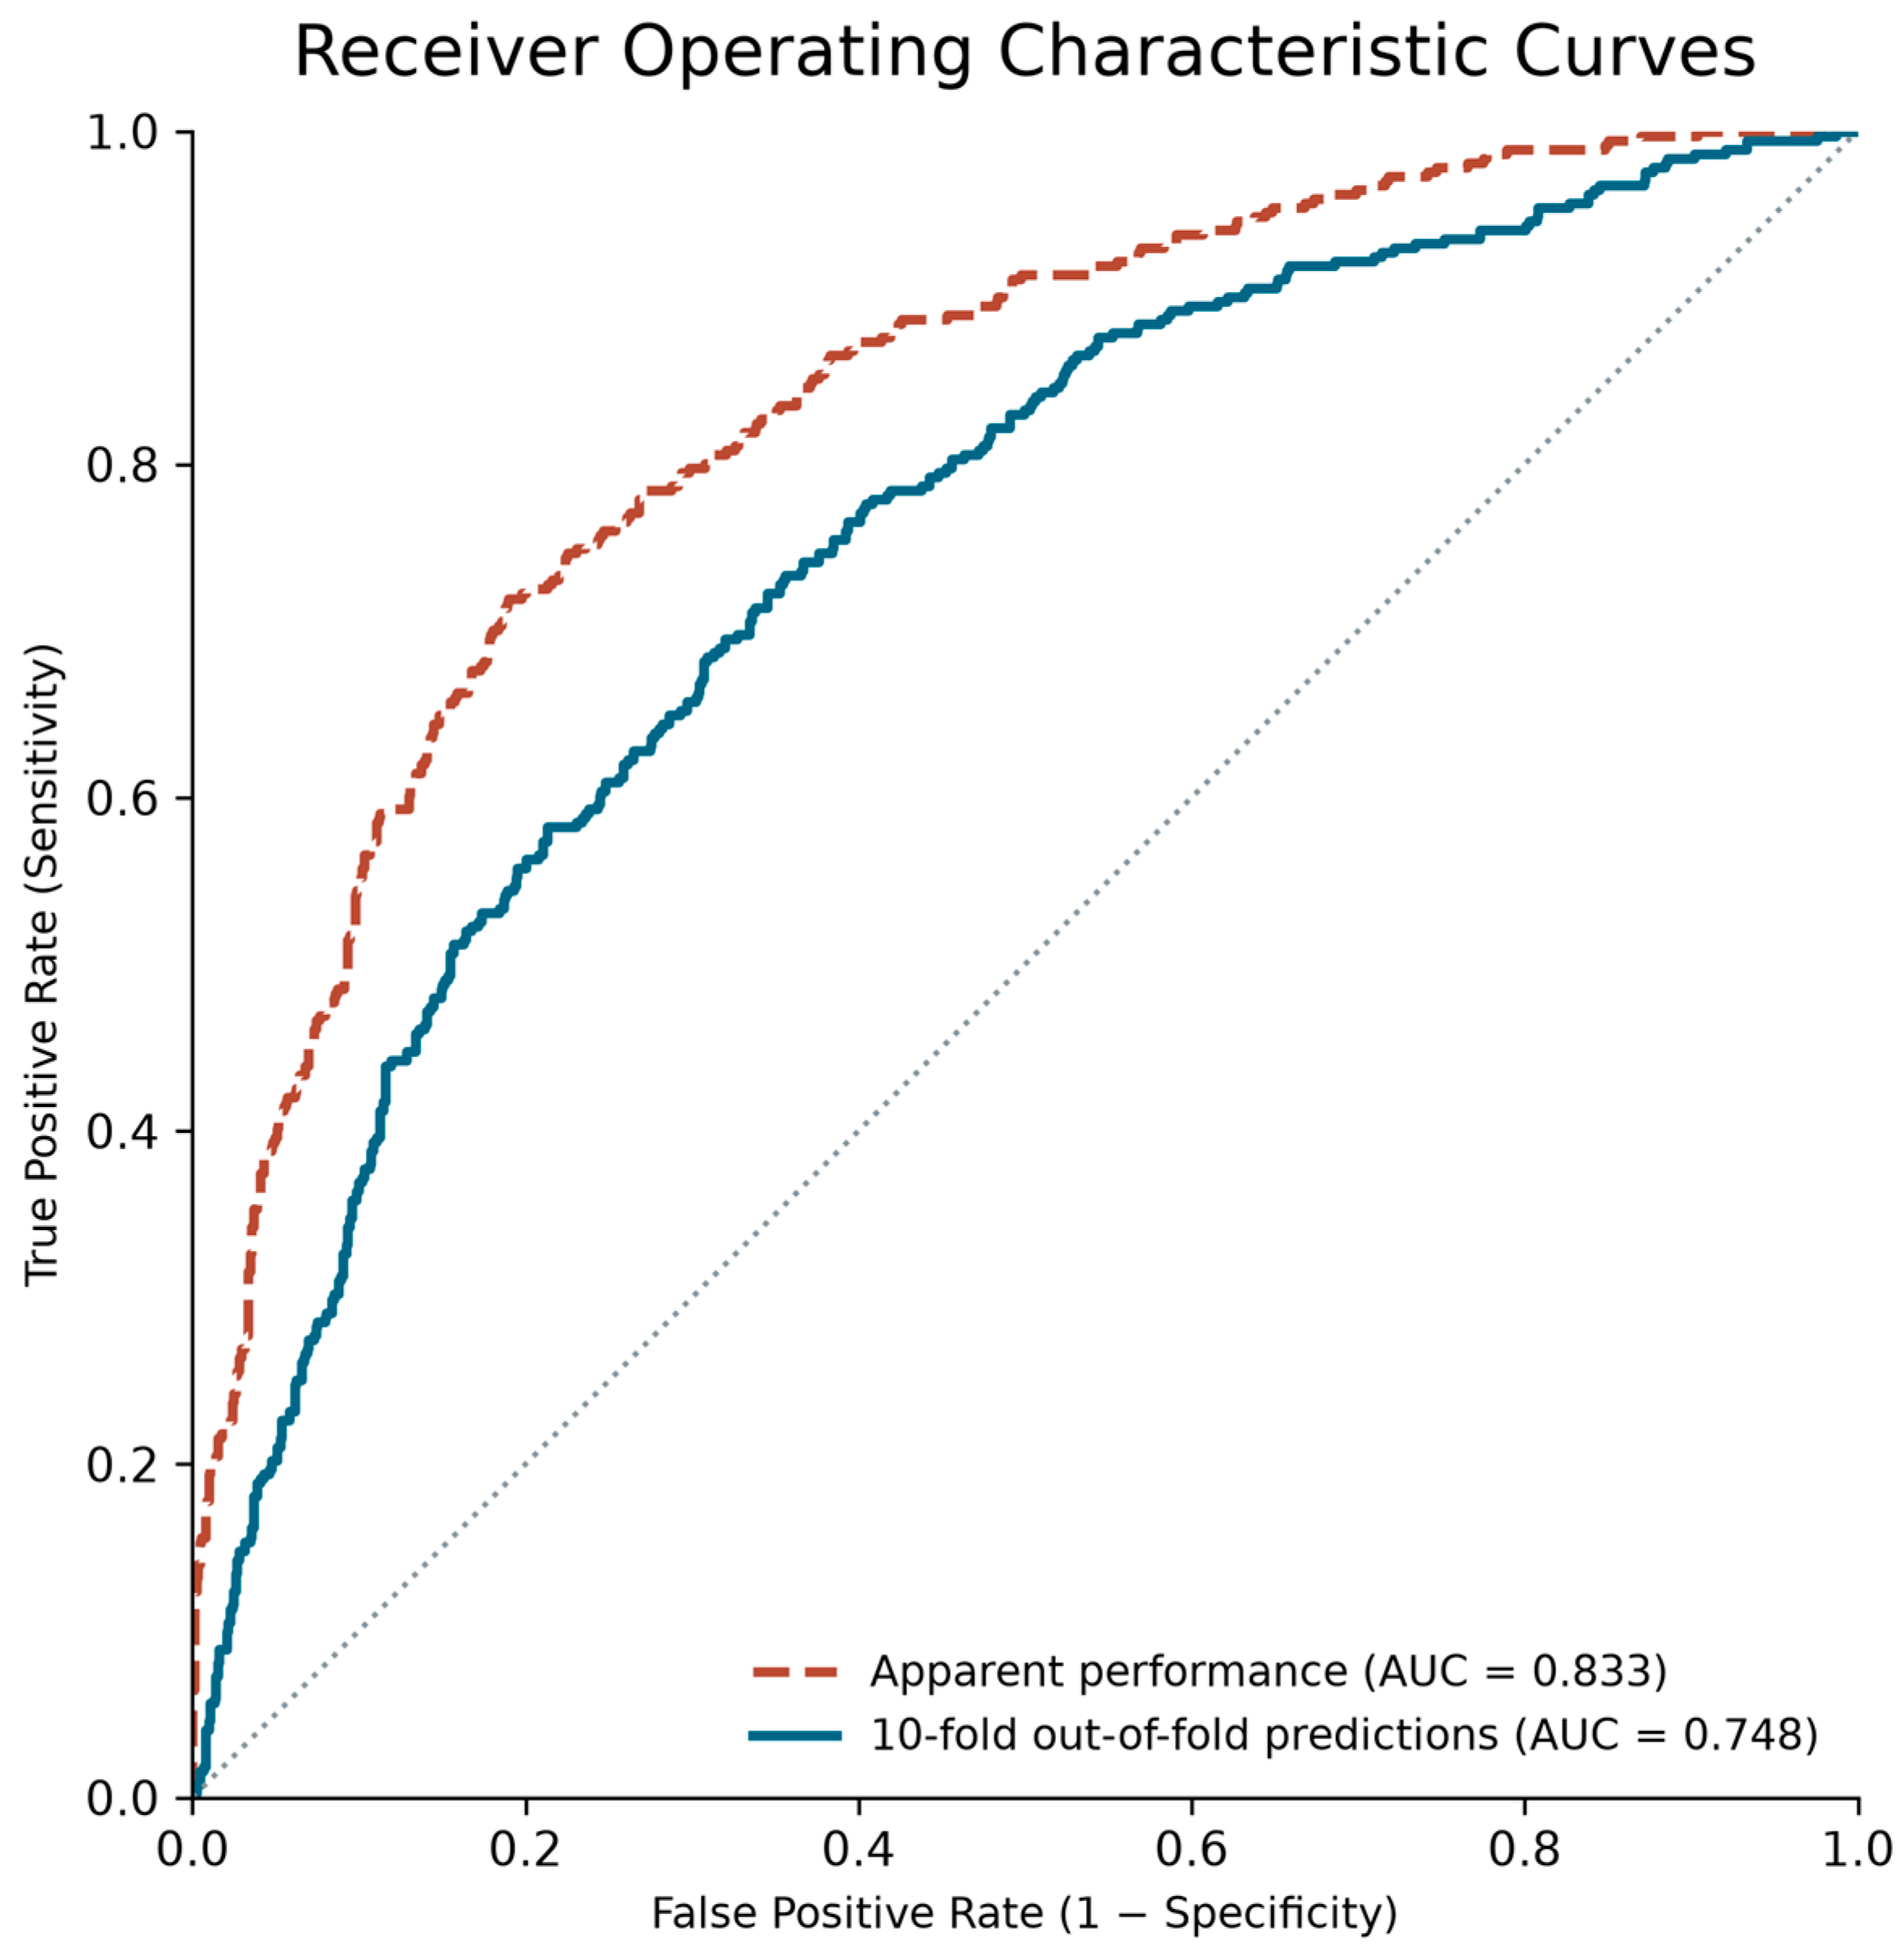
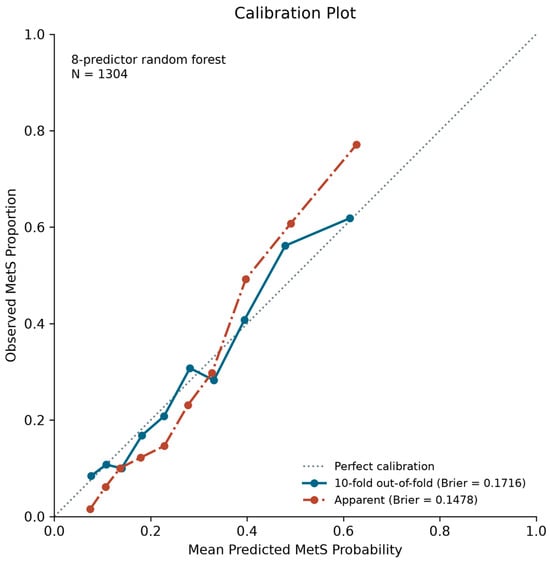
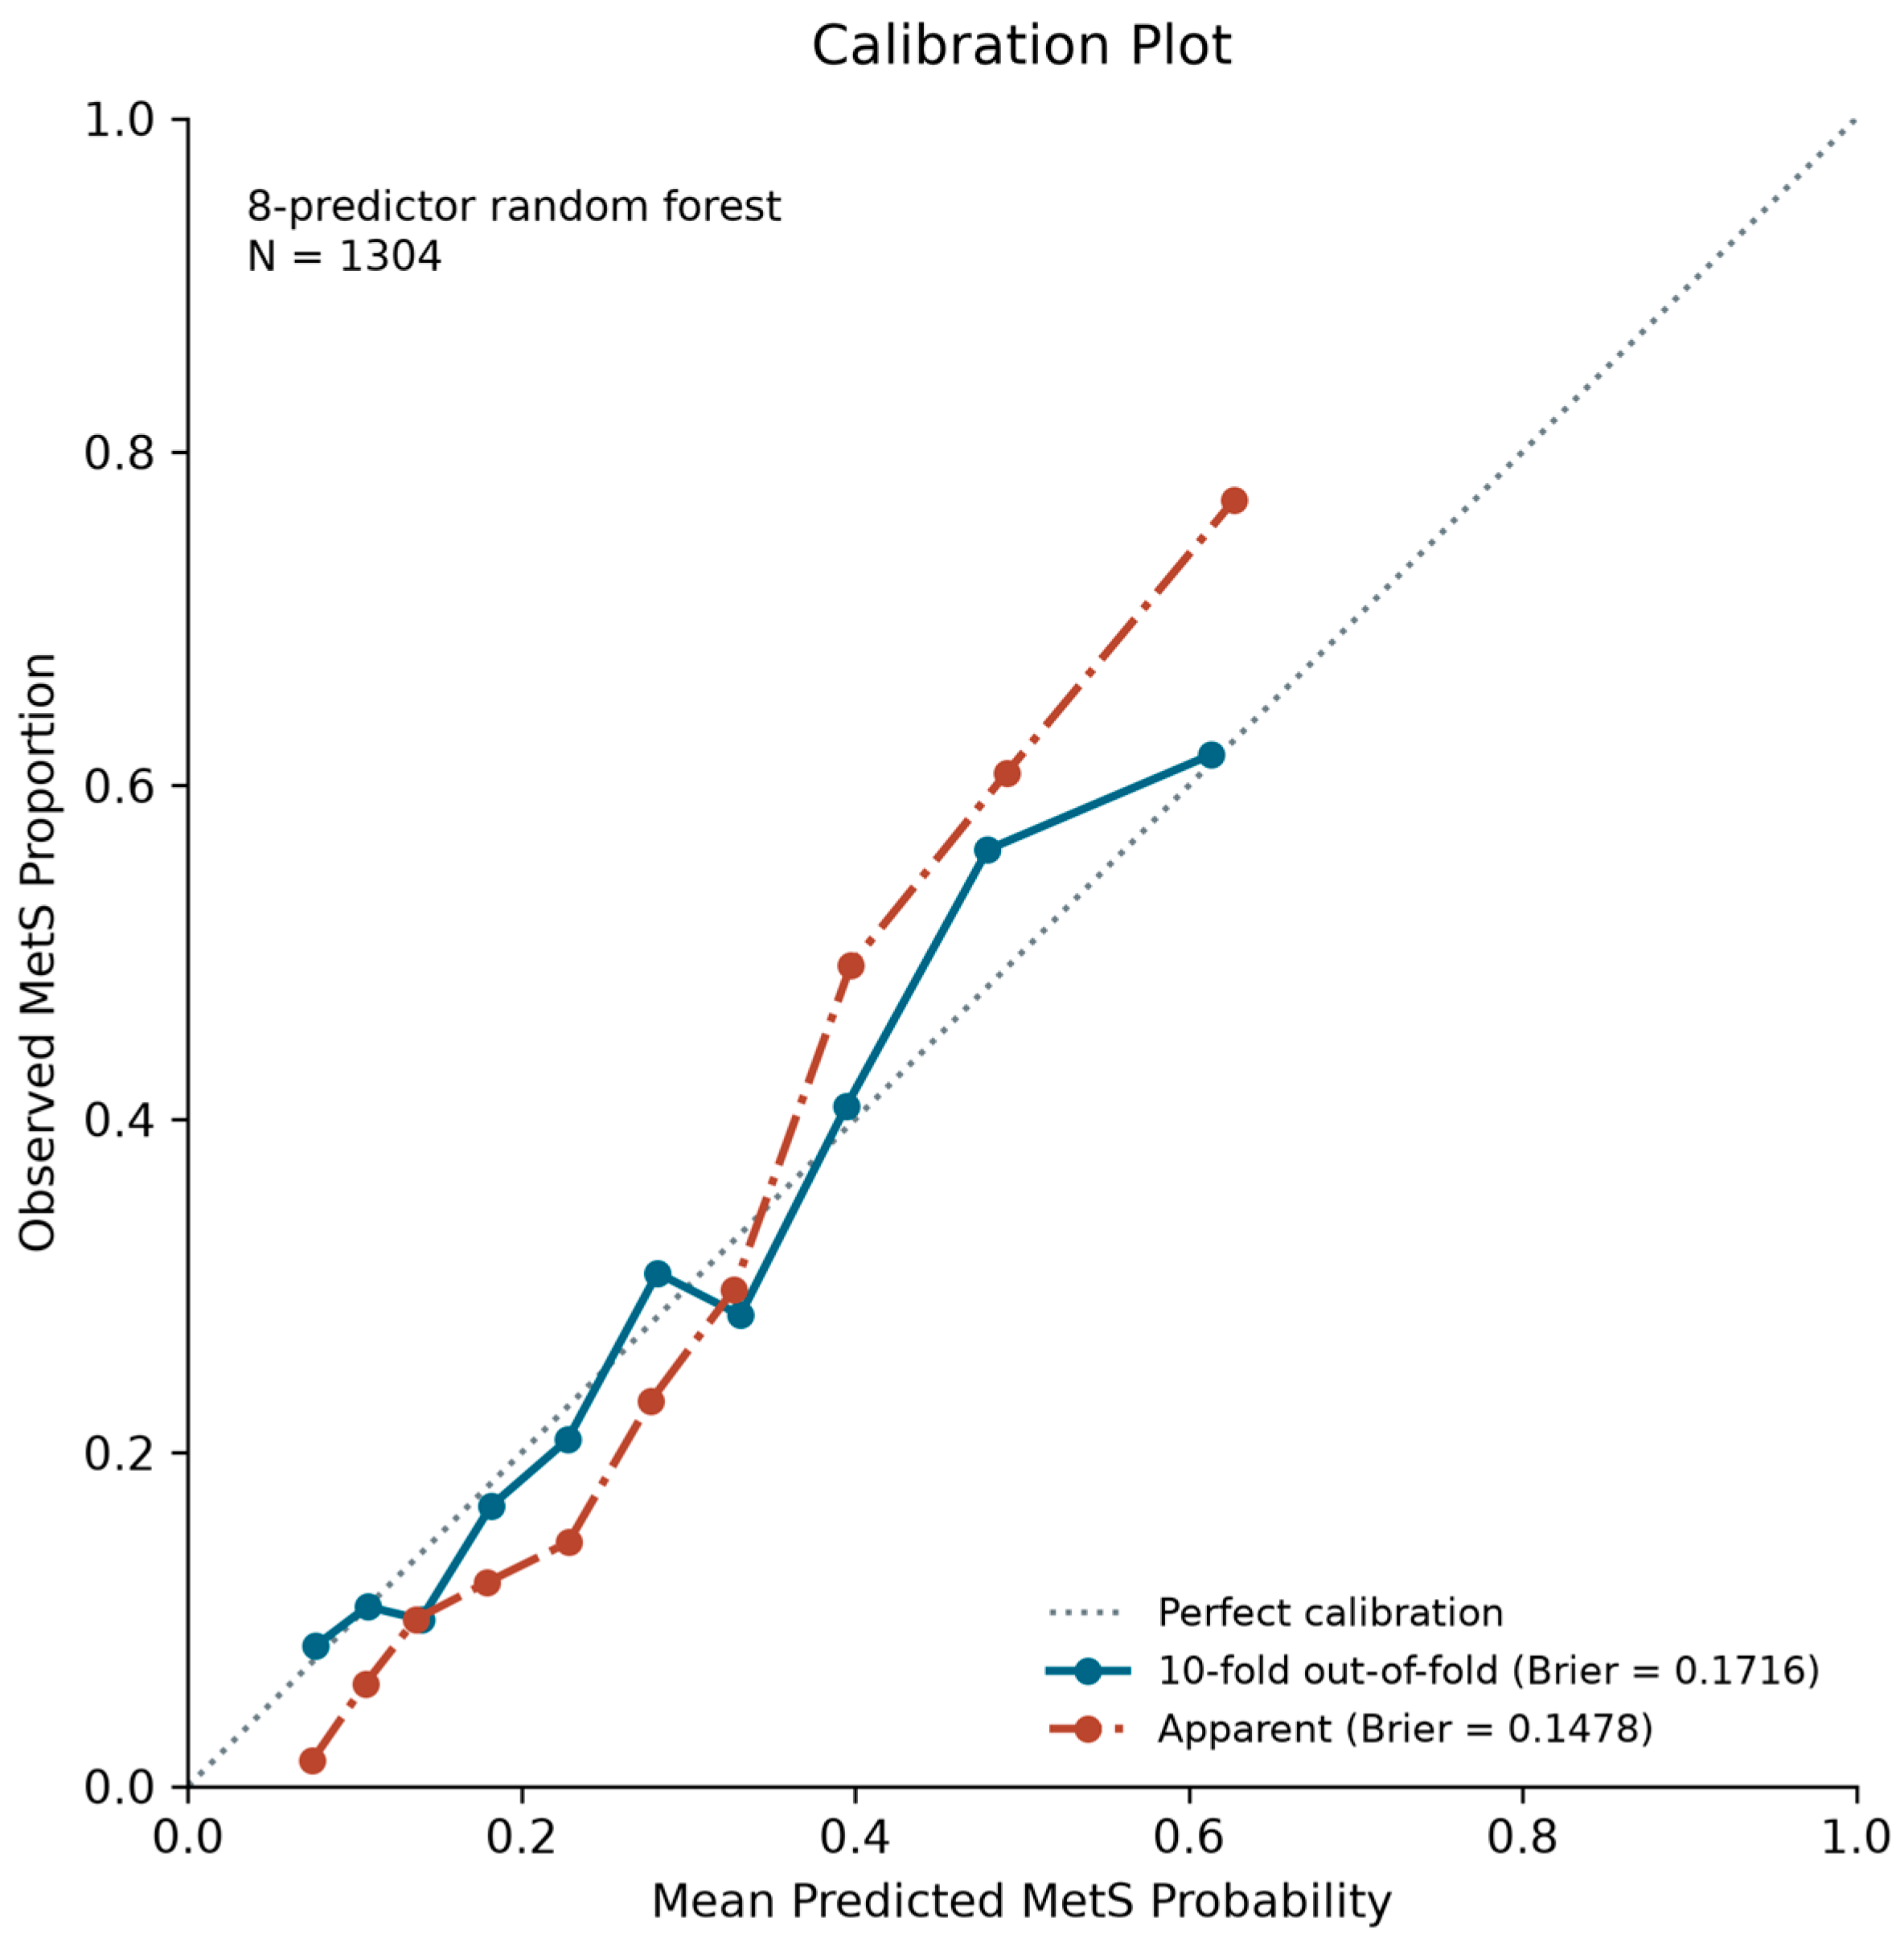
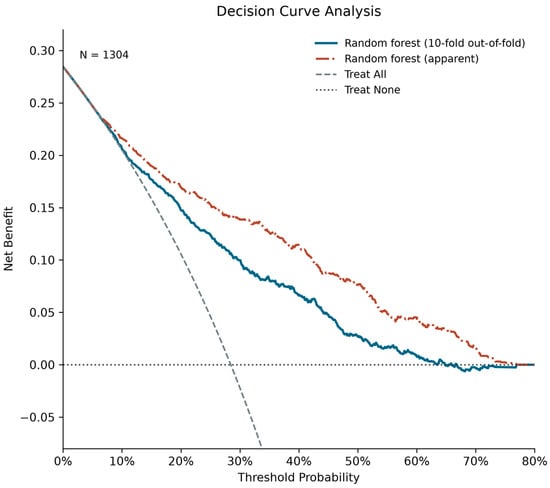
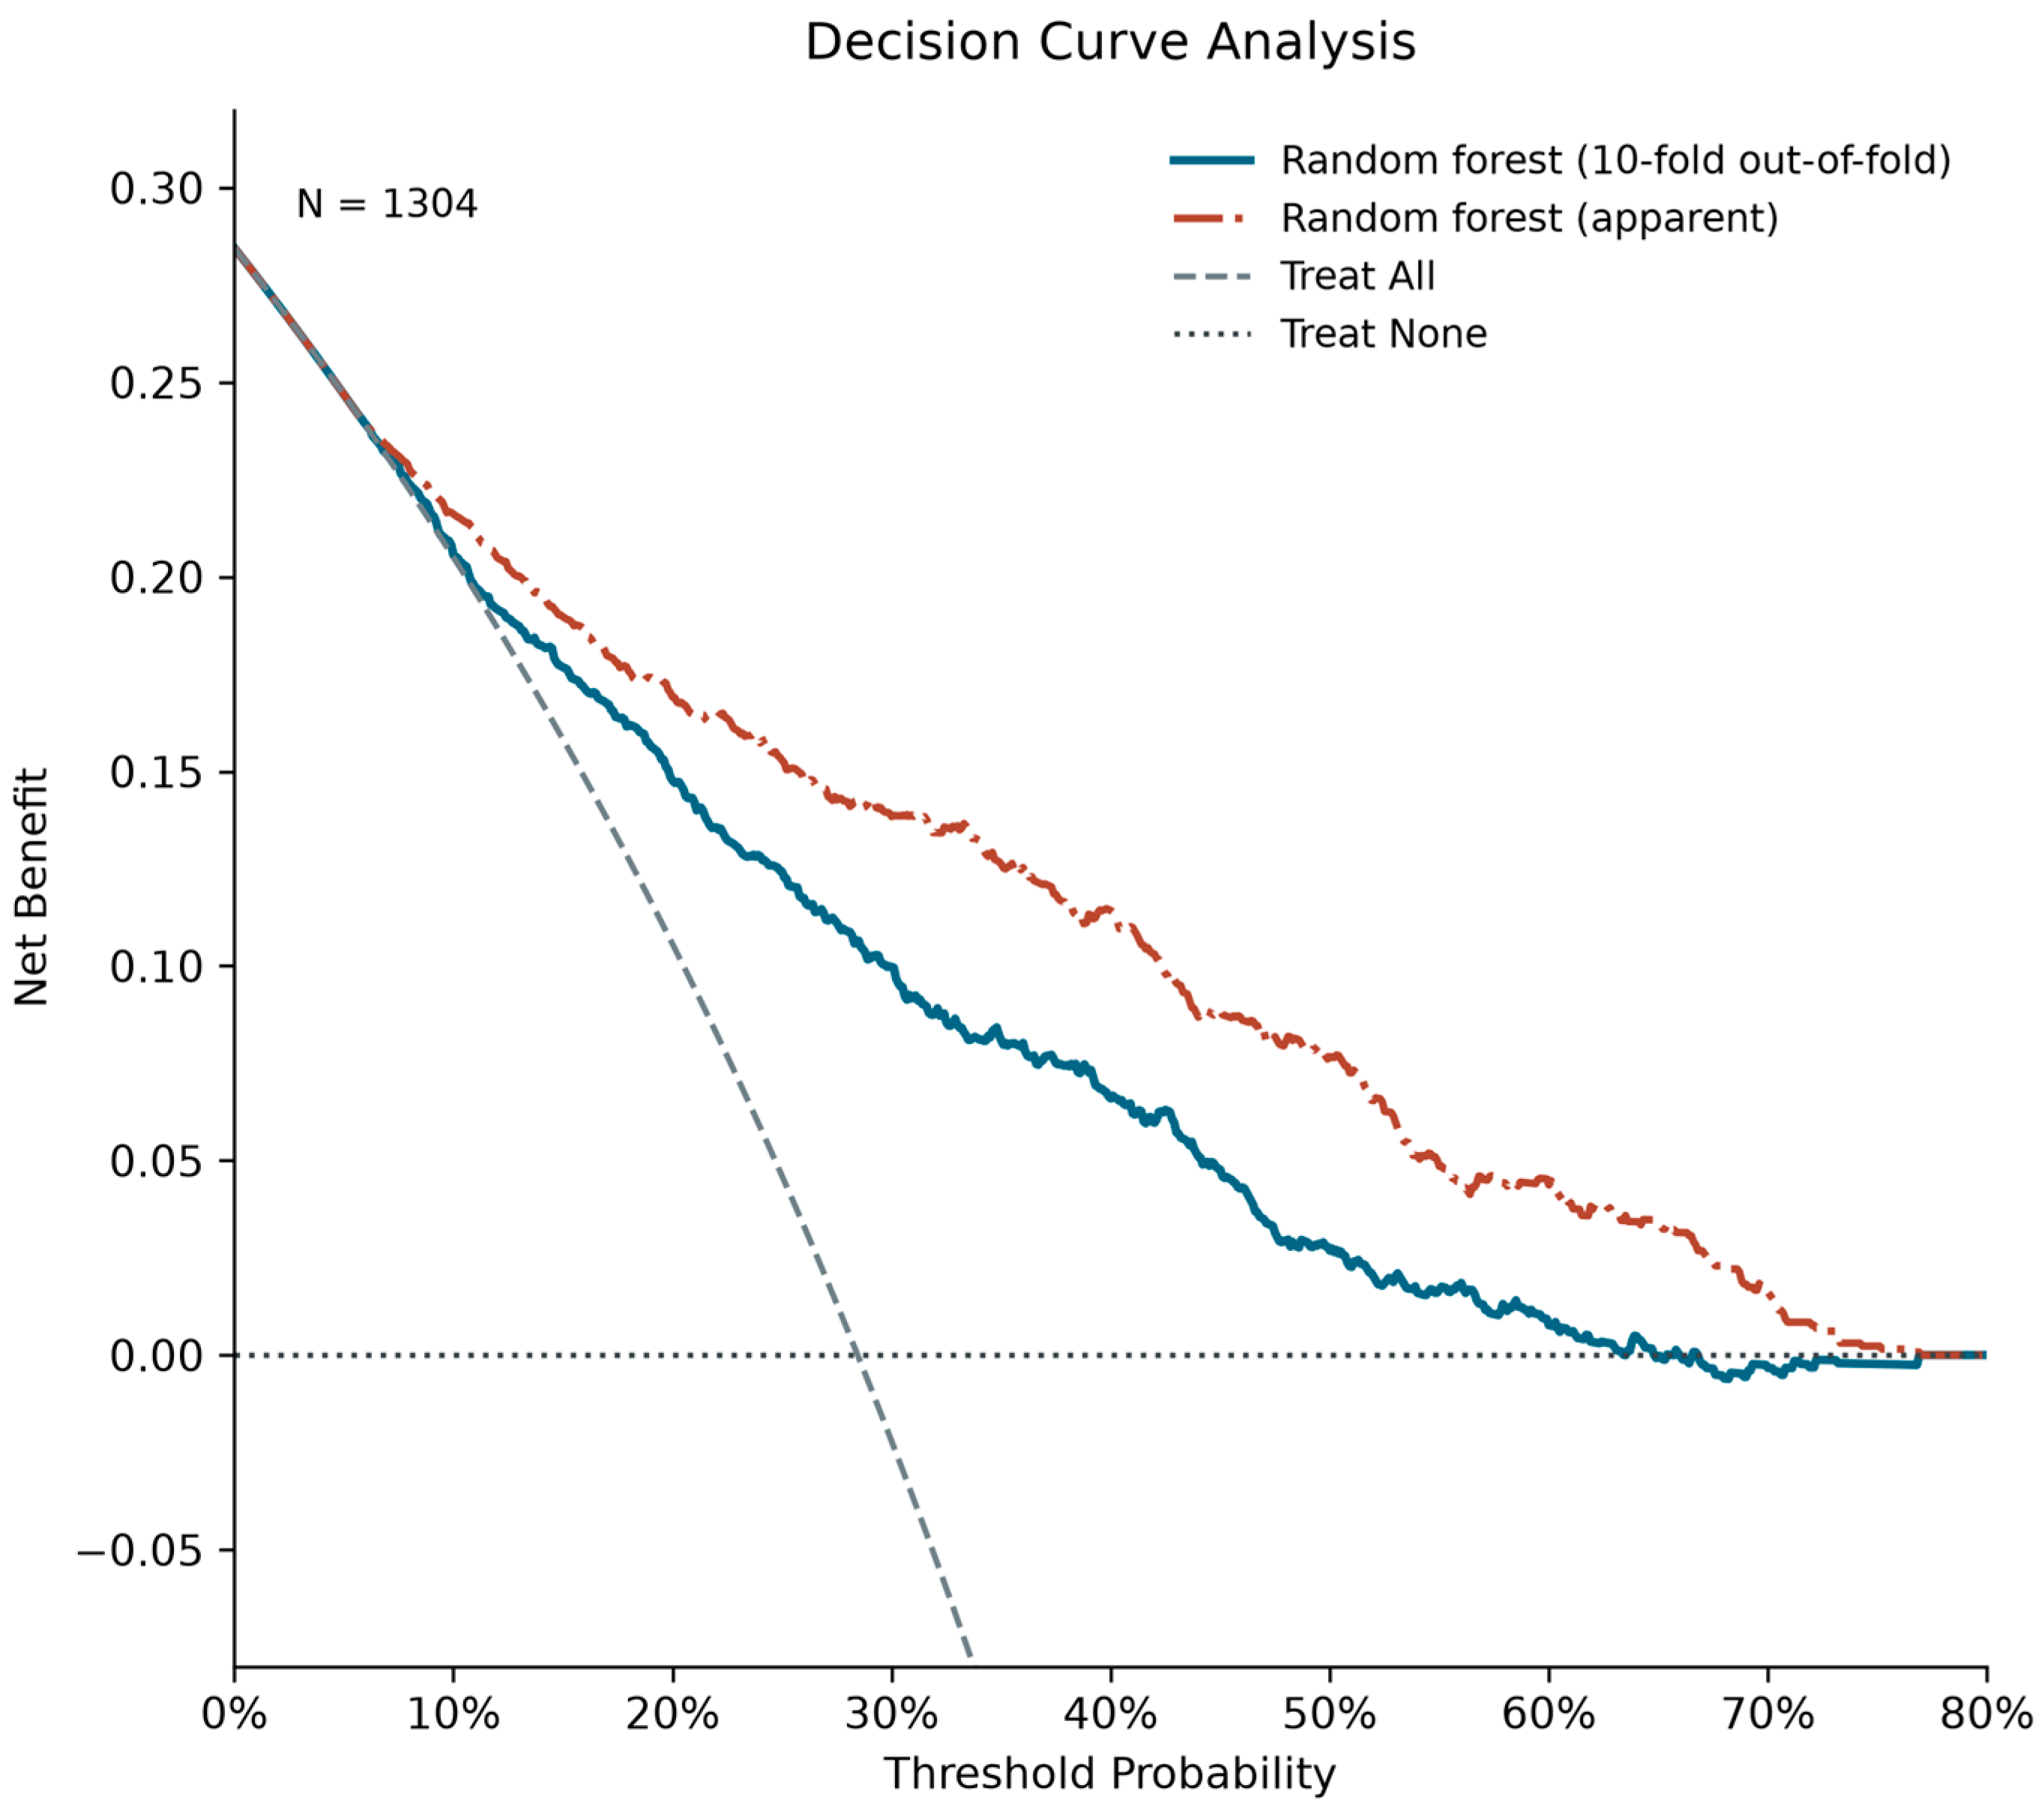
A random forest model was also constructed using the same eight measurements. Its apparent AUC was 0.833 and the stratified tenfold out-of-fold AUC was 0.748, indicating good discrimination (Figure 2). Apparent and out-of-fold Brier scores were 0.1478 and 0.1716, respectively. Grouped calibration curves showed some discrepancies between predicted probabilities and observed MetS proportions across risk groups (Figure 3). The original eight-predictor random forest had an apparent AUC of 0.833 and a tenfold cross-validation AUC of 0.748 after the predictors had been selected using the full development dataset. In nested cross-validation, the random forest development procedure yielded an AUC of 0.746 (conditional 95% CI 0.716–0.776). The Brier score was 0.1723 (conditional 95% CI 0.1612–0.1838), compared with 0.2036 for the training-fold prevalence benchmark. The calibration intercept was 0.005 (conditional 95% CI −0.130 to 0.139), and the calibration slope was 1.101 (conditional 95% CI 0.943–1.285). At illustrative probability thresholds of 20%, 30%, and 40%, sensitivity was 84.6%, 67.9%, and 46.4%, respectively, and specificity was 47.6%, 69.0%, and 85.5%, respectively (Figure 4).
Figure 2.
Apparent and stratified 10-fold out-of-fold ROC curves of the random forest model. The gray dotted diagonal line represents chance-level discrimination (AUC = 0.50).
Figure 3.
Apparent and stratified tenfold out-of-fold calibration curves of the random forest model.
Figure 4.
Apparent and stratified tenfold out-of-fold decision curves of the random forest model.
4. Discussion
This study used LASSO and multivariable logistic regression to examine the association between the TyG index and MetS risk. Eight baseline measurements were included: age, body weight, BMI, LDL-C, UA, HbA1c, left forearm T-score, and TyG index. The model achieved an apparent AUC of 0.833 and a stratified tenfold out-of-fold AUC of 0.748, indicating good discrimination in this exploratory out-of-fold assessment.
Population studies from different countries suggest that the TyG index has value for identifying MetS [10,14,18]. In the supplementary multivariable logistic regression analysis in this study, each one-unit increase in TyG was associated with an odds ratio of 1.864 for MetS detected at follow-up in 2026 after simultaneous adjustment for the other seven baseline measurements (95% CI 1.409–2.467; p < 0.001). This finding suggests an association between baseline glucose and lipid metabolism and subsequent MetS outcomes.
Previous research supports the potential of TyG for identifying and predicting MetS [19,20,21]. A cross-sectional study in Sri Lanka found that TyG discriminated concurrent MetS better than individual measurements such as fasting glucose and triglycerides [14]. An analysis of NHANES data compared TyG with the homeostasis model assessment of insulin resistance (HOMA-IR) for identifying MetS [22]. A cohort study by Son et al. further showed that TyG was associated with subsequent MetS and had better predictive performance than HOMA-IR in that population [11]. Our finding that baseline TyG was associated with follow-up MetS adds evidence for its potential use in long-term risk assessment among individuals attending hospital health examinations.
Mechanistically, insulin resistance is closely linked to multiple metabolic abnormalities in MetS [1], while oxidative stress and inflammation also contribute to its development and progression [4]. By combining fasting glucose and triglycerides, TyG indirectly reflects disturbances in glucose and lipid metabolism associated with insulin resistance [7,8].
The decision curves suggest that the random forest model may inform MetS risk stratification among health examination attendees. We used thresholds of 20%, 30%, and 40% to illustrate the trade-off between detecting more cases and referring fewer individuals for further assessment. Increasing the threshold from 20% to 40% reduced sensitivity from 84.6% to 46.4% and increased specificity from 47.6% to 85.5%. In a potential clinical pathway, a positive prediction would prompt review of metabolic measurements and consideration of further assessment. These thresholds were illustrative. Selecting a threshold for practice would require independent evaluation of calibration and net benefit, taking into account the consequences of missed cases and additional assessments. In practice, thresholds should therefore account for available screening resources, the burden of further examinations, and the risk of missed cases. Individuals identified as high risk could be prioritized for further assessment and closer follow-up. Complete validation and evaluation in independent populations are needed to determine whether this stratification strategy improves identification of individuals at high risk while controlling additional testing burdens.
This study has several limitations. First, recruitment and follow-up completion may have been influenced by healthcare-seeking behavior, health status, and willingness to participate, introducing potential selection and survivor biases. Second, gaps in the records retained over the 10-year study period prevented us from reporting hospital-specific recruitment and outcome counts. Consequently, we could not fully assess clustering or variation in outcomes across hospitals, and the generalizability of the findings to the broader population of the western Chinese plateau remains uncertain. The influence of unmeasured factors also cannot be excluded. Finally, measurements at baseline and follow-up established MetS status at follow-up but did not identify the time of onset or characterize metabolic changes during the intervening period.
5. Conclusions
The TyG-centered MetS risk prediction model showed moderate discrimination and calibration. Its performance and clinical utility require evaluation in an independent population before use in screening.
Author Contributions
Conceptualization, L.M. and Y.Y.; methodology, Y.Y. and Z.W.; software, Y.Y.; validation, Y.Y., H.Q. and X.L.; formal analysis, Y.Y.; investigation, Y.Y., Z.W., H.Q., X.L., Y.M. and Z.Z.; resources, L.M.; data curation, Y.Y. and Y.M.; writing—original draft preparation, Y.Y.; writing—review and editing, L.M. and Z.W.; visualization, Y.Y.; supervision, L.M.; project administration, L.M.; funding acquisition, L.M. All authors have read and agreed to the published version of the manuscript.
Funding
This research was funded by the National Natural Science Foundation of China (grant number 72264022), the Lanzhou Science and Technology Development Guidance Plan Project (grant number 2023-ZD-95), and the Gansu Province Science and Technology Plan Project—Joint Research Fund (grant number 25JRRA1251).
Institutional Review Board Statement
The study was conducted in accordance with the Declaration of Helsinki, and approved on 7 March 2024 by the Ethics Committee of the First Hospital of Lanzhou University (approval number: LDYYLL2024-404).
Informed Consent Statement
Informed consent was obtained from all subjects involved in the study.
Data Availability Statement
The data presented in this study are available on request from the corresponding author due to participant privacy.
Conflicts of Interest
The authors declare no conflicts of interest.
Abbreviations
MetS, metabolic syndrome; TyG, triglyceride-glucose; BMI, body mass index; LDL-C, low-density lipoprotein cholesterol; HDL-C, high-density lipoprotein cholesterol; TC, total cholesterol; TG, triglycerides; UA, uric acid; HbA1c, glycated hemoglobin; BMD, bone mineral density; FPG, fasting plasma glucose; 2 hPG, 2 h plasma glucose; OGTT, oral glucose tolerance test; TSH, thyroid-stimulating hormone; TPOAb, thyroid peroxidase antibody; TgAb, thyroglobulin antibody; ALT, alanine aminotransferase; AST, aspartate aminotransferase; LASSO, least absolute shrinkage and selection operator; ROC, receiver operating characteristic; AUC, area under the ROC curve; DCA, decision curve analysis; OR, odds ratio; CI, confidence interval; SE, standard error; HOMA-IR, homeostasis model assessment of insulin resistance; NHANES, National Health and Nutrition Examination Survey.
References
- Eckel, R.H.; Grundy, S.M.; Zimmet, P.Z. The metabolic syndrome. Lancet 2005, 365, 1415–1428. [Google Scholar] [PubMed]
- He, Y.; Li, Y.; Bai, G.; Zhang, J.; Fang, Y.; Zhao, L.; Zhao, W.; Yang, X.; Ding, G. Prevalence of metabolic syndrome and individual metabolic abnormalities in China, 2002–2012. Asia Pac. J. Clin. Nutr. 2019, 28, 621–633. [Google Scholar] [CrossRef] [Scilit] [PubMed]
- Yao, F.; Bo, Y.; Zhao, L.; Li, Y.; Ju, L.; Fang, H.; Piao, W.; Yu, D.; Lao, X. Prevalence and influencing factors of metabolic syndrome among adults in China from 2015 to 2017. Nutrients 2021, 13, 4475. [Google Scholar] [CrossRef] [Scilit] [PubMed]
- Masenga, S.K.; Kabwe, L.S.; Chakulya, M.; Kirabo, A. Mechanisms of Oxidative Stress in Metabolic Syndrome. Int. J. Mol. Sci. 2023, 24, 7898. [Google Scholar] [CrossRef] [Scilit] [PubMed]
- Ştefan, A.G.; Clenciu, D.; Mitrea, A.; Vladu, I.M.; Protasiewicz-Timofticiuc, D.C.; Roşu, M.M.; Maria, D.T.; Dinu, I.R.; Gheonea, T.C.; Vladu, B.E.; et al. Metabolic Syndrome and Insulin Resistance in Romania. Int. J. Mol. Sci. 2025, 26, 2389. [Google Scholar] [CrossRef] [Scilit] [PubMed]
- Aliyu, U.; Toor, S.M.; Abdalhakam, I.; Elrayess, M.A.; Abou−Samra, A.B.; Albagha, O.M.E. Evaluating indices of insulin resistance and estimating the prevalence of insulin resistance in a large biobank cohort. Front. Endocrinol. 2025, 16, 1591677. [Google Scholar] [CrossRef] [Scilit] [PubMed]
- Sun, Y.; Ji, H.; Sun, W.; An, X.; Lian, F. Triglyceride glucose (TyG) index: A promising biomarker for diagnosis and treatment of different diseases. Eur. J. Intern. Med. 2025, 131, 3–14. [Google Scholar] [CrossRef] [Scilit] [PubMed]
- Guerrero-Romero, F.; Simental-Mendía, L.E.; González-Ortiz, M.; Martínez-Abundis, E.; Ramos-Zavala, M.G.; Hernández-González, S.O.; Jacques-Camarena, O.; Rodríguez-Morán, M. The product of triglycerides and glucose, a simple measure of insulin sensitivity. Comparison with the euglycemic-hyperinsulinemic clamp. J. Clin. Endocrinol. Metab. 2010, 95, 3347–3351. [Google Scholar] [CrossRef] [Scilit] [PubMed]
- Afshar, M.; Afraie, M.; Azami, M.; Zamani, K.; Moradpour, F.; Moradi, Y. Diagnostic Performance of the TyG Index in Detecting Metabolic Syndrome: A Cross-Sectional Study from Western Iran. Open Public Health J. 2025, 18, e18749445383799. [Google Scholar] [CrossRef] [Scilit]
- Shi, C.; Cheng, Y.; Ma, L.; Wu, L.; Shi, H.; Liu, Y.; Ma, J.; Tong, H. Using easy-to-collect indices to develop and validate models for identifying metabolic syndrome and pre-metabolic syndrome. Front. Endocrinol. 2025, 16, 1587354. [Google Scholar] [CrossRef] [Scilit] [PubMed]
- Son, D.-H.; Lee, H.S.; Lee, Y.-J.; Lee, J.-H.; Han, J.-H. Comparison of triglyceride-glucose index and HOMA-IR for predicting prevalence and incidence of metabolic syndrome. Nutr. Metab. Cardiovasc. Dis. 2022, 32, 596–604. [Google Scholar] [CrossRef] [Scilit] [PubMed]
- Chinese Diabetes Society. Guidelines for the prevention and treatment of type 2 diabetes in China (2020 edition). Chin. J. Diabetes Mellit. 2021, 13, 315–409. (In Chinese) [Google Scholar]
- World Health Organization. STEPS Manual. Available online: https://www.who.int/teams/noncommunicable-diseases/surveillance/systems-tools/steps/manuals (accessed on 5 November 2026).
- Paramanathan, T.; Sandrasegarampillai, B.; Arasaratnam, V.; Thirunavukarasu, K. The discriminative ability of the triglyceride-glucose index to identify metabolic syndrome among adults of the northern Sri Lankan population. BMC Endocr. Disord. 2024, 24, 101. [Google Scholar] [CrossRef] [Scilit] [PubMed]
- Tibshirani, R. Regression shrinkage and selection via the lasso. J. R. Stat. Soc. Ser. B Methodol. 1996, 58, 267–288. [Google Scholar] [CrossRef] [Scilit]
- Breiman, L. Random forests. Mach. Learn. 2001, 45, 5–32. [Google Scholar] [CrossRef] [Scilit]
- Vickers, A.J.; Elkin, E.B. Decision curve analysis: A novel method for evaluating prediction models. Med. Decis. Mak. 2006, 26, 565–574. [Google Scholar] [CrossRef] [Scilit] [PubMed]
- Raimi, T.H.; Dele-Ojo, B.F.; Dada, S.A.; Fadare, J.O.; Ajayi, D.D.; Ajayi, E.A.; Ajayi, O.A. Triglyceride-Glucose Index and Related Parameters Predicted Metabolic Syndrome in Nigerians. Metab. Syndr. Relat. Disord. 2021, 19, 76–82. [Google Scholar] [CrossRef] [Scilit] [PubMed]
- Hosseinkhani, S.; Forouzanfar, K.; Hadizadeh, N.; Razi, F.; Darzi, S.; Bandarian, F. Insight into the Predictive Power of Surrogate Diagnostic Indices for Identifying Individuals with Metabolic Syndrome. Endocr. Metab. Immune Disord.-Drug Targets 2024, 24, 1291–1302. [Google Scholar] [CrossRef] [Scilit] [PubMed]
- Rattanatham, R.; Tangpong, J.; Chatatikun, M.; Sun, D.; Kawakami, F.; Imai, M.; Klangbud, W.K. Assessment of eight insulin resistance surrogate indexes for predicting metabolic syndrome and hypertension in Thai law enforcement officers. PeerJ 2023, 11, e15463. [Google Scholar] [CrossRef] [Scilit] [PubMed]
- Nabipoorashrafi, S.A.; Seyedi, S.A.; Rabizadeh, S.; Ebrahimi, M.; Ranjbar, S.A.; Reyhan, S.K.; Meysamie, A.; Nakhjavani, M.; Esteghamati, A. The accuracy of triglyceride-glucose (TyG) index for the screening of metabolic syndrome in adults: A systematic review and meta-analysis. Nutr. Metab. Cardiovasc. Dis. 2022, 32, 2677–2688. [Google Scholar] [CrossRef] [Scilit] [PubMed]
- Wan, H.; Cao, H.; Ning, P. Superiority of the triglyceride glucose index over the homeostasis model in predicting metabolic syndrome based on NHANES data analysis. Sci. Rep. 2024, 14, 15499. [Google Scholar] [CrossRef] [Scilit] [PubMed]

Disclaimer/Publisher’s Note: The statements, opinions and data contained in all publications are solely those of the individual author(s) and contributor(s) and not of MDPI and/or the editor(s). MDPI and/or the editor(s) disclaim responsibility for any injury to people or property resulting from any ideas, methods, instructions or products referred to in the content. |
© 2026 by the authors. Licensee MDPI, Basel, Switzerland. This article is an open access article distributed under the terms and conditions of the Creative Commons Attribution (CC BY) license.