


Abstract
Bezier curve-based optimization (BCO) provides a population-based search framework that generates candidate solutions along linear, quadratic, and cubic Bezier paths defined by control points. This paper presents IBCO, an improved BCO configuration that integrates three established controls: dimension- and bound-gated diversity feedback, reflective boundary repair, and stagnation-triggered differential or elite-guided perturbation. The contribution is an auditable integration and activation design, not a claim that these operators are individually new. Existing records comprise 30 runs on 26 classical instances, 29 evaluated CEC2017 functions (F1 and F3–F30; F2 excluded), 24 CEC2022 instances, 5 constrained engineering problems, and 26 high-dimensional classical instances. The CEC2017, CEC2022, and engineering profiles used fixed per-run realized evaluation counts within each documented profile; this does not imply identical candidate-evaluation sequences within every run. Classical and high-dimensional IBCO runs used 9030–9144 evaluations, versus 9030 for Original BCO; therefore, those profiles do not establish fixed-evaluation superiority. A retrospective, problem-blocked reanalysis of existing runs rejected the omnibus null of equal treatments in all seven comparison and ablation profiles at (largest ), but IBCO’s advantage over Original BCO did not exceed profile-level Nemenyi critical differences. Among 24 classical rank-1 results, only 4 were unique first places. Ablation records identify reflective repair as the most stable component but do not establish synergy among the complete configuration combining diversity feedback, reflective boundary repair, and stagnation-triggered perturbation. IBCO is therefore interpreted as a competitive, incremental BCO configuration relative to the implemented historical baselines, not as a scale-invariant, evaluation-efficient, or universally dominant optimizer.
Keywords:
improved Bezier curve-based optimization; continuous optimization; population diversity; boundary handling; stagnation perturbation; non-parametric statistical testing MSC:
65K05; 68T20; 65D17
1. Introduction
Continuous optimization is central to engineering design, parameter estimation, and complex-system modeling [1,2]. In these applications, objective functions can be non-linear, multi-modal, non-convex, noisy, constrained, or unavailable in differentiable closed form [1,2]. Population-based evolutionary and swarm optimizers are attractive in this setting because they search with few assumptions about the objective function. Genetic algorithms, particle swarm optimization, and differential evolution established representative paradigms based on selection, collective learning, and differential perturbation, respectively [2,3,4]. Subsequent methods, including the grey wolf optimizer, whale optimization algorithm, moth-flame optimization, sine cosine algorithm, salp swarm algorithm, Harris hawks optimization, and arithmetic optimization algorithm, have further expanded the range of population-update and parameter-control mechanisms used for continuous optimization [5,6,7,8,9,10,11].
Continuous-optimization methodology has also progressed through covariance adaptation and increasingly strong adaptive differential-evolution families. CMA-ES adapts a full search covariance model, JADE combines adaptive parameters with an optional external archive, SHADE learns parameter memories from successful trials, and L-SHADE adds linear population-size reduction [1,12,13,14]. These methods are relevant standards for judging a new continuous optimizer. They were not evaluated in the completed experiment records analyzed in this paper; the present comparison therefore establishes behavior only relative to the implemented historical set and cannot establish current state-of-the-art competitiveness.
The performance of a population-based optimizer depends strongly on how it balances exploration and exploitation [15,16]. A population that contracts too rapidly can lose useful search directions and converge prematurely, whereas excessive perturbation can disrupt refinement in narrow valleys or low-dimensional basins [15,16]. Population diversity and state-dependent parameter control therefore provide useful signals for adapting search behavior [15,16]. Feasibility repair is another consequential design choice. Clipping, random reinitialization, reflection, and resampling induce different candidate distributions and can change the behavior and reproducibility of an optimizer even when its nominal update equation is unchanged [17,18]. An effective improvement should consequently identify the weakness addressed by each added mechanism, define when that mechanism is activated, and account for any additional objective-function evaluations.
Bezier curve-based optimization (BCO) is a trajectory-based population optimizer for numerical optimization and three-dimensional unmanned-aerial-vehicle path planning [19]. Its search equations are constructed from linear, quadratic, and cubic Bezier curves. Linear Bezier interpolation provides a direct trajectory between two control points, whereas higher-order curves combine additional control points to produce richer trajectories. This construction gives BCO a geometric interpretation grounded in established Bezier interpolation, approximation, and evaluation theory [20,21]. In the original BCO, the linear operator mainly supports local exploitation, the quadratic operator provides local avoidance behavior, and the cubic operator supports broader exploration.
Despite this interpretable trajectory structure, the original BCO implementation has three limitations. First, it does not explicitly monitor population diversity. When individuals collapse around a restricted region, subsequent Bezier updates can continue to exploit that region without a state-dependent response. Second, random reset after a boundary violation restores feasibility but discards the direction carried by the infeasible trajectory. Third, the algorithm has no explicitly scheduled recovery operation when the global best solution remains unchanged for a prolonged period. Diversity control, reflection, and differential perturbation are established optimization mechanisms rather than new primitives. The methodological question addressed here is therefore how to integrate them into BCO with explicit gates, acceptance rules, and evaluation accounting while leaving the Bezier search core auditable.
Existing BCO work has established the Bezier-trajectory formulation and demonstrated its use in numerical optimization and three-dimensional unmanned-aerial-vehicle path planning [19]. The available BCO study does not provide a systematic analysis of diversity-gated balance control, reflection-based boundary repair, and stagnation-triggered recovery within the same BCO execution path. This unresolved integration question motivates the present study. IBCO is therefore evaluated as an empirical and auditable combination of established controls rather than as a new family of search operators.
The documented BCO literature remains narrow in the evidence available for this manuscript. The verified source establishes the original Bezier-trajectory optimizer and its numerical and path-planning applications, but it does not report a controlled comparison of adaptive diversity regulation, boundary-handling alternatives, stagnation recovery, or their combinations within BCO [19]. The present study therefore addresses a specific integration gap in the documented BCO line; it does not claim that no other BCO variants exist, nor does it treat the available source as a systematic review of all BCO-related publications. This distinction limits the novelty claim to the specified BCO execution-path integration and identifies a broader BCO literature survey as necessary future work.
This study presents improved BCO (IBCO), whose implementation is denoted by Improved_BCO. IBCO preserves the original linear, quadratic, and cubic Bezier update structure and provides an auditable BCO-specific integration of three established ideas. Strategy A modifies the BCO balance factor using normalized population diversity together with dimensionality, search-range, iteration, and stagnation gates. Strategy B replaces random-reset boundary handling with repeated reflection so that a finite infeasible candidate is folded into the feasible interval. Strategy C activates after stagnation and perturbs only inferior individuals by either a DE/best/1-style global differential move on problems passing a bound-width trigger or a scale-conditioned elite-guided move otherwise. All candidate replacements remain greedy, and the complete procedure respects a prescribed maximum number of function evaluations.
The main contributions are summarized as follows:
- 1.
- An explicit dimension- and bound-gated diversity rule is integrated with the original BCO balance factor to condition its branch signal on the observed population state.
- 2.
- Established reflective repair and differential/elite-guided perturbations are coupled to BCO through explicit bound-width and stagnation triggers, target selection, greedy acceptance, and evaluation-budget checks. The contribution is this auditable integration and scheduling, not a claim that reflection or differential mutation is a new operator family.
- 3.
- A function-evaluation-aware algorithmic workflow is defined with pre-specified parameters, greedy acceptance, and explicit recording of convergence and evaluation counts. The evaluation includes repeated runs, ablation and sensitivity analysis, classical and CEC benchmarks, engineering cases, and a reanalysis of the existing records with omnibus rank tests and effect-size intervals [22,23,24,25,26].
- 4.
- The method is positioned according to the completed evidence rather than as a universally dominant optimizer: unequal realized evaluations limit the classical and high-dimensional comparisons, CEC2017 is mixed, the engineering cases improve on the original BCO but do not outperform differential evolution, and the absence of modern adaptive-DE and CMA-ES baselines limits claims of current competitiveness.
2. Basic Principle of Bezier Curve-Based Optimization
BCO represents each individual as a point in a bounded decision space and constructs trial trajectories using Bezier curves [19]. Consider the minimization problem
where , D is the problem dimension, and and are the componentwise lower and upper bounds.
2.1. Population Initialization
Let N denote the population size and the ith individual. The initial population is sampled uniformly as
where is a uniformly distributed random vector and ⊙ denotes componentwise multiplication. After the initial evaluations, the individual with the lowest objective value is stored as the current global best .
2.2. Iteration-Dependent Control Parameters
The original BCO uses an iteration-dependent trajectory parameter
where t is the current iteration, T is the maximum number of iterations, and is a random scalar. As increases, the denominator grows and the stochastic deviation of from one contracts. The balance factor that participates in selecting the Bezier update branch is defined as:
where , , and is random. The sine term decreases with the iteration ratio and thereby reduces the magnitude of the balance factor as the search progresses. In the MATLAB implementation, the logarithm uses ; this protects the exceptional zero returned by a finite-precision random draw and keeps the logarithmic term finite. The draws and are independent scalar realizations from ; neither is a deterministic transform of the other. Although the deterministic envelopes depend only on , the random variables in Equations (3) and (4) are resampled independently for every individual.
2.3. Bezier Trajectory Operators
For a linear Bezier trajectory with control points and , the trial position is
The quadratic operator uses three control points:
The cubic operator uses four control points:
Let denote the population mean, let , let , and let . Here, z is a scalar standard-normal draw, whereas is a D-dimensional vector with independent standard-normal components; they are distinct independent realizations. All random draws mentioned below are fresh draws. An index j is sampled from ; whenever a second index k is required, it is sampled outside . The original BCO branch and its control points are implemented as follows.
- (i)
- If , cubic and quadratic updates are selected with equal probability. For the cubic update, , , and . Its fourth point iswhere is a uniformly sampled coordinate and . For the quadratic update, , , and, with equal probability, or .
- (ii)
- If , a best-guided linear update is selected with probability . It uses and, with equal probability, or .
- (iii)
- In the remaining branch, mean-guided and coordinate-mixing updates are selected with equal probability. The mean-guided update uses and either or , with equal probability. For coordinate mixing, and is initialized to ; independently for each coordinate d, with probability , a fresh is drawn and . Both alternatives use the linear operator in Equation (5).
These branch rules and the linear, quadratic, and cubic forms are retained unchanged in IBCO. After boundary repair and objective evaluation, a trial point replaces the current individual only when its objective value is lower:
Let denote the cost of one objective-function evaluation, and let be the number of evaluations actually performed, including initialization. is instance-specific; these asymptotic expressions do not imply equal wall-clock costs across benchmark families. The implementation stores the population, its fitness values, the best solution, and a length-T convergence record. Using the same notation adopted below for IBCO, the time and space bounds of the original method are
Without an earlier evaluation-budget stop, , where the additional N accounts for initialization. For the usual case , initialization is absorbed by the term, which also includes the population updates and their componentwise trajectory operations.
3. Proposed Improved BCO Algorithm
IBCO retains the original BCO initialization, trajectory parameter, Bezier operators, branch structure, and greedy acceptance rule. Its modification is confined to three state-dependent components: adjustment of the balance factor, repair of infeasible trajectories, and perturbation of inferior individuals after stagnation. These components reuse established population-state, reflection, and differential-search ideas; their role here is an explicitly specified integration into the BCO execution path rather than the introduction of three independent optimization primitives.
3.1. Strategy A: Dimension- and Bound-Gated Diversity-Adaptive Balance
Let be the population matrix. The normalized population diversity is defined by
Here, is the diversity of the initial population, is the diversity relative to initialization, and are numerical guards instantiated by MATLAB eps. The notation denotes the sample standard deviation with denominator , matching std(X,0,1) in the implementation. The code first replaces each range by ; if the resulting initial diversity is no larger than eps, it sets the stored to one before forming the ratio. Thus, zero-width coordinates and a degenerate initial population do not cause division by zero.
The dimension gate is defined as:
Thus, the additional diversity response is disabled at and below 10 dimensions, increases linearly between 10 and 30 dimensions, and is fully enabled from 30 dimensions onward. The bound-width gate is
The thresholds 10, 30, and 100 are empirical presets held fixed in the reported experiments, not theoretically derived transition points. The values 10 and 30 depend on the chosen dimensional representation, whereas the width threshold 100 is evaluated in raw decision-variable units and is therefore unit-dependent. Rescaling a variable can change the bound-width branch even when the underlying optimization problem is equivalent; the gates should not be interpreted as scale invariant. The attenuation on problems whose median range exceeds 100 limits interaction between diversity recovery and the global differential perturbation used by Strategy C. Let be the stagnation-reference iteration and let W be the stagnation window. The reference is updated whenever the global best improves and is also reset after each Strategy C activation, which prevents Strategy C from firing again immediately when a perturbation is unsuccessful. The stagnation and iteration gates are
The improved balance factor is then defined as:
where is the diversity threshold and is the diversity gain. The correction is non-zero only when , and its magnitude is jointly controlled by dimension, bound width, iteration stage, and time since the most recent global-best improvement or Strategy C activation. The pre-specified values are and .
3.2. Strategy B: Reflective Boundary Repair
When the original BCO would randomly reset an out-of-bounds coordinate, IBCO applies repeated reflection. For a trial coordinate , define:
The feasible coordinate is:
The modulo operation handles overshoots larger than one interval width, and the second step folds the coordinate into . Equations (15) and (16) assume . In the implementation, zero-width coordinates bypass the modulo operation and are clipped to their fixed bound, consistent with the denominator guard in Equation (10). In the reflective path used by the reported IBCO runs, every non-finite coordinate is replaced by an independent uniform draw in its feasible interval before the finite coordinates are reflected. The original random-reset path likewise includes non-finite coordinates in its resampling mask. The optional clipping path has no explicit NaN replacement and was not used in the reported configuration. Unlike random reset, reflection retains information about the magnitude and direction of a finite infeasible trajectory. Strategy B adds no objective-function evaluation.
3.3. Strategy C: Bound-Width-Triggered Stagnation Perturbation
If the stagnation reference is unchanged for W iterations, Strategy C targets the worst individuals instead of perturbing the complete population. The default mutant ratio is . The elite mean is computed from the best individuals, with and . For every target, and are sampled so that the target, , and are distinct. Define the remaining-iteration factor and let be the base perturbation scale.
When the median bound width exceeds 100, a perturbed candidate is generated by global differential motion:
where and . Excluding the Gaussian term, has the base-vector and single-difference structure of DE/best/1 mutation [2]. Strategy C is therefore a DE/best/1-style reuse, not a new differential-mutation family. Its BCO-specific integration differs from a complete DE generation by applying a time-varying factor and bound-scaled Gaussian term only to stagnation-selected inferior individuals, omitting a DE crossover step, and comparing each repaired candidate greedily with its target.
When the median bound width is at most 100, the local scale-conditioned branch (implementation identifier scale_aware) combines contraction toward the global best, attraction toward the elite mean, differential motion, and noise scaled by the population spread:
For this pre-specified local branch, , , , and , where are independent. The componentwise scale is , with the maximum applied coordinatewise. The pairwise-difference term is DE-like, but the target-based update with best and elite attraction is not DE/best/1. Scaling its noise by population spread and bound width conditions the step magnitude; it does not make the operator invariant to changes of units because the branch itself is selected by the raw threshold 100. Each Strategy C candidate is repaired, evaluated subject to the remaining function-evaluation budget, and accepted only if it improves the targeted individual. After all targeted candidates have been processed, is reset to the current iteration irrespective of acceptance. Consequently, the strategy can attempt diversity recovery without replacing good incumbents by inferior perturbations or triggering on every subsequent iteration.
3.4. Default Configuration
The completed experiments used one pre-specified IBCO configuration. The switches strategyA, strategyB, and strategyC were all enabled. Strategy A used diversityFloor = 0.10 for , diversityGain=0.60 for , and an enabled dimension gate. Its median-range threshold was 100, and the bound-width attenuation applied to was 0.50.
Strategy C used the local scale-conditioned branch recorded in the code as scale_aware, a fixed stagnation window of , an elite ratio of , a base perturbation scale of 0.03, and a mutant ratio of . The optional adaptive-backoff, budget-aware, and usefulness-aware controls present in the implementation were disabled, so the trigger window changed only through the activation reset described above. These values, including the dimension transitions 10 and 30 and the bound-width trigger 100, are empirical presets and should not be interpreted as theoretically or globally optimal parameters. In particular, changing decision-variable units can change the behavior of the width trigger.
For clarity, the Bezier trajectory equations, population size, and iteration envelopes are inherited from the original BCO implementation. The diversity floor, diversity gain, elite ratio, mutant ratio, stagnation window, and perturbation scale are fixed implementation presets selected to provide moderate intervention while preserving the original BCO update path; they were not obtained by a separate global parameter search. The transitions at dimensions 10 and 30 provide a simple interpolation from no additional diversity response to full activation, while the width threshold 100 separates the recorded global and local perturbation branches. These choices are empirical and representation-dependent. The existing one-factor sensitivity records provide local diagnostics for selected values, but they do not establish threshold optimality or invariance to changes of units.
The functional rationale for the remaining presets is as follows. The diversity floor treats a population retaining less than one tenth of its initial normalized spread as a possible collapse state, while limits the resulting balance correction to a moderate fraction of the available gate product. The attenuation on wide-bound problems reduces simultaneous amplification of diversity feedback and the global recovery branch. The stagnation window requires a sustained absence of global-best improvement before recovery is attempted; the elite ratio supplies a small reference group, and the mutant ratio limits the intervention to inferior individuals. The base perturbation scale keeps the perturbation relative to the decision-variable range. These explanations describe implementation intent rather than an optimization-derived selection rule; no parameter value should be interpreted as globally optimal.
3.5. Algorithmic Workflow
The complete IBCO workflow is summarized in Table 1. It shows how the inherited BCO trajectory update, diversity-adaptive balance adjustment, reflective repair, stagnation-triggered perturbation, greedy acceptance, and function-evaluation accounting are combined in one execution path.
Table 1.
Pseudocode of improved BCO (IBCO).
3.6. Search-Mechanism Analysis
The interpretations below are design hypotheses used to motivate component ablations, not validated causal mechanisms. Removing a component changes the subsequent stochastic trajectory and its interactions with the remaining components; an observed ablation difference can therefore support a configuration-level association but cannot uniquely establish the proposed causal pathway.
3.6.1. Adaptive Exploration and Exploitation
The original BCO already combines geometrically distinct linear, quadratic, and cubic trajectories. Strategy A does not replace these operators; it changes the balance signal used by the original branch logic. The correction in Equation (14) is activated by a diversity deficit and scaled by dimension, bound width, iteration stage, and stagnation. At and below 10 dimensions, , so the original balance factor is preserved. At higher dimensions, the response becomes stronger, but attenuates it when the median bound width exceeds 100. The design hypothesis is that this gating can raise exploration pressure after diversity loss without applying the same response to every problem; the ablation does not by itself validate that explanation.
3.6.2. Feasibility and Directional Continuity
Random reset samples a feasible value independently of a finite infeasible trajectory. In contrast, Strategy B folds that trajectory back into the domain, so the repaired point remains a deterministic function of the overshoot. Because reflection requires only componentwise arithmetic and no objective evaluation, it changes candidate geometry without changing the evaluation budget. The associated hypothesis is that retaining overshoot information is preferable to independent resampling on some landscapes; component-level performance differences test this hypothesis only indirectly.
3.6.3. Recovery from Stagnation
Strategy C acts only after W iterations have elapsed since the most recent global-best improvement or Strategy C activation, and it acts only on the worst fraction of the population. The bound-width-triggered global branch reuses DE/best/1-style differential motion with additional bound-scaled noise, whereas the local scale-conditioned branch combines contraction, elite guidance, a pairwise difference, and population-scaled noise. The hypothesis is that this scheduled perturbation can provide a recovery attempt while greedy acceptance protects incumbents from inferior candidates. The mechanism is landscape- and unit-dependent; the available evidence concerns the pre-specified A+B+C configuration and does not validate a universal benefit of Strategy C.
3.7. Time Complexity and Function-Evaluation Accounting
Let be the number of objective evaluations actually performed and let K be the number of Strategy C activations; N, D, T, and have the meanings used in Equation (9). Population diversity, the population mean, Bezier updates, and boundary repair require operations per iteration. Each Strategy C activation generates candidates for a fixed fraction , costing , and performs ascending and descending fitness sorts, costing . Because , the activation-related term is absorbed by the base upper bound. The unified time and space bounds are
Here, , and the number of completed Strategy C activations is conservatively bounded by ; the fixed window gives the looser order estimate when activations occur at the nominal schedule. The space term covers the population and fitness arrays, componentwise working vectors, sort indices, and stored convergence history; the three added strategies do not change the asymptotic space order relative to BCO. Strategy B consumes no additional evaluations, whereas Strategy C can add evaluations during triggered recovery steps. The displayed time bound is an implementation-level worst-case accounting rather than a platform-independent runtime prediction. Recording and is therefore necessary for diagnosing whether a comparison used the same realized budget; an identical upper cap alone does not establish that condition.
4. Simulation Experiments
4.1. Experimental Design
4.1.1. Environment and Compared Algorithms
The principal formal classical, CEC-comparison, and engineering batches were executed in MATLAB R2021b with CPU fallback. The later high-dimensional batch was executed in MATLAB R2026a with a six-worker process pool and GPU-backed random initialization on an NVIDIA GeForce RTX 5060 Laptop GPU; objective evaluations remained on the CPU, so runtime speedup is not evaluated. Exact environment metadata were not recorded uniformly for every profile. The MATLAB-version and worker-configuration difference means that runtime and random-trajectory details are not directly comparable across profiles; the reported conclusions concern objective values and ranks under each documented protocol, not cross-profile execution speed. The comparison set comprised the locally implemented versions of Original BCO, IBCO, PSO, GWO, WOA, DE, GA, SSA, HHO, MFO, SCA, and AOA. These established baselines provide a broad historical comparison, but they do not constitute a contemporary state-of-the-art comparator set.
All ten non-BCO baselines were local MATLAB implementations called through a common wrapper rather than official releases. They used uniform initialization and random-reset boundary handling. PSO used an inertia weight decreasing from 0.9 to 0.2, , and a velocity limit equal to 0.2 times the variable range. GWO and WOA used a control parameter decreasing from 2 to 0; WOA additionally used spiral coefficient 1 and an auxiliary coefficient decreasing from to . DE used the DE/rand/1/bin scheme with and . GA used three-way tournament selection, one elite, crossover probability 0.8, the smaller of 0.1 and as its mutation probability, and mutation scale 0.05 times the variable range. HHO used the energy envelope and a Levy exponent of 1.5. SSA used . MFO used spiral coefficient 1 and a decreasing number of flames. SCA used . AOA used , , , and . These parameter settings identify the reported local implementations; they should not be interpreted as results from versioned official baseline packages.
Every reported profile used 30 independent runs and a population size of 30. The formal classical comparison and formal classical ablation each contained 26 problem instances and used 300 iterations with . The focused sensitivity study contained six instances and used the same run count, population, iteration limit, and evaluation cap. The archived CEC2017 driver explicitly selected F1 and F3–F30, giving 29 functions. The run archive contains no F2 evaluation log and no documented technical execution error, so a specific failure mechanism cannot be established retrospectively. F2 was not executed and is therefore excluded from every CEC2017 aggregate, figure, statistical test, and claim in this manuscript. The CEC2017 results should consequently be read as a 29-function partial profile rather than as evidence for the complete CEC2017 suite. The CEC2022 profile contained 24 instances (F1–F12 at 10D and 20D). Both CEC profiles used 300 iterations and . The five constrained engineering cases used 100 iterations and . The high-dimensional classical profile contained 26 instances and used 300 iterations with .
The CEC2017, CEC2022, and engineering runs reached 9030, 9030, and 3030 evaluations, respectively. Each run in these profiles used or reached the documented fixed per-run realized evaluation count within its profile; this does not imply identical candidate-generation or evaluation sequences for every algorithm and run. In contrast, the common 10,000-FE cap did not produce equal realized budgets in the classical and high-dimensional profiles. IBCO’s minimum/mean/maximum counts were 9030/9073.35/9144 in the formal classical profile and 9030/9071.98/9144 in the high-dimensional profile, whereas Original BCO used 9030/9030/9030 in both; most other baselines used 9030, and HHO used 10,000. Equal caps and iteration limits therefore must not be interpreted as strict equal-FE comparisons; the reported ranks may partly reflect these algorithm-dependent evaluation counts. The formal classical profile contains 13 benchmark functions at 10D and 30D, whereas the high-dimensional profile uses the same functions at 50D and 100D. The engineering profile comprises a welded beam, pressure vessel, tension/compression spring, speed reducer, and three-bar truss.
4.1.2. Metrics and Statistical Procedures
The reported 9030, 9030, and 3030 values refer to realized evaluations per run within the corresponding CEC2017, CEC2022, and engineering profiles; they are not totals summed across the 30 runs.
For every algorithm–problem pair, the scripts recorded the best, worst, mean, median, and standard deviation of the final absolute error or penalized objective, together with runtime, practical rank, function evaluations, best positions, raw run values, and convergence histories. Practical ranks were calculated from problem-level mean errors with a tolerance of . Consequently, a rank-1 count is not an exclusive win count: multiple algorithms can receive rank 1 on the same problem. Arithmetic means across different functions or engineering cases are also scale-sensitive and are reported only as descriptive aggregates, not as normalized cross-problem effect sizes.
The archived analysis protocol specifies the same problem-, dimension-, and run-specific seed for every algorithm and resets the optimizer random stream from that seed; this was the intended run-index pairing for deterministic objectives. However, the current raw result rows do not retain the seed or an immutable source hash, so the pairing cannot be independently reconstructed observation by observation. The high-dimensional profile was generated after CPU and GPU random-stream seeding had both been implemented. Pairwise tables used IBCO as the reference and applied the Wilcoxon signed-rank procedure to the 30 run-index-matched final errors, with , followed by Holm correction over the valid problem–comparator contrasts in each result set [22,23,26]. The numerical signed-rank and Holm outputs are consequently retained as protocol-conditional secondary summaries rather than definitive inferential evidence. Moreover, F7 noisy quartic draws fresh objective noise during evaluation, so equal optimizer seeds do not guarantee matched noise realizations across algorithms; its signs are descriptive only. Under this convention, “+” denotes a Holm-adjusted directional sign in favor of IBCO, “=” denotes no adjusted directional sign, and “-” denotes a sign against IBCO. These symbols do not estimate a suite-wide probability of superiority.
The original statistical files also report tolerance-aware, run-level mean ranks. An additional retrospective analysis was performed on the existing 30-run raw arrays without rerunning any optimizer. For each problem instance, the 30-run median final error (or median penalized objective for engineering) was used as the response, the problem instances were blocks, and the algorithms were treatments in a Friedman test. Nemenyi critical differences were then calculated for the same problem-level ranks [24,25]. The omnibus Friedman null was tested at ; it states that all treatments have the same block-level rank distribution and does not identify which treatment is superior. When the omnibus result was significant, the unadjusted Nemenyi critical difference was used as an exploratory all-treatment comparison. The Nemenyi step is separate from the protocol-conditional Wilcoxon–Holm summaries and was not used to claim IBCO superiority. This is a statistical reanalysis of existing observations, not a new experiment. The 5 comparison profiles contain 12 algorithms, whereas the 2 ablation profiles contain 11 configurations. Problem-level practical ranks, original run-level mean ranks, and the retrospective problem-blocked Friedman ranks are kept distinct throughout.
4.2. Mechanism Comparison
4.2.1. Formal Classical Ablation
The formal ablation study compared the complete A+B+C configuration with Original BCO, single-strategy variants, pairwise combinations, and leave-one-strategy-out variants. Equivalent pairs were consolidated in Table 2. The complete IBCO configuration achieved a mean practical rank of 1.6923, a rank-1 count of 22 (1 unique), and a mean error of 0.678651. The A+C configuration (IBCO without Strategy B) obtained a slightly better average practical rank but a much larger mean error. Strategy C alone showed the same instability pattern. In contrast, variants containing Strategy B produced mean errors below 0.85. Because an aggregate mean error across heterogeneous functions is scale-sensitive, these values provide descriptive stability evidence rather than a stand-alone inferential result. They suggest that reflective repair is the most stable component in this profile, while the benefits of Strategies A and C remain landscape-dependent.
Table 2.
Compact summary of the formal classical ablation study.
The original run-level Nemenyi summary has a critical difference of 2.9610 and a largest IBCO-involving rank difference of 0.3577. The retrospective problem-blocked analysis supplies the previously missing omnibus context: , . IBCO and Original BCO have problem-blocked mean ranks of 4.9808 and 7.0385, respectively; their difference remains below the Nemenyi critical difference of 2.961. The median IBCO-versus-Original BCO is 0.5722 with a problem-bootstrap 95% interval of [0.5000, 0.9844]. Against Original BCO, the protocol-conditional Holm sign table records 2 positive signs and 24 ties. The complete configuration was retained as the pre-specified default for this profile, with reflective repair providing the clearest descriptive stability benefit, but the data do not establish that every strategy is independently beneficial on every function.
Figure 1, Figure 2, Figure 3, Figure 4 and Figure 5 reproduce the 26 formal ablation convergence curves in a consistent three-by-two arrangement. The curves cover every 10D and 30D instance in this profile rather than a selected subset. The most informative contrasts occur on the Rosenbrock, noisy quartic, and Schwefel profiles: recovery mechanisms help on the wide-bound deceptive Schwefel landscape, whereas the low-dimensional Rosenbrock profile shows that additional disturbance is not uniformly beneficial. F7 is defined as with a new random noise draw at each evaluation. Its best-so-far curves and terminal errors therefore combine search behavior with opportunistic noise realizations; without common-noise streams, repeated reevaluation, or uncertainty bands, the noisy 30D contrast is descriptive rather than evidence about deterministic convergence.
Figure 1.
Mean convergence curves for the formal classical ablation study (part 1 of 5).
Figure 2.
Mean convergence curves for the formal classical ablation study (part 2 of 5).
Figure 3.
Mean convergence curves for the formal classical ablation study (part 3 of 5).
Figure 4.
Mean convergence curves for the formal classical ablation study (part 4 of 5).
Figure 5.
Mean convergence curves for the formal classical ablation study (part 5 of 5).
4.2.2. CEC2017 Ablation
The 29-function CEC2017 ablation profile (F1 and F3–F30; F2 excluded) provides a more conservative mechanism assessment, and the corresponding problem-level practical mean ranks are reported in Table 3. IBCO obtained the lowest original aggregate mean rank, 5.6621, followed by the configurations without Strategy A and by Strategy B+C, both at 5.8195. In the retrospective problem-blocked analysis, with ; IBCO and Original BCO have mean ranks of 4.6552 and 6.5172, and their difference is below the Nemenyi critical difference of 2.804. IBCO receives 6 rank-1 assignments, 4 unique, and its median against Original BCO is 0.5167 [0.5044, 0.5889]. However, the 290 protocol-conditional Holm-adjusted pairwise outcomes were all ties. Before correction, the signs were 23 positive, 264 ties, and 3 negative. The complete configuration therefore has the most favorable average ordering in this profile, but these secondary comparisons do not support claiming that any individual strategy combination is decisively superior across the evaluated CEC2017 functions.
Table 3.
Problem-level practical mean ranks in the 29-function CEC2017 ablation profile (F2 excluded).
Figure 6, Figure 7, Figure 8, Figure 9 and Figure 10 contain all 29 evaluated CEC2017 ablation curves, covering F1 and F3–F30. No F2 result was generated. Their function-dependent crossings and close terminal values are consistent with the protocol-conditional sign summary: the mechanisms change trajectories and average ordering, but no single ablation contrast has an adjusted directional sign.
Figure 6.
Mean convergence curves for the 29-function CEC2017 ablation profile (F2 excluded; part 1 of 5).
Figure 7.
Mean convergence curves for the 29-function CEC2017 ablation profile (F2 excluded; part 2 of 5).
Figure 8.
Mean convergence curves for the 29-function CEC2017 ablation profile (F2 excluded; part 3 of 5).
Figure 9.
Mean convergence curves for the 29-function CEC2017 ablation profile (F2 excluded; part 4 of 5).
Figure 10.
Mean convergence curves for the 29-function CEC2017 ablation profile (F2 excluded; part 5 of 5).
4.2.3. Focused One-Factor Sensitivity
The formal sensitivity experiment varied one parameter at a time while holding the remaining IBCO settings at their pre-specified defaults. It used paired seeds for 30 independent runs on Rosenbrock, Schwefel, and Ackley at 10D and 30D, giving six instances per setting. Each run used a population of 30, 300 iterations and a maximum of 10,000 function evaluations; the realized setting–instance means ranged from approximately 9030 to 9108 evaluations, so remains an upper bound. Table 4 reports the arithmetic mean of the six instance-level ErrorMean values, each of which is the mean absolute final error over 30 runs. This aggregate is scale-sensitive and is therefore used as a compact diagnostic rather than an inferential ranking across heterogeneous functions.
Table 4.
Paired-seed one-factor sensitivity results on six representative instances. Each entry is parameter value (aggregate mean error).
The stagnation window produced the clearest response: shortening it to 10 increased aggregate error to 6.933961, mainly because the 30D Schwefel error increased, whereas a value of 20 reduced the aggregate to 2.505264. A diversity floor of 0.15 also reduced the focused aggregate to 2.511624; both lower aggregates were driven primarily by the 30D Rosenbrock instance. No paired inferential test was reported for this sensitivity profile, and the aggregate is dominated by the larger-error instances. These alternatives were therefore not substituted into the pre-specified IBCO configuration used for the formal comparison, CEC, engineering, and high-dimensional results. They are candidates for a new matched validation round, not evidence of significant superiority or a basis for retrospectively changing the evaluated method.
4.3. Comparative Experiment
4.3.1. Formal Classical Benchmarks
Table 5 shows that IBCO obtained the lowest descriptive practical-rank aggregate, 1.0769, and received rank 1 on 24 of 26 classical instances. This ordering is conditional on the implemented capped protocol and should not be read as an equal-budget superiority claim. These rank-1 assignments include tolerance-based co-ranks; only 4 were unique rank-1 results. Original BCO was close by practical rank but had a substantially larger unscaled aggregate mean error. Against Original BCO on instance-level mean error, IBCO recorded 4 wins, 20 practical ties, and 2 losses. The two losses were F5 Rosenbrock at 10D and F7 noisy quartic at 30D. Because F7 uses fresh unmatched objective noise, its pairwise outcome is descriptive only and is not evidence of a deterministic convergence-rate difference. Because realized FE counts also differ by algorithm, the proper interpretation is favorable performance under the implemented capped protocol, not strict equal-budget or function-wise dominance.
Table 5.
Formal classical comparison over 26 problem instances.
Figure 11, Figure 12, Figure 13, Figure 14 and Figure 15 show all 26 mean best-so-far curves. Their horizontal axis is iteration index, not cumulative function evaluations. Thus, especially in the classical and high-dimensional profiles, a common horizontal location can correspond to different realized FE counts across algorithms. On many unimodal and separable instances, IBCO reaches the common optimum rapidly, so the main distinction is stability rather than an isolated terminal advantage. The wide-bound Schwefel curves display the clearest gain from bound-width-triggered recovery. Rosenbrock exposes a remaining cost of perturbation in a narrow valley; the noisy-quartic curves are interpreted only as stochastic trajectories, not as a clean convergence-rate comparison.
Figure 11.
Mean convergence curves for the formal classical comparison (part 1 of 5).
Figure 12.
Mean convergence curves for the formal classical comparison (part 2 of 5).
Figure 13.
Mean convergence curves for the formal classical comparison (part 3 of 5).
Figure 14.
Mean convergence curves for the formal classical comparison (part 4 of 5).
Figure 15.
Mean convergence curves for the formal classical comparison (part 5 of 5).
4.3.2. CEC2017 (F2 Excluded) and CEC2022 Profiles
The CEC profiles broaden the evidence beyond the classical functions. Pairwise signs and convergence curves for F7 noisy Quartic are descriptive because fresh evaluation-noise realizations were not matched across algorithms. The CEC2017 evidence is a 29-function partial profile (F1 and F3–F30; F2 excluded), whereas the CEC2022 profile contains 24 evaluated instances. Table 6 distinguishes problem-level practical rank from the descriptive run-level mean rank computed over the 30 run indices. On CEC2022, IBCO leads both measures, with a practical rank of 2.5000, a run-level mean rank of 2.8236, and 7 unique rank-1 instances. DE is close, with practical and run-level ranks of 2.5417 and 3.0785, respectively, and obtains more problem-level rank-1 assignments (12 vs. 7); DE’s count can include ties. Six of the seven protocol-conditional Holm-adjusted negative signs for IBCO in this profile occur against DE. Thus, CEC2022 supports a favorable average ordering but not loss-free dominance. The 29-function CEC2017 profile is mixed: IBCO has the lowest problem-level practical rank (3.0690) and receives 7 rank-1 assignments, all unique, whereas PSO has a slightly lower run-level mean rank (3.2977 versus 3.3644 for IBCO). In the retrospective problem-blocked analysis, the IBCO–Original BCO rank difference does not exceed the Nemenyi critical difference, and several function-level negative signs remain after Holm correction. These 29 functions support describing IBCO as competitive rather than dominant; they do not support a claim about the omitted F2 or the full 30-function suite.
Table 6.
Compact comparison on the 29-function CEC2017 partial profile (F2 excluded) and CEC2022.
Figure 16, Figure 17, Figure 18, Figure 19 and Figure 20 include every evaluated CEC2017 curve (F1 and F3–F30); F2 is absent because the archived protocol did not execute it and contains no valid F2 result. The trajectories vary substantially across hybrid and composition functions: IBCO often descends quickly and continues improving, but competing methods obtain lower endpoints on a non-negligible subset. This variation is consistent with the 16 protocol-conditional Holm-adjusted negative signs in the profile-level summary.
Figure 16.
Mean convergence curves for the 29-function CEC2017 comparison profile (F2 excluded; part 1 of 5).
Figure 17.
Mean convergence curves for the 29-function CEC2017 comparison profile (F2 excluded; part 2 of 5).
Figure 18.
Mean convergence curves for the 29-function CEC2017 comparison profile (F2 excluded; part 3 of 5).
Figure 19.
Mean convergence curves for the 29-function CEC2017 comparison profile (F2 excluded; part 4 of 5).
Figure 20.
Mean convergence curves for the 29-function CEC2017 comparison profile (F2 excluded; part 5 of 5).
Figure 21, Figure 22, Figure 23 and Figure 24 contain the 24 CEC2022 curves at 10D and 20D. The IBCO trajectory is more consistently near the leading envelope than in CEC2017, which agrees with its leading practical and run-level mean ranks. Nevertheless, crossings and terminal losses remain visible on individual functions, so the graphical evidence supports favorable average competitiveness rather than loss-free superiority.
Figure 21.
Mean convergence curves for the complete CEC2022 comparison (part 1 of 4).
Figure 22.
Mean convergence curves for the complete CEC2022 comparison (part 2 of 4).
Figure 23.
Mean convergence curves for the complete CEC2022 comparison (part 3 of 4).
Figure 24.
Mean convergence curves for the complete CEC2022 comparison (part 4 of 4).
4.3.3. Constrained Engineering Cases
The reported rank-1 designation for DE refers to the mean penalized-objective ordering under this protocol; it is not a claim about independently validated engineering optima.
On the five constrained engineering cases, IBCO had a lower unscaled aggregate of mean penalized objectives and a better mean rank than Original BCO under the implemented penalty and feasibility-tolerance rules. Because only five engineering problems serve as blocks, this profile is treated as a small-block exploratory analysis rather than a general inferential claim. The engineering wrapper used the static quadratic penalty
where denotes a non-positive inequality constraint and an equality constraint; no dynamic penalty schedule was used. For feasibility diagnostics, let and classify a run as feasible when . DE ranked first on all five cases under the implemented penalized-objective protocol and accounts for all five protocol-conditional Holm-adjusted negative signs for IBCO in this profile. The rank is based on mean penalized objective after applying a tolerance to the mean maximum violation. A direct reanalysis of the existing IBCO positions found 30 feasible runs out of 30 on each case when the same threshold was applied run by run. The mean maximum violation was zero for pressure vessel, spring, welded beam, and speed reducer and for three-bar truss. The best observed feasible designs are reported below in prose. IBCO should therefore be reported as the best BCO variant and second by the reported mean-rank ordering under the implemented penalized-objective protocol, not as the best engineering optimizer. The 30/30 feasibility diagnostic is IBCO-only; comparator-level feasible-run rates and residual distributions are unavailable.
The best pressure-vessel run had raw objective 5940.73047790925. Its design vector was [0.786231196829, 0.390186514044, 40.5145505728, 197.633386062].
The best spring run had raw objective 0.0126861543942925. Its design vector was [0.0517057953917, 0.356983911509, 11.2923847096].
The best welded-beam run had raw objective 1.73108930751419. Its design vector was [0.2058774478, 3.45680263961, 9.0690212162, 0.206027808239].
The best speed-reducer run had raw objective 2995.86959740748. Its design vector was [3.50024281243, 0.700036014502, 17.0008729186, 7.31766746014, 7.72310365601, 3.35223438486, 5.2868870584].
The best three-bar-truss run had raw objective 263.895849080965. Its design vector was [0.788746716613, 0.408045882987]. The maximum constraint violation was zero for each of these five best runs.
Figure 25 presents all five penalized-objective convergence histories. IBCO generally improves the Original BCO trajectory, while DE retains lower penalized endpoints. The arithmetic aggregate in Table 7 mixes objectives with different units and scales and is not a normalized engineering-performance measure. The engineering ranking is therefore a ranking under the penalized-objective protocol, not a ranking of independently verified feasible optima. Although the recovered positions establish 30/30 feasible IBCO runs at the stated tolerance, matched per-run feasible rates and objective distributions conditional on feasibility are not reported for every comparator, nor are the returned designs compared with independently verified best-known feasible designs. Because the penalty formulation combines objective and constraint violation and these comparative feasibility diagnostics are incomplete, the results support only a comparison under the implemented penalty protocol, not universal constraint-handling or engineering-design superiority.
Figure 25.
Mean convergence curves for the constrained engineering comparison (part 1 of 1).
Table 7.
Five leading algorithms by mean rank on the constrained engineering cases; all 12 implemented algorithms were included in the statistical analysis.
4.3.4. High-Dimensional Classical Validation
The 50D/100D validation gives IBCO the lowest descriptive practical-rank aggregate, 1.1154, and 23 rank-1 assignments among the implemented algorithms, of which only 4 are unique; the remaining rank-1 assignments are tolerance-based co-ranks. No negative protocol-conditional Holm-adjusted signs occur in this profile. Direct mean-error comparison with Original BCO nevertheless yields 4 wins, 19 practical ties, and 3 losses, showing that the two BCO variants remain close on many instances. The unscaled mean errors in Table 8 are dominated by the largest-scale functions, and realized FE counts differ by algorithm. The results therefore support a favorable high-dimensional trend under the capped protocol but do not establish equal-budget or universal high-dimensional superiority.
Table 8.
High-dimensional classical comparison over 26 problem instances.
Figure 26, Figure 27, Figure 28, Figure 29 and Figure 30 show the 50D/100D convergence set. IBCO is frequently at or near the leading envelope, particularly on the wide-bound Schwefel instances. The many visually close curves against Original BCO are consistent with the 19 practical ties. Because the horizontal axis is iteration and the realized FE counts are unequal, these panels do not establish equal-evaluation convergence speed.
Figure 26.
Mean convergence curves for the 50D/100D classical comparison (part 1 of 5).
Figure 27.
Mean convergence curves for the 50D/100D classical comparison (part 2 of 5).
Figure 28.
Mean convergence curves for the 50D/100D classical comparison (part 3 of 5).
Figure 29.
Mean convergence curves for the 50D/100D classical comparison (part 4 of 5).
Figure 30.
Mean convergence curves for the 50D/100D classical comparison (part 5 of 5).
4.3.5. Statistical Synthesis
F7 noisy Quartic remains included in the descriptive block-level rankings, but its unmatched fresh-noise evaluations are not evidence of a deterministic algorithm difference. The reported values are pairwise effect summaries for IBCO versus Original BCO and are not omnibus effect sizes.
Table 9 reports the retrospective Friedman/Nemenyi and effect-size reanalysis of the existing raw runs. All seven problem-blocked omnibus tests reject the null of equal treatments at , meaning that at least one treatment differs in block-level rank; this result is not evidence that IBCO is the superior treatment. For every profile, however, the IBCO–Original BCO mean-rank difference is smaller than the corresponding Nemenyi critical difference. The median is the median, across problem instances, of the probability that a randomly selected IBCO terminal value is smaller than a randomly selected Original BCO value, with half credit for ties; its 95% interval bootstraps problem instances. For the minimization objective, indicates no directional advantage, whereas values above 0.5 favor IBCO; these are problem-bootstrap intervals rather than 30-run individual-level confidence intervals. The intervals are wide for profiles with many tolerance ties or few problem blocks. The CEC2017 comparison interval crosses 0.5, and the formal classical, formal ablation, and high-dimensional intervals touch 0.5; the CEC2017 ablation, CEC2022, and engineering intervals lie above 0.5. These effect sizes describe IBCO relative to Original BCO and do not replace the all-configuration rank comparison.
Table 9.
Retrospective reanalysis of existing 30-run records. Friedman tests use problem instances as blocks and the 30-run median terminal value as the response; no optimizer was rerun. The Friedman and Nemenyi procedures use ; Nemenyi critical differences are exploratory post hoc thresholds. is the probability that IBCO has a smaller terminal value than Original BCO for the minimization objective, with half credit for ties, summarized by a problem-bootstrap 95% interval rather than a 30-run individual-level interval. The final column reports problem-level practical rank-1 assignments, not Friedman rank-1 assignments; ties may be included. The engineering row is a small-block exploratory result because it contains only five problem blocks.
Table 10 separately preserves the protocol-conditional signed-rank-derived sign counts from the original statistical workflow. Neither the classical profile nor the high-dimensional profile contains a negative protocol-conditional Holm-adjusted sign, whereas CEC2017, CEC2022, and the engineering cases contain both positive and negative results. Because strict run pairing is not encoded row by row and F7 noise was not matched, these counts remain secondary evidence even though the problem-blocked Friedman omnibus tests are now reported. Collectively, the results support competitive performance over the tested profiles, subject to the noise and unequal-FE qualifications, but do not justify a universal-best claim.
Table 10.
Protocol-conditional signed-rank-derived signs before and after Holm correction. Counts are descriptive for noisy F7.
4.3.6. Cross-Profile IBCO–Original BCO Summary
To make the magnitude and heterogeneity of the observed improvement easier to inspect, Table 11 summarizes metrics that are already reported for IBCO and Original BCO. For all listed metrics, lower values are preferable; the relative reduction is computed as . The rank-based rows use the corresponding problem-blocked or practical rank definition stated in the surrounding sections, whereas the error and penalized-objective rows are unscaled descriptive aggregates. The table is not a new experiment and should not be interpreted as a normalized effect-size analysis.
Table 11.
Descriptive cross-profile comparison of IBCO and Original BCO using existing records. Relative reduction is positive when the IBCO value is lower; rank and aggregate-error scales are profile-specific.
The relative reductions vary substantially across profiles. The largest numerical reduction is the classical unscaled mean error, but this aggregate mixes heterogeneous function scales and is therefore not directly comparable with the engineering penalized aggregate, whose reduction is only 1.03%. Rank reductions are more moderate and remain conditional on each profile’s rank construction. These differences indicate that the practical gain is landscape-dependent rather than a uniform improvement factor. The retained records include realized function-evaluation counts, but they do not include synchronized wall-clock time, peak memory, CPU utilization, or energy measurements under a common hardware configuration. Consequently, the present study cannot quantify an improvement-per-watt or improvement-per-second ratio; those measurements are required before making a claim about net computational advantage.
All convergence panels report mean best-so-far trajectories against iteration index. They visualize search dynamics and terminal tendencies, but they are neither FE-normalized plots nor significance tests. Because strict pairing cannot be reconstructed row by row from the result files, the signed-rank-derived sign tables are protocol-conditional secondary summaries rather than definitive inferential evidence; the F7 entries are descriptive only because objective-noise realizations were not matched.
4.3.7. Scope and Reproducibility Limitations
The comparator set emphasizes established population-based optimizers and does not include recent strong adaptive differential-evolution, ensemble, or other state-of-the-art optimizers for which matched implementations were unavailable. The reported ordering is therefore relative only to the 12 implemented versions and cannot establish contemporary state-of-the-art performance. Parameter and source provenance for several baseline implementations is local rather than tied to an official release, which also limits cross-study comparability.
The available reproducibility materials include MATLAB scripts, raw run arrays, summary tables, and convergence histories, but the result files do not embed an immutable source commit, file checksums, or a seed value beside every observation. The CEC adapters additionally depend on external MEX binaries and input-data directories whose release identifiers and checksums were not stored with the results. CEC2017 F2 was excluded at execution time without a dedicated F2 experiment and must remain outside every CEC2017 claim. These source-version limitations, the stochastic F7 objective, unequal realized FE counts in the classical and high-dimensional profiles, and incomplete comparator-level per-run engineering feasibility reporting prevent bitwise reproduction and narrow the conclusions to the documented implementations and capped protocols.
5. Discussion
IBCO should be interpreted as an incremental integration of three control mechanisms into the existing Bezier-trajectory framework, not as a new optimizer paradigm. Strategy A acts on the balance signal only when relative diversity is below its threshold and the dimension, range, iteration, and stagnation gates permit a response. Strategy B changes feasibility repair without consuming an additional objective evaluation. Strategy C is activated after non-improvement and targets only inferior individuals under greedy acceptance. The ablation results distinguish the tested configurations and associate Strategy B with the clearest stability benefit, while Strategies A and C are more sensitive to dimension and landscape scale. However, the experiments do not report activation counts, repair counts, accepted perturbations, or time-resolved diversity and stagnation traces. They therefore do not establish a causal mechanism account or synergy among the three strategies.
The most favorable results are obtained on the formal classical and high-dimensional profiles. Under the implemented capped protocols, IBCO obtained the lowest descriptive practical-rank aggregate in both profiles, and neither profile contains a negative protocol-conditional Holm-adjusted sign. Gains occur on several wide-bound deceptive functions, but the present design does not isolate whether diversity adjustment, reflective repair, perturbation, or their interaction produces those gains. The two classical losses against Original BCO, on 10D Rosenbrock and 30D noisy quartic, are equally informative. A narrow curved valley can reward uninterrupted local refinement, while a noisy landscape can make recovery triggers less reliable. These cases show why state-dependent perturbation should be interpreted as a compromise rather than a universally beneficial addition.
The CEC and engineering results define a stricter boundary. On the 29-function CEC2017 partial profile (F1 and F3–F30; F2 excluded) and on CEC2022, IBCO has the lowest problem-level practical rank. It also has the leading original run-level mean rank on CEC2022, whereas PSO is slightly ahead on the CEC2017 original run-level mean-rank measure and the IBCO–PSO Nemenyi difference is not significant. Function-level losses remain after multiplicity correction, particularly in CEC2017. On the engineering profile, IBCO improves both rank and mean penalized objective relative to Original BCO, yet DE ranks first on every case under the implemented penalized-objective protocol. The cross-profile summary shows that the relative reduction ranges from 1.03% for the engineering penalized aggregate to 83.63% for the unscaled classical mean error; the latter is strongly affected by heterogeneous function scales. These values therefore indicate landscape-dependent gains rather than a common improvement factor. The evidence supports competitiveness across heterogeneous test families and an improvement within the BCO family. It does not support the claim that IBCO dominates every comparator or application class.
The function-evaluation protocol is an important part of this interpretation. CEC2017, CEC2022, and engineering comparisons used fixed per-run realized evaluation counts of 9030, 9030, and 3030, respectively. These counts describe the documented evaluations used or reached by each run within its profile and should not be read as identical candidate-generation or evaluation sequences for every algorithm and run. The classical and high-dimensional comparisons are not: Original BCO and most baselines used 9030 evaluations, IBCO used 9030–9144 because Strategy C can evaluate extra stagnation-recovery candidates, and HHO used 10,000. Those two profiles are therefore cap-controlled rather than exactly evaluation-matched. Explicit accounting makes this difference visible but does not remove its potential effect on rankings or pairwise comparisons. Runtime values also remain implementation- and hardware-dependent and should not be interpreted as platform-independent complexity measurements.
Limitations
Several limitations remain. First, the comparator set used in this study consists mainly of established population optimizers and does not include stronger recent DE families such as LSHADE-cnEpSin, CP-EODE, JADE, SHADE, or SaDE. Comparisons with source-code implementations of those methods under exactly matched realized evaluation budgets are required before extending the relative-performance conclusions to the current state of the field. The BCO-specific literature base is also limited in the verified material used here: the available source documents the original BCO but does not establish a complete taxonomy of adaptive, diversity-controlled, boundary-aware, hybrid, or high-dimensional BCO variants. The BCO gap claimed in this paper is consequently bounded to the documented source and should not be read as an exhaustive claim about all related publications.
Second, the thresholds and Strategy C settings were pre-specified and evaluated only at selected settings. In particular, the absolute bound-width gate of 100 depends on the units and numerical width of the decision bounds. No affine rescaling or equivalent change-of-units experiment was conducted, so the results do not establish invariance to problem representation or multi-scale robustness. The mechanism telemetry is also incomplete: the reported ablations do not quantify when each gate fires, how often repair or perturbation is accepted, or how those events alter diversity. This prevents attribution of the observed outcomes to a specific mechanism pathway or to interactions among mechanisms.
Third, the retrospective problem-blocked analysis supplies a Friedman omnibus test for each of the seven comparison or ablation profiles and an interval for IBCO versus Original BCO. All seven tests reject the omnibus null of equal treatments at , but this only indicates that at least one treatment differs within a profile. It does not imply a significant IBCO–Original BCO contrast. The IBCO–Original BCO mean-rank difference remains below the corresponding Nemenyi critical difference in every profile. Effect sizes and intervals are not available for every comparator pair, and the original signed-rank/Holm outputs remain conditional on a run-pairing protocol that cannot be reconstructed row by row from the raw files. Complete comparator-by-problem median, IQR, success-rate, and effect-size tables were not reconstructed in this no-new-experiment revision; the aggregate tables should therefore be treated as descriptive summaries. The engineering evidence covers only five cases and is therefore a small-block exploratory result: the existing IBCO positions yield 30/30 feasible runs under the stated tolerance, but comparator-level feasible rates and conditional feasible-objective distributions are incomplete. No complete IBCO UAV study with threat definitions, constraints, and independent runs is reported; consequently, no UAV performance claim is made. The dense convergence-figure set is descriptive and should not be treated as a substitute for numerical uncertainty and effect-size reporting.
Fourth, the manuscript package does not itself include the separate anonymized companion archive; that archive is maintained separately and will be supplied through the review channel or by the corresponding author. It is intended to provide the MATLAB implementation, benchmark wrappers, raw runs, summary tables, reanalysis script, and plotting workflow. It improves inspectability but does not recover information that was never stored with the observations, including a source commit, per-row seed, and release identifiers or checksums for the external CEC MEX and input-data files. Exact bitwise reproduction therefore remains unverified, and a persistent versioned public archive is still required for final publication. The retained records also do not provide synchronized wall-clock, peak-memory, CPU-utilization, or energy measurements, so the net computational return of the additional Strategy-C evaluations cannot be quantified in this revision. Finally, convergence curves and non-parametric tests summarize repeated-run behavior but do not provide a theoretical convergence proof.
6. Conclusions and Future Work
This paper evaluated improved Bezier curve-based optimization (IBCO) as an incremental modification of Original BCO. It retains the linear, quadratic, and cubic Bezier trajectory operators and integrates a dimension- and bound-gated diversity-adaptive balance factor, reflective boundary repair, and stagnation perturbation for inferior individuals. These additions reuse established population-control, feasibility-repair, and perturbation ideas within the BCO update structure. The CEC and engineering profiles used the same realized evaluation count per run within each documented profile; this does not imply identical candidate-generation or evaluation sequences. In the classical and high-dimensional profiles, however, Original BCO used 9030 evaluations and IBCO used 9030–9144; those results do not constitute strict equal-budget comparisons.
Across 26 formal classical instances, IBCO obtained the lowest descriptive practical-rank aggregate (1.0769) and 24 tolerance-aware rank-1 assignments among 12 implemented algorithms, but only 4 were unique first places. The formal ablation study associated Strategy B with the clearest stability benefit, while the incomplete mechanism telemetry does not demonstrate synergy among the complete configuration’s components. IBCO led the problem-level practical ranks on the 29-function CEC2017 partial profile (F1 and F3–F30; F2 excluded) and CEC2022; CEC2017 remained mixed, whereas CEC2022 was more consistently favorable. On five constrained engineering cases, IBCO improved over Original BCO but remained behind DE. The 50D/100D profile yielded 23 rank-1 assignments, of which only 4 were unique. Although all seven retrospective, problem-blocked Friedman tests rejected the omnibus null of equal treatments at , none of the IBCO–Original BCO mean-rank differences exceeded its Nemenyi critical difference. Without affine scaling tests, the high-dimensional results do not establish representation-scale invariance or multi-scale robustness.
The evidence supports IBCO as an incremental and sometimes competitive modification of BCO within the tested profiles, not as a new or universally dominant optimizer. It does not establish strict budget-matched superiority in the classical and high-dimensional profiles, representation-scale invariance, mechanism synergy, or bitwise reproducibility. Future work should enforce equal realized evaluation counts; test affine rescaling and changes of units; record gate activations, repairs, perturbations, acceptance, diversity, and stagnation trajectories; compare against recent high-performance DE and CMA-ES baselines; and extend effect-size and interval reporting to every important comparator pair. Engineering studies should report comparator-level feasibility rates, constraint violations, feasible design variables, and independent-run uncertainty. A more selective main-text figure set should be paired with machine-readable numerical results, and the exact implementation, raw runs, and figure-generation workflow should be deposited in a persistent versioned repository. These empirical steps should precede stronger claims, while theoretical work can examine conditions under which diversity gating and reflective repair alter Bezier-trajectory search.
Author Contributions
Data Curation, D.H.; Writing—original draft, P.L.; Writing—review and editing, Y.Z., D.Z., Z.L., L.H., B.L. and J.Z.; Visualization, P.L. and D.H. All authors have read and agreed to the published version of the manuscript.
Funding
This research received no external funding. The article processing charge was not funded by any specific agency.
Data Availability Statement
The dataset and MATLAB implementation supporting the findings of this study have been submitted as a supplementary archive with this article. The archive includes the available MATLAB implementation and benchmark wrappers, raw run arrays, summary tables, convergence histories, reanalysis scripts, and plotting workflow. The data are provided subject to the reproducibility limitations stated in the manuscript: the retained result files do not embed an immutable source commit, file checksums, or a seed value beside every observation, and the external CEC MEX binaries and input-data directories are not redistributed in the archive.
Acknowledgments
During the preparation of this work, the authors used OpenAI Codex to assist with source-manuscript integration, English-language editing, and LaTeX formatting. After using this tool, the authors reviewed and edited the content as needed and take full responsibility for the content of the publication.
Conflicts of Interest
The authors declare no conflicts of interest.
References
- Hansen, N.; Ostermeier, A. Completely Derandomized Self-Adaptation in Evolution Strategies. Evol. Comput. 2001, 9, 159–195. [Google Scholar] [CrossRef] [Scilit] [PubMed]
- Storn, R.; Price, K. Differential Evolution—A Simple and Efficient Heuristic for Global Optimization over Continuous Spaces. J. Glob. Optim. 1997, 11, 341–359. [Google Scholar] [CrossRef] [Scilit]
- Holland, J.H. Genetic algorithms. Sci. Am. 1992, 267, 66–72. [Google Scholar] [CrossRef] [Scilit]
- Kennedy, J.; Eberhart, R. Particle swarm optimization. In Proceedings of ICNN’95—International Conference on Neural Networks; IEEE: Piscataway, NJ, USA, 1995; Volume 4, pp. 1942–1948. [Google Scholar] [CrossRef] [Scilit]
- Mirjalili, S.; Mirjalili, S.M.; Lewis, A. Grey Wolf Optimizer. Adv. Eng. Softw. 2014, 69, 46–61. [Google Scholar] [CrossRef] [Scilit]
- Mirjalili, S.; Lewis, A. The Whale Optimization Algorithm. Adv. Eng. Softw. 2016, 95, 51–67. [Google Scholar] [CrossRef] [Scilit]
- Mirjalili, S. Moth-flame optimization algorithm: A novel nature-inspired heuristic paradigm. Knowl.-Based Syst. 2015, 89, 228–249. [Google Scholar] [CrossRef] [Scilit]
- Mirjalili, S. SCA: A Sine Cosine Algorithm for solving optimization problems. Knowl.-Based Syst. 2016, 96, 120–133. [Google Scholar] [CrossRef] [Scilit]
- Mirjalili, S.; Gandomi, A.H.; Mirjalili, S.Z.; Saremi, S.; Faris, H.; Mirjalili, S.M. Salp Swarm Algorithm: A bio-inspired optimizer for engineering design problems. Adv. Eng. Softw. 2017, 114, 163–191. [Google Scholar] [CrossRef] [Scilit]
- Heidari, A.A.; Mirjalili, S.; Faris, H.; Aljarah, I.; Mafarja, M.; Chen, H. Harris hawks optimization: Algorithm and applications. Future Gener. Comput. Syst. 2019, 97, 849–872. [Google Scholar] [CrossRef] [Scilit]
- Abualigah, L.; Diabat, A.; Mirjalili, S.; Abd Elaziz, M.; Gandomi, A.H. The Arithmetic Optimization Algorithm. Comput. Methods Appl. Mech. Eng. 2021, 376, 113609. [Google Scholar] [CrossRef] [Scilit]
- Zhang, J.; Sanderson, A.C. JADE: Adaptive Differential Evolution with Optional External Archive. IEEE Trans. Evol. Comput. 2009, 13, 945–958. [Google Scholar] [CrossRef] [Scilit]
- Tanabe, R.; Fukunaga, A. Success-History Based Parameter Adaptation for Differential Evolution. In 2013 IEEE Congress on Evolutionary Computation; IEEE: Piscataway, NJ, USA, 2013; pp. 71–78. [Google Scholar] [CrossRef] [Scilit]
- Tanabe, R.; Fukunaga, A. Improving the Search Performance of SHADE Using Linear Population Size Reduction. In 2014 IEEE Congress on Evolutionary Computation (CEC); IEEE: Piscataway, NJ, USA, 2014; pp. 1658–1665. [Google Scholar] [CrossRef] [Scilit]
- Leung, Y.; Gao, Y.; Xu, Z.B. Degree of population diversity—A perspective on premature convergence in genetic algorithms and its Markov chain analysis. IEEE Trans. Neural Netw. 1997, 8, 1165–1176. [Google Scholar] [CrossRef] [Scilit] [PubMed]
- Eiben, A.E.; Hinterding, R.; Michalewicz, Z. Parameter control in evolutionary algorithms. IEEE Trans. Evol. Comput. 1999, 3, 124–141. [Google Scholar] [CrossRef] [Scilit]
- Biedrzycki, R.; Arabas, J.; Jagodzinski, D. Bound constraints handling in Differential Evolution: An experimental study. Swarm Evol. Comput. 2019, 50, 100453. [Google Scholar] [CrossRef] [Scilit]
- Kononova, A.V.; Vermetten, D.; Caraffini, F.; Mitran, M.L.; Zaharie, D. The Importance of Being Constrained: Dealing with Infeasible Solutions in Differential Evolution and Beyond. Evol. Comput. 2024, 32, 3–48. [Google Scholar] [CrossRef] [Scilit] [PubMed]
- Zhao, W.; Xie, Y.; Wang, L.; Zhang, Z.; Khodadadi, N.; Mirjalili, S. An effective Bezier curve-based optimization (BCO) for large-scale numerical problems and 3D unmanned aerial vehicle path planning with efficient multiple threats evasion. Adv. Eng. Inform. 2026, 73, 104524. [Google Scholar] [CrossRef] [Scilit]
- Forrest, A.R. Interactive interpolation and approximation by Bezier polynomials. Comput.-Aided Des. 1990, 22, 527–537. [Google Scholar] [CrossRef] [Scilit]
- Wozny, P.; Chudy, F. Linear-time geometric algorithm for evaluating Bezier curves. Comput.-Aided Des. 2020, 118, 102760. [Google Scholar] [CrossRef] [Scilit]
- Wilcoxon, F. Individual Comparisons by Ranking Methods. Biom. Bull. 1945, 1, 80–83. [Google Scholar] [CrossRef] [Scilit]
- Holm, S. A simple sequentially rejective multiple test procedure. Scand. J. Stat. 1979, 6, 65–70. [Google Scholar]
- Nemenyi, P.B. Distribution-Free Multiple Comparisons. Ph.D. Thesis, Princeton University, Princeton, NJ, USA, 1963. [Google Scholar]
- Demsar, J. Statistical comparisons of classifiers over multiple data sets. J. Mach. Learn. Res. 2006, 7, 1–30. [Google Scholar]
- Derrac, J.; Garcia, S.; Molina, D.; Herrera, F. A practical tutorial on the use of nonparametric statistical tests as a methodology for comparing evolutionary and swarm intelligence algorithms. Swarm Evol. Comput. 2011, 1, 3–18. [Google Scholar] [CrossRef] [Scilit]
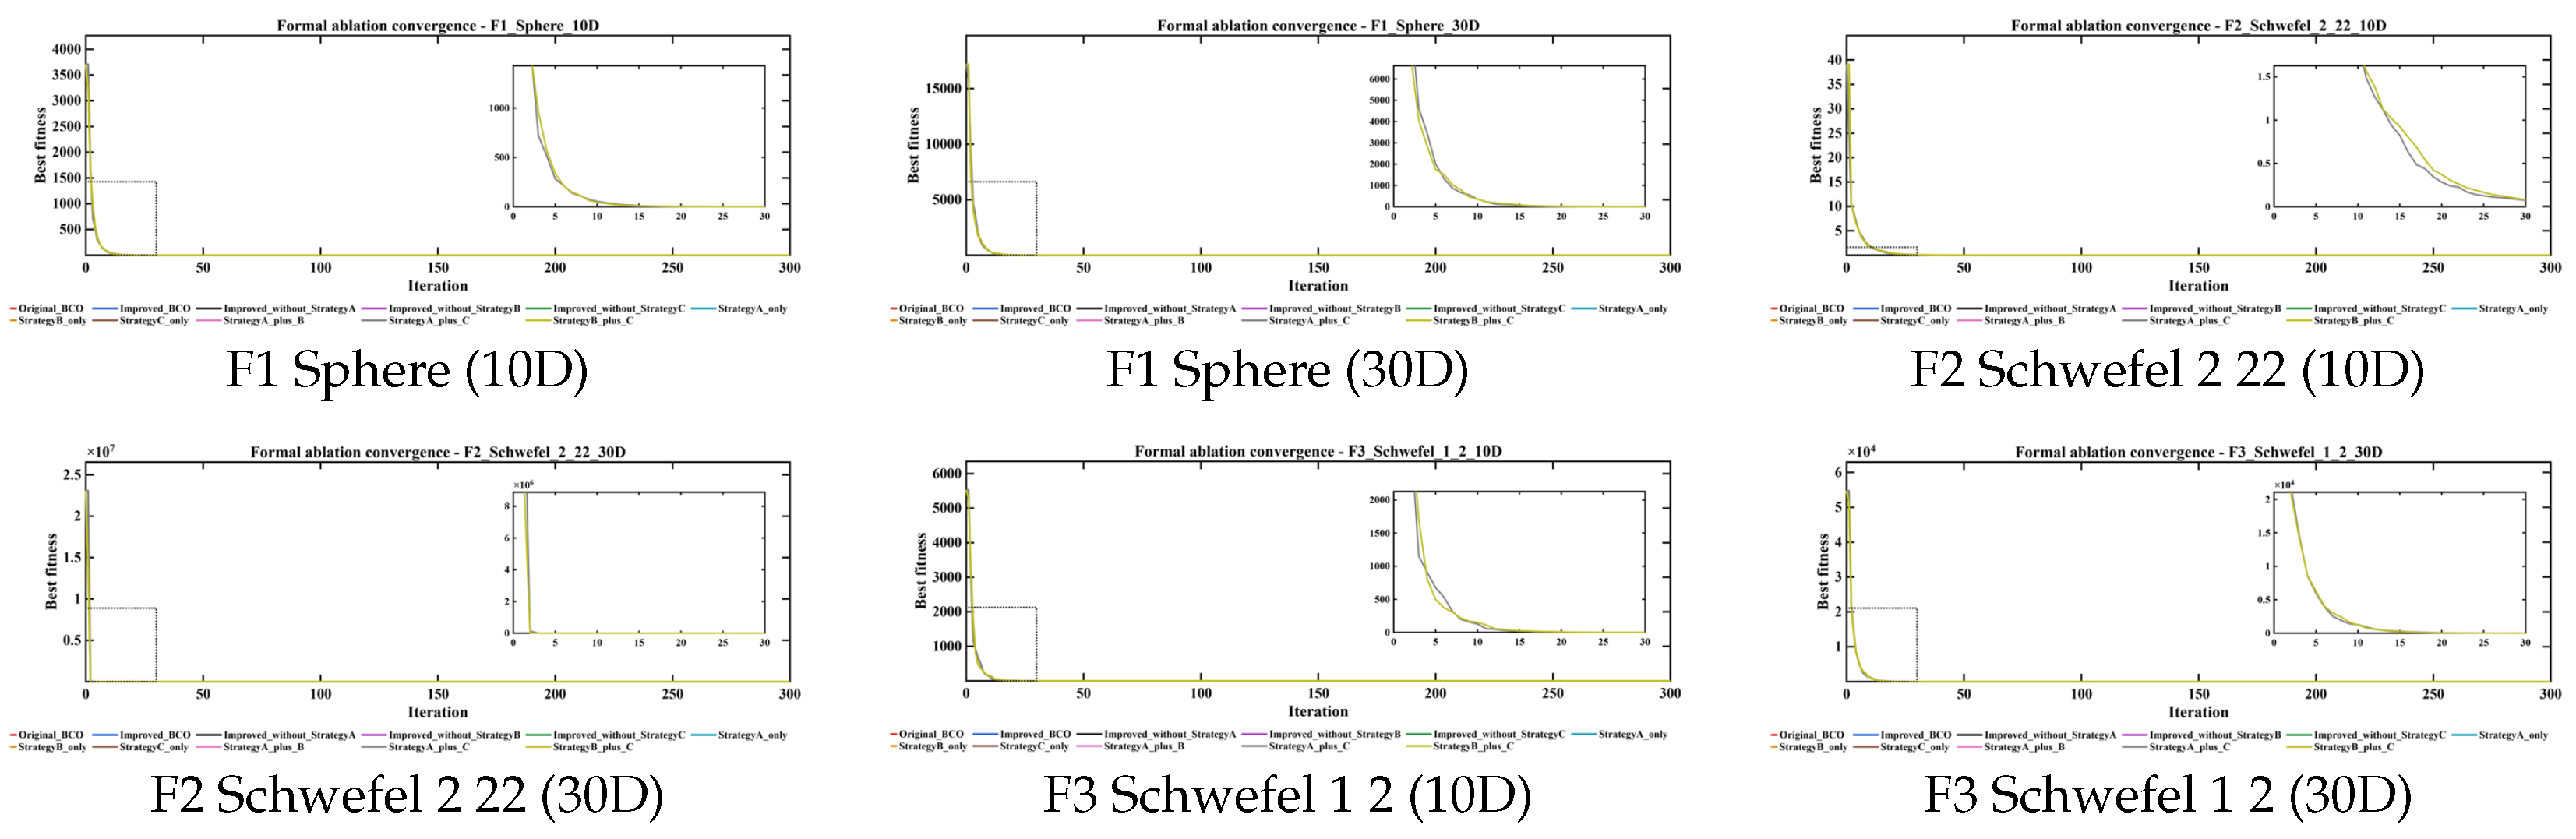
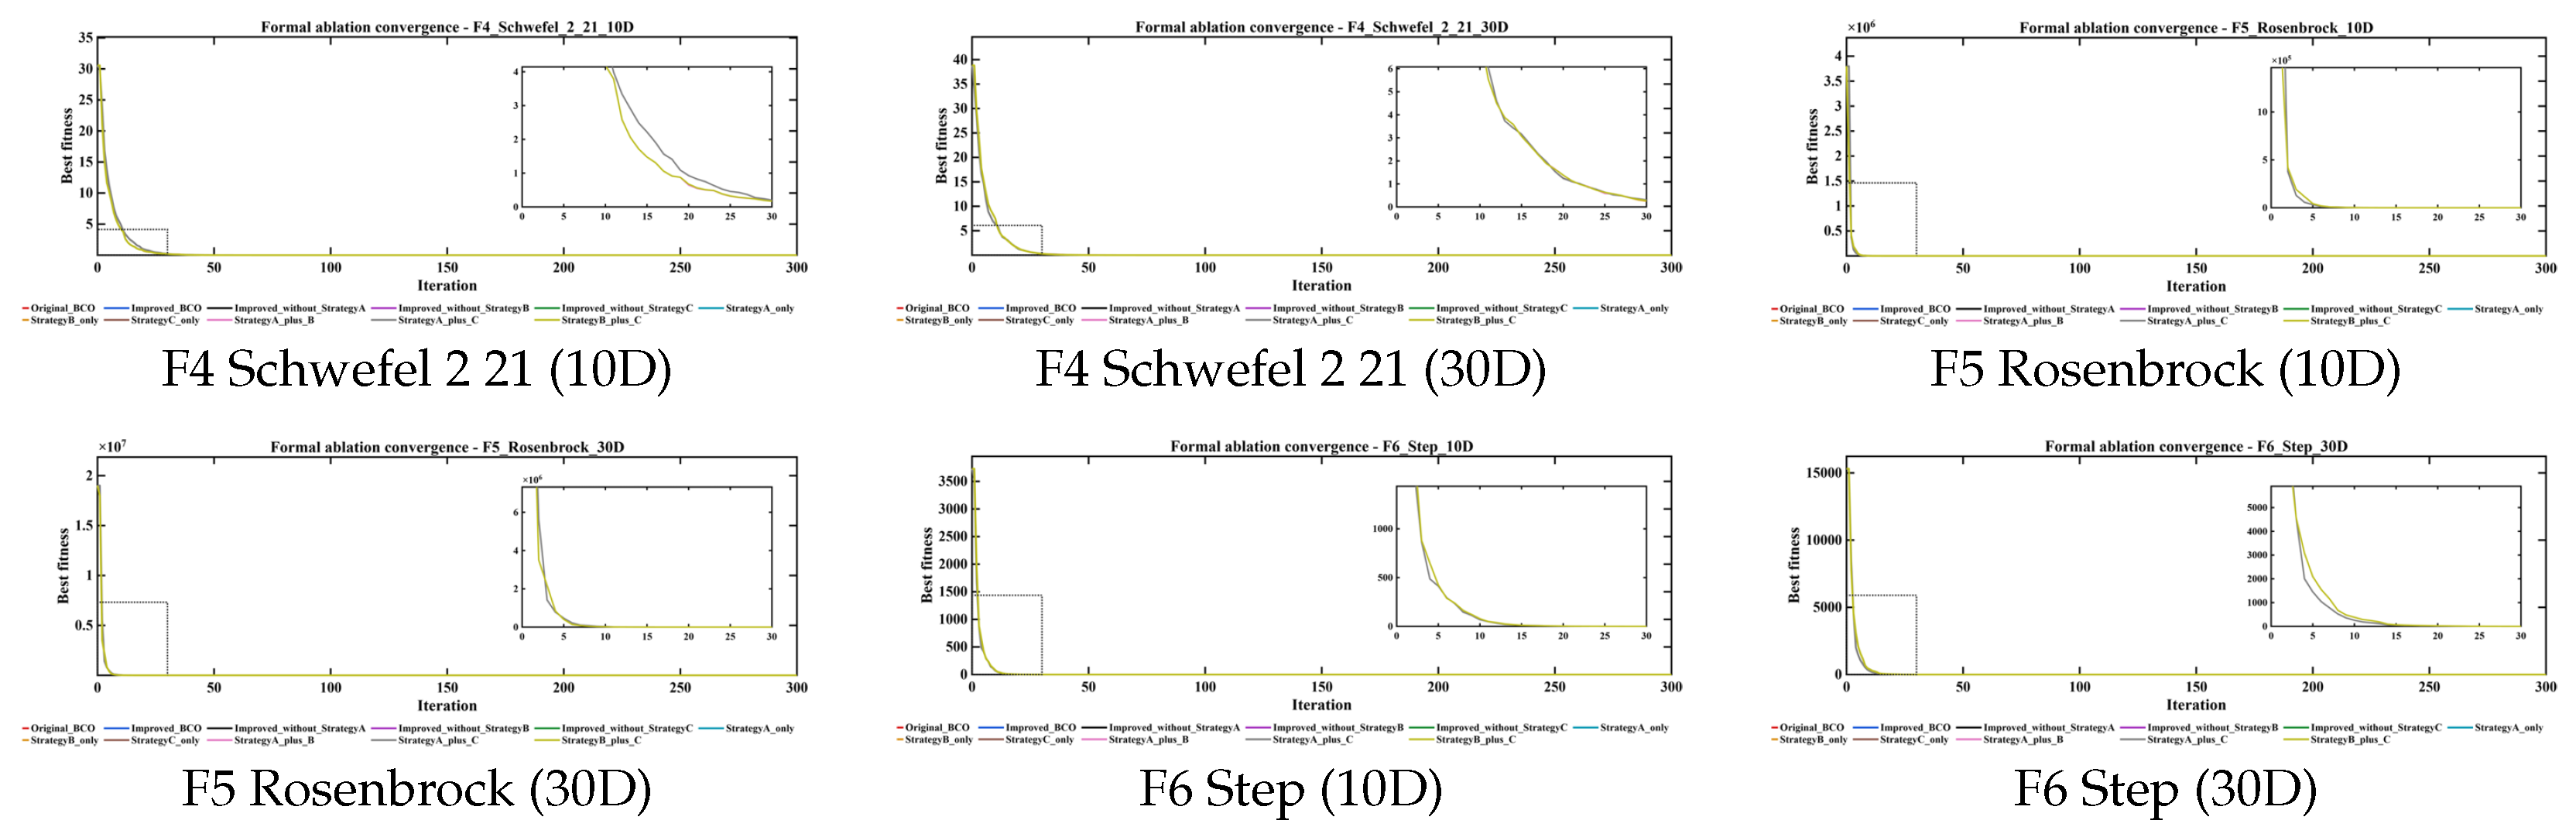
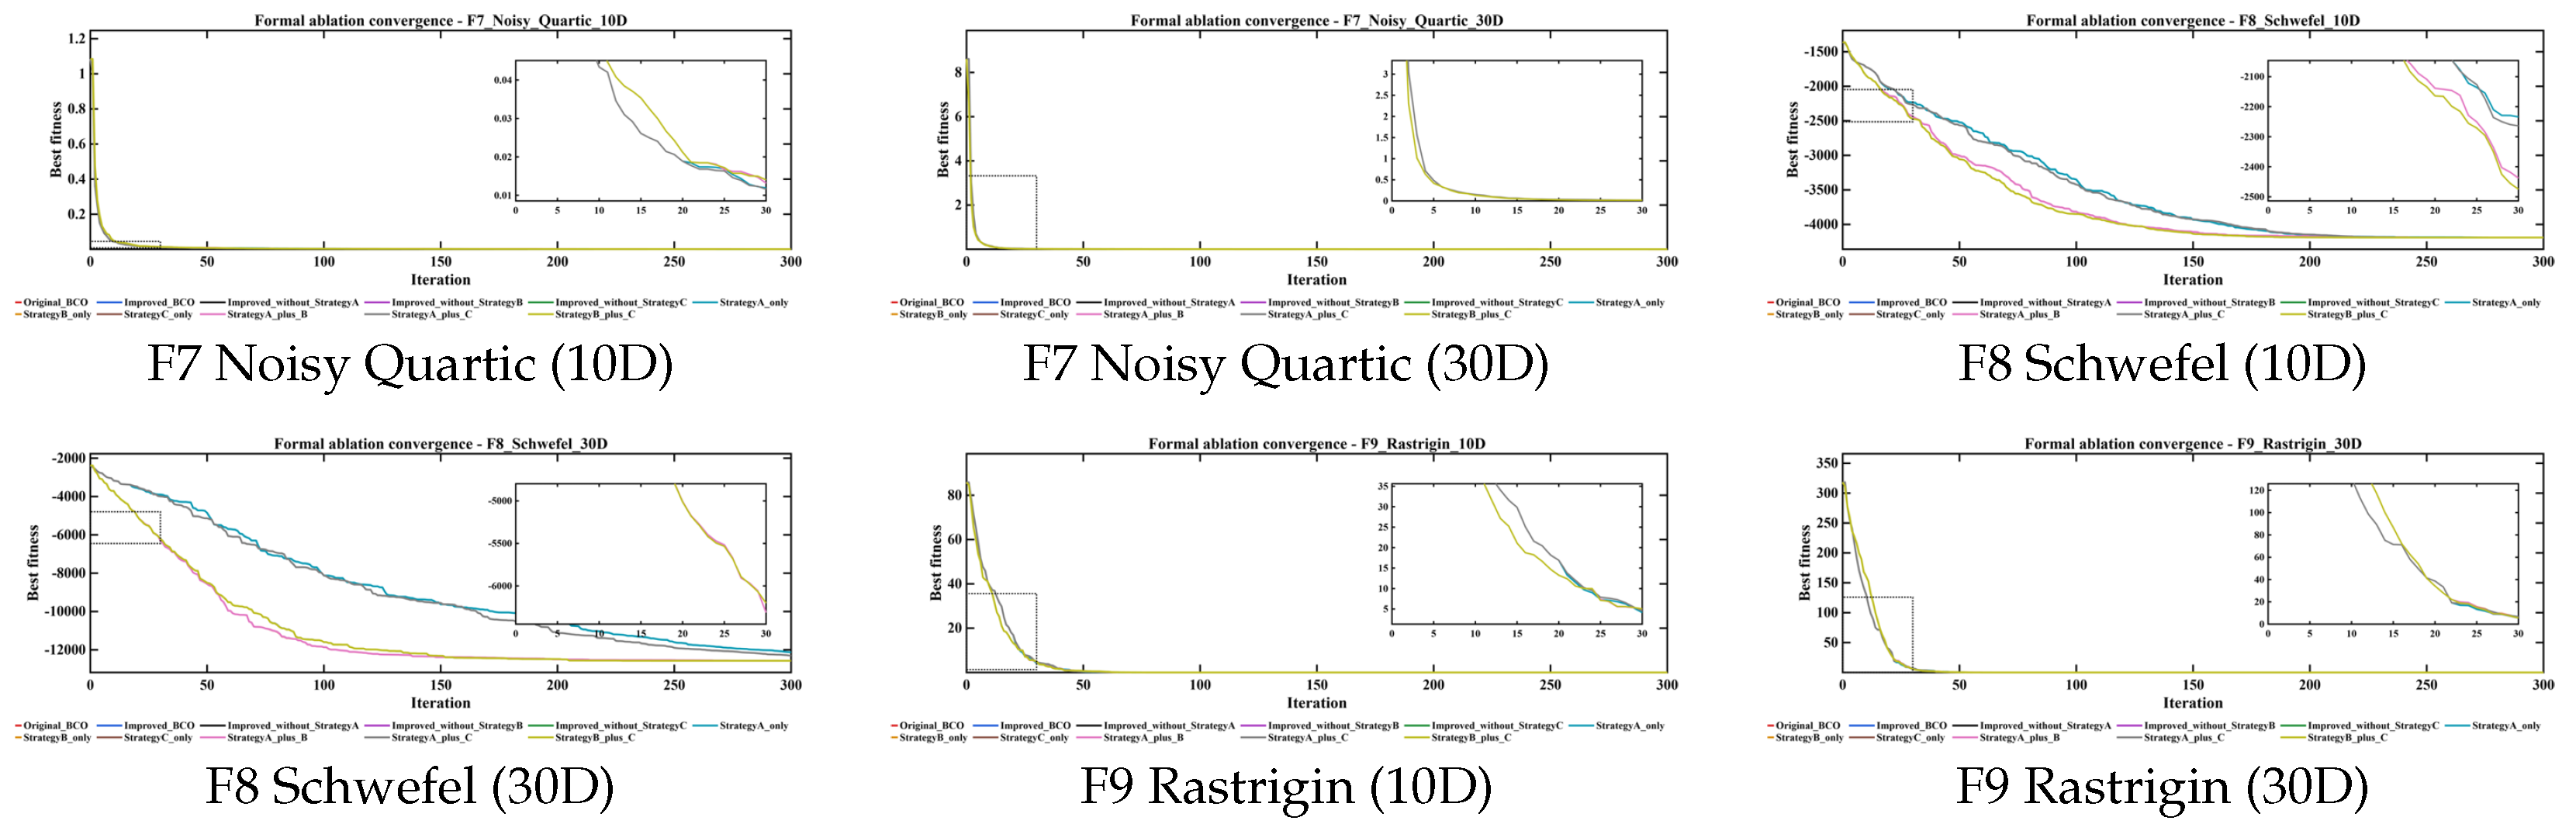
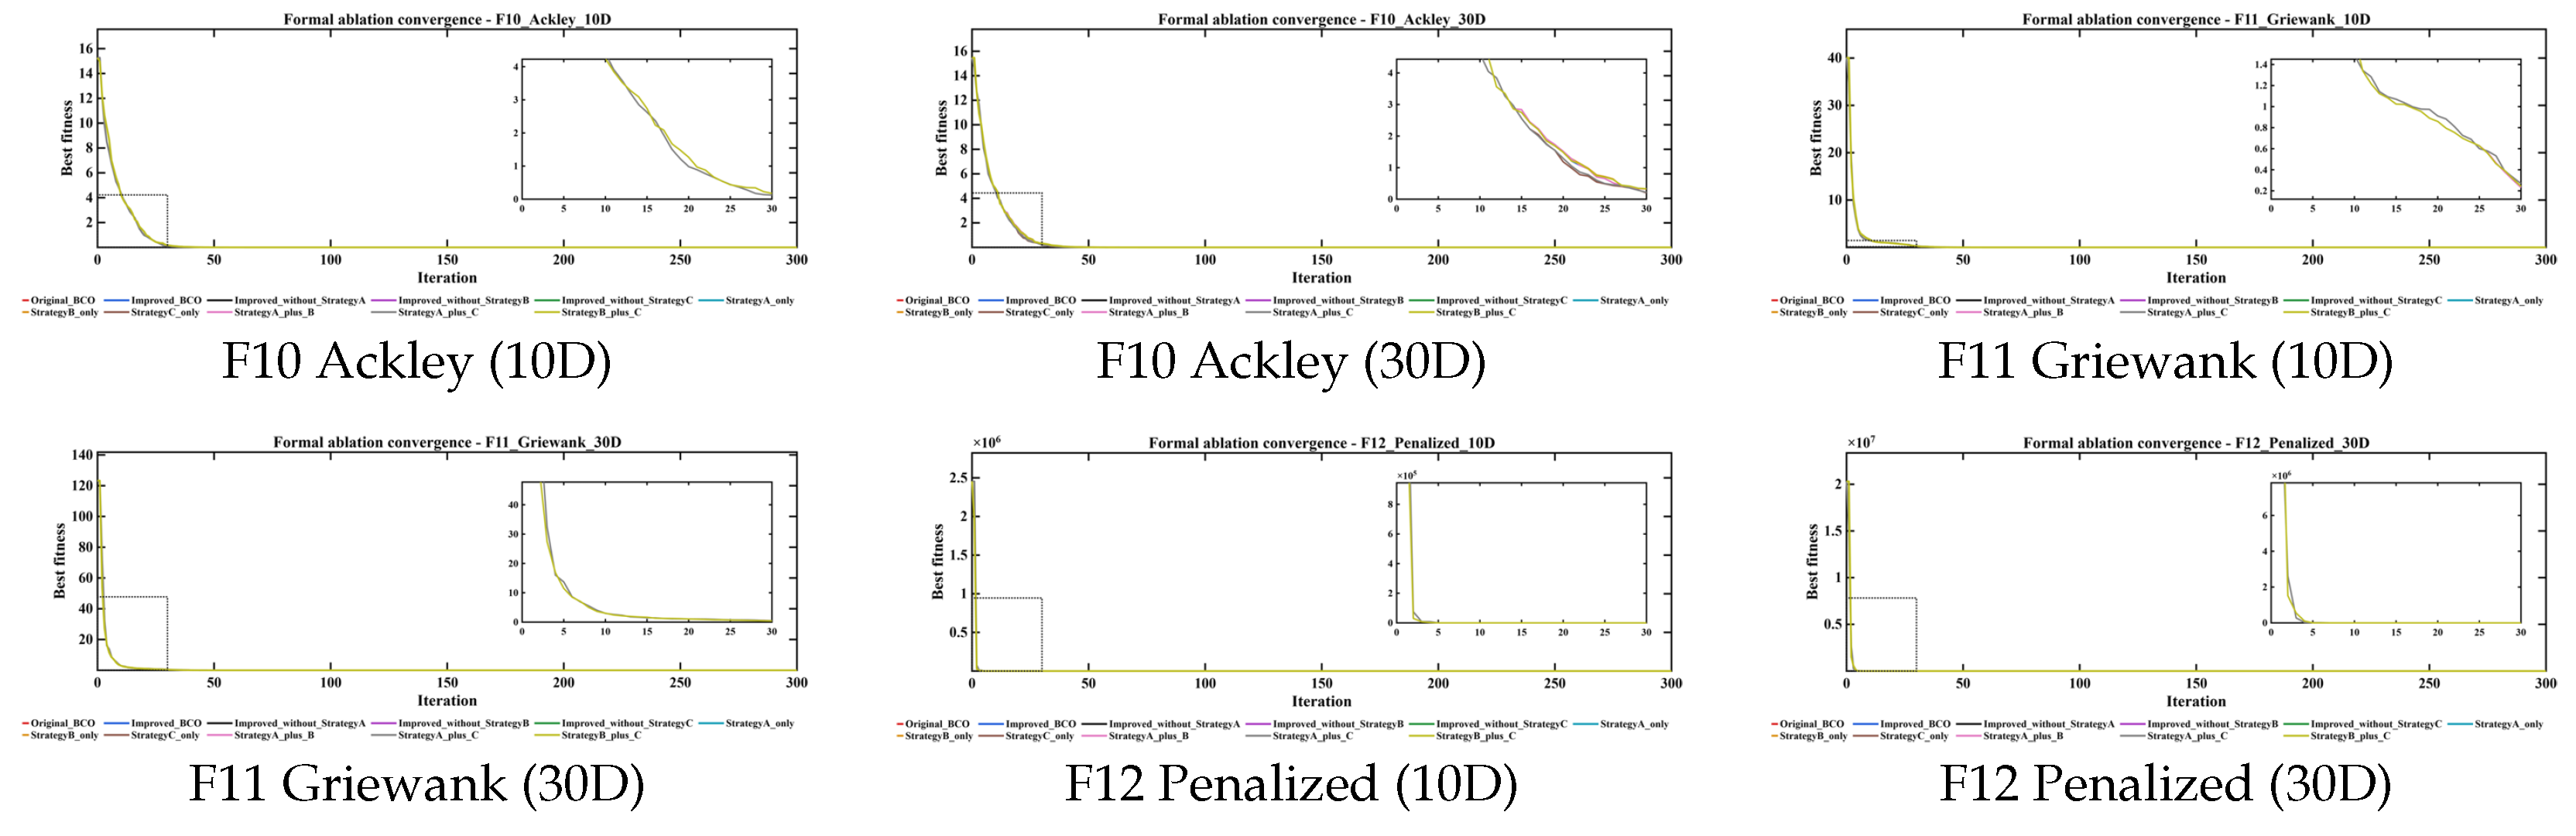



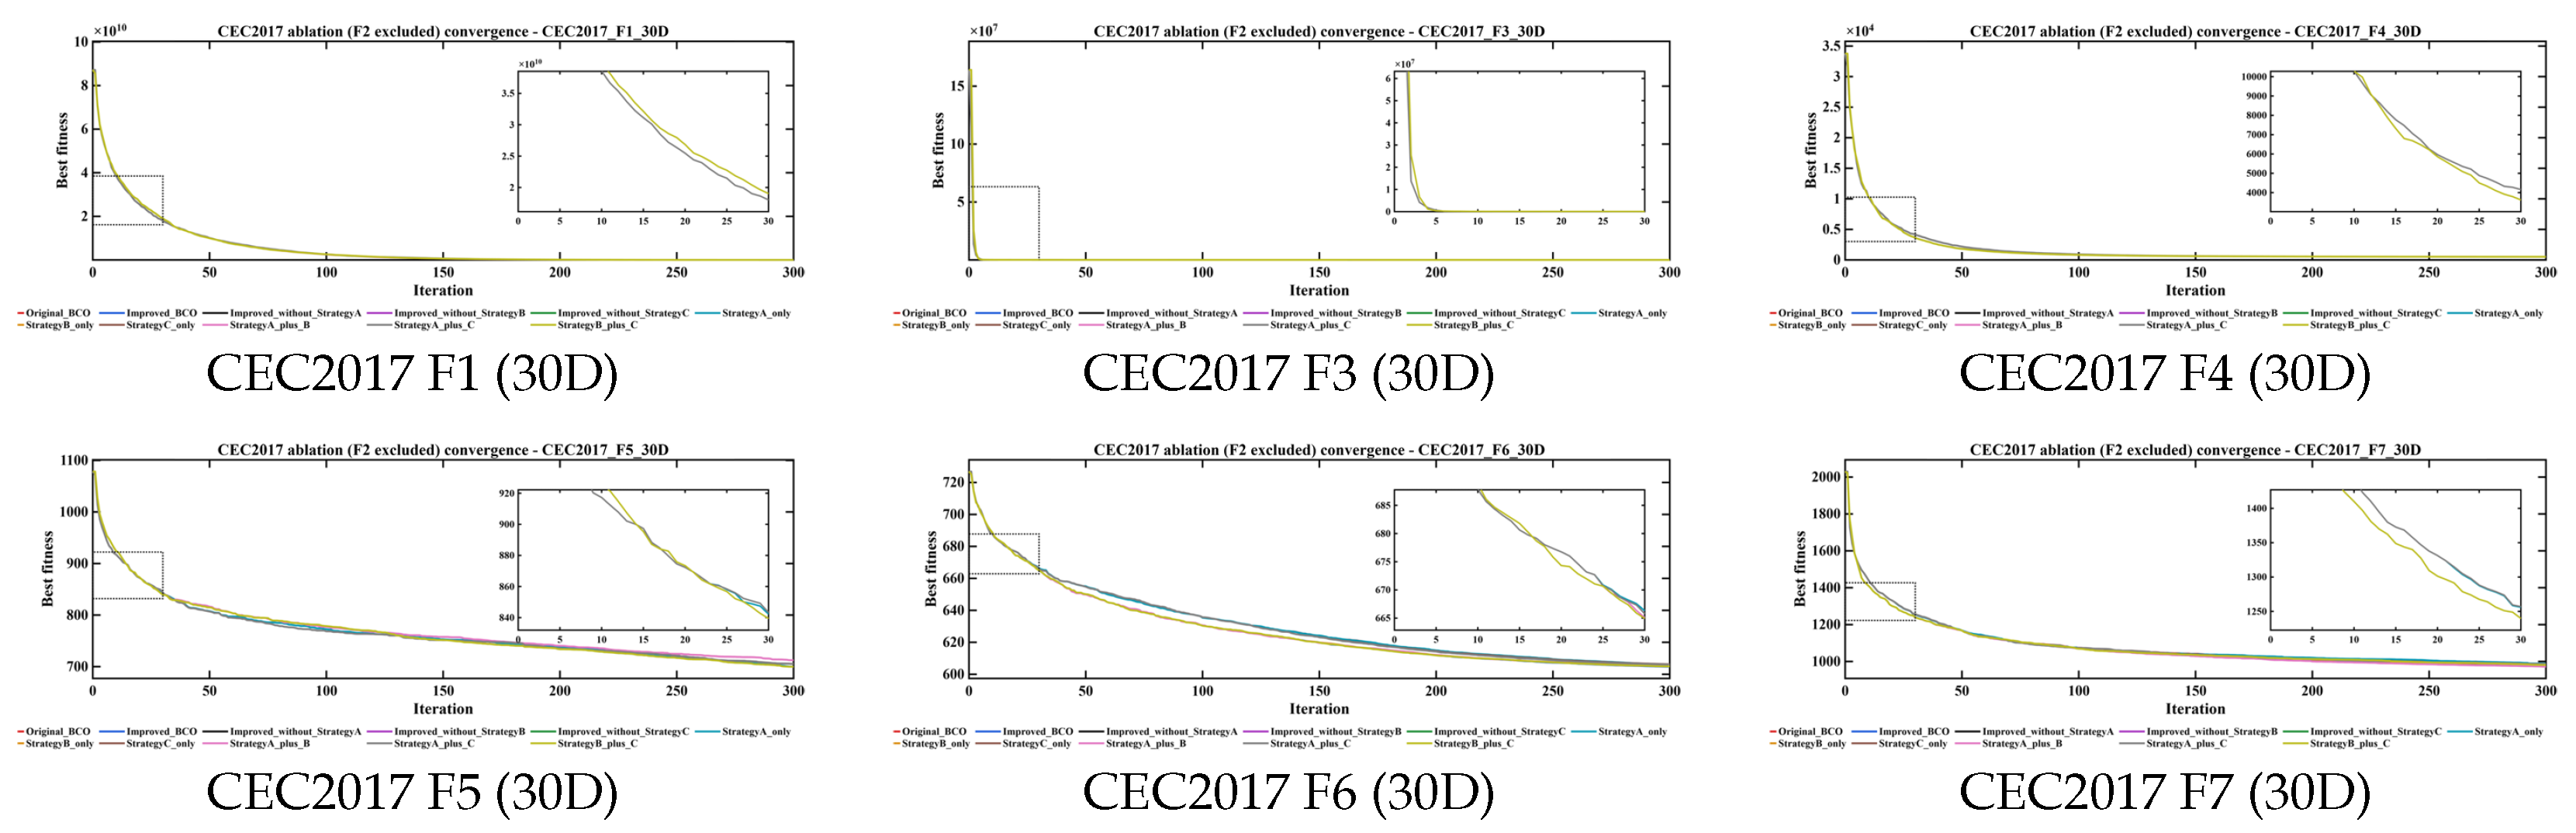

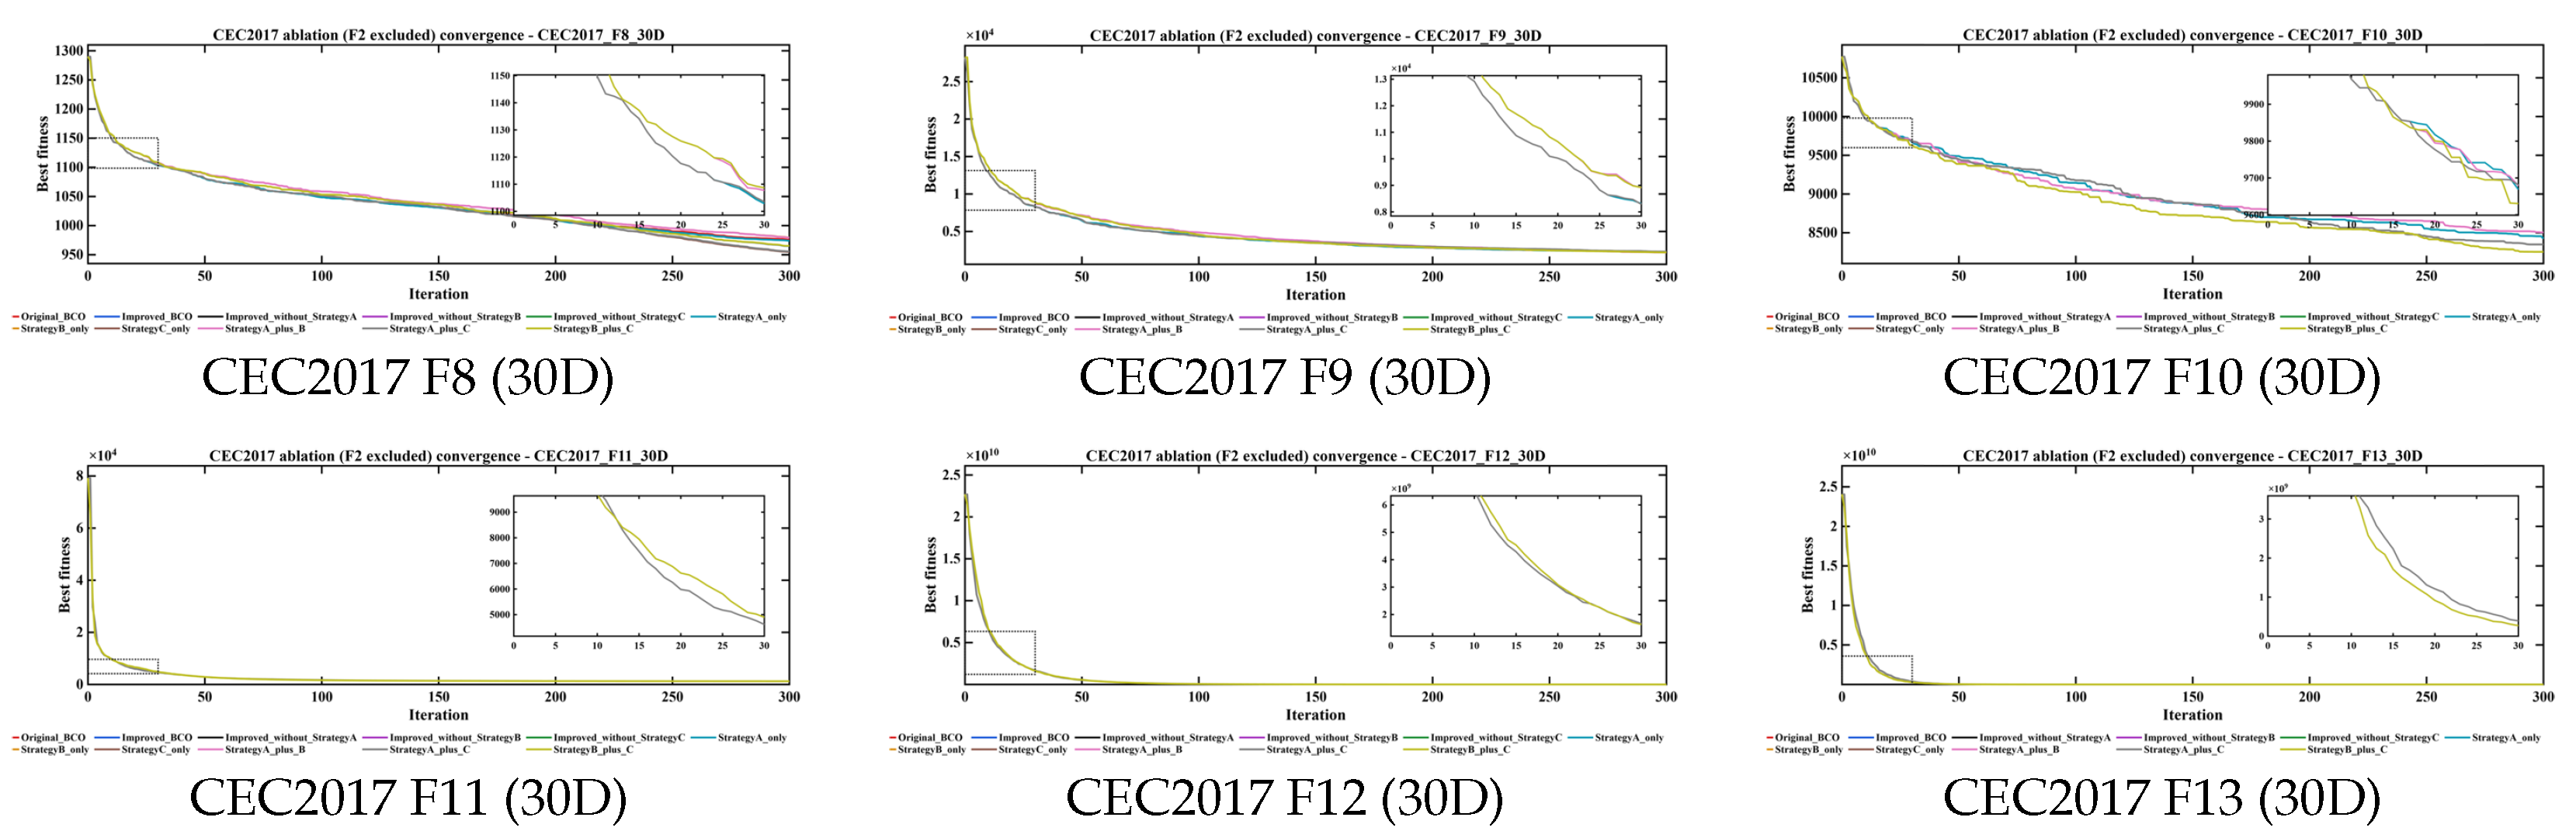

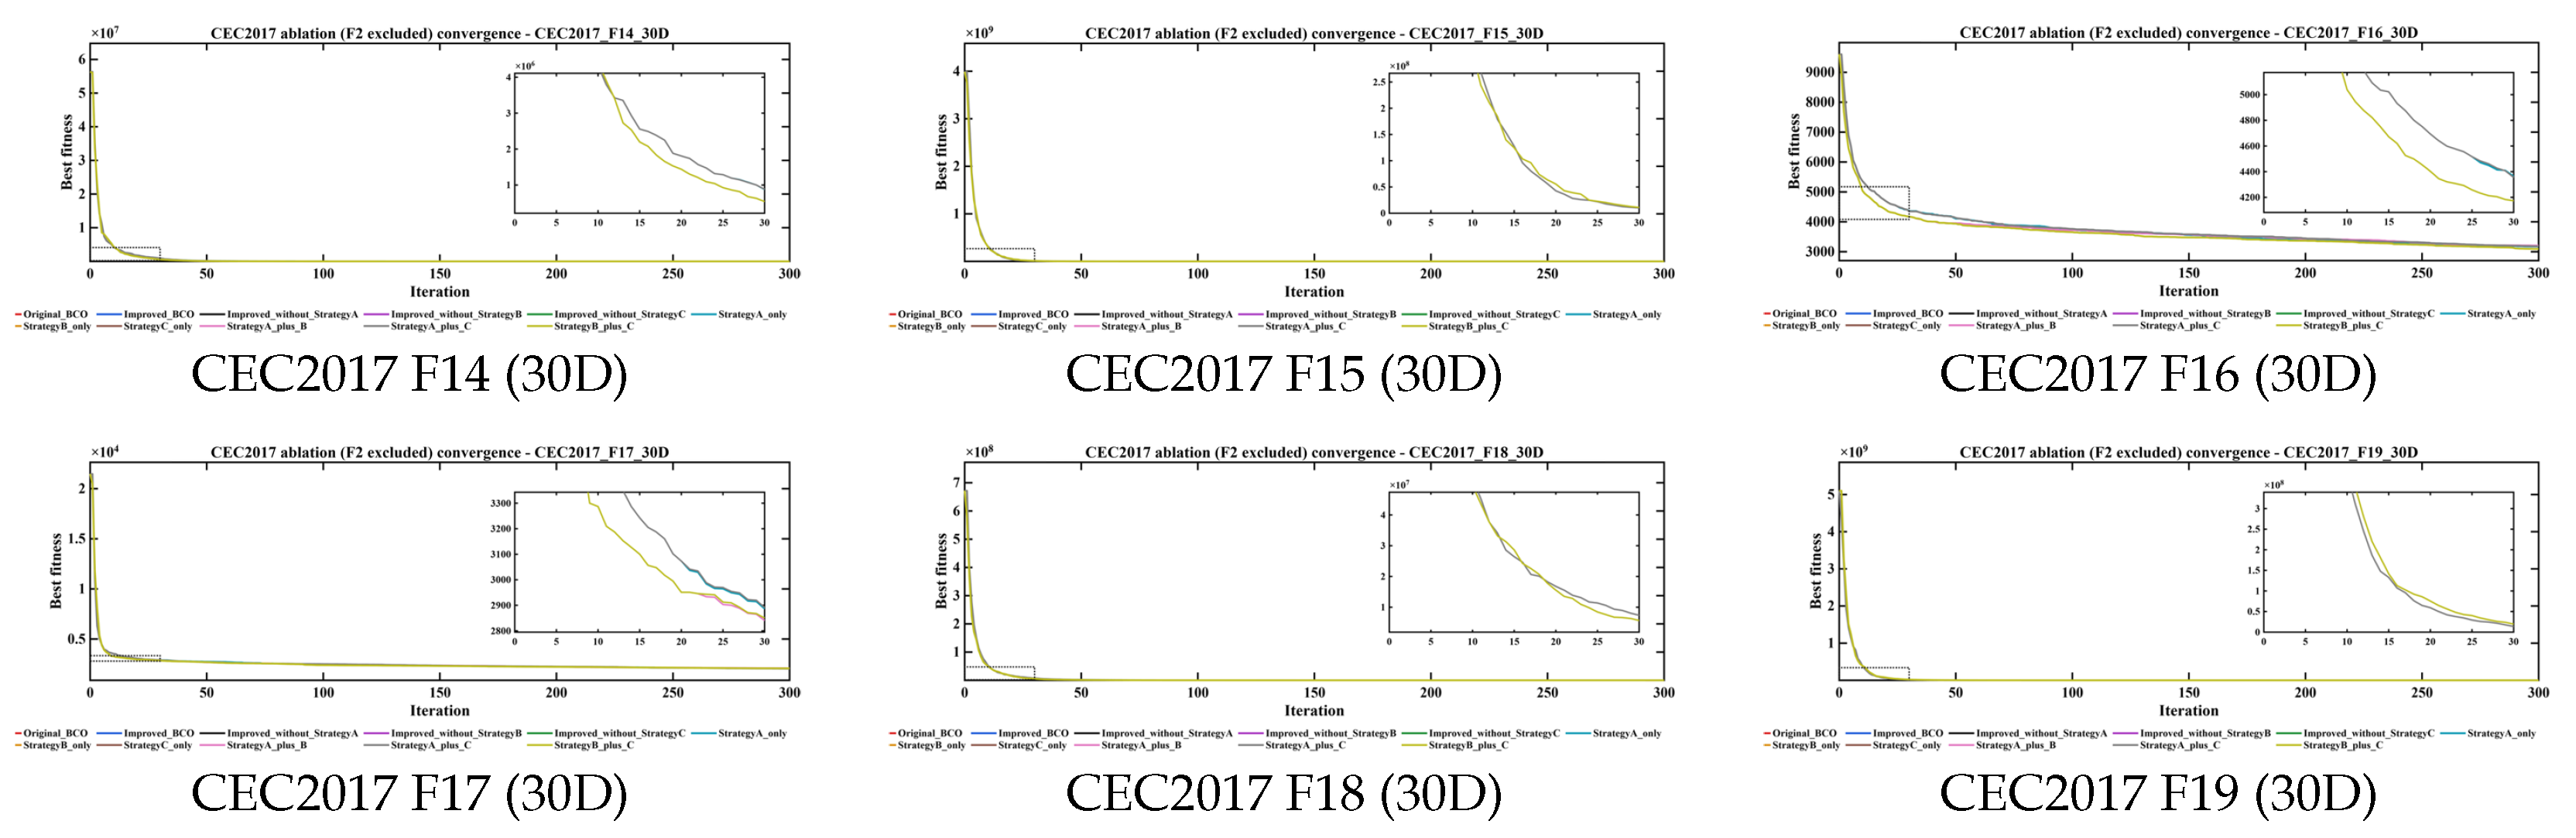

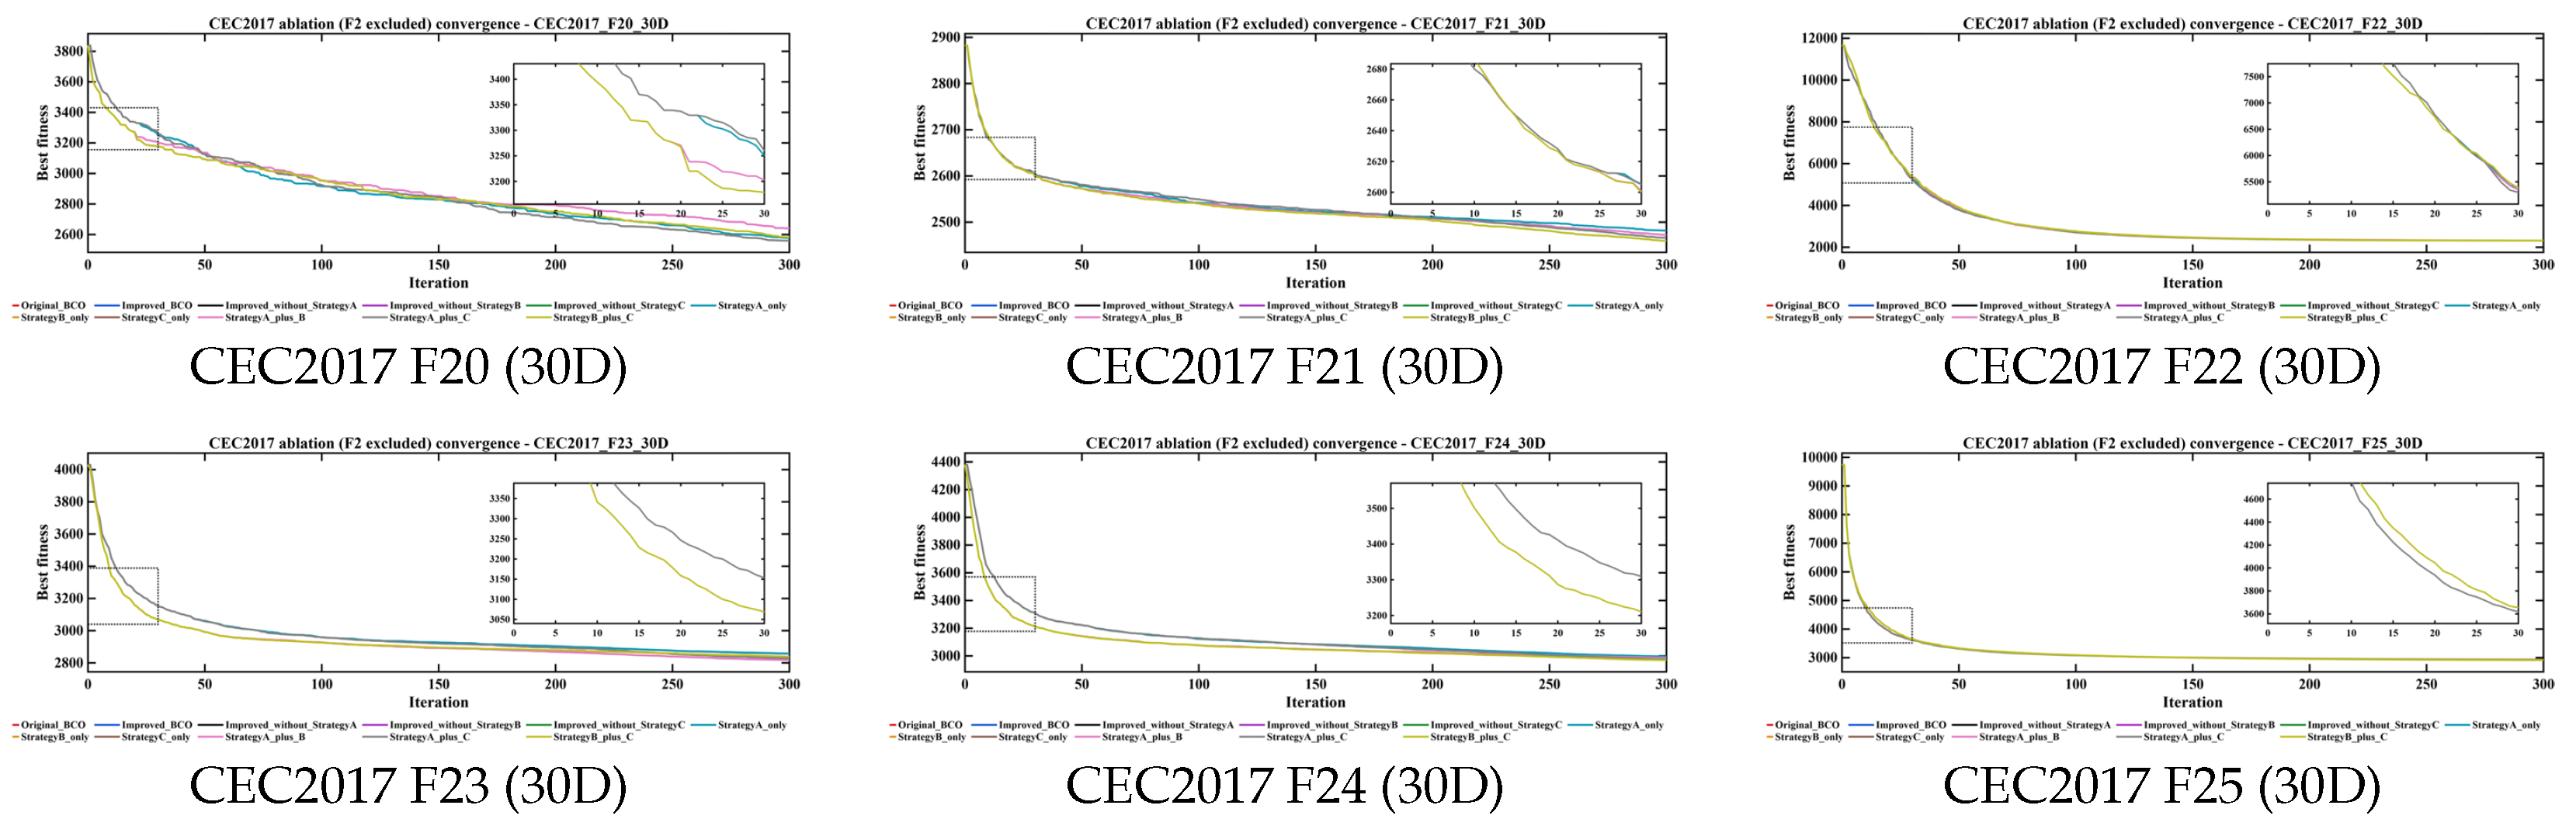
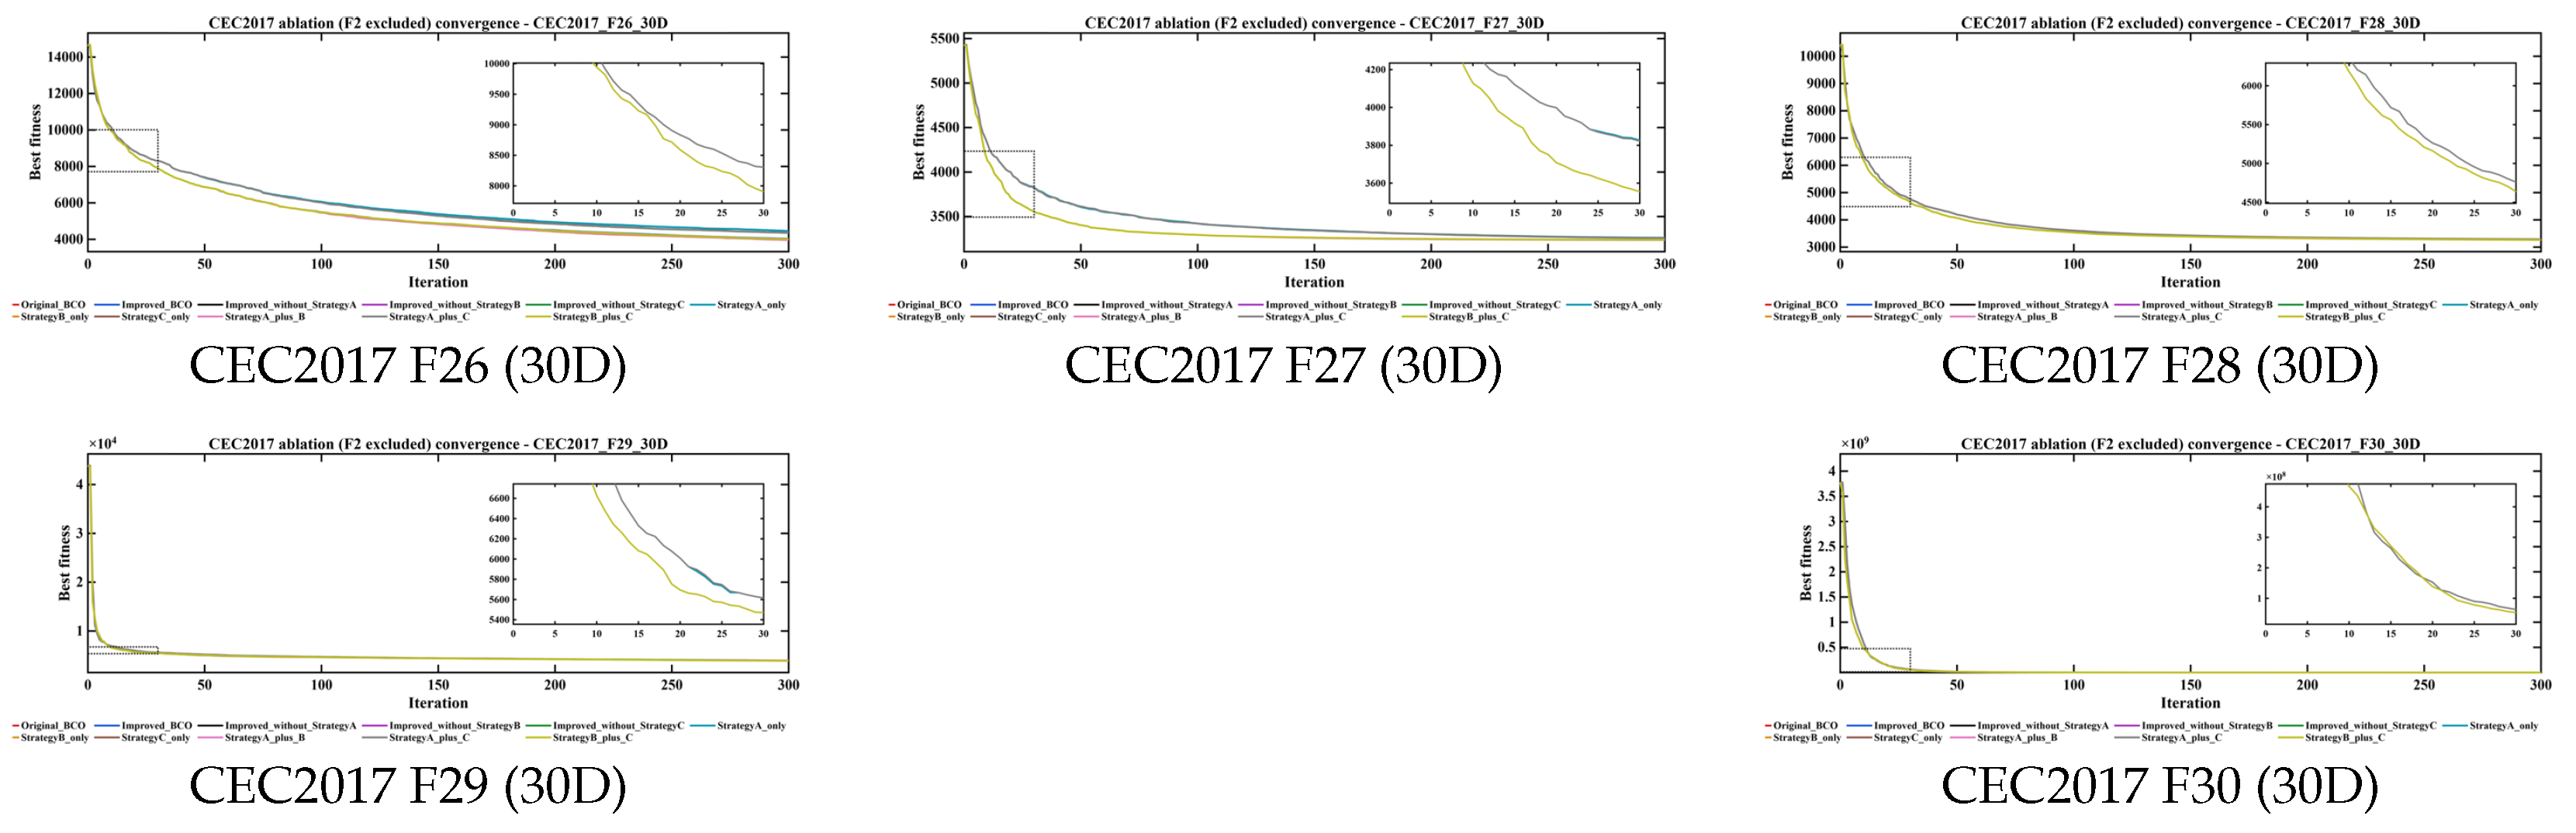
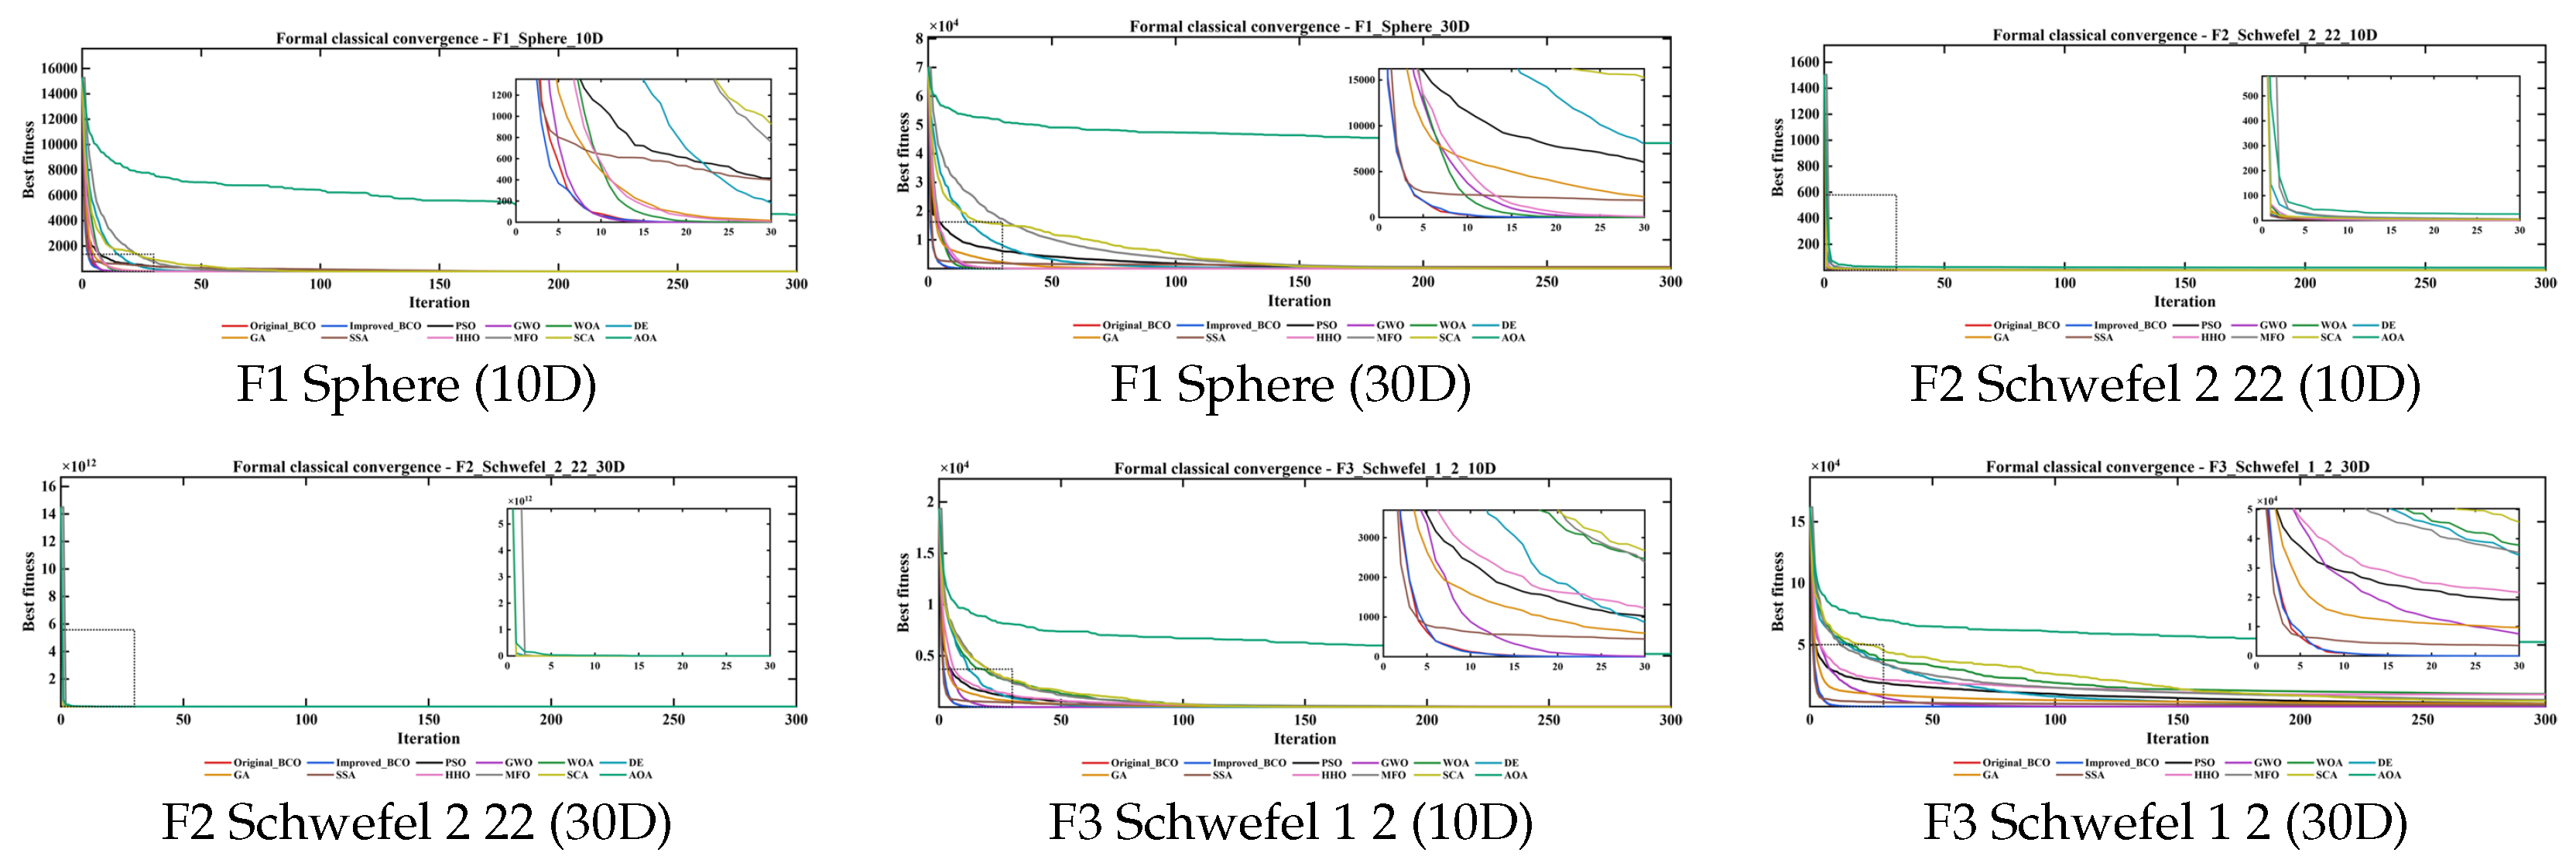
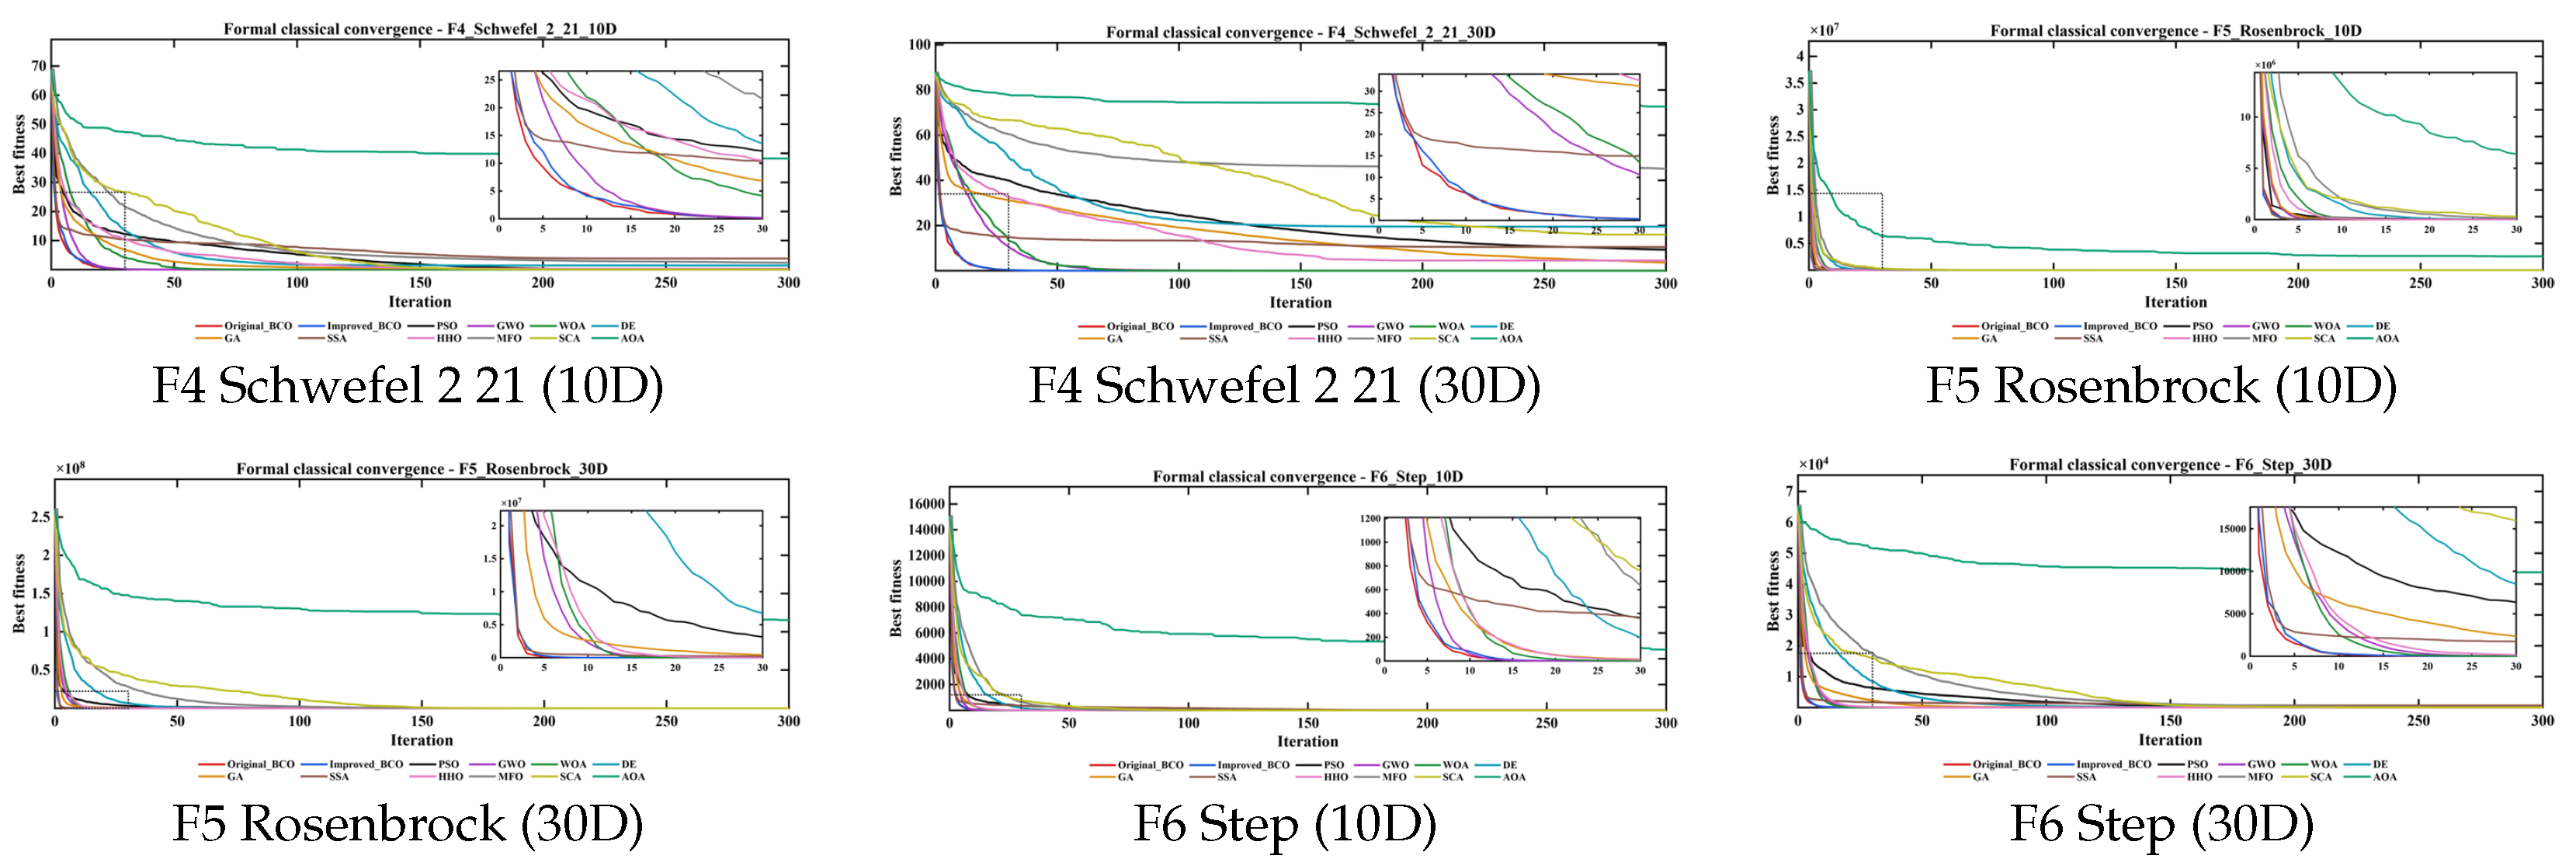
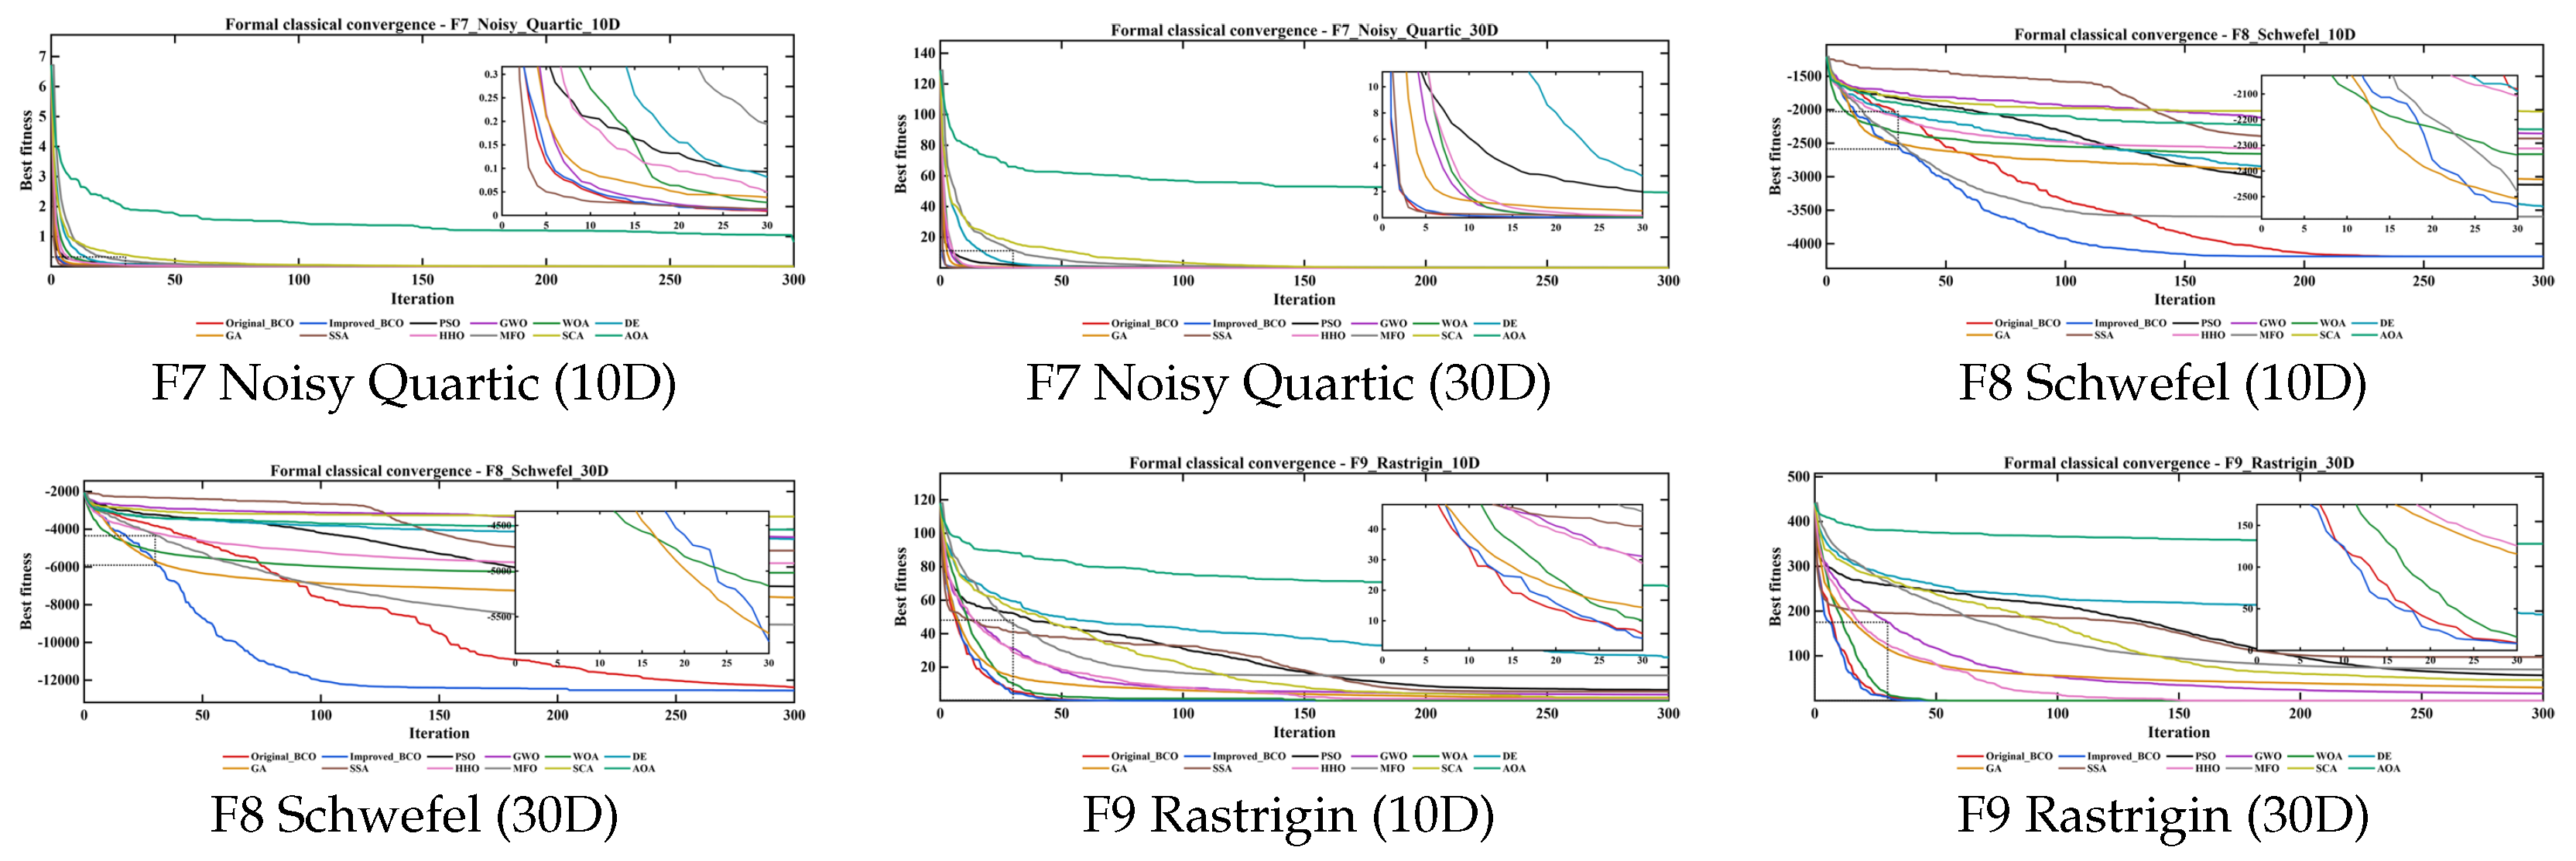
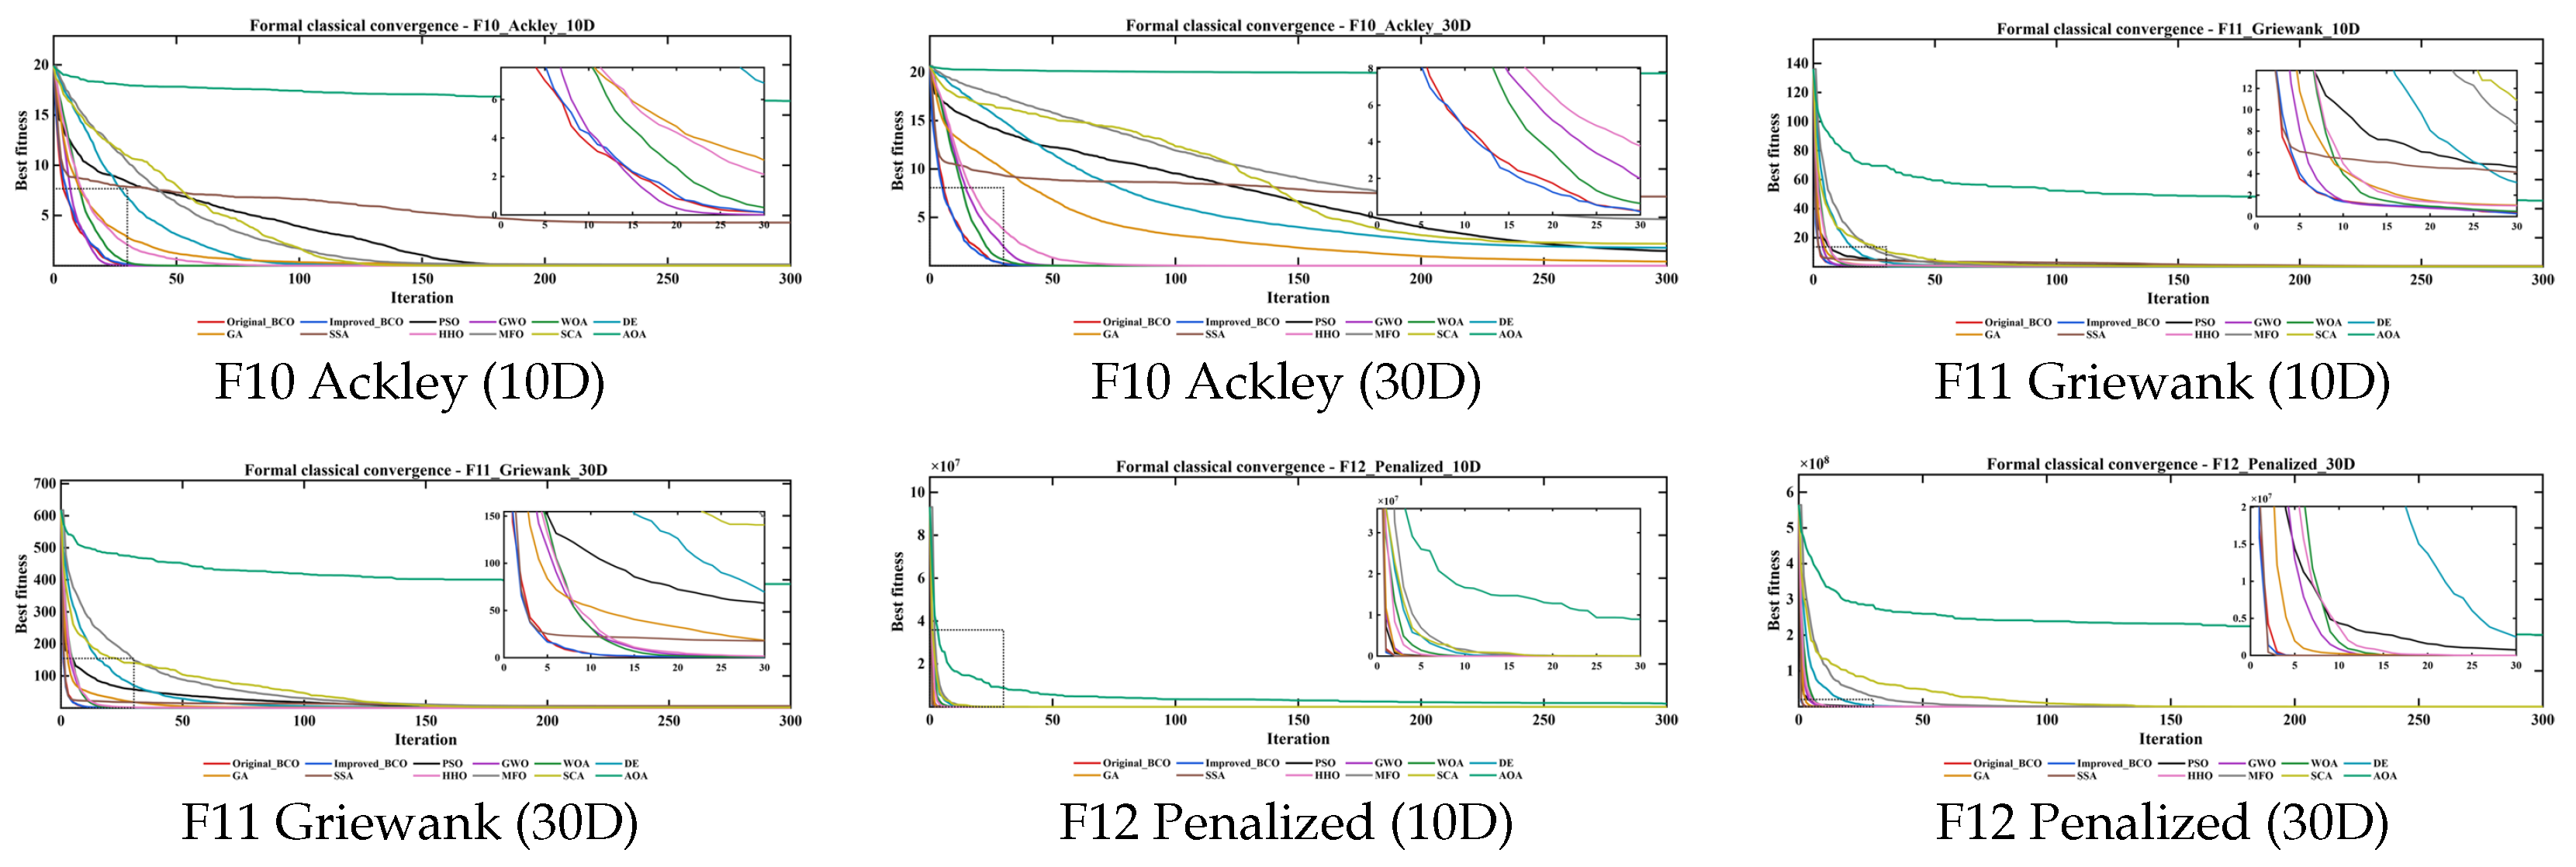


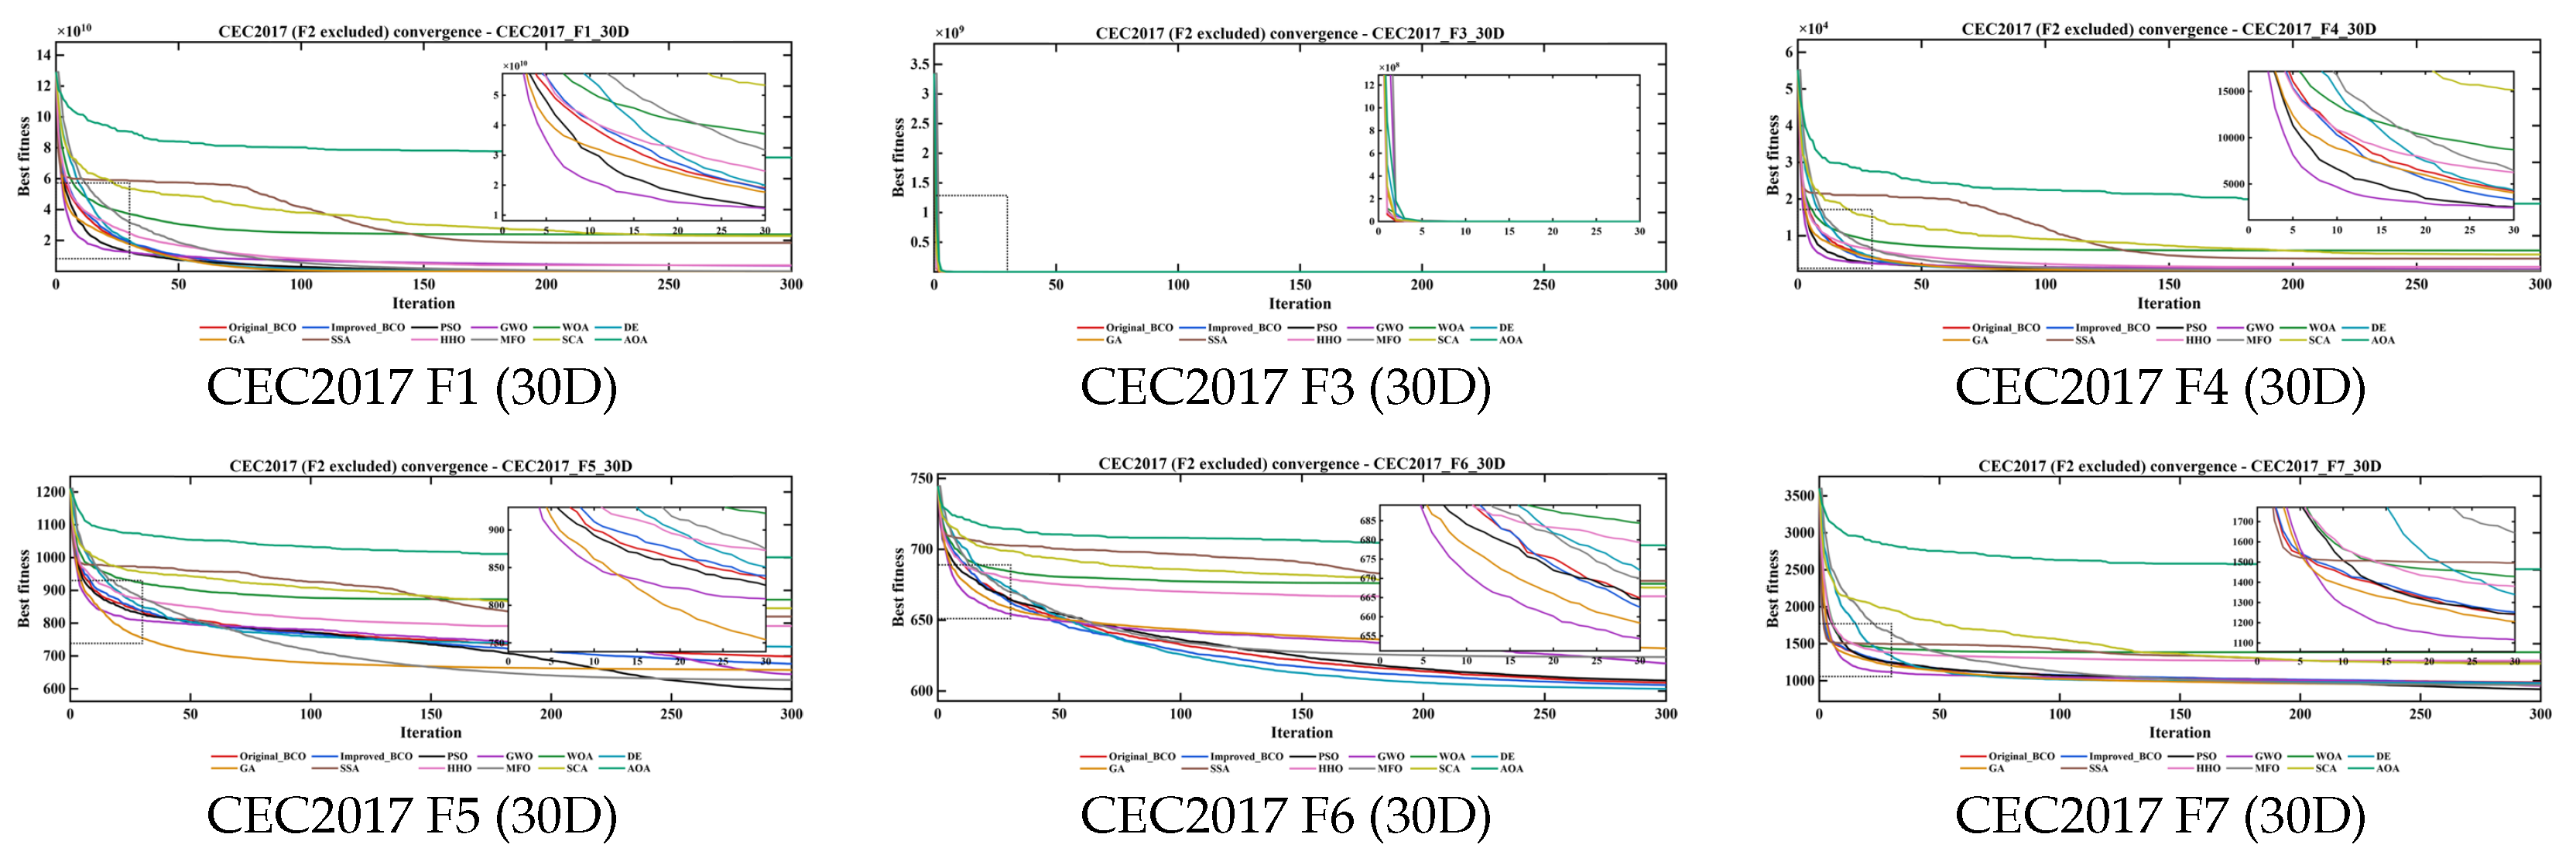
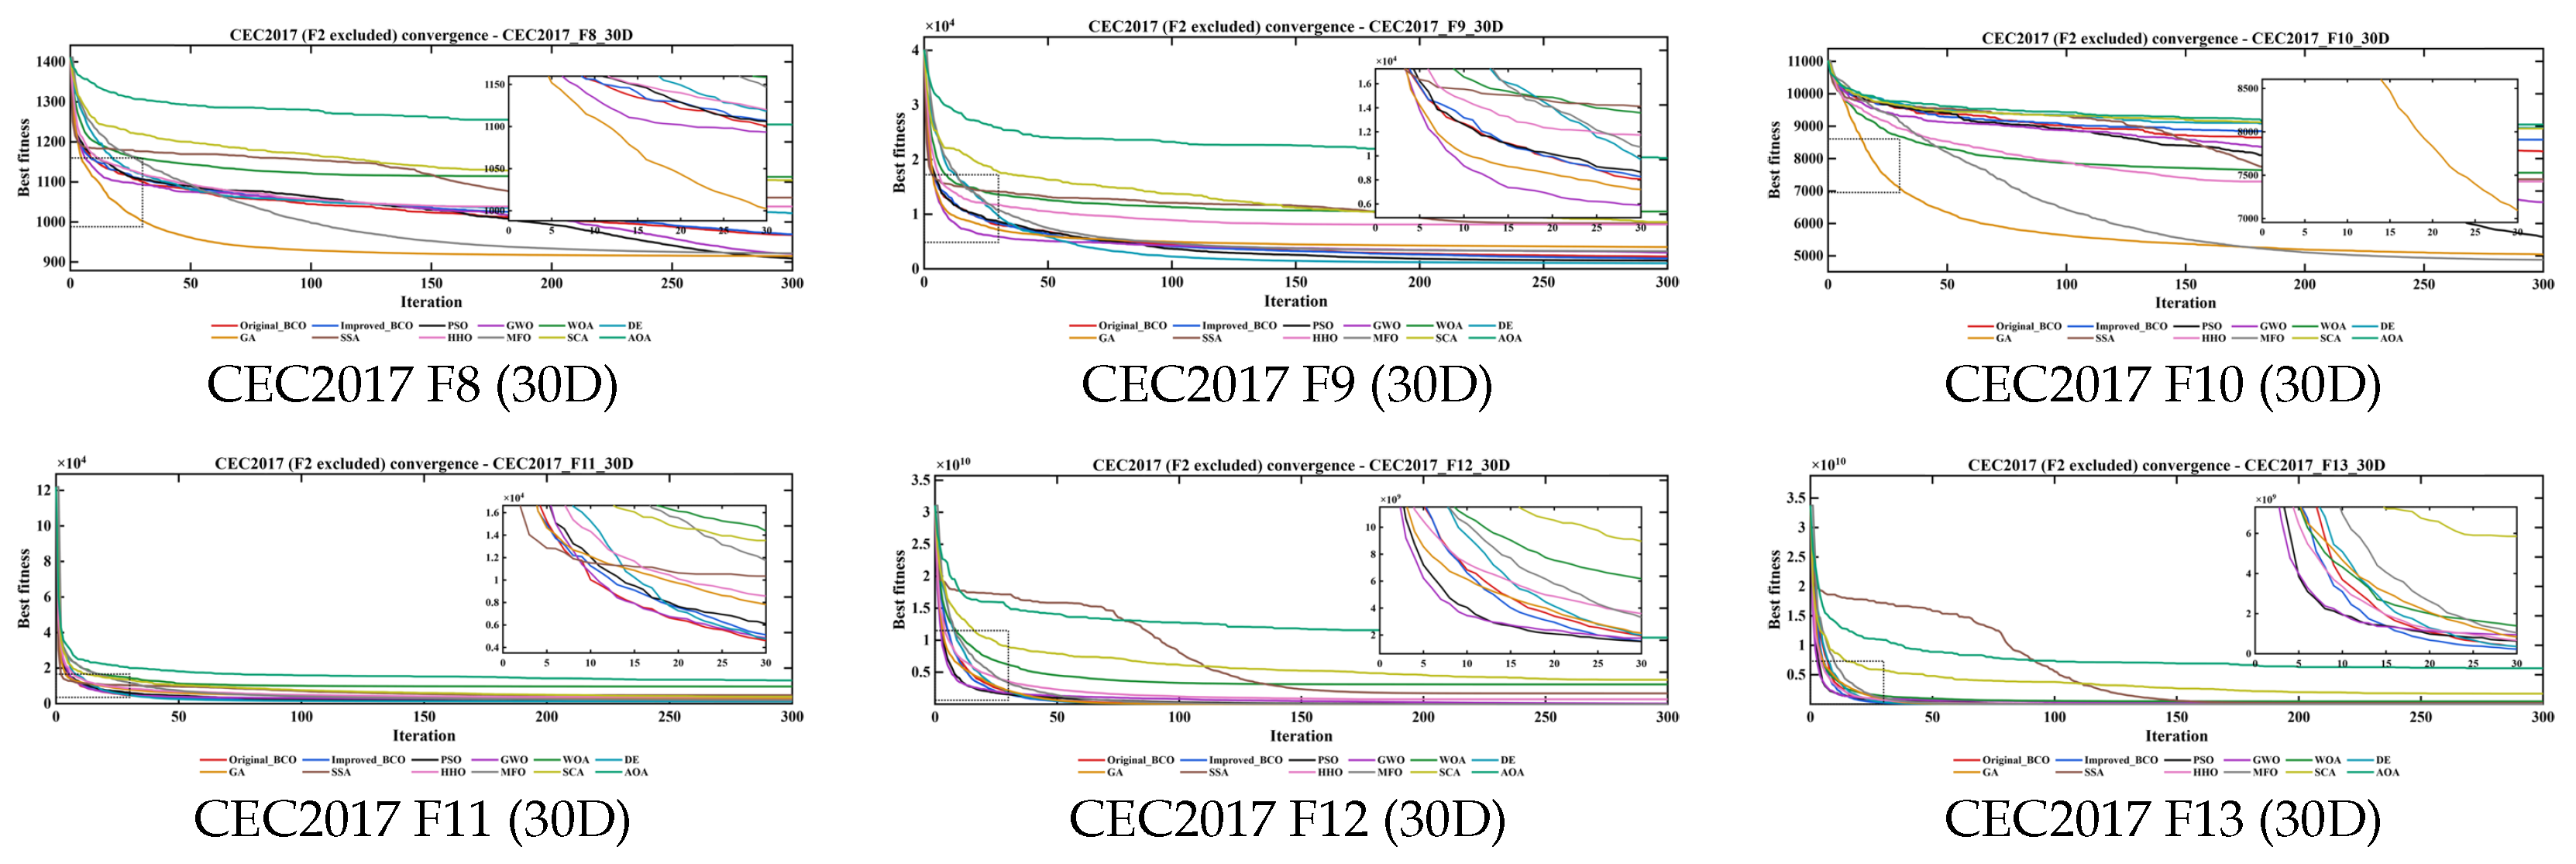
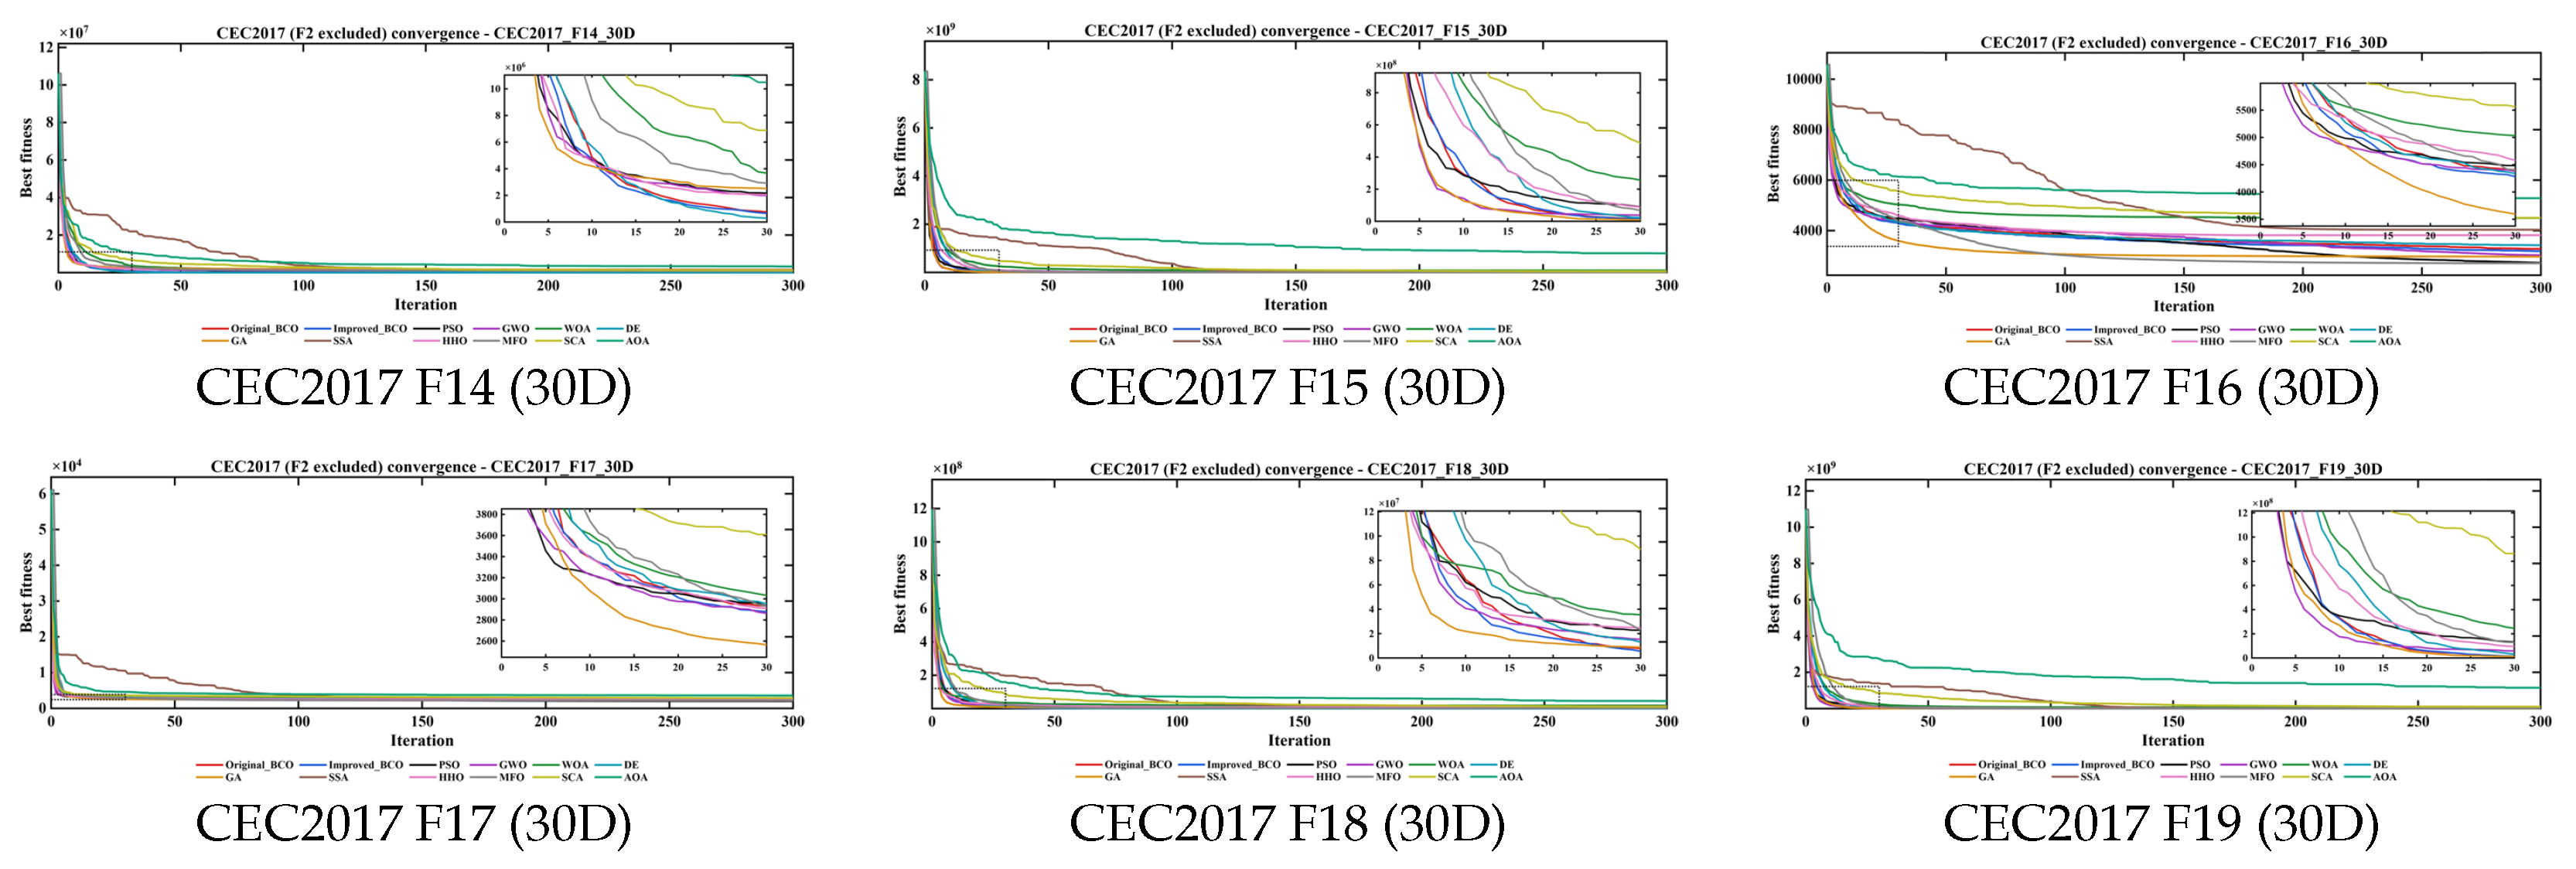
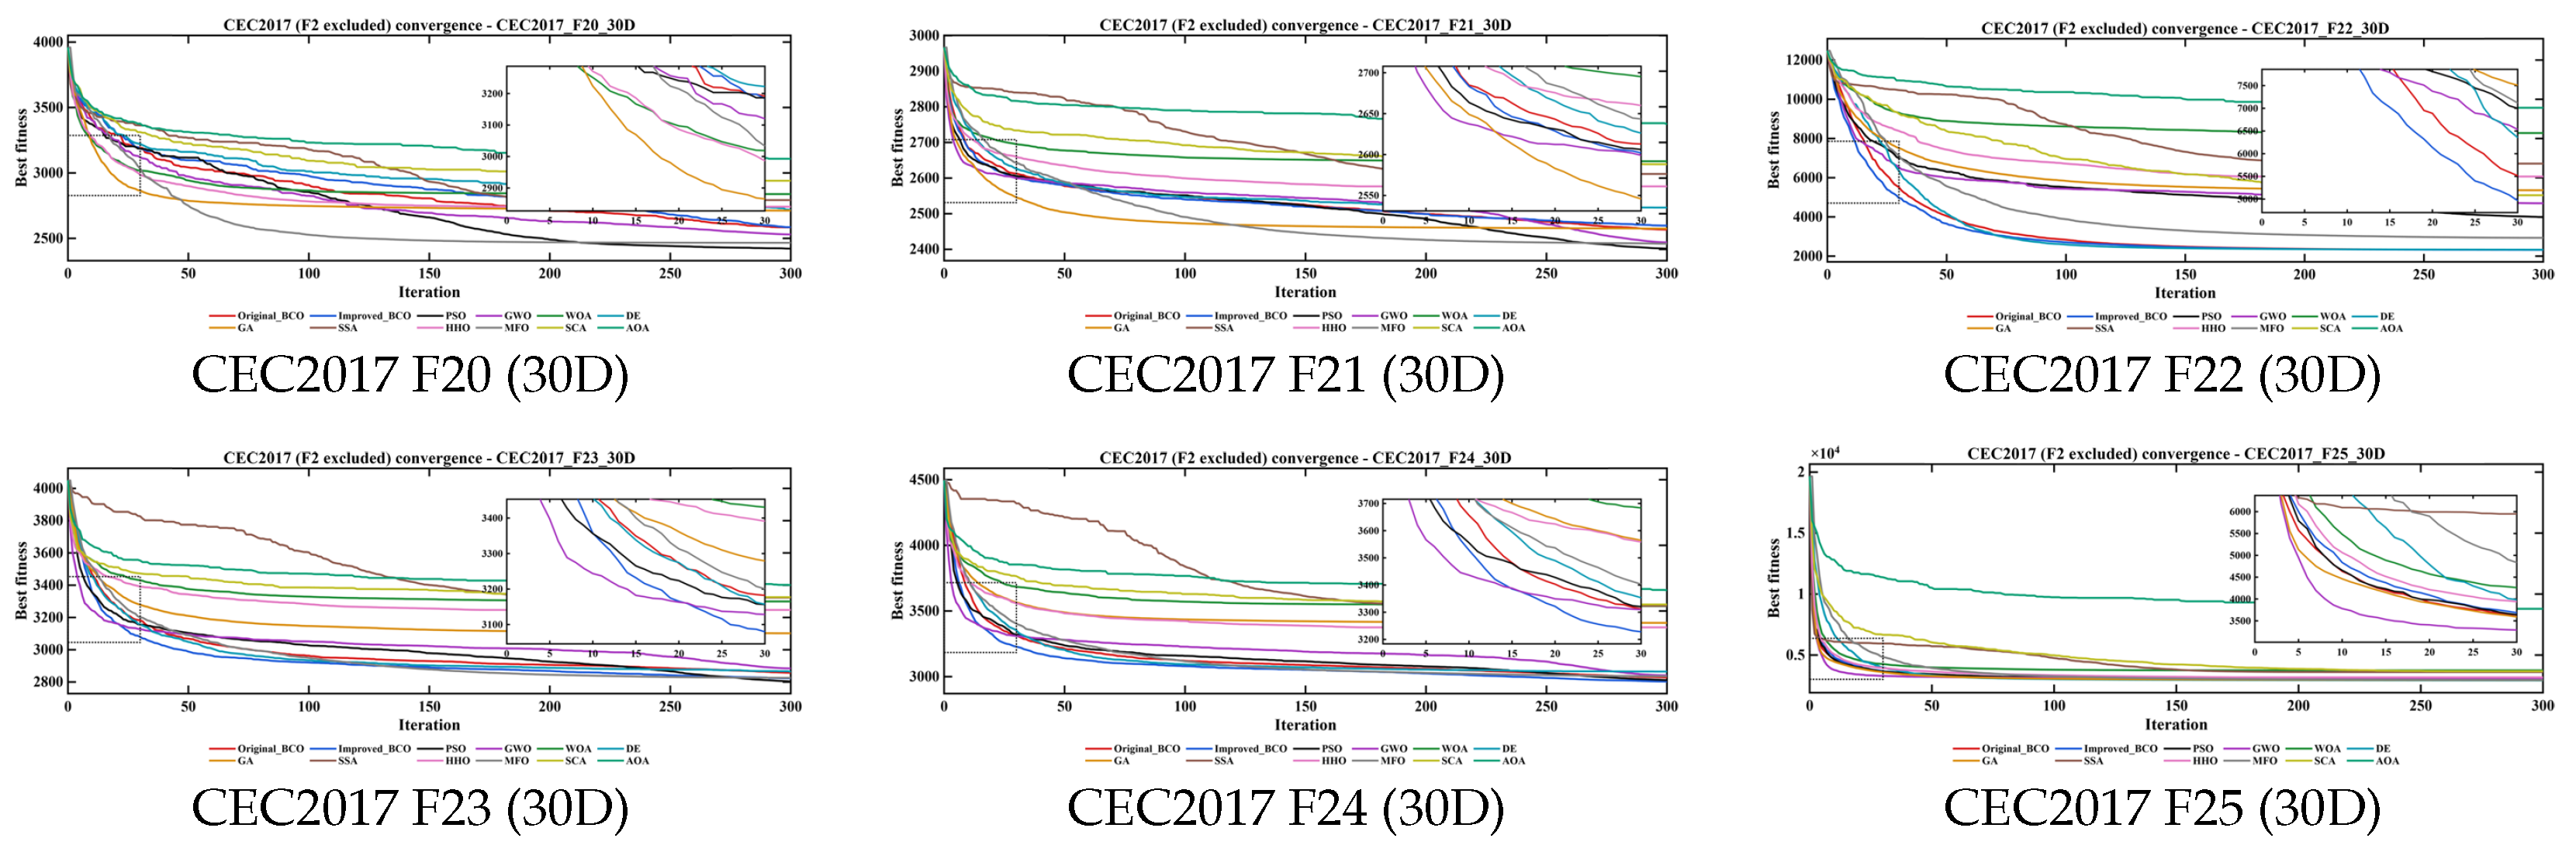
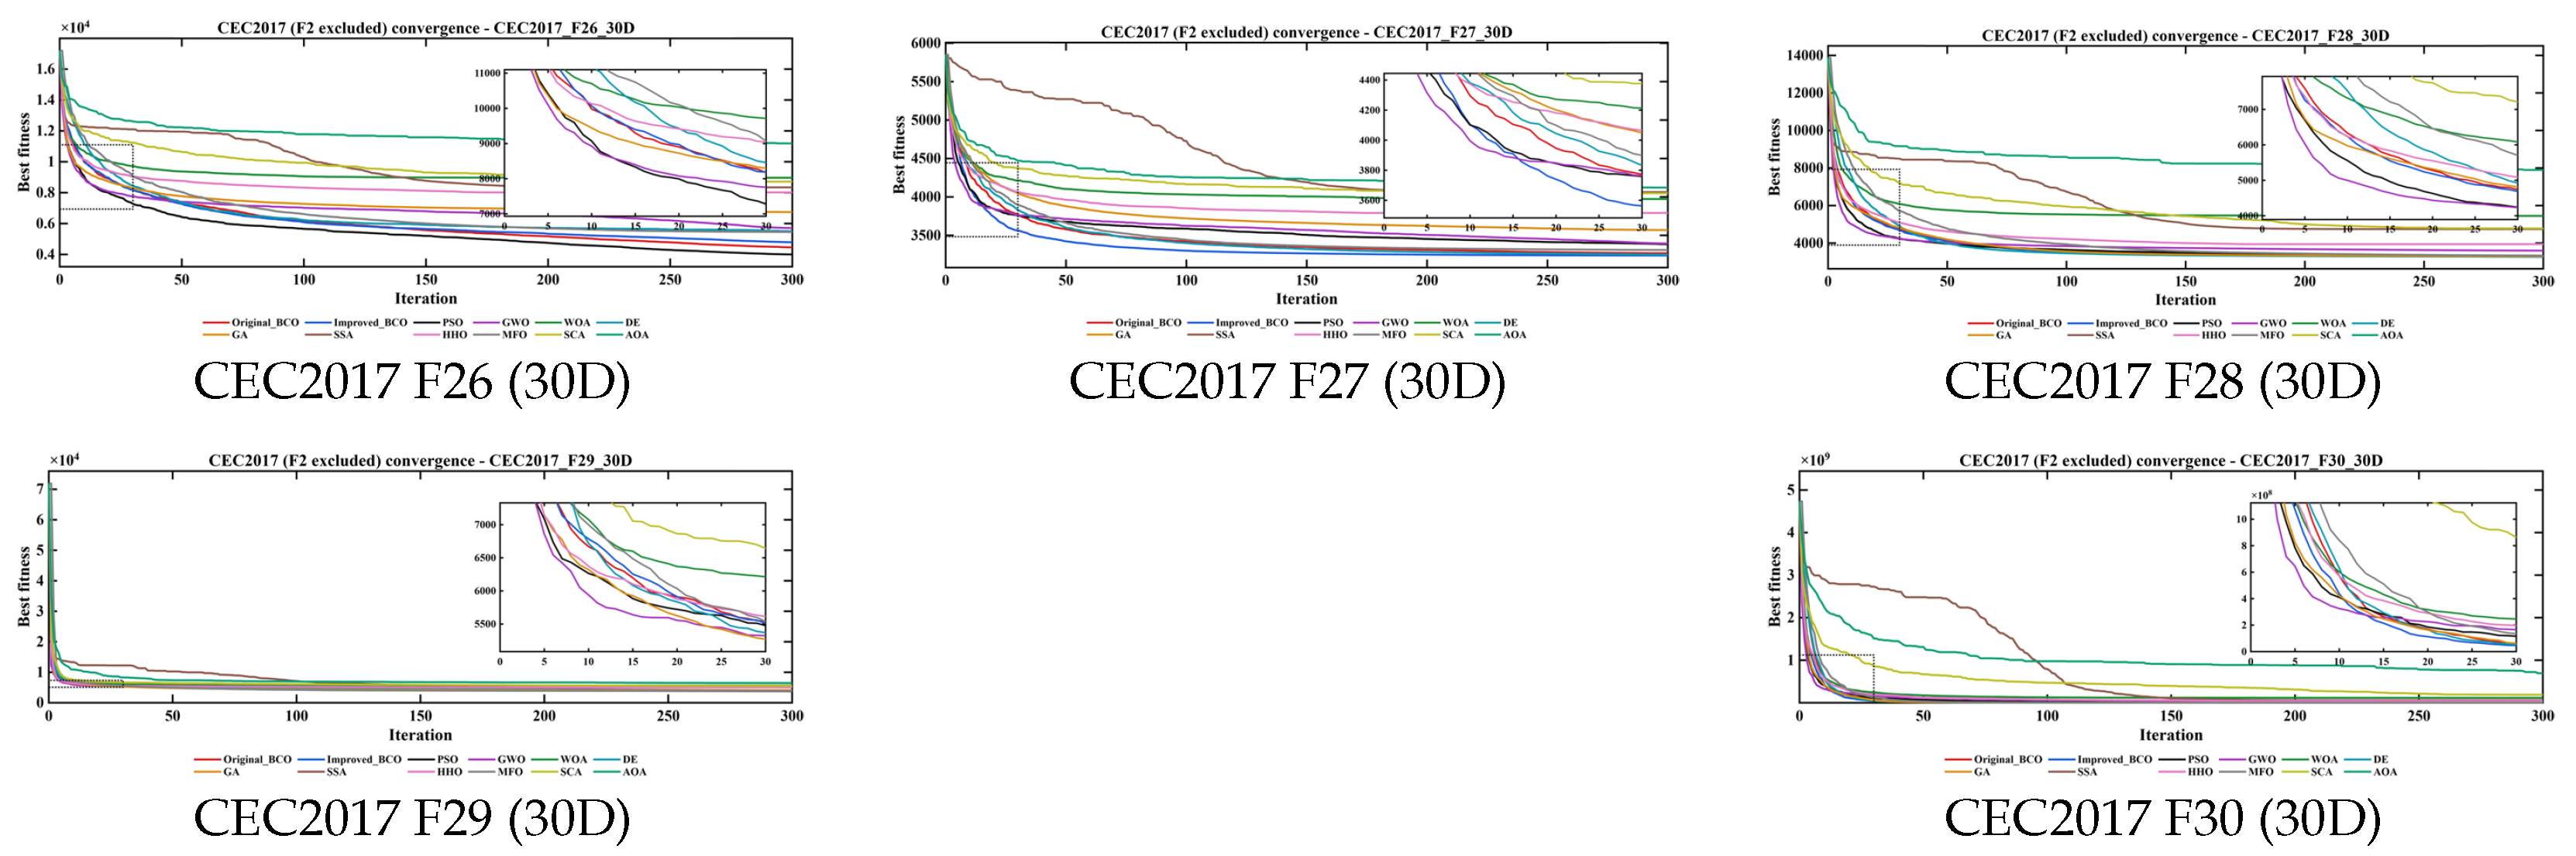
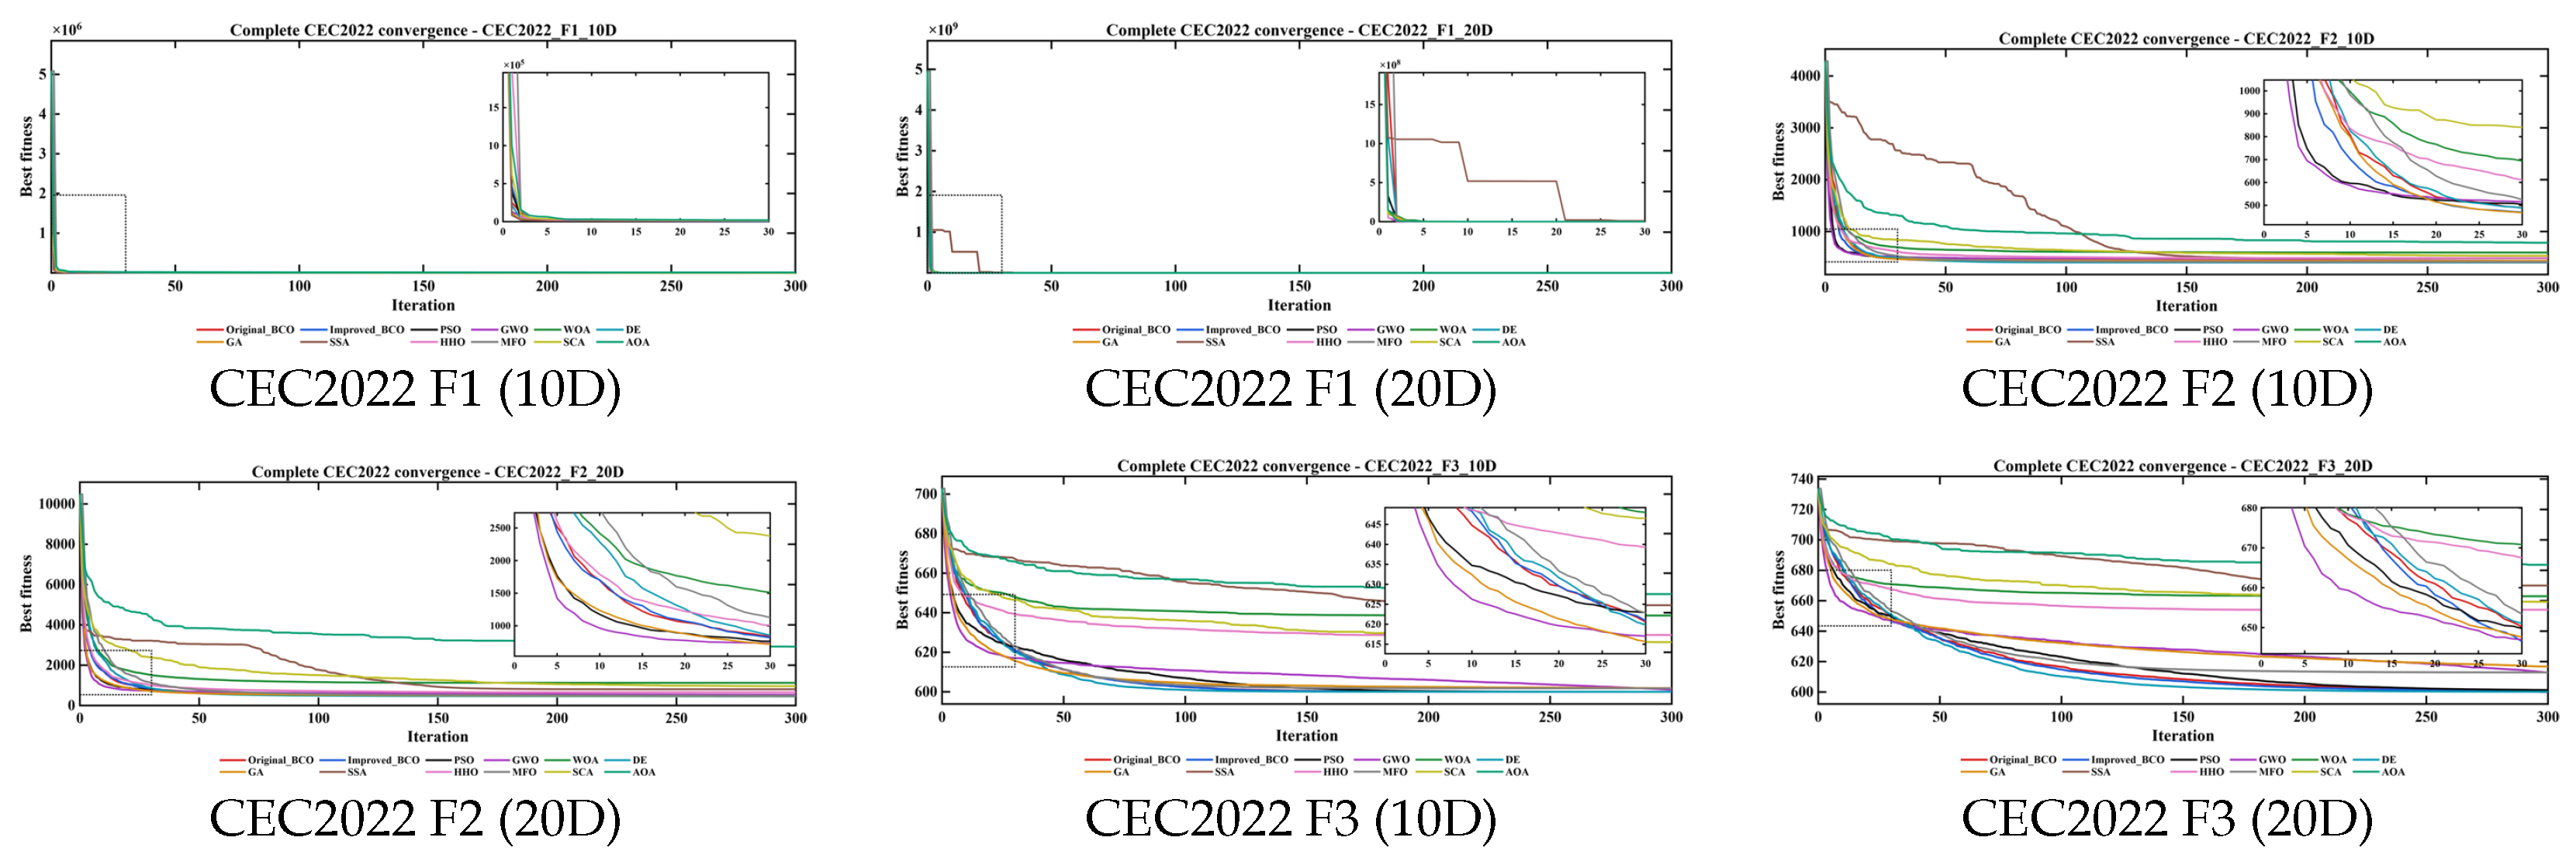
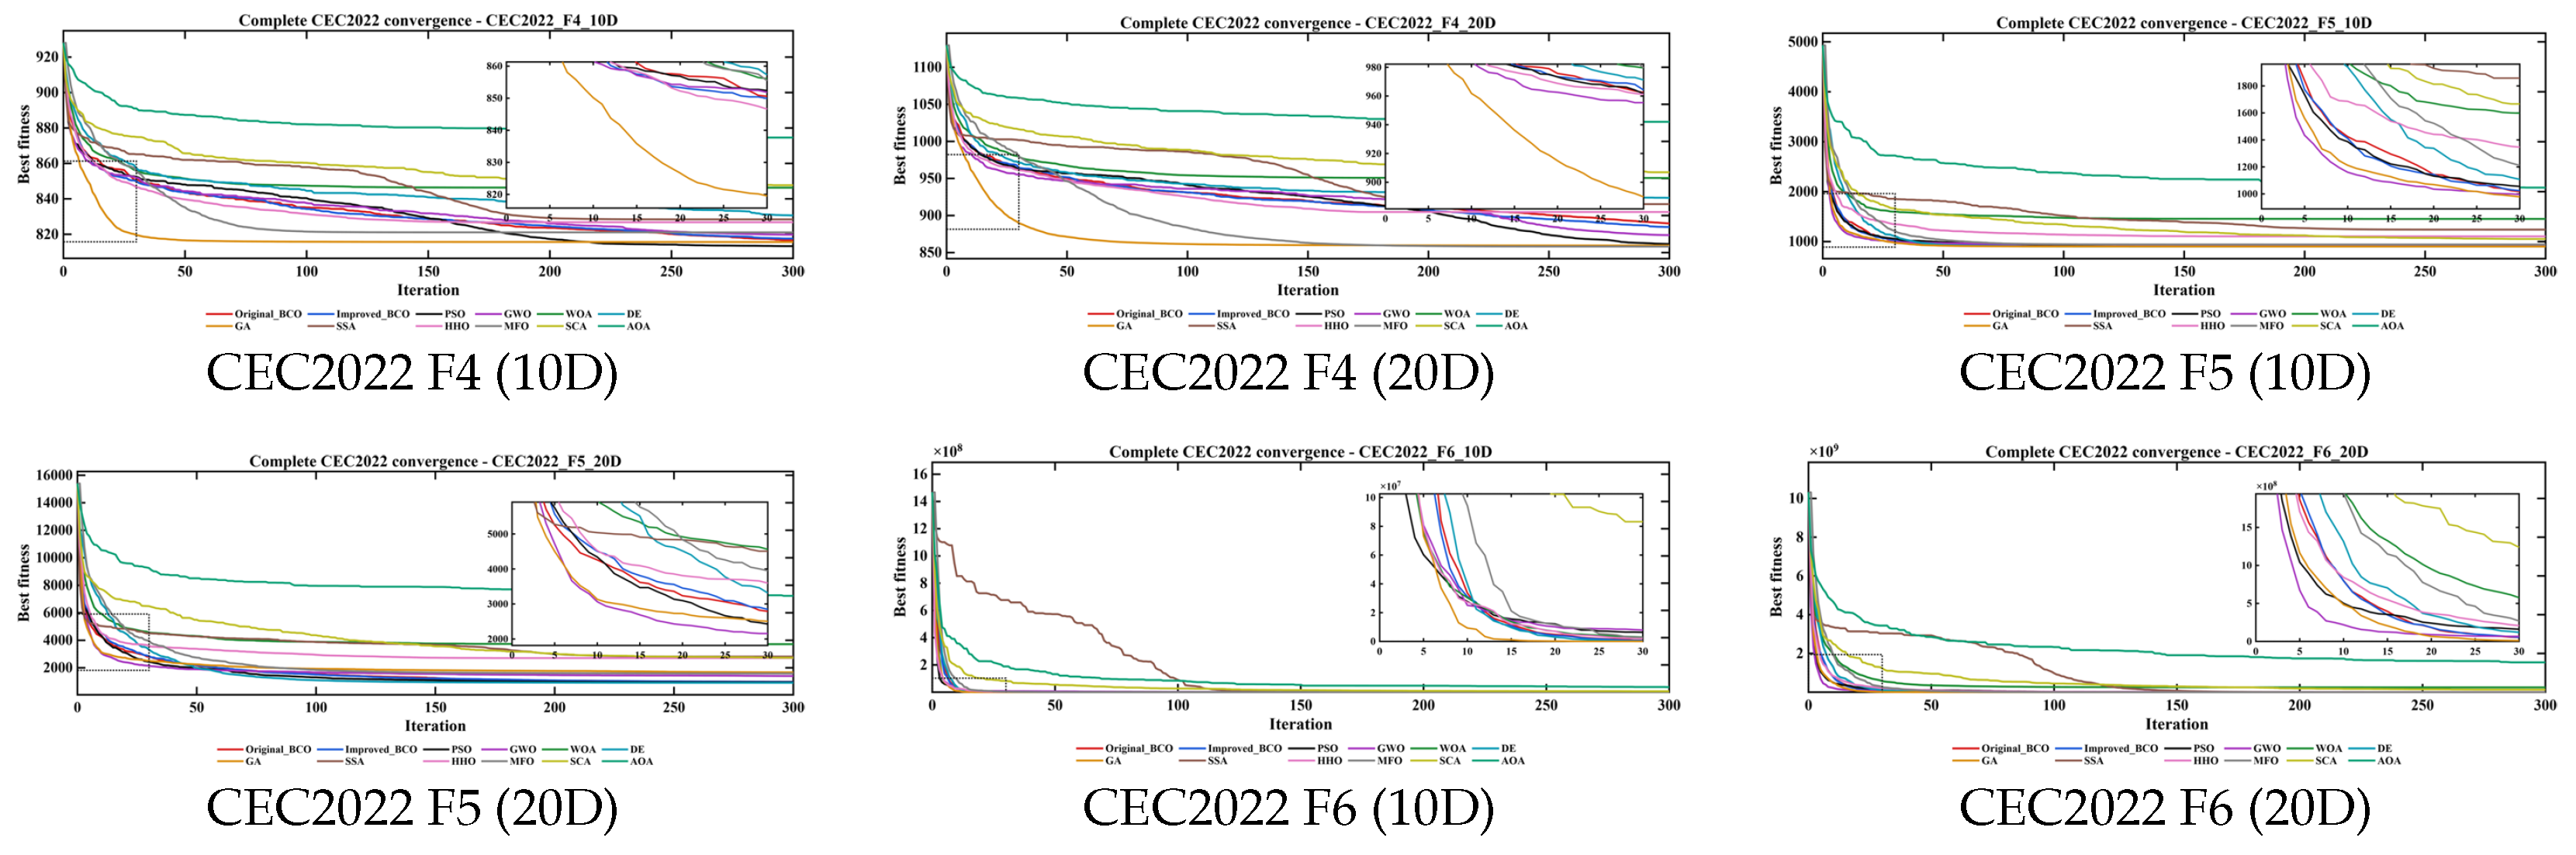
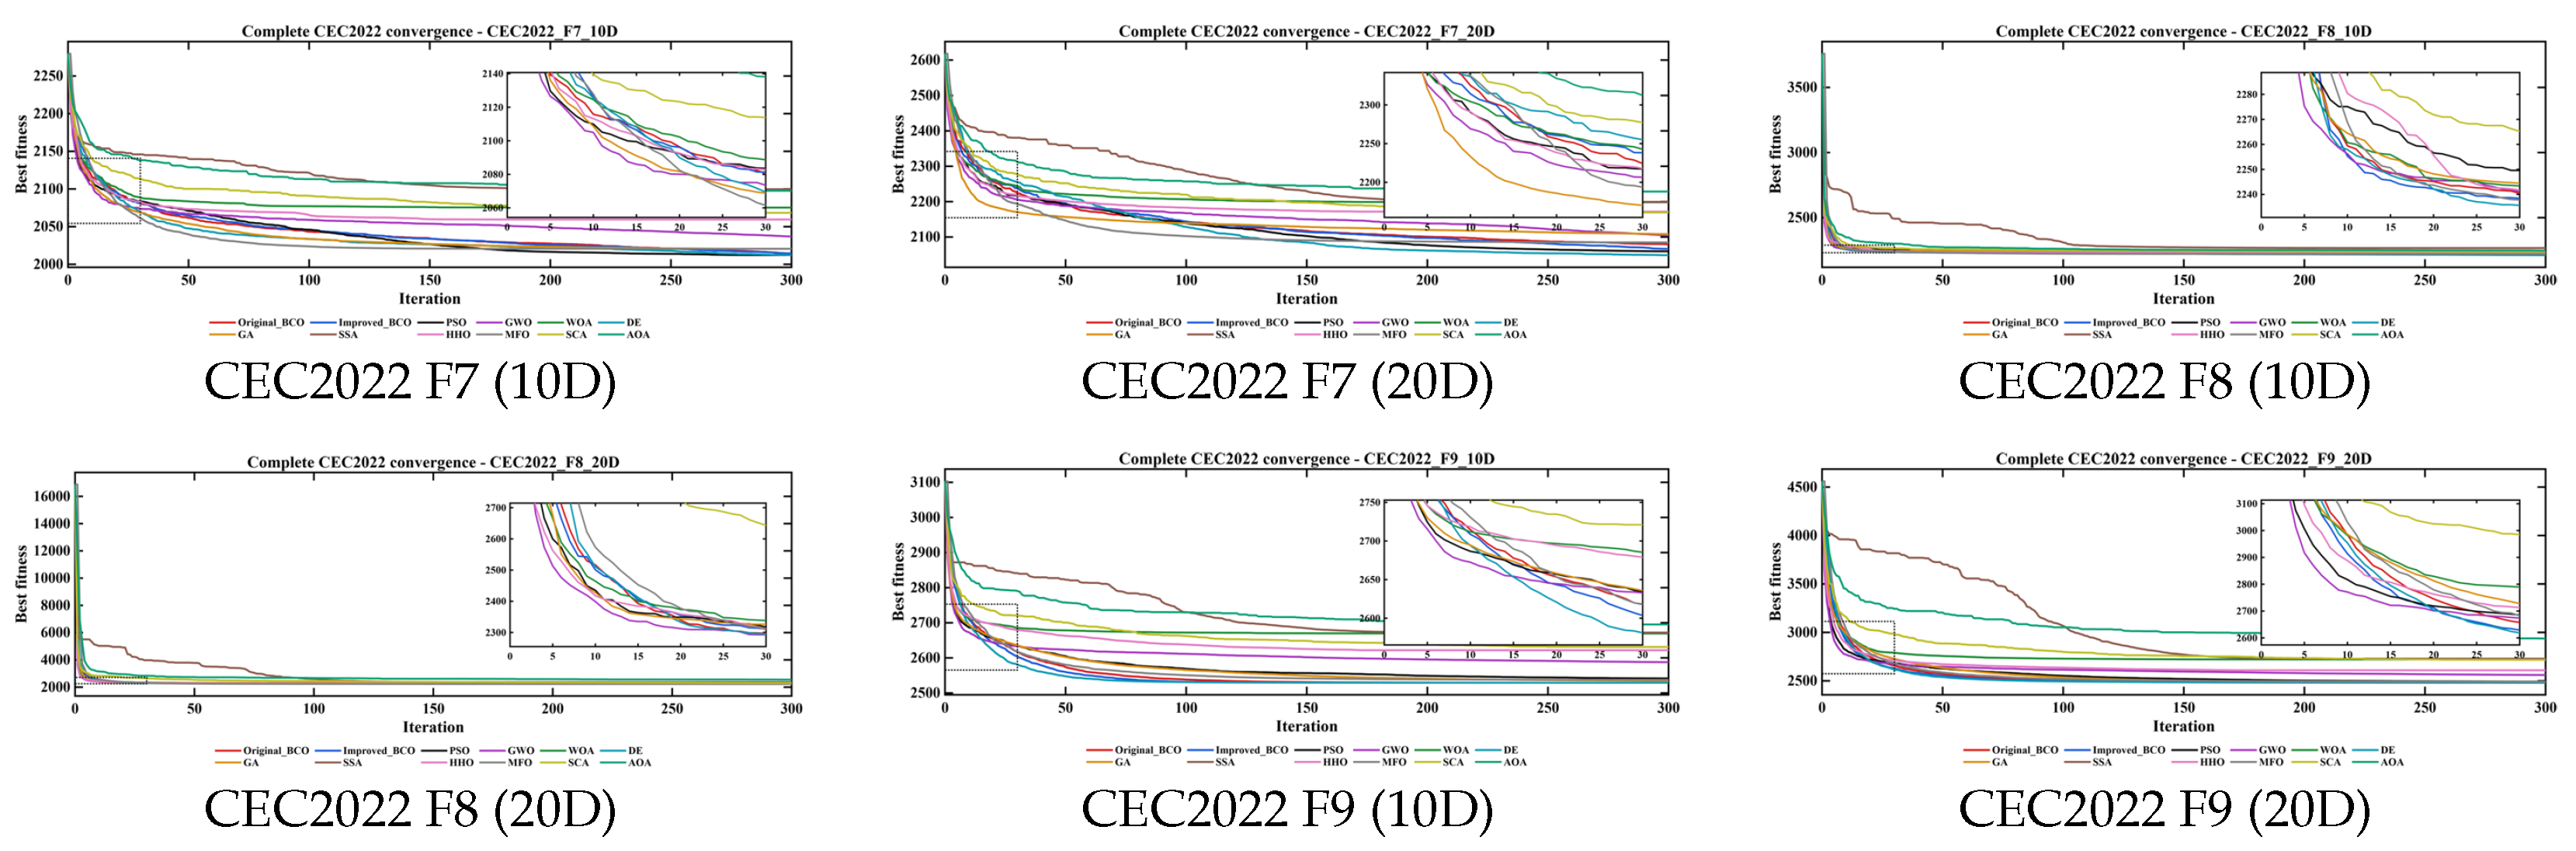
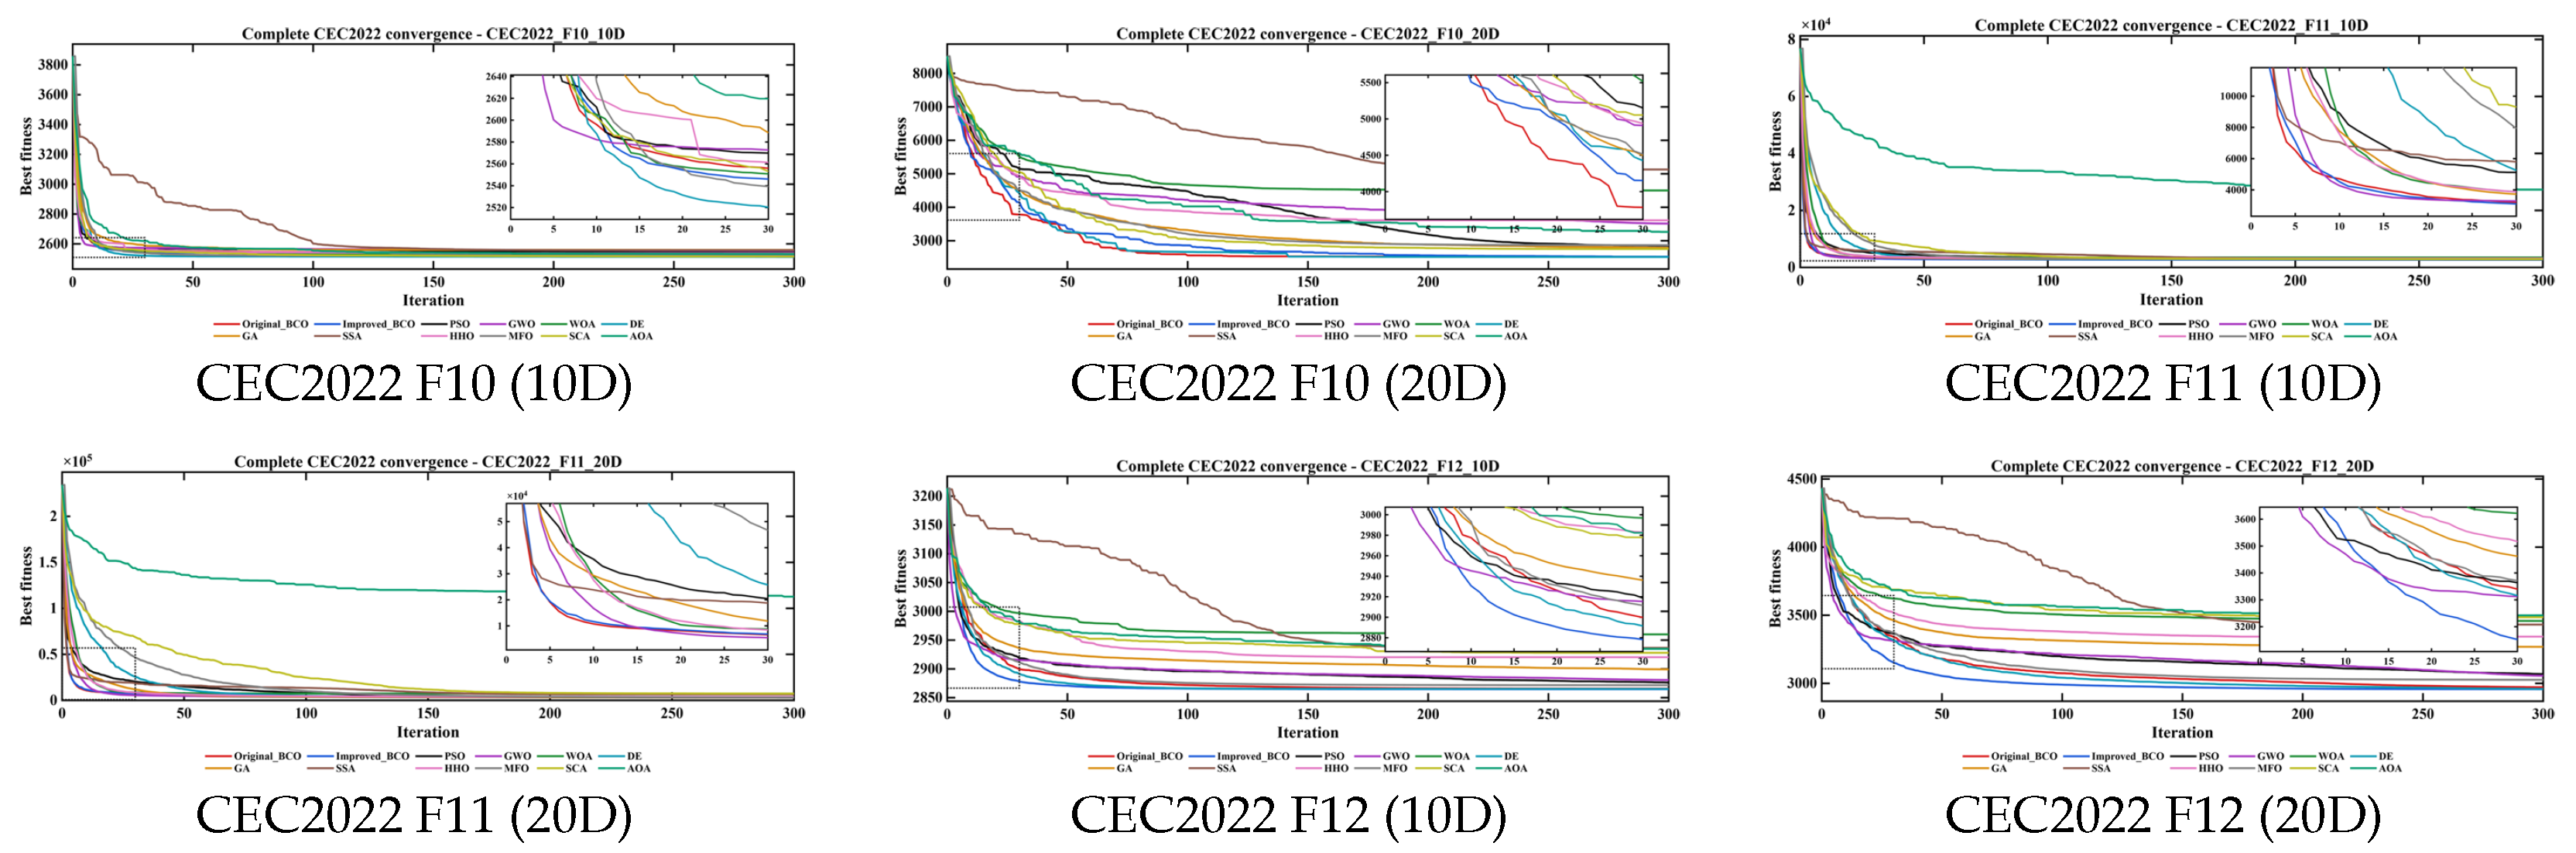
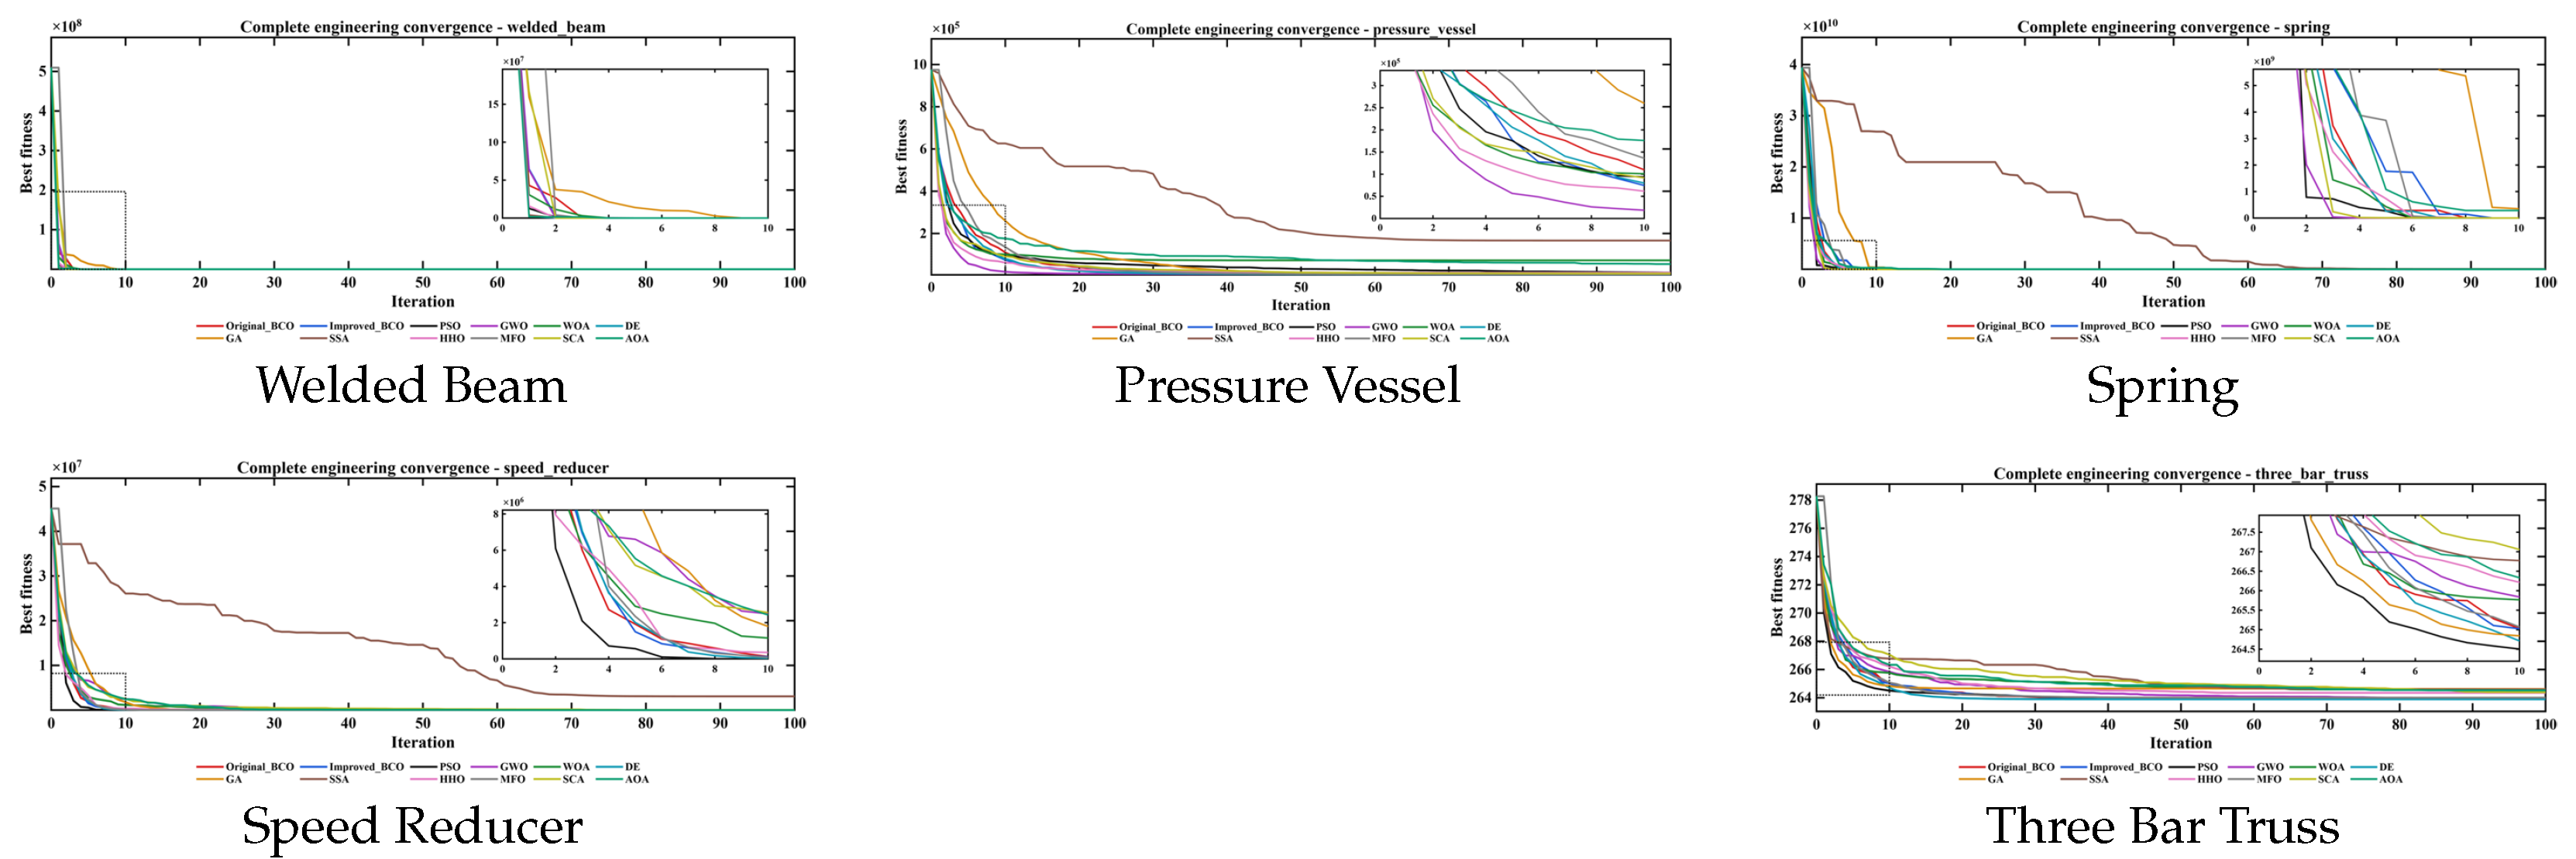
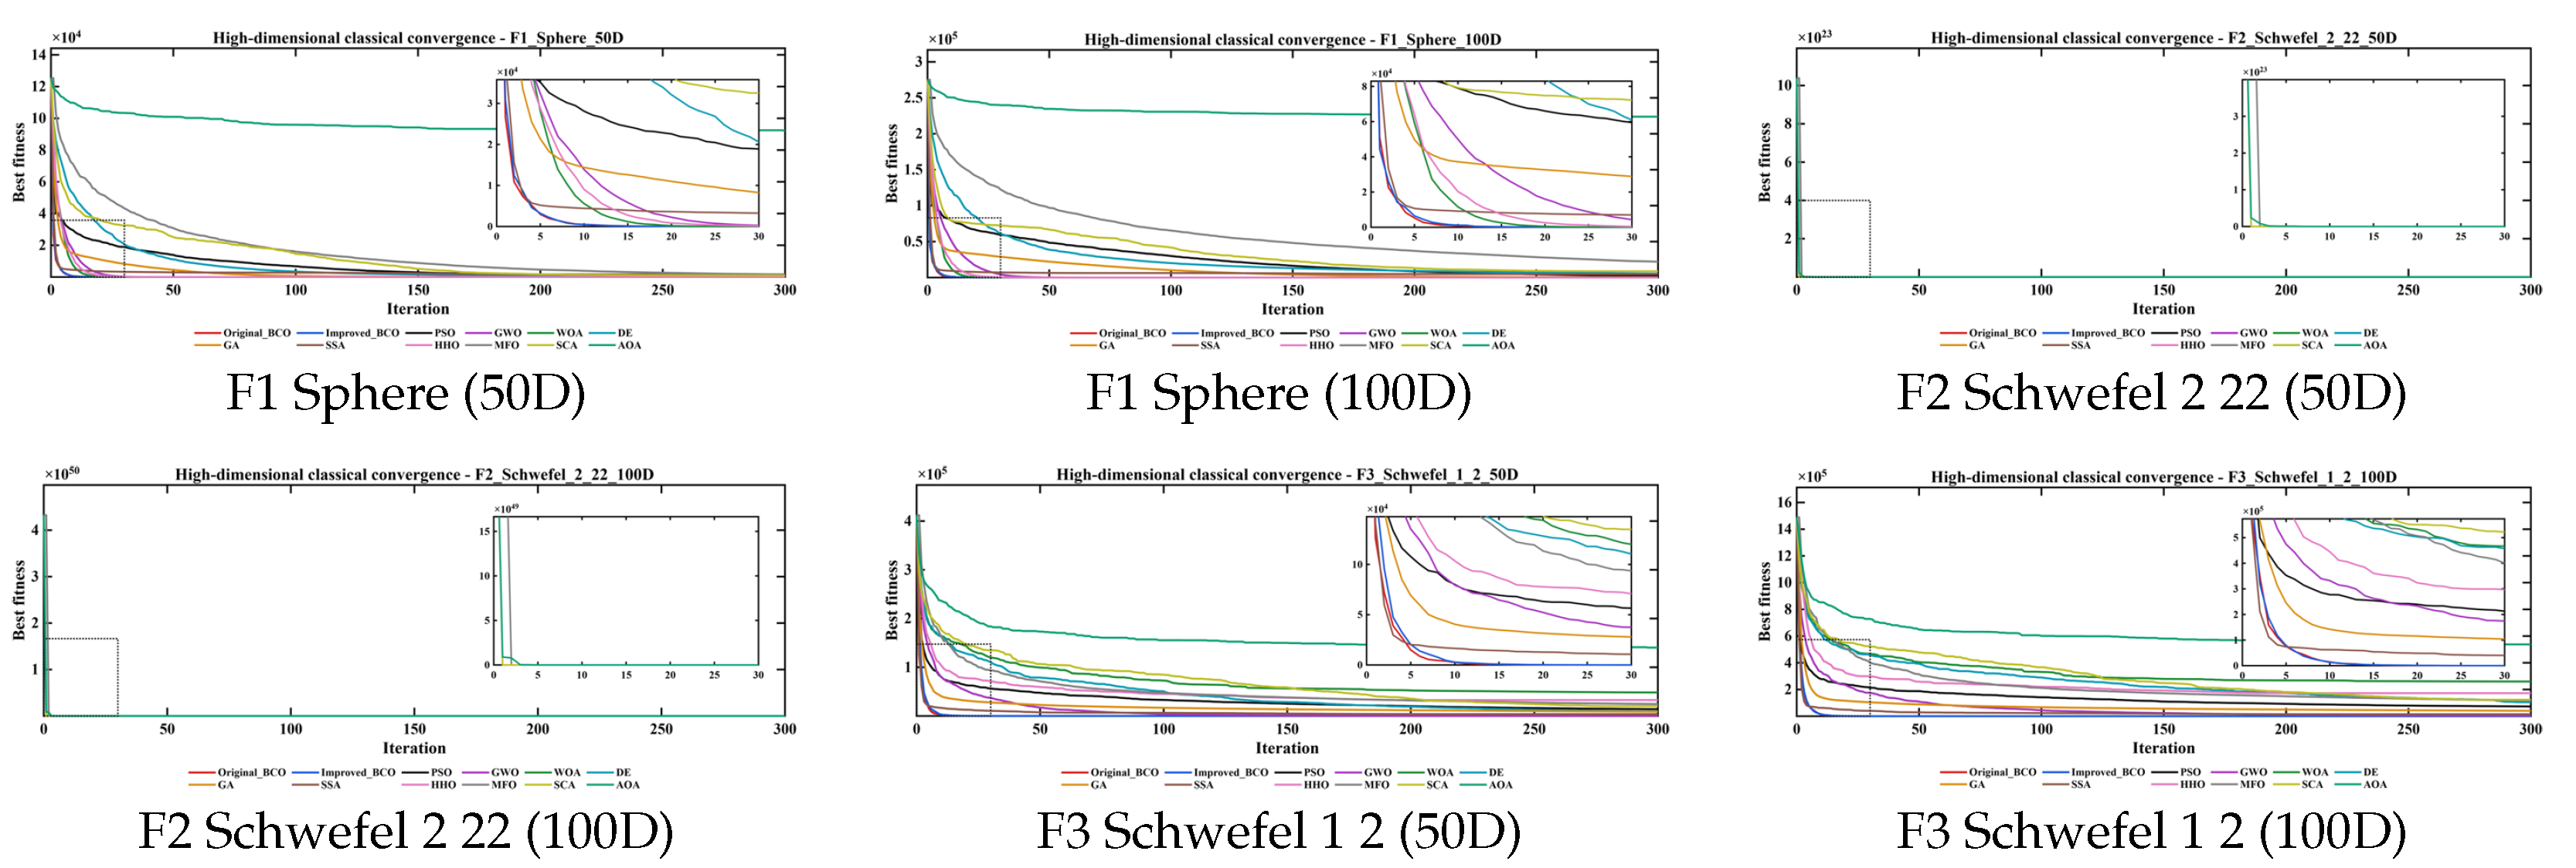
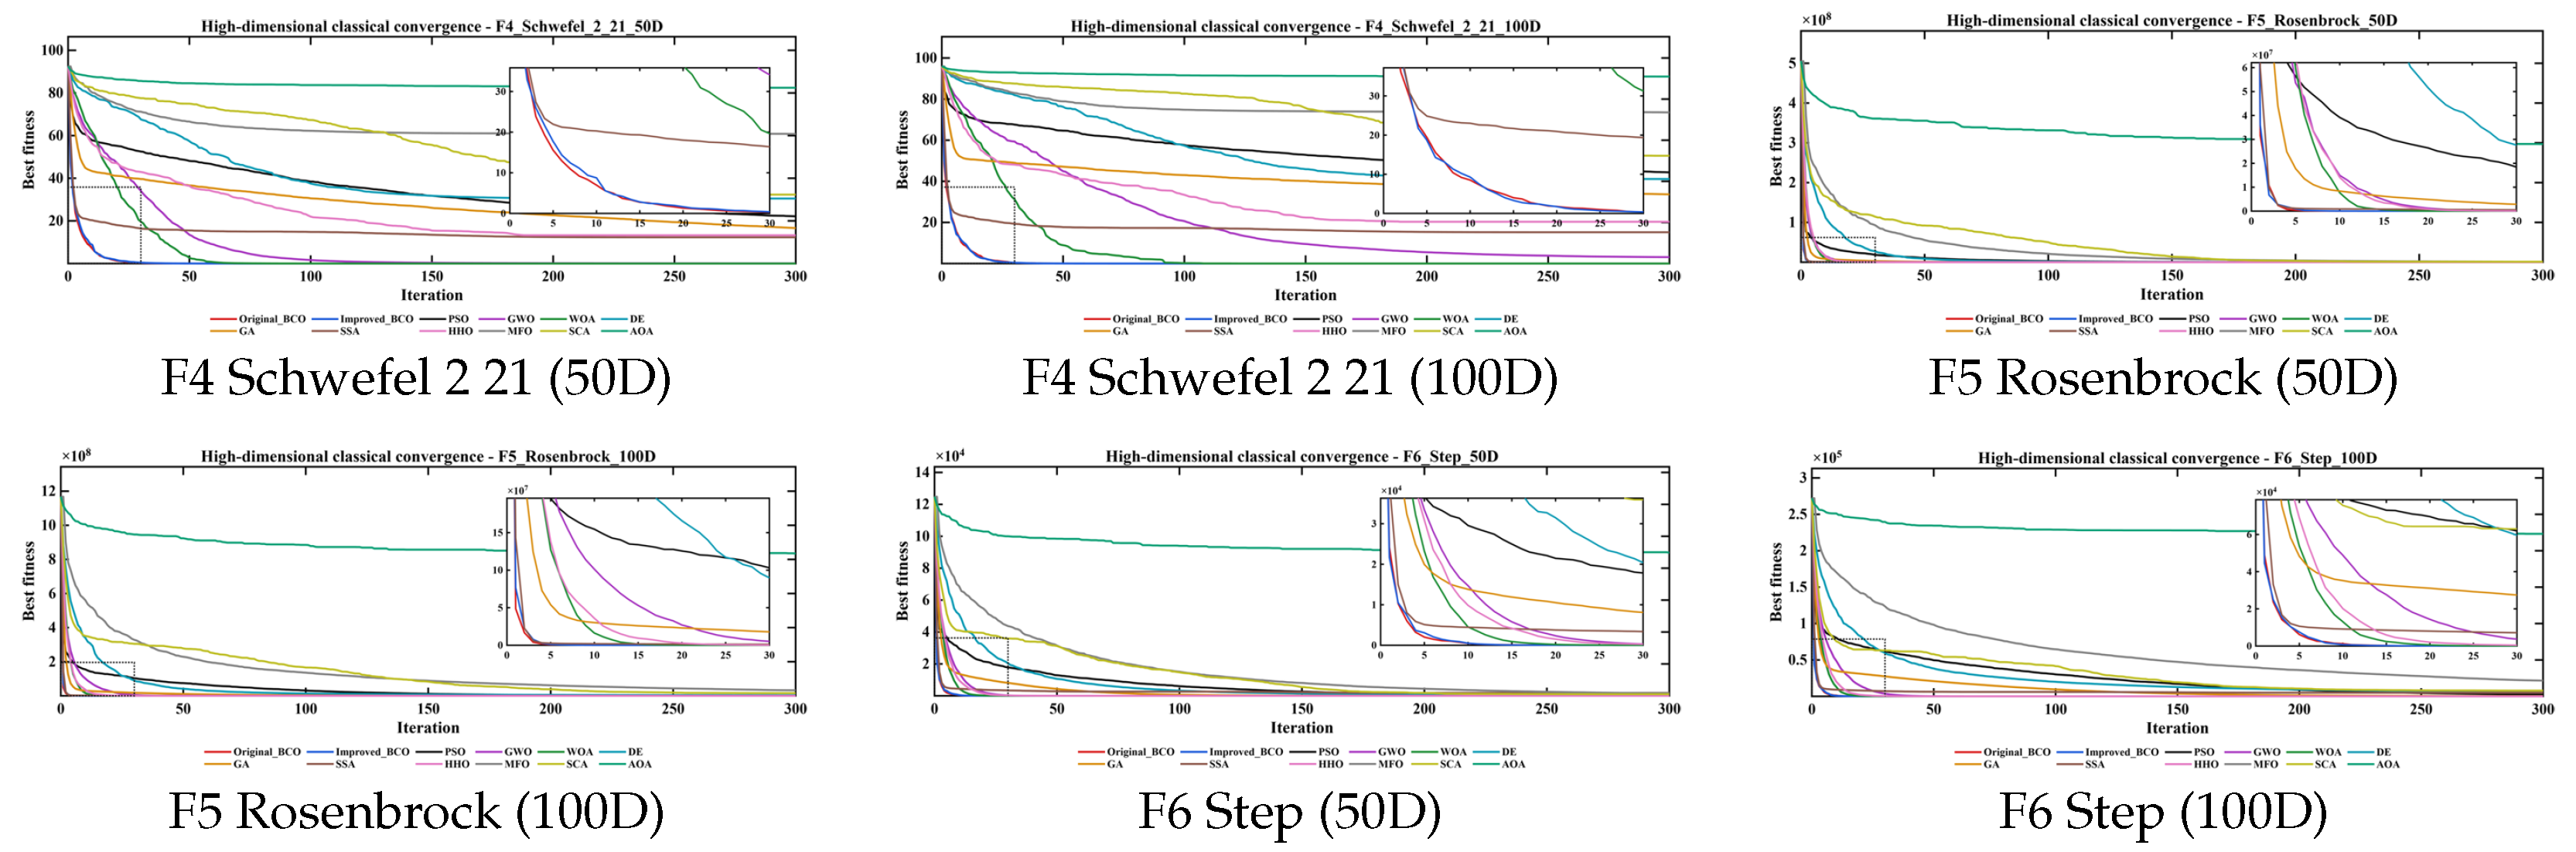
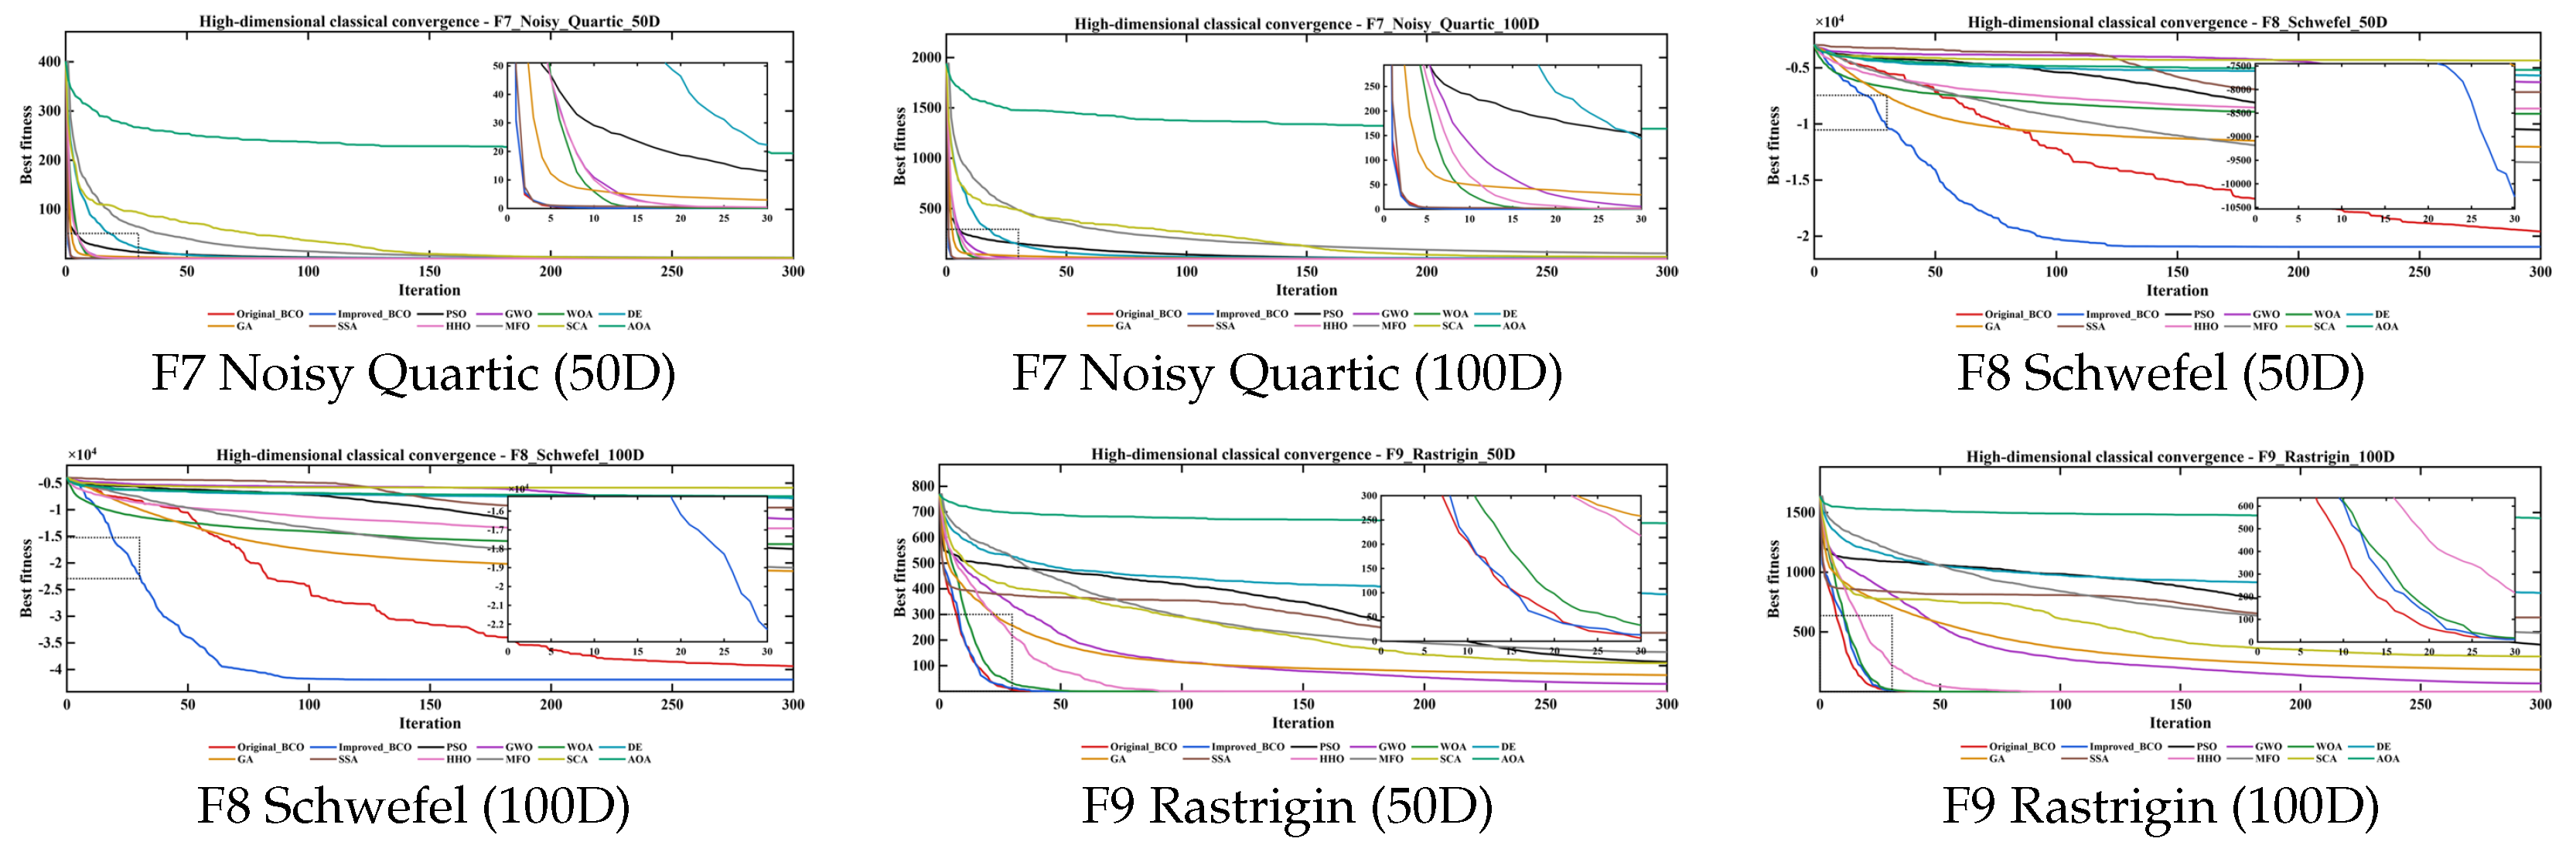
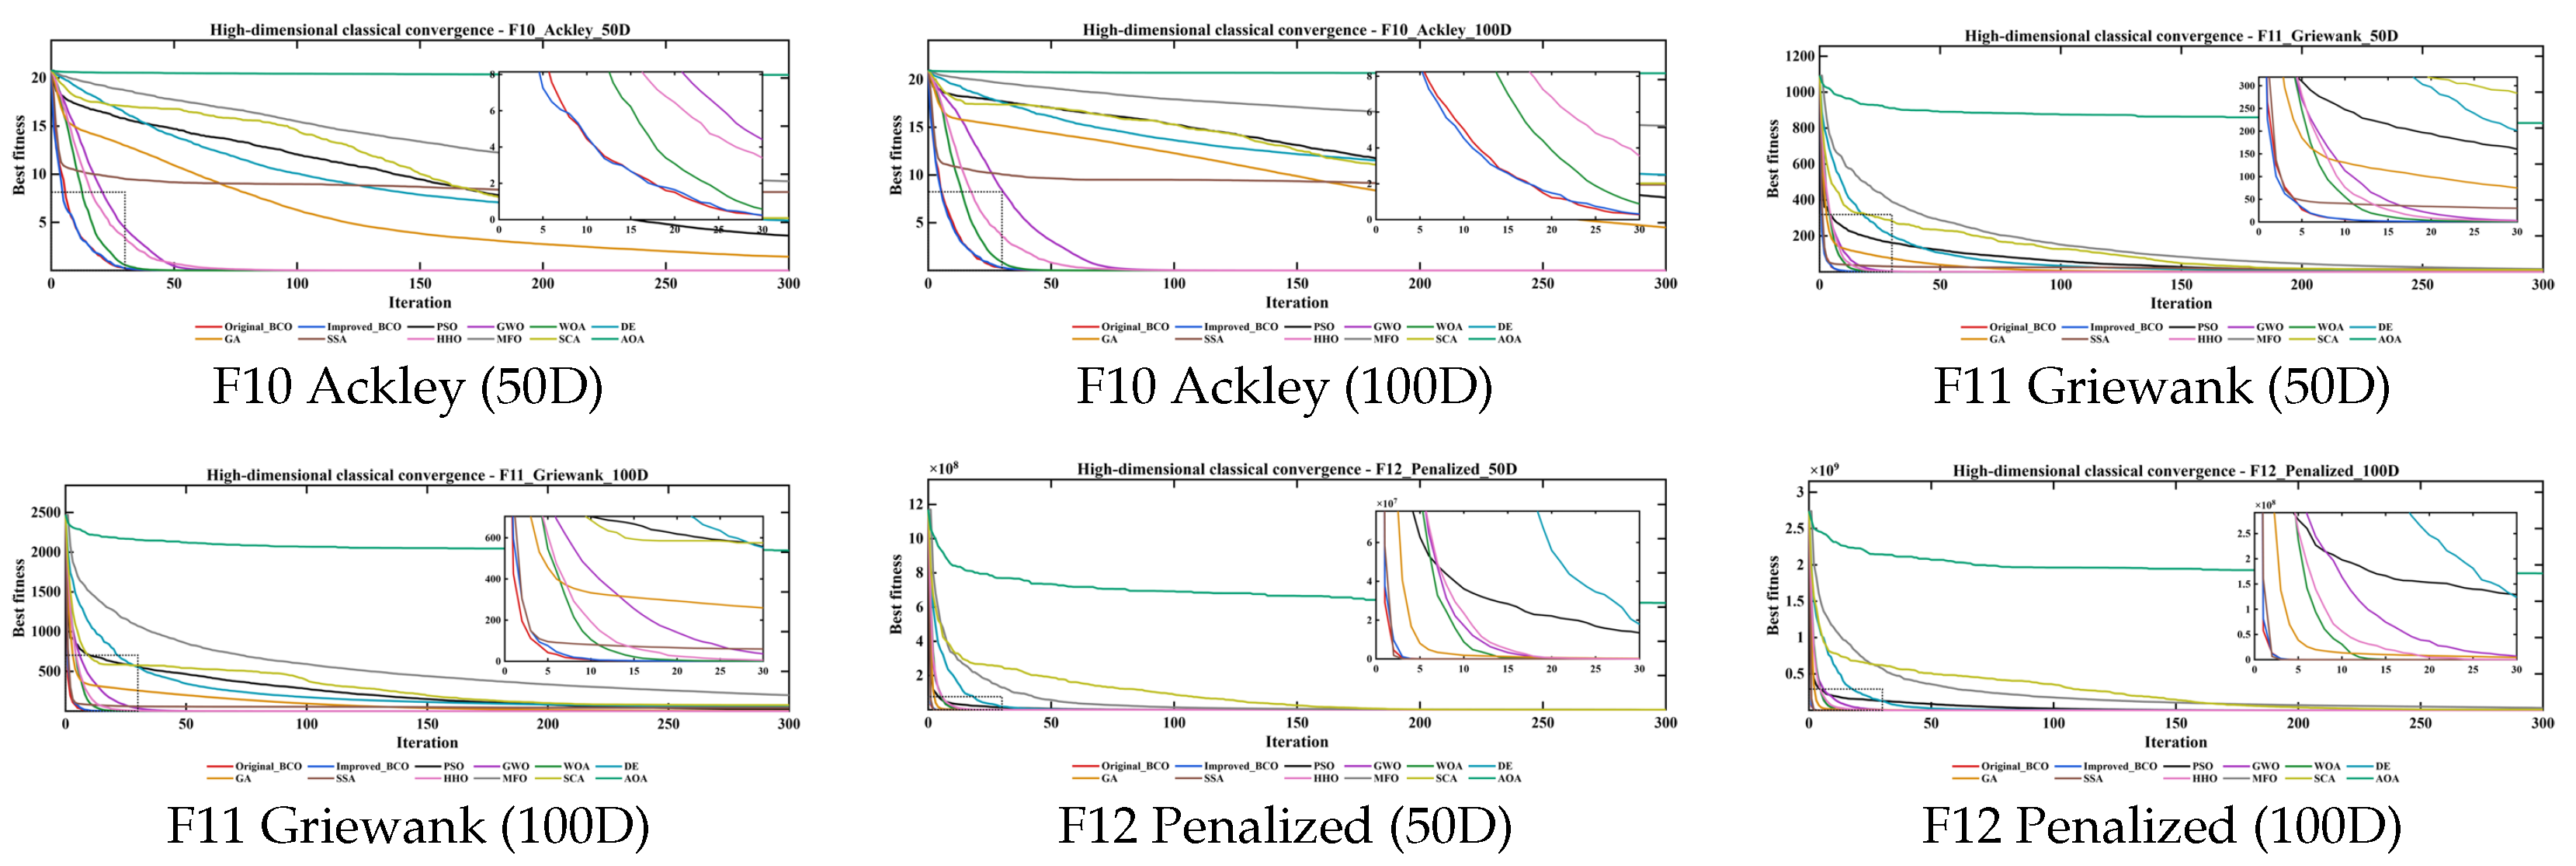



Disclaimer/Publisher’s Note: The statements, opinions and data contained in all publications are solely those of the individual author(s) and contributor(s) and not of MDPI and/or the editor(s). MDPI and/or the editor(s) disclaim responsibility for any injury to people or property resulting from any ideas, methods, instructions or products referred to in the content. |
© 2026 by the authors. Licensee MDPI, Basel, Switzerland. This article is an open access article distributed under the terms and conditions of the Creative Commons Attribution (CC BY) license.